Embed Size (px)
Citation preview

Oceanography Vol.18, No.2, June 2005246
and
COASTALOCEAN
PHYSICSRED TIDES
A N E X A M P L E F R O M
M O N T E R E Y B AY, C A L I F O R N I A
Oceanography Vol.18, No.2, June 2005246
Th is article has been published in Oceanography, Volume 18, Number 2, a quarterly journal of Th e Oceanography Society.
Copyright 2005 by Th e Oceanography Society. All rights reserved. Reproduction of any portion of this article by photo-
copy machine, reposting, or other means without prior authorization of Th e Oceanography Society is strictly prohibited.
Send all correspondence to: [email protected] or Th e Oceanography Society, PO Box 1931, Rockville, MD 20849-1931, USA.

Oceanography Vol.18, No.2, June 2005 247
D
B R E A K I N G W A V E S
B Y J O H N P. R Y A N , H E I D I M . D I E R S S E N , R A P H A E L M . K U D E L A ,
C H R I S T O P H E R A . S C H O L I N , K E N N E T H S . J O H N S O N ,
J A M E S M . S U L L I V A N , A N D R E W M . F I S C H E R , E R I C H V. R I E N E C K E R ,
PAT R I C K R . M C E N A N E Y, A N D F R A N C I S C O P. C H A V E Z
Dense accumulations of certain phytoplankton make the ocean appear reddish. Some of these
“red tides” poison marine life and negatively impact coastal fi sheries and human health. Com-
plex variability in coastal waters coupled with rudimentary understanding of phytoplankton
ecology challenge our ability to understand and predict red tides. During fall 2002, multi-scale
physical and biological observations were made preceding and during a red tide bloom in Mon-
terey Bay, California. These intensive observations provided insight into the physical ocean-
ography underlying the event. The bloom was preceded by intrusion of a warm, chlorophyll-
poor fi lament of the California Current, suddenly changing physical and biological conditions
through most of the bay. Enhancement of vertical density stratifi cation followed the intrusion
and created conditions favoring dinofl agellates. Favorable environmental conditions led to
red tide inception in the northern bay, and advection strongly infl uenced spread of the bloom
throughout the bay and out into the adjacent sea. Concentration of dinofl agellates in conver-
gence zones was indicated by the development of dense red tide patches in fronts and in wave-
like aggregations having the same scale as internal waves that propagated through the bloom.
Oceanography Vol.18, No.2, June 2005 247
ni

Oceanography Vol.18, No.2, June 2005248
INTRODUCTIONPhytoplankton support most of the life
in the ocean. However, some phyto-
plankton species can have deleterious
impacts, primarily by producing toxins
that are transferred to marine life and
to people, by physically damaging or
causing dysfunction of vital tissues (e.g.,
fi sh gills and skin), and by depletion of
oxygen during respiration and decay of
dense blooms (Glibert et al., introduc-
tory article, this issue). Blooms of these
species are termed harmful algal blooms
(HABs). Greater understanding of HABs
is prompted not only by their impacts,
but also by the apparent global increase
in their occurrence (Hallegraeff, 2003).
Red tides can, but do not always, cause
harm; those that do are one category of
HABs. Dinofl agellates constitute approx-
imately 50 percent of all red tide species
and 75 percent of all HAB species (Sour-
nia, 1995; Smayda, 1997); therefore, di-
nofl agellate ecology research is essential
to advancing understanding of red tide
and HAB phenomena. Among the most
challenging aspects of this research is in-
vestigation of the physical oceanography
that infl uences bloom initiation and de-
velopment in complex, rapidly changing
coastal environments (Tester et al., 1991;
Franks and Anderson, 1992; Anderson,
1995; Pitcher and Boyd, 1996; Donaghay
and Osborn, 1997; Smayda, 2002).
Monterey Bay lies in the central Cali-
fornia Current upwelling system (Figure
1) where phytoplankton productivity
and abundance are greatly augmented by
wind-driven upwelling of nutrient-rich
John P. Ryan ([email protected]) is Scientist I, Monterey Bay Aquarium Research Institute,
Moss Landing, CA, USA. Heidi M. Dierssen is Assistant Professor in Residence, University of
Connecticut, Department of Marine Sciences, Groton, CT, USA. Raphael M. Kudela is As-
sistant Professor, University of California, Ocean Sciences Department, Santa Cruz, CA, USA.
Christopher A. Scholin is Associate Scientist, Monterey Bay Aquarium Research Institute,
Moss Landing, CA, USA. Kenneth S. Johnson is Senior Scientist, Monterey Bay Aquarium
Research Institute, Moss Landing, CA, USA. James M. Sullivan is Marine Research Scientist,
University of Rhode Island, Graduate School of Oceanography, Narragansett, RI, USA. An-
drew M. Fischer is Research Technician, Monterey Bay Aquarium Research Institute, Moss
Landing, CA, USA, and Ph.D. Candidate, Cornell University, Ithaca, NY, USA. Erich V. Ri-
enecker is Research Technician, Monterey Bay Aquarium Research Institute, Moss Landing,
CA, USA. Patrick R. McEnaney is Research Technician, Monterey Bay Aquarium Research
Institute, Moss Landing, CA, USA. Francisco P. Chavez is Senior Scientist, Monterey Bay
Aquarium Research Institute, Moss Landing, CA, USA.
9/19 9/29 10/1 10/3 10/5 10/8
SeaWiFS chlorophyll (mg/m3)
0. 5 1 2 4 8
California
PacificOcean
32°N
37°N
42°N
125° W 120° W 115° WA H
B C D E F G
Figure 1. A red tide bloom following rapid environmental change in the central California Current (CC) upwelling system during late September to
early October 2002. Near-surface chlorophyll concentrations in Monterey Bay and adjacent waters from the Sea-viewing Wide Field-of-view Sensor
(SeaWiFS) satellite instrument illustrate fl ushing of the bay by a CC fi lament (B-D; see also Figure 2), and a red tide bloom that rapidly followed the
fl ushing (E-G). Image spatial resolution is ~ 1.1 x 1.1 km. Th e circle at the mouth of Monterey Bay in C shows the location of a mooring that provided
measurements of water properties and ocean current velocities (Figure 3). Th e dinofl agellate species that dominated the bloom were (H) Ceratium
furca (left) and Ceratium dens. Th e pictures are from a water sample taken on October 8, 2002, at the location indicated; the scale bar is 50 µm.

Oceanography Vol.18, No.2, June 2005 249
waters to the shallow sunlit layer (Ryther,
1969). Recent reviews frame the complex
ecology of HABs in coastal upwelling
systems (Smayda, 2000; Kudela et al., this
issue). During a phytoplankton ecology
research program in September and Oc-
tober of 2002, the bay experienced rapid
changes in the physical environment and
phytoplankton community. In 11 days,
the bay changed from characteristic pro-
ductive green-blue waters, to unproduc-
tive clear blue waters, and then to ruddy
brown waters of a red tide that spread
throughout the bay. Observed from the
deck of a ship, the red tide was charac-
terized by highly concentrated patches
having sharp boundaries. The dinofl agel-
late species consistently found to domi-
nate the red tide patches were Ceratium
furca and Ceratium dens (Figure 1H),
which are known to bloom in produc-
tive coastal waters of the Northeast Pa-
cifi c (Horner et al., 1997; Smayda, 2002).
Multidisciplinary, multi-scale observa-
tion of the bay and adjacent sea provided
a lens through which red tide genesis and
evolution were viewed.
METHODSSatellite Remote SensingWe obtained Level 1a Sea-viewing Wide
Field-of-view Sensor (SeaWiFS) im-
agery and ancillary data required for
their processing from the NASA/God-
dard Distributed Active Archive Cen-
ter (DAAC). The SeaDAS software was
applied to atmospherically correct the
imagery, compute chlorophyll con-
centration using the OC4v4 algorithm
(O’Reilly et al., 1998), and geographi-
cally project the chlorophyll images.
Mapped sea surface temperature (SST)
imagery (Figure 2) was obtained from
the NOAA CoastWatch West Coast re-
gional node. Synthetic aperture radar
(SAR) imagery was obtained from the
Alaska Satellite Facility (ASF) and was
projected from satellite to map coordi-
nates using software from ASF.
Aircraft Remote Sensing On October 7, the Airborne Visible/In-
frared Imaging Spectrometer (AVIRIS)
imaged the bay and adjacent waters in
51 minutes with four parallel swaths,
each 11 km wide and overlapping by 1
km. Sun glint was avoided by orient-
ing fl ight line headings toward the sun.
The AVIRIS imagery was atmospheri-
cally corrected using an algorithm devel-
oped for hyperspectral remote sensing
(Gao et al., 2000; Montes et al., 2004).
Atmospheric correction results were
validated with refl ectance spectra com-
puted from optical measurements of the
ocean surface, the sky, and a reference
Kodak gray card. These measurements
were made using a HOBI Labs Hydro-
Rad hyperspectral radiometer during the
AVIRIS acquisition. Chlorophyll concen-
tration was computed from the atmo-
spherically corrected image spectra using
the SeaWiFS OC4v4 algorithm.
California
Current
35.7°N
36.1°N
36.5°N
36.9°N
37.3°N
123.3°W 122.5°W 121.7°W
AVHRR SST (°C)14 15 16 17 18
Figure 2. Th is Advanced Very High Resolution Radiometer (AVHRR) sea
surface temperature (SST) image from September 29, 2002 (cf Figure 1C)
illustrates a warm fi lament of the California Current involved in the rapid
environmental changes preceding the red tide bloom in Monterey Bay.
Th e fi lament is emphasized by the white curved line. Th e circle at the
mouth of Monterey Bay shows the location of a mooring that provided
measurements of water properties and ocean current velocities (Figure 3).

Oceanography Vol.18, No.2, June 2005250
Ship-Based SensingTo monitor physical and bio-optical con-
ditions through a large volume of Mon-
terey Bay during September and October
2002, the R/V Zephyr regularly surveyed
an 83-km, winding transect (Figure 3A),
along which was towed a Sea Sciences
Acrobat Model LTV-50 computer-con-
trolled, undulating vehicle. Instrumen-
tation included a Falmouth Scientifi c
Micro-CTD (conductivity, temperature,
depth), a SeaTech light scattering sensor,
and a WET Labs WETStar fl uorometer.
The depth range sampled was between
~3 and 50 m; the average number of
profi les for full-volume surveys was 170;
a full survey required ~7 hours. To rep-
resent properties within the volume, a
three-dimensional interpolation of the
sampled volume was created for each
measured variable via Delaunay trian-
gulation in MATLAB. Density was cal-
culated from temperature, salinity, and
pressure using the UNESCO 1983 poly-
nomial (Fofonoff and Millard, 1983). To
compute average vertical density stratifi -
cation from the volume surveys (Figure
4), density was binned to 1-m vertical
resolution and vertical-density gradients
(kg/m3 per meter) were computed along
1 5 10 15 20 25 30 5 10 15
100
200
300
400
Dep
th (
m)
-20
0
20
33.4
33.5
33.6
Salin
ity
(psu
)
A C
B
September October
cm/s
Monterey BaySalinity (psu) Chlorophyll Fluor (rfu)
33.6 33. 7 0 1 2 3
September 25
September 27
September 30
North
North
0
20
40Dep
th (
m)
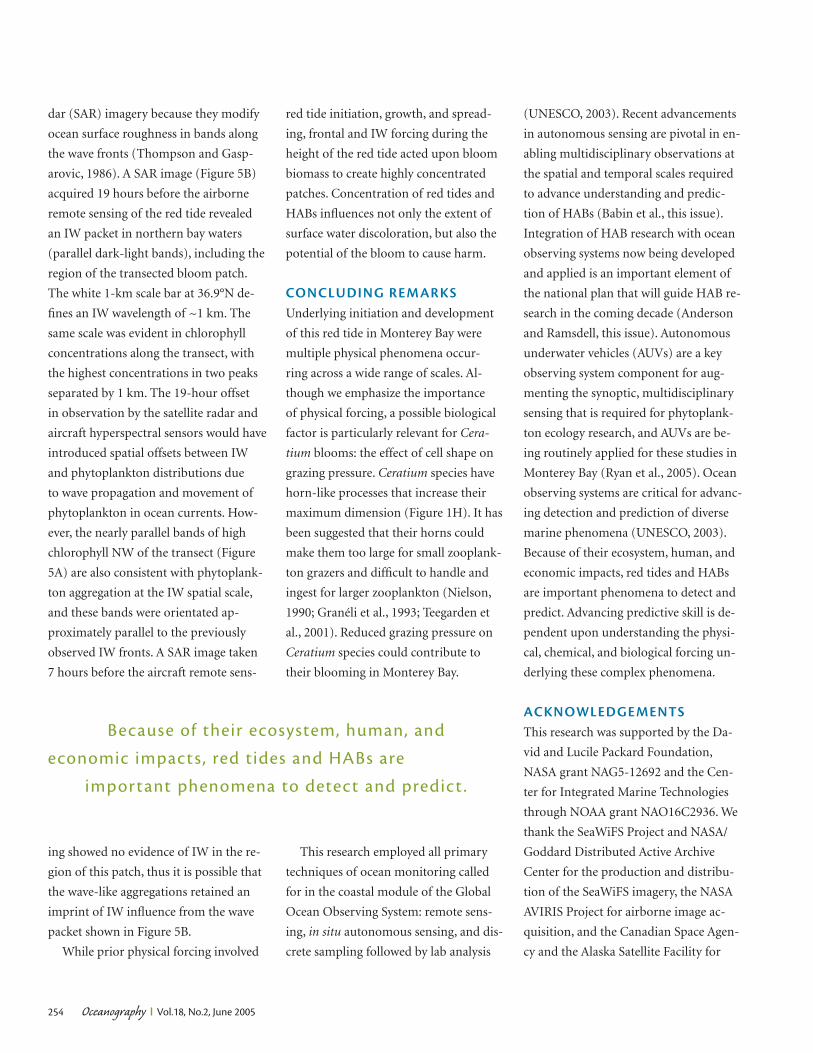
Figure 3. Monterey Bay was closely monitored in situ through the period of rapid change preceding the red tide. Measurement locations
shown within the context of Monterey Bay coastal and seafl oor topography (A) also provide viewpoint reference for the volume views in
C. A mooring at the mouth of the bay captured the low salinity and enhanced fl ow signatures of intruding off shore waters (B). Salinity is
the average of measurements at 1, 10, 20, 40 and 60 m; psu = practical salinity units. Meridional ocean current velocity is positive north-
ward. While the mooring observations detailed conditions at the mouth of the bay, the bay interior was thoroughly surveyed by towed
undulating vehicle along the winding track shown in A. Th e volume views (C) show salinity and chlorophyll fl uorescence (representing
phytoplankton abundance) within the monitored volume (rfu = relative fl uorescence units; 1 rfu = 1 volt of fl uorometer output voltage).
Viewpoint is from above, southwest of the volume, as in A. Dramatic reduction in phytoplankton abundance (cf Figure 1) was evident
throughout most of the bay.

Oceanography Vol.18, No.2, June 2005 251
track for the complete survey. These
were then averaged within density-range
bins rather than depth bins because iso-
pycnal depths varied across the survey
domain. During the red tide bloom,
sampling of phytoplankton was achieved
on multiple days from the R/V Zephyr
and the R/V Point Sur.
Autonomous Moored SensingMoorings of the Monterey Ocean Ob-
serving System at the mouth of Mon-
terey Bay (Figure 3A) and 35 km fur-
ther offshore provided measurements
of temperature and salinity at multiple
depths in the upper water column and
ocean-current velocities between 20 and
500 m. Sea-Bird MicroCAT CTD instru-
ments measured temperature and salin-
ity, and RDI Workhorse Long-Ranger
Acoustic Doppler Current Profi lers
measured water velocities. October 7
average current velocity at 20 m, shown
in Figure 5A, was computed from the
hourly time series that was fi rst low-pass
fi ltered with a 33-hour cutoff to remove
tidal variation.
MULTISCALE PHYSICAL FORCINGFlushing of Monterey BayThe core of the California Current (CC)
is normally more than 100 km seaward
of the central Monterey Bay coast (Col-
lins et al., 2003). Direct infl uence of this
boundary current on nearshore waters
can occur in association with onshore
fl ows during wind relaxation and in CC
meanders and fi laments. During late Sep-
tember 2002, a fi lament of the CC fl owed
into Monterey Bay and displaced resident
bay waters. Intruding waters were rela-
tively chlorophyll-poor (Figure 1B-D)
and warm (Figure 2). Continuous moni-
toring from a mooring at the mouth of
Monterey Bay (Figure 3A) showed rela-
tively low salinity and enhanced fl ow
of the intruding waters (Figure 3B). A
mooring 35 km further offshore detected
low salinity and onshore fl ow anomalies
associated with the CC variability.
We closely monitored the rapid physi-
cal and biological changes forced by the
CC intrusion through much of Mon-
terey Bay (Figure 3A, C). We observed
unperturbed conditions, with phyto-
plankton abundant in the shallow sunlit
waters, on September 25. By September
27, productive waters of the southern
bay were displaced by intruding waters
having lower salinity and much lower
chlorophyll concentrations. By Septem-
ber 30 the entire central bay was fl ushed
by intruding waters.
Enhancement of StratificationStratifi cation is a measure of the strength
of vertical gradients in density. En-
hanced stratifi cation is a primary condi-
tion associated with blooming of red tide
dinofl agellates (Ryther, 1955; Margalef
et al., 1979; Smayda, 1997; Gentien et al.,
this issue; Kudela et al., this issue). Sig-
nifi cant consequences for phytoplankton
ecology and HABs result from inputs of
freshwater and terrestrial materials that
infl uence physical, chemical and biologi-
cal conditions, including stratifi cation,
in many coastal environments (Glibert
et al., this issue; Cembella et al., this is-
sue). In oceanic waters away from local
nutrient inputs that accompany buoy-
ant riverine or estuarine fl ows, stratifi -
cation separates resources that sustain
phytoplankton: light that increases in
intensity toward the surface, and nutri-
0.01 0.02 0.03
1025.0
1025.2
1025.4
1025.6
1025.8
Volume−averaged stratification (kg/m3/m)
Den
sity
(kg
/m3 )
September 30
October 2
Figure 4. Profi les of the average vertical density gradient, computed from en-
tire volume surveys (Figure 3C) show that stratifi cation in Monterey Bay was
strongly enhanced immediately preceding the red tide bloom. Because dino-
fl agellates are favored by stratifi cation, this physical change was an important
factor in the ensuing dinofl agellate red tide. Profi les were smoothed using a
running-mean window of 0.08 kg/m3.

Oceanography Vol.18, No.2, June 2005252
122.1° W 121.9° W
AVIRIS chlorophyll (mg/m3)
0. 5 1 2 4 8
© Canadian Space Agency (2002)
36.6° N
36.7° N
36.8° N
36.9° N
122.1°W 121.9°W
14.5
14.7
14.9
15.1
15.3
15.5
SST
(°C
)
0
5
10
15
20
Ch
loro
ph
yll (
mg/
m3 )
1 2 3 4 5 6 7 8 9 10 11 12
ChlorophyllSST
Distance (km)
A B
C
South North
Figure 5. High-resolution, multidisciplinary remote sensing combined with in situ observations described physical processes in-
volved in red tide spread and patchiness. Th e bloom spread clockwise around the bay (Figure 1). Clockwise wrapping of red tide
waters around a low-chlorophyll anticyclone was pronounced in Airborne Visible/Infrared Imaging Spectrometer (AVIRIS) obser-
vations from October 7, 2002 (A). Image acquisition occurred between 21:01 and 21:52 GMT. Nearly concurrent SST (22:14 GMT)
showed a cool fi lament fl owing clockwise along the northern periphery of the anticyclone (the gray contour in A is the 14.6°C iso-
therm). Ocean current velocity measured at a mooring confi rmed fl ow toward the northwest in the southwestern quadrant of the
anticyclone (the white arrow represents October 7 average current velocity at 20 m depth; magnitude is 12.8 cm/s). Bloom patchi-
ness was detailed by the high-resolution view of AVIRIS (A; more than 3000 times the resolution of the SeaWiFS imagery shown in
Figure 1). Concentration of dinofl agellates in convergence zones was indicated at multiple scales, in association with confl uence
of water masses along the bloom periphery, and in wavelike aggregations having the scale of internal waves (IW) that propagated
through the bloom. Th e IW signature of parallel dark-light bands was pronounced in the northern bay in same-day RADARSAT-1
synthetic aperture radar (SAR) imagery (B). SAR image acquisition began at 02:04 GMT, October 7, 2002; spatial resolution is ~30
m. Th e scale of 1 km was evident across the wave fronts (white scale bar along 36.9°N in B is 1 km) and in a transect of AVIRIS chlo-
rophyll concentrations across a patch infl uenced by the IW. Th e transect location is shown in A, and chlorophyll concentrations
are shown relative to AVHRR SST in C; the vertical dotted lines in C are 1 km apart. Chlorophyll peaks separated by 1 km were the
dominant variation along the transect, and the chlorophyll transect was fi ltered to emphasize variation on scales > 0.5 km.

Oceanography Vol.18, No.2, June 2005 253
ents that increase in concentration with
depth. By enabling access to separated
light and nutrient resources, motility of
dinofl agellates can provide competitive
advantage over non-motile species under
more strongly stratifi ed conditions. Di-
minished turbulence associated with en-
hanced stratifi cation may also minimize
growth-retarding effects of turbulence
on dinofl agellates (Smayda, 1997). Re-
cent experiments, showing highly vari-
able responses of dinofl agellate species
to turbulence, identify this microscale
physical forcing as an important re-
search area for advancing understanding
of red tides and HABs (Sullivan et al.,
2003; Sullivan and Swift, 2003). Between
September 30 (Figure 3C) and October
2, immediately preceding the red tide
bloom, average stratifi cation within the
monitored volume increased sharply in
the pycnocline, the vertical portion of
the water column over which stratifi ca-
tion is greatest (Figure 4). The increase,
unrelated to local inputs of riverine or
estuarine waters, established conditions
advantageous for dinofl agellates.
Red Tide Inception and SpreadShortly after the fl ushing and rapid strat-
ifi cation of the bay, the red tide bloom
began in the northern bay, where the
low-chlorophyll intruding waters met
the remnants of resident high-chloro-
phyll bay waters (Figure 1D). From the
northern bay, the bloom rapidly spread
southward around the bay and out into
the adjacent sea during October 3-8 (Fig-
ure 1E-G). An anticyclonic circulation
pattern infl uencing bloom spread, as in-
dicated by the satellite image sequence,
was supported by high-resolution aircraft
remote sensing of the bloom, satellite
SST imagery, and moored observations
of ocean current velocity (Figure 5A). A
circular region of low chlorophyll waters
was centered at the mouth of the bay, and
waters of the northern and southern bay
wrapped clockwise around this feature. A
cool SST fi lament extended from north-
ern Monterey Bay southeastward along
the northern side of the anticyclone
(gray contour in Figure 5A), indicating
clockwise fl ow in northern bay waters.
October 7 average near-surface veloc-
ity measured at the mooring confi rmed
northwestward fl ow in the southwestern
quadrant of the anticyclone (arrow in
Figure 5A) and is consistent with seaward
extension of chlorophyll-rich waters
from the southern bay.
Red Tide PatchinessRed tides have long been considered
paradigms of plankton patchiness (Ry-
ther, 1955; Margalef et al., 1979). Inter-
action of ocean currents and plankton
motility can create patchiness. Where
horizontal fl ows converge and down-
well, phytoplankton can be concentrated
near the surface if they move upward at
a rate greater than the downward fl ow of
water. Positively buoyant diatoms form
spectacular accumulations in conver-
gence zones along large-scale wave fronts
in the equatorial Pacifi c (Yoder et al.,
1994). Having fl agellar motility, dino-
fl agellates can form dense aggregations
near the surface by swimming upward
against downward fl ows in convergence
zones. Ceratium furca (Figure 1H) are
strong swimmers with an exceptionally
high ratio of swimming to sinking rate
(Smayda, 2002). The ability of C. furca
and C. dens to migrate against vertical
currents has been observed off Baja Cali-
fornia (Blasco, 1978).
Observing at more than 3000 times
the spatial resolution of SeaWiFS satellite
remote sensing, aircraft remote sensing
of this red tide revealed a highly patchy
distribution (Figure 5A). Airborne and
satellite remote sensing support the in-
fl uence of two physical processes on
convergent fl ow patterns and bloom
patchiness. The fi rst was confl uence of
regional water masses along the sea-
ward boundary of the bloom. A transect
through the frontal zone and the center
of a red tide patch (Figure 5A) shows a
sharp increase of chlorophyll concentra-
tions in the frontal zone where bloom
waters converged with low chlorophyll
waters of the anticyclone and the cool
fi lament that fl owed southeastward from
the northern bay (between 7 and 8 km
along-transect in Figure 5C). The second
process was internal waves (IW), which
create convergence zones that can con-
centrate phytoplankton (Franks, 1997).
IW are evident in synthetic aperture ra-
Ocean observing systems are critical for
advancing detection and prediction of
diverse marine phenomena (UNESCO, 2003).
Oceanography Vol.18, No.2, June 2005254
dar (SAR) imagery because they modify
ocean surface roughness in bands along
the wave fronts (Thompson and Gasp-
arovic, 1986). A SAR image (Figure 5B)
acquired 19 hours before the airborne
remote sensing of the red tide revealed
an IW packet in northern bay waters
(parallel dark-light bands), including the
region of the transected bloom patch.
The white 1-km scale bar at 36.9°N de-
fi nes an IW wavelength of ~1 km. The
same scale was evident in chlorophyll
concentrations along the transect, with
the highest concentrations in two peaks
separated by 1 km. The 19-hour offset
in observation by the satellite radar and
aircraft hyperspectral sensors would have
introduced spatial offsets between IW
and phytoplankton distributions due
to wave propagation and movement of
phytoplankton in ocean currents. How-
ever, the nearly parallel bands of high
chlorophyll NW of the transect (Figure
5A) are also consistent with phytoplank-
ton aggregation at the IW spatial scale,
and these bands were orientated ap-
proximately parallel to the previously
observed IW fronts. A SAR image taken
7 hours before the aircraft remote sens-
ing showed no evidence of IW in the re-
gion of this patch, thus it is possible that
the wave-like aggregations retained an
imprint of IW infl uence from the wave
packet shown in Figure 5B.
While prior physical forcing involved
red tide initiation, growth, and spread-
ing, frontal and IW forcing during the
height of the red tide acted upon bloom
biomass to create highly concentrated
patches. Concentration of red tides and
HABs infl uences not only the extent of
surface water discoloration, but also the
potential of the bloom to cause harm.
CONCLUDING REMARKSUnderlying initiation and development
of this red tide in Monterey Bay were
multiple physical phenomena occur-
ring across a wide range of scales. Al-
though we emphasize the importance
of physical forcing, a possible biological
factor is particularly relevant for Cera-
tium blooms: the effect of cell shape on
grazing pressure. Ceratium species have
horn-like processes that increase their
maximum dimension (Figure 1H). It has
been suggested that their horns could
make them too large for small zooplank-
ton grazers and diffi cult to handle and
ingest for larger zooplankton (Nielson,
1990; Granéli et al., 1993; Teegarden et
al., 2001). Reduced grazing pressure on
Ceratium species could contribute to
their blooming in Monterey Bay.
This research employed all primary
techniques of ocean monitoring called
for in the coastal module of the Global
Ocean Observing System: remote sens-
ing, in situ autonomous sensing, and dis-
crete sampling followed by lab analysis
(UNESCO, 2003). Recent advancements
in autonomous sensing are pivotal in en-
abling multidisciplinary observations at
the spatial and temporal scales required
to advance understanding and predic-
tion of HABs (Babin et al., this issue).
Integration of HAB research with ocean
observing systems now being developed
and applied is an important element of
the national plan that will guide HAB re-
search in the coming decade (Anderson
and Ramsdell, this issue). Autonomous
underwater vehicles (AUVs) are a key
observing system component for aug-
menting the synoptic, multidisciplinary
sensing that is required for phytoplank-
ton ecology research, and AUVs are be-
ing routinely applied for these studies in
Monterey Bay (Ryan et al., 2005). Ocean
observing systems are critical for advanc-
ing detection and prediction of diverse
marine phenomena (UNESCO, 2003).
Because of their ecosystem, human, and
economic impacts, red tides and HABs
are important phenomena to detect and
predict. Advancing predictive skill is de-
pendent upon understanding the physi-
cal, chemical, and biological forcing un-
derlying these complex phenomena.
ACKNOWLEDGEMENTSThis research was supported by the Da-
vid and Lucile Packard Foundation,
NASA grant NAG5-12692 and the Cen-
ter for Integrated Marine Technologies
through NOAA grant NAO16C2936. We
thank the SeaWiFS Project and NASA/
Goddard Distributed Active Archive
Center for the production and distribu-
tion of the SeaWiFS imagery, the NASA
AVIRIS Project for airborne image ac-
quisition, and the Canadian Space Agen-
cy and the Alaska Satellite Facility for
Because of their ecosystem, human, and
economic impacts , red tides and HABs are
important phenomena to detect and predict .

Oceanography Vol.18, No.2, June 2005 255
production and distribution of the SAR
imagery. M. Montes helped with AVIRIS
atmospheric correction. Thanks to the
Captain and crew of the R/V Zephyr, to
L. Coletti, S. Fitzwater, H. Jannasch, and
J. Plant for development, maintenance,
and help in operation of the towed ve-
hicle system, and to R. Marin for the
photos of the red tide species in Figure 1.
J.P.R. thanks P.J.S. Franks for discussion
of patchiness and internal waves, and J.
Yoder and T. Smayda for comments and
suggestions on the manuscript.
REFERENCESAnderson, D.M. 1995. Toxic red tides and harmful
algal blooms: A practical challenge in coastal
oceanography. Reviews of Geophysics 33(sup-
pl.):1189-1200.
Blasco, D. 1978. Observations on the diel migration
of marine dinofl agellates of the Baja California
coast. Marine Biology 46:41-47.
Collins, C.A., J.T. Pennington, C.G. Castro, T.A.
Rago, and F.P. Chavez. 2003. The California
Current system off Monterey, California: Physi-
cal and biological coupling. Deep-Sea Research
Part II 50:2389-2404.
Donaghay, P.L. and T.R. Osborn. 1997. Toward a
theory of biological-physical control of harmful
algal bloom dynamics and impacts. Limnology
and Oceanography 42:1283-1296.
Fofonoff, N.P. and R.C. Millard. 1983. Algorithms
for calculation of fundamental properties of
seawater. UNESCO Technical Papers in Marine
Science, No. 44. UNESCO, Paris, France, 53 pp.
Franks, P.J.S. and D.M. Anderson. 1992. Alongshore
transport of a toxic phytoplankton bloom in a
buoyancy current: Alexandrium tamarense in
the Gulf of Maine. Marine Biology 112:153-164.
Franks, P.J.S. 1997. Spatial patterns in dense algal
blooms. Limnology and Oceanography 42:1297-
1305.
Gao, B.C., M.J. Montes, Z. Ahmad, and C.O. Davis.
2000. Atmospheric correction algorithm for
hyperspectral remote sensing of ocean color
from space. Applied Optics 39:887-896.
Granéli, E., P. Olsson, P. Carlsson, W. Granéli, and
C. Nylander. 1993. Weak ‘top-down’ control of
dinofl agellate growth in the coastal Skagerrak.
Journal of Plankton Research 15:213-237.
Hallegraeff, G.M. 2003. Harmful algal blooms: A
global overview. Pp. 25-49 in Manual on Harm-
ful Marine Microalgae, G.M. Hallegraeff, D.M.
Anderson, and A.D. Cembella, eds. UNESCO,
Paris, France.Horner, R.A., D.L. Garrison, and F.G. Plumley.
1997. Harmful algal blooms and red tide prob-lems on the U.S. West coast. Limnology and Oceanography 42:1076-1088.
Margalef, R., M. Estrada, and D. Blasco. 1979. Functional morphology of organisms involved in red tides, as adapted to decaying turbulence.
Pp. 89-94 in Toxic Dinofl agellate Blooms, Pro-ceedings of the Second International Conference on toxic dinofl agellate blooms, D.L. Taylor and H.H. Seliger, eds. Elsevier, New York, NY, USA.
Montes, M.J., B-C Gao, and C.O. Davis. 2004. NRL Atmospheric Correction Algorithms for Oceans: Tafkaa User’s Guide. NRL/MR/7230--04-8760. Naval Research Laboratory Washington, DC.
Nielson, T.G. 1990. Contribution of zooplankton grazing in the decomposition of a Ceratium bloom. Collected Papers of the 1990 ICES Council Meeting. ICES, Copenhagen, Denmark, 33 pp.
O’Reilly, J.E., S. Maritorena, B.G. Mitchell, D.A. Siegel, K.L. Carder, S.A. Garver, M. Kahru and C. McClain. 1998. Ocean color chlorophyll algorithms for SeaWiFS. Journal of Geophysical Research C103:24,937-24,953.
Pitcher, G.C. and A.J. Boyd. 1996. Across-shelf and alongshore dinofl agellate distributions and the mechanisms of red tide formation within the southern Benguela upwelling system. Pp. 243-246 in Harmful and Toxic Algal Blooms: Proceed-ings of the 7th International Conference on Toxic Phytoplankton, T. Yasumoto, Y. Oshima and Y. Fukuyo, eds, UNESCO, Paris, France.
Ryan, J.P., F.P. Chavez, and J.G. Bellingham. 2005. Physical-biological coupling in Monterey Bay, California: Topographic infl uences on phyto-plankton ecology. Marine Ecology Progress Series 287:23-32.
Ryther, J.H. 1955. Ecology of autotrophic marine dinofl agellates with reference to red water con-ditions. Pp. 387-414 in The Luminescence of Biological Systems, F.H. Johnson, ed. American Association for the Advancement of Science, Washington, D.C., USA.
Ryther, J.H. 1969. Photosynthesis and fi sh produc-tion in the sea. Science 166:72-76.
Advancing predictive skil l is dependent
upon understanding the physical , chemical ,
and biological forcing underlying these
complex phenomena .
Smayda, T.J. 1997. Harmful algal blooms: Their ecophysiology and general relevance to phy-toplankton blooms in the sea. Limnology and Oceanography 42:1137-1153.
Smayda, T.J. 2000. Ecological features of harmful algal blooms in coastal upwelling systems. South African Journal of Marine Science 22:219-253.
Smayda, T.J. 2002. Turbulence, watermass stratifi -
cation and harmful algal blooms: An alternative view and frontal zones as pelagic seed banks. Harmful Algae 1:95-112.
Sournia, A. 1995. Red-tide and toxic marine phy-toplankton of the world ocean: an inquiry into biodiversity. Pp. 103-112 in Harmful Marine Algal Blooms, P. Lassus, G. Arzul, E. Erard-Le Denn, P. Gentien, and C. Marcaillou-LeBaut, eds. Lavoisier, Paris, France.
Sullivan, J.M. and E. Swift. 2003. Effects of small-scale turbulence on net growth rate and size of ten species of marine dinofl agellates. Journal of Phycology 39:83-94.
Sullivan, J.M., E. Swift, P.L. Donaghay, and J.E.B. Rines. 2003. Small-scale turbulence affects the division rate and morphology of two red-tide dinofl agellates. Harmful Algae 2:183-199.
Teegarden G.J., R.G. Campbell, and E.G. Durbin. 2001. Zooplankton feeding behavior and par-ticle selection in natural plankton assemblages containing toxic Alexandrium spp. Marine Ecol-ogy Progress Series 218:213-226.
Tester, P.A., R.P. Stumpf, F.M. Vukovich, P.K. Fol-wer, and J.T. Turner. 1991. An expatriate red tide bloom: transport, distribution, and persistence. Limnology and Oceanography 36:1053-1061.
Thompson, D.R. and R.F. Gasparovic. 1986. In-tensity modulation in SAR images of internal waves. Nature 320:345-347.
UNESCO. 2003. The Integrated, Strategic Design Plan for the Coastal Oceans Observation Module of the Global Ocean Observing System. GOOS Report No. 125. IOC Information Documents Series No. 1183. UNESCO, Paris, France, 190 pp.
Yoder, J.A., S.G. Ackleson, R.T. Barber, P. Flament, and W.M. Balch. 1994. A line in the sea. Nature 371:689-692.