Embed Size (px)
Citation preview
CoAXs 2.0Scaling up Co-Creative Planning of
Transit Corridors using Accessibility-Based Stakeholder Engagement
November 2017

Associate Professor, MIT Department of Urban Studies and Planning
Professor of the Practice, MIT Department of Urban Studies and Planning
MST-MCP Candidate | Facilitation, partner liaison, and scenario development lead
MCP-JD Candidate | Facilitation, scenario development, and partner liaison
MCP Candidate | Analysis and report design
SM | Analysis and scenario development
MCP Candidate | Analysis, scenario development, and partner liaison
MCP | Analysis and survey design
PhD | Technical lead
MST Candidate | Software development lead
Supported by:TransitCenterBRT+ Centre of ExcellenceMIT Department of Urban Studies and Planning
Copyright 2017 Massachusetts Institute of Technology
In partnership with:LivableStreetsRide New OrleansAdvance AtlantaWalk San FranciscoConveyal
Additional thanks to:Jaime SozaJeffrey Rosenblum
P. Christopher Zegras
Ceasar McDowell
Kelly Blynn
Peter Damrosch
Xinhui Li
Cristian Navas Duk
Ricardo Sanchez Lang
Ayesha Shahid
Anson Stewart
Xin Zheng
Team
Acknowledgements
CONTENTS
Introduction1
4
5
6
2
3
Looking back: Lessons learned from four partnerships in four cities
Looking forward
Appendices
Research objectives and approach
Project background
Software capabilities
Did CoAXs help our advocacy partners advance their goals?
What time, resources, and capacities were needed?
What did users think of the tool capabilities?
Is the current version of CoAXs versatile for different users and engagement formats?
Appendix A: Boston workshop details
Appendix B: Software and data requirements and preparation
Near term engagement lessons
Longer term prospects
Partner and timeline
Scenarios: Bus priority in Boston
Workshop design
Findings
Impetus for testing in new contexts
Process for finding and selecting spring partners
Brief description of each deployment
Findings
Boston-area Workshops in Fall 2016
New contexts in Spring 2017
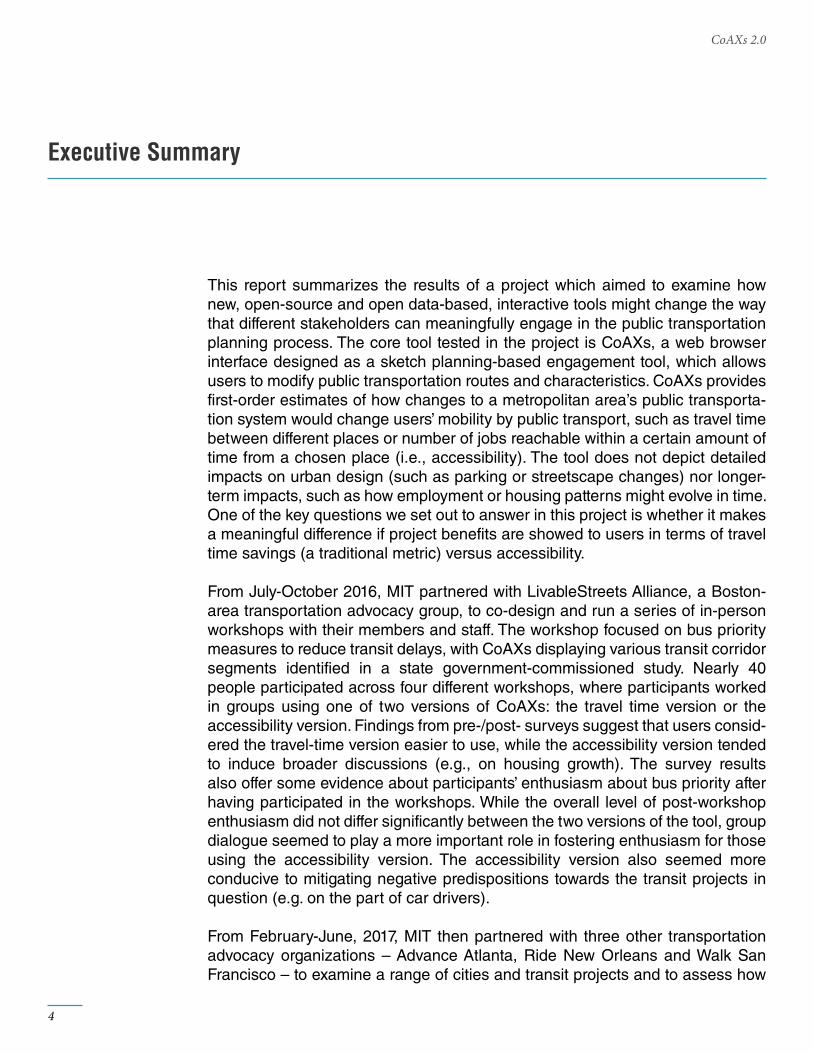
This report summarizes the results of a project which aimed to examine how new, open-source and open data-based, interactive tools might change the way that different stakeholders can meaningfully engage in the public transportation planning process. The core tool tested in the project is CoAXs, a web browser interface designed as a sketch planning-based engagement tool, which allows users to modify public transportation routes and characteristics. CoAXs provides first-order estimates of how changes to a metropolitan area’s public transporta-tion system would change users’ mobility by public transport, such as travel time between different places or number of jobs reachable within a certain amount of time from a chosen place (i.e., accessibility). The tool does not depict detailed impacts on urban design (such as parking or streetscape changes) nor longer-term impacts, such as how employment or housing patterns might evolve in time. One of the key questions we set out to answer in this project is whether it makes a meaningful difference if project benefits are showed to users in terms of travel time savings (a traditional metric) versus accessibility.
From July-October 2016, MIT partnered with LivableStreets Alliance, a Boston-area transportation advocacy group, to co-design and run a series of in-person workshops with their members and staff. The workshop focused on bus priority measures to reduce transit delays, with CoAXs displaying various transit corridor segments identified in a state government-commissioned study. Nearly 40 people participated across four different workshops, where participants worked in groups using one of two versions of CoAXs: the travel time version or the accessibility version. Findings from pre-/post- surveys suggest that users consid-ered the travel-time version easier to use, while the accessibility version tended to induce broader discussions (e.g., on housing growth). The survey results also offer some evidence about participants’ enthusiasm about bus priority after having participated in the workshops. While the overall level of post-workshop enthusiasm did not differ significantly between the two versions of the tool, group dialogue seemed to play a more important role in fostering enthusiasm for those using the accessibility version. The accessibility version also seemed more conducive to mitigating negative predispositions towards the transit projects in question (e.g. on the part of car drivers).
From February-June, 2017, MIT then partnered with three other transportation advocacy organizations – Advance Atlanta, Ride New Orleans and Walk San Francisco – to examine a range of cities and transit projects and to assess how
4
CoAXs 2.0
Executive Summary
well CoAXs worked remotely (i.e., with people logging in, on their own, via the web). Overall, fewer people used the tool in this remote approach, and used it for relatively short periods of time (about 9 minutes, on average), somewhat supporting the perceived value of the in-person workshop approach. Nonethe-less, users still found the tool useful (e.g., for training) and usable and indicated that CoAXs was effective in changing their perceived impacts of transit system improvements.
The in-person and remote workshops, in partnership with advocacy organizations from several cities across the USA, provide some support for CoAXs’ potential to enhance participation in public transportation planning. That said, preparing CoAXs for a particular campaign in a specific city is not “automatic.” Below we summarize some of the key technical and organizational “lessons learned” from our experiences over the past year.
• Think and Strategize First. Adapting CoAXs to a specific context is time consuming. Before starting to gather data, organizations should clearly define their vision and objectives for their stakeholder engagement campaign, use of the CoAXs tool, the public transportation projects of interest, and the types of “accessibility” (e.g., to job opportunities, healthcare facilities) to be analyzed.
• Prioritize. In theory, CoAXs can be used to assess a number of different public transport scenarios and variations to them. In practice, the number of scenarios should be limited. Technical and time constraints naturally limit the scope of what can be considered in any practical application. The specifics should closely follow a strategic vision and objectives.
• Prepare the Technical Requirements. In most cases, CoAXs requires access to the open-source Conveyal Analysis software. After establishing that capability, CoAXs has four basic inputs for creating a project:
i. General Transit Feed Specification (GTFS) files for the area’s public transit system,
ii. geo-referenced data of the variables representing “opportunities” of interest to access (e.g., jobs, persons with certain levels of education, health centers, green areas),
iii. technical details about the public transport projects of interest (these are project-specific, but generally include average speed, length of the route, location of stops), and
iv. shapefiles representing any new services and lines (generally to be generated by the users).
The above implies that individuals involved in preparing CoAXs for a specific application have proficiency in GIS and, ideally, familiarity with GTFS. In addition, the implementation team needs to have web development capabil-ities.
• Design and Prepare the Engagement Method(s). In-person workshops
5
Scaling up Co-creative Planning of Transit Corridors using Accessibility-Based Stakeholder Engagement
tend to encourage enriching deliberations, where people can share experi-ences and doubts, question assumptions, and develop mutual understand-ings. Such workshops must be kept to a manageable size (e.g., no more than 10 persons per group working around a large touchscreen) and need at least one trained facilitator. This ensures that:
• participants have the chance to meaningfully interact with the tool,
• most participants are able to test scenarios of their interest,
• fruitful conversations can take place, and,
• the facilitator can reasonably manage the experience.
That said, online engagement has the potential to engage a large number of people, in a low cost, low hassle way. A hybrid in-person/online engage-ment approach might also be worth exploring, as might innovative ways to encourage participation (e.g., gamification).
• Provide Adequate Project Information. Even if the intended audience consists of people familiar with transportation planning, background infor-mation on the public transportation projects should be shared. This should include general information about the types of changes that can be explored in CoAXs and definitions of terms (e.g., headways, BRT, dwell times).
• Capitalize on the Learning Opportunity. CoAXs is only one type of tool that can be used for enhancing engagement. Any organization should consider how CoAXs might fit within its broader suite of approaches and ultimate objectives. Once deciding that CoAXs (or a similar tool) might be right, the organization should consider using the CoAXs experience as an experiment – to understand the impacts on its members, the organization itself, and its objectives.
6
CoAXs 2.0

7
Scaling up Co-creative Planning of Transit Corridors using Accessibility-Based Stakeholder Engagement

Introduction
1
Research objectives and approachProject background
Software capabilities
101113
While better stakeholder engagement and performance metrics have long been espoused by authorities, substantive progress still faces political and institutional barriers. In many places, allies of public transit, especially longstanding trans-portation equity advocates, are skeptical of “black box” transportation planning processes. This rhetoric-practice gap points to the need for enhanced transit planning methods, more conducive to meaningful stakeholder engagement and accounting for agencies’ and community groups’ limited financial, human and technical resources. Interactive planning tools could meet this need.
Open-source tools and open data, transparent and reasonably available, hold some promise. “Free and Open Source Software” (FOSS) makes source code readily available for modification by others, in theory. “Open data” refers to data that anyone can access, use or share.[1] Limited information exists, however, about the time and effort required to adapt such tools for community-led campaigns. Software and data providers are guarded about the technical effort required to tailor their tools for grassroots groups, and the latter are wary of investing scarce time and resources in prospective tools with unproven benefits.
This report summarizes the results of a project aiming to assess the value of one open-source, open data tool designed for public engagement in public transpor-tation planning. Through partnerships with community-based transit advocacy organizations in four US cities, we attempt to shed light on how these tools can become more usable, valuable, and widely applicable. Through a combination of in-person workshops and remote (individual web-accessed) implementations, we attempt to gauge the difference in engagement mechanisms. By testing different ways of communicating transit’s benefits to stakeholders, we aim to see whether the concept of “accessibility” can be meaningfully operationalized in engage-ment processes and produce “better” outcomes. By assessing the technical and communicative efforts required,we gauge the resource requirements of extending the co-creative model. The ultimate objective of this project is to push forward tools and approaches that can improve the planning process, enhancing its credibility, and expanding the possibilities for “co-creative” outcomes.
[1] ODI. What is open data? Open Data Institute. Accessed 7 August 2017 at: https://theodi.org/what-is-open-data.
10
CoAXs 2.0
Research objectives and approach
Urban planning generally, and transportation planning specifically, has long grappled with how to meaningfully and effectively engage the “public.” In the USA, the top-down, engineering-driven urban highway program of the 1950s and 1960s came to a head in the late 1960s, culminating in the “freeway revolts” and national legislation requiring more public involvement.[2] Around the same time and also in response to top-down initiatives such as urban renewal, partic-ipation “came into vogue” among planning theorists and practitioners.[3] Over the subsequent half century, as conceptions of planning have evolved, so have conceptions about the role for public participation.
Paralleling the movement towards more open forms of governance, the ongoing revolution in information and communication technologies (ICTs) has ushered in new possibilities for planning and managing infrastructure and services and empowering citizens. “Open data” – borne of the basic idea that open govern-ment, transparency, and accountability can enhance public policy and service delivery[4] – epitomizes the potential. ICTs create new possibilities for distributed data generation, computation, and sharing and also create new expectations among citizens about what information should be made available, by whom, to whom, under what conditions, and for what purposes. In the USA, these possibil-ities and expectations have increasingly manifest themselves across the public sector. Public transportation provides a great example, through what Rojas[5] terms “transit transparency.” Starting in the mid-2000s, transit agencies across the country began publicly releasing digital files of static transit information (e.g., stops and schedules) in a now de-facto standard (the general transit feed speci-
[2] Napolitan, F., and P. C. Zegras. Shifting Urban Priorities? The Removal of Inner City Freeways in the United States. Transportation Research Record No. 2046, 2008, pp. 68-75. Last accessed 7 August 2017 at: http://web.mit.edu/czegras/www/Napolitan_Zegras_FreewayRe-moval_Final.pdf.[3] Arnstein, S. A Ladder of Citizen Participation. JAIP, Vol. 35, No. 4, 1969, pp. 216–224. Last accessed 7 August 2017 at: www.participatorymethods.org/sites/...org/files/Arnstein%20ladder%201969.pdf.[4] Janssen, M., Y. Charalabidis, and A. Zuiderwijk. Benefits, Adoption Barriers and Myths of Open Data and Open Government. Information Systems Management, Vol. 29, No. 4, 2012, pp. 258–268. Last accessed 7 August 2017 at: http://repository.tudelft.nl/islandora/object/uuid:952c-8b0e-c55e-4443-9b41-14c38806a840/datastream/OBJ/view[5] Rojas, F. M. Transit Transparency : Effective Disclosure through Open Data. Taubman Center for State and Local Government, Harvard Kennedy School Cambridge, MA, 2012. Last accessed 7 August 2017 at: http://www.transparencypolicy.net/assets/FINAL_UTC_TransitTransparency_8%2028%202012.pdf.
11
Scaling up Co-creative Planning of Transit Corridors using Accessibility-Based Stakeholder Engagement
Project background
fication, GTFS) and creating methods (application programing interfaces, APIs) for third parties to access that information. An increasingly global phenomenon, transit transparency, exemplified by GTFS, is shifting how agencies interact with users and the general public, opening new methods of communication and service use, monitoring, assessment, and modeling.
Google originally specified GTFS as the format in which transit agencies could upload their network and schedule information to enable transit directions in Google Maps. Since then, GTFS has evolved into a collab-oratively updated, flexible standard, powering a wide range of trip planning and analysis applications. Feeds (generally .zip collections of comma-separated text files) for over 800 transit providers can be downloaded from transit agencies or sites like Transitfeeds[6].
Application programming interfaces (APIs) make it easier for software developers to meet their users’ needs by providing standardized, documented data access. Leading transit agencies (including the MBTA[7] and Transport for London[8]) support APIs for service alerts and vehicle arrival predictions, giving developers simple, reliable, and accurate ways to obtain data that don’t require familiarity with the complexities of agencies’ internal systems.
The project summarized in this report aims to capitalize on these trends, leveraging an open-source and open data-based tool called CoAXs (short for Collaborative Accessibility-based Stakeholder Engagement System). CoAXs was designed to be used in co-creative[9] planning workshops to evaluate and communicate accessibility benefits of public transit projects. After initial focus group testing in Boston and Santiago de Chile,[10] it was subsequently used in a series of public workshops organized in partnership with a local community development organi-zation, examining the potential for bus rapid transit in the Boston Metropolitan Area. The work described in this report represents a continuation of our develop-ment of the tool’s technological and participatory capabilities.
[6] https://transitfeeds.com/[7] http://realtime.mbta.com/portal[8] https://tfl.gov.uk/info-for/open-data-users/unified-api[9] Benson, Stephen. 2013. Co-creation 101: How to use the crowd as an innovation partner to add value to your brand. Vision Critical. Last accessed 7 August 2017 at: https://www.visioncrit-ical.com/cocreation-101/.[10] Stewart, Anson F. 2014. “Visualizing Urban Accessibility Metrics for Incremental Bus Rapid Transit Projects.” MST-MCP Thesis. MIT. https://dspace.mit.edu/handle/1721.1/92057?show=full
12
CoAXs 2.0
GTFS
APIs
CoAXs is a browser-based interface designed to support deliberation about modifications to public transport systems. As a sketch planning and stake-holder engagement tool, it occupies a middle ground between detailed network editing and modeling software on the one hand, and presentation tools that use pre-calculated results for information delivery on the other. Users can activate and deactivate selected hypothetical and existing transit routes; set parame-ters such as changes in speed, frequency, and dwell time for bundles of routes; and explore the impact of these changes on different locations in a region. A zoomable and pannable map is central to the interface, allowing users to under-stand how project features (dedicated bus lanes on a certain street, for example) and impacts (reduced travel time, or conversely, increased access to opportuni-ties) relate spatially to familiar places.
CoAXs performs a first-order analysis of changes to the transit system. Longer-term changes to land-use patterns and other dynamics are not explicitly modeled. Detailed urban design, pedestrian environment, streetscape, and traffic changes that might be associated with changes to transit are also not represented. Participants’ expectations about these changes are based on their intuition and iterative exploration of first-order impacts of transit service changes, such as reduced travel time. To support this interactive, dynamic generation and evaluation of transport network scenarios, CoAXs relies on software called Analysis, developed by Conveyal. This computational software has an API that accepts network modifications and returns detailed travel time and accessibility results within seconds. Both CoAXs and Conveyal’s tools are open-source[11], allowing them to be downloaded, modified, and run on private computers or cloud computing infrastructure. Further details on the software dependencies of CoAXs are included in Appendix B.
[11] Conveyal’s software, R5 and Analysis, are under the MIT license (https://github.com/conveyal/r5/blob/master/LICENSE, https://github.com/conveyal/analysis-backend/blob/master/LICENSE), which allows free use, modification, and redistribution and is compatible with the GNU GPL (http://www.gnu.org/licenses/license-list.html#X11License).
13
Scaling up Co-creative Planning of Transit Corridors using Accessibility-Based Stakeholder Engagement
Software capabilities

Boston-area Workshops in Fall 2016
2
Partner and timelineScenarios: Bus priority in Boston
Workshop designFindings
Participant demographicsParticipant interactions
Usability and usefulness in supporting dialogueExpected impacts
EnthusiasmOther feedback
16171921212124262829

We started the project by partnering with LivableStreets Alliance, an advocacy group in the Greater Boston area working for streets that accommodate all people and provide mobility options that enhance access to opportunities and destinations. We began working with them in the summer of 2016 to explore how CoAXs might fit into their advocacy committee’s work to develop a campaign supporting bus priority measures. Some LivableStreets members and staff had been involved in past work exploring bus rapid transit in Boston and testing earlier versions of CoAXs. They were eager to engage their wider membership with bus priority campaigns, especially as the Massachusetts Department of Transporta-tion (MassDOT) has been actively examining the prioritization of dedicated bus lanes.
After several discussions, we jointly agreed on the following overall project objec-tives:
• Deepen understanding within the advocacy committee about the impacts of transit priority by exploring the connections between transit priority, network design, and regional accessibility.
• Give people a shared experience and foundational knowledge base to facili-tate conversations about the place of transit priority within Complete Streets and LivableStreets’ advocacy.
• Understand and measure how CoAXs in combination with dialogue among participants can increase support for transit improvements through broad-ening stakeholder involvement in planning, improving credibility around the planning process, and generating new service ideas.
• Test to what extent a focus on regional accessibility (as opposed to the tradi-tional, time -savings lens) can widen the scope of both impacts and people considered relevant to a project.
In September, we met with core members of LivableStreets who volunteered as “captains” to help develop sample transit scenarios and the workshop agenda. They helped us formulate more specific objectives for what participants would learn from the workshops, including:
• The value and possibility of improving bus service
• What it would take to fix buses
• The aggregate impact of bus priority on quality of life in the city
16
CoAXs 2.0
Partner and timeline
• How bus priority could impact them personally
In October, we conducted four workshops, which are described in greater detail below. After we processed results from the workshop, LivableStreets hosted us for a debrief discussion in December.
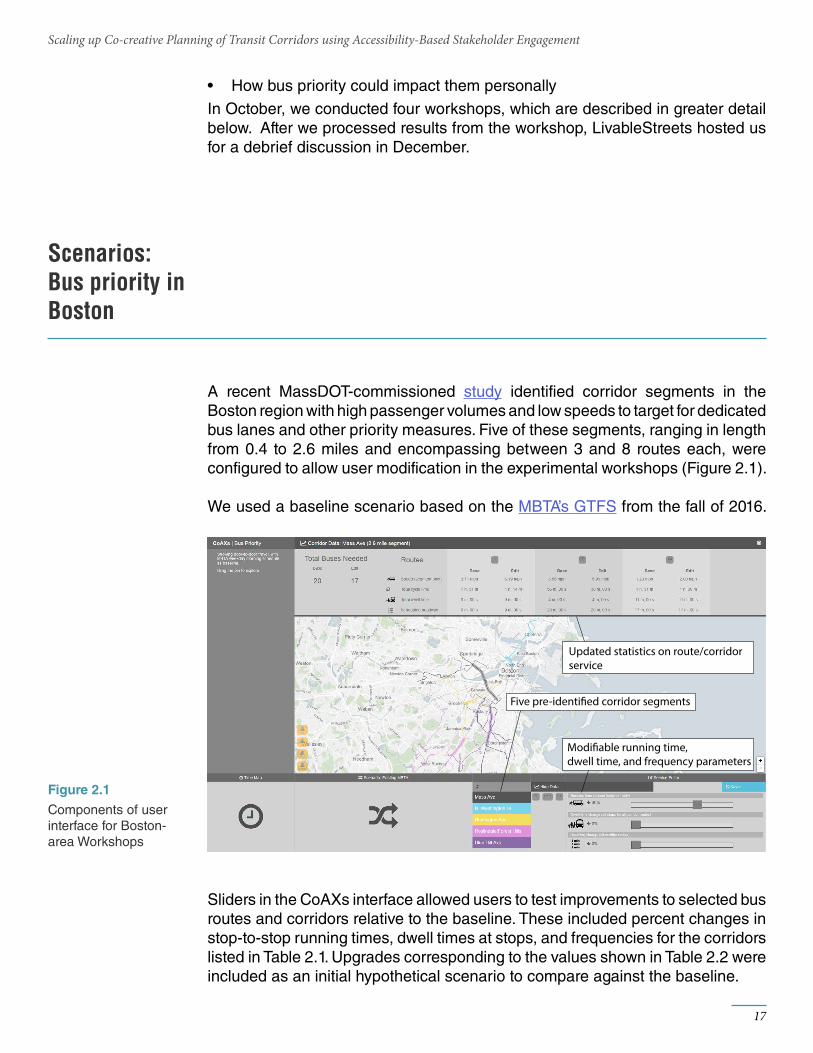
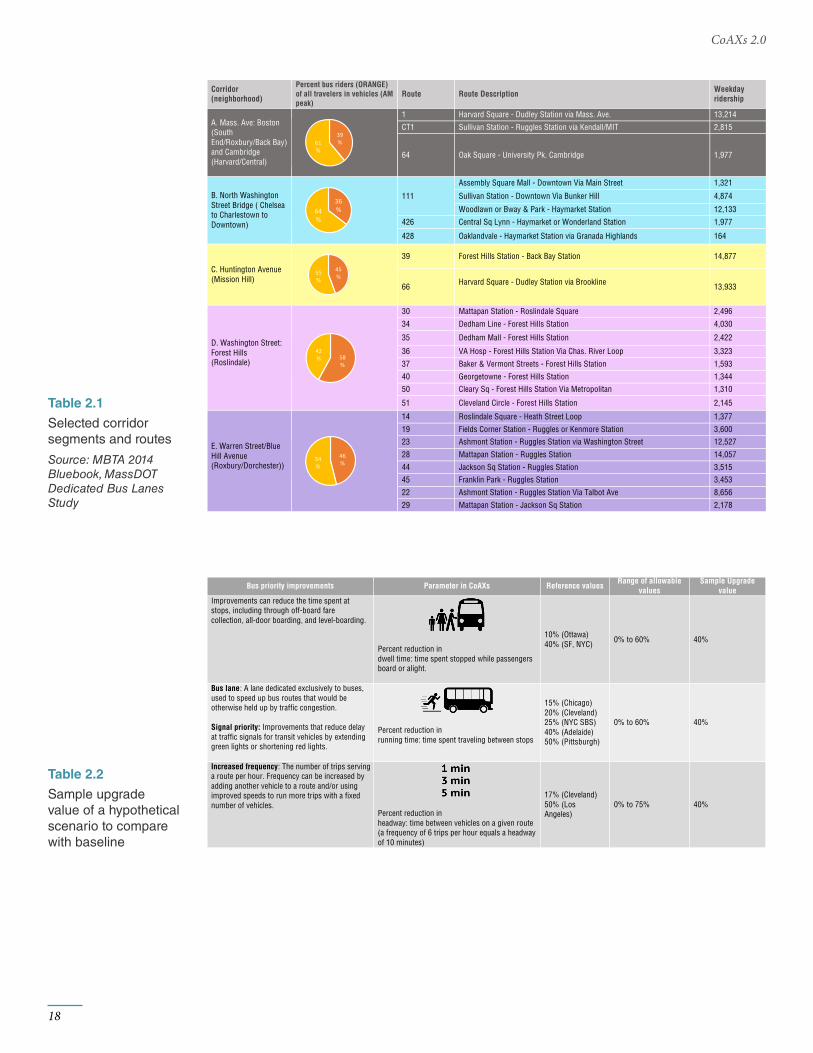
A recent MassDOT-commissioned study identified corridor segments in the Boston region with high passenger volumes and low speeds to target for dedicated bus lanes and other priority measures. Five of these segments, ranging in length from 0.4 to 2.6 miles and encompassing between 3 and 8 routes each, were configured to allow user modification in the experimental workshops (Figure 2.1).
We used a baseline scenario based on the MBTA’s GTFS from the fall of 2016.
Five pre-identi�ed corridor segments
Updated statistics on route/corridor service
Modi�able running time, dwell time, and frequency parameters
Sliders in the CoAXs interface allowed users to test improvements to selected bus routes and corridors relative to the baseline. These included percent changes in stop-to-stop running times, dwell times at stops, and frequencies for the corridors listed in Table 2.1. Upgrades corresponding to the values shown in Table 2.2 were included as an initial hypothetical scenario to compare against the baseline.
17
Scaling up Co-creative Planning of Transit Corridors using Accessibility-Based Stakeholder Engagement
Scenarios: Bus priority in Boston
Components of user interface for Boston-area Workshops
Figure 2.1
!
Bus priority improvements Parameter in CoAXs Reference values Range of allowable
values Sample Upgrade
value Improvements can reduce the time spent at stops, including through off-board fare collection, all-door boarding, and level-boarding.
Percent reduction in dwell time: time spent stopped while passengers board or alight.
10% (Ottawa) 40% (SF, NYC) 0% to 60% 40%
Bus lane: A lane dedicated exclusively to buses, used to speed up bus routes that would be otherwise held up by traffic congestion. Signal priority: Improvements that reduce delay at traffic signals for transit vehicles by extending green lights or shortening red lights.
Percent reduction in running time: time spent traveling between stops
15% (Chicago) 20% (Cleveland) 25% (NYC SBS) 40% (Adelaide) 50% (Pittsburgh)
0% to 60% 40%
Increased frequency: The number of trips serving a route per hour. Frequency can be increased by adding another vehicle to a route and/or using improved speeds to run more trips with a fixed number of vehicles.
Percent reduction in headway: time between vehicles on a given route (a frequency of 6 trips per hour equals a headway of 10 minutes)
17% (Cleveland) 50% (Los Angeles)
0% to 75% 40%
!!
Corridor (neighborhood)
Percent bus riders (ORANGE) of all travelers in vehicles (AM peak)
Route Route Description Weekday ridership
A. Mass. Ave: Boston (South End/Roxbury/Back Bay) and Cambridge (Harvard/Central)
1 Harvard Square - Dudley Station via Mass. Ave. 13,214
CT1 Sullivan Station - Ruggles Station via Kendall/MIT 2,815
64 Oak Square - University Pk. Cambridge 1,977
B. North Washington Street Bridge ( Chelsea to Charlestown to Downtown)
111
Assembly Square Mall - Downtown Via Main Street 1,321
Sullivan Station - Downtown Via Bunker Hill 4,874
Woodlawn or Bway & Park - Haymarket Station 12,133
426 Central Sq Lynn - Haymarket or Wonderland Station 1,977
428 Oaklandvale - Haymarket Station via Granada Highlands 164
C. Huntington Avenue (Mission Hill)
39 Forest Hills Station - Back Bay Station 14,877
66 Harvard Square - Dudley Station via Brookline 13,933
D. Washington Street: Forest Hills (Roslindale)
30 Mattapan Station - Roslindale Square 2,496
34 Dedham Line - Forest Hills Station 4,030
35 Dedham Mall - Forest Hills Station 2,422
36 VA Hosp - Forest Hills Station Via Chas. River Loop 3,323
37 Baker & Vermont Streets - Forest Hills Station 1,593
40 Georgetowne - Forest Hills Station 1,344
50 Cleary Sq - Forest Hills Station Via Metropolitan 1,310
51 Cleveland Circle - Forest Hills Station 2,145
E. Warren Street/Blue Hill Avenue (Roxbury/Dorchester))
14 Roslindale Square - Heath Street Loop 1,377
19 Fields Corner Station - Ruggles or Kenmore Station 3,600
23 Ashmont Station - Ruggles Station via Washington Street 12,527
28 Mattapan Station - Ruggles Station 14,057
44 Jackson Sq Station - Ruggles Station 3,515
45 Franklin Park - Ruggles Station 3,453
22 Ashmont Station - Ruggles Station Via Talbot Ave 8,656
29 Mattapan Station - Jackson Sq Station 2,178
39%61
%
36%64
%
45%55
%
58%
42%
46%
54%
18
CoAXs 2.0
Sample upgrade value of a hypothetical scenario to compare with baseline
Table 2.2
Selected corridor segments and routes
Source: MBTA 2014 Bluebook, MassDOT Dedicated Bus Lanes Study
Table 2.1
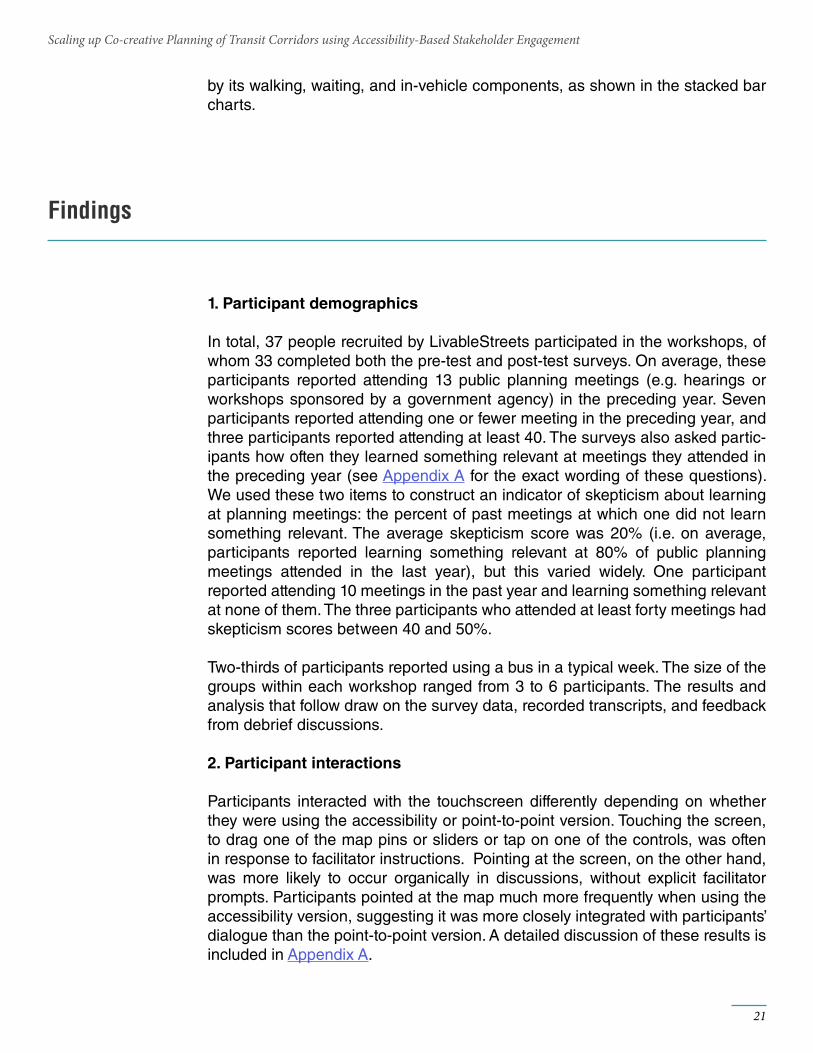
In collaboration with LivableStreets, we customized a version of CoAXs for use in two-hour, in-person workshops. At the beginning of each workshop, participants listened to a ten-minute overview of the bus priority study and related projects, completed a pre-test survey, then divided into two groups. The two groups tested separate versions of the tool with distinct ways of representing benefits of transit improvements, as detailed below. Each group tested sample scenarios before creating their own modifications. Participants then completed a post-test survey and reconvened for a ten-minute debrief discussion.
Copies of both surveys are included in Appendix A. The pre-test survey contained questions on past participation in planning meetings and an open-response item about modes of travel regularly used. It also included questions on a Likert-type scale (e.g., 1 to 5) about expected impacts of the sample project on different groups, and enthusiasm for the sample project. The post-test survey repeated these questions and included additional questions about CoAXs’ usability as well as its usefulness for promoting conversation and empathy. The “sample project” in question was not necessarily constant between the two surveys. In the pre-test survey, a certain level of service improvements was defined for the five chosen corridors, but during the course of the workshop, participants’ understandings of a feasible or desirable level of improvements for each of the corridors may have changed, and their interpretation of “sample project” may have changed accord-ingly. The inconsistency in “sample project’s” definition is a methodological limita-tion, but it may reflect how both the features of projects, and perceptions of them, may shift through public involvement.
We conducted the workshops in MIT classrooms with moveable partitions, which allowed the two groups to work in separate spaces. Two touchscreens were used for the different tool versions, and participants were not informed until the end of the workshop that the other group had tested a different version of CoAXs. Observers also noted participant interactions with the tool and with each other using an observation rubric and audio recording.
Two primary facilitators led the workshops, one assigned to each group; between workshops they alternated between the tool versions. These facilitators followed a script introducing the CoAXs interface, comparing the baseline and initial hypothetical scenarios from different locations, discussing ranges of parameters to test, inputting new scenarios, and deliberating about impacts. They actively encouraged interaction with the tool and questions about its usage and under-lying assumptions.
19
Scaling up Co-creative Planning of Transit Corridors using Accessibility-Based Stakeholder Engagement
Workshop design
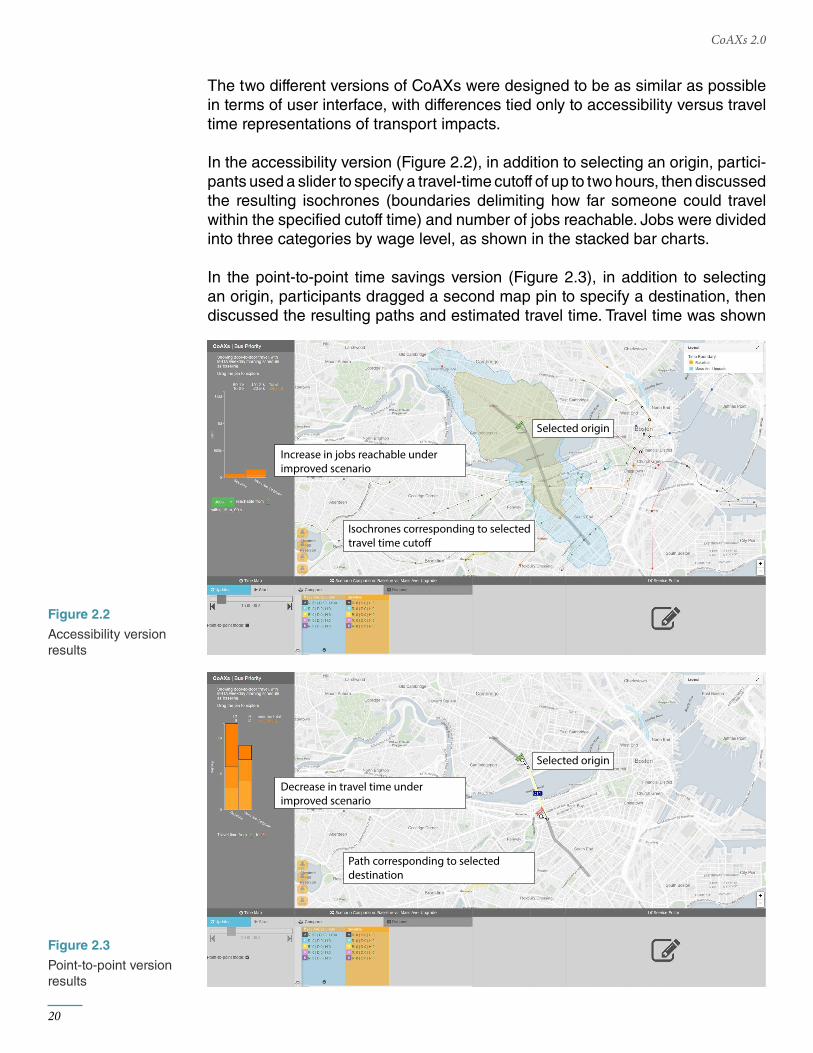
Increase in jobs reachable underimproved scenario
Isochrones corresponding to selectedtravel time cuto�
Selected origin
The two different versions of CoAXs were designed to be as similar as possible in terms of user interface, with differences tied only to accessibility versus travel time representations of transport impacts.
In the accessibility version (Figure 2.2), in addition to selecting an origin, partici-pants used a slider to specify a travel-time cutoff of up to two hours, then discussed the resulting isochrones (boundaries delimiting how far someone could travel within the specified cutoff time) and number of jobs reachable. Jobs were divided into three categories by wage level, as shown in the stacked bar charts.
In the point-to-point time savings version (Figure 2.3), in addition to selecting an origin, participants dragged a second map pin to specify a destination, then discussed the resulting paths and estimated travel time. Travel time was shown
Decrease in travel time underimproved scenario
Path corresponding to selecteddestination
Selected origin
20
CoAXs 2.0
Accessibility version results
Figure 2.2
Point-to-point version results
Figure 2.3
by its walking, waiting, and in-vehicle components, as shown in the stacked bar charts.
1. Participant demographics
In total, 37 people recruited by LivableStreets participated in the workshops, of whom 33 completed both the pre-test and post-test surveys. On average, these participants reported attending 13 public planning meetings (e.g. hearings or workshops sponsored by a government agency) in the preceding year. Seven participants reported attending one or fewer meeting in the preceding year, and three participants reported attending at least 40. The surveys also asked partic-ipants how often they learned something relevant at meetings they attended in the preceding year (see Appendix A for the exact wording of these questions). We used these two items to construct an indicator of skepticism about learning at planning meetings: the percent of past meetings at which one did not learn something relevant. The average skepticism score was 20% (i.e. on average, participants reported learning something relevant at 80% of public planning meetings attended in the last year), but this varied widely. One participant reported attending 10 meetings in the past year and learning something relevant at none of them. The three participants who attended at least forty meetings had skepticism scores between 40 and 50%.
Two-thirds of participants reported using a bus in a typical week. The size of the groups within each workshop ranged from 3 to 6 participants. The results and analysis that follow draw on the survey data, recorded transcripts, and feedback from debrief discussions.
2. Participant interactions
Participants interacted with the touchscreen differently depending on whether they were using the accessibility or point-to-point version. Touching the screen, to drag one of the map pins or sliders or tap on one of the controls, was often in response to facilitator instructions. Pointing at the screen, on the other hand, was more likely to occur organically in discussions, without explicit facilitator prompts. Participants pointed at the map much more frequently when using the accessibility version, suggesting it was more closely integrated with participants’ dialogue than the point-to-point version. A detailed discussion of these results is included in Appendix A.
21
Scaling up Co-creative Planning of Transit Corridors using Accessibility-Based Stakeholder Engagement
Findings
We also recorded and classified participants’ interactions with each other. Facil-itators played a central role in prompting these interactions, speaking between 47% and 72% of the words in groups. Among the participants, there tended to be fairly balanced contributions, though a few groups did have participants who spoke much more frequently than their fellow group members. Point-to-point groups seemed more concerned with on-the-street feasibility and implementa-tion. The contrast between these two comments is illustrative:
“It’s a difficult thing to assume that we can achieve something like that in Boston, with all the goals and other constraints. I just imagine taking out an entire parking lane on both sides, or one side, and the uproar that would come from every single business owner along that street.”
- A point-to-point version user
“They’re putting in five thousand new units of housing just on the other side of the Charlestown Navy Yard… There’s little bus access for those people right now, and there needs to be a lot more to avert a 24/7/365 gridlock on those streets.”
- An accessibility version user
22
CoAXs 2.0
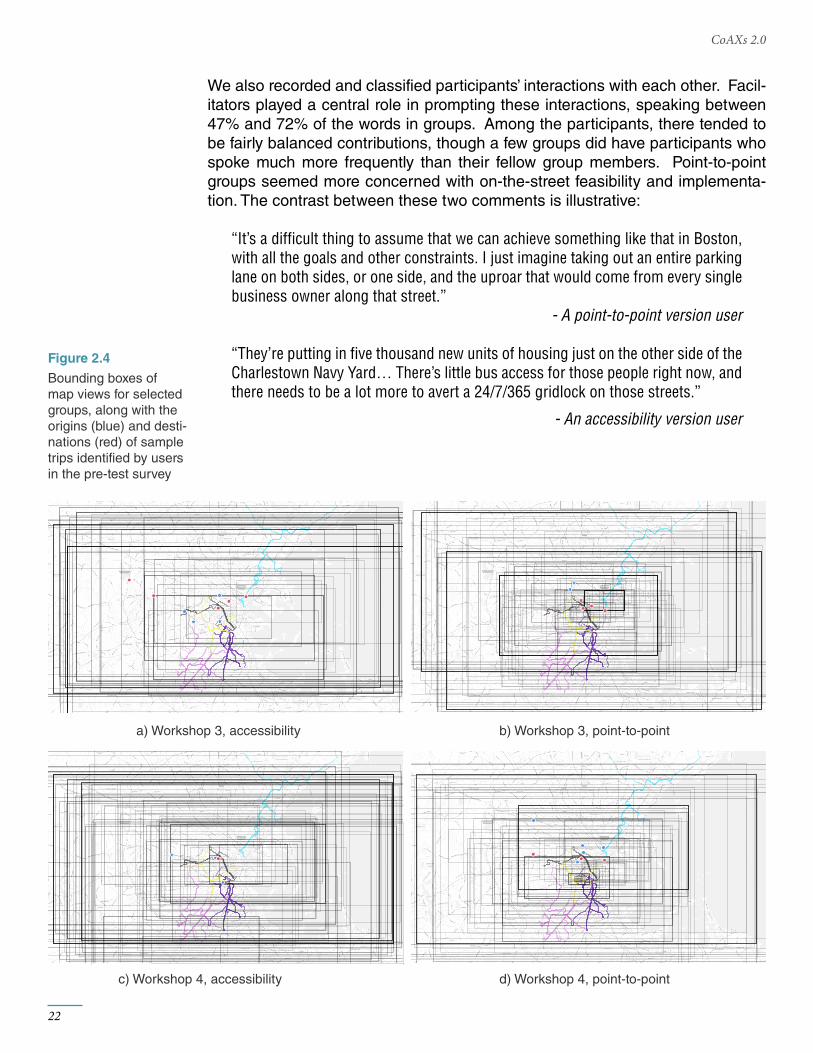
Bounding boxes of map views for selected groups, along with the origins (blue) and desti-nations (red) of sample trips identified by users in the pre-test survey
a) Workshop 3, accessibility
c) Workshop 4, accessibility
b) Workshop 3, point-to-point
d) Workshop 4, point-to-point
Figure 2.4
The broader framing of the accessibility version (e.g. showing one-to-all isochrones instead of one-to-one itineraries on the map, and focusing on ultimate destinations reachable rather than minutes saved), may help explain why groups using it seemed more likely to discuss wider factors, such as housing growth. A related observation is that point-to-point group participants tended to view the map at larger scales (i.e. more zoomed in), as shown in Figure 2.4.
In Figure 2.4(c), the cluster of map views in the south of the region is notable. The three participants in this group tested a number of origins around Dedham, even though it is distant from their normal commuting patterns (as denoted by the blue and red dots). The lively discussion that occurred when exploring these origins is illustrative of the potential of CoAXs for collaboratively building under-standing:
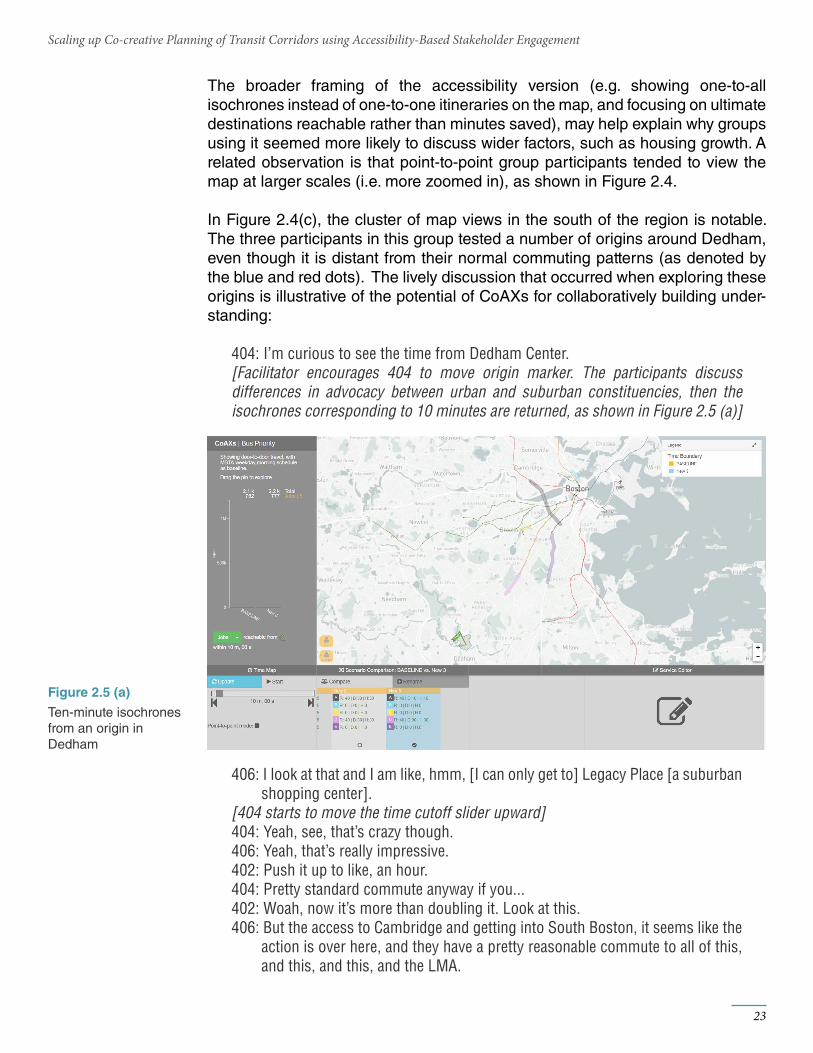
404: I’m curious to see the time from Dedham Center.[Facilitator encourages 404 to move origin marker. The participants discuss differences in advocacy between urban and suburban constituencies, then the isochrones corresponding to 10 minutes are returned, as shown in Figure 2.5 (a)]
406: I look at that and I am like, hmm, [I can only get to] Legacy Place [a suburban shopping center].
[404 starts to move the time cutoff slider upward]404: Yeah, see, that’s crazy though.406: Yeah, that’s really impressive.402: Push it up to like, an hour.404: Pretty standard commute anyway if you...402: Woah, now it’s more than doubling it. Look at this.406: But the access to Cambridge and getting into South Boston, it seems like the
action is over here, and they have a pretty reasonable commute to all of this, and this, and this, and the LMA.
23
Scaling up Co-creative Planning of Transit Corridors using Accessibility-Based Stakeholder Engagement
Ten-minute isochrones from an origin in Dedham
Figure 2.5 (a)
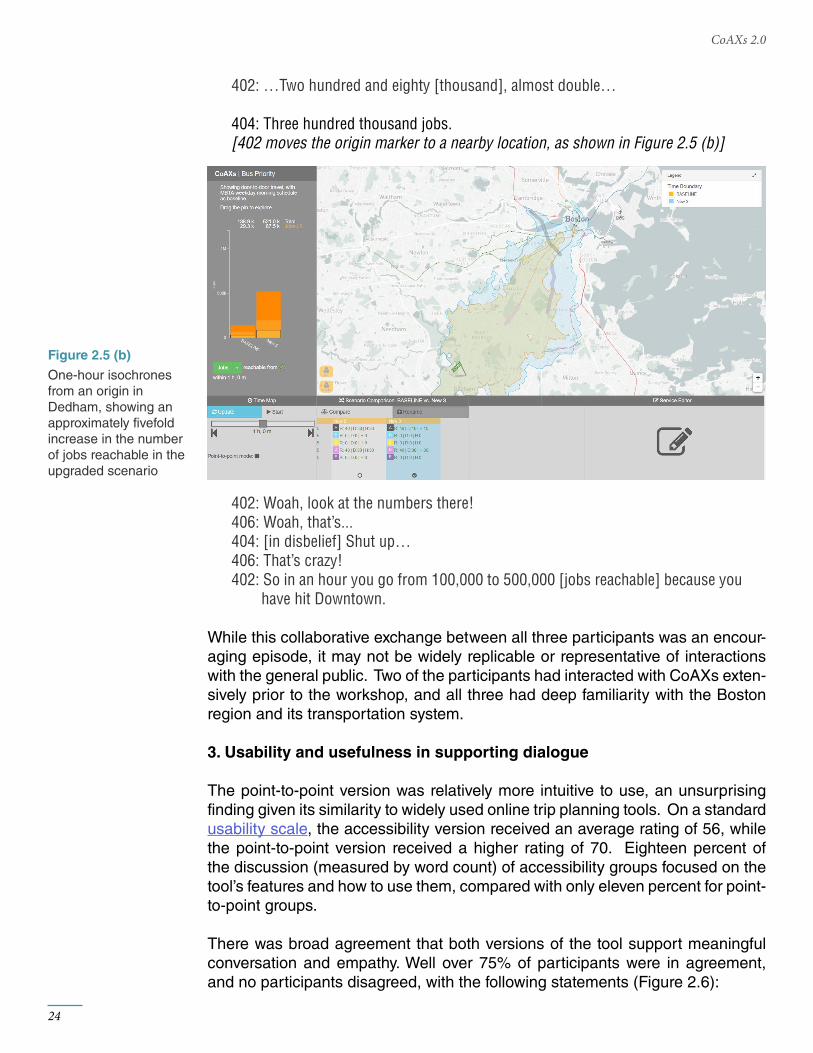
402: …Two hundred and eighty [thousand], almost double…
404: Three hundred thousand jobs.[402 moves the origin marker to a nearby location, as shown in Figure 2.5 (b)]
402: Woah, look at the numbers there!406: Woah, that’s...404: [in disbelief] Shut up…406: That’s crazy!402: So in an hour you go from 100,000 to 500,000 [jobs reachable] because you
have hit Downtown.
While this collaborative exchange between all three participants was an encour-aging episode, it may not be widely replicable or representative of interactions with the general public. Two of the participants had interacted with CoAXs exten-sively prior to the workshop, and all three had deep familiarity with the Boston region and its transportation system.
3. Usability and usefulness in supporting dialogue
The point-to-point version was relatively more intuitive to use, an unsurprising finding given its similarity to widely used online trip planning tools. On a standard usability scale, the accessibility version received an average rating of 56, while the point-to-point version received a higher rating of 70. Eighteen percent of the discussion (measured by word count) of accessibility groups focused on the tool’s features and how to use them, compared with only eleven percent for point-to-point groups.
There was broad agreement that both versions of the tool support meaningful conversation and empathy. Well over 75% of participants were in agreement, and no participants disagreed, with the following statements (Figure 2.6):
24
CoAXs 2.0
One-hour isochrones from an origin in Dedham, showing an approximately fivefold increase in the number of jobs reachable in the upgraded scenario
Figure 2.5 (b)
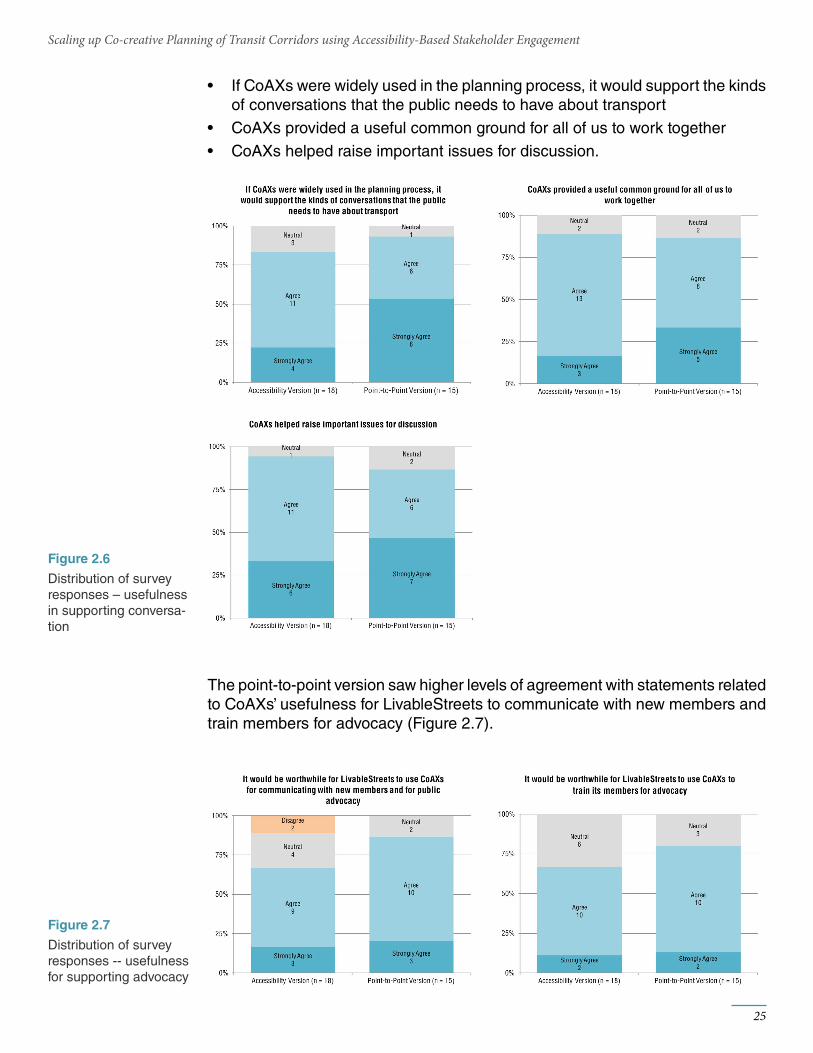
• If CoAXs were widely used in the planning process, it would support the kinds of conversations that the public needs to have about transport
• CoAXs provided a useful common ground for all of us to work together
• CoAXs helped raise important issues for discussion.
The point-to-point version saw higher levels of agreement with statements related to CoAXs’ usefulness for LivableStreets to communicate with new members and train members for advocacy (Figure 2.7).
25
Scaling up Co-creative Planning of Transit Corridors using Accessibility-Based Stakeholder Engagement
Distribution of survey responses – usefulness in supporting conversa-tion
Distribution of survey responses -- usefulness for supporting advocacy
Figure 2.6
Figure 2.7
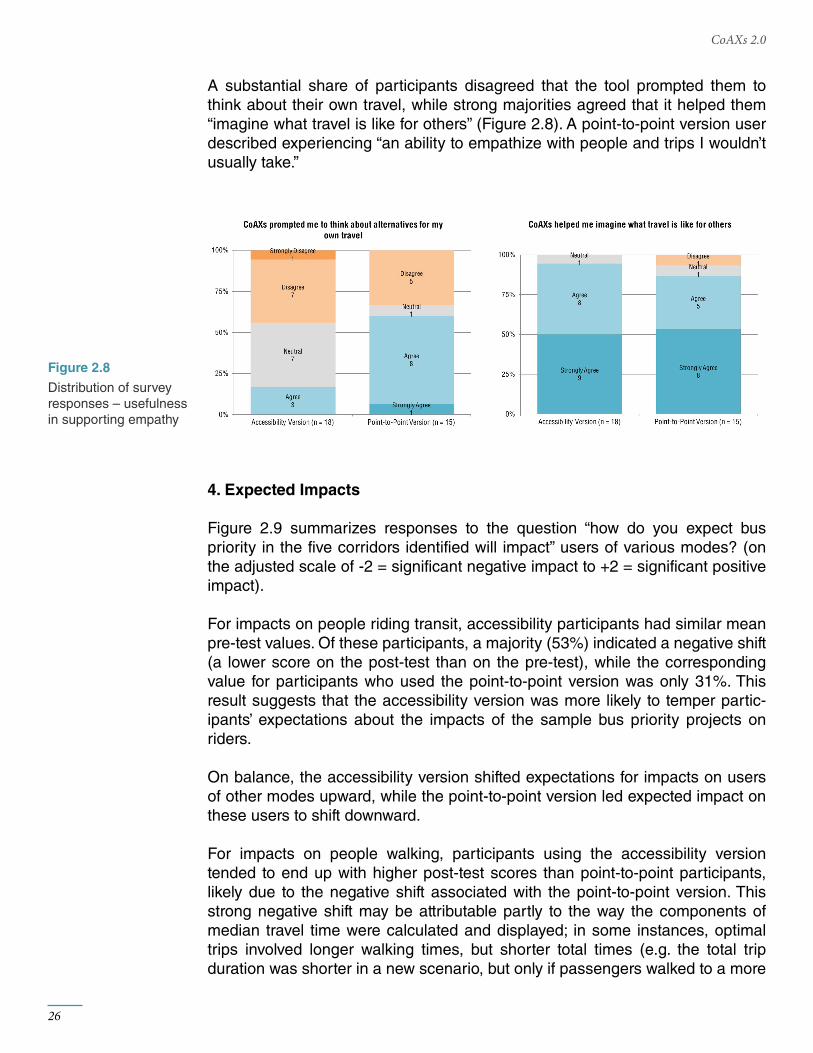
A substantial share of participants disagreed that the tool prompted them to think about their own travel, while strong majorities agreed that it helped them “imagine what travel is like for others” (Figure 2.8). A point-to-point version user described experiencing “an ability to empathize with people and trips I wouldn’t usually take.”
4. Expected Impacts
Figure 2.9 summarizes responses to the question “how do you expect bus priority in the five corridors identified will impact” users of various modes? (on the adjusted scale of -2 = significant negative impact to +2 = significant positive impact).
For impacts on people riding transit, accessibility participants had similar mean pre-test values. Of these participants, a majority (53%) indicated a negative shift (a lower score on the post-test than on the pre-test), while the corresponding value for participants who used the point-to-point version was only 31%. This result suggests that the accessibility version was more likely to temper partic-ipants’ expectations about the impacts of the sample bus priority projects on riders.
On balance, the accessibility version shifted expectations for impacts on users of other modes upward, while the point-to-point version led expected impact on these users to shift downward.
For impacts on people walking, participants using the accessibility version tended to end up with higher post-test scores than point-to-point participants, likely due to the negative shift associated with the point-to-point version. This strong negative shift may be attributable partly to the way the components of median travel time were calculated and displayed; in some instances, optimal trips involved longer walking times, but shorter total times (e.g. the total trip duration was shorter in a new scenario, but only if passengers walked to a more
26
CoAXs 2.0
Distribution of survey responses – usefulness in supporting empathy
Figure 2.8
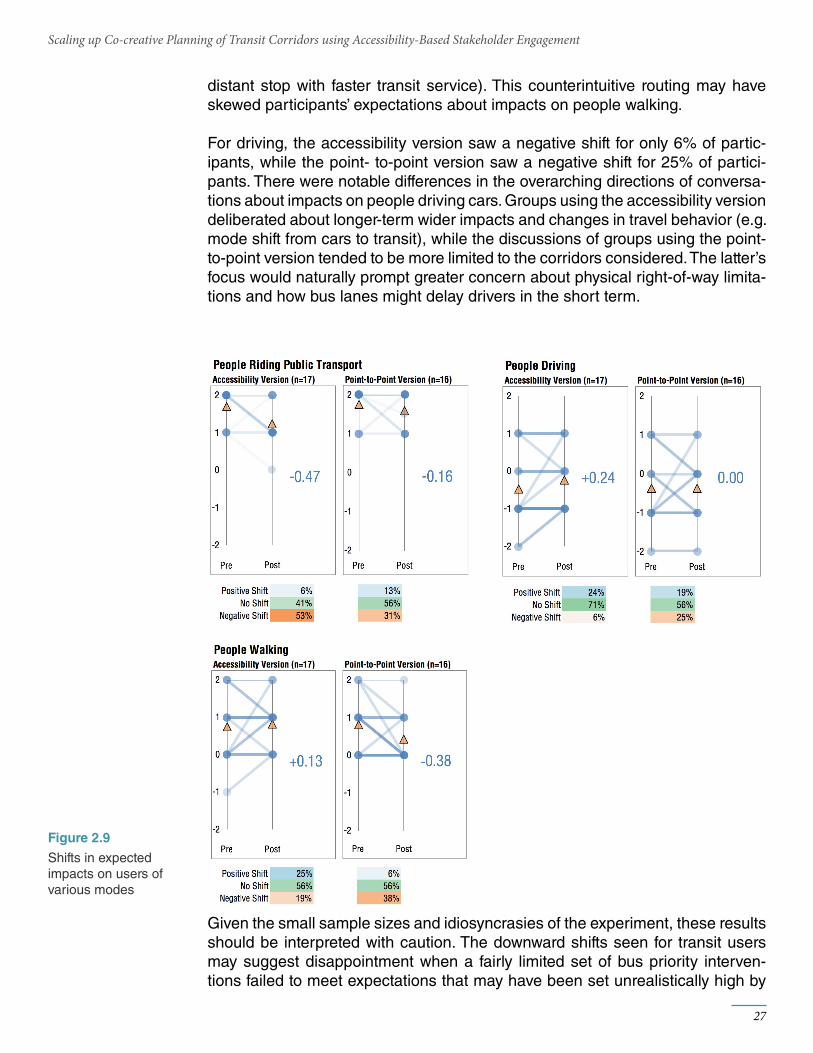
distant stop with faster transit service). This counterintuitive routing may have skewed participants’ expectations about impacts on people walking.
For driving, the accessibility version saw a negative shift for only 6% of partic-ipants, while the point- to-point version saw a negative shift for 25% of partici-pants. There were notable differences in the overarching directions of conversa-tions about impacts on people driving cars. Groups using the accessibility version deliberated about longer-term wider impacts and changes in travel behavior (e.g. mode shift from cars to transit), while the discussions of groups using the point-to-point version tended to be more limited to the corridors considered. The latter’s focus would naturally prompt greater concern about physical right-of-way limita-tions and how bus lanes might delay drivers in the short term.
Given the small sample sizes and idiosyncrasies of the experiment, these results should be interpreted with caution. The downward shifts seen for transit users may suggest disappointment when a fairly limited set of bus priority interven-tions failed to meet expectations that may have been set unrealistically high by
27
Scaling up Co-creative Planning of Transit Corridors using Accessibility-Based Stakeholder Engagement
Shifts in expected impacts on users of various modes
Figure 2.9
the brief introductory presentation. They may also reflect mean reversion issues -- participants who indicated a maximum response in the first survey could decrease, but not increase their response on the second survey - that could be mitigated by improved survey design. Alternatively, the isochrones shown in the accessibility version may have been too diffuse a representation to convince participants that bus priority would have a significant positive impact. It is beyond the scope of this analysis to predict the “true” impact of the sample projects on pedestrians or drivers, or how closely participant expectations aligned with predictions based on validated models. But to the extent that a positive shift in impact on drivers is away from a simplistic or short-term view that transit priority projects will automatically have a net negative impact on drivers, the accessibility version may do a better job of broadening impacts considered.
5. Enthusiasm
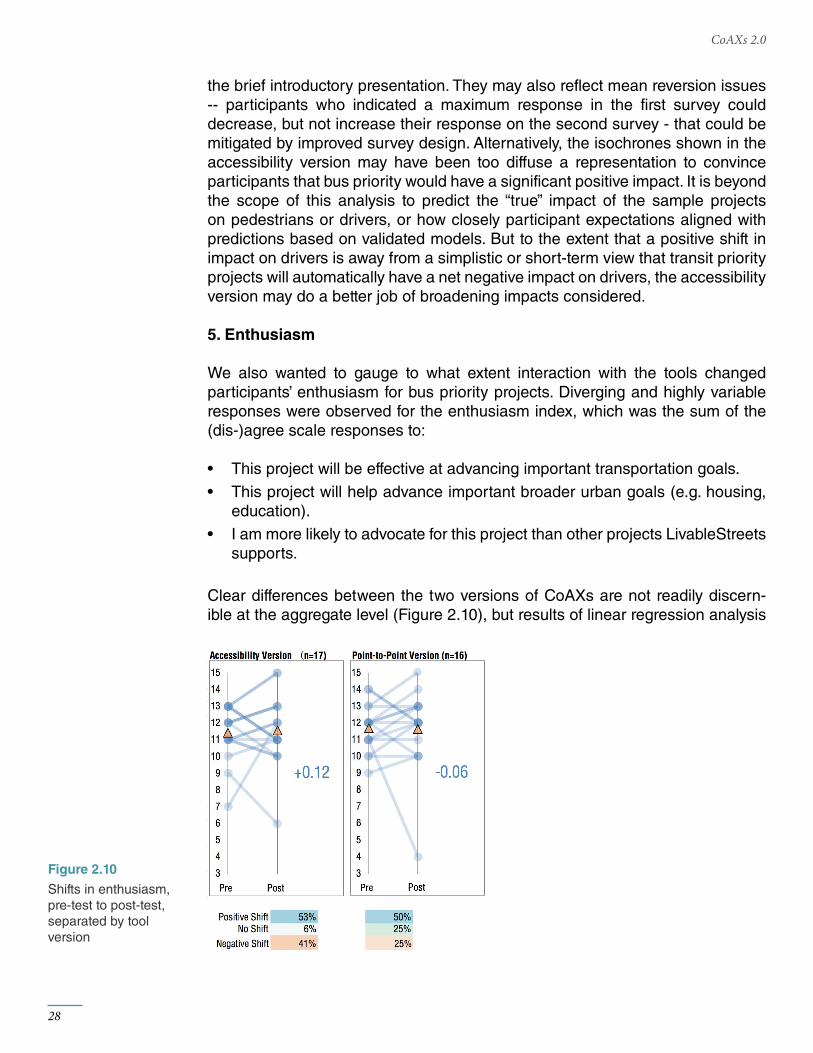
We also wanted to gauge to what extent interaction with the tools changed participants’ enthusiasm for bus priority projects. Diverging and highly variable responses were observed for the enthusiasm index, which was the sum of the (dis-)agree scale responses to:
• This project will be effective at advancing important transportation goals.
• This project will help advance important broader urban goals (e.g. housing, education).
• I am more likely to advocate for this project than other projects LivableStreets supports.
Clear differences between the two versions of CoAXs are not readily discern-ible at the aggregate level (Figure 2.10), but results of linear regression analysis
28
CoAXs 2.0
Shifts in enthusiasm, pre-test to post-test, separated by tool version
Figure 2.10
suggest that the accessibility version of the tool fosters enthusiasm differ-ently than the point-to-point version does. Even participants who were initially enthusiastic about bus priority were likely to be dissuaded by the point-to-point version if they used cars or tended to be skeptical about participating in planning meetings. In contrast, for the accessibility version, the effects of a predisposition toward skepticism and car usage are reduced. Dialogue quality, as measured by a five-item index developed to measure tools for collaborative planning (the five questions at the bottom of page 2 of Survey 2 in Appendix A), is a much more important factor for predicting enthusiasm when using the accessibility version than when using the point-to-point version. This finding aligns with observations during the workshops. When using the point-to-point version, individuals testing their own trips of interest tended to stand in front of the screen, blocking it and testing different destinations with limited interaction with the other participants. In contrast, an individual using the accessibility version tended to move the origin marker to an origin of interest, then step back and discuss the resulting isochrones with the other participants; they would be more inclined to enter a conversation referencing a representation of travel times that spans much of the region, rather than only a single trip with which they might not be familiar.
6. Other Feedback
Responses to open-ended questions in the survey provided us additional insight into participants’ responses and the potential usefulness of CoAXs. Our debrief discussion in September included a preliminary presentation of the usability, usefulness, expected impacts, and enthusiasm results discussed above. We then broke into small groups to discuss the following questions:
• Do the preliminary results align with your experience? - If not, why not? - What did you take away that isn’t represented there yet?• Do you think high expectations about bus priority would have been met with… - More extensive corridors or new routes? - Additional tool features? - Modeling reliability gains?• How can we make CoAXs more useful to advocates?• How might LivableStreets use a tool like CoAXs in their efforts?
Lessons learned from these questions are synthesized in Section 4.
29
Scaling up Co-creative Planning of Transit Corridors using Accessibility-Based Stakeholder Engagement

New Contexts in Spring 2017
3
Advance AtlantaRide New Orleans
Walk San FranciscoFindings
Overall results on usefulness and usabilityCity-specific responses regarding understanding of transit system
Shifts in survey responses from pre- to post- uses of CoAXsUser Interactions
3334363737394244
In the spring, we partnered with three new organizations to see if and how CoAXs could aid their advocacy efforts. In addition to continuing to test the differences between displaying benefits as travel times savings vs. accessibility, the spring deployments provided a chance to see how CoAXs would fare in new contexts and through “remote” implementations instead of in-person workshops. Both the fall workshops with LivableStreets and the previous version of CoAXs in 2015 had focused on bus priority projects through in-person workshops in the Boston area. The spring deployments featured a range of cities and projects with both online and in-person engagements that brought to light a number of new issues on both the technical and conceptual sides. To aid in the online component, we revamped CoAXs to be simpler and created instructional videos to guide users through CoAXs without the need for an in-person facilitator. The public-facing changes were matched by a behind-the-scenes update as we took the oppor-tunity of the new deployments to rewrite CoAXs using React.js, a more up-to-date JavaScript framework than our previous Angular.js one. Finally, the spring deployments served as a chance to review and document the full steps involved in launching a custom version of CoAXs.
With the help of TransitCenter, we reached out to a number of government agencies and advocacy groups with a brief description of CoAXs and a link to the online Boston version of the tool. We received responses from four advocacy groups and two government agencies. Because one of the original goals was to assess the usefulness of interactive mapping tools for advocacy groups, and given resource constraints, we chose to partner with three of the advocacy organi-zations: Advance Atlanta, Ride New Orleans, and Walk San Francisco (SF).
Over the following months we worked with the three organizations to discuss their projects and campaigns and explore what role CoAXs could play. Based on the conversations with our partners, we produced three versions of CoAXs, one for each city, that featured custom capabilities with the aim of helping their members understand and promote projects they cared about. A brief description of each partner and engagement appears below.
32
CoAXs 2.0
Remote Engagement
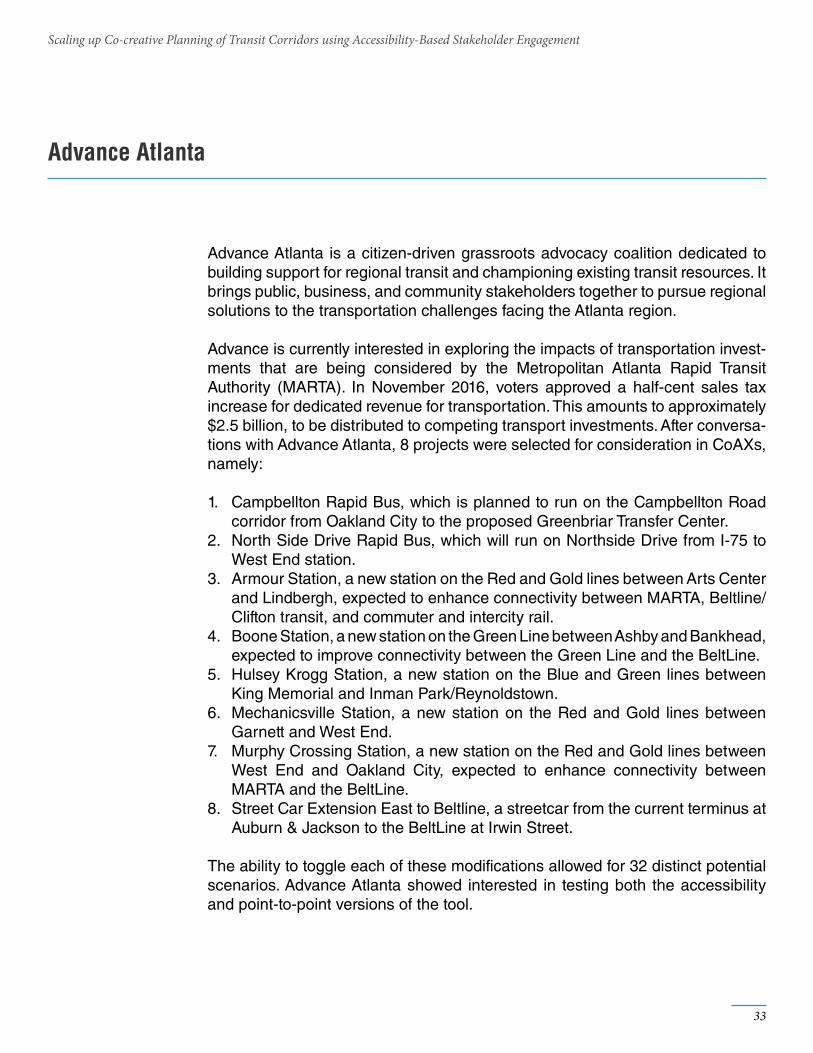
Advance Atlanta is a citizen-driven grassroots advocacy coalition dedicated to building support for regional transit and championing existing transit resources. It brings public, business, and community stakeholders together to pursue regional solutions to the transportation challenges facing the Atlanta region.
Advance is currently interested in exploring the impacts of transportation invest-ments that are being considered by the Metropolitan Atlanta Rapid Transit Authority (MARTA). In November 2016, voters approved a half-cent sales tax increase for dedicated revenue for transportation. This amounts to approximately $2.5 billion, to be distributed to competing transport investments. After conversa-tions with Advance Atlanta, 8 projects were selected for consideration in CoAXs, namely:
1. Campbellton Rapid Bus, which is planned to run on the Campbellton Road corridor from Oakland City to the proposed Greenbriar Transfer Center.
2. North Side Drive Rapid Bus, which will run on Northside Drive from I-75 to West End station.
3. Armour Station, a new station on the Red and Gold lines between Arts Center and Lindbergh, expected to enhance connectivity between MARTA, Beltline/Clifton transit, and commuter and intercity rail.
4. Boone Station, a new station on the Green Line between Ashby and Bankhead, expected to improve connectivity between the Green Line and the BeltLine.
5. Hulsey Krogg Station, a new station on the Blue and Green lines between King Memorial and Inman Park/Reynoldstown.
6. Mechanicsville Station, a new station on the Red and Gold lines between Garnett and West End.
7. Murphy Crossing Station, a new station on the Red and Gold lines between West End and Oakland City, expected to enhance connectivity between MARTA and the BeltLine.
8. Street Car Extension East to Beltline, a streetcar from the current terminus at Auburn & Jackson to the BeltLine at Irwin Street.
The ability to toggle each of these modifications allowed for 32 distinct potential scenarios. Advance Atlanta showed interested in testing both the accessibility and point-to-point versions of the tool.
33
Scaling up Co-creative Planning of Transit Corridors using Accessibility-Based Stakeholder Engagement
Advance Atlanta
Ride New Orleans is the primary public transit advocacy organization in New Orleans, working towards a “world class, multi-modal transportation system that promotes a vibrant, healthy and sustainable New Orleans region.” Ride was drawn to the CoAXs tool in part due to their focus on equity and their previous use of accessibility-to-jobs framing. They were interested in being able to explore transit projects of interest through that optic.
Public transit in New Orleans is provided by multiple transit agencies serving different parishes (counties), and in some cases service stops at parish lines, hampering access for riders. Ride New Orleans has been interested in extending certain bus lines to better connect Jefferson and Orleans parishes, and partic-
34
CoAXs 2.0
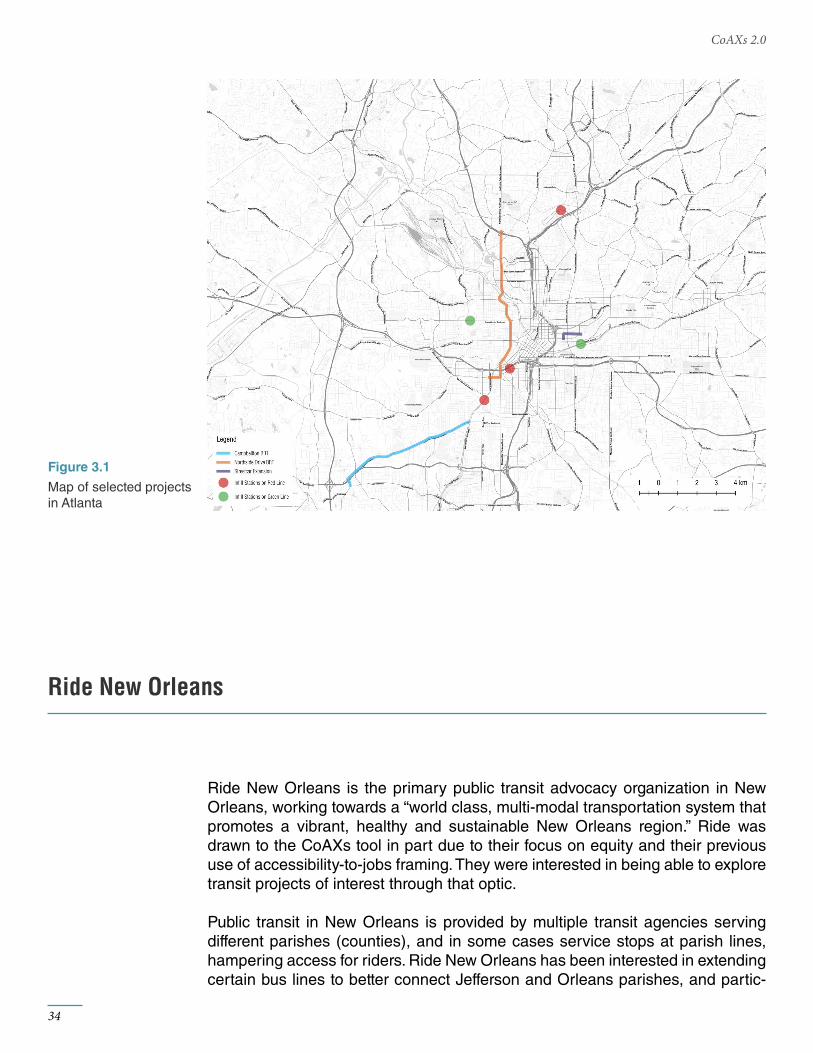
Map of selected projects in Atlanta
Figure 3.1
Ride New Orleans
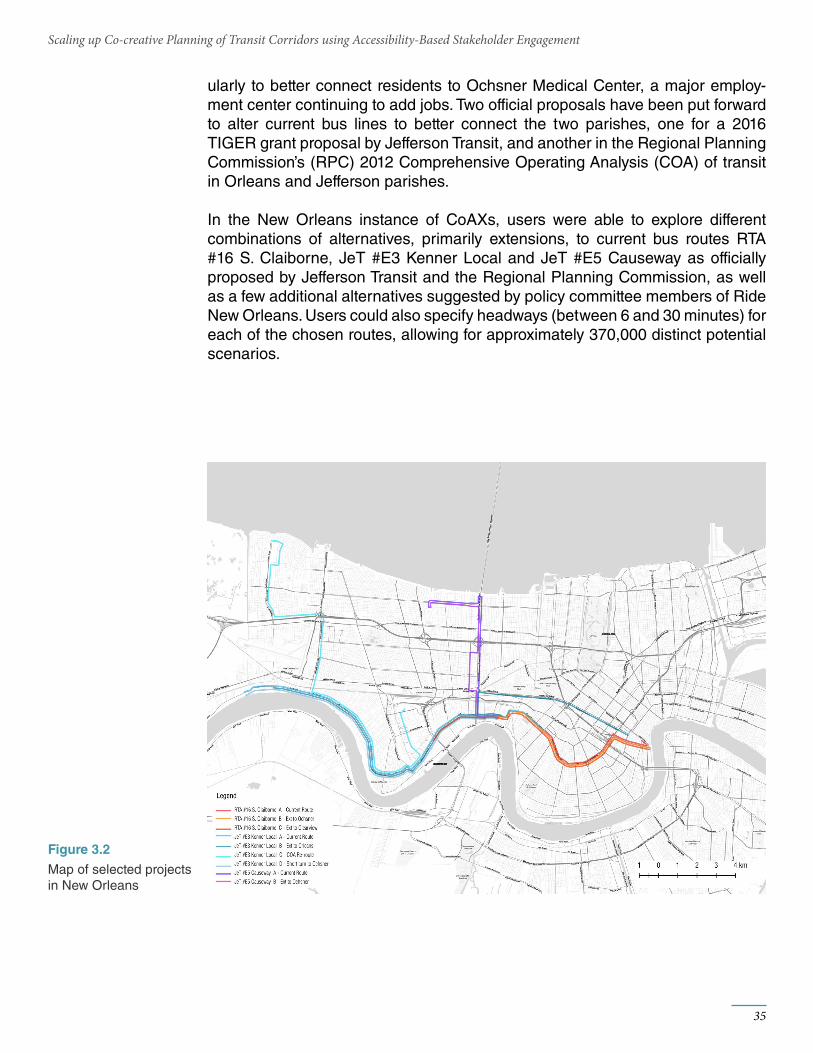
ularly to better connect residents to Ochsner Medical Center, a major employ-ment center continuing to add jobs. Two official proposals have been put forward to alter current bus lines to better connect the two parishes, one for a 2016 TIGER grant proposal by Jefferson Transit, and another in the Regional Planning Commission’s (RPC) 2012 Comprehensive Operating Analysis (COA) of transit in Orleans and Jefferson parishes.
In the New Orleans instance of CoAXs, users were able to explore different combinations of alternatives, primarily extensions, to current bus routes RTA #16 S. Claiborne, JeT #E3 Kenner Local and JeT #E5 Causeway as officially proposed by Jefferson Transit and the Regional Planning Commission, as well as a few additional alternatives suggested by policy committee members of Ride New Orleans. Users could also specify headways (between 6 and 30 minutes) for each of the chosen routes, allowing for approximately 370,000 distinct potential scenarios.
35
Scaling up Co-creative Planning of Transit Corridors using Accessibility-Based Stakeholder Engagement
Map of selected projects in New Orleans
Figure 3.2
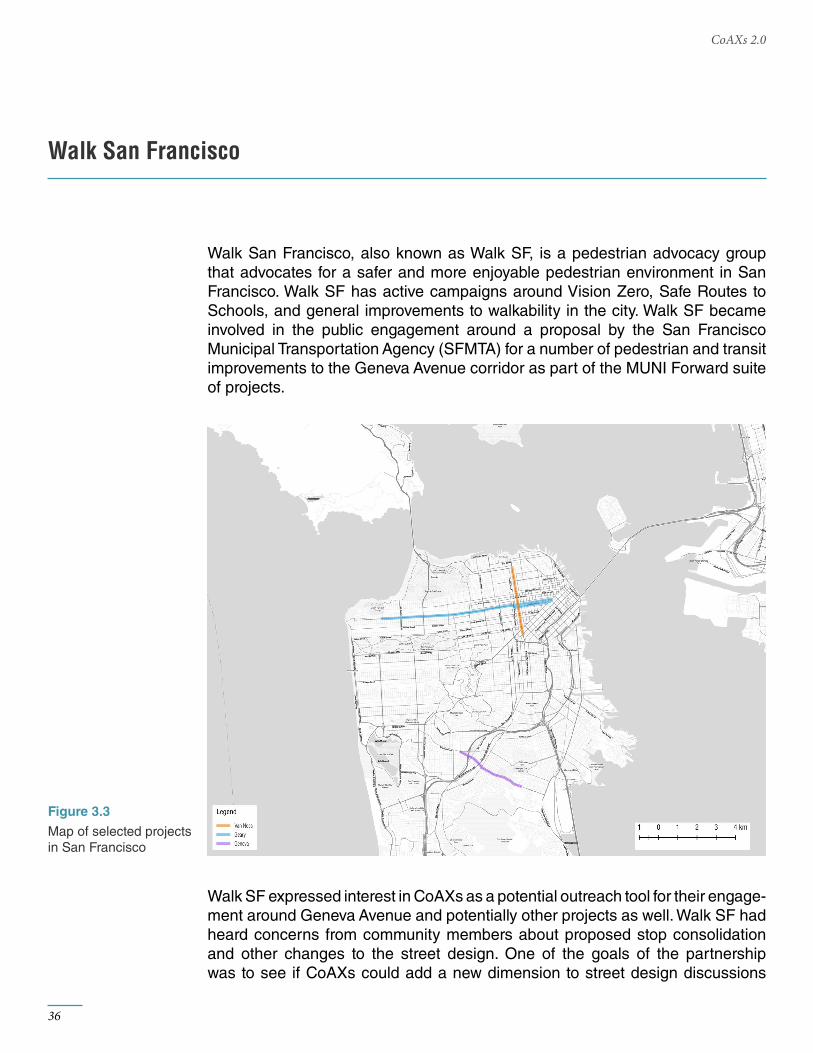
Walk San Francisco, also known as Walk SF, is a pedestrian advocacy group that advocates for a safer and more enjoyable pedestrian environment in San Francisco. Walk SF has active campaigns around Vision Zero, Safe Routes to Schools, and general improvements to walkability in the city. Walk SF became involved in the public engagement around a proposal by the San Francisco Municipal Transportation Agency (SFMTA) for a number of pedestrian and transit improvements to the Geneva Avenue corridor as part of the MUNI Forward suite of projects.
Walk SF expressed interest in CoAXs as a potential outreach tool for their engage-ment around Geneva Avenue and potentially other projects as well. Walk SF had heard concerns from community members about proposed stop consolidation and other changes to the street design. One of the goals of the partnership was to see if CoAXs could add a new dimension to street design discussions
36
CoAXs 2.0
Walk San Francisco
Map of selected projects in San Francisco
Figure 3.3
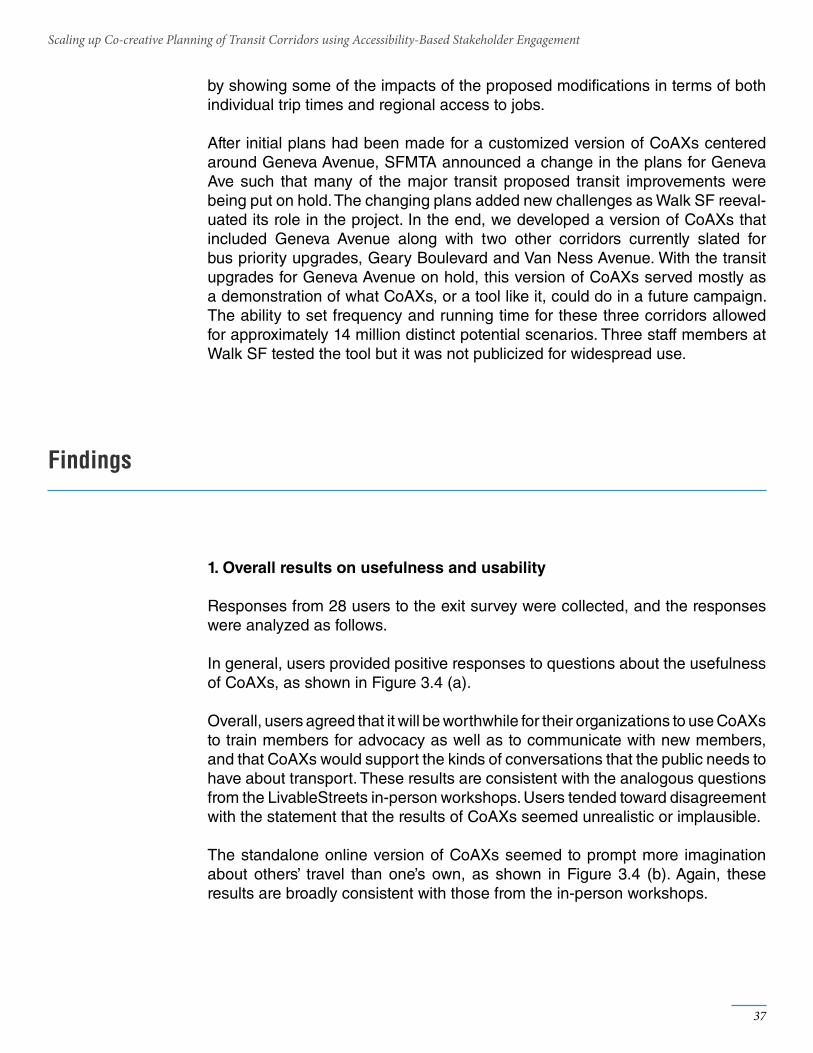
1. Overall results on usefulness and usability
Responses from 28 users to the exit survey were collected, and the responses were analyzed as follows.
In general, users provided positive responses to questions about the usefulness of CoAXs, as shown in Figure 3.4 (a).
Overall, users agreed that it will be worthwhile for their organizations to use CoAXs to train members for advocacy as well as to communicate with new members, and that CoAXs would support the kinds of conversations that the public needs to have about transport. These results are consistent with the analogous questions from the LivableStreets in-person workshops. Users tended toward disagreement with the statement that the results of CoAXs seemed unrealistic or implausible.
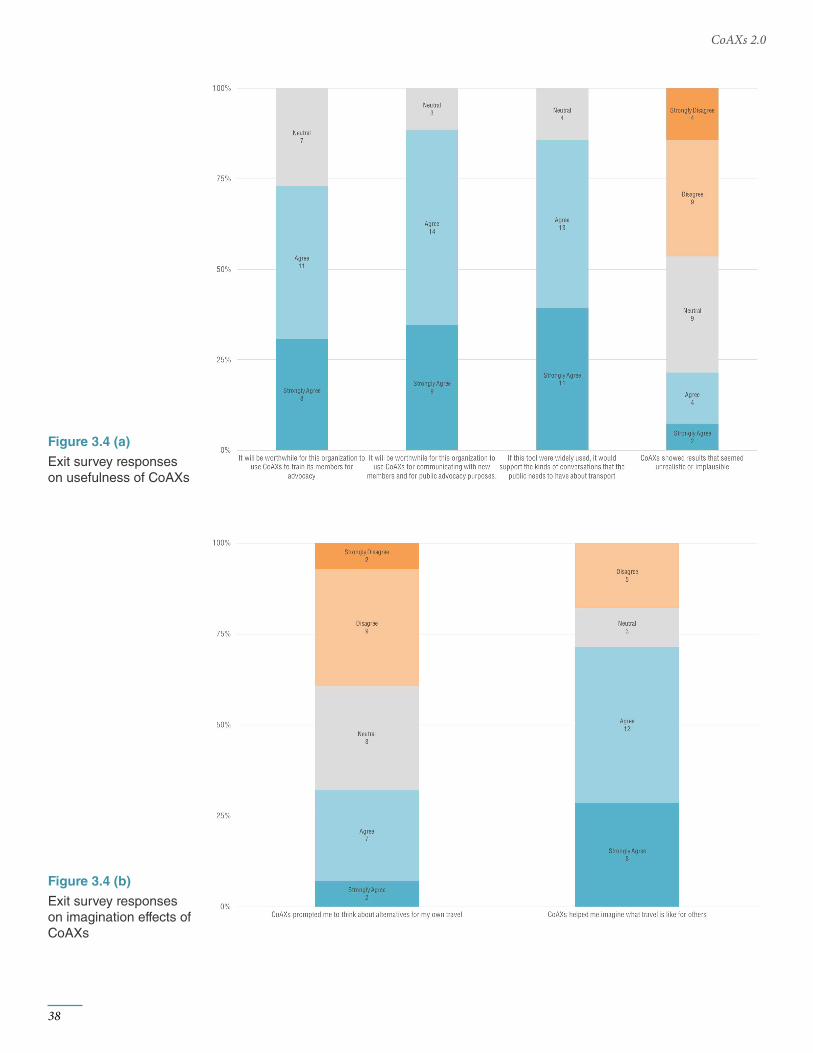
The standalone online version of CoAXs seemed to prompt more imagination about others’ travel than one’s own, as shown in Figure 3.4 (b). Again, these results are broadly consistent with those from the in-person workshops.
by showing some of the impacts of the proposed modifications in terms of both individual trip times and regional access to jobs.
After initial plans had been made for a customized version of CoAXs centered around Geneva Avenue, SFMTA announced a change in the plans for Geneva Ave such that many of the major transit proposed transit improvements were being put on hold. The changing plans added new challenges as Walk SF reeval-uated its role in the project. In the end, we developed a version of CoAXs that included Geneva Avenue along with two other corridors currently slated for bus priority upgrades, Geary Boulevard and Van Ness Avenue. With the transit upgrades for Geneva Avenue on hold, this version of CoAXs served mostly as a demonstration of what CoAXs, or a tool like it, could do in a future campaign. The ability to set frequency and running time for these three corridors allowed for approximately 14 million distinct potential scenarios. Three staff members at Walk SF tested the tool but it was not publicized for widespread use.
37
Scaling up Co-creative Planning of Transit Corridors using Accessibility-Based Stakeholder Engagement
Findings
38
CoAXs 2.0
Exit survey responses on usefulness of CoAXs
Exit survey responses on imagination effects of CoAXs
Figure 3.4 (a)
Figure 3.4 (b)
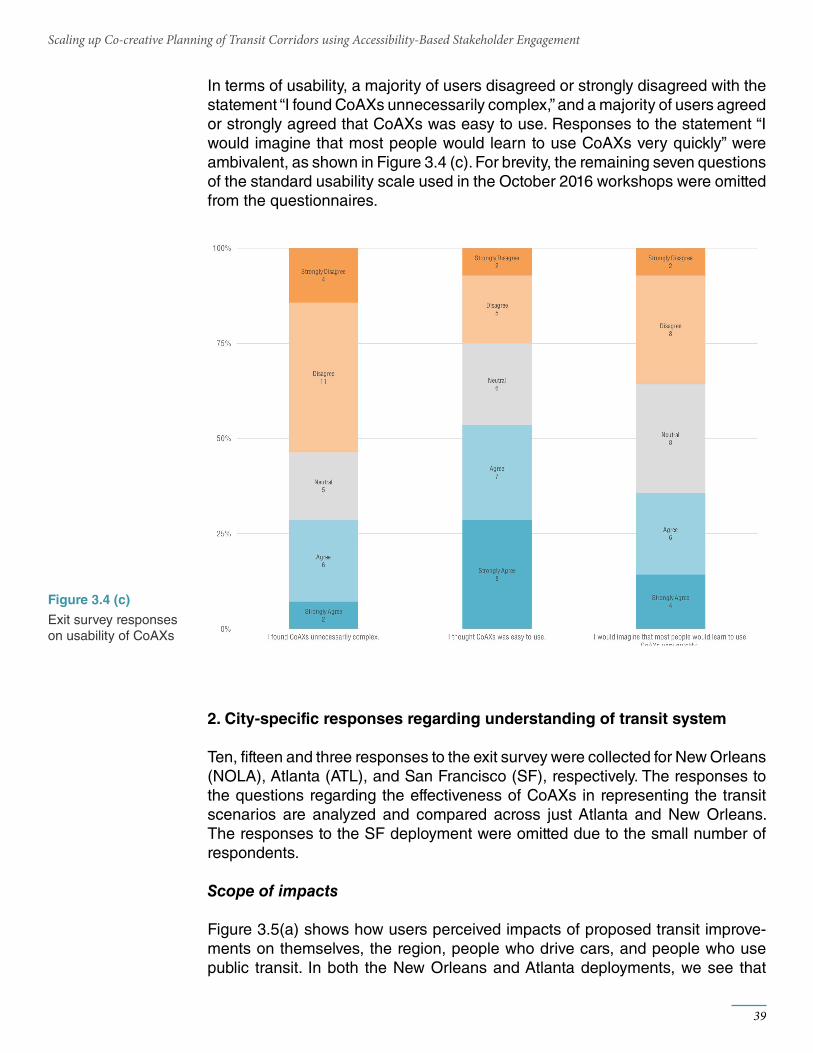
In terms of usability, a majority of users disagreed or strongly disagreed with the statement “I found CoAXs unnecessarily complex,” and a majority of users agreed or strongly agreed that CoAXs was easy to use. Responses to the statement “I would imagine that most people would learn to use CoAXs very quickly” were ambivalent, as shown in Figure 3.4 (c). For brevity, the remaining seven questions of the standard usability scale used in the October 2016 workshops were omitted from the questionnaires.
2. City-specific responses regarding understanding of transit system
Ten, fifteen and three responses to the exit survey were collected for New Orleans (NOLA), Atlanta (ATL), and San Francisco (SF), respectively. The responses to the questions regarding the effectiveness of CoAXs in representing the transit scenarios are analyzed and compared across just Atlanta and New Orleans. The responses to the SF deployment were omitted due to the small number of respondents.
Scope of impacts
Figure 3.5(a) shows how users perceived impacts of proposed transit improve-ments on themselves, the region, people who drive cars, and people who use public transit. In both the New Orleans and Atlanta deployments, we see that
39
Scaling up Co-creative Planning of Transit Corridors using Accessibility-Based Stakeholder Engagement
Exit survey responses on usability of CoAXs
Figure 3.4 (c)
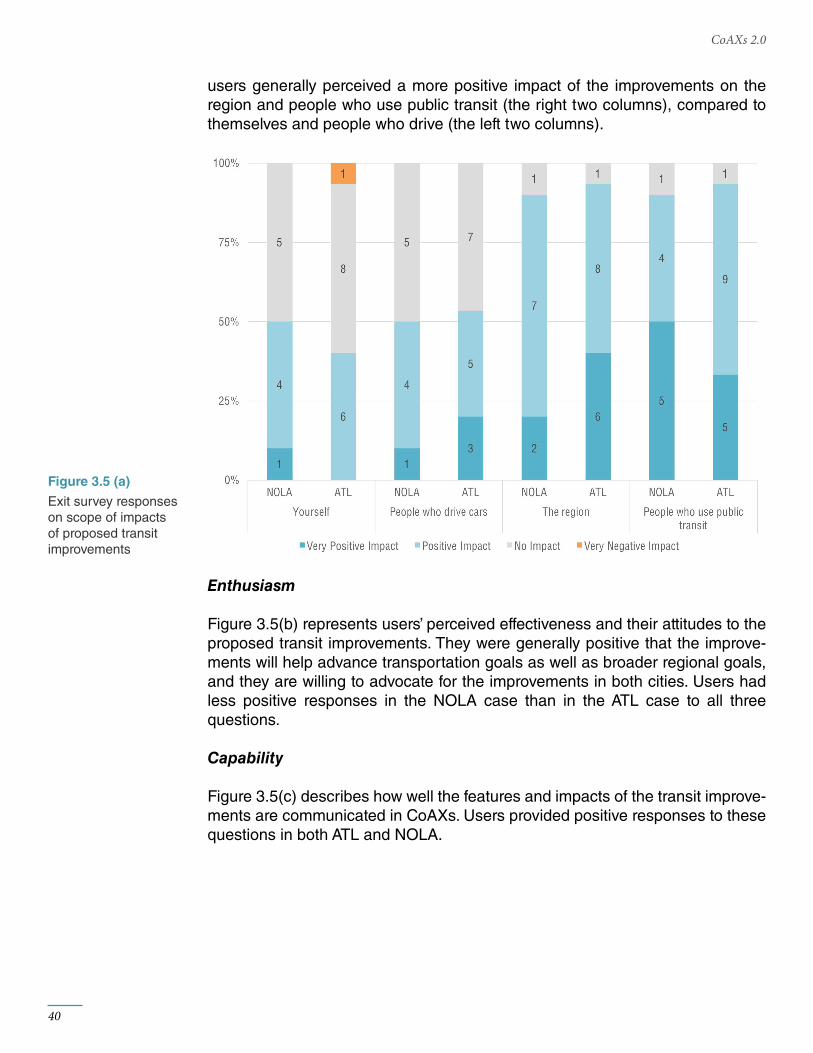
users generally perceived a more positive impact of the improvements on the region and people who use public transit (the right two columns), compared to themselves and people who drive (the left two columns).
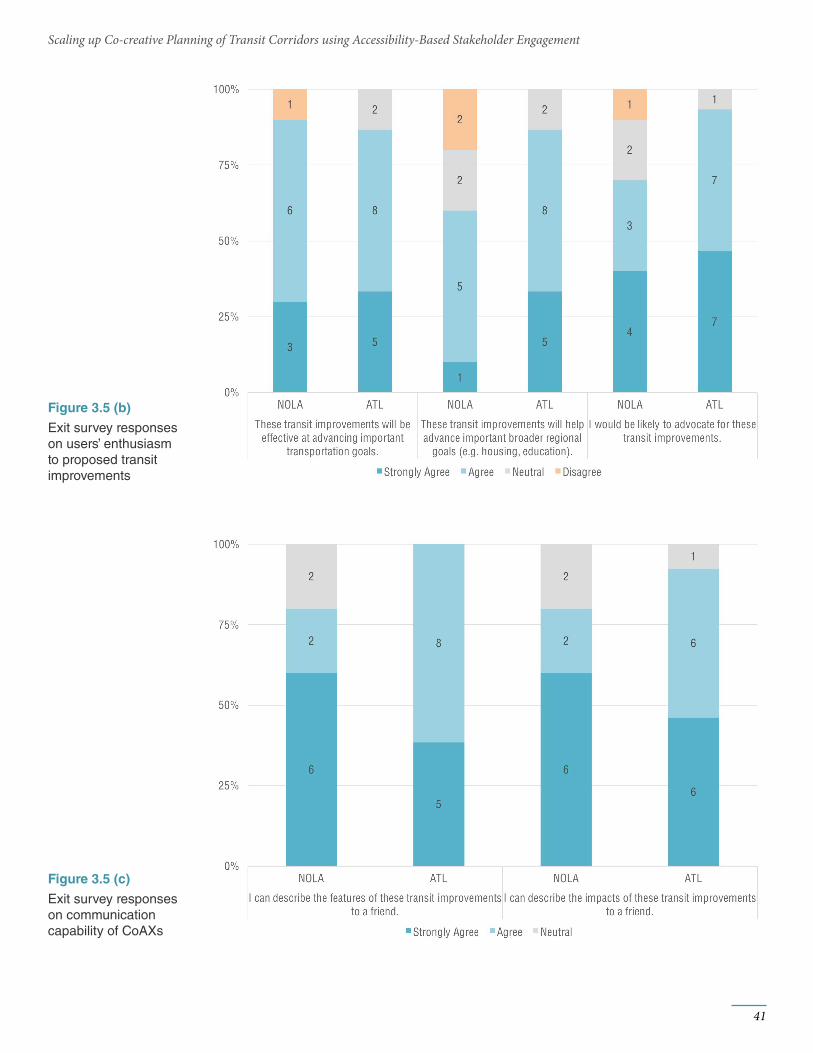
Enthusiasm
Figure 3.5(b) represents users’ perceived effectiveness and their attitudes to the proposed transit improvements. They were generally positive that the improve-ments will help advance transportation goals as well as broader regional goals, and they are willing to advocate for the improvements in both cities. Users had less positive responses in the NOLA case than in the ATL case to all three questions.
Capability
Figure 3.5(c) describes how well the features and impacts of the transit improve-ments are communicated in CoAXs. Users provided positive responses to these questions in both ATL and NOLA.
40
CoAXs 2.0
Exit survey responses on scope of impacts of proposed transit improvements
Figure 3.5 (a)
41
Scaling up Co-creative Planning of Transit Corridors using Accessibility-Based Stakeholder Engagement
Exit survey responses on users’ enthusiasm to proposed transit improvements
Exit survey responses on communication capability of CoAXs
Figure 3.5 (b)
Figure 3.5 (c)
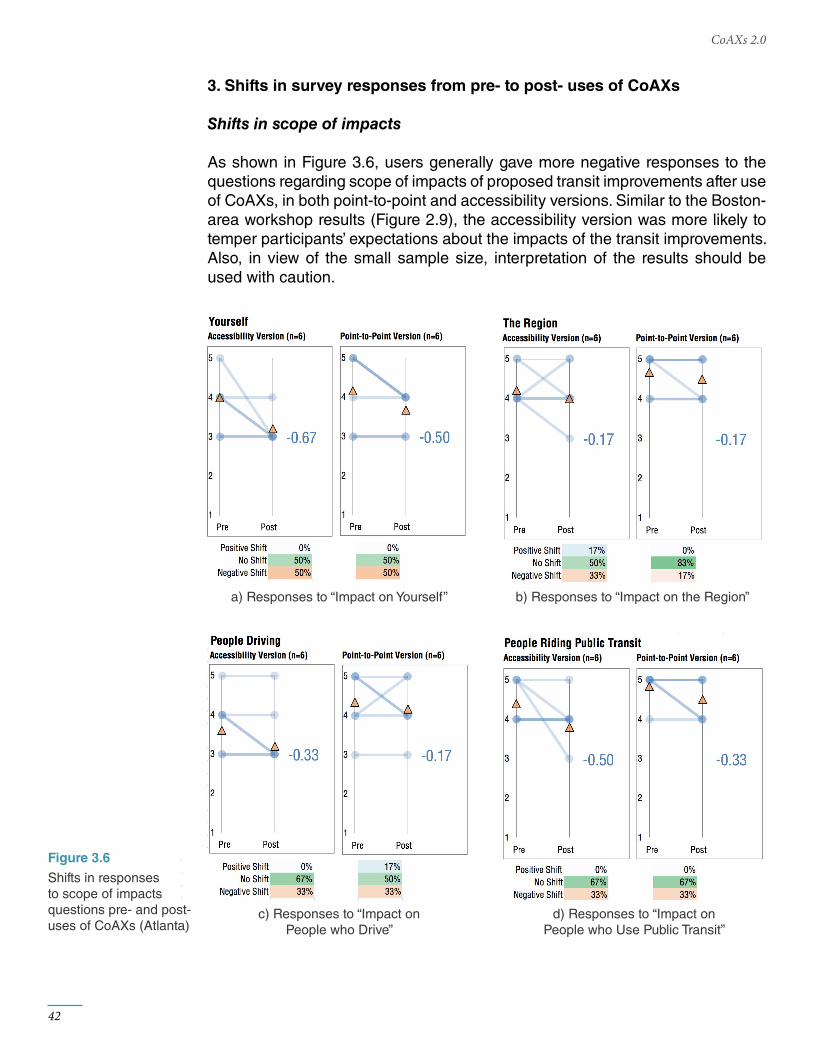
3. Shifts in survey responses from pre- to post- uses of CoAXs
Shifts in scope of impacts
As shown in Figure 3.6, users generally gave more negative responses to the questions regarding scope of impacts of proposed transit improvements after use of CoAXs, in both point-to-point and accessibility versions. Similar to the Boston-area workshop results (Figure 2.9), the accessibility version was more likely to temper participants’ expectations about the impacts of the transit improvements. Also, in view of the small sample size, interpretation of the results should be used with caution.
42
CoAXs 2.0
Shifts in responses to scope of impacts questions pre- and post- uses of CoAXs (Atlanta)
Figure 3.6
a) Responses to “Impact on Yourself”
c) Responses to “Impact on People who Drive”
d) Responses to “Impact on People who Use Public Transit”
b) Responses to “Impact on the Region”
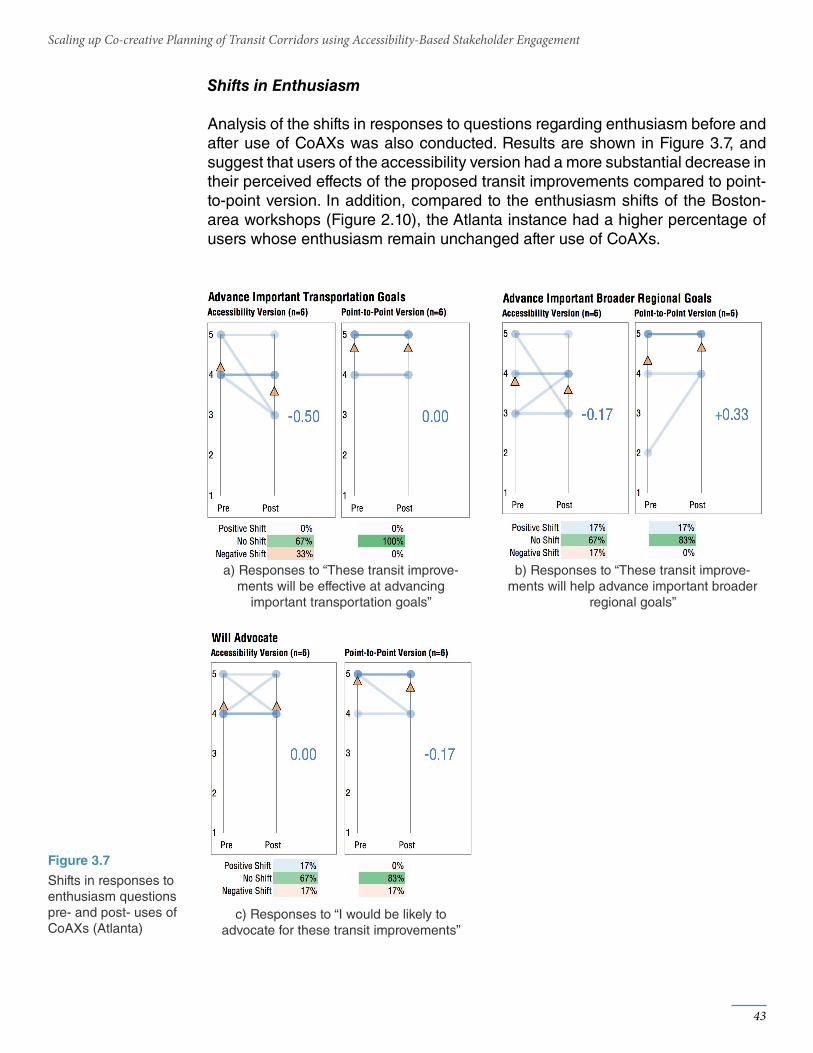
Shifts in Enthusiasm
Analysis of the shifts in responses to questions regarding enthusiasm before and after use of CoAXs was also conducted. Results are shown in Figure 3.7, and suggest that users of the accessibility version had a more substantial decrease in their perceived effects of the proposed transit improvements compared to point-to-point version. In addition, compared to the enthusiasm shifts of the Boston-area workshops (Figure 2.10), the Atlanta instance had a higher percentage of users whose enthusiasm remain unchanged after use of CoAXs.
43
Scaling up Co-creative Planning of Transit Corridors using Accessibility-Based Stakeholder Engagement
a) Responses to “These transit improve-ments will be effective at advancing
important transportation goals”
c) Responses to “I would be likely to advocate for these transit improvements”
b) Responses to “These transit improve-ments will help advance important broader
regional goals”
Shifts in responses to enthusiasm questions pre- and post- uses of CoAXs (Atlanta)
Figure 3.7
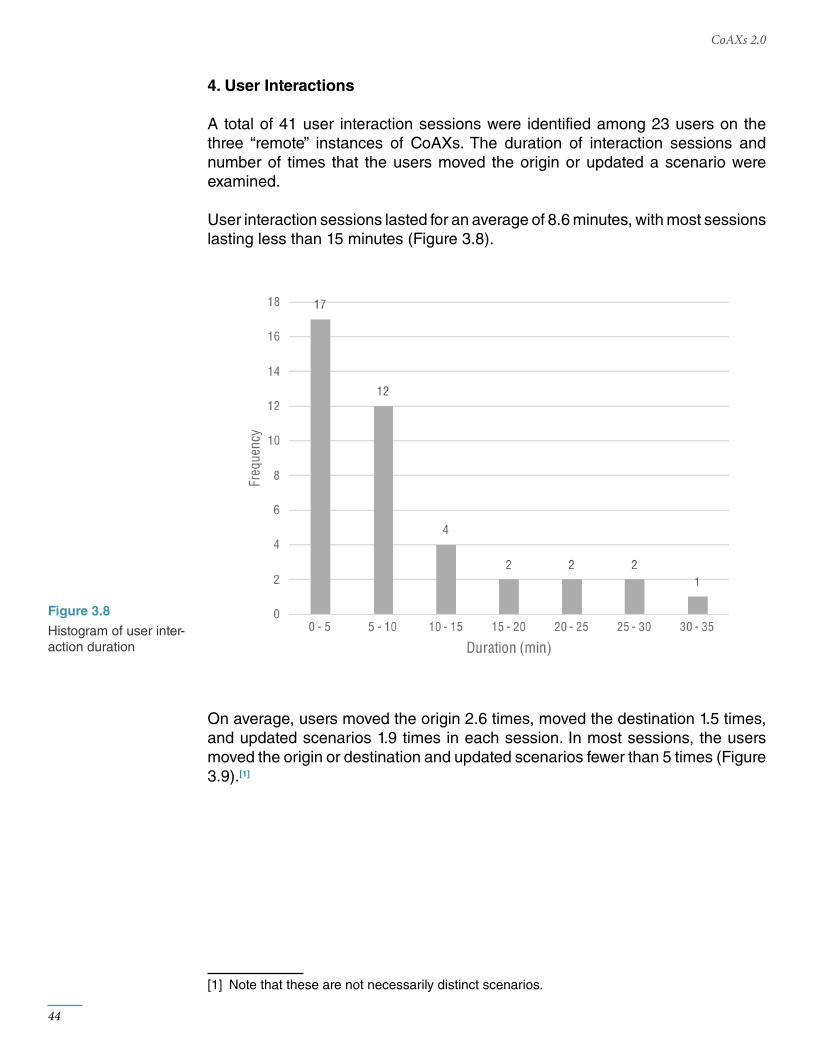
4. User Interactions
A total of 41 user interaction sessions were identified among 23 users on the three “remote” instances of CoAXs. The duration of interaction sessions and number of times that the users moved the origin or updated a scenario were examined.
User interaction sessions lasted for an average of 8.6 minutes, with most sessions lasting less than 15 minutes (Figure 3.8).
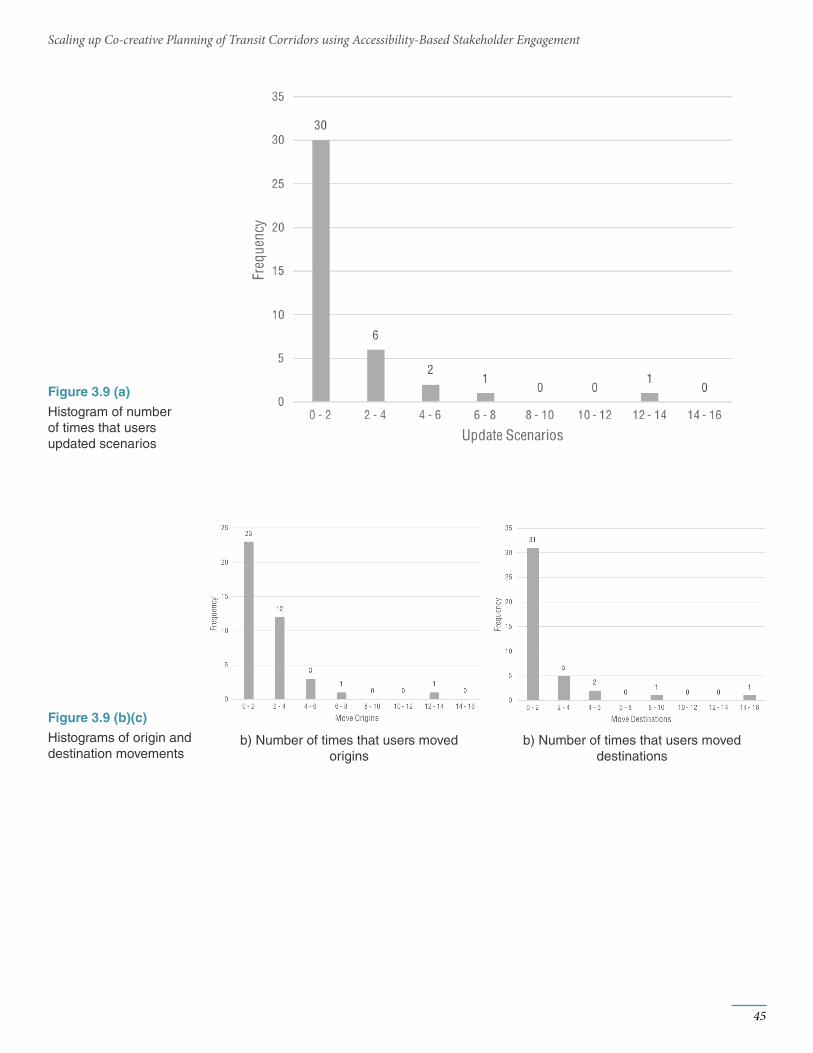
On average, users moved the origin 2.6 times, moved the destination 1.5 times, and updated scenarios 1.9 times in each session. In most sessions, the users moved the origin or destination and updated scenarios fewer than 5 times (Figure 3.9).[1]
[1] Note that these are not necessarily distinct scenarios.
44
CoAXs 2.0
Histogram of user inter-action duration
Figure 3.8
45
Scaling up Co-creative Planning of Transit Corridors using Accessibility-Based Stakeholder Engagement
Histograms of origin and destination movements
Histogram of number of times that users updated scenarios
b) Number of times that users moved origins
b) Number of times that users moved destinations
Figure 3.9 (b)(c)
Figure 3.9 (a)
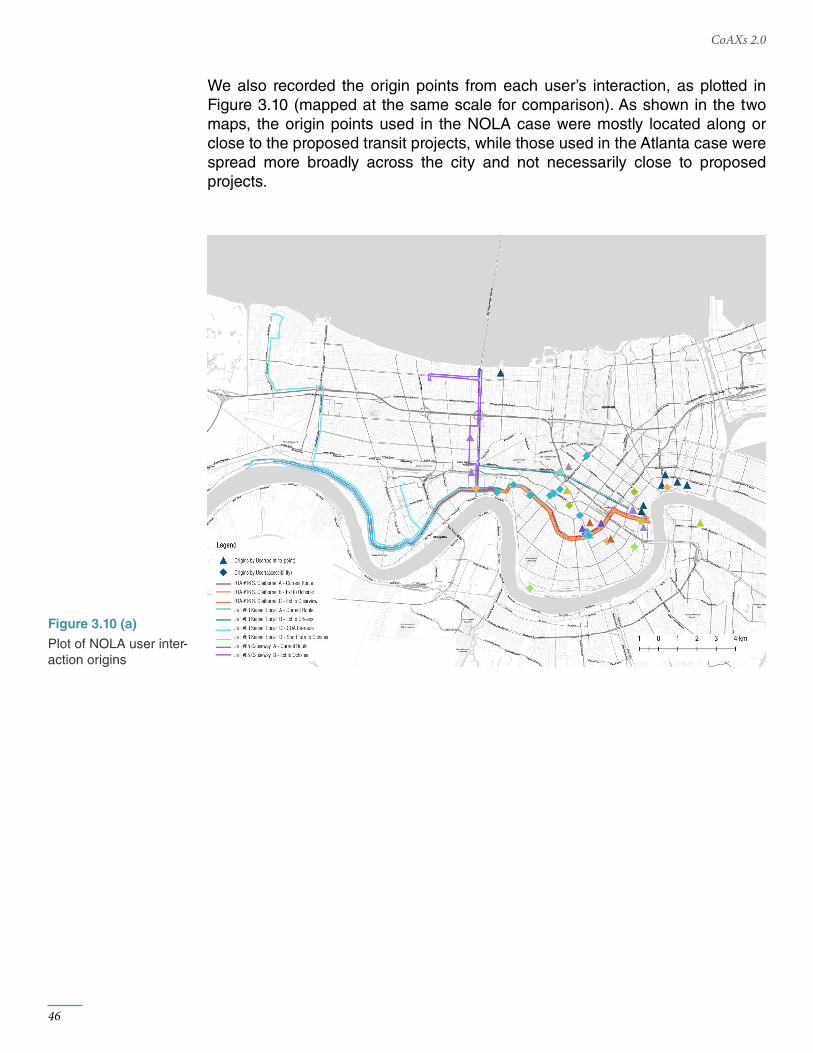
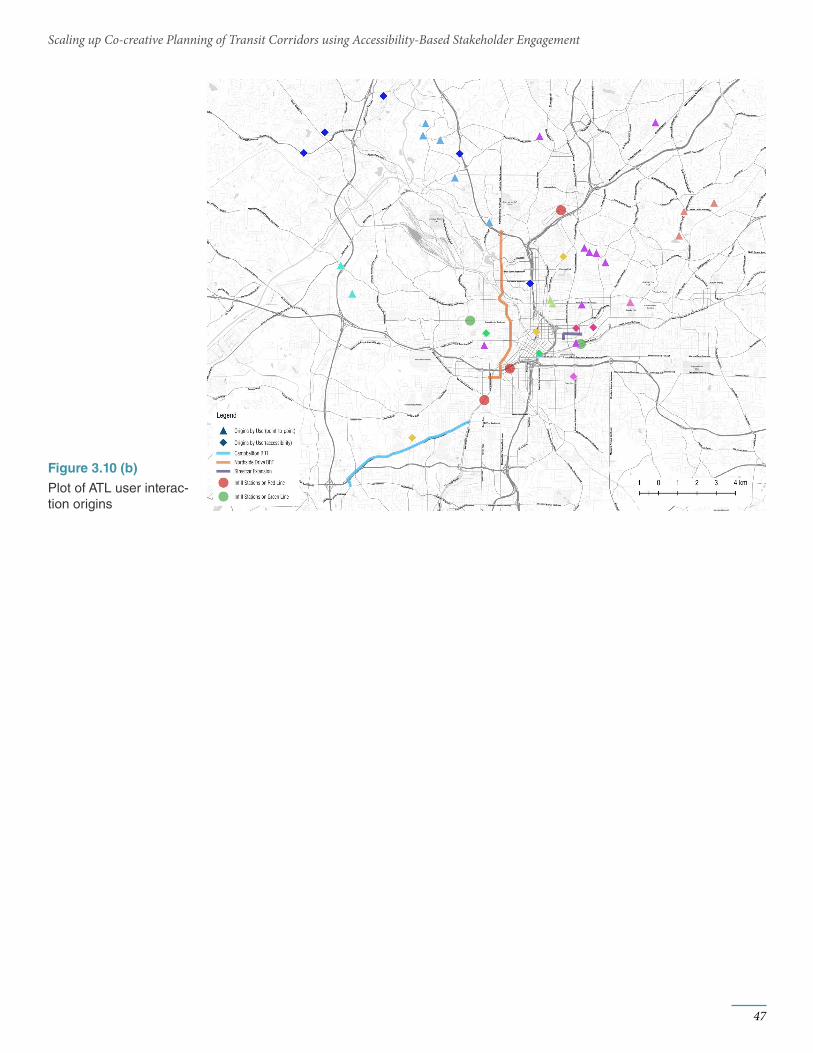
We also recorded the origin points from each user’s interaction, as plotted in Figure 3.10 (mapped at the same scale for comparison). As shown in the two maps, the origin points used in the NOLA case were mostly located along or close to the proposed transit projects, while those used in the Atlanta case were spread more broadly across the city and not necessarily close to proposed projects.
46
CoAXs 2.0
Plot of NOLA user inter-action origins
Figure 3.10 (a)
47
Scaling up Co-creative Planning of Transit Corridors using Accessibility-Based Stakeholder Engagement
Plot of ATL user interac-tion origins
Figure 3.10 (b)

Looking Back:Lessons learned from four partnerships in four cities
4
Did CoAXs help our advocacy partners advance their goals?What time, resources, and capacities were needed?
What did users think of the tool capabilities?Is the current version of CoAXs versatile for different users and
engagement formats?
50515255
One of CoAXs’ promises is to serve as a tool for motivating members of advocacy organizations around a particular transit campaign. Across multiple deployments, partners and users tended to feel that the travel time and accessibility benefits portrayed were not particularly motivating. In part, this is because the benefits that CoAXs showed did not match expectations of the impacts of proposed measures, with a variety of interpretations for why that may have been so. As one partner said, “the biggest time savings was about 4-5 minutes, which was logically hard to wrap our heads around.” When asked what would have felt like a compelling impact, one partner said they thought in the range of 10-20% of the region’s jobs would have felt like something they’d want to advocate for. Users from another deployment relayed similar sentiments, with feedback such as, the “improvements generally don’t seem to expand distance or access as much as I hope that they would” and “After playing with the tool, I think I overestimated the positive impacts of these specific corridor improvements on transit users.” In short, for the projects we tested, CoAXs was not as useful for generating enthu-siasm among advocates as we had hoped.
Generally, the groups who participated felt that working with the research team to have their members interact with CoAXs was primarily beneficial from an educa-tional standpoint. For example, one partner mentioned they felt it was empow-ering to their staff and active members “just to see that there’s a way on a map to play around with these routes, that they aren’t set in stone, that we can make these changes, and that we have the power to propose changes.” The benefits of using CoAXs were also dependent on whether groups using CoAXs already had active campaigns aligned with scenarios being tested in the tool.
Multiple organizations felt that the tool and its outputs would be useful for communicating with decision-makers about potential benefits to their districts/jurisdictions (“a potential knockout for engaging state legislators”). One actually used findings from CoAXs to communicate with decision-makers for one of their campaigns.
Through reflection by the research team, debriefs with advocacy partners and their members, and qualitative interpretation of the data, we summarize the key lessons from the four CoAXs implementations described above. This section is organized around four central questions.
50
CoAXs 2.0
Did CoAXs help our advocacy partners advance their goals?
Two partners mentioned that the time required to select scenarios and collabo-rate with the research team was more than they anticipated, and somewhat of a capacity burden for their small teams. For some partners this was due to the time needed for recruitment, which ended up being more taxing than anticipated due to difficulty explaining the event and motivating people to participate; for others, unexpected effort was required to work with us iteratively defining the scenarios,
The appeal of CoAXs as a tool for communicating with decision-makers seemed to come in part from how it demonstrates the benefits of transit improvement projects in multiple ways. With respect to accessibility benefits, partners generally appreciated the economic and equity aspect of those benefits, with one partner being particularly drawn in since other transit studies in their city have used that framing in the past: “I don’t think transportation organizations do a good job of explaining livability benefits like access to jobs, schools, grocery stores, etc. I think linking CoAXs less from time savings and more to access is great.”
In addition to briefing decision-makers, partners suggested CoAXs may work best in its interactive format for a group of stakeholders meeting over multiple sessions who could have the time to grasp the tool, test scenarios, and build consensus. The successful collaborative exchange among advocates who were already familiar with CoAXs and the Boston region (described in Section 2), along with evidence that the accessibility version might not be intuitive to a first-time user, support the recommendation for multiple sessions.
Two partners emphasized the need to have a tool that addresses the allocation of street space at a more granular scale, with a particular focus on parking issues to help users visualize and understand the benefits and impacts of utilizing parking space in different ways.
Finally, one partner felt that aside from tools, what really seemed most important in being able to win street design or bus priority changes had been implementing a pilot project that people could experience first-hand: “until you have that, this is not going to be relevant to anyone.” This assertion aligns with an issue noted by many participants -- important elements of the user experience such as reliability, conditions at stops, crowding, and comfort -- are not well represented by the current tool.
51
Scaling up Co-creative Planning of Transit Corridors using Accessibility-Based Stakeholder Engagement
What time, resources, and capacities were needed?
testing them, and then walking members through how to use the tool.
Because CoAX is based on open-source software, the main barrier to use is not cost, directly, but the amount of time and depth of knowledge required to deploy a full implementation of CoAXs. Familiarity with specialized software and programming (e.g. GIS and Javascript) is required for editing and cleaning GTFS, creating transportation scenarios, downloading and editing land use data, running analyses, and customizing what users of CoAXs can actually see and do. These requirements are discussed in greater detail in Appendix B.
Creating scenarios is an iterative process. Final scenarios were usually the result of multiple rounds of creation, testing, and refinement. The CoAXs team coded the scenarios, but due to the number of assumptions involved in scenario creation and scenario modeling, the partners played an invaluable role, sharing their knowledge to “gut check” the scenarios to see if they aligned with their experience of public transportation in their cities. This was particularly true in the spring deployment where our research team was working remotely, in cities for which the CoAXs team had much less familiarity with the transportation systems. This ability to test the output of CoAXs against one’s own knowledge was indis-pensable but further increased the amount of time required from our partner organizations and our own team.
One central issue was whether CoAXs helped capture enough of the benefits of proposed projects to fuel useful conversations about them. While some partners and users concluded that the measurable benefits of bus priority improvements are by nature incremental, others felt the tool simply did not capture certain intan-gible benefits, like enabling level boarding for an area with a lot of seniors. Some partners also recognized, like the research team, that not capturing improve-ments to reliability diminished the projected value of bus priority measures. As one participant said in a debrief, “I think as advocates there was often a tendency to gravitate towards the time savings and then it’d be ‘well, it’s only a minute difference.’ And we know that what people actually really care about is reliability, and there was no way to visualize that impact.” Another partner summed up why being able to communicate these benefits could be so important: “Because you’re not building in extra time not knowing how long the bus will be, not getting
52
CoAXs 2.0
What did users think of the tool capabilities?
to the bus ridiculously early, those are time savings you can’t quantify in the current tool, those are lifestyle improvements”.
Because the results did not tend to meet advocates’ expectations of what might be a compelling improvement to advocate for, one partner noted that their members tended towards “maximizing all the knobs” [sliders] to be able to find the largest impacts.
Aside from the type of benefits presented, other participants reflected on the way those benefits were communicated. One user noted that the tool could be “highly idiosyncratic” with respect to identifying benefits, while another suggested that the “visualization was challenging because I think your eye was not drawn toward where the increases happened.” Multiple users noted they found it could be difficult to figure out what combination of scenario improvements and location of the origin marker would demonstrate an interesting set of benefits. This search for “a needle in a haystack” might be frustrating for many users. In an advocacy context, CoAxs may be best used as a data analysis tool for staff and highly engaged members, to select key results to share with community members and decisionmakers.
Users generally felt that the accessibility version inherently encouraged them to think about others’ travel, as thinking about access to jobs isn’t a normal frame of reference: “people don’t usually think about how many jobs I have access to, so it’s about other people, and other populations.” Conversely, one user who tested the travel time version felt, “I think the focus on travel time savings misses some of the other benefits of transit. It is definitely important, but only looking at it through this lens actually makes the projects seem less impactful to me.”
One partner reflected on the desire for the tool to more clearly communicate which entities have responsibility for which interventions, so as to educate their advocates about where they need to put pressure in an advocacy process: “some of the improvements are things that the [transit authority] controls, and some the city controls, so having mixed messages like that from an advocacy perspective makes it harder…our advocacy is really about understanding who has power and who has the ability to make the change, and the tool is not set up to understand that. The output isn’t designed for a particular audience, it isn’t for legislators, or municipalities, so each entity could focus in on the thing they’re not responsible for, which is what everyone does here.”
Multiple users also reflected a desire to increase the perceived impact of the results by somehow aggregating the benefits amongst all the people who would benefit or over a longer time period, such as calculating the “total person-hours saved using ridership data”.
Users also frequently expressed a desire for greater creative abilities. While CoAXs provides users with the ability to implement a number of improvements, it does not currently have a “free draw” mode where users can sketch new transit
53
Scaling up Co-creative Planning of Transit Corridors using Accessibility-Based Stakeholder Engagement
lines. A common feature request was the ability to introduce some kind of constraint on scenario creation, such as costs. When the number of additional buses required for a particular improvement was added to some implementations, multiple users expressed that they felt that that was a useful piece of information for the scenario creation process. As one user put it, “I definitely think this has potential as a tool, particularly in reality-checking frequency adjustments (I increased frequency to 15 minutes at one point and it went from needing two buses on the current line to 9 on the extended one--not likely to happen).”
One of the goals of CoAXs is to give the public greater control over some of the underlying assumptions that often feed “black box” transportation models. While many users expressed confusion with the complexity of these assump-tions, others wanted to know even more about them, highlighting the challenge of opening the black box to enable co-creation and alleviate skepticism, while enabling enough simplicity for broad engagement.
One user expressed appreciation and greater trust in the results from having been able to “see inside the black box,” citing that they felt few people trusted the results from their MPO’s model given how many unknown assumptions go into it, but also felt conflicted about the necessary complexity involved with opening the black box and the need to distill results for certain audiences.
Other users wanted the option to see further inside the black box, highlighting a potential need for more technical documentation available within the tool. As one user put it:
“I can’t see what’s happening with a lot of the details that have enormous impor-tance in transit planning. How fast is the bus travelling on each segment? Where are the stops? Are there timed transfers and if so where are they? These have huge impacts on mobility. HOWEVER, I think this is a great tool that’s clearly still in development and could eventually be really great, but I think it will be important to make sure the scenarios that are being demonstrated in the tool very thoroughly incorporate and communicate to users the operational realities mentioned in the questions above.”
Without being able to see all the assumptions, and with results being less than anticipated, some users became skeptical and doubted the results of the tool. “Accessibility did not seem accurate. Estimated catchment area was much smaller than in reality.”
“The concept is a great one and has potential to dramatically impact how the public conceptualizes and evaluates the merits of new projects. However, the modeled results seems very inaccurate based on my experience, e.g, the tool estimated that it would take me 45 minutes to travel from my house to work. This is simply not the case, both if I drive or if I take transit.”
54
CoAXs 2.0
Partners generally invited their most engaged members to work with the tool, who tended to have a range of prior knowledge about public transit, with some very knowledgeable users. Still, some advocates who were active members felt that even for them, the tool took time to grasp, and felt that using it with less knowledgeable members of the public would require more time and priming beforehand. As two users wrote in the exit survey, “This is a great tool for wonky transit people. I am concerned about how much John Q. Citizen would be able to garner from this,” and “I am a master’s planning student and had some trouble operating this program.”
Partners generally seemed unsure that the tool in its current format would be useful for the general public, worrying that “community members don’t have time to wait for the tool to load,” nor the time to learn how the tool works and test scenarios. Users also felt that with respect to accessibility and travel time, the use might depend on the audience, with accessibility being more compelling for decisionmakers and those thinking about issues from a regional perspective, while travel time may be more important for members of the general public in an area that could benefit from a proposed project.
Another takeaway from partners with respect to audience also related to scale; advocates tended to feel that the tool and particularly the accessibility framing would be best for regional-scale organizations and conversations, and wasn’t particularly useful for fine-grained discussions about allocation of street space in a particular corridor. In a similar vein, we found that larger scale changes are typically better suited to the tool than smaller, incremental improvements.
In terms of the in-person vs. online engagement formats, those who participated in the in-person workshops felt that the facilitation prompts were helpful and that the format did foster teamwork. As outlined above, one of the key findings from the online deployments was that the majority of users only looked at one scenario while the in-person workshops resulted in users exploring and experi-menting with a much wider range of scenarios.
The feedback suggests that multiple sessions are needed to enable people to wrap their heads around the tool’s capabilities, before then being able to engage with the scenarios they would like to test, and ultimately working towards consensus.
Two potential use cases for CoAXs at its current (or slightly beyond) level of
55
Scaling up Co-creative Planning of Transit Corridors using Accessibility-Based Stakeholder Engagement
Is the current version of CoAXs versatile for different users and engagement formats?
development emerge from the experiences and feedback: 1) Using CoAXs with a group of key stakeholders working on a particular transit
planning process, for engagement with the tool and scenarios over multiple sessions, providing the time and space to understand the tool, seek out different scenarios to test, and ultimately build consensus around certain alternatives.
2) Advocacy groups using CoAXs internally as a data analysis tool to help them with campaign strategy, and with developing communications, maps, and data to help build a case, particularly to local decisionmakers.
The four deployments also allowed us to gauge CoAXs’ versatility across different kinds of projects. Nearly all implementations focused on different types of bus priority improvements to particular corridors, which worked well from the perspec-tive of the tool’s capabilities to model bus priority improvements, and from the perspective of being able to model scenarios of relevance to the organizations.
On the other hand, due in part to the nature of these improvements, and in part to the visualizations and the way benefits are calculated in CoAXs, some of these scenarios tended to show results that appeared fairly incremental, which seemed to underwhelm and somewhat deflate users, rather than arm them with data they found compelling. As one user said in a debrief, “bus prioritization is nibbling around the edges on a lot of problems, saving a few minutes here and there, but in a lot of discussions it became apparent that you’re not going to make major changes in time, not [here]”. For the implementation in New Orleans, it became clear that assumptions in our calculation of accessibility may not be appropriate for low frequency transit networks (e.g. in which most routes run less frequently than every half hour). Our approach considers the average accessibility over a two-hour window, as if a rider left their origin randomly during that window, rather than consulting a schedule. This assumption might result in longer estimated waiting times than riders actually experience, because, in actuality, they likely time their departures. Additionally, riders are assumed to choose their route based on perfect foresight of their departure time, rather than timing their departure to use a convenient or familiar route, which may have meant that improved routes were rarely assumed to be used if they ran infrequently. Since transit riders in New Orleans don’t tend to utilize their system in the way CoAXs assumes, this method of calculating accessibility may have tended to dilute the benefits of the scenarios being tested. These experiences of smaller benefits than anticipated led some partners to feeling they should have chosen a set of corridors or scenarios that implied more aggressive interventions to show bigger, more visible benefits.
56
CoAXs 2.0

57
Scaling up Co-creative Planning of Transit Corridors using Accessibility-Based Stakeholder Engagement


Looking Forward
5
Near term engagement lessonsLonger term prospects
6061
This project, examining how people understand and communicate about transit scenarios, involved only a limited set of interested advocates. It does, however, offer a glimpse into potentially new, co-creative approaches to engagement for public transportation planning. In such approaches, instead of trying to design optimal projects themselves, planners would be responsible for designing spaces and tools for collaborative problem solving. As such tools continue to evolve, lines between traditionally distinct steps of a linear transportation planning process – identifying needs, generating project ideas, narrowing alternatives, selecting a preferred option, and implementing the selected project – are starting to blur. Reducing the computational time and cognitive effort required to analyze complex networks may enable more inclusive, reflective, iterative, and meaningful engagement.
Effective engagement must be collaboratively designed. Ideally, stakeholders participate in the stages of framing the problem, and generating, narrowing, selecting, and implementing alternatives, not only for a transportation project itself, but also for the higher-level design of engagement strategies and techniques around it. Our research deviated from this ideal. We began in the middle, with an already narrowed set of technical tools, and sought to identify if these tools might address problems advocates face and understand how easily they could be implemented. At the same time, we faced challenges of continually evolving functionality and interoperability of various open-source software modules, some beyond our control. These challenges made it impractical to hand off to partners the responsibility for configuring and deploying CoAXs, and we ended up playing a greater role as technical mediators than we initially envisioned.
Even if more user-friendly, stable, and well-documented software is made widely available, technical mediators may still be needed. The difficulties of formulating input assumptions (about reasonable vehicle speeds, for example), may be attrib-utable to the inherent complexity of transportation systems that even well-con-ceived analysis tools cannot resolve. Interpreting results, and adjusting input data and calculation assumptions, requires time and intuition for iterative explo-ration and calibration. Even if robust analysis tools are sufficiently user-friendly for non-expert use, appeals to authority, drawing on the credibility of technical experts, may still be important as an advocacy tactic. The need for a technical mediator limits short-term prospects for wider use of CoAXs, at least in its current form.
60
CoAXs 2.0
Near term engagement lessons
Longer term, we envision co-creative tools for transit planning being scaled up in a number of ways. A growing number of online tools allow users to visualize isochrones interactively. Based on how well these visualizations seemed to promote dialogue and a focus on new locations, unexpected beneficiaries, and equity impacts, we believe they have strong potential to enhance co-creation and build broader constituencies for public transit. Whether agencies, advocates, and stakeholders continue to use varied tools for these visualizations, or consol-idate around a few leading tools, it may be worthwhile to foster a community of practice around interactive mapping that frames the benefits of transit in terms of areas and opportunities accessible. Other benefits, such as comfort, crowding, or prestige associated with different modes, may be difficult to quantify, but shared tools could be designed to help prompt dialogue about these factors.
Our users wanted features enabling them both to create scenarios quickly, sketching at a high-level (e.g. drawing a new line), and to see meaningfully different results, which often relied on detailed inputs (e.g. speed variations between stop pairs). Put another way, we have negotiated between allowing freer alternative creation, and showing narrowly filtered results already identified as having major impacts. While the sliders in some of our deployments allowed the creation of millions of distinct scenarios, many of them ended up not being meaningfully different from each other; participants tended to evaluate only a few, often at the extreme ends of our pre-specified ranges. Future tools could allow simpler, less detailed inputs, then calculate results for a range of possible values based on detailed service parameters without requiring explicit user specification -- in effect conducting a sensitivity analysis automatically. Alternatively, users could specify a desired result (e.g., a desired increment in number of jobs reachable from a certain neighborhood) and see a range of potential scenarios that would achieve this result. Implementing and deploying such features would require a fair amount of development effort over the coming years. Cloud services could keep the computing costs for such features within reasonable limits.
Regardless of the specific features, effective computational tools for co-creative planning would need to be shared between transit agencies and the public. Ideally, they would be valuable enough for the agencies to sponsor development and maintenance, lending legitimacy to advocates’ proposals. Many agencies have already enabled online trip planners through GTFS, APIs with GTFS real-time vehicle location data, and public dashboards to report performance metrics. Much of this performance reporting, however, is too abstract (e.g. on-time-per-formance at a line-level, while passengers are likely to care more about their
61
Scaling up Co-creative Planning of Transit Corridors using Accessibility-Based Stakeholder Engagement
Longer term prospects
overall door-to-door journey). If a healthcare center wanted to understand how access to its patients varied over the course of a year, or if an employer wanted to receive alerts about how its employees were affected by a series of disrup-tions, transport agencies do not provide the integrated tools to do so, despite having the individual components in place. They do, however, provide APIs for mapping individual journeys, through which anyone can enter a single origin and destination to receive information on a trip. It would be a relatively small extension to provide interfaces for mapping access to opportunities, in which anyone could enter multiple origins and destinations to obtain relevant informa-tion about network performance, in current or future scenarios.
Using this platform, a household could upload home and work locations, then receive weekly performance reports quantifying time lost to delays, and lobby elected officials with personalized impacts based on official data. A retailer could upload a spatial layer of different customer demographic groups, understand how a proposed transportation project would change their level of access, and ultimately become a more informed contributor to public deliberation. Advocacy groups could ask their members to upload location history, then convene a meeting to test different ideas that would benefit their constituencies. Putting features like these to use for shared understandings of access to opportunities could improve agency credibility, giving them channels to explain the causes (e.g. history of poor maintenance) and potential solutions (e.g. specific investment plans) for delays through ongoing communication with both individual customers and stakeholders.
Digital tools are not only unlocking new possibilities for stakeholder engagement, they are also reshaping the fundamentals of urban mobility itself. The adoption of GTFS, a flexible de-facto standard that has spawned a wide range of tools, has been instructive. Analogous standards for sharing user location, ride request, and crowdsourced data have not yet been advanced. The digital infrastructure of APIs and data standards is increasingly intertwined with the traditional infrastructure of streets and tracks, but it is highly fragmented. Concerted efforts to structure public access to mobility data are critical steps on the path toward effective future tools for co-creation. Incorporating scaled-up sources of multimodal passenger demand data, in addition to vehicle location data, could enable a deeper level of co-creation. Users’ preferences could be readily gleaned from their behavior, and the potential impacts of projects could be more readily evaluated and communi-cated in personal ways. Nonetheless, for shared mobility like transit, deliberation and dialogue are likely to be more effective in finding solutions than algorithmic dictates. Some degree of public decision-making, with concomitant face-to-face organizing and advocacy, will be required to shape the priorities and futures of transit and the cities it serves.
62
CoAXs 2.0

63
Scaling up Co-creative Planning of Transit Corridors using Accessibility-Based Stakeholder Engagement


Appendices
6
Appendix A: Boston workshop detailsSample pre-test survey
Sample post-text surveyParticipant interaction results
Appendix B: Software and data requirements and preparationSkillsets
Data needs and preparationSoftware
66666872
75757579
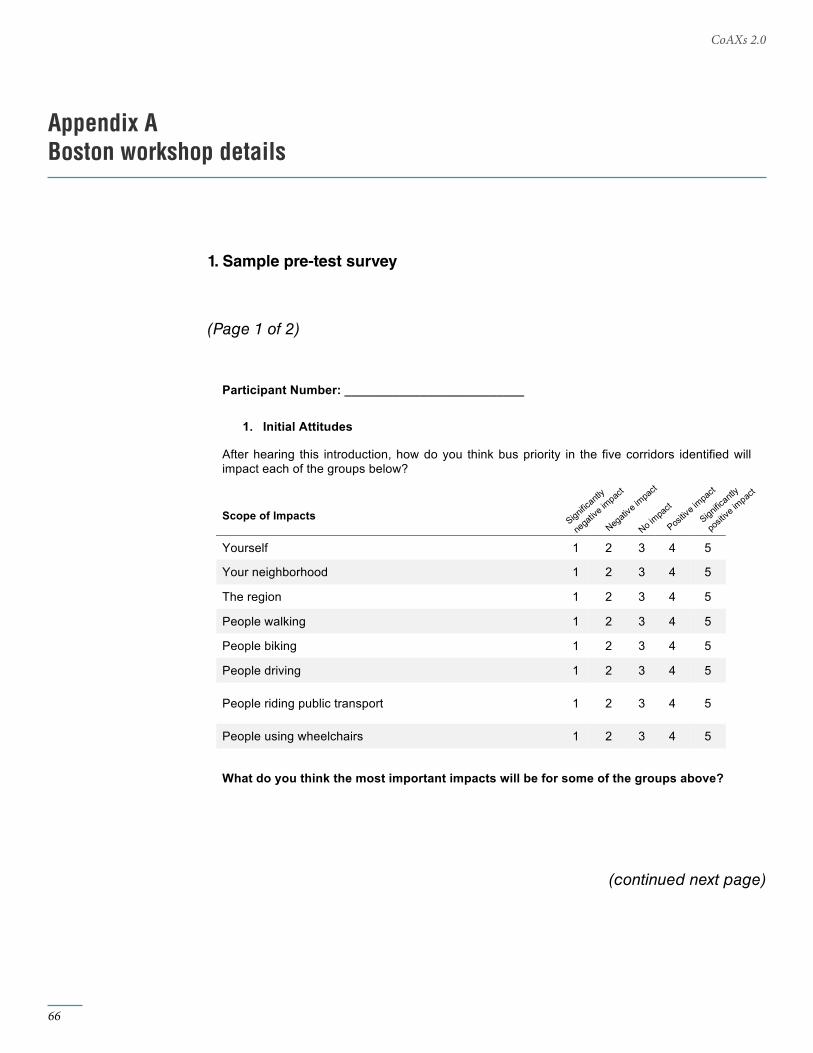
1. Sample pre-test survey
(Page 1 of 2)
(continued next page)
Participant Number: __________________________
1. Initial Attitudes
After hearing this introduction, how do you think bus priority in the five corridors identified will
impact each of the groups below?
Scope of Impacts
Yourself 1 2 3 4 5
Your neighborhood 1 2 3 4 5
The region 1 2 3 4 5
People walking 1 2 3 4 5
People biking 1 2 3 4 5
People driving 1 2 3 4 5
People riding public transport 1 2 3 4 5
People using wheelchairs 1 2 3 4 5
What do you think the most important impacts will be for some of the groups above?
To what extent do you disagree/agree with the following statements? As above, “this project”
refers to bus priority in the five corridors identified
This project will be effective at advancing important
transportation planning goals. 1 2 3 4 5
This project will help advance important broader planning
goals (e.g. housing, education). 1 2 3 4 5
I am more likely to advocate for this project than other projects
LivableStreets supports. 1 2 3 4 5
I learned a great deal about bus priority from this introduction. 1 2 3 4 5
I can describe the features of this project to a friend. 1 2 3 4 5
I can describe the impacts of this project to a friend. 1 2 3 4 5
I have the knowledge to advocate confidently for this project. 1 2 3 4 5
66
CoAXs 2.0
Appendix ABoston workshop details
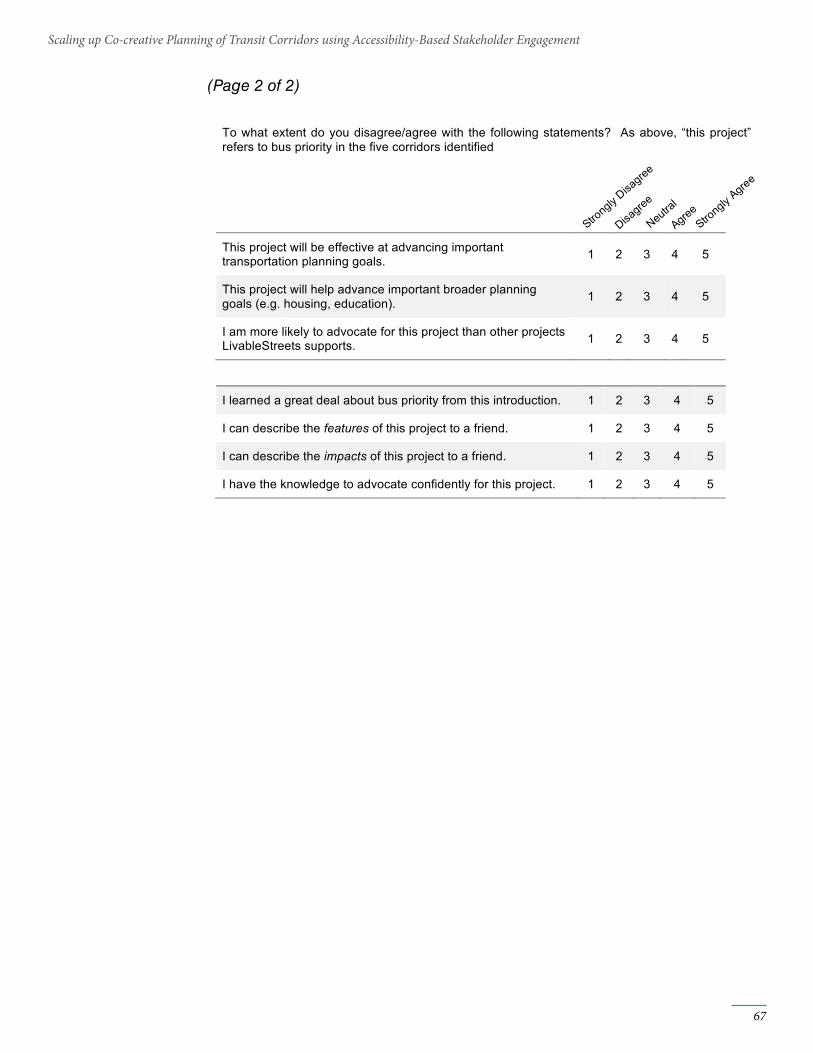
Participant Number: __________________________
1. Initial Attitudes
After hearing this introduction, how do you think bus priority in the five corridors identified will
impact each of the groups below?
Scope of Impacts
Yourself 1 2 3 4 5
Your neighborhood 1 2 3 4 5
The region 1 2 3 4 5
People walking 1 2 3 4 5
People biking 1 2 3 4 5
People driving 1 2 3 4 5
People riding public transport 1 2 3 4 5
People using wheelchairs 1 2 3 4 5
What do you think the most important impacts will be for some of the groups above?
To what extent do you disagree/agree with the following statements? As above, “this project”
refers to bus priority in the five corridors identified
This project will be effective at advancing important
transportation planning goals. 1 2 3 4 5
This project will help advance important broader planning
goals (e.g. housing, education). 1 2 3 4 5
I am more likely to advocate for this project than other projects
LivableStreets supports. 1 2 3 4 5
I learned a great deal about bus priority from this introduction. 1 2 3 4 5
I can describe the features of this project to a friend. 1 2 3 4 5
I can describe the impacts of this project to a friend. 1 2 3 4 5
I have the knowledge to advocate confidently for this project. 1 2 3 4 5
(Page 2 of 2)
Participant Number: __________________________
1. Initial Attitudes
After hearing this introduction, how do you think bus priority in the five corridors identified will
impact each of the groups below?
Scope of Impacts
Yourself 1 2 3 4 5
Your neighborhood 1 2 3 4 5
The region 1 2 3 4 5
People walking 1 2 3 4 5
People biking 1 2 3 4 5
People driving 1 2 3 4 5
People riding public transport 1 2 3 4 5
People using wheelchairs 1 2 3 4 5
What do you think the most important impacts will be for some of the groups above?
To what extent do you disagree/agree with the following statements? As above, “this project”
refers to bus priority in the five corridors identified
This project will be effective at advancing important
transportation planning goals. 1 2 3 4 5
This project will help advance important broader planning
goals (e.g. housing, education). 1 2 3 4 5
I am more likely to advocate for this project than other projects
LivableStreets supports. 1 2 3 4 5
I learned a great deal about bus priority from this introduction. 1 2 3 4 5
I can describe the features of this project to a friend. 1 2 3 4 5
I can describe the impacts of this project to a friend. 1 2 3 4 5
I have the knowledge to advocate confidently for this project. 1 2 3 4 5
67
Scaling up Co-creative Planning of Transit Corridors using Accessibility-Based Stakeholder Engagement
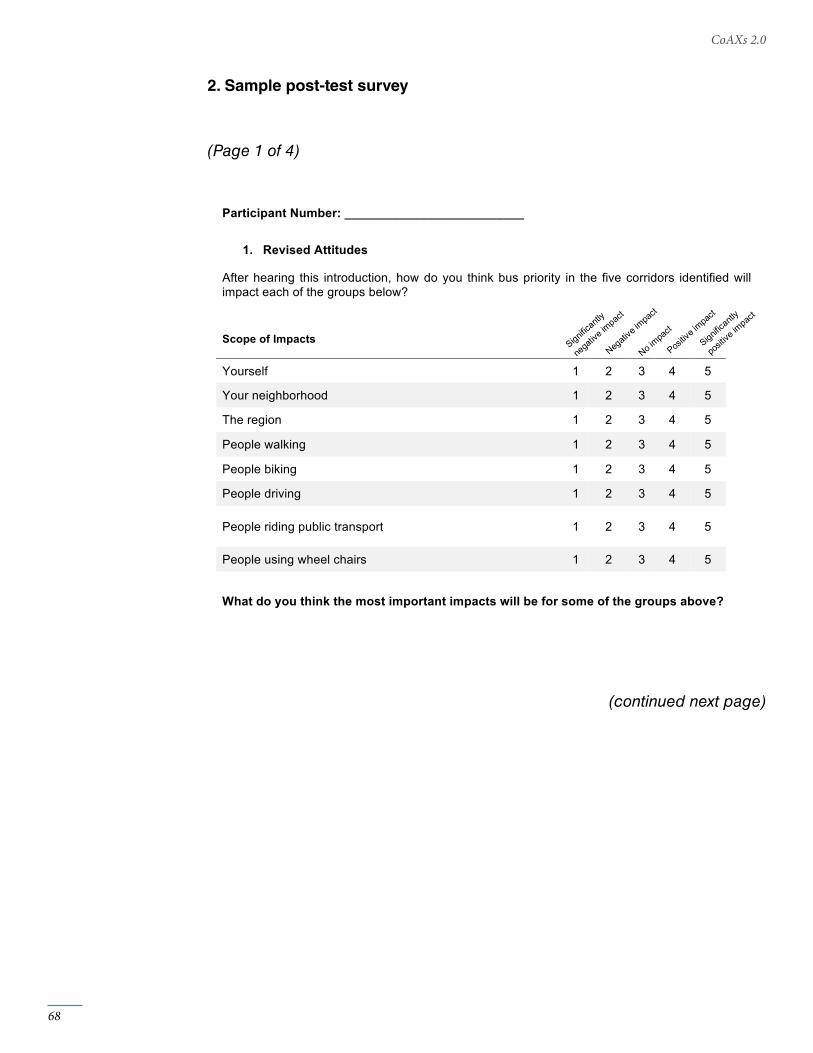
Participant Number: __________________________
1. Revised Attitudes
After hearing this introduction, how do you think bus priority in the five corridors identified will
impact each of the groups below?
Scope of Impacts
Yourself 1 2 3 4 5
Your neighborhood 1 2 3 4 5
The region 1 2 3 4 5
People walking 1 2 3 4 5
People biking 1 2 3 4 5
People driving 1 2 3 4 5
People riding public transport 1 2 3 4 5
People using wheel chairs 1 2 3 4 5
What do you think the most important impacts will be for some of the groups above?
2. Sample post-test survey
(Page 1 of 4)
(continued next page)
68
CoAXs 2.0
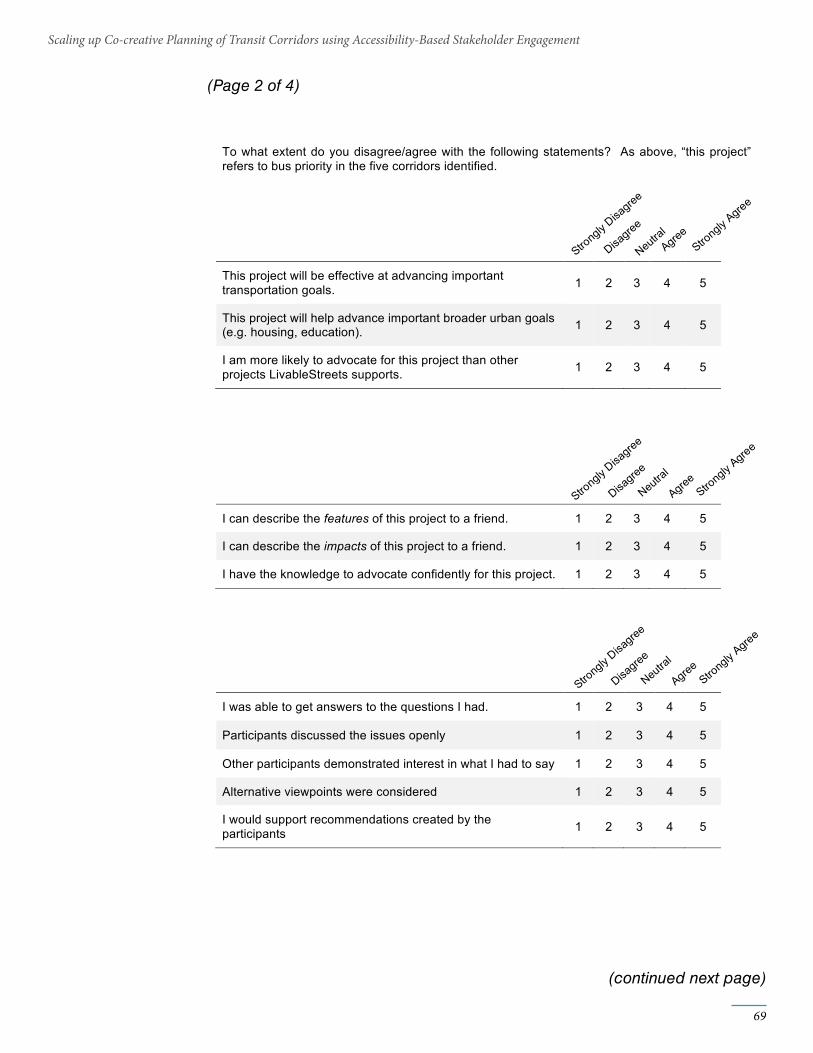
Participant Number: __________________________
1. Revised Attitudes
After hearing this introduction, how do you think bus priority in the five corridors identified will
impact each of the groups below?
Scope of Impacts
Yourself 1 2 3 4 5
Your neighborhood 1 2 3 4 5
The region 1 2 3 4 5
People walking 1 2 3 4 5
People biking 1 2 3 4 5
People driving 1 2 3 4 5
People riding public transport 1 2 3 4 5
People using wheel chairs 1 2 3 4 5
What do you think the most important impacts will be for some of the groups above?
To what extent do you disagree/agree with the following statements? As above, “this project”
refers to bus priority in the five corridors identified.
This project will be effective at advancing important
transportation goals. 1 2 3 4 5
This project will help advance important broader urban goals
(e.g. housing, education). 1 2 3 4 5
I am more likely to advocate for this project than other
projects LivableStreets supports. 1 2 3 4 5
I can describe the features of this project to a friend. 1 2 3 4 5
I can describe the impacts of this project to a friend. 1 2 3 4 5
I have the knowledge to advocate confidently for this project. 1 2 3 4 5
I was able to get answers to the questions I had. 1 2 3 4 5
Participants discussed the issues openly 1 2 3 4 5
Other participants demonstrated interest in what I had to say 1 2 3 4 5
Alternative viewpoints were considered 1 2 3 4 5
I would support recommendations created by the
participants 1 2 3 4 5
(Page 2 of 4)
(continued next page)
69
Scaling up Co-creative Planning of Transit Corridors using Accessibility-Based Stakeholder Engagement
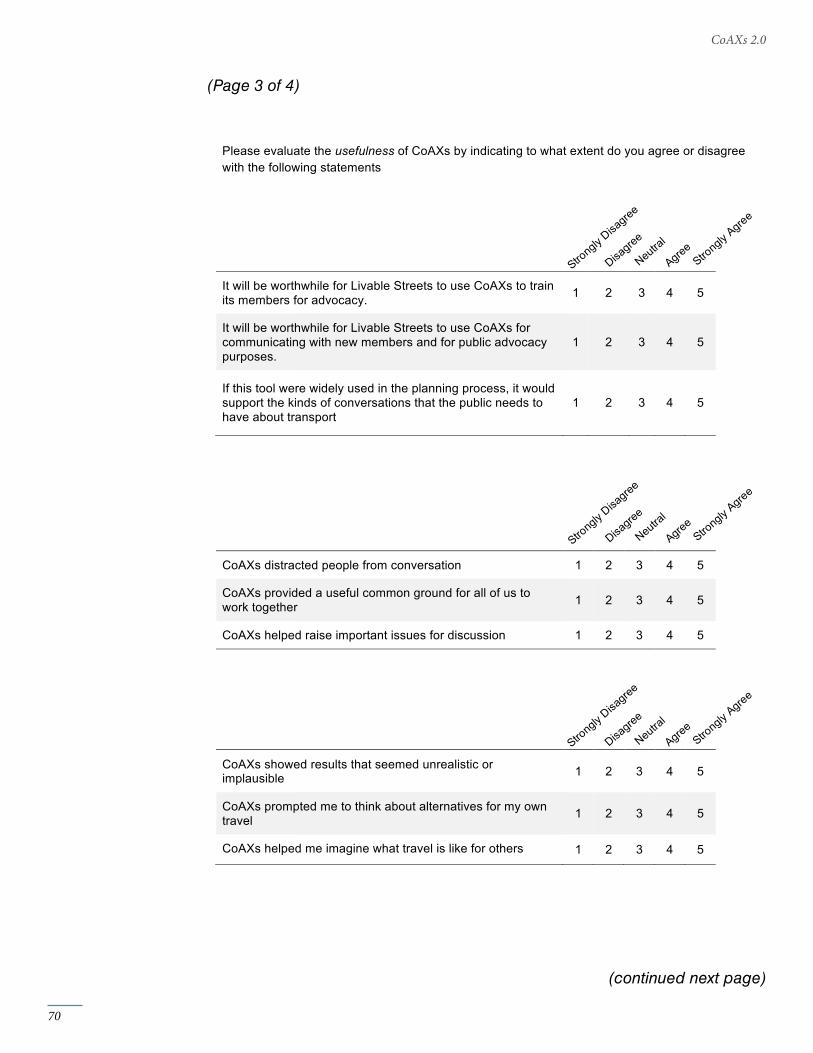
Please evaluate the usefulness of CoAXs by indicating to what extent do you agree or disagree
with the following statements
It will be worthwhile for Livable Streets to use CoAXs to train
its members for advocacy. 1 2 3 4 5
It will be worthwhile for Livable Streets to use CoAXs for
communicating with new members and for public advocacy
purposes.
1 2 3 4 5
If this tool were widely used in the planning process, it would
support the kinds of conversations that the public needs to
have about transport
1 2 3 4 5
CoAXs distracted people from conversation 1 2 3 4 5
CoAXs provided a useful common ground for all of us to
work together 1 2 3 4 5
CoAXs helped raise important issues for discussion 1 2 3 4 5
CoAXs showed results that seemed unrealistic or
implausible 1 2 3 4 5
CoAXs prompted me to think about alternatives for my own
travel 1 2 3 4 5
CoAXs helped me imagine what travel is like for others 1 2 3 4 5
(Page 3 of 4)
(continued next page)
70
CoAXs 2.0
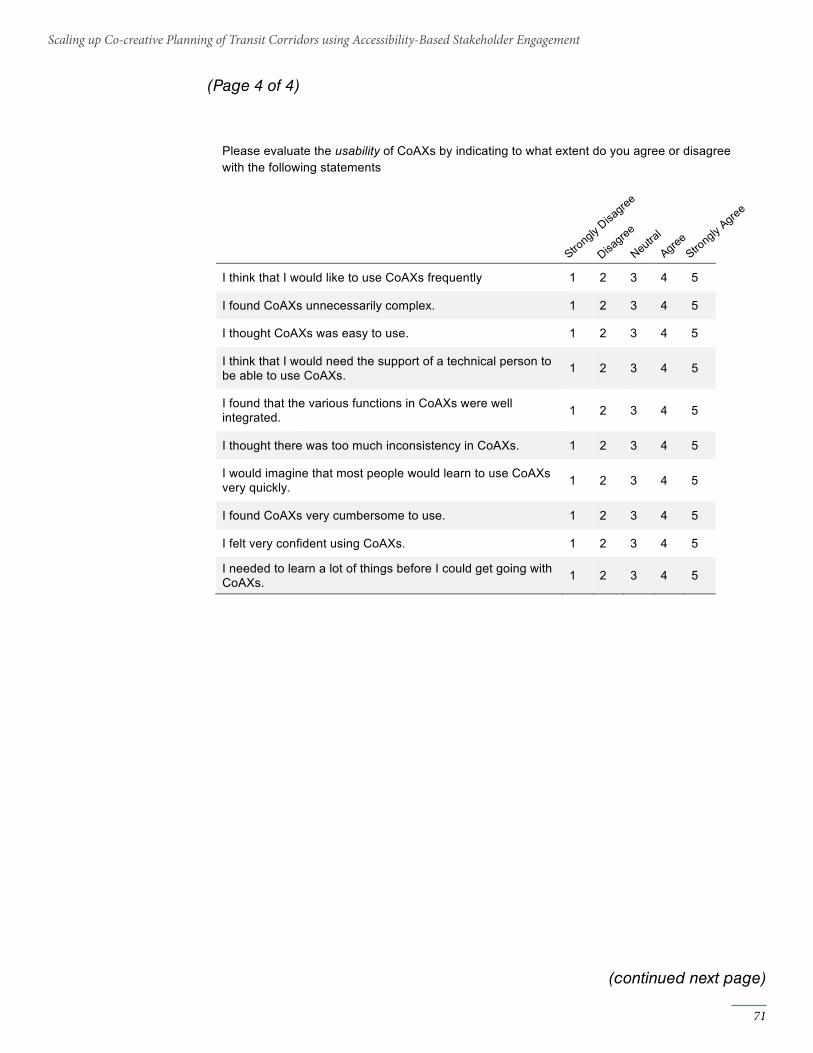
Please evaluate the usefulness of CoAXs by indicating to what extent do you agree or disagree
with the following statements
It will be worthwhile for Livable Streets to use CoAXs to train
its members for advocacy. 1 2 3 4 5
It will be worthwhile for Livable Streets to use CoAXs for
communicating with new members and for public advocacy
purposes.
1 2 3 4 5
If this tool were widely used in the planning process, it would
support the kinds of conversations that the public needs to
have about transport
1 2 3 4 5
CoAXs distracted people from conversation 1 2 3 4 5
CoAXs provided a useful common ground for all of us to
work together 1 2 3 4 5
CoAXs helped raise important issues for discussion 1 2 3 4 5
CoAXs showed results that seemed unrealistic or
implausible 1 2 3 4 5
CoAXs prompted me to think about alternatives for my own
travel 1 2 3 4 5
CoAXs helped me imagine what travel is like for others 1 2 3 4 5
Please evaluate the usability of CoAXs by indicating to what extent do you agree or disagree
with the following statements
I think that I would like to use CoAXs frequently 1 2 3 4 5
I found CoAXs unnecessarily complex. 1 2 3 4 5
I thought CoAXs was easy to use. 1 2 3 4 5
I think that I would need the support of a technical person to
be able to use CoAXs. 1 2 3 4 5
I found that the various functions in CoAXs were well
integrated. 1 2 3 4 5
I thought there was too much inconsistency in CoAXs. 1 2 3 4 5
I would imagine that most people would learn to use CoAXs
very quickly. 1 2 3 4 5
I found CoAXs very cumbersome to use. 1 2 3 4 5
I felt very confident using CoAXs. 1 2 3 4 5
I needed to learn a lot of things before I could get going with
CoAXs. 1 2 3 4 5
(Page 4 of 4)
(continued next page)
71
Scaling up Co-creative Planning of Transit Corridors using Accessibility-Based Stakeholder Engagement
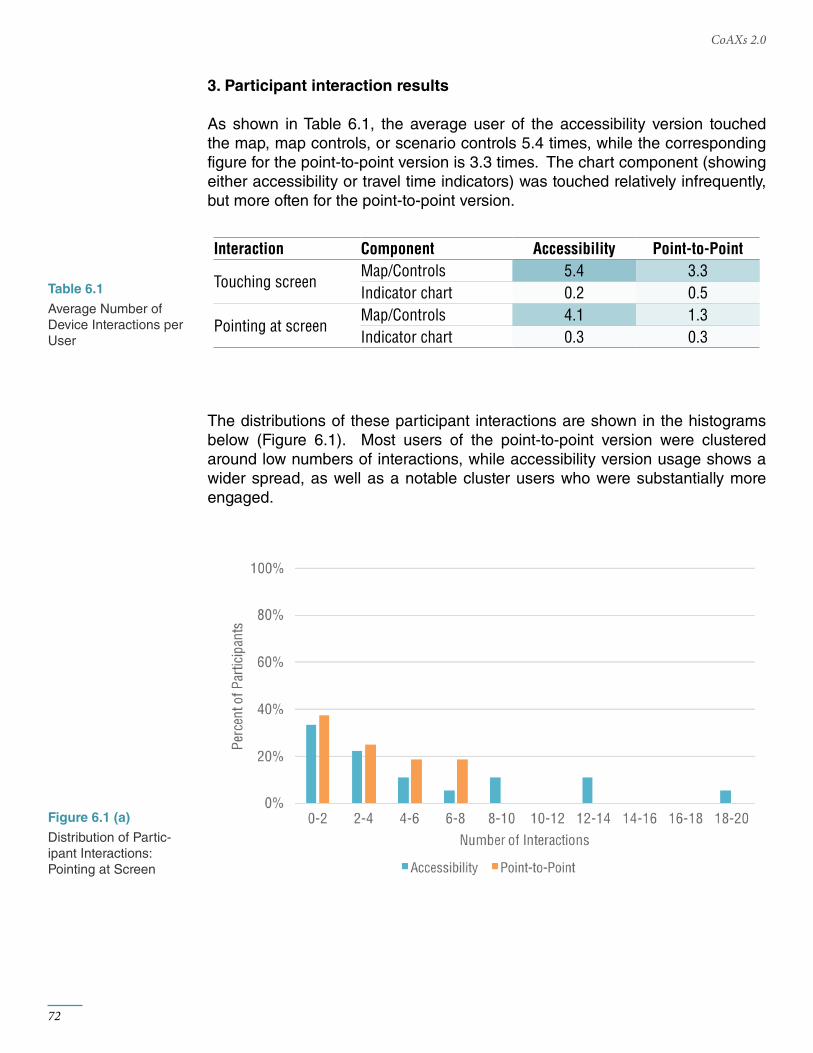
3. Participant interaction results
As shown in Table 6.1, the average user of the accessibility version touched the map, map controls, or scenario controls 5.4 times, while the corresponding figure for the point-to-point version is 3.3 times. The chart component (showing either accessibility or travel time indicators) was touched relatively infrequently, but more often for the point-to-point version.
The distributions of these participant interactions are shown in the histograms below (Figure 6.1). Most users of the point-to-point version were clustered around low numbers of interactions, while accessibility version usage shows a wider spread, as well as a notable cluster users who were substantially more engaged.
Interaction Component Accessibility Point-to-Point
Touching screenMap/Controls 5.4 3.3Indicator chart 0.2 0.5
Pointing at screenMap/Controls 4.1 1.3Indicator chart 0.3 0.3
72
CoAXs 2.0
Average Number of Device Interactions per User
Table 6.1
Distribution of Partic-ipant Interactions: Pointing at Screen
Figure 6.1 (a)

The figures below depict what percent of the conversation in each group was led by facilitators, and how balanced contributions were between participants.
73
Scaling up Co-creative Planning of Transit Corridors using Accessibility-Based Stakeholder Engagement
Percent of Words Spoken in GroupWorkshop 1
Percent of Words Spoken in GroupWorkshop 2
Accessibility Version
Accessibility Version
Point-to-Point Version
Point-to-Point Version
Distribution of Partic-ipant Interactions: Pointing at Screen
Figure 6.2 (a)
Figure 6.2 (b)
Figure 6.1 (b)

74
CoAXs 2.0
Percent of Words Spoken in GroupWorkshop 3
Percent of Words Spoken in GroupWorkshop 4
Accessibility Version
Accessibility Version
Point-to-Point Version
Point-to-Point Version
Figure 6.2 (c)
Figure 6.2 (d)
1. Skillsets
Our deployments have relied on three technical skillsets.
Software Development
The latest CoAXs front-end interface is implemented using ReactJS. Developing the current functionality required approximately six weeks of full-time work by a proficient front-end software developer, as well as support in using the Analysis back-end API for computation. Additional time was needed to develop the survey and logging functions used for research.
Maintenance
The back-end computation platform requires various administrative and technical skills, for tasks related to user management, server administration, etc. For the Boston-based workshops, we partnered with Conveyal for access to cloud-based instances of Analysis. For our spring deployments, we administered our own server at MIT, running Ubuntu. This switch made us responsible for managing resources (e.g. memory allocated to different tasks), patching vulnerabilities, responding to power outages, etc.
Customization
Given a stable front-end codebase and access to a suitably configured compu-tation engine, CoAXs can be customized for different transit projects in different cities by someone with a working knowledge of Javascript, transit data standards like GTFS, and GIS. The next section includes an illustrative overview of what such customization entails.
2. Data needs and preparation
CoAXs relies on data sources that are typically publicly available, but that at this stage require informed preparation by potential users to be able to model scenarios of interest with reasonable levels of accuracy. The primary steps for preparing data inputs and customizing an instance of CoAXs are described in more detail below, as well as the software and skills used in each step by the CoAXs team.
This section is not meant to be an instruction manual or how-to guide; the evolving nature of the various open-source software modules used would quickly make such a guide obsolete. For example, updates to Analysis that were made
75
Scaling up Co-creative Planning of Transit Corridors using Accessibility-Based Stakeholder Engagement
Appendix BSoftware and data requirements and preparation
after our workshops allow for automatic download of formatted US Census data. There are likely multiple ways to achieve each step below, and we include these steps as an indication of the capabilities needed to implement this tool and key bottlenecks preventing easier use.
1) Prepare land use data
CoAXs can represent access to a wide range of opportunities, such as health centers, grocery stores, or parks, assuming georeferenced data for the opportu-nity are available (e.g. in a shapefile). CoAXs thus far has used block-level data on the job locations, provided by the U.S. Census Bureau through the LEHD (Longi-tudinal Employer-Household Dynamics) Origin-Destination Statistics (LODES) dataset. This dataset includes detailed information about different types of jobs by wage and industry, though we use summary data to avoid overwhelming users with information.
In order to prepare land-use inputs for CoAXs, we downloaded relevant LEHD Workplace Area Characteristics files and TIGER boundaries for Census blocks, then used GIS software to join the two. The resulting shapefile was then uploaded and transformed into a high-resolution raster grid using the steps described here: https://github.com/mitTransportAnalyst/Shapefile2Grid. The resulting grid files were then posted online to be read as inputs by CoAXs.• Datasets used: 2010 U.S. Census blocks shapefiles, LEHD Workplace Area
Characteristics file• Software used: QGIS (free, open source)/ArcGIS, Excel
2) Prepare GTFS Data
In addition to land-use data, GTFS feeds are needed for each transit agency serving a region of interest. GTFS feeds are often available for download on transit agency websites or through repositories like http://transit.land.
While more extensive GTFS manipulation for scenario creation is described in later steps, this step concerns the basic preparation needed before uploading required GTFS feeds to make CoAXs work. At a minimum, users must upload a GTFS feed into Analysis; for scenario editing, users may need to add a feed_info.txt file[1] to the GTFS feed. This step frequently involves some troubleshooting, as GTFS feeds may have inconsistencies that cause errors. Feed Validator[2] can be useful for identifying problems with GTFS feeds, such as dates being in the wrong format.
In the Boston case, there was an interest in being able to model improvements to bus dwell times to simulate the potential impact of off-board fare collection, but the MBTA GTFS feed doesn’t include dwell times at bus stops (as is true for many agencies’ feeds). As a result, we used SQL to add a standard 15 seconds of dwell time to each stop, which could also have been done with Excel or a text
[1] https://developers.google.com/transit/gtfs/reference/feed_info-file[2] https://github.com/google/transitfeed/wiki/FeedValidator
76
CoAXs 2.0
editor. If data had been available, actual dwell times by bus stop could have been added.• Datasets used: GTFS feeds for each city (sometimes multiple per city,
uploaded together)• Software used: Text editors, Feed Validator, PGAdmin III (optional)
3) Develop scenarios
One of the most interesting and challenging steps in developing an instance of CoAXs is determining what range of scenarios to enable users to test. While different CoAXs deployments have allowed users to test a variety of combi-nations of different transit improvement scenarios, we have generally limited these possible combinations to specific routes, corridors, and defined ranges of potential improvements in order to avoid an overwhelming number of possible combinations, focus users’ attention on scenarios relevant to our partners, and find scenarios that are best suited to CoAXs’ capabilities. At present, CoAXs is most easily able test speed or frequency improvements, but with a little more effort is also able to test entirely new routes, stops, extensions, or re-routes. To determine what scenarios to test, we worked with partners to identify potential transit improvements of interest (either proposed by public agencies, or by their advocacy organization) that would work well in CoAXs, and then worked on translating those scenarios into CoAXs.
3a) Prepare scenarios (changes to route/stop geography)
At this stage, CoAXs does not recognize geographic changes to routes or stops made in the scenario editing interface of Conveyal Analysis, so users must prepare a GTFS feed representing any changes to route or stop geography. This preparation can be done with a text editor or tools like GTFS Editor or Architect. Examples of geography changes include extensions to routes, new routes, skip-stop service, and in-fill stations. Detailed editing may be needed to ensure that representations of baseline service adhere to expectations (e.g. setting stop-to-stop travel times to match official sources).
A new GTFS feed representing added or rerouted service can be uploaded to Analysis to create the scenario files used in CoAXs.
• Datasets used: prepared GTFS feeds• Software used: GTFS Editor
3b) Prepare scenarios (no change to route/stop geography)
The scenario editing interface of Analysis is a relatively easy-to-use tool to create modifications that can be applied to uploaded GTFS files, including changes in running time, dwell time, frequency, or dropping certain trips.
Another translation issue confronted in this step is the issue of frequency-based[3] vs. scheduled routes. Service in GTFS can be represented either by trips that repeat at a certain frequency, or lists of explicitly specified departure times. For new routes in CoAXs, we use frequency-based trips, because defining specific
[3] https://developers.google.com/transit/gtfs/reference/frequencies-file
77
Scaling up Co-creative Planning of Transit Corridors using Accessibility-Based Stakeholder Engagement
departure times for every trip would be unnecessarily detailed. To set the modeled transit improvement on the same footing as the baseline, we also convert any existing routes that will be subject to modification into frequency-based routes in the baseline scenario.
• Datasets used: prepared GTFS feeds• Software used: Scenario Editor
4) Test scenarios
After uploading the land use file created in step 1, the GTFS feeds created in step 2, and the scenario files created in step 3, we could use Analysis to compare different scenarios and sense-check results.
• Datasets used: prepared GTFS feeds, prepared land use file• Software used: Conveyal Analysis
5) Configure CoAXs
Scenarios from Step 3b are included in the CoAXs front-end as seed modifi-cations, defining which parameters users can change, and to which bundles of routes these changes will apply [https://github.com/mitTransportAnalyst/Scenar-io-seed-modification-geojson-documentation].
The last step is to prepare optional inputs to help guide users. The first is a file, following the GeoJSON specification, highlighting where modifications are applied [https://github.com/mitTransportAnalyst/documentation-of-geojson-files]. In some cases, we also created a GeoJSON of the current transit network using QGIS, to show in the background to help orient users.
The second (optional) file includes information to display to users a scorecard of the headway and estimated number of buses required for each route, which can be helpful information to provide as users test different scenarios. To create this input, one needs to find for each route included in the scenario the current headway during the chosen time period (we used 7-9am) and the average cycle time for each route in that same time period. To find the headway, one can simply look at the transit agency’s schedule online to make a rough estimate. To find the cycle time, you’ll either need to use time tables published on the agency’s website if they’re available, or you’ll need some knowledge of the GTFS feed to be able to find the right trips in the right time window for each route, and see the running time from the first to the last stop during the time period. To find the cycle time, we added the running times for each direction for each route together, and then add 10-15% to account for a typical layover at each end. Once you have the cycle time and headway in minutes, you can use this formula to estimate the number of vehicles:
Vehicles = cycle time/headway
Vehicles should be rounded up, since you can’t have a fraction of a bus. It’s also possible, but not required, to use SQL to do this analysis.
78
CoAXs 2.0
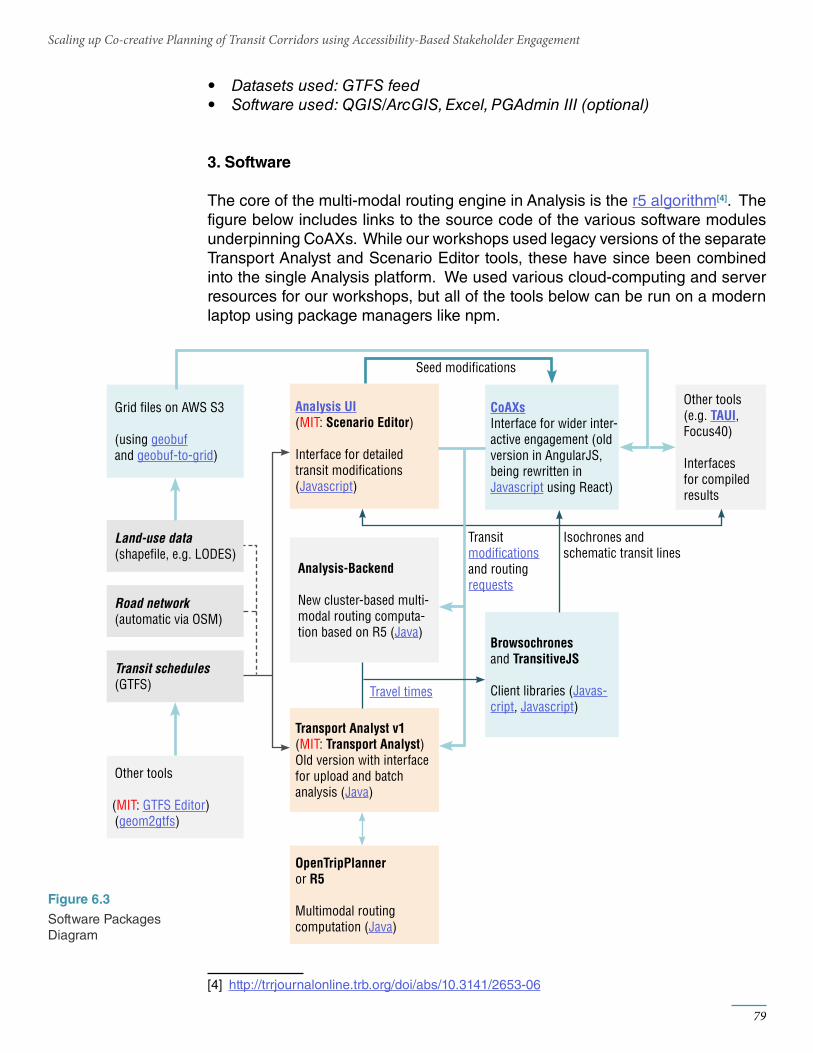
• Datasets used: GTFS feed• Software used: QGIS/ArcGIS, Excel, PGAdmin III (optional)
3. Software
The core of the multi-modal routing engine in Analysis is the r5 algorithm[4]. The figure below includes links to the source code of the various software modules underpinning CoAXs. While our workshops used legacy versions of the separate Transport Analyst and Scenario Editor tools, these have since been combined into the single Analysis platform. We used various cloud-computing and server resources for our workshops, but all of the tools below can be run on a modern laptop using package managers like npm.
[4] http://trrjournalonline.trb.org/doi/abs/10.3141/2653-06
79
Scaling up Co-creative Planning of Transit Corridors using Accessibility-Based Stakeholder Engagement
Grid files on AWS S3
(using geobufand geobuf-to-grid)
Land-use data(shapefile, e.g. LODES)
Road network(automatic via OSM)
Transit schedules(GTFS)
Other tools
(MIT: GTFS Editor)(geom2gtfs)
Transit modificationsand routing requests
Isochrones and schematic transit lines
Seed modifications
Travel times
Other tools(e.g. TAUI, Focus40)
Interfaces for compiled results
Analysis-Backend
New cluster-based multi-modal routing computa-tion based on R5 (Java)
Analysis UI(MIT: Scenario Editor)
Interface for detailed transit modifications (Javascript)
Transport Analyst v1(MIT: Transport Analyst)Old version with interface for upload and batch analysis (Java)
OpenTripPlanneror R5
Multimodal routing computation (Java)
CoAXsInterface for wider inter-active engagement (old version in AngularJS, being rewritten in Javascript using React)
Browsochrones and TransitiveJS
Client libraries (Javas-cript, Javascript)
Software Packages Diagram
Figure 6.3