Embed Size (px)
Citation preview

Cobram Crossroads Report, November 2019 1
SIAN WRIGHT, LISA BOURKE, KRISTEN GLENISTER & DAVID SIMMONS
Department of Rural Health
CobramCrossroads II A population health study

2 Department of Rural Health
Cover image: ISTOCK.

Cobram Crossroads Report, November 2019 3
TABLE OF CONTENTS
TABLE OF CONTENTS .................................................................................................................................................................. 3
LIST OF TABLES and FIGURES .................................................................................................................................................... 4
ACKNOWLEDGEMENTS ............................................................................................................................................................... 5
A NOTE OF THANKS… ........................................................................................................................................................... 5
EXECUTIVE SUMMARY ................................................................................................................................................................. 6
INTRODUCTION ........................................................................................................................................................................... 7
WHAT WAS THE STUDY ABOUT? ........................................................................................................................................... 7
METHODS .................................................................................................................................................................................... 8
HOW WAS THE STUDY UNDERTAKEN? ................................................................................................................................. 8
RESULTS ...................................................................................................................................................................................... 9
WHAT DID THE STUDY FIND? ................................................................................................................................................. 9
The Participants ................................................................................................................................................................. 9
Community ....................................................................................................................................................................... 10
Health ............................................................................................................................................................................... 11
Use of Health Services .....................................................................................................................................................15
Access to Health Services ................................................................................................................................................ 20
General Compliments and Concerns .............................................................................................................................. 21
Health Behaviours ...........................................................................................................................................................22
Children’s Health ..............................................................................................................................................................25
Clinic Results .................................................................................................................................................................... 26
CONCLUSION .............................................................................................................................................................................28
RECOMMENDATIONS ...........................................................................................................................................................29
REFERENCES .............................................................................................................................................................................30
4 Department of Rural Health
LIST OF TABLES and FIGURES
Table 1: Characteristics of the Cobram respondents: Crossroads II compared with Crossroads I and 2016 Census Data 10
Table 2: Self-reported health status by Cobram participants, Crossroads I, Crossroads II and Victoria ............................ 11
Figure 1: Reported levels of happiness for Crossroads I and Crossroads II ...........................................................................12
Table 3: Health checks reported by respondents in the past two years for Crossroads I and Crossroads II ......................13
Table 4: Health conditions reported by respondents in Crossroads I and II ......................................................................... 14
Figure 2: Satisfaction with hospital stay among those hospitalised in past year (Crossroads II). ....................................... 17
Table 5: Distance reported travelled to key health services, in percent (Crossroads II) ...................................................... 20
Table 6: Frequency of take-away food as a main meal, comparing Crossroads I and Crossroads II ....................................22
Table 7: Consumption of Vegetables for Adults, Crossroads II, Crossroads I and Victoria ...................................................22
Table 8: Consumption of Fruit, Crossroads I, Crossroads II and Victoria ...............................................................................23
Table 9: Consumption of Dairy Products for Adults, Crossroads II and Crossroads I ...........................................................23
Table 10: Smoking status, Crossroads II, Crossroads I and Victoria2 .................................................................................... 24
Cobram Crossroads Report, November 2019 5
ACKNOWLEDGEMENTS
A NOTE OF THANKS…The researchers and all involved with this project would like to sincerely thank all the participants who generously gave their time and shared their stories. Many invited us into their homes, shared personal details and came to our clinic for several hours after fasting the previous night. We are indebted to you all and thank you for your participation.
We thank all our fieldworkers who assisted with data collection and were professional in their approach to data collection for this study, namely Veronica Coady, Fulya Torun, Zahra Ali, Delia Allen, Jayden Andrew, Shane Barbary, Lauren Barker, Felicity Booth, Lou Bush, Amanda Clarkson, Nicole Dalle-Nogare, Madhulika Golhar, Priscilla Howden, Terry James, Viv Jeffries, James Kolacz, Lisa McCoy, Jill McFarlane, Angela Magoga, Zubaidah Mohamed Shaburdin, Bruce Naylor, Patricia Patt, Lyn Pierce, Karen Quinlan and Catherine Sambell. We thank the staff at Cobram District Health (now NCN Health - Cobram Campus) who supported our clinics by opening buildings, workings as blood takers and generally supporting the study. We are appreciative of the contribution of Melissa Langford who assisted with the pathology service. We thank the Dental staff from Goulburn Valley Health (GVH) for supporting and contributing to our clinics, including Dr David Whelan, Dr Setareh Moktarani, Steph Veale, Dr Alan Tran, Dr Aditya Athale and Rose McDonald. We also thank Jack Herry-Carscallen and Dunya Tomic for assistance with data entry. We are very grateful to the clinicians who reviewed results and provided medical expertise at no cost including Professor Bill Adam, Dr Cathy Turnbull, Dr Helen Malcolm, Associate Professor Les Bolitho, Dr Ammar Majeed and Dunya Tomic. And we thank Leigh Rhode for supporting the development and set up of this project with GVH and the Dental research.
This research was funded by the National Health and Medical Research Council (NHMRC) and local health and local community partners, including Cobram District Health, Moira Shire, Goulburn Valley Health, Primary Care Connect, Benalla Health, Seymour Health, Goulburn Valley Primary Care Partnerships, Shepparton Access, City of Greater Shepparton, Alfred Health and the Department of Rural Health, The University of Melbourne. We thank the partners for their support, cooperation and direction of this project and hope the data is useful for service planning and improvement. The research acknowledges the Australian Government Department of Health’s Rural Health Multidisciplinary Training Programme.
6 Department of Rural Health
EXECUTIVE SUMMARY
Crossroads II is a study of health, use of health services and undiagnosed disease in rural and regional communities in northern Victoria. It was conducted in 2016 – 2018 as a follow up of a baseline study, Crossroads I, conducted between 2001 and 2003. The aim of this report is to provide local health services and local governments with information about the health of local residents and health needs in the community. Comparison to the original Crossroads I study also enables assessment of whether health care use has increased since the first study.
Households in Cobram township were randomly selected from council lists and visited by university researchers who asked a range of questions. Following, an adult was randomly selected and invited to a health screening clinic where key health tests were conducted. This study reports on 431 residents of Cobram who completed an extensive health questionnaire and 121 adults who attended a screening clinic in 2017 and 2018. While a small sample and more likely female and older, the respondents were selected randomly and visited repeatedly to achieve a response rate of 60% for the household questionnaire and 67% for the clinic.
The findings suggest that residents of Cobram have higher rates of chronic conditions than 15 years earlier. Similar to other rural regions, health behaviours remain a challenge and the increase in obesity is concerning. This study found greater access to services and increased utilisation of health services than the earlier Crossroads I study. Concerns about access to medical specialists locally and quality of care were identified. Like many rural communities, mental health conditions were reported to have increased while the use of mental health services was low. Despite these findings, residents of Cobram reported they are happy and generally healthy.
We acknowledge the hard work of local health services, local health practitioners and the local Shire to provide services, increase access to services and provide appropriate health care, as demonstrated through the new GP clinic, the new Rehabilitation Centre, increased access to GPs, medical specialists and allied health professionals, development of telehealth services and a range of initiatives in the local area focused on health care, aged care and healthy living since Crossroads I. With this in mind, three recommendations are proposed:
1. strategies to improve management of chronic disease in Cobram are developed for all ages;
2. strategies to increase access to quality health services are considered, particularly in relation to mental health and health promotion;
3. strategies to improve health behaviours are enhanced, including fun, community activity programs in Cobram to engage people of all ages in exercise and social participation.

Cobram Crossroads Report, November 2019 7
INTRODUCTION
WHAT WAS THE STUDY ABOUT?While it is well known that rural residents have less access to health services, lower rates of health service utilisation and poorer health outcomes, there is little accurate health data about specific rural places and populations.1-3 This study was undertaken in partnership with Cobram District Health and Moira Shire to provide improved understanding of the health of the local population and assist in planning for services in the coming years.
Crossroads II (2016 – 2018) is a study of health, use of health services and undiagnosed disease in rural and regional communities in northern Victoria. It is a follow up of a baseline study conducted between 2001 and 2003. The original study, Crossroads I, investigated residents of Shepparton, Mooroopna and the six surrounding shire capitals, including Cobram, to provide local health services with information about the health status of local residents and the needs of the community. Crossroads II revisited the towns of Cobram, Benalla, Seymour, Shepparton and Mooroopna to determine whether health care use and access had improved since the first study and to provide further information about health needs for future planning for the communities.
The population of Cobram at the time of the original study was 4,554 people which increased to 5,375 by 2016.4 Cobram District Hospital had 30 acute beds in 2003 and provided obstetric and maternity services, a nursing home care unit, a domiciliary care service and few allied health services. There were 4.6 full time equivalent practicing GPs. At the time of Crossroads II, Cobram District Health had 12 acute beds which includes an Urgent Care Centre, Palliative Care Suite, Day Procedure Unit and two Transitional Care Program beds designed to assist older patients regain independence following admission to the hospital. There was a 30-bed aged care unit which included one respite care bed. Cobram District Health also provided a GP clinic with seven qualified GPs and one GP registrar. There were two other clinics in Cobram, Alpha Medical Centre and Mivo Park Medical Clinic, which both had two GPs each. Allied health professionals available in Cobram included: physiotherapists, speech pathologist, podiatrist, social worker, community health and district nursing services. Dental services were also provided for both public and private patients.
This study was undertaken before the merging of Cobram, Nathalia and Numurkah health centres to form NCN Health and was undertaken in partnership with Cobram District Health (now NCN Health - Cobram Campus) and Moira Shire. This report provides an overview of the findings of Crossroads II with comparisons to Crossroads I where available. Headings are used throughout so that readers can find the information they are interested in. It is anticipated that this information will be useful in identifying key health needs in Cobram and for planning health services into the future.

8 Department of Rural Health
METHODS
HOW WAS THE STUDY UNDERTAKEN?For Crossroads II, 637 houses were randomly selected from a council list which included 349 Cobram households that participated in the original Crossroads I study. Of the 637 selected households, 531 were eligible to participate; addresses removed from the study included those that had been changed from residential to business, were vacant at the time of being visited and those whose residents had not lived in the locality for a minimum of six months. Trained research assistants approached each household in pairs to ask all adult residents for participation in the study. Where residents were not home or the time was inconvenient, multiple follow up visits were made to contact all adults in the household. Interviewers asked a set of questions about health conditions, service use, concerns about health care and other wellbeing, social participation and demographic questions. Using this method, 316 of the 531 eligible households participated in the questionnaire for a response rate of 60%. A total of 431 adults were surveyed from these 316 households.
For those households completing the questionnaire, a randomly selected adult (using a random number generator at the household) was also invited to a health screening clinic. The clinics were held at the new Moira Rehabilitation Centre at Cobram District Health. A series of health assessments were conducted, including tests for blood pressure, height and weight, psychological distress, hearing impairment, lung function, cognitive function and diabetes. At the conclusion of the clinic, participants were offered breakfast. A total of 180 participants were invited to the clinic and 121 attended and completed the clinic (response rate 67%).
Both the household survey and the clinics were conducted between March 2017 and October 2018. Measures were based on the original Crossroads I study which was conducted in 2001-2003. For more detail on the methods of this study, see Glenister et al.5 Data were recorded into a large dataset and then cleaned and coded. Analysis of each question has been undertaken and the response to most questions is presented in this report. Further, most questions have been tested statistically for differences between males and females (t-test) and across age (Pearson’s r); only where a statistically significant and substantive difference was found, it is noted in the report. In addition, comparison to Crossroads I (2001-2003) is presented where possible.
Cobram Crossroads Report, November 2019 9
RESULTS
WHAT DID THE STUDY FIND?
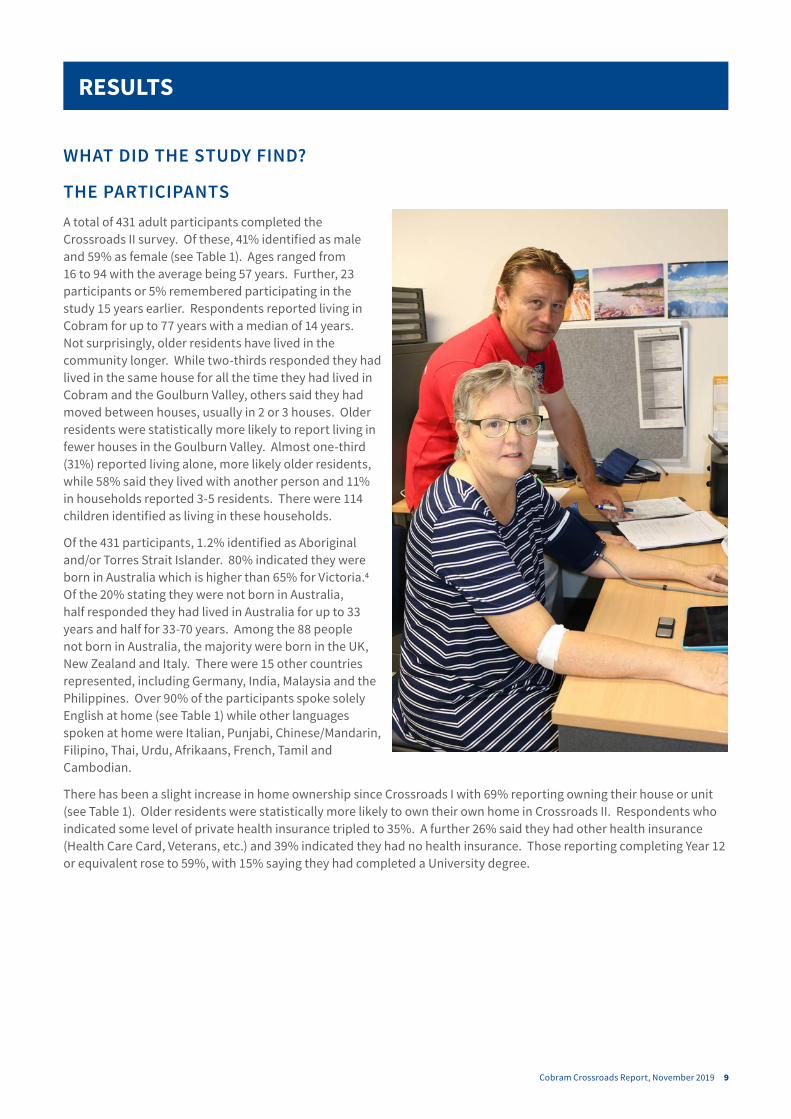
THE PARTICIPANTSA total of 431 adult participants completed the Crossroads II survey. Of these, 41% identified as male and 59% as female (see Table 1). Ages ranged from 16 to 94 with the average being 57 years. Further, 23 participants or 5% remembered participating in the study 15 years earlier. Respondents reported living in Cobram for up to 77 years with a median of 14 years. Not surprisingly, older residents have lived in the community longer. While two-thirds responded they had lived in the same house for all the time they had lived in Cobram and the Goulburn Valley, others said they had moved between houses, usually in 2 or 3 houses. Older residents were statistically more likely to report living in fewer houses in the Goulburn Valley. Almost one-third (31%) reported living alone, more likely older residents, while 58% said they lived with another person and 11% in households reported 3-5 residents. There were 114 children identified as living in these households.
Of the 431 participants, 1.2% identified as Aboriginal and/or Torres Strait Islander. 80% indicated they were born in Australia which is higher than 65% for Victoria.4 Of the 20% stating they were not born in Australia, half responded they had lived in Australia for up to 33 years and half for 33-70 years. Among the 88 people not born in Australia, the majority were born in the UK, New Zealand and Italy. There were 15 other countries represented, including Germany, India, Malaysia and the Philippines. Over 90% of the participants spoke solely English at home (see Table 1) while other languages spoken at home were Italian, Punjabi, Chinese/Mandarin, Filipino, Thai, Urdu, Afrikaans, French, Tamil and Cambodian.
There has been a slight increase in home ownership since Crossroads I with 69% reporting owning their house or unit (see Table 1). Older residents were statistically more likely to own their own home in Crossroads II. Respondents who indicated some level of private health insurance tripled to 35%. A further 26% said they had other health insurance (Health Care Card, Veterans, etc.) and 39% indicated they had no health insurance. Those reporting completing Year 12 or equivalent rose to 59%, with 15% saying they had completed a University degree.
10 Department of Rural Health
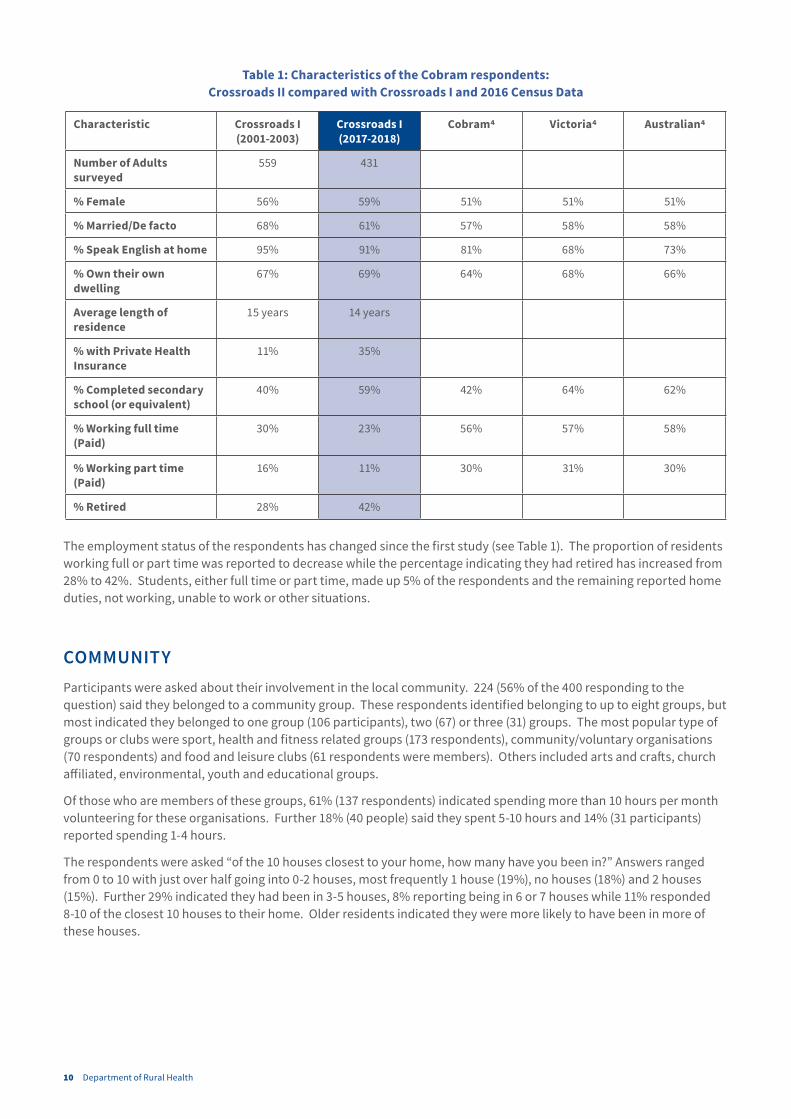
Table 1: Characteristics of the Cobram respondents: Crossroads II compared with Crossroads I and 2016 Census Data
Characteristic Crossroads I (2001-2003)
Crossroads I (2017-2018)
Cobram4 Victoria4 Australian4
Number of Adults surveyed
559 431
% Female 56% 59% 51% 51% 51%
% Married/De facto 68% 61% 57% 58% 58%
% Speak English at home 95% 91% 81% 68% 73%
% Own their own dwelling
67% 69% 64% 68% 66%
Average length of residence
15 years 14 years
% with Private Health Insurance
11% 35%
% Completed secondary school (or equivalent)
40% 59% 42% 64% 62%
% Working full time (Paid)
30% 23% 56% 57% 58%
% Working part time (Paid)
16% 11% 30% 31% 30%
% Retired 28% 42%
The employment status of the respondents has changed since the first study (see Table 1). The proportion of residents working full or part time was reported to decrease while the percentage indicating they had retired has increased from 28% to 42%. Students, either full time or part time, made up 5% of the respondents and the remaining reported home duties, not working, unable to work or other situations.
COMMUNITYParticipants were asked about their involvement in the local community. 224 (56% of the 400 responding to the question) said they belonged to a community group. These respondents identified belonging to up to eight groups, but most indicated they belonged to one group (106 participants), two (67) or three (31) groups. The most popular type of groups or clubs were sport, health and fitness related groups (173 respondents), community/voluntary organisations (70 respondents) and food and leisure clubs (61 respondents were members). Others included arts and crafts, church affiliated, environmental, youth and educational groups.
Of those who are members of these groups, 61% (137 respondents) indicated spending more than 10 hours per month volunteering for these organisations. Further 18% (40 people) said they spent 5-10 hours and 14% (31 participants) reported spending 1-4 hours.
The respondents were asked “of the 10 houses closest to your home, how many have you been in?” Answers ranged from 0 to 10 with just over half going into 0-2 houses, most frequently 1 house (19%), no houses (18%) and 2 houses (15%). Further 29% indicated they had been in 3-5 houses, 8% reporting being in 6 or 7 houses while 11% responded 8-10 of the closest 10 houses to their home. Older residents indicated they were more likely to have been in more of these houses.
Cobram Crossroads Report, November 2019 11
The 121 participants at the screening clinic were asked about their satisfaction with local facilities. Overall:
• 63% were satisfied with local schools
• 62% were satisfied with the local hospital
• 55% were satisfied with local exercise facilities
• 27% were satisfied with local entertainment
• 24% were satisfied with local government
• 19% were satisfied with public transport locally
Older residents were more likely to be more satisfied with the local hospital and local entertainment. Compared to the earlier Crossroads I study, satisfaction with local schools and the local hospital were similar, 61% and 64% respectively in Crossroads I. Satisfaction with exercise facilities (64%) and public transport (27%) had decreased somewhat while satisfaction with local entertainment (46%) and local government (42%) had decreased substantially since the earlier study.
Clinic participants were also asked if they would be sorry to leave this community; 84% indicated they would be sorry or very sorry to leave. Older residents indicated they were more likely to be sorry to leave Cobram while young people were more likely to be planning to leave Cobram. Further, when clinic participants were asked, 9% said they plan to leave.
HEALTH
Overall health and happiness
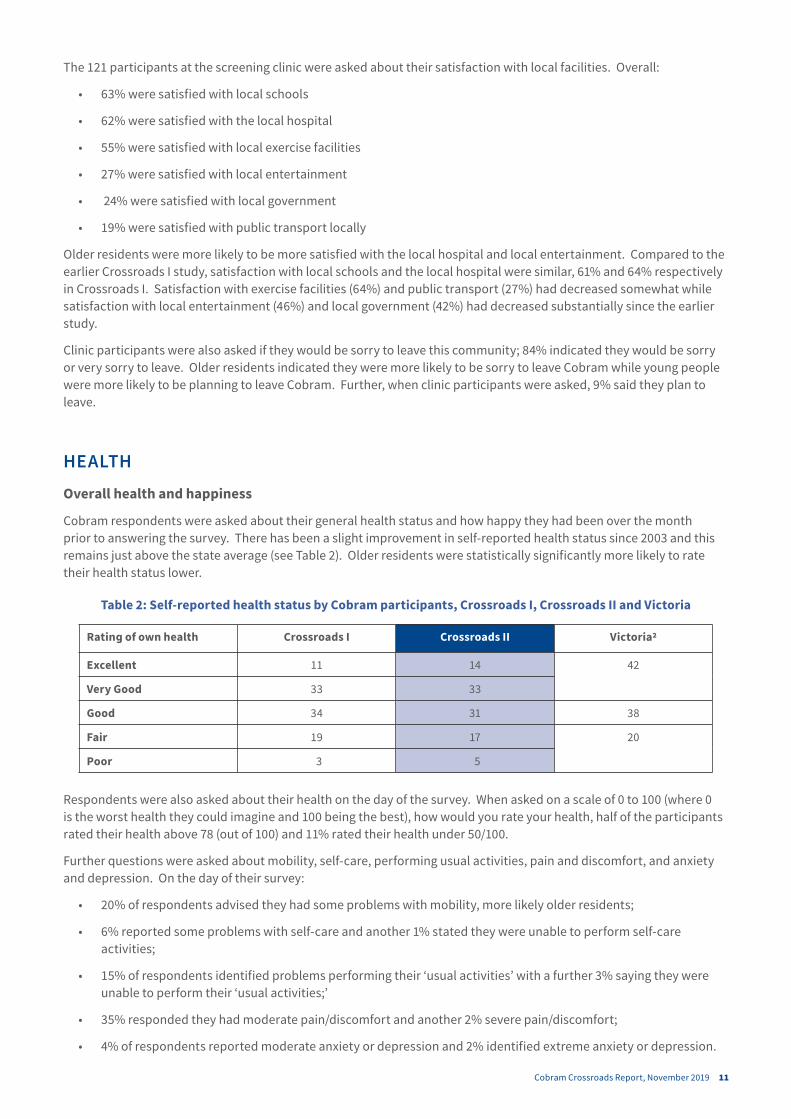
Cobram respondents were asked about their general health status and how happy they had been over the month prior to answering the survey. There has been a slight improvement in self-reported health status since 2003 and this remains just above the state average (see Table 2). Older residents were statistically significantly more likely to rate their health status lower.
Table 2: Self-reported health status by Cobram participants, Crossroads I, Crossroads II and Victoria
Rating of own health Crossroads I Crossroads II Victoria2
Excellent 11 14 42
Very Good 33 33
Good 34 31 38
Fair 19 17 20
Poor 3 5
Respondents were also asked about their health on the day of the survey. When asked on a scale of 0 to 100 (where 0 is the worst health they could imagine and 100 being the best), how would you rate your health, half of the participants rated their health above 78 (out of 100) and 11% rated their health under 50/100.
Further questions were asked about mobility, self-care, performing usual activities, pain and discomfort, and anxiety and depression. On the day of their survey:
• 20% of respondents advised they had some problems with mobility, more likely older residents;
• 6% reported some problems with self-care and another 1% stated they were unable to perform self-care activities;
• 15% of respondents identified problems performing their ‘usual activities’ with a further 3% saying they were unable to perform their ‘usual activities;’
• 35% responded they had moderate pain/discomfort and another 2% severe pain/discomfort;
• 4% of respondents reported moderate anxiety or depression and 2% identified extreme anxiety or depression.

12 Department of Rural Health
The majority of respondents indicated they were happy (see Figure 1). One quarter (25%) rated themselves as ‘very happy’ and 44% rated themselves as ‘happy’. A further 7% indicated they were ‘somewhat happy’ and 17% regarded themselves as ‘mixed’. 6% rated themselves unhappy, including 2% saying ‘somewhat unhappy,’ 2% responding ‘unhappy’ and 2% replying ‘very unhappy.’ Interestingly, happiness was not correlated with age. Comparing these findings to Crossroads I, a higher proportion of respondents rated themselves as happy or very happy than in the earlier study in 2001-2003.
Figure 1: Reported levels of happiness for Crossroads I and Crossroads II
10
Respondents were also asked about their health on the day of the survey. When asked on a scale of 0 to 100 (where 0 is the worst health they could imagine and 100 being the best), how would you rate your health, half of the participants rated their health above 78 (out of 100) and 11% rated their health under 50/100.
Further questions were asked about mobility, self-care, performing usual activities, pain and discomfort, and anxiety and depression. On the day of their survey:
• 20% of respondents advised they had some problems with mobility, more likely older residents;
• 6% reported some problems with self-care and another 1% stated they were unable to perform self-care activities;
• 15% of respondents identified problems performing their ‘usual activities’ with a further 3% saying they were unable to perform their ‘usual activities;’
• 35% responded they had moderate pain/discomfort and another 2% severe pain/discomfort;
• 14% of respondents reported moderate anxiety or depression and 2% identified extreme anxiety or depression.
The majority of respondents indicated they were happy (see Figure 1). One quarter (25%) rated themselves as ‘very happy’ and 44% rated themselves as ‘happy’. A further 7% indicated they were ‘somewhat happy’ and 17% regarded themselves as ‘mixed’. 6% rated themselves unhappy, including 2% saying ‘somewhat unhappy,’ 2% responding ‘unhappy’ and 2% replying ‘very unhappy.’ Interestingly, happiness was not correlated with age. Comparing these findings to Crossroads I, a higher proportion of respondents rated themselves as happy or very happy than in the earlier study in 2001-2003.
Figure 1: Reported levels of happiness for Crossroads I and Crossroads II
0
5
10
15
20
25
30
35
40
45
Very happy Happy Somewhathappy
Mixed Somewhatunhappy
Unhappy Very unhappy
Perc
ent
Level of Happiness
Crossroads I (%) Crossroads II (%)

Cobram Crossroads Report, November 2019 13
Health Checks and Screening
Most, 87% of respondents, indicated they had been immunised for childhood diseases. 60% informed the study they had been immunised for influenza in the previous 12 months. In addition, 26% reported they had a pneumonia vaccine in the previous 5 years and 57% had a tetanus vaccine in the previous 10 years. Older residents were more likely to report being immunised for influenza in the past year. They were also more likely to indicate having a pneumonia vaccine in the past five years.
Participants were asked about the health checks they had undergone in the past two years. Generally, this has increased during the 15 years between Crossroads I and II (see Table 3). With the exception of pap smears, older participants were statistically significantly more likely to have had each of these checks in the past two years. Women were less likely to have been checked for skin conditions.
Screening rates were examined for particular age and gender groups. For men aged 50 years and over, 62% reported having a bowel examination and 82% indicated having a prostate check in the past two years. Among women 50 years and over, 60% responded they had had a bowel examination and 70% indicated they had had a mammogram in the past two years. Of women under 50 year of age, 57% reported having pap smear in the past two years.
Table 3: Health checks reported by respondents in the past two years for Crossroads I and Crossroads II
Rating of own health Crossroads I (%) Crossroads II (%)
Blood pressure check 89 93
Cholesterol check 60 78
Diabetes/high blood sugar 55 69
Bowel examination 22 43
Skin examination for lesions or cancers 33 44
Females having a mammogram 71 50
Males having a prostate check 63 61
Females having a pap smear 56 50
Key Health Conditions
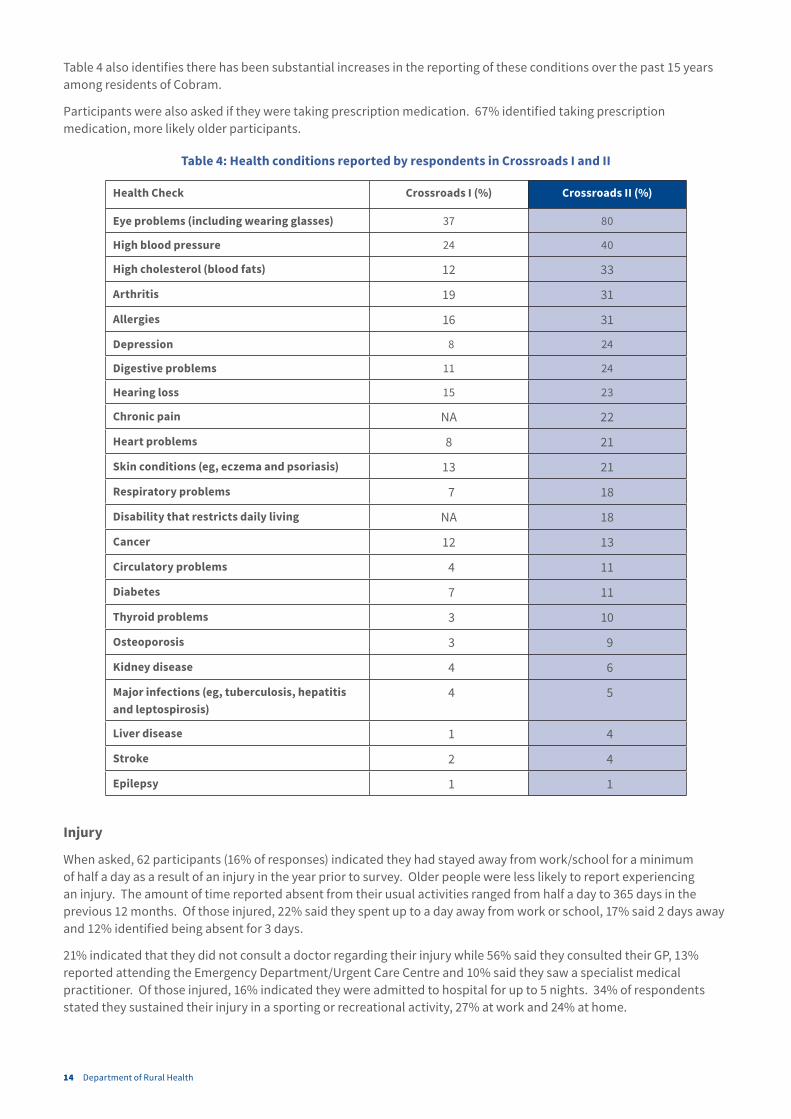
The participants were asked if they had a range of medical conditions, which they may have been treated for in the past or were currently being treated for (see Table 4). Older people were statistically significantly more likely to identify having many of these conditions, specifically (in order of strongest correlation to lower correlation) high blood pressure, eye problems, high cholesterol, arthritis, heart, osteoporosis, cancer, digestive problems and disability. Women were more likely to identify having eye problems while men were more likely to report having a heart condition.
14 Department of Rural Health
Table 4 also identifies there has been substantial increases in the reporting of these conditions over the past 15 years among residents of Cobram.
Participants were also asked if they were taking prescription medication. 67% identified taking prescription medication, more likely older participants.
Table 4: Health conditions reported by respondents in Crossroads I and II
Health Check Crossroads I (%) Crossroads II (%)
Eye problems (including wearing glasses) 37 80
High blood pressure 24 40
High cholesterol (blood fats) 12 33
Arthritis 19 31
Allergies 16 31
Depression 8 24
Digestive problems 11 24
Hearing loss 15 23
Chronic pain NA 22
Heart problems 8 21
Skin conditions (eg, eczema and psoriasis) 13 21
Respiratory problems 7 18
Disability that restricts daily living NA 18
Cancer 12 13
Circulatory problems 4 11
Diabetes 7 11
Thyroid problems 3 10
Osteoporosis 3 9
Kidney disease 4 6
Major infections (eg, tuberculosis, hepatitis and leptospirosis)
4 5
Liver disease 1 4
Stroke 2 4
Epilepsy 1 1
Injury
When asked, 62 participants (16% of responses) indicated they had stayed away from work/school for a minimum of half a day as a result of an injury in the year prior to survey. Older people were less likely to report experiencing an injury. The amount of time reported absent from their usual activities ranged from half a day to 365 days in the previous 12 months. Of those injured, 22% said they spent up to a day away from work or school, 17% said 2 days away and 12% identified being absent for 3 days.
21% indicated that they did not consult a doctor regarding their injury while 56% said they consulted their GP, 13% reported attending the Emergency Department/Urgent Care Centre and 10% said they saw a specialist medical practitioner. Of those injured, 16% indicated they were admitted to hospital for up to 5 nights. 34% of respondents stated they sustained their injury in a sporting or recreational activity, 27% at work and 24% at home.

Cobram Crossroads Report, November 2019 15
The proportion reporting injuries in the current study (16%) is a slight increase from Crossroads I where 14% described staying away from work/school due to injury. Of these, 16% indicated they spent up to a day away from work or school, 16% said 2 days away and 8% identified being absent for 3 days in Crossroads I. While 14% said they did not consult a doctor, others reported consulting a GP (39%), the Emergency Department/Urgent Care Centre (10%) or a specialist medical practitioner (13%). In this previous study, 24% reported being admitted to hospital for up to 14 nights. Work place injuries were recorded to be more common (53%) while 23% reported the injury occurring at home and 14% during sport or recreational activities.
USE OF HEALTH SERVICES
GP Usage
Of the 431 surveyed, 95% said they had visited a GP in the previous 12 months. Age was not correlated with GP use. Of those reporting using a GP, 97% said they used a GP in Cobram with 65% indicating they only saw a GP in Cobram. Respondents also said they consulted GPs in Shepparton, Numurkah, Tocumwal, Yarrawonga, Berrigan, Tatura, Kyneton, Melbourne, Sydney and Finley. Two thirds (66%) of respondents said they had seen one GP in the past year while 22% said they had seen two GPs, 9% said 3 GPs and 3% said 4 or more. The most frequent reasons identified for seeing more than one GP were availability of appointments, preferred GP was not always available, or GP was away or had left.
Half of respondents reported visiting their GP up to 4 times in the past year and half indicated visiting 4 times or more. Whilst the longest period of time reported to wait to see a GP (from the time of making an appointment) was a month, 43% said they were able to see a GP either the same day or the next day. A further 19% said they waited up to 2 days and another 31% responded waiting up to a week. Delays to see a GP were identified as being due to wanting to see a specific doctor. Respondents often chose to see an alternative to their preferred doctor if they needed an appointment in a short time frame. 5% of respondents pre-booked their GP appointments to ensure they saw their preferred GP.
Of those using a GP, 86% of respondents indicated they were bulk billed, more likely older residents. Further, most were satisfied with their GP: 92% said they were either very satisfied (57%) or satisfied (35%). In another question, 46% rated their confidence in their GP as excellent, 32% as very good and 17% good.

16 Department of Rural Health
Specialist Medical Practitioner
In the previous 12 months, 44% (189) of respondents indicated that they attended an appointment with at least one medical specialist. Participants who were older were more likely to state they had seen a specialist. This is higher than 35% stating they visited a specialist in the Crossroads I study. In the current study, a third said they visited this medical specialist once in the past year while 90% reported visiting this specialist 4 times or less. The time waiting for an appointment was reported to be up to five months, but most were able to make an appointment within 4 weeks. Further, 92% were very satisfied (66%) or satisfied (26%) with their medical specialist. 52% of the appointments were reported to be in Shepparton, with either Shepparton based consultants or visiting specialists from Melbourne; 21% of the appointments were said to be in Melbourne; 10% in Wangaratta; 6% in Cobram and 6% in Albury. Other locations identified included Yarrawonga, Echuca, Benalla, Wodonga and out of state (Queensland).
In addition, 61 respondents indicated visiting a second medical specialist in the past year, again more likely older participants. Half said they saw this specialist once and most three times or less. Time to get this appointment was reported as up to six months, but most said they waited 45 days or less. These medical specialists were said to be seen in Cobram by 7 (including by telehealth) as well as in Yarrawonga (1), Shepparton (22), Wangaratta (3), Benalla (1), Albury-Wodonga (8), Melbourne (17) and interstate (2). Again, 92% were very satisfied (69%) or satisfied (23%) with the medical specialist.
In the previous year, 12 said they saw three specialist medical practitioners. Most indicated visiting this third specialist three times or less, in Shepparton (5), Wangaratta (2), Albury-Wodonga (2) and Melbourne (3). They responded waiting up to three months for an appointment but most waited two weeks or less. All were satisfied with this medical specialist.
Hospital Outpatient Clinic
24% (104) of respondents said they attended a hospital outpatients’ clinic for an appointment. Exactly half reported visiting outpatients once in the past year, 18 said they visited twice, 15 responded three times and the others indicated visiting up to 40 times, usually 4-6 times, in the past year. Of these, 28 people said they did not wait for an appointment and 28 indicated they attended a pre-booked appointment. Waiting times for others were reported to vary from 1 day to 6 months. Overall, 94% were satisfied with outpatient services. Appointment locations were identified as Cobram 41%, Shepparton 38%, Melbourne 10% and Wangaratta 4%. Other locations reported included Benalla, Kyabram, Yarrawonga, Albury and interstate, and some went to more than one location.
Hospital Day Surgery
67 respondents, or 16%, identified that they had had day surgery during the previous 12 months. Most said they had undergone day surgery once (78%) or twice (15%). Waiting times for their surgery were reported to range from no waiting time (7%) to 12 months (1%) but over half conveyed waiting a month or less. Surgery was said to be performed in Shepparton 41% of the time, in Cobram 24% of the time, Melbourne 11%, Wangaratta 7%, Albury 6% and Numurkah 6% of the time. Other locations were Kyabram, Benalla and interstate. Overall, 68% were very satisfied with their day surgery experience and a further 22% were satisfied.
Emergency Department/Urgent Care Centre
91 respondents (23%) reported using a hospital Emergency Department (ED) or Urgent Care Centre (UCC) in the past year. This is slightly higher than 19% using the ED in the earlier Crossroads study in 2001-2003. Of the 91 respondents, 60 said they had used the UCC in Cobram, 27 the ED in Shepparton and 4 the ED in Wangaratta. Most (65 respondents) said they had used an ED/UCC once, while 18 said twice, seven reported using an ED/UCC 3-6 times and one person responded 30 times in the past year.
For 17 of these 91 respondents, they suggested their use of ED/UCC was related to a previous hospital admission. Further, 64 suggested that follow-up information was provided at the ED/UCC visit.
When asked, 56 of the 91 using an ED/UCC said they saw a doctor within an hour of presentation while 17 responded seeing a doctor within 1-3 hours. Further, 15 respondents said they saw the doctor within 3-6 hours and three indicated it was more than six hours until they saw a doctor. When asked about the total time spent in ED/UCC, 15 participants said they were there less than one hour, 32 said 1-3 hours, 24 said 3-6 hours and 20 indicated more than six hours.
All respondents were asked: “Do you have any concerns about the Emergency Department?” This question elicited 506 responses. Almost half, 246 participants, said they had no concerns. Further, 32 advised they did not know or had not used the service and a further 6 had no comment.
Cobram Crossroads Report, November 2019 17
There were 30 positive comments about UCC/ED, including: “can’t fault them”, “Cobram is great…”, “Cobram very attentive and helpful”, “Shepparton – found it was wonderful” and “I have been to the ED and they were very good”.
With regards to the UCC in Cobram, 26 participants suggested the facilities were basic, with one commenting specifically on the lack of out of hours’ pathology and another the lack of out of hours X-Ray facilities. 16 respondents commented on the lengthy wait to see a doctor, 11 commented that the doctor does not always attend, a further 11 felt that the waiting time in Urgent Care was too long and another two felt that a lot of time was wasted. 12 commented on the cost of care being a concern and a further 12 comments were about poor care received. Six felt the ED/UCC was understaffed and another three responded staff lacked training on how to deal with emergencies. Eight participants advised they preferred to go elsewhere. 30 suggested that the response in Urgent Care was to send patients to Goulburn Valley Health in Shepparton, with another two stating they “pick and choose what to treat”.
The use of Goulburn Valley Health Emergency Department led to a number of comments specific to the service: 12 complained of the waiting time, 10 felt the care was substandard, three commented on security issues, two suggested ED was overused, and another said ED was understaffed.
There were 10 comments about the ambulance service transport to ED/UCC: 4 were concerned about the time it took for the ambulance to arrive, 1 felt there were not enough ambulances and 1 related an experience of a poor standard of care. There were 4 positive comments about the ambulance service including the “ambulance is excellent.”
Hospitalisation
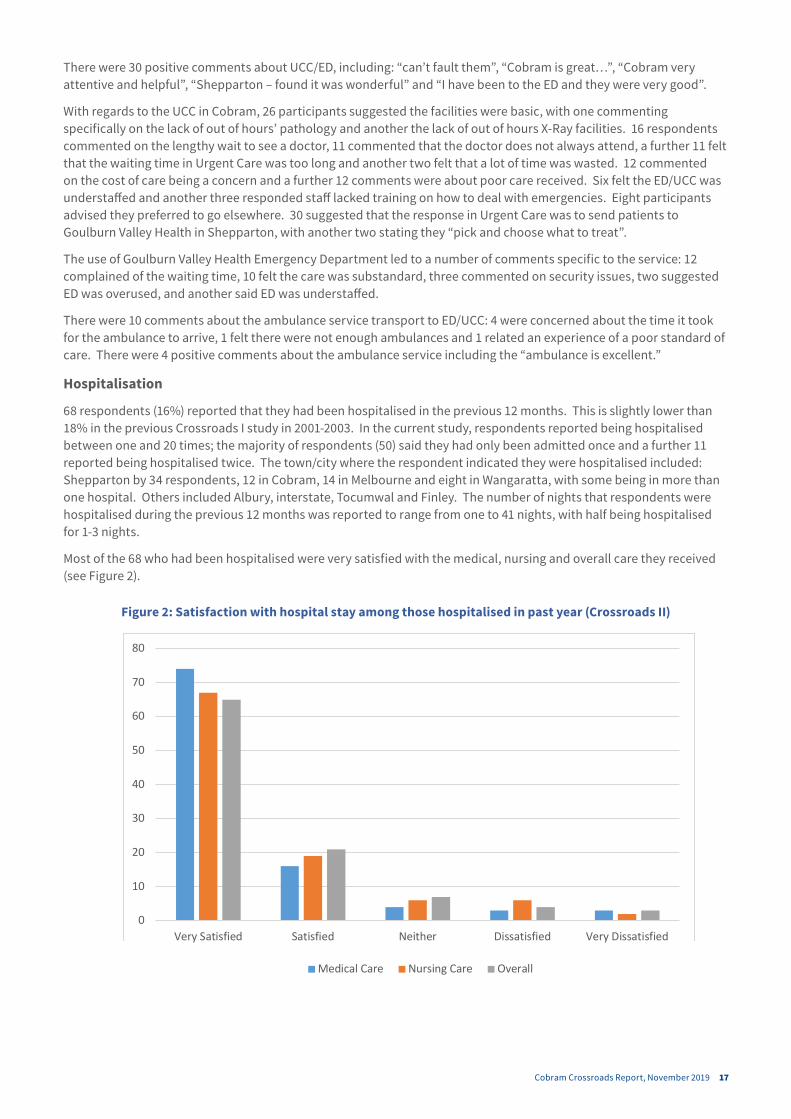
68 respondents (16%) reported that they had been hospitalised in the previous 12 months. This is slightly lower than 18% in the previous Crossroads I study in 2001-2003. In the current study, respondents reported being hospitalised between one and 20 times; the majority of respondents (50) said they had only been admitted once and a further 11 reported being hospitalised twice. The town/city where the respondent indicated they were hospitalised included: Shepparton by 34 respondents, 12 in Cobram, 14 in Melbourne and eight in Wangaratta, with some being in more than one hospital. Others included Albury, interstate, Tocumwal and Finley. The number of nights that respondents were hospitalised during the previous 12 months was reported to range from one to 41 nights, with half being hospitalised for 1-3 nights.
Most of the 68 who had been hospitalised were very satisfied with the medical, nursing and overall care they received (see Figure 2).
Figure 2: Satisfaction with hospital stay among those hospitalised in past year (Crossroads II)
17
Figure 2: Satisfaction with hospital stay among those hospitalised in past year (Crossroads II)
Respondents were asked: “Do you have any concerns about inpatient hospital care?” In response, 294 replied they had no concerns and another 31 stated they had no personal experience or were unable to comment. There were 31 positive comments about care received including: “the nurses were great”; “the nurses here are fantastic” and “palliative care was excellent”. Ten respondents were concerned about the standard of care they received, nine felt the hospital was too small, three indicated the hospital had only basic facilities and another four suggested it was underfunded. Further, seven respondents were concerned about poor communication during their admission and another three comments referred to dissatisfaction with the food. There were also 37 comments about using facilities at other locations; four of these stated they preferred to go elsewhere and eight said they were referred on to Shepparton.
0
10
20
30
40
50
60
70
80
Very Satisfied Satisfied Neither Dissatisfied Very Dissatisfied
Medical Care Nursing Care Overall

18 Department of Rural Health
Respondents were asked: “Do you have any concerns about inpatient hospital care?” In response, 294 replied they had no concerns and another 31 stated they had no personal experience or were unable to comment. There were 31 positive comments about care received including: “the nurses were great”; “the nurses here are fantastic” and “palliative care was excellent”. Ten respondents were concerned about the standard of care they received, nine felt the hospital was too small, three indicated the hospital had only basic facilities and another four suggested it was underfunded. Further, seven respondents were concerned about poor communication during their admission and another three comments referred to dissatisfaction with the food. There were also 37 comments about using facilities at other locations; four of these stated they preferred to go elsewhere and eight said they were referred on to Shepparton.
Mental Health services
Mental health and wellbeing services were reported to be utilised by 51 or 12% of Cobram participants in the past year. Overall, 5% reported using a psychologist, 5% seeing a social worker, 3% consulting a psychiatrist, 2% visiting a welfare officer and 3% using another mental health or wellbeing service, mostly a ‘counsellor’. While 31 said they visited one practitioner, 20 reported using more than one of these services in the past year.
Of the 23 seeing a psychologist, respondents said they visited them up to 12 times in the past year. They said they waited up to 4 months for the initial appointment. While almost half said they visited a psychologist in Cobram, others reported using them in the region (Numurkah, Yarrawonga, Shepparton, Wangaratta and Albury-Wodonga). Most, 91%, were satisfied with their use of a psychologist.
Of the 13 who said they visited a psychiatrist, seven indicated seeing the psychiatrist once or twice in the past year. Others responded seeing them up to 12 times in the past year. Respondents reported waiting between two weeks and five months for the appointment. Five said they accessed the psychiatrist in Cobram (including via telehealth) and another four in Shepparton, one in Wodonga and one in Melbourne. Others said they saw a psychiatrist interstate or in other regions in Victoria.
Dental
Dental care was identified as a need in the earlier Crossroads I study. In Crossroads II, almost half of the respondents (43%) identified that they had seen a dentist or dental professional in the previous 12 months. A further 22% advised they had been to the dentist within the past two years. 30% responded visiting a dentist over two years ago while 1 % said they had never attended a dental appointment and 4% could not remember. In the original Crossroads I study, 36% reported seeing a dentist in the past year, 23% in the past two years while 41% indicated it had been more than two years. The major barriers to attending a dentist were identified as cost (19%), fear (12%), apathy (7%) and time (4%) which are similar to the barriers identified in Crossroads I. In the current study, no respondent identified distance as a barrier.
When asked, 62% of respondents indicated they had all their teeth while 23% said they had some of their teeth and 15% said they did not have their own teeth. Older participants were more likely to report having dentures.
Cobram Crossroads Report, November 2019 19
Other Health Service Usage
Respondents identified using a range of health services within the past year, including:
• Optometrist, 48% (more likely older participants)
• Pharmacist for Advice, 36%
• Registered Nurse, 23%
• Physiotherapist, 20%
• Audiologist, 15% (more likely older participants)
• Chiropractor, 14%
• Ambulance, 12%
• Aged Care Services, 4% (more likely older participants)
• Disability Services, 4%
• Osteopath, 4%
• Exercise Physiologist, 4%
• Acupuncturist, 3%
• Midwife, 2% (less likely older participants)
• Naturopath, 1%
• Speech Therapist, 0.5%
• Aboriginal health Services by 0.2%
In addition, 131 respondents (30%) indicated visiting other health services in the past 12 months. 60 responded visiting a podiatrist and 53 reported having a massage. Other services visited included a dietician, sports/remedial medicine or rehabilitation, diabetes educator, skin clinic, pain management clinic, Chinese medicine and Bowen therapy.
The use of services had increased from the previous Crossroads I study in 2001-2003. In the earlier study, 25% reported visiting an Optometrist, 15% indicated using a pharmacist for advice, 12% seeing a Chiropractor or Osteopath, 10% a Physiotherapist, 6% a Registered Nurse, and 5% said they used an Ambulance in the previous year.
20 Department of Rural Health
ACCESS TO HEALTH SERVICESParticipants were asked how far they travelled to attend appointments with different health services. Most responded that they utilised a local GP, dentist and hospital (see Table 5). Distance to medical specialist were usually more than 50km away, in a regional centre or Melbourne. Age was not correlated with distance to services.
Table 5: Distance reported travelled to key health services, in percent (Crossroads II)
Less than 10km 11-50km 50-100km More than 100km
GP 92 4 3 1
Dentist 79 4 14 3
Medical Specialist 5.5 0.5 61 33
Hospital 78 1 16 5
There were 313 comments about why people travel out of their immediate locality for health services. Two-thirds of these comments referenced the availability of services as a reason for travelling while 56 referred to personal choice, 15 indicated they were long term users of a non-local service and continued to use it even though they no longer lived locally, 11 suggested they received better care elsewhere, nine referred to other more convenient locations due to work or opening hours, and six cited cost of the service.
Participants were also asked if they have access to a car on a daily basis; 94% of respondents indicated they did. They were also asked if they had someone to take care of them. Overall, 91% indicated they had someone to take care of them ‘now and then’ and 83% responded that they had someone to take care of them for ‘a short time and up to six months.’
When asked, “What prevents you from accessing health services?” 468 responses were provided. Of these, the majority (301 respondents) had no problems, eight did not know or use local services and a further person had no comment. A total of 46 respondents commented that the distance to travel for an appointment and/or their ability to access transport was a significant barrier in accessing health care. One respondent talked about a positive experience using the community car. Further, 26 respondents commented that availability of services was a barrier, 11 of these were specific to mental health services, nine referred to allied health professionals and six to specialists. There were 22 participants who commented on having difficulty attending appointments due to work or personal commitments which limited access to services during work hours. Waiting times was mentioned by 16 participants; 10 of these were general, five were specific to specialist medical practitioners and one referred to time taken to get an appointment for an investigation. Cost or lack of bulk billing practices was cited as a factor for 14 participants.

Cobram Crossroads Report, November 2019 21
GENERAL COMPLIMENTS AND CONCERNSOpen ended questions were asked to determine local perspectives Cobram’s health services. Respondents were asked “Do you have any concerns about the medical care provided in this community?” As some respondents gave more than one answer, there were 562 comments from the 431 participants in Cobram. Of the 562 responses, 225 identified no concerns and five said they “didn’t know” or “hadn’t used” the medical services.
There were 21 positive comments which included “good service from doctors”; “happy with the medical care” and “quality of care is good”.
There were 121 comments about General Practitioners, specifically 29 complained about the time it took to get an appointment, 24 were concerned about being “outsourced” to services in other areas with an additional three commenting that GPs refer on rather than deal with things themselves. There were 13 comments about poor communication between the GP and the patient and 11 were concerned about the turnover of GPs locally. Eight participants observed that GPs were of a poor quality, eight stated that GPs were very busy which negatively impacted the care that was provided, eight commented on the cost of attending a GP appointment and eight mentioned the need for out of hours GP services. There were seven comments about the need for more GPs in Cobram, six were concerned about the length of time they waited in the GP surgery for their consultation, three stated that their GP was not accredited with the hospital, three identified that they used services outside of Cobram due to personal choice and one felt they had experienced prejudice by their GP.
There were 84 comments about the lack of specialist services locally. In order of frequency, these comments related to: general comments (38); psychiatry/mental health specialists (13); maternity services (8); aged care services (7); paediatrics (5); cardiology (5); oncology/cancer services (4); orthopaedics (2); rheumatology (1); and gynaecology (1). The difficulties associated with the distance travelled to see a specialist were mentioned by 12 participants. There were also 10 comments about the lengthy waiting time to see a specialist and three others mentioned cost.
There were 66 comments about other services: 26 were about the hospital, of which 12 of these felt the hospital was under resourced, 10 felt the care they received was poor, three stated the hospital was too small/did not have enough beds and one mentioned the cost of attending urgent care. There were nine comments about the ambulance service, five were concerned that the wait for the ambulance was too long, two felt the ambulance crew chose not to respect the wishes of the patient, one felt that the area required an improvement in cover by ambulance services and one said the ambulance crew was not aware of their location leading to delays. There were five comments about the available dental services; three were concerned about the length of the waiting times, one was concerned about the cost of the appointment/treatment and one cited the lack of orthodontist locally. Other comments not directly related to medical care included: four about poor communication and a further two mentioned the attitude of GP clinic staff. There were four comments about the lack of or reduced quality of X-Ray services, three felt there was a lack of information about what services were available locally, three mentioned the poor access to or wait for appointments with allied health professionals and another two specified a lack of social services.
Another question asked: “Do you have any concerns about health services in general?” There were 484 responses of which half, 240, had no concerns, six had not used local health services and six had no comments. 80 participants made comments about the lack of services available. 26 were concerned about the cost of appointments and/or treatment and 24 were concerned about the level of care they received. There were 23 comments about lack of funding for health services, eight of these were specific to the funding of Medicare rather than private health insurance in order to boost the public health system.
22 Department of Rural Health
HEALTH BEHAVIOURS
Diet
Respondents were asked how often they ate takeaway food as a main meal (see Table 6). There was an increase in those having take-away food 1-3 times per week compared to Crossroads I and fewer respondents ‘never’ having take-away food. Older participants were less likely to report eating take away food frequently.
Table 6: Frequency of take-away food as a main meal, comparing Crossroads I and Crossroads II
How often? Crossroads I (%) 2001-2003
Crossroads II (%) 2017-2018
Never 17 11
Less than once a month 34 34
2 – 3 days a month 28 26
1 – 3 days a week 19 29
4 – 6 days a week 1 1
Respondents were asked how many serves of vegetables, fruit and dairy they ate in an average day. The Australian guidelines recommend a minimum daily vegetable intake is five to six serves (depending on gender and age), where a serve is defined as half a cup of cooked vegetables or a cup of green leafy or raw salad vegetables.6 One in 10 respondents in Cobram identified eating the recommended amounts of vegetables in Crossroads II, compared with 8% in rural Victoria and Victoria as a whole of 7% (see Table 7). Women were statistically significantly more likely to report eating more serves of vegetables than men.
Table 7: Consumption of Vegetables for Adults, Crossroads II, Crossroads I and Victoria
Number of serves Crossroads I Crossroads II Rural Victoria2 Victoria2
Don’t eat vegies 1% 1% No data No data
Less than 1 serve No data 7% 6% 7%
1 serve 1 – 3 serves
70%
21% 1 – 2 serves
57%
1 – 2 serves
59%2 serves 30%
3 serves 19% 3 – 4 serves
28%
3 – 4 serves
24%4 serves 4 – 5 serves
25%
12%
5 serves 6% 5+ serves
8%
5+ serves
7%6 or more serves 40% 4%
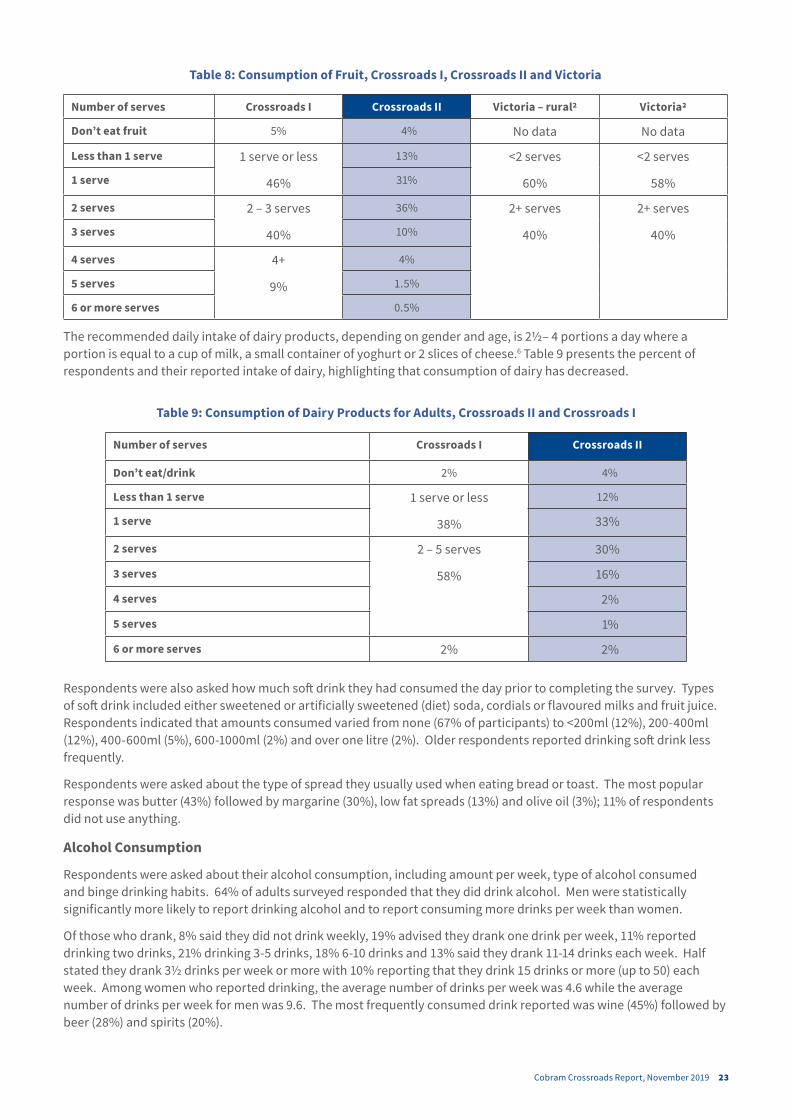
The recommended minimum daily intake of fruit is two serves for people who are 18 years of age or older, where a serve is defined as one medium piece or two small pieces of fruit or one cup of diced pieces.6 Respondents reporting eating the recommended amounts of fruit for Crossroads II was 52%, just higher than Crossroads I (49%) and higher than rural Victoria (40%) and Victoria as a whole (40%) (see Table 8).
Cobram Crossroads Report, November 2019 23
Table 8: Consumption of Fruit, Crossroads I, Crossroads II and Victoria
Number of serves Crossroads I Crossroads II Victoria – rural2 Victoria2
Don’t eat fruit 5% 4% No data No data
Less than 1 serve 1 serve or less
46%
13% <2 serves
60%
<2 serves
58%1 serve 31%
2 serves 2 – 3 serves
40%
36% 2+ serves
40%
2+ serves
40%3 serves 10%
4 serves 4+
9%
4%
5 serves 1.5%
6 or more serves 0.5%
The recommended daily intake of dairy products, depending on gender and age, is 2½– 4 portions a day where a portion is equal to a cup of milk, a small container of yoghurt or 2 slices of cheese.6 Table 9 presents the percent of respondents and their reported intake of dairy, highlighting that consumption of dairy has decreased.
Table 9: Consumption of Dairy Products for Adults, Crossroads II and Crossroads I
Number of serves Crossroads I Crossroads II
Don’t eat/drink 2% 4%
Less than 1 serve 1 serve or less
38%
12%
1 serve 33%
2 serves 2 – 5 serves
58%
30%
3 serves 16%
4 serves 2%
5 serves 1%
6 or more serves 2% 2%
Respondents were also asked how much soft drink they had consumed the day prior to completing the survey. Types of soft drink included either sweetened or artificially sweetened (diet) soda, cordials or flavoured milks and fruit juice. Respondents indicated that amounts consumed varied from none (67% of participants) to <200ml (12%), 200-400ml (12%), 400-600ml (5%), 600-1000ml (2%) and over one litre (2%). Older respondents reported drinking soft drink less frequently.
Respondents were asked about the type of spread they usually used when eating bread or toast. The most popular response was butter (43%) followed by margarine (30%), low fat spreads (13%) and olive oil (3%); 11% of respondents did not use anything.
Alcohol Consumption
Respondents were asked about their alcohol consumption, including amount per week, type of alcohol consumed and binge drinking habits. 64% of adults surveyed responded that they did drink alcohol. Men were statistically significantly more likely to report drinking alcohol and to report consuming more drinks per week than women.
Of those who drank, 8% said they did not drink weekly, 19% advised they drank one drink per week, 11% reported drinking two drinks, 21% drinking 3-5 drinks, 18% 6-10 drinks and 13% said they drank 11-14 drinks each week. Half stated they drank 3½ drinks per week or more with 10% reporting that they drink 15 drinks or more (up to 50) each week. Among women who reported drinking, the average number of drinks per week was 4.6 while the average number of drinks per week for men was 9.6. The most frequently consumed drink reported was wine (45%) followed by beer (28%) and spirits (20%).
24 Department of Rural Health
Of those who drank alcohol, 61% of respondents advised they had not consumed more than 5 drinks in a couple of hours in the month prior to completing the survey. Frequency of this pattern of drinking varied between 1 and 30 times in the previous month; of those that had, most had consumed 5 drinks in a couple of hours once and few had consumed this more than six times in the past month.
Smoking
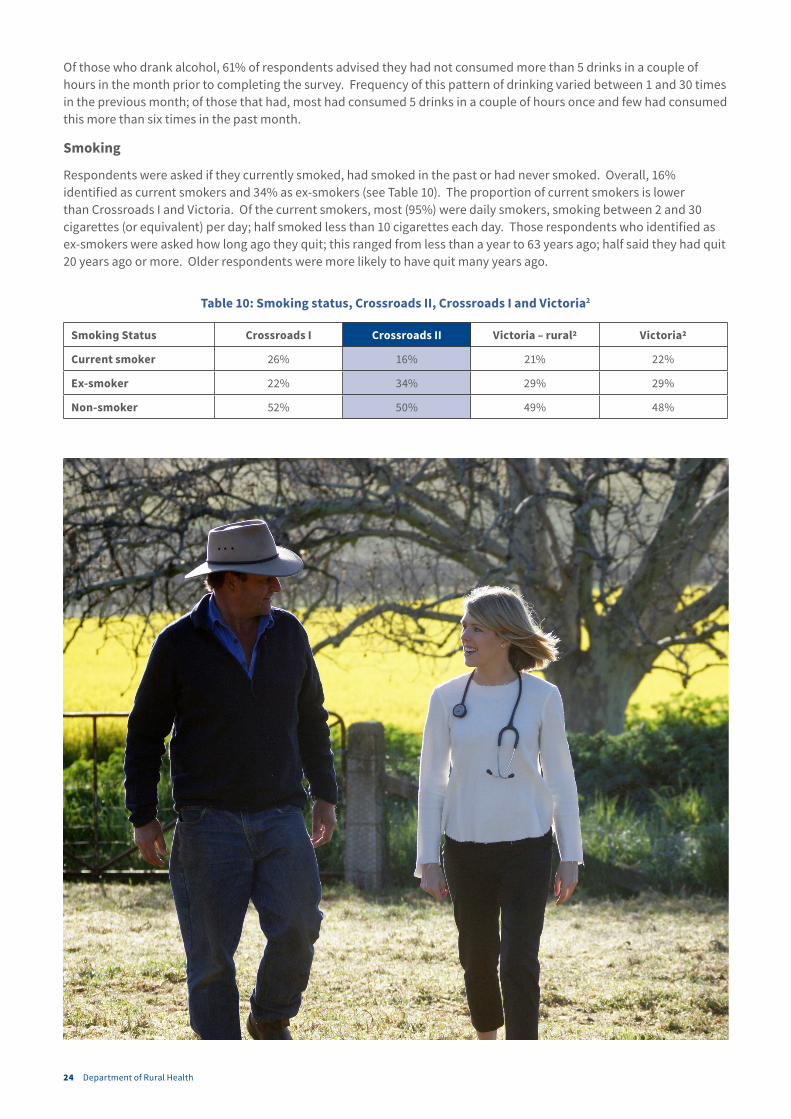
Respondents were asked if they currently smoked, had smoked in the past or had never smoked. Overall, 16% identified as current smokers and 34% as ex-smokers (see Table 10). The proportion of current smokers is lower than Crossroads I and Victoria. Of the current smokers, most (95%) were daily smokers, smoking between 2 and 30 cigarettes (or equivalent) per day; half smoked less than 10 cigarettes each day. Those respondents who identified as ex-smokers were asked how long ago they quit; this ranged from less than a year to 63 years ago; half said they had quit 20 years ago or more. Older respondents were more likely to have quit many years ago.
Table 10: Smoking status, Crossroads II, Crossroads I and Victoria2
Smoking Status Crossroads I Crossroads II Victoria – rural2 Victoria2
Current smoker 26% 16% 21% 22%
Ex-smoker 22% 34% 29% 29%
Non-smoker 52% 50% 49% 48%
Cobram Crossroads Report, November 2019 25
Physical Activity
Respondents were asked about their participation in physical activity. Overall, 66% reported participating in physical exercise designed to improve or maintain their physical fitness. Of these, 23% said they exercised seven days each week, 23% said 5-6 days each week, 36% responded 3-4 days each week and 18% said they exercised 1-2 days each week. Older residents indicated exercising on more days. When asked how long they participated in their exercise sessions, of those who identified exercising, 13% said they exercised for less than 30 minutes, 37% said 30-59 minutes, 27% responded 60-89 minutes and 23% said they exercised for 90 minutes or more each session. Walking, gym sessions, organised sport (e.g., football, netball, bowls, golf, yoga) and running were the most common forms of exercise reported by Cobram participants. Compared to the national guidelines for exercise (that recommend at least 150 minutes of exercise per week for adults 18-64),7 42% of respondents reported achieving this recommendation.
Sun Protection
Overall, 34% of respondents advised they always used sun protection when out in the sun and a further 29% said they usually use some form of sun protection; 13% claimed they never use sun protection. The most common forms of protection used were a hat, sunglasses and sunscreen, all reported to be used by more than half of the respondents. Women were more likely to report using sunscreen, sunglasses and avoid the sun while men were more likely to report using a sun hat.
CHILDREN’S HEALTHDuring the household questionnaire, 45 families provided information for 84 children. Of these, half (50%) were male and half of the children were females. The ages of the children ranged from 0 to 16 years.
Families provided information about the average serves of fruit, vegetables and dairy products their children were consuming per day. In Crossroads-II, approximately 69% of children were consuming the recommended amount of fruit per day and approximately 30% were consuming the recommended number of serves of vegetables per day. Further, 71% of children were consuming the recommended number of serves of dairy products per day.
When asked about key conditions, of the 45 families with children:
• 14 families reported having one or more child with Asthma;
• 21 families indicated one or more child had a skin condition;
• 13 families described one or more child with an allergy;
• 12 families reported one or more child with eye problems;
• 4 families indicated having one or more child with Attention Deficit Disorder; and
• 3 families said one or more child had a disability.
In addition, 8 families reported having a child that had been hospitalised. Further, 19 families reported attending the ED for their child and 43 of 45 families said they had consulted a GP for their child’s health in the past year. Of the families who reported having a child hospitalised in the past 12 months, half were hospitalised in Wangaratta and 3 families had a child hospitalised in Shepparton. Of the families who said they had children treated at the ED/UCC, 13 presented to Cobram UCC and 3 to Wangaratta or Benalla. 68% waited less than an hour to see a doctor, 26% waited 1-3 hours and 5% waited 3-6 hours.

26 Department of Rural Health
CLINIC RESULTSAs part of Crossroads II, a number of health screening clinics were held in Cobram. 121 participants attended, of which 49 (41%) identified as male. Participants were aged between 18 and 92 years old with an average of 62 years.
Diet
Participants were asked at the clinic how healthy they considered their diet to be; 22% rated their diet as very healthy and 66% as quite healthy. Almost all participants (96%) were aware that nutritional guidelines recommend eating multiple serves of fruit per day, but only 35% of participants were aware that these guidelines also recommend eating several serves of vegetables per day.
Sleep
Of the clinic participants, 36% said that they slept well most of the time, 15% said some of the time, 8% indicated not well some of the time and 13% responded not well most of the time. The remainder reported experiencing a mixture of sleep quality.
Blood Pressure
Blood pressure was measured at the clinic; 49% of male clinic participants and 35% of female clinic participants returned high blood pressure measurements. Of those aged 65 years or older, 55% of clinic participants returned a high blood pressure measurement compared to 23% of participants aged between 18 and 64.
Hearing
An audiology (hearing) test was performed at the clinics and 120 Cobram participants took part. Of these, 51 (43%) had some hearing loss. This included 19 male participants (39%) and 32 female participants (44%). Of the 51 participants who had an abnormal audiology test, 40 (78%) were over the age of 65 years of age.
Lung Function
Spirometry is a common test measuring pulmonary (lung) function and is used to diagnose and assess changes in chronic lung conditions, such as asthma and Chronic Obstructive Pulmonary Disease. 111 clinic participants performed a spirometry test of which 26 (23%) had a lower than normal result which included 9 (23%) of the male participants and 17 (25%) of the female participants.
Cognitive Function
The Montreal Cognitive Assessment (MoCA) tool was used to screen clinic participants for cognitive impairment and possible dementia. A score of less than 26 is indicative of cognitive impairment. 24% of clinic participants in Cobram had scores of less than 26. Of participants aged 65 and over, 31% of clinic had scores less than 26.
Mental Health
Participants completed the Kessler psychological distress scale (K10) during the clinic. From this assessment, 85% of clinic participant scores were below 20, suggesting that these participants were likely to be psychologically well. The scores of the remaining 15% of clinic participants indicated mild to severe risk of psychological distress. This percent is similar to that reported in another study 8 where 13% were assessed to be at risk of psychological distress.
Diabetes
Of the 121 clinic participants, an Oral Glucose Tolerance Test (OGTT) was performed for 108 people. There were 14 participants (13%) who had an impaired glucose tolerance following the OGTT and one participant was diagnosed as having Diabetes Mellitus at the clinic. The World Health Organisation guidelines stipulate that impaired glucose tolerance is a fasting glucose less than 7.0mmol/l with a 2-hour glucose of equal to or more than 7.8mmol/l but less than 11.1mmol/l. Diabetes Mellitus is a fasting glucose equal to or more than 7.0mmol/l or 2-hour glucose equal to or more than 11.1mmol/l.9

Cobram Crossroads Report, November 2019 27
Obesity
Carrying excess body weight around the middle of the body can increase the risk of heart disease and stroke. Waist measurement along with measures of Body Mass Index can give an indication of the increased risks of chronic health conditions linked with excess body fat. For most adults, a waist measurement of more than 94cm for men and above 80cm for women is an indicator of internal fat deposits which coat organs such as the heart, kidneys and liver.10
The mean average waist measurement for the people of Cobram was 97cm. The number of males with a waist measurement more than 94cm was 18 (37%) and the number of females with a waist measurement of more than 80cm was 15 (21%).
Body Mass Index (BMI) combines an individual’s height and weight to form a measure that can help predict risk of developing disease.11 Height and weight of participants were measured during the clinic. Overall:
• 2% were underweight (BMI below 18.5)
• 21% were in the normal range (BMI 18.5 – 24.9)
• 40% were overweight (BMI 25 – 29.9)
• 37% were obese (BMI 30 or above)
Furthermore, 22% of males had a BMI measurement within the normal range, 31% of males measured in the clinic were overweight and 47% classified as obese. Of the female participants, 3% were underweight, 31% had a normal BMI, 35% were classified as overweight and another 31% were classified as obese.
28 Department of Rural Health
CONCLUSION
This study reports on a detailed health questionnaire completed by 431 randomly selected participants residing in Cobram township in 2017-2018. In addition, 121 of these adults completed a two-hour screening clinic. It also provides some comparison to the Crossroads I study, conducted in Cobram in 2001-2003 using the same measures. Key findings included that:
• Measure of health and happiness had increased slightly over the past 15 years and were above state average;
• Some of the most prevalent health conditions were related to ageing, including eye problems, arthritis, heart problems and hearing loss;
• Rates of chronic disease were identified as higher than found in the previous Crossroads I study, particularly high cholesterol, high blood pressure, depression, allergies, arthritis, heart problems, thyroid problems, diabetes, respiratory problems, circulatory problems eye problems, osteoporosis, digestive problems, hearing loss, stroke and kidney disease;
• Rates of mental health conditions were found to be high while use of mental health services was less frequent;
• Use of services had increased, particularly use of medical specialists, dentists, optometrists, physiotherapists and osteopaths;
• Access to services has increased significantly since the Crossroads I study, although it is still a concern for some residents, particularly in relation to specialists and quality care;
• Age is not related to hospitalisation, satisfaction with services or happiness; and
• Health behaviours, with the exception of smoking, had not improved since Crossroads I and increases in the prevalence of obesity are concerning.
While a small sample and more likely female and older, the respondents were selected randomly and visited repeatedly to achieve a good response rate. The findings suggest that residents of Cobram have higher rates of chronic conditions than 15 years earlier while also having more access to services and are using health services more. While ageing was related to increased chronic diseases, age was not related to use of hospitals or many other measures. Similar to other rural regions, health behaviours remain a challenge. Despite these findings, residents of Cobram are reporting that they are happy and generally healthy.
Cobram Crossroads Report, November 2019 29
RECOMMENDATIONSBased on the findings, this report provides recommendations for the community of Cobram. In developing these, we acknowledge the hard work of local health services, local health practitioners and the local Shire to provide services, increase access to services and provide appropriate health care, as demonstrated by the new GP clinic, the new Rehabilitation Centre, increase in GPs, allied health professionals and access to medical specialists, development of telehealth, decline in smoking rates and a range of initiatives focused on health care, aged care and healthy living. There are many new medical and allied health services since Crossroads I as well as a range of programs to improve health care, improve quality of care and meet community needs. With this in mind, three recommendations are proposed:
1. strategies to improve management of chronic disease in Cobram are developed for all ages;
2. strategies to increase access to quality health services are considered, particularly in relation to mental health and health promotion;
3. strategies to improve health behaviours are enhanced, including fun, community activity programs in Cobram to engage people of all ages in exercise and social participation.

30 Department of Rural Health
REFERENCES
1. AIHW (2017) Rural & Remote Health. Australian Institute of Health and Welfare: https://www.aihw.gov.au/reports/rural-health/rural-remote-health/contents/rural-health. (Accessed October 30, 2018)
2. DHHS (2017) Victorian Population Health Survey 2015: Selected survey findings. Victorian Department of Health and Human Services: Melbourne.
3. Terry, D., Glenister, K. and Bourke, L. (2015) Repurpose, reuse, and recycle: The current challenge of rural and regional data. Partyline 53: 50-51.
4. ABS (2018) 2016 Census QuickStats for Victoria. Australian Bureau of Statistics: http://www.abs.gov.au/websitedbs/D3310114.nsf/Home/2016%20search%20by%20geography. (Accessed April 30, 2019)
5. Glenister, K.M., Bourke, L., Bolitho, L., Wright, S., Roberts, S., Kemp, W., Rhode, L., Bhat, R., Tremper, S., Magliano, D.J., Morgan, M., Marino, R., Adam, W. and Simmons, D. (2018) Longitudinal study of health, disease and access to care in rural Victoria: the Crossroads-II study: methods. BMC Public Health 18:670: https://doi.org/10.1186/s12889-018-5511-9
6. NHMRC (2013) Australian Dietary Guidelines. Australian Government National Health and Medical Research Council: http://www.nhmrc.gov.au/guidelines-publications/n55. (Accessed October 30, 2018)
7. Australian Bureau of Statistics (2018) National Health Survey, 2017-18: Physical Activity. Australian Bureau of Statistics: https://www.abs.gov.au/ausstats/[email protected]/Lookup/by%20Subject/4364.0.55.001~2017-18~Main%20Features~Physical%20activity~115 (Accessed August 24, 2019)
8. Andrews, G. and Slade, T. (2001) Interpreting scores on the Kessler Psychological Distress Scale (K10). Australian and New Zealand Journal of Public Health 25(6):494-7.
9. WHO (2006) Definition and diagnosis of diabetes mellitus and intermediate hyperglycaemia. World Health Organization: https://www.who.int/diabetes/publications/diagnosis_diabetes2006/en/. (Accessed 3 September 2018)
10. Heart Foundation (2018) Waist measurement. Heart Foundation Australia: https://www.heartfoundation.org.au/your-heart/know-your-risks/healthy-weight/waist-measurement. (Accessed 28 August 2018)
11. NHMRC (2013) Clinical Practice Guidelines for the Management of Overweight and Obesity in Adults, Adolescents and Children in Australia. National Health and Medical Research Council: https://www.nhmrc.gov.au/about-us/publications/clinical-practice-guidelines-management-overweight-and-obesity. (Accessed September 2, 2018)

Cobram Crossroads Report, November 2019 31

32 Department of Rural Health
CONTACT DETAILS:For more information about the Crossroads II study, please see https://medicine.unimelb.edu.au/research-groups/rural-health-research
Department of Rural Health Lisa Bourke 49 Graham Street PO Box 6500 Shepparton VIC 3632
+61 3 5823 4500
CRICOS 00116K November 2019