Embed Size (px)
Citation preview

Calin Dragan, CEOMichael Coombs, CFO
Coca-Cola East JapanQ2 & YTD 2015Earnings Presentation
August 7, 2015
www.ccej.co.jp
(Posted to CCEJ Website August 6, 2015)

The plans, performance forecasts, and strategies appearing in this material are based on the assumptions and judgment of the management of Coca-Cola East Japan Co. Ltd. (CCEJ) in view of data obtained as of the date this material was released. These forecasts may differ materially from actual performance due to risks and uncertain factors such as those listed below.
Risks and uncertain factors are not limited to the items listed below. They are also included in our annual securities report, or
“Yuka Shoken Houkokusho”.
• Intensification of price competition in the marketplace
• Change in economic trends surrounding our business
• Major fluctuations in capital markets
• Fluctuations in currency exchange rates, particularly with respect to the value of the Japanese yen and the U.S. dollar
• Increases in prices of raw materials
• Change in the tax environment
• CCEJ's ability to realize production efficiencies and to implement capital expenditures at the levels and times planned by management;
• CCEJ's ability to market and distribute effectively
• Uncertain factors other than those above
The information in this presentation is provided for informational purposes and should not be construed as a solicitation of an investment in our securities.CCEJ undertakes no duty to update any statement in light of new information or future events. You should rely on your own independent examination of us before investing in any securities issued by our company.
Forward-Looking Statements
2
Q2 & YTD 2015

Coca-Cola Zero Taste Challenge (VIDEO)
3
Q2 & YTD 2015
(TRY! #Kiki Coke – Coca-Cola Zero Taste Challenge Commercial Film)http://www.cokezero.jp/movie/#movie09

Coca-Cola Zero Taste Challenge
4
What? Is this really ZERO?• June – July promotion• Sampling ~100K cans• Nine events in CCEJ territory
Taste and then slide cover off can to discover if it was Coca-Cola or Coke Zero
Enjoy!
Q2 & YTD 2015

Introduction
• Overview and Key Messages
• Transforming our Business
Second Quarter and Year-to-Date Results
• Share, Volume and Financial Results
Rest-of-Year Outlook
• Marketing Activities and Key Milestones
Q2 & YTD 2015 Earnings Presentation
5
Q2 & YTD 2015
YTD comparable* operating income improved by 3.8 billion yen vs. prior year, including cycling the impact of the accounting policy change in Q1 2014.
Ongoing delivery of supply chain synergies, partially offset by increased expenses related to employee overtime, inventory movement & systems support for rollout of new Enterprise Resource Planning (ERP) system. Below plan YTD.
Share decline in the second quarter, cycling strong share growth in prior year and decision to decrease promotional activity at quarter-end (June)
Balanced volume and revenue performance in the quarter and year-to-date
Continued growth in tea, water & coffee led by Convenience Store channel
Acquisition of Sendai Coca-Cola bottler reflected in results from Q2
Summary of First Half Results
6* Includes Q2 2015 acquisition of Sendai bottler
Q2 & YTD 2015

Q2 & YTD 2015Results
www.ccej.co.jp

Rapid organizational transformation & integration continues; acquired Sendai Coca-Cola Bottling Company, consolidated eight subsidiaries into FV East Japan.
Two new production lines operational in Q2 (Ibaraki, Ebina)
Phase One of ERP System operational. Necessary fine-tuning and “hypercare” IT support was greater than expected. Limited customer out of stocks in spite of strong effort in Q2 to ensure stable continuity of supply during transition.
Developing capabilities and implementing programs for revenue growth management to improve price/mix.
Restructured indirect procurement into Coca-Cola Business Services Company
Transforming the Business in 2015
8
Q2 & YTD 2015

9
アプリケーションマップ(2012/11)
REDサーバ LBCクロス(溝口DC)
KBC
在庫管理
伝発名人
TCCS サーバ(コールセンター)
z
z
z
DIAS
DWH
訪問 FAX受注テレ受注
人間系の受注
弊社受信
EDI関連
Web(Infomart)
センター配送照合システム
Webクライアント
HUB I/Fシステム
MOS
ノーツ(社内コミュニケーション)
コミュニケーションメール
自販機情報
社内コミュニケーショ
ン顧客情報収集 RFA 賃貸料
管理
受注取り纏め(移行ツール)
データ取込
NetStrage260
ウィルス管理(シマンテック)
バックアップデータ
TONEAD1
ユーザー管理
ドメイン管理
TONEWSS1
ポリシー管理
Windows Updatバージョン管理
セキュリティー管理
ノーツ連携(CACHATTO)
ノーツ連携
システム監視(CAT6)
ユーザーログ監視
一往復検量
(CCJC資産) 自販機検量
CCIBS幕張サーバ
ホームページ
インターネットメール変換
プロキシ
MINIAP
HUBマスタ・トランチェック
FlashReportExcell加工
Web広報利根パックスクリエーション外部サイト
Web広報利根
アウトバウンド受注
インバウンド受注
受注KPI管理スマートフォン
EOSシステム
受注デー タ作成
ボトラー間連携
各種伝票作成
精算データ作成
ASN
受注統合管理 BISS連携 データチェック
ディスパッチ ピッキングリスト在庫引当
納品書データ作成
専用伝票出力
棚卸実差表 棚卸
配送明細配送一覧
配送ルート稼動チェック
在庫転送 破損等
PC端末
HHTアップロード補充・精算(FS)
帰
所
HHTダウンロード
納品(RS)ルートセトル
現金チェック
車上チェック
翌日積込&承認
修理受付
Web検品
入荷検品
オンライン請求
出荷伝票入力 配車
入荷伝票入力
発注書入力
送込数作成
出荷伝票出力
最終賞味期限更新
オーダー依頼 在庫実査
機器調達設置・撤去移動 修理 整備 廃棄
サニテーション
インスペクション
部品管理 部品EDI
自販機統合システム
費用管理
作業履歴管理
機器管理
修理オーダー 連携
在庫システム
機内在庫 受払 在庫実績 SAP連携
受注
J-SCALE
支店
KBC
J-SCALE
EM
J-SCALE
SM関連HHT
伝票回収チェック
銀行入金業務
FS預り金
請求データ
EOSデータ管理
共配費用処理
ボトラー間精算
z
z
z
利根移行ツールI/Fシステム
千葉LC
マテハン管理
受注・在庫連携
コード変換
D-DISデータ作成
売掛管理(一般顧客を除く)
固定資産
資金管理(一部・単独)
原価計算
部門利益管理
購買業務一般会計 買掛管理
在庫・(物流)
稟議(COA)
営業活動推進システム
スケジュール管理
顧客情報
商談進捗
活動実績
損益試算
実績紹介
各種調査
バジェット作成
TVOSS
オペレーション分析
売切分析
商品戦略
訪問計画
新商品展開
異常値検出
プレ名人
コラム戦略
KPI管理
J-SCALE
実行系
報酬管理(評価)
昇給
人事異動 賞与
退職金出向管理 福利厚生
労働者名簿
目標管理
組織管理
E-Learning
勤怠管理HCM給与(外部委託:ペイロール社)
給与計算 年末調整
共済会
保険業務 仮払い
連結決算(シナンシャル社)
FBシステム(みずほ)
SUPER COMPACT
Pathfinder
支払業務
SAP I/F(Tonekk03)
入庫登録I/F
入出庫伝票登録I/F
受注出荷I/F
営業所在庫I/Fファイル
販売リベート仕訳I/F
売上仕訳I/F
給与・賞与仕訳I/F
管理会計
費用分析
予算管理
個店損益
販売実績
各種売上管理
PowerPlay各種売上分析
定型帳票
過不足金管理(TVOSSサーバ)
個機過不足 製品過不足 現金過不足
FSコミッションJ-SCALE
BO系
未開拓顧客検索ツール
SharePointサーバ(物理的にはMOSサーバに同居)
経営層ドキュメント管理 会議室予約 帳票出力
オーダー
支店発注送り込み計算 EJP発注
J-SCALE連携
コード変換
J-SCALE:TKのレイアウト変換
トランザクションデータの管理
レガシーマスター作成
レガシートラン作成
各システム間連携
レガシーマスター作成
レガシートラン作成
統合マスター管理
顧客系 顧客契約系
レガシーマスター管理(Tonedb01)
レガシー商品マスター 業種 住所
TONEHULFT
専伝マスタ?
翌日精算業務物コン連携
修理オーダー連携
共通機能 BI/CRM/SFA関連
三井住友
支払業務
J-SCALEのSAPシステムでは直結
SAP
補完
売掛金管理システム(顧客)
計上 請求 入金 残高 与信
リベートシステム(顧客)
リベート計算リベート/未払金
レガシー
J-SCALE個別
インフラ
共配売上・在庫
健康保険組合(カシオ情報機器:健康保険総合システム)
レセプト(法研)経理・人(適用)・給付・検診
CCCJ システム全体図
=BISS(支店系)
=BISS(BO)
フルコミッション
BISS支店系/在庫管理
ロード受払
支店オーダー
(CCEJPオーダー)
BISS 実行系
在庫
会計
購買
売掛システム
売掛管理
DWH
個店損益
Visit
売上分析
在庫管理
棚卸し
受注
EOS/DIAS
端末
BISS支店系/納品準備
ディスパッチ
プレロード
自社伝票発行(端末精算)
専用伝票発行
フルプレロード
BISS支店系/納品精算
フルハンディー
レギュラーハンディー
センター納品売上インターフェイス
BISS支店系/営業所事務
過不足管理
預り金管理
釣り銭管理
入金管理
リベート
協賛計上
物流システム配送費用計算
(CJL協力会社配送費)
在庫情報検索
人事システム
給与システム
SCM
需要予測
出荷計画
LCシステム
出荷予定
入出荷実績
DCシステム
出荷
マスタ管理
受注情報 納品情報
ロード情報
DC/TC積込指示
製品移管
伝票情報
保管場所移動
製品オーダー
その他(営業所間移管)
出荷指示
入荷検収
ロード情報
売上情報
売上情報
営業仕訳
売上代入金口座管理
営業仕訳情報
センター納品クロス配送
EOS
EOS
販売
出荷予定
入荷予定
セトルメント
フルコミッション管理
賞味期限管理
CCJC
DDIS
債権管理
各種仕訳情報
一往復オペレーション
在庫情報
小払い精算
フロントプロセス
テレセルセンター
CIMMS
顧客管理
契約単価管理
顧客情報商流管理情報物流管理情報自販機情報
専伝情報管理
チェーン情報管理
CJ I/F(レガシー)
商品管理
プロモーション
出荷実績
次世代SCM対象範囲
次世代SCM
導入後廃止
EOS 個店別情報
【主なシステムの外部データセンター設置場所】[富士通FIP中原センター]・現営業所(TKシステム)サーバ・売掛金管理システムサーバ・CJ I/F(インターフェース)サーバ[富士通FIP都築センター]・需給システムサーバ・テレセルDBサーバ※BISS支店系導入が完了次第、現営業所 (TK)システムは撤去事業所サーバはFSコミ リプレイス後撤去予定
[名古屋事務所]・中京地区LCシステムサーバ・関連会社システムサーバ
【システムリプレイス時期(予定)】・売掛金、協賛金、FSコミ :2014年・テレセルセンター :2015年・DWH :2014年~2015年
CokeOne+ ERP System Deployment
Before CokeOne+ ERP System:• Non-standardized business processes• Insufficient management reporting• From 26 legal entities to four• ~200 Loosely integrated systems• Complex – 2,500 interfaces• Multiple master databases
• CokeOne+ is a full transformation of business processes and people’s daily activities, including accounting, procurement, payment, manufacturing, inventory, shipping, etc.
• Such an integrated management system is a “must-have” to manage the current business, and a foundation for further business transformation.
• We experienced a short-term impact on supply chain management in Q2, resulting in limited customer disruption, as well as increased costs.
From April 2015One System; Cloud-Based
Q2 & YTD 2015

+11%
Volume Performance in the First HalfSequential Improvement during Q2 after Tax Rise
+17%
+15%
April May
June
+3%
-1.5%
Q1
Q2Solid
performance and share
growth
Cycling prior year
decline after c-tax hike
1H volume +5.4% (+0.1%*)
Q2 Highlights• Sendai acquisition April 1• Strong volume in April
cycling C-tax last year• Less CCEJ volume
promotions in June (2L water); Heavy competitor launch and promotional activity
Outlook• Slow start to July; End of
rainy season mid-month• Competitor promotions,
new products continue• Q3 peak season for
bottling business
1H Reported Volume by Quarter
Q2 Reported Volume by Month
10* Organic volume growth, not including Q2 acquisition of Sendai bottler
Sendai Bottler acquisition effective April 1
Cycling prior year growth; Less promo
activity in SM & Discounters
+6.7%*+4.4%*
--5.6%*
-+6.7%*-+4.4%*
-+1.3%*
Q2 & YTD 2015
Source: Compass volume and Intage SRI share
CCEJ Historic Weekly Volume Shipment Trends
Example: Drug & Discounter Channel
Balancing Volume & ValueLess Promotional Activities in June Led to Volume Decline
• Less promotional activities in June vs. past trends, in line with our ongoing price, terms & conditions (PTC) focus
• This continued emphasis on trying to balance volume and value could mean up to 2 to 3 million cases less volume in 2015
• The June volume decline negatively impacted profit and market share
• We continue to evaluate the effectiveness of various PTC actions in market and we will calibrate our activities
11
Q2 & YTD 2015
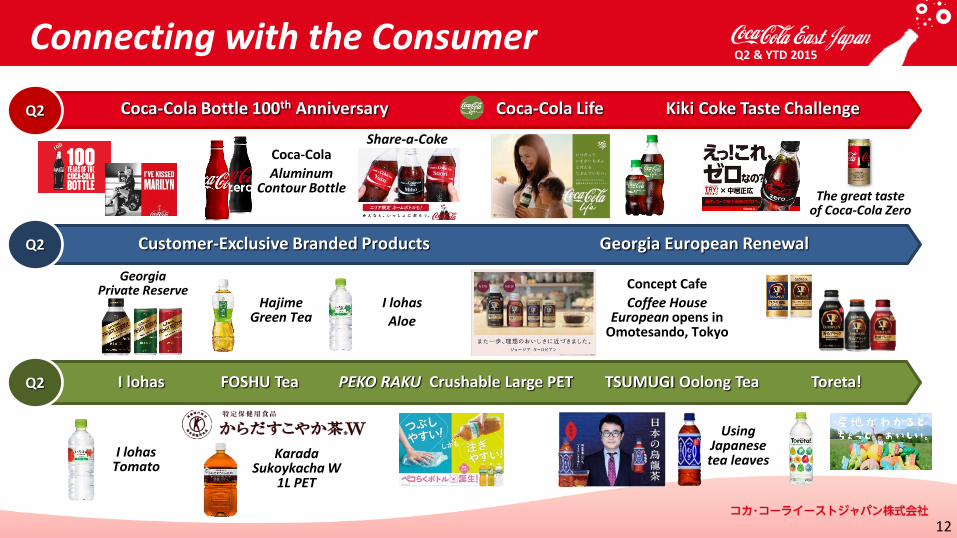
Customer-Exclusive Branded Products Georgia European Renewal
Coca-Cola Bottle 100th Anniversary Coca-Cola Life Kiki Coke Taste Challenge
Q2
I lohas FOSHU Tea PEKO RAKU Crushable Large PET TSUMUGI Oolong Tea Toreta!Q2
Q2
KaradaSukoykacha W
1L PET
Connecting with the Consumer
Concept Cafe
Coffee House European opens in
Omotesando, Tokyo
Coca-Cola
Aluminum Contour Bottle
Share-a-Coke
I lohas
Aloe
I lohasTomato
Hajime Green Tea
Georgia Private Reserve
Using Japanese tea leaves
12
The great taste of Coca-Cola Zero
Q2 & YTD 2015

1 2 3 4 5 6 7 8 9 101112131415161718192021222324
Q3 +0.9
Q4+0.8
2014 +0.7
2014
Q2 +0.7Q1
+0.4
2013
Q2*-0.3
2015
Q1*+0.2
2015 YTD*
-0.1
Slight Share Loss Cycling Prior Year Growth
* Including Sendai Bottler (now South Tohoku Region)** Source: Intage, OTC channel, NARTD beverages
Volume Share vs. Prior Year Value Share vs. Prior Year
2015Market Share*
vs. Prior Year
Q2 YTD
Volume -0.3 -0.1Value -0.4 -0.1
Share gains in cola, teas, water;Challenges in flavored sparkling
June share reflects less promotional activity
Volume & value share growth in 6 of 7 quarters
13
1 2 3 4 5 6 7 8 9 101112131415161718192021222324
Q4+0.4
Q3 +0.6
Q2+0.9
Q1+0.2
2014 +0.5
20142013
Q2*-0.4
2015
Q1*+0.2
2015 YTD*
-0.1
Q2 & YTD 2015

vs. PriorYear
CVS D&DNat’l SM
LocalSM
VMEat & Drink
Q2 2015 +8% +1% -1% even -4% +15%
YTD 2015 +11% -1% -8% -3% -3% +10%
Total Volume, including SendaiQ2 +11.1%; YTD 2015 +5.4%
• CVS growth led by water, tea, coffee• Drug & Discounter, Supermarkets reflect less
promotional pricing and pullback in 2L water• Vending weak due to weather and channel mix.
Indoor outperforming outdoor.• Eating & Drinking growth led by outlet expansion
Channel Volume GrowthIncluding Sendai
Supermarket
(SM) 22%
Drug & Discounter
(D&D)
12%
Convenience Store (CVS)
15%
Eating & Drinking
13%
Vending (VM)27%
Others11%
Q2 Volume by Channel(% of total)
Volume Performance by Channel
14
vs. Prior Year CVS D&D Nat’l SM Local SM VM Eat & Drink
Q2 2015 +20% +13% +13% +7% +6% +23%
YTD 2015 +17% +6% even +1% +2% +14%
Organic VolumeExcluding Sendai Q2 +1.3%; YTD +0.1%
* BAPC (Bottler Actual Physical Cases)
Q2 & YTD 2015
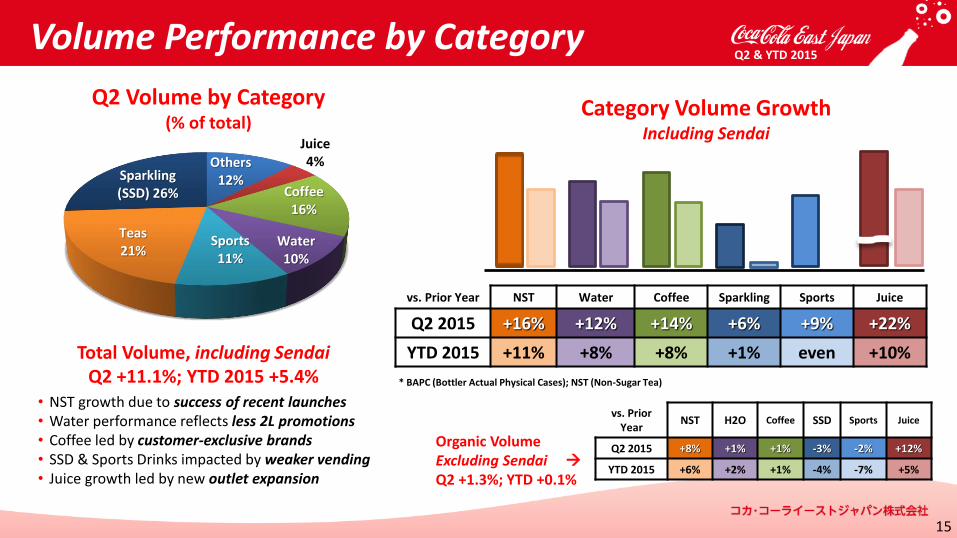
* BAPC (Bottler Actual Physical Cases); NST (Non-Sugar Tea)
vs. Prior Year NST Water Coffee Sparkling Sports Juice
Q2 2015 +16% +12% +14% +6% +9% +22%
YTD 2015 +11% +8% +8% +1% even +10%
Volume Performance by Category
Total Volume, including SendaiQ2 +11.1%; YTD 2015 +5.4%
• NST growth due to success of recent launches• Water performance reflects less 2L promotions• Coffee led by customer-exclusive brands• SSD & Sports Drinks impacted by weaker vending• Juice growth led by new outlet expansion
15
Others12%
Juice4%
Coffee16%
Water10%
Sports11%
Teas21%
Sparkling (SSD) 26%
Q2 Volume by Category(% of total)
vs. PriorYear
NST H2O Coffee SSD Sports Juice
Q2 2015 +8% +1% +1% -3% -2% +12%
YTD 2015 +6% +2% +1% -4% -7% +5%
Category Volume GrowthIncluding Sendai
Organic VolumeExcluding Sendai Q2 +1.3%; YTD +0.1%
Q2 & YTD 2015

Q2 & YTD 2015Financial Results
www.ccej.co.jp
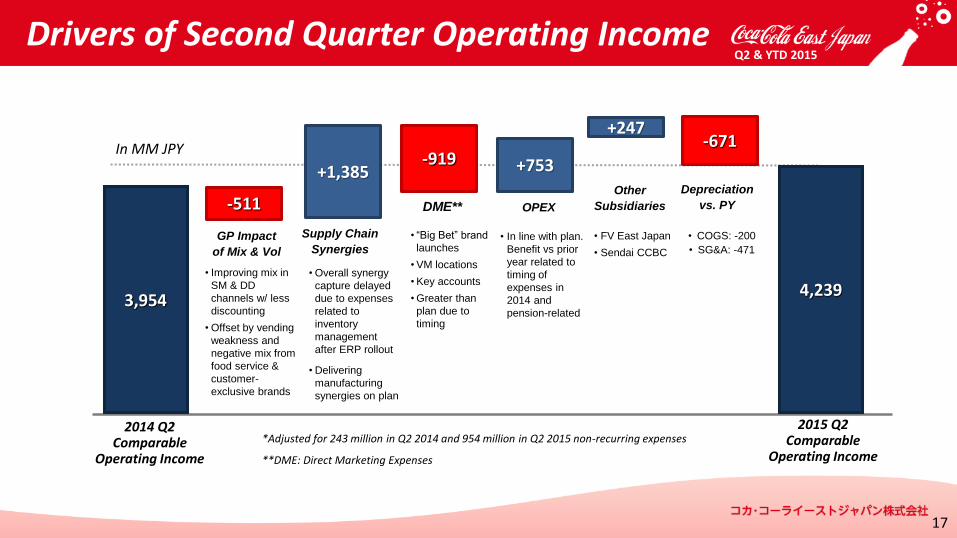
Drivers of Second Quarter Operating Income
+753
3,9544,239
-919
-511
In MM JPY
+247
+1,385
-671
17
2014 Q2Comparable
Operating Income
2015 Q2Comparable
Operating Income
GP Impact
of Mix & Vol
Supply Chain
Synergies
DME**
*Adjusted for 243 million in Q2 2014 and 954 million in Q2 2015 non-recurring expenses
**DME: Direct Marketing Expenses
OPEX
Other
Subsidiaries
• FV East Japan
• Sendai CCBC
Depreciation
vs. PY
• COGS: -200
• SG&A: -471
• Improving mix in
SM & DD
channels w/ less
discounting
• Offset by vending
weakness and
negative mix from
food service &
customer-
exclusive brands
• Overall synergy
capture delayed
due to expenses
related to
inventory
management
after ERP rollout
• Delivering
manufacturing
synergies on plan
• “Big Bet” brand
launches
• VM locations
• Key accounts
• Greater than
plan due to
timing
• In line with plan.
Benefit vs prior
year related to
timing of
expenses in
2014 and
pension-related
Q2 & YTD 2015

2015 Q2Actual
in million yen
2015 Q2One-time
items
2015 Q2Comparable
2014 Q2Comparable
Vs. PY
Diff %
Sales Volume(BAPC) (,000 cases)
80,784 - 80,784 72,725 8,059 +11.1
Net Revenue 151,828 - 151,828 136,580 15,248 +11.2
COGS 81,204 - 81,204 74,229 6,975 +9.4
Gross Profit 70,623 - 70,623 62,351 8,272 +13.3
SG&A 67,338 -954 66,384 58,397* 7,987 +13.7
Operating Income 3,285 954 4,239 3,954 285 +7.2
Profit Before Tax 2,850 1,414 4,219 4,086 133 +3.3
Net Income 2,531 910 3,441 2,437 1,005 +41.2
*Adjusted for 243 million in Q2 2014 non-recurring expensesNote: 2014 volume was revised in our Q4 2014 earnings announcement as a result of data and system standardization.
Second Quarter 2015 Results
18
• Balanced volume & revenue performance • Improving gross margin driven by manufacturing efficiency • Comparable SG&A
increase led by continued marketing investment & people costs • Q2 tax reflects deferred tax for consolidation of subs (FVEJ)
Q2 & YTD 2015
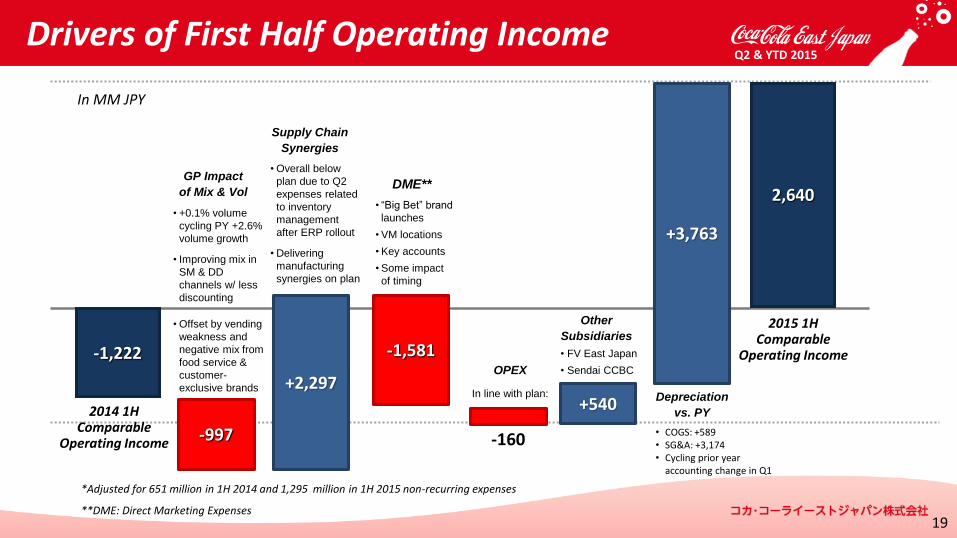
-1,222
2,640
-1,581
-997
In MM JPY
+540+2,297
+3,763
-160
19
2014 1HComparable
Operating Income
2015 1HComparable
Operating Income
GP Impact
of Mix & Vol
Supply Chain
Synergies
DME**
OPEX
Depreciation
vs. PY
• COGS: +589• SG&A: +3,174• Cycling prior year
accounting change in Q1
Drivers of First Half Operating Income
• +0.1% volume
cycling PY +2.6%
volume growth
• Improving mix in
SM & DD
channels w/ less
discounting
• Offset by vending
weakness and
negative mix from
food service &
customer-
exclusive brands
• Overall below
plan due to Q2
expenses related
to inventory
management
after ERP rollout
• Delivering
manufacturing
synergies on plan
• “Big Bet” brand
launches
• VM locations
• Key accounts
• Some impact
of timing
In line with plan:
Other
Subsidiaries
• FV East Japan
• Sendai CCBC
*Adjusted for 651 million in 1H 2014 and 1,295 million in 1H 2015 non-recurring expenses
**DME: Direct Marketing Expenses
Q2 & YTD 2015

2015 1HActual
in million yen
2015 1HOne-time
items
2015 1HComparable
2014 1HComparable
Vs. PY
Diff %
Sales Volume(BAPC) (,000 cases)
139,794 - 139,794 132,610 7,184 +5.4
Net Revenue 262,049 - 262,049 248,495 13,554 +5.5
COGS 140,051 - 140,051 135,781 4,270 +3.1
Gross Profit 121,997 - 121,997 112,714 9,283 +8.2
SG&A 120,651 -1,295 119,356 113,936* 5,420 +4.8
Operating Income 1,345 1,295 2,640 -1,222 3,862 -
Profit Before Tax 131 2,445 2,576 -1,036 3,612 -
Net Income 988 1,574 2,562 -1,540 4,102 -
*Adjusted for 651 million in 1H 2014 non-recurring expensesNote: 1H 2014 results include JPY 805 million in COGS and JPY 3,850 million in SG&A due to the write-off of residual value of existing tangible fixed assets related to a change in accounting policy Note: 2014 volume was revised in our Q4 2014 earnings announcement as a result of data and system standardization.
First Half 2015 Results
20
• Balanced volume and revenue performance • Improving gross margin driven by manufacturing efficiency • COGS and SG&A
benefit from cycling Q1 2014 accounting policy change • Q2 tax reflects additional deferred tax for consolidation of subs (FVEJ)
Q2 & YTD 2015

Second Half 2015Outlook
www.ccej.co.jp

Transform the summer
Transform yourself
22
Coca-Cola Summer CampaignQ2 & YTD 2015

23
Q2 & YTD 2015
Q3 the most important quarter of the year
We are strengthening Marketing & Execution programs in key channels
– Solid marketing calendar for second half of 2015
– Targeted promotional activities that respect PTC guidelines
Increased focus on Logistics optimization
– Increase direct shipments (plant to sales center) & reduce hub-to-hub moves
– Reduce finished goods transport distance; Improve efficiency of truck-loading
Close review of all operating expenses is underway
Second Half Outlook; “Reasons to Believe”

Continued stabilization and utilization of new ERP system in Q3; management of stable product supply as we fully shift to new system.
Two new production lines (Iwatsuki) to be commissioned in 2H
Additional Bottle Can capacity (Tokai) to be commissioned end of Q3
Operational integration of Sendai (now South Tohoku Region) and FV East Japan
Regional approach to Supply Chain optimization
Pricing, Terms & Conditions; Continued promotional optimization
Key Milestones in the Second Half
24
Q2 & YTD 2015

www.ccej.co.jp
APPENDIX
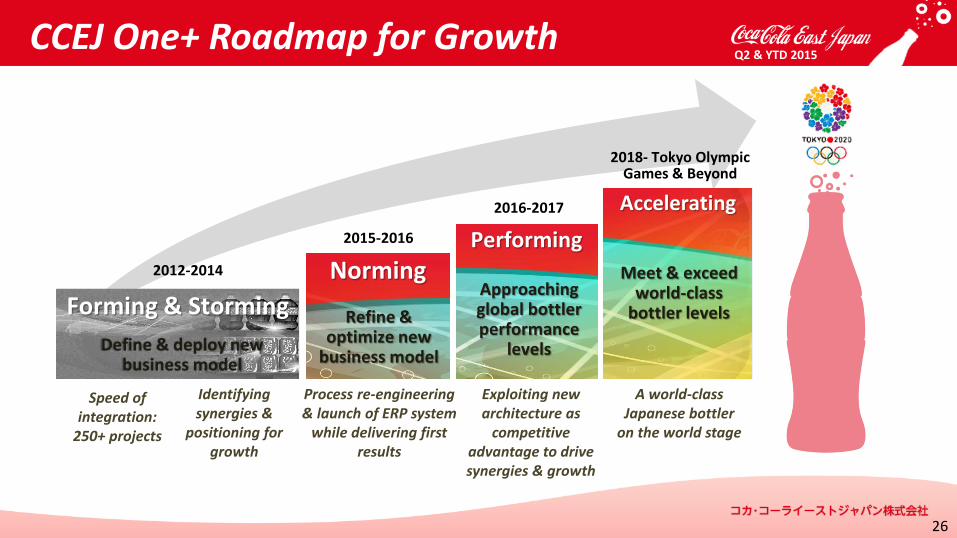
2015-2016
2016-2017
2018- Tokyo Olympic Games & Beyond
2012-2013
Forming
Accelerating
Meet & exceed world-class
bottler levels
A world-class Japanese bottler
on the world stage
Performing
Approaching global bottler performance
levels
Exploiting new architecture as
competitive advantage to drive synergies & growth
Norming
Refine & optimize new
business model
Process re-engineering& launch of ERP system
while delivering first results
26
2012-2014
Speed of integration:
250+ projects
Forming & Storming
Define & deploy new business model
Identifying synergies &
positioning for growth
CCEJ One+ Roadmap for GrowthQ2 & YTD 2015

The Coca-Cola System
The Coca-Cola system in Japan consists of the Coca-Cola (Japan) Company (CCJC), bottlers and other related companies.
CCJC, as the franchise owner, is responsible for supplying concentrate and beverage bases (coffee beans, tea leaves, juices, etc.) for allof Coca-Cola’s brands, as well as R&D, innovation, and marketing and brand development.
The bottlers, including CCEJ, as franchisees, are responsible for manufacturing, distribution and selling the finished products. We all areworking together with our system partners to grow the Coca-Cola business by optimizing our overall operations through more efficientproduction and distribution, marketplace execution that is firmly focused on the consumer, faster response to market preferences,enhanced customer service, and rigorous quality control.
Coca-Cola Tokyo Research & Development Co., Ltd. (CCTR&D)
Product development and technical support to respond to the needs of the customer in Japan. A wholly owned subsidiary of The Coca-Cola Company.
Coca-Cola Business Service Co., Ltd. (CCBSC)
Providing joint procurement of raw materials, packaging, etc. as well as business consulting services, developing and maintaining the information systems to support Coca-Cola System. Jointly owned by The Coca-Cola Company and all the
bottlers in Japan.
Coca-Cola Customer Marketing Company (CCCMC)
Business negotiations window for nationwide retail, convenience stores,supermarket and food-service chains as well as developing proposals for sales promotions and storefront activities. Jointly owned by CCJC and all the bottlers in
Japan.
FV Corporation Co., Ltd. (FVC) Sales negotiations window for national chain vending operators, and deals non-Coca-Cola products as well as Coca-Cola branded products. Jointly owned by CCJC and all the bottlers in Japan.
Other Coca-Cola System Related Companies in Japan
A powerful partnership driving growth of the Coca-Cola business
27
Q2 & YTD 2015

Glossary of Frequently Used Terms
CDE Abbreviation of Cold Drink Equipment. Vending machines, coolers and beverage dispensers, etc.
Coolers The equipment with Coca-Cola’s logos which keeps beverages at an appropriate temperature (chilled and/or hot) for immediate consumption, and ready for selling them at the storefront of retail outlets and restaurants. It serves as point-of–sales advertising, too.
DME Abbreviation of Direct Marketing Expenses. Sales promotion-related expenses reported in advertisement & sales promotion expenses and partly in sales commissions of SG&A.
FC Abbreviation of Future Consumption. Purchase or sell beverage for future consumption in home, etc. It also means the products / SKUs for FC (for example, single packages 1L or more and multi-pack of IC packages) and channels that consumers purchase the beverages for FC. (for example, supermarket, drug & discounter channels, etc.).
HORECA Abbreviation of Hotel, Restaurants and Cafeteria. Generally means sales channels of these kinds.
IC Abbreviation of Immediate Consumption. Purchase or sell beverage for consuming it immediately. It also means the products / SKUs for IC (for example, single packages less than 1L as well as fountains) and channels that consumers purchase the beverages for IC(for example, vending machine, convenience stores channels, etc.).
OBPPC Abbreviation of Occasion, Brand, Package, Price, Channel. A segmentation strategy tailored to consumption opportunities in five areas: occasion, brand, package, price and channel.
Operational Excellence (OE)
The Coca-Cola System’s way to develop people and culture around productivity which allows higher financial value achievement by driving sustainable improvement using common language and tools as well as focusing on business priorities.
RTM Abbreviation of Route-to-Market. A framework, a process, a philosophy, a proven approach for driving profitable growth.
28
Q2 & YTD 2015

www.ccej.co.jp
THANK YOUCoca-Cola East Japan
Q2 &YTD 2015 Earnings PresentationAugust 7, 2015
<Inquiries>Investor Relations
Coca-Cola East Japan
[email protected]+81-3-5575-3797
http://investor.ccej.co.jp/