Embed Size (px)
Citation preview
Cocoa Product Price Relationships
Mathurin Gbetibouo and Kirti Mehta
Division Working Paper No. 1988-1January 1988
International Commodity Markets DivisionInternational Economics DepartmentThe World Bank
Division Working Papers report on work in progress and arecirculated to stimulate discussion and comment.
Pub
lic D
iscl
osur
e A
utho
rized
Pub
lic D
iscl
osur
e A
utho
rized
Pub
lic D
iscl
osur
e A
utho
rized
Pub
lic D
iscl
osur
e A
utho
rized
Pub
lic D
iscl
osur
e A
utho
rized
Pub
lic D
iscl
osur
e A
utho
rized
Pub
lic D
iscl
osur
e A
utho
rized
Pub
lic D
iscl
osur
e A
utho
rized

COCOA PRODUCT PRICE RELATIONSHIPS
MATHURIN GBETIBOUO AND KIRTI MEHTA
January 1988
The authors are from the World Bank and the European Community Commission,respectively. Neither institution accepts responsibility for the viewsexpressed herein which are those of the authors and should not be attributedto the World Bank, to its affiliated organizations nor to the EuropeanCommunity Commission. The findings, interpretations, and conclusions are theresults of research supported by the Bank; they do not necessariLy representofficial policy of the Bank.

TABLE OF CONTENTS
Page
I. INTRODUCTION ..................................................... 1
II. COCOA PRODUCT TRADE.. ..........................................3
Evolution of Trade in Cocoa Products.3Prospects for Cocoa Products Trade .......................... 4
III. COCOA PRODUCTS: PRICE FORMATION, SUPPLY AND DEMAND ..............7
Cocoa Products and their Characteristics .................... 7Processing of Cocoa Products ............................... 10Technical Rates of Conversion from Bean to Products ........ 12Historical Product Price Behavior .......................... 19
IV. SPECIFICATION OF THE COCOA PRODUCTS MODEL ....................... 23
Cocoa Market Relationships ................................. 23Structure of the New Cocoa Model ........................... 24Liquor Production and Demand ............................... 27Butter Production and Demand ............................... 28Powder Production and Demand ............................... 30Crindings Equation.31Data Deficiencies .......................................... 33Estimates of the Demand and Supply of Cocoa Products.......35
V. PRODUCT PRICE FORMATION: THEORETICAL DISCUSSION ANDEQUATION SPECIFICATION .......................................... 42
Review of Literature ....................................... 42Formulation of Product Price Equations......................45Liquor Price Equation ...................................... 49Cocoa Butter Price Equation ................................ 52Powder Price Equation......................................55
VI. ESTIMATION OF COCOA PRODUCT DEMAND AND PRICE EQUATIONS .......... 57
Grindings Equation ......................................... 57Cocoa Products Demand ..................................... 60Cocoa Butter Demand ........................................ 60Cocoa Powder Demand ........................................61Cocoa Products Price Equations .............................. 61Equilibrium Product Prices.................................. 65Implications for Cocoa Processing...........................69

VII. CONCLUSION ...................................................... 74
ANNEX A Cocoa Bean and Product Market Dynamics Givena Supply Shock ......................................... 76
ANNEX B Cocoa Market Relationships ............................. 78
ANNEX C Cocoa Product Flow Chait... .........79
ANNEX D Cocoa Product Output Usage and Price Determination. 80
ANNEX E Estimation Results for Main Equation of theCocoa Products Submodel ................................ 81
ANNEX F Cocoa Bean and Product Price ElasticityRelationships .......................................... 83
REFERENCES ...................................................... 86
LIST OF TABLES AND FIGURES
TABLE 1: WORLD SHARES OF COCOA GRINDINGS AND COCOA PRODUCTEXPORTS FROM BEAN-PRODUCING COUNTRIES ......................... 4
TABLE 2: COCOA PRODUCT PRICES AND THEIR RATIOS TO BEAN PRICES ........ 18
TABLE 3: PRICES OF COCOA POWDERS AND POWER/BEAN PRICE RATIOSBY BUTTERFAT CONTENT AND ALKALIZATION PROCESS,NOVEMBER 28, 1986 ........................................... 21
TABLE 4: COCOA MASS OF LEADING CHOCOLATE BARBRANDS SOLD ON THE US MARKET ................................. 38
TABLE 5: VARIABLE NAMES AND DESCRIPTION ............................... 73
FIGURE 1: A SCHEMATIC REPRESENTATION OF NINE COCOAPROCESSING TECHNOLOGIES ..................................... 13
FIGURE 2: BUTTER AND CAKE/POWDER PRODUCTION POSSIBILITY FRONTIER......16
FIGURE 3: COCOA SUBMODEL'S LINKAGE .................................... 25
FIGURE 4: PRODUCT PRICE RATIO SPACE ................................... 68

- iv
SUMMARY
1. This study is an extension of the Division's earlier modelling of theworld cocoa economy. It bridges a gap in the specification of cocoa beandemand and cocoa product price functions. The model of the determination ofthe prices of cocoa products (liquor, butter and powder) presented here takesinto explicit account the economics of cocoa processing on the one hand andthe demand for the individual cocoa products on the other. Previous analysisof this part of the cocoa market has been limited to deriving the ratio ofeach product's price to the bean price on the basis of the physical conversionrate. It is argued here that these conversion factors are themselves theresult of economic decisions regarding the amount of cocoa fat to leave incocoa cake and therefore these decisions should be treated as endogenous tothe analysis of price determination in the cocoa market. In the specificationdeveloped here the prices of cocoa liquor, butter and powder are determined bythe excess demand for each product and their expected profitability, measuredas the difference between the "warranted" price (or the product of the beanprice and the technical conversion factor) and the lagged product price.
2. In earlier studies, absence of data on production and consumption ofcocoa products forced reliance on arbitrarily-determined conversion factors.Deficiencies in the quality of product price data are to be expected since alarge proportion of product use is in vertically-integrated operations andthere exists substantial heterogeneity in the products. Cocoa product use andoutput data have been generated for this study econometrically, usingauxiliary observed relationships which are based on technical, albeitimperfect, information. One test of the robustness of this data is in howwell the product price and new cocoa grindings equations fit historicaldata. The results suggest that the data are robust.
3. From the estimation of the model developed here, the price elasticityof bean grindings, a proxy for world consumption of beans, is found to be -0.4compared with estimates of about -0.25 from analysis in which product pricerelationships are omitted. A larger elasticity estimate was expected sincebeans are ground not only in response to signals from the end-product marketbut also in response to changes in the relative profitability of using cccoafat instead of other vegetable fats. In turn, cocoa product demand (acomponent of total foodstuffs) is essentially driven by income and populationgrowth. At the world level, income and price elasticities of cocoa productdemand are bound to be small as is expected of most food items. However, thefact that other vegetable fats can substitute for cocoa fats increases theprice elasticity. The demand for cococa is the most inelastic (-0.06) of thecocoa products because it faces the least competition and because itrepresents only a small share of the total intermediate product costs.
4. Estimation of the cocoa product price model indicates that theadjustment of prices to their warranted level is not instantaneous and that,in fact, product prices are seldom a fixed (technical conversion factor)multiple of cocoa bean prices as implied by those models which omit the cocoaproducts sector. For example, the cocoa liquor price adjustment parameter is
less than unity (0.84) and the liquor price is related to the bean price by afactor of 1.11, not by the technical conversion factor of 1.25. This findinghas an important implication as the cocoa product-cocoa bean price ratio isoften used as a guide in assessing the costs-benefits of processing cocoaproducts versus exporting raw cocoa beans, as well as the choice of theprocessing technology. The speed of the adjustment of cocoa butter prices totheir warranted level varies positively with the size of cocoa bean stocksavailable for pressing. The average adjustment parameter is 0.6. But whencocoa beans were relatively scarce as in 1977, it decreased to 0.32--suggesting a slow adjustment of cocoa butter prices to their warrantedlevel. The fastest adjustment occurred in 1965, which is also the year theratio of cocoa bean stocks to grindings reached its highest level. Theadjustment coefficient was close to 1.0 and the bean stocks to grindings ratiowas 0.79.
5. Output from the model has been used as input to activity analysiscarried out to assess the profitability of downstream processing of cocoabeans by producing countries and to derive optimal processing technology.From this analysis, it was found that choice of the optimal technology(hydraulic press, expeller, expeller and solvent extraction are thetechnologies presently in use) depends on bean and product prices as well ason the strength of demand for the various products.
6. After the technological and other events that around 1977 led to alarge increase in the direct use of cocoa liquor in chocolate confectionary--as well as to the demand for high-fat cocoa powders--the basic cocoa productprice ratios vis-a-vis cocoa beans changed substantially. It is interestingto examine the question of choice of processing technology against thisbackground of substantial changes in price relationship. Using the results ofthe cocoa product demand estimations and prices prevailing during the period1980-83, the optimization model results show that processers would be advisednot to confine themselves to a single processing method. They should be ableto convert beans directly into butter through expelling and solventextractions as well as to be able to press for butter, and cake.
7. As regards investment in cocoa processing by the cocoa bean producingcountries, given their current difficulties of competing in the veryheterogenous cocoa powder market, 4iz seems more profitable to opt forinvestment in processing technologies whose joint product mixes are weightedin favor of output of the more homogenous cocoa butter.

I. INTRODUCTION -
8. The primary motivation for extending the model of the cocoa market to
include the determination of prices of cocoa products--cocoa liquor or mass,
cocoa butter and cocoa solids (i.e. presscake/powder)--was the recognition
that the cocoa market has in fact four distinct submarkets (beans, liquor,
butter and cocoa solids). These submarkets are intrinsically linked. By
modeling explicitly these interlinked markets it was hoped to develop price
relatiniiships between cocoa product prices and bean prices that take into
account factors other than the technical fat conversion factors, which has
been the practice hitherto.
9. A second motivation was that without explicitly modeling the
interrelationships between cocoa product markets and the market for beans it
is not possible to analyze the economics' of cocoa processing, as, for example,
in the determination of the optimal processing technology under different
product prices, or the comparative costs of processing at the origin versus
processing in consuming countries.
*The authors wish to express sincere gratitude to Ronald C. Duncan andTakamasa Akiyama for thieir comments and suggestions. The authors are solelyresponsible for any remaining errors and shortcomings.

-2-
10. A third major reason for undertaking an analysis of the
interrelationships between bean and product markets was the increasing
interest in processing in bean-producihg countries--exclusively developing
countries. The composition of cocoa trade has changed over the years from
exclusively bean exports to a mixture of beans and product exports. In the
1962-65 period, producing countries were on average grinding only 16% of their
production locally. In 1985, they ground 31% of total bean production.
11. The remainder of the paper is organized as follows: Chapter II
underscores the relevance of this analysis of the cocoa product markets by
describing the evolution of trade in cocoa products and evaluating the
prospects for cocoa processing and exports of cocoa products by bean-producing
countries. Chapter III provides the background for the specification of the
model by describing the products and their processing technologies. Chapter IV
presents the model for estimating supply and demand relationships for cocoa
products and discusses problems related to the data. Since product price
formation is an important subject in this study, it is necessary to discuss
the theoretical underpinnings of the pricing mechanisms involved and the
product price models suggested. This is done in Chapter V. The results from
estimating the model are presented in Chapter VI together with recommendations
with respect to processing in bean-producing countries, and the conclusions
are presented in Chapter VII.

-3-
II. COCOA PRODUCT TRADE
Evolution of Trade in Cocoa Products
12. At one time, cocoa exports were exclusively in the form of beans with
the trade flowing from producing countries (all of them developing countries
in the tropical areas) to consuming countries mainly in the northern
hemisphere. The structure of cocoa trade has undergone substantial changes
with the increase of processing in cocoa bean-producing countries and the
resulting increase in the share of trade in the form of processed products. In
the middle of this century, only 11% of cocoa produced was ground by producing
countries. Their share of grindings increased steadily to 34% in 1978/79 and
have stabilized at that level. Since 1977/78, almost all cocoa paste sold on
international markets has been processed in bean-producing countries.- The
bean-producers' shares of the markets for cocoa butter and powder/cake have
also increased, though'not to the same extent. Table 1 reports the evolution
of cocoa products trade in terms of the shares of bean-producing countries.
13. The figures of Table 1 mask spectacular increases in the export
shares by some countries that deserve acknowledgment. Brazil has achieved the
most outstanding increases in grindings and exports of cocoa products. It has
become a leading exporter of cocoa butter, ranking second behind the
Netherlands. In 1985, Brazil exported 48,000 tons of cocoa butter and 36,000
tons of cocoa powder/cake--by comparison with less than 10,000 tons of exports
of both products two decades earlier. C6te d'Ivoire has more than doubled its
grinding capacity in less than a decade, and output increased from 40,000 tons

-4-
grinding capacity in less than a decade, and output increased from 40,000 tons
in 1977 to 90,000 tons in 1985; Malaysia has increased its grinding output
ten-fold to 20,000 tons over the same time span.
TABLE 1: WORLD SHARES OF COCOA GRINDINGS AND COCOA PRODUCT EXPORTS FROMBEAN-PRODUCING COUNTRIES
(PERCENTAGES)
EXPORTSGRINDINGS COCOA PASTE COCOA BUTTER COCOA CAKE
1948/52 11 NA 351958/62 16 NA 3T'§ 201968/72 21 57 53 301973/77 25 86 49 391977/78 32 92 48 481978/79 34 95 48 481979/80 33 93 46 461980/86 33 NA NA NA
NA: Not available.
SOURCE: DERIVED FROM GILL AND DUFFUS AND ICCO.
Prospects for Cocoa Products Trade
14. Exports of cocoa products by developing countries are expected to
grow because of the following changing trade practices:
i. Smaller manufacturers of products using cocoa in
industrial countries prefer to buy the intermediate cocoa
products instead of grinding their own, in order to have

-5-
grinding of cocoa beans for cocoa butter--to be used
subsequently for chocolate manufacturing--may yield an
unwanted amount of cocoa powder; this is avoided if the
manufacturer imports the specific product quantity needed.
ii. On the supply side, recent studies [UNCTAD (1984),
Karunasekera (1983)] suggest that there are potential
gains for developing countries in processing some--but not
necessarily all--cocoa products. Many cocoa-producing
countries have been contemplating increases in processing
of cocoa beans to increase domestic value-added.
15. When considering the past increases in cocoa processing in the bean-
producing countries and the potential for further increases, it is important
to note that over this historical period the advent of the Lome Co6wvention
(between the EEC and a group ,f African, Caribbean and Pacific countries) and
the GSP (Generalized Scheme of Preferences for exports of developing countries
to industrial countries) provided incentives for processing in the developing
countries. As a result of these international agreements, the barriers
against imports of cocoa products are now low to zero in most industrial
countries. It is noteworthy that the response to this lowering of barriers was
quite low among the African producers, which suggests some constraints on the
supply side. Another qualification to be observed when drawing conclusions
from the pasL increases in processing activities in developing countries is
that Brazil and Ecuador provided subsidies to artificially encourage, this

-6-
activity. Such policies are economically costly and are not to be encouraged.
1/ It is not known to what extent differential tax policies have led to the
movement of processing activities from industrial to developing countries.
Multinational companies are heavily involved in cocoa processing activities
and their investment activities are sensitive to differential tax rates
between countries.
1/ This fact is best illustrated by the Ecuador cocoa industry as recountedby Aronson (1987) an Ecuadorian cocoa exporter: "In the mid [1970s] theEcuadorian Government, through a complex of subsidies which totalled 40%,encouraged the development of a local liquor industry which, at its peakaround 1978, reached a grinding capacity of about 150% of the totalcrop. This excess capacity created several problems: (i) Fie;-cecompetition on the part of the firms to place their product in a worldmarket that was not ready for such ample supplies of Ecuadorian liquor,which in effect amounted to a transfer of the subsidy to the [foreign]consumer; (ii) A local price squeeze, which drove up the price of beansinternally to levels at which bean exporters could no longer export atmarket prices. The result of this situation was a long period of conflictbetween industry, government, exporters and producers in which everyonecame out losers."

-7-
III. COCOA PRODUCTS: PRICE FORMATION, SUPPLY AND DEMAND
16. An understanding of the model developed in the subsequent chapter
requires a description of processing activities and the historical price
patterns for cocoa products, as well as the technical conversion factors
important for product output data estimation. Prior to this a description of
the various cocoa products is in order.
Cocoa Products and their Characteristics
17. Cocoa, also referred to as cacao, is the common appelation for a
tropical tree called Theobroma cacao. 1/ When the fruit (an American football
shaped rptd) is harvested, the seeds are removed to undergo fermentation and
drying. Fermentation may be-done in wooden buckets covered with banana leaves.-
Sometimes the pulp-encased seeds are simply wrapped in the banana leaves.
After fermentation, the beans are sun dried on a cement-covered area. Besides
making handling easier, the drying of cocoa beans improves their aroma and
reduces their mildly bitter taste.
18. kermentation and drying are the only two processes performed at the
farm level. Further development of flavor is achieved at the industrial level
by roasting which also reduces moisture and acidity. The roasted beans are
1/ This name was given in the 18th century by Carolus Linnaeus the Swedishbotanist, originator of a system of taxonomic classification. It meansfood of the gods. Cocoa was at that time the most honored beverage of thehighest class in the Montezuma era. The tropical beverage was spread toEurope by the Spanish navigator/explorer Hernando Cortes.

-8
more friable and ready' to be ground after the nibs or broken pieces of kernels
have been isolated from the shell husks and germs.
19. The first product obtained from grinding cocoa nibs is called cocoa
liquor. It is a heavy liquia that contains 53% to 56% fat. Cocoa liquor is
also referred to as chocolate liquor or cocoa mass. In this form the product
can be used for making chocolate for baking, or undergo further grinding for
manufacturing butter and powder.
20. Cocoa butter is the solid fat derived from cocoa liquor either by
grinding, hot pressing or by other chemical processing. It is used in the
manufacture of chocolate, in the cosmetic industry and for pharmaceutical
preparations such as suppositories.
21. Cocoa powder is obtained by pulverizing cocoa cake, the de-fatted
solid product left after butter has been extracted from the liquor. Cocoa
powder contains butter residues in varying proportions: usually between 10%
and 20%. 1/
22. During the past decade, there has been an increasing use of cocoa
product substitutes in the confectionary industry. To understand the reason
for their popularity, a little knowledge of the physical properties of the
main ingredients in choccVlate confectionery is necessary.
l/ Beside cocoa powder, cocoa cake also produces theobromine, an alkaloid(C7H8N802) which is a natural nerve stimulant.

-9-
23. Chocolate confectionaries have two distinctive characteristics: their
aroma and their ability to dissolve. The aroma is provided by the solid
products derived from grinding cocoa beans: cocoa mass and cocoa powder. The
attractive property of chocolate products of remaining solid at room
temperature but melting when placed in the mouth is due to cocoa butter, the
fatty cocoa derivative. While it has been difficult to find a non-cocoa
product that could give chocolate its characteristic flavor, some limited
success has been achieved in using non-cocoa vegetable fats in chocolate
confectionary.
24. There are virtually no substitutes for cocoa powder, although during
the 1977-79 period of record high cocoa prices some manufacturers tried
various powder substitutes derived from carob. In France, scientists have been
able to isolate from coal the type of enzyme responsible for the chocolate
flavor. It is not known whether the discovery has crossed the laboratory
boundary, but current price prospects do not justify such an investment.
25. Competition is stronger, however, for cocoa butter from a still
marginal but increasing use of different types of vegetable fats. There are
three types of fats that are competing with cocoa butter in confectionary
manufacture. These are cocoa butter equivalents, replacers and improvers.
26. Cocoa Butter Equivalents (CBEs): These products have the property of
being compatible with cocoa butter; thus they can be complementary to cocoa
butter when manufacturers are trying to reduce the total cost of fat
ingredients. Non-lauric, hardened fats constitute most of the CBEs.

-10-
27. Cocoa Butter Replacers (CBRs): These products are intended to replace
cocoa butter use in confectionary. Since the CBRs are usually not compatible
with cocoa butter they are blended with cocoa powder to meet full flavoring
requirements. Butter substitutes are obtained by two processes of refining
vegetable oils: fractionation and hydrogenation. The first process (one that
yields a high-quality butter substitute) is currently the most expensive. It
decomposes the vegetable fat into fractions in order to obtain specific
physical properties.
28. Cocoa Butter Improvers (CBIs): This last category consists of
vegetable fats that perform better than cocoa butter in the conservation and
handling of chocolate confectionaries. They have a higher melting point than
cocoa butter; thus they have a longer shelf life and are more suitable for
manufacturing chocolate to be marketed in tropical regions.
Processing of Cocoa Products
29. Cocoa beans are transformed through several processes into interme-
diate inputs--cocoa liquor, cocoa butter, cocoa cake/powder--that are the raw
materials for the chocolate confectionary and chocolate flavors industry.
After an initial stage of cleaning, roasting (unless the beans are to be
expelled solely for cocoa butter) and winnowing to separate the nibs from the
bean shells, the nibs are fed into grinders to produce cocoa liquor (also
referred to as chocolate mass or cocoa paste). The liquor is then pressed
hydraulically to produce cocoa butter and presscake which is subsequently

ground to produce _ocoa powder. In the hydraulic press the cocoa butter
content of the .iquor is reduced from approximately 55% to a cocoa presscake
which may have a fat content ranging from 12-25% according to the final
applications of cocoa powder. An alternative route to cocoa butter and cake
adopts expelling or extrusion of cocoa nibs (or even beans themselves to
recover the fat content of the shells) without going through liquor
production. Under expeller pressing it is possible to reduce the fat content
of cocoa cake to 8-9% without great difficulty and so a relatively higher
proportion of butter can be recovered. The flavor of cocoa butter obtained in
this way is mild and in this respect is quite different from that obtained
through hydraulic pressing. Expeller pressing is often used to extract the fat
from sub-standard beans. Another way to extract cocoa butter is through
solvent extraction from expeller cake or cocoa or chocolate residues. Solvent-
extracted butter needs to be subjected to a refining process. A schematic
representation of the various technologies described above is to be found in
Figure 1.
30. In general, the choice of the technology of processing depends on the
relationship between factor costs in each country. Hydraulic pressing in its
various forms is the most widely-used process, especially in developing
countries where capital is scarce (in those countries processes (6) and (7)
are most prevalent). Nib and liquor alkalinization (or the Dutch process) is a
more capital-intensive method that yields deeper-colored cocoa products.
31. The grinding of presscake produced from cocoa liquor results in a
range of good quality powders. Compared to cocoa butter, cocoa powder is very

- 12 -
much a heterogenous product differentiated by fat content, fineness of grind,
coLor and flavor. The powder produced from expeller cake has, in general,
inferior flavor and is also difficult to obtain in a very fine form. In prac-
tice, therefore, the final outlets for powders produced from expeller cake are
more limited.
Technical Rates of Conversion from Beans to Products
32. In the specification of production relationships for cocoa products
in the next chapter, extensive use is made of technical conversion factors. It
is appropriate at this stage to review their derivation. At the initial stage
of processing, liquor or paste is produced from the beans: the liquor content
of 100 tons of beans is approximately 80 tons. The physical composition of
liquor is not precisely fixed, but the conventional view, based on processing
experience, is that some 55% of liquor is fat and the other 45% cocoa solids.
33. Thus, in an ideal situation, 100 tons of beans or 80 tons of liquor
can yield 44 tons of fat or cocoa butter and 36 tons of cocoa solids.
Generally for cost reasons, mechanical pressing does not recover all butter
and defatted cake nor cocoa solids. Depending upon the choice of pressing
equipment, the pressed cake contains fat ranging from 6-8% up to 22-24%.
Liquor pressing is thus a spectrunr of technologies yielding different
quantities of butter and cocoa presscake and it is part of the processing
decision to choose how much butter to recover and what fat to leave in the
cake.

FIGURE 1: A SCHEMATIC REPRESENTATION OF NINE COCOA PROCESSING TECHNOLOGIES
----------------------------------------------CLEANING, ROASTING AND WINNOWING---------------------------------------------------------
1 2 3 4 5 6 7
lI I I . l lINIB ALKALIZATION NIB GRINDING NIB GRINDING EXPELLER PRESSING EXPELLER PRESSING NIB GRINDING NIB GRINDING
NIB DRYING C. LIQUOR C. LIQUOR C. BUTTER C. BUTTER C. LIQUOR C. LIQUOR
NIB GRINDING LIQ. ALKALIZATION LIQ. ALKALIZATION CAKE GRINDING CAKE ALKALIZATION HYD. PRESSING HYD. PRESSING
C. LIQUOR HYDRAULIC PROCESSING ALK. LIQ. GRINDING C, POWDER CAKE DRYING C. BUTTER C. BUTTER
HYDRAULIC PRESSING C. BUTTER HYDRAULIC PRESSING CAKE GRINDING CAKE GRINDING CAKE GRINDING
C. BUTTER CAKE GRINDING C. BUTTER C. POWDER C. POWDER WATER TREATMENT
CAKE GRINDING C | CAKE GRINDING COCOA DRYING
C. POWDERI C. POWDER C. POWDER
SOLVENT EXTRACTION SOLVENT EXTRACTION
C. BUTTERA C. BUTTER
SOURCES: ADAPTED FROM MINIFIE, P. 42,,

- 14 -
34. Therefore, contrary to the impression given by the use, say, of FAO
conversion factors for processing beans to butter and to powder, these factors
do not reflect absolute physical conversion rates. In fact, they represent Lhe
average conversion rates in a specific situation: if the bulk of world
presscake produced is either 10-12% fat content or 22-24% fat content and if
the production of low-fat cake to high-fat cake is in the ratio 2:1, it
follows that on average presscake contains 15% fat. Given that 80 tons of
liquor contains 44 tons of butter and 36 tons of cocoa cake, if the cake
contains 15% fat then 80 tons of liquor will produce 42.4 tons of
presscake [=36 . (1-.15)] and 37.6 tons of cocoa butter [=80-42.4]. The
conversion factors reported by FAO result from supposing that of the 100 tons
of beans producing 80 tons of liquor, half are devoted to each of the two
joint products--cocoa butter and cocoa cake. In that case the following
conversiQn factors result:
cocoa butter = 50/37.6 = 1.33
cocoa cake = 50/42.4 = 1.18
35. Under this same assumption (i.e. on average, cake contains 15% fat),
we can easily derive the technical input-output relationships.
37.6butter production 80 (=0.47) x (Liquor available for pressing)
cake production 42.4 (0.53) x (Liquor available for pressing)80

-15 -
The factors 0.47 and 0.53 are used in the production relationships specified
in Chapter IV.
36. The foregoing suggests two observations. In the first place it
explains why the ratio between prices of cocoa products and prices of beans
does not remain constant. The existence of Joint products and the wide range
for the fat composition of cocoa cake means that a given price for beans is
inadequate to determine the values given to the two essential components of
cocoa beans--the fat which constitutes cocoa butter and the "flavor" which is
what imparts value to cocoa cake.
37. The second observation is that while it is true that production
relationships display fixed proportions, the processes can in fact alter the
proportions in which butter and cake are produced from a given quantity of
liquor by varying the fat content of cake. For example, if we limit the fat
content of cake to vary between zero and 24%, the production possibility
frontier for cocoa butter and cake from 80 tons of liquor, is then described
mathematically by:
BTPD + PWPD < 80
BTPD S 44
PWPD S 47.3
(where BTPD is butter production, PWPD is powder production) and
graphically as shown in Figure 2. In Figure 2, lines from the origin 0

- 16 -
Figure 2: Butter and Cake-Powder Production Possibility Frontiere
Tons ofCocoa Buffer
80
\A ISO-input for 80 Tonsof Cocoa Liquor44-0
B32.7.
0 36.0 47.3 80 Tons ot Cocoa Cake-Powder(0% of Fat) (24% Fat) (55% Fat) (Assumed Buffer Fat Content)
World Bank - 40713:1

- 17 -
which intersect the segment AB 1/ describe alternative liquor pressing
technologies: each line gives the proportions in which butter and cake (of
varying fat content) are obtained.
38. Finally, an intuitive interpretation of the relative valuation of
cocoa products can be given along the following lines. Supply and demand, not
of the quantity of beans but of the quantities of "fat" and "flavor",
determines the value of cocoa beans. Since liquor contains both and requires
1.25 tons of ground beans per ton of liquor, liquor values should be in the
ratio 1.25 times the bean price. Once we turn to the joint products--cocoa
butter and cocoa cake/powder--we find that their composition in terms of "fat"
and "flavor" are very different from that of the cocoa bean. The valuation of
the products by the market indicates that "fat" is more highly valued than
"flavor". If the conventional FAO factors were to be a guide to the market's
valuation of "fat" and "flavor", we should observe butter and powder/cake
being- priced at 1.33 and 1.18, respectively, times the bean price. Actual
product prices show that cocoa butter is valued substantially higher than
this; so much so as to recover almost all the processing cost from butter
alone and to treat cake/powder as a by-product of low value. Only at the time
of the severe bean shortage of 1977/78 has the cake/bean price ratio assumed
importancer (see Table 2) and this event is generally explained as the result
of a significant increase in demand for powder in confectionary and bakery
uses. The model results presented below suggest that the 1977/78 butter/bean
1/ The segment AB intersects the cake production axis at 80, i.e., liquor canbe viewed as cake containing 55% fat.

TABLE 2: COCOA PRODUCT PRICES AND THEIR RATIOS TO BEAN PRICES
COCOA LIQUOR COCOA BUTTER COCOA CAKE/POWDER GPM
PRICE LIQUOR/BEAN PRICE BUTTER/BEAN RATIO POWDER/BEAN RATIO*($/TON) PRICE RATIO (S/TON) PRICE RATIO (S/TON) PRICE RATIO
1961 503.7 1.04 1,052.6 2.17 347.0 0.71 2.881962 421.5 0.92 1,125.4 2.45 314.8 0.68 3.131963 350.7 0.63 1,198.4 2.17 283.2 0.51 2.671964 445.9 0.88 1,179.0 2.33 296.1 0.58 2.921965 319.4 0.87 1,007.8 2.75 265.3 0.72 3.471966 350.1 0.67 1,011.7 1.95 241.4 0.47 2.411967 424.9 0.71 1,221.3 2.04 285.2 0.47 2.521968 546.9 0.76 1,440.9 2.00 308.2 0.43 2.421969 840.8 0.93 1,900.8 2.10 363.8 0.40 2.501970 866.7 1.28 1,618.2 240 429.5 0.64. 3.031971 704.2 1.31 1,296.0 2.41 447.3 0.83 3.241972 710.4 1.10 1,309.2 2.03 423.9 0.66 2.691973 1,101.4 0.97 2,106.8 1.86 480.6 0.42 2.281974 1,941.5 1.24 3,360.3 2.15 658.5 0.42 2.571975 1,836.1 1.47 3,239.0 2.00 848.4 0.68 3.281976 2,057.9 1.00 3,351.2 1.64 1,005.6 0.49 2.121977 4,212.9 1.11 5,137.9 1.35 2,968.3 0.78 2.131978 4,296.5 1.26 4,763.2 1.40 4,689.1 1.38 2.771979 4,149.9 1.26 5,462.5 1.66 3,925.7 1.19 2.851980 3,466.9 1.33 6,293.2 2.42 2,229.0 0.86 3.271981 2,532.1 1.22 5,042.3 2.42 1,173.2 0.56 2.981982 2,258.4 1,30 4,551.0 2.62 1,067.4 0.61 3.231983 2,111.0 0.99 4,013.6 1.89 1,046.7 0.49 2.381984 2,200.0 0.92 4,200.0 1.75 1,050.1 0.44 2.19
* GROSS PROCESSING MARGIN RATIO, OR THE SUM OF BUTTER AND POWDER PRICE RATIOS.
SOURCES: FAO AND IECCM.

- 19 -
and cake/bean price ratios are more convincingly explained by a shift in
liquor processing towards recovering more butter from liquor because of the
bean shortfall coinciding with relatively firm but not exceptional demand for'
high fat content powders. Subsequently, the lagged adjustment in liquor
processing in the period after 1978 toward producing the high fat content
powders resulted in high butter/bean price eatios that persisted through
1981/82, even though bean supplies were abundant.
Historical Product Price Behavior
39. During the 1960's, cocoa liquor was priced below cocoa beans not only
in bean equivalent but also in absolute terms. Indeed, as Table 2 shows, the
liquor to bean price ratios averaged 0.79 over the period 1962-69, with a low
of 0.63--showing that liquor, the product, was priced at only 63% of the cost
of cocoa beans. The bean. equivalent break-even price ratio--which is the
technical conversion factor--is 1.25. There are two plausible explanations for
such product price "backwardation". One is the alleged transfer pricing
practiced by the vertically integrated industries controlling over 60% of
cocoa liquor produced during the 1960s, whereas beans were produced and sold
by more numerous agents. The second explanation, which is related to the first
mentioned, has to do with the fact that since the main purpose of grinding
beans was to extract butter, a small share of liquor produced was traded for
its own value. Thus a thin market situation prevailed in which price did not
reflect the "real" input costs (bean prices) of producing liquor.

- 20 -
40. The 1960s also saw a relatively high butter to bean price ratio
(averaging 2.22) which compensated for the low liquor to bean price ratio. The
low powder to bean price ratio (averaging 0.53) during the same period is also
consistent with the fact that cocoa butter fat was the only valued output of
the cocoa bean grinding process.
41. As the share of liquor produced outside vertically-integrated
operations increased in the 1970s (see Table 1), liquor prices tended to
reflect more closely the technical conversion ratios between the products (see
Table 2). The liquor price ratio exceeded unity during the period.
42. The sum of butter/bean and powder/bean price ratios (a measure of
gross processinig margins; GPM ratio in Table 2) has always been greater than
2.53--the sum of the technical conversion ratios for both products--except
during 1976-77, the period of record-high cocoa bean prices and the slow
product price adjustments.
43. From examination of the cocoa products' price ratios (see Table 2) it
is evident that cocoa butter has traditionally commanded a considerable
premium over the bean price. The converse has been true for powder/cake except
for the period 1977-79. The most important factor underlying the valuation of
cocoa products is the fat content: it is the fat in cocoa products which holds
crucial significance for chocolate confectioners. That this is the case is
further demonstrated by the fact that cocoa powders with higher fat content,
especially when they are alkalized, command prices that are at a considerable
premium to the bean price. A spectrum of cocoa powder prices and price ratios
is presented in Table 3.

- 21 -
TABLE 3: PRICES OF COCOA POWDERS AND POWDER/BEAN PRICE iRATIOS BY BUTTERFATCONTENT AND ALKALIZATION PROCESS, NOVEMBER 28, 1986
Cocoa Powder Price Powder/Bean Price Ratio*(¢/lb)
10-12% Natural Butterfat 48- 53¢/LB 0.5510-12Z Alkalized 58- 63¢/LB 0.6510-12% Red Alkalized 79- 89¢/LB 0.9110-12% Black Alkalized 89- 99¢/LB 1.0216-18% Natural Butterfat 60- 65¢/LB 0.6816-18% Red Alkalized 94- 104C/LB 1.07.22-24% Butterfat 72- 77¢/LB 0.8122-24% Red Alkalized 106- 116C/LB 1.20
* As of November, 1986 when the bean price was C91.8/LB
Sources: Milling and Baking News, and IECCM.
44. It is relevant to note that while cocoa butter is a more or less
homogeneous product, cocoa powder is a highly heterogeneous product,
differentiated by fat content, fineness of grind, color and flavor. The main
outlets for cocoa powders are in the beverage, dairy and bak ng industries.
Another major use of cocoa powder is in the coating of some chocolate-flavored
dairy products. Accordingly, the low-quality, high-volume cocoa powder or cake
obtains quite low prices (relative to bean prices), since this product is
abundant relative to its outlets in the bakery and dairy product sectors. A
very small amount of the cocoa powders used in chocolate flavoring of bakery
and dairy products will suffice to impart the desired flavor. At the other
extreme are premium cocoa powders, produced to specification as special
chocolate flavoring agents, which command very high prices appropriate to a
highly-differentiated product.

- 22 -
45. The preceding points can be illustrated from the behavior of the
price data for cocoa beans, butter and powder in Table 2. From 1975 to 1977,
prices of cocoa powder more than tripled and in 1978 cocoa powder was priced
almost as high as cocoa butter. Having presumably a more inelastic demand (one
reason is the absence of powder substitutes), cocoa powder experienced a far
greater price increase than cocoa butter as a result of the 1976-1978 cocoa
bean shortage. The major reason for the four-fold increase of powder prices
over the above period was due to the large increase in the demand for high fat
powder following a shortfall in the supply of cocoa butter. This price
movement disturbed the traditional price relationship in the cocoa industry
and hence affected the relative profitability of the derived and raw products.
Converters could be expected to give preference in their grindings to powder
production rather than to butter during that period. However, there could not
be a dramatic substitution in production because powder and butter are
produced in technologically-fiynd proportions (although by changing from
pressing to solvent extraction it is possible to change these proportions to
some extent). Industry sources assert that grinders in such a situation would
typically lower their bid on one product (in this case. cocoa butter) as long
as they could compensate through the other product. (See Annex A for a
graphical explanation.)

- 23 -
IV. SPECIFICATION OF THE COCOA PRODUCTS MODEL
46. One of the main uses of the model is to provide the basis for
forecasting cocoa product prices. Although the known differences in income
elasticities between countries argue for the modeling of supply and demand by
region, such an approach is not feasible due to lack of reliable regional data
of the demand and supply of cocoa products.
Cocoa Market Relationships
47. A simplified flowchart of global cocoa market interactions is
schematized in Annex B. The core entities that are the subject of most cocoa
models are the supply and demand for beans and bean prices. Inventories of
cocoa beans have been found to play a key role in short-term price formation
(Weymar). Export strategies such as scheduled sales by non-atomistic marketing
boards can also affect cocoa prices (Gbetibouo). Income and population, the
usual demand shifters, affect the quantity of cocoa beans consumed, not
directly, but via the demand for end products such as chocolate confectionary
and non-confectionary cocoa-based goods. The logical link between the cocoa
bean block and the exogenous end product block is the intermediate product

- 24 -
market. 1/ Prices of intermediate products are determined by output and the
demand for grindings. The quantities of intermediate products depend on the
supply of beans and the technology of grinding.
Structure of the New Cocoa Model
48. The cocoa products' model builds on the Division's cocoa bean model.
2/ In effect, the new cocoa model consists of the cocoa products model
described in this paper together with endogenous bean supply equations taken
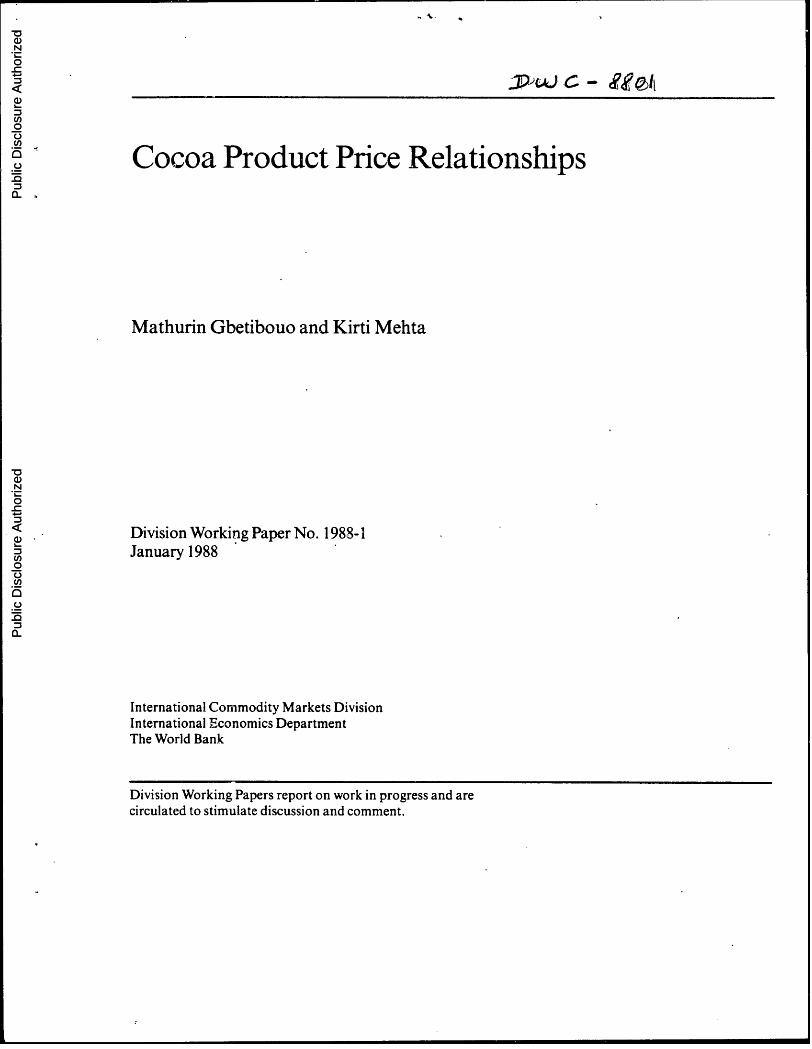
from the cocoa bean model. Figure 3 demonstrates how the linkages between the
two blocks are made. A more comprehensive representation of the linkages is
displayed in Annex E.
49. The supply of beans affects the availability o-f cocoa products via
the technical coefficients of converting beans into products. The demand for
products and the supply of beans jointly determine the prices of the products
which, in turn, affect the profitability of grinding. The expected level of
grindings is one of the major determinants of the current cocoa bean price.
With relevant lags, the price of cocoa beans will affect the production
capacity and supply of cocoa beans in each exporting country as specified in
the bean submodel.
1/ The next step for a comprehensive cocoa model would be to endogenize theend-product market. In the current specification this market is assumed tobe essentially driven by population and income; the substitution effectsof non-chocolate confectionaries are ignored.
2/ See Akiyama and Duncan (1982) and Akiyama and Bowers (1984) for adescription of the bean model

- 25 -
Figure 3: Cocoa Submodels' Linkage
BEANS PRODUCTS
SUPPL G SUPL
Bean N ProductPrices D Prices
43. The processing activity has been described in Chapter III. The
economics of processing as it relates to products' price formation is
discussed in subsequent sections pertaining to the products' price equations.
Since prices in the model emerge as the result of -the adjustment behavior of
product manufacturers to excess demand and to processing margins, it is
necessary to discuss the supply and demand relationships for each product.
Altihough product prices in the model are not strictly derived by equating
supply to demand, a discussion of these relationships is necessary in order to
comprehend the market forces that determine the excess demands for the
products and to justify the chosen proxies for excess demand.
44. Another important relationship is the grindings equation. The
grindings equation links beans to products through the physical transformation
of the beans (the supply side) as well as via the expected profitability or
processing margins (the demand side). The demand for grindings, which is an

- 26 -
important determinant of grindings, is estimated here as the sum of the
individual product demands.
52. The levels of consumption of these products (liquor, butter and
powder) are determined from input demand schedules. These input demands are
expressed by chocolate and cocoa-flavored goods manufacturers. Theoretically,
the demand for the three cocoa products should be expressed as:
PDQi = f (PPi, PO, Ps, Z)
where: PDQi = quantity demanded of intermediate cocoa product i
PPi = intermediate cocoa product i price
PO = output price
PS = prices of substitute inputs
Z = exogenous shifters
53. The difficulty of getting data for some price variables--for
instance, prices of CBE and CBS in the case of cocoa butter demand, and of the
intermediate input in the case of the heterogenous cocoa powder--forced us to
express the stated input demand relations in an ad hoc manner. These demand
expressions, along with other important building blocks in product price
formation, are presented below.

- 27 -
Liquor Production and Demand
54. Production: Liquor production at the world level bears a fairly
constant relationship to grindings. With existing technology, the quantity of
liquor produced from one ton of pressed cocoa beans is 800 kg. Thus
LQPD = 0.8*BNGR
where LQPD = world production of cocoa liquor
BNGR = world cocoa bean grindings
55. Demand: Two components of liquor demand need to be distinguished.
One is the liquor directly used in flavoring confectionaries. The other
component is the liquor pressed for the extraction of cocoa butter. The latter
component is simply a residual found by subtracting from the total amount of
liquor produced the quantity of liquor consumed as direct input by the
chocolate and cocoa-flavored product industries. The direct use of liquor in
chocolate and chocolate-flavored products is viewed as an input demanded in
the production of these goods. Thus the following equation is suggested.
I-D = f(CHPD, CFLPD, BTCHPDR, LQCHPCR)
where
LQD = direct demand for liquor
CHPD = index of chocolate production
CFLPD = index of chocolate-flavored confectionary production
BT2HPDR = ratio of butter use in chocolate production
LQCHPCR cocoa liquor to chocolate price ratio

- 28 -
The ratio expressing changes in the amount of cocoa butter used for chocolate
production (BUCHPDR) captures the impact of a complementary input while the
liquor to chocolate price ratio (LQCHPCR) picks up the price effect. The
chocolate flavor production .(CFLPD) is proxied by the ratio of biscuit to
chocolate production. The level of intermediate consumption of cocoa liquor
should be positively related to the variations of CFLPD. This formulation
suggests that the joint estimation of liquor, butter and powder demands would
lead to efficiency gains since any shocks in liquor demand are likely to be
correlated with shocks in butter/powder demands.
Butter Production and Demand
56. Production: Cocoa butter production is the sum of butter obtained
from the beans and the cocoa nibs. The yield coefficient for the recovery of
butter through mechanical pressing of beans is 0.47 on the assumption that the
average fat content of cocoa powder is 15%. Expeller butter is the relatively
small proportion of butter production that is obtained directly from cocoa
nibs by mechanical extrusion. Thus:
BTPD = 0.47 [LQAV] + EXBTPD
where BTPD = cocoa butter production
LQAV = liquor available
EXBTPD = expeller butter

- 29 -
57. Demand; Demand for cocoa butter is specified as an input demand
function in the production of chocolate products.
BTDM = f(CHPD, CFLPD, BTCHPCR, BTFTPCR)
where:
BTDM = cocoa butter demand
BTCHPCR = cocoa butter to chocolate price ratio
BTFAPCR = cocoa butter to vegetable fats price ratio
Since chocolate confectionary is the main end use for cocoa butter the
variable CFLPD can probably be dropped. Its contribution to the explanatory
power of the equation is likely to be small and, moreover, omitting it may
help in the identification of the BTDM equation from the LQDM equation.
58. Cocoa butter substitutes (CBS) and extenders (CBE) are playing an
increasingly important role in chocolate production. In order to take account
of the substitution of butter by such alternatives we have introduced a price
term in the form of a ratio of the price of cocoa butter relative to the price
of other vegetable fats. The second price term is the butter/chocolate ratio
to estimate the own-price elasticity of the input demand for butter.

- 30 -
Powder Production and Demand
Production: Powder or presscake is produced jointly with butter in
the proportion 53/47.
Thus PWPD = 0.53 [LQAV].
where PWPD = powder produced.
59. Demand: Demand for powder is specified as an input demand function
in the production of chocolate-flavored products, the main outlet for powder.
Thus
PWDM = f(CFLQ, PWCHPCR)
where PWDM = cocoa powder demand
PWCHPCR = cocoa powder to chocolate price ratio
60. Cocoa powder is used in a wide range of chocolate confectionary for
which it is difficult to obtain individual output indices. Since butter and
powder are jointly produced, powder output is necessarily positively
correlated with butter demand. An increase in powder output will lead to a
fall in the powder price and to an increase in powder consumption. Thus,
powder use is likely to vary positively with butter demand. As this
relationship has been incorporated by using OLS instead of a systems
estimator, thus not allowing for across-equation correlation with the error
term of the BTD equation, the simultaneous equation bias in the estimation of
powder and butter demand will not be corrected. The powder/chocolate price
ratio picks up price influences. Given that there are no important substitutes
for cocoa powder, a relative price variable is not included.

- 31
Grindings Equation
61. The cocoa grindings equation can be viewed as being derived from the
constrained minimization of the cost function for an intermediate input. The
grinder wants to minimize costs subject to a predetermined demand for
grindings. 1/ Within this minimization framework, the optimal factor use or
the quantity of beans ground will depend on the marginal physical product of
beans. Assuming that butter is the only valued product of the grinding
activity, this marginal physical product will be equal to the cocoa butter
price multiplied by the fat content. The cost function can be represented as:
C = F + BNPC * BNCR
where C = total costs
F = fixed costs
BNPC = price of cocoa beans
BNGR = grindings
In this simplified cost function, variable inputs other than cocoa beans are
ignored. Thus the following production relationship is suggested:
ACP D D (Q bn)
where ACP - aggregate cocoa product
Qbn = quantity of cocoa beans
1/ Demand for grindings is "predetermined" in the sense that it is assumedthat the grinder holds to a naive expectation about future grinding needswhich is the sum of the observed individual product demands.

- 32 -
Recasting the constrained minimization problem, adding the Lagrangian term and
solving for the first-order conditions yields:
C = F + BNPC* BNGR X [I(Qbn) ACP]
and c= BNGR- X1bn =0
thus BNGR = bn
where X = Lagrangian multiplier
Since a production function has not been formally spe-cified, an analytical
solution to the above optimization problem cannot be derived explicitly. One
can only infer that optimal factor use, in this case cocoa bean grindings,
depends on the marginal physical product of cocoa beans. The value of the
marginal products, assuming that producing butter fat is the main reason for
the grinding activity, is equal to the price of cocoa butter multiplied by its
fat content. It is more convenient to express such returns t6 processing for
butterfat in terms of "processing margins" (FTMG) and measure it as
FTNC cocoa butter * fat content - bean pricebean price
The other important determinant of the level of krindings is the bean input
cost. Grindings in period t are therefore a function of the demand for
grindings derived from the rate of use in period t of liquor, butter and
powder as well as two other factors: one is the cost of the input (cocoa
beans), while the other is the net processing margin. The following equation
is suggested:

- 33 -
BNGR = f (BNGRDM, FTMG, BNPCD)
with
BNGRDM = LQDM + 0.5 x [BTDM + PWDM]0.8 0.47 0.53
where ;NGRM = derived demand for grindings
BNPCD = deflated bean price
62. We encountered various difficulties in attempting to estimate the
above equations. The following discussion reports the major data deficiencies
and proposes alternative methods for determining the consumption and output of
cocoa products when these data are not observable.
Data Deficiencies
63. The principal areas in which data are lacking is in the consumption
of cotoa products--the direct use of liquor, and cocoa butter and cocoa powder
demand. Several options to overcome these data deficiencies suggest!
themselves. In the first place it may be assumed that demand is
observationally equivalent to production over the sample period. Given the
vertically-integrated nature of cocoa products and downstream manufacturing,
this assumption is not entirely unrealistic. For example, liquor (which
imparts the flavor in chocolate) can be produced to the level required for
chocolate and cocoa butter and presscake manufacture. There has, however, been
an erosion of the integrated production structure as the bean-producing

- 34 -
countries have become important suppliers of cocoa products. Industry in
certain consuming countries, the Netherlands and the Federal Republic of
Germany, for example, has also been an important non-captive supplier of cocoa
butter and powder. Also with merchant supplies and markets for cocoa products
available it is evident that firms hold stocks of cocoa products rather than
hold all stocks in the form of beans. In consequence, the assumption that
cocoa products demands are observationally equal to their production needs
modification even though regressions for cocoa products demand as functions of
chocolate output (CHPD) and the product's relative price vis-a-vis chocolate
wholesale prices show quite good fits.
64. A second approach would be to construct data on the demand for cocoa
products directly from recipes for chocolate confectionary and chocolate-
flavored products. Such an approach would have to be at an individual country
level since recipes and the composition of chocolate confectionary (solid
chocolate, filled bars, etc.) vary greatly from country to country. Such an
approach would also need to estimate import and export functions for the cocoa
products. Since recipe information is not available at the country level,
certainly not on a yearly basis, this approach is not feasible. An estimate
of the average world recipe for chocolate confectionary and chocolate-flavored
products can be obtained simply by regressing world grindings on world
chocolate production. Given the increasing importance of supplies of cocoa
products from bean-producing countries it might be preferable to estimate this
regression over the period before 1973, from which date a large volume of
cocoa products started flowing from the origins. By applying the respective
product technical conversion factors to grindings, estimates of liquor, butter

- 35 -
and presscake/powder in chocolate confectionary and flavored products' recipes
can be derived.
65. Another way to derive estimates of the demand for cocoa products is
to maintain the assumption of equivalence between the demand for cocoa
products and production in the chocolate-producing countries while, at the
same time, interpreting imports of cocoa products from the bean-producing
countries as a component of the demand for cocoa products. The difference
between the output of cocoa products in the bean-producing countries and their
exports would be taken as the change in stocks.
66. With either of the latter twc approaches, it is evident that the
estimated demand will be subject to a certain degree of measurement error. In
the model specified above the demand for cocoa products enter the world
grindings equation as regressand variables; hence, there are unlikely to be
untoward major econometric consequences from the measurement errors. Where
they enter as regressor variables, it is necessary to employ an instrumental
variable estimation procedure in order to obtain consistent estimates.
Estimates of the Demand and Supply of Cocoa Products
67. The methods adopted for estimating the demand and supply data of
cocoa products are based on knowledge of the processing technology as well as
on the worldwide market behavior of manufacturers.

- 36 -
68. Consumption: Data on the consumption of cocoa butter, powder and
liquor by individual countries are not available. Thus intermediate
consumption of cocoa products is calculated at the world level in order to
avoid compounding possible measurement errors. It is calculated simply a's the
sum of bean equivalent production (i.e. grindings times the product yiel'd) by
the industrial countries and the net exports by the bean-producing countries.
This method of construction is consistent with the last of the three
approaches described earlier and seems the most suitable given currently
available information. Thus the total intermediate use of product can be
specified as follows.
WDDM = Y1 * INDGRD + DEVNX.
where
WDDM. = world consumption of cocoa product i1
Yi yield of cocoa product i per unit of cocoa bean ground
DEVNX. = net exports of cocoa products by bean-producing
countries
INDGRD = grindings of cocoa beans by industrial countries
69. Output: The construction of output data was necessary because the
only published information (by the United Nations in Industrial Statistics) is
sketchy and is lacking for important cocoa consuming countries such as the
United States and some Eastern European countries including the USSR. Global
output of cocoa product is thus expressed as a technical ratio of world
grindings.

- 37 -
70. Consumption and production of each of the cocoa products was
estimated in the following ways.
(i) Cocoa Liquor Production
71. There are three methods of approximating the quantity of cocoa liquor
directly used in chocolate confectionai'ies, based on:
- recipe information
- sampling, and
- econometric construction
72. Recipe information: Giver; the confidentiality surrounding such
information, manufacturers would not provide exact figures. However, they
confirmed that our estimates were within a reasonable range. The range for the
amount of cocoa liquor directly used in chocolate is 8-14%, depending on the
manufacturer and the confectionary. We also noticed significant differences
across countries. Because of these differences, we considered obtaining the
average use from a "global" recipe of world chocolate production via the
following alternatives.
73. Chemlcal analysis of chocolate confectionaries: The most direct way
of obtaining the quantity of cocoa liquor present in a candy bar is by
chemical analysis. In 1986 technicians of the magazine Consumer Reports
conducted such experiments on 58 brands of chocolate bars (see Table 4). From
their cross-sectional analysis we estimated the unweighted average liquor
content to be 11%.

- 38 -
TABLE 4: COCOA MASS OF LEADING CHOCOLATEBAR BRANDS SOLD ON THE US MARKET
SAMPLE SIZE COCOA MASS PERCENTAGERANGE AVERAGE
DARK CHOCOLATES 17 13-25 17
MILK CHOCOLATES 16 2-16 6
WHITE CHOCOLATE 3 0 0
CHOCOLATE BAR PLUS 22 2-21 9
AVERAGE BAR 58 2-25 11
SOURCE: CONSUMER REPORTS, NOVEMBER 1986, PP. 700-1.
74. According to this study the cocoa content of chocolate confect-
ionaries sold on the US market varies from zero for white chocolate 1/ to 25%
for some dark chocolate brands.
75. For an estimate of worldwide liquor use, the unweighted US average
would be a gross approximation because of the differences across countries in
consumer preferences by categories of chocolates. Europeans, especially the
British, tend to have a preference for milk chocolate over dark chocolate.
Also, European consumers seem to prefer chocolates with less filling than
their US counterparts.
1/ These products are still called "chocolate" because they contain cocoabutterfat to provide the melting property. The chemical analysis found atmost only some traces of cocoa flavor.

- 39 -
76. Econometric estimation: A simple approach to estimating the quantity
of liquor directly used in confectionaries at a world level is a regression of
world grindings on chocolate output. This statistical relation can be viewed
as a reduced-form, input demand equation derived from the production of
confectionaries.
Thus
BNGR = aCHPD + constant
multiplying throughout by 0.8 yields
0.8 * BNGR = 0.8 (aCHPD + C) ; where C is constant.
77. The left hand side of the above relationship is equivalent to the
total amount of liquor produced. It can be further decomposed as the sum of
liquor used directly (LQUS) and the liquor used for pressing (LQAV). Thus
LQUS = (0.8 * a) CHPD-LQAV + C
From the above, the coefficient (0.8a) of CHPD can be interpreted as an
indicator of the average recipe for liquor used directly. In the estimated
regression, a was equal to 0.13. Thus 0.8a , or about 10%, can be considered
the average liquor content of chocolate confectionaries. This figure is close
to the 11% liquor content resulting from the chemical analysis reported above.
- 40 -
78. The implied recipe information from the regression analysis was
selected as the basis for generating the butter and powder production
estimates.
ii. Cocoa Butter and Powder Production and Consumption Data
79. Subtracting the amount of liquor used directly.for chocolate confec-
tionary from total liquor produced (LQPD) leaves the balance available to be
pressed for cocoa butter and powder (LQAV). Assuming an average fat content of
powder of 15% and that powder (PWPD) and butter (BTPD) are jointly produced in
fixed proportions, the amount of the two products can be estimated as follows:
BTPD = 0.47 * LQAV
PWPD = 0.53 * LQAV
The demand for cocoa butter can be estimated by adding the supplies from bean-
producing countries to the cocoa butter yielded by grindings in industrial
countries. Intra-industrial country trade in cocoa butter can be ignored.
BTDM = 0.37 * INCBNGR + BPCBTNC
where
BTDM = World use of cocoa butter
INCBNGR = Grindings in industrial countries
BPCBTNX = Net exports of cocoa butter by bean-producing countries

-41-
80. Powder use is derived as a residual in the sense that unused cocoa
fat (i.e. available liquor less pressed cocoa butter) is converted into powder
of various fat content. If cocoa powder consumption is in the same proportion
as implied by the FAO conversion ratios in which high-fat (22-24%) and low-fat
(10-12%) powders are produced, i.e. one-third and two-thirds respectively, the
average fat content is 15%. Powder use can therefore be estimated as.
PWDM = [0.55 * liquor available less butter produced]/0.15
81. For the purpose of determining powder prices, it is preferable to do
the analysis in terms of unused cocoa fat rather than arbitrarily converting
it to cocoa powder use by applying an average fat content factor. The former
is the procedure used in this study. If interest is focused on the end uses
for cocoa powder, clearly a more refined approach using recipes, alternative
flavorings and their prices needs to be incorporated in order to estimate
powder use by type of powder.

- 42 -
CHAPTER V. PRODUCT PRICE FORMATION: THEORETICAL DISCUSSIONAND EQUATION SPECIFICATION
Review of Literature
82. The aim of the paper is to model the determination of cocoa product
prices and derive a relationship linking bean and product prices. Given the
characteristics of the cocoa bean and its derived products, a logical source
of inspiration for modeling such price behavior seems to be in the joint
production literature.
83. The theory of joint production is not new. However, it was only
relatively recently that it has been carried beyond the textbook examples of
wool and mutton, iron and steel, or beef and hides etc. V1 Laitinen has
extended the theory of the traditional, homogeneous, single good firm to the
multiproduct case. Pasinetti (1980) has also applied the joint production
theory to analyze the bivalent nature (in terms of stocks and flows) of
capital goods. The general problem these studies try to solve is that of an
optimal transformation of the joint outputs in a multi-input, multi-product
framework. Dynamic extensions of this methodology have been tried by some
authors to solve the temporal optimization of a multiproduct firm (Laitinen).
1/ For a comprehensive review of joint production studies, see Laitinen(1980) pp. 2-12.

- 43 -
84. The problem of interest in the current project is purposely kept more
in the vein of the classical examples in the sense that the joint products are
produced in nearly fixed proportions; although by changing technology the
proportions can be changed. Therefore, there is no form of arbitrage. In the
cocoa products' economy, several technologies are available for converting
beans into butter and powder--with each yielding relatively fixed
proportions. The problem of the converter is to choose among these
technologies.
85. If cocoa butter and hence cocoa powder are fixed-yield, joint
products of cocoa beans (the beans contain a fixed fat content and
technologies succeed to a varying extent in recovering the fat content), the
linkage between product and bean prices could be specified in the following
theoretical relationships:
(i) BNPC = w 1BTPC + w2PWPC + w3LQPC
w1BTPC + w2PWPC + w3LQPC(i) E bn
1 (w BTPC) + 1 (w PWPC) + 1 (w LQPC)1 2 3
bt pw lq
86. Relationship (i) simply states that the price of cocoa beans is the
weighted sum of the prices of the twin products--with the weights being the
yields per unit of beans. This relation could be imposed as a consistency
constraint that prices must satisfy in equilibrium and when products are
valued solely on the basis of their fat content. Because liquor is produced
for direct use there is no reason for (i) to hold and in fact it rarely holds
in practice.

- 44 -
87. Relationship (ii) is derived from Ci) but imposes an even more strict
restriction on the elasticities. 1/ Relation (ii) holds if, as should be the
case when joint products are obtained in fixed proportion, the price demand
elasticity of beans is the weighted harmonic average of the price elasticities
of butter and powder.
88. Another interesting relationship to observe, if margin equations
could be estimated, is the one suggested by Brandow (1961). He assumes that if
margins are a linear function of output,
M = k + aAx where O S a <1
and kŽO
where M = margins, Ax = output, and k = a constant.
the raw (bean) demand elasticity in our case becomes:
(iii) E = Er (1 - k A
where Er is the retail level elasticity (for cocoa-based end products).
Relation (iii) could be more practical and relevant to our purpose since cocoa
butter and cocoa powder have two separated end use markets (chocolate for
butter and bakery; dairy or drinks for powder).
1/ Mathematical derivation of relation (ii) for a two joint-product case ispresented in Annex F.
-45-
89. So relation (iii) suggests a linkage of the cocoa model blocks
through a simple margin equation.
90. Although neither of the above relationships are tested in the
analysis, they could be exploited in further model developments. However, as
will be demonstrated, omission of such a relationship does not invalidate the
analysis as long as observed and predicted price ratios fall within certain
boundaries and the analysis is conducted within such limits.
Formulations of Product Price Equations
91. The model of price formation developed in the current study follows
from the assumption that each product market clears in the traditional manner
exposited by Arrow (1959). Thus, a price adjustment equation that equates
demand to supply or that nullifies the excess demand relation is specified for
each product.
S = S(P, a)
D = D(P, S)
dP H (q - q ) = H [D(P, a) - S (p)]dt d s
or
AP = f (excess demand)
92. In the usual treatment, equilibrium prices are found by solving for P
and assuming that supply equates to demand without any explicit explanation of

- 46 -
the trial-and-error processes that stabilize the above system. The price
equations specified in this study attempt to describe explicitly the
adjustment behavior of cocoa bean processors in their grinding and pressing
operations. This calls for 3n alteration of the above adjustment equation as
follows:
AP = f (excess demand, processing margins)
There are several reasons for adding the second explanatory variable,
processing margins. One reason is the absence of a terminal market for these
products similar to those of New York or London for cocoa beans. In addition,
because liquor, butter and powder are intermediate produicts, their pricing
will reflect a cost-plus element.
93. The specific formulation of each product price equation will be
discussed in subsequent sections. A general form for such equations is
APP Xi [PP e pp ] + XDP ; yi>1it 1 (i-.i)
where PP = product price
ppe - "warranted" price
XDP = excess demand
= adjustment parameter
1 - 1, 2, 3 and 4 for respectively bean, liquor, butter and
powder.

- 47 -
940 Further definitions of "processing margins" and "warranted" price are
in order. In the current context, processing margins should not be
interpreted as mark-up, the component of price above the average variable cost
added to cover overhead costs and profits. Instead, margins are interpreted
here, following a less conventional definition (Tomek and Robinson, 1981,
p.122), as the price of specific marketing services that satisfy time, space
and form utilities. The current study is more concerned with form utility, in
that product prices are hypothesized to include the cost of the service of
transforming cocoa beans into various products. The supply and demand for such
a service depends on input costs of which the cocoa bean price is an important
component. 1/
95. The "warranted" price is the value of the product such that the
market is form efficient--meaning that the-raw and deriv>.d products' prices
are separated by the processing costs. In the absence of processing cost data,
inference about form efficiency can be made from the wedge between the actual
price of the derived product and the raw product price times the technical
conversion factor. It is this latter entity, (raw product price times the
technical conversion factor) that is called the "warranted" price. Its
inclusion in the price adjustment behavior model is consistent with optimality
conditions of the multiproduct firm whereby product price ratios should equal
the ratios of the rates of product transformation.
1/ Further discussion of pricing of joint-services with alternative productforms is found in Bressler and King (1970, Chapter 9).

- 48 -
96. Turning back' to the price adjustment equation, the parameter X
accounts for the technical lag in changing processing technologies to adjust
prices to their "warranted" level with respect to the bean price. The term in
the square brackets is a proxy for the expected profitability of processing;
whereas the last term is a measure of excess demand for an individual product.
97. To summarize, the X. and PP e of individual product price equations1 1
of the general form written above are developed as
Xi = f(STGRR); i>2
where STGRR = stocks to grindings ratio,
and
for liquor: 2 = f(BNPC)
for butter: PPe = f(PP2, pP3); and
for powder: PPe f(P PP2)
98. The adjustment parameter for both butter and powder can be made a
function of the stocks-grindings ratio on the grounds that adjustment of
prices for products to the level of processing required to satisfy the

- 49 -
expected demand for grindings will vary with the amount of beans available. 1/
The estimation of the price equations using X specified as stated above works
well for butter but not for powder. This result is consistent with the fact
that butter has for a long time been considered the main product in the
processing of cocoa beans. The individual product price equations estimated
are discussed below.
Liquor Price Equation
99. The liquor price equation takes the following formulation:
ALQPC = X1 [a1 BNPC - LQPC_] + LQXDM
where LQXDM = excess demand for liquor
1/ See Abramovitz (1959) and also Nerlove (1972) for a general theoreticaldiscussion of price formation and adjustment costs. Peel and Walter (1983)tested for the case of the labor market, the hypcthesis that the speed ofadjustment of the actual to the desired level of employment is partlydetermined by the size of the excess supply of labor. By analogy, it isclaimed here that the availability of beans will influence X , which in turn,with product in excess demand, will affect the price adjustment at period t,
(Pit)

- 50 -
100. A rigorous specification of the excess demand for liquor requires
logically to substract grindings (the supply element) from the bean-equivalent
liquor demand. However, since the demand for liquor is not observable, it
seems reasonable to construct the "demand component" of an hypothetical excess
demand for liquor from chocolate production. Thus a proxy for liquor in excess
demand is formulated as follows.
LQXDM = a + $CHPD + yBNGR + nSTGR
101. The CHPD term measures the demand aspect. Other demand effects could
be captured by including chocolate-flavored goods production; but this
additional variable would introduce multicollinearity with CHPD. The constart
term a is included to pick up any residual demand effect.
102. The "supply component" of the hypothetical excess demand is proxied
by grindings, BNGR, and the stocks-to-grindings ratio. The latter variable is
added to compensate for the absence of the (unobservable) liquor stocks. In
addition, STGR will reflect the effect of potential liquor supply since the
size of stocks naturally influences the availability of beans for liquor
processing and hence excess demand for liquor. The term STGR is developed as
the ratio of lagged stocks to current grindings as cocoa liquor is pressed
from the current crop and from existing stocks.

- 51 -
Putting all the pieces together, the liquor price equation becomes
ALQPC = XI[a 1BNPC LQPC_1 ] + a+aCHPD + 6BNGR + nSTGR
The priors on the coefficients are as follows:
0<X <11
a >0
1a>0
6<0
n<O
The prior on the adjustment parameter of cocoa liquor indicates that
the adjustment of the actual liquor price, LQPC, to the "warranted" liquor
price, LQPCe, is not instantaneous. The "warranted" price is a function of
the cocoa bean price. Since the latter constitutes a cost to the cocoa liquor
presser, ac1 should be positive. The coefficient a for the "demand side
component" CHPD of the excess demand of cocoa liquor should also be
positive. The coefficients 6 and n should be negative since they relate to
the supply side components, grindings and bean stocks, of the excess demand
for liquor.

- 52 -
Cocoa Butter Price Equation
As a first approach we can specify
ABTPC = Xb [BTPC eBTPC 1]
On the basis of the common view among processors that butter is valued at the
fat content of the cocoa bean, this equation can be respecified as
ABTPC = Xb [abBNPCBTPC_l]
103. The above formulation implies that ab should be close to the butter
conversion rate 1.33. Unlike the liquor rate, this conversion factor is
derived from an arbitrary assumption regarding the fat composition of the
presscake/powder (see previous chapter). Thus it is riot expected that
ab should turn out to be exactly 1.33.
104. A reformulation of the equilibrium butter price, BTPCe or a bBNPC, is
necessary given the weakness of the adopted bean price proxy in conveying
information about quality premia for butter from different sources. The
International Cocoa Organization price used as the indicator for cocoa prices
is a futures price that has not been adjusted for quality differentials.
Furthermore, taking into account the breakdown of vertical integration in the
cocoa industry it seems appropriate to determine BTPCe in terms of other
product prices rather than solely in terms of bean prices. Thus,

- 53
BTPCe = f (LQPC,PWPC)
The liquor price can be considered predetermined to the presser. Similarly,
where butter is the main product, the powder price is the by-product credit.
The two price variables are sufficient to fix the value that the processor
would give to butter since they determine the processors' operating margin.
105. Observed prices may deviate from the "warranted" price for several
reasons. For instance, actual prices can differ from the "warranted" level in
the case of excess demand for butter. Usually, such excess demand exists when
there is a shift in recipe in favor of milk chocolate and away from dark
chocolate. To capture this tendency, the variable butter use/liquor use ratio
was chosen to proxy the excess demand for butter. The more conventional
measure of excess demand for butter is butter use less butter supply. Butter
supply can be constructed as defined earlier as the product of the liquor
available and the fat content plus expeller butter. However, since historical
data for expeller butter production do not exist, an equation for that
component of butter supply could not be estimated. Butter use is also
unobservable and has to be proxied by CHPD. Against this background the
measure proposed, ratio of butter to liquor use, appears as the least
problematiic proxy.

- 54 -
106. So the equation to be estimated for the butter price becomes
ABTPC = X (a LQPC + acPWPC-BTPC )+ a + a BTLQUSRb bLP b -1 1 a2
with Xb = f(STGR)
where BTLQUSR = ratio of butter use to liquor use
The priors for the cocoa butter price equation are:
0<Xb<1
ab>0
ab<°
a2>0
The rational for the expected signs on Xb and ab is the same as that
for X1 and a1 in the case of the cocoa liquor price equation. The coefficient
a' for the cocoa powder price PWPC should be negative to reflect the jointb
product nature of cocoa powder and cocoa butter. When the cocoa butter price
is high, the cocoa powder price is low as a result of either a second-round
effect of an increasing supply of cocoa butter (and thus cocoa powder), or as
a result of the willingness of manufacturers to accept lower bids on cocoa
powder. The coefficient a2 on BTLQUSR, representing an intermediate demand,
should be positive.

- 55 -
Powder Price Equation
107. Following the development of the butter price equation, the powder
price equation can be respecified as
APWPC = X IPWPCe - PWPC 1] + PWXDMp
where PWXDM = excess demand for cocoa powder
108. A simple way of formulating PWPCe is to relate it to the input price
(liquor price) and the main product price (butter price). In the case of the
powder price we do not make the a priori claim that the powder-bean ratio
should tend to the technical conversion ratio. As for the excess demand
variable, the demand and supply for powder can be represented respectively by
CFLPD (cocoa flavored output or the food production index) and the unused fat
(i.e., the difierence between the liquor available and the cocoa cati'ter used).
If one makes the arbitrary assumption of 12 to 15% fat content in cocoa
powder, the unused fat variable is measured as liquor available times 0.53.
The powder equation then becomes
APWPC = X [PWPC e _-WC c~ + C1 FTBI + C2 UNUSFTp[ -1] 0 1 2
or
APWPC = X [a LQPC + a BTPC-PWPC_1] + C2+C1 FBTI + C UNUSFT
where FTBI = food, tobacco and beverages index
UNUSFT = unused cocoa fat.

- 56 -
The priors for the cocoa powder price are:
0<X <1p
a >0p1
* <0p2
C >0
c2<0
The rationale for the expected signs on X , a 1 and a 2 follow the
same logic as that in the case of the price of cocoa butter. The demand side
element, the proxy for biscuit production (FTBI) should be positively related
to the price of cocoa powder; whereas the supply side element, the unused
cocoa fat, relates negatively to it.

° 57 -
VI. ESTIMATION OF COCOA PRODUCT DEMAND AND PRICE EQUATIONS
Grindings Equation
109. To review the previous discussion, grindings are specified as a
function of the expected demand for grindings, the expected margins recovered
from the grinding operatiorn and the deflated bean price. The estimated
consumption data allows the computation of a demand-for-grindings variable
which is measured as the bean equivalent sum of the liquor, butter and solids
use. This demand for grindings is satisfied from current grindings and from
changes in the inventories of cocoa products. The demand for grindings is
therefore a predetermined variable to the grindings decision and, hence, one
can specify a grindings equation as the solution to the problem of minimizing
costs of griindings given a predetermined demand and the bean and products
prices.
110. By modeling grindings in this manner it is possible to capture the
effect on grindings of the relative demands of the three cocoa products and
the relative price structure of the products vis a vis each other and with
respect to the cocoa bean price.

- 58 -
111. The estimated grindings equation is reproduced below 1/
ln BNGR = 0.2561 + 0.8817 In BNGRDM + 0.0327 In FTMG(1.27) (15.62) (2.27)
+ 0.0924 In BNGR(-l) 0.0177 ln BNPCD(1.68) (-4.13)
-2R 0.99 DW = 1.64
112. In this specification the variable FTMG can be viewed as the
difference between the liquor/bean price ratio and the returns to liquor
pressing (butter and powder prices) relative to the liquor price. Grindings
are positively related to this difference. When this difference is low, i.e.,
when FTMG takes on a low value or if returns to pressing are high relative to
the liquor price, grindings tend to decline. Such a decline would work its way
through to an increase in the liquor price and hence into FTMG in the
subsequent period. The experience of 1980-83 is a good illustration of this
relationship when the annual increase in grindings was limited because the
liquor/bean price ratio remained fairly stable while returns from butter and
presscake were increasing.
i13'. The short- and long-run price elasticities of grindings with respect
to changes in the cocoa bean price (BNPC) are derived from computing the
following expression:
1/ Most variables have been already defined in previous sections; but toenhance the reading of the subsequent equations, the variabledescriptions are repeated in the table at the end of this chapter.

- 59 -
dogBNPC In BNGR dlogBNPC [-8817 ln BNGRDM + .0327 In FTMG
-0.0177 In BNPCD]
114. Given the combination of equations in log and arithmetic forms, we
can only say something about elasticities at sample means. (At sample means
the ratio BNPC/BNGR is close to unity, which facilitates the computations.)
Thus, the short- and long-run price elasticities of world cocoa grindings at
sample means are respectively -0.4 and -0.45. Therefore, by including the
relationships between cocoa products and grindings, the estimated short-run
price elasticity turns out to be much larger than the previously estimated
elasticities of around -0.25 when products were not included in the
specification. In specifications which have not included cocoa products, the
long-run elasticity estimates have been found to be fairly close to that
estimated above, confirming indirectly the above approach.
115. A larger elasticity estimate was expected since beans are ground not
only in response to signals from the end-product market but also in response
to changes in the relative profitability of using cocoa fat instead of other
vegetable fats. In turn, cocoa product demand (a component of total
foodstuffs) is essentially driven by income and population growth. At the
world level, income and price elasticities of cocoa product demand are bound
to be small as is expected of most food items. However, the fact that other
vegetable fats can substitute for cocoa fats increases the price elasticity.

- 60 -
Cocoa Products Demand
116. Estimation of the cocoa products demand relationships presented
earlier gave the following results.
Cocoa Butter Demand:
BTDM = 140.5367 - 22.6270 BTCHPCR - 41.9642 BNCHPCR(4.3999) (-1.1976) (-2.6045)
+ 0.7544 BTDM(-1) - 0.6256 BTFTPCR(7.7750) (-1.0781)
+ 0.0240 CHPD(1.7897)
-2R 0.892 s.e.e. =12.769 DW 2.43
117. The chocolate-flavored output variable was dropped for the reasons
stated earlier.
118. All coefficients have the expected signs although some are not
significantly different from zero at the 95% confidence level. The t-value for
the coefficient of BTCHPCR is low because that variable is certainly
correlated with BNCHPCR.
119. Inclusion of the variable BTFTPCR is intended to account for the
impact of substitute non-cocoa fat (NCF) use in chocolate confectionary. The
results suggest that such an effect has not been significant--which is in line
with reality in the Unites States where NCFs are prohibited and in the EEC
where their use is strictly regulated or limited, as in the United Kingdom.

- 61 -
Cocoa Powder Demand:
PWDM = 191.0189 - 40.2711 PWCHPCR + 0.4468 PWDM(-1)(4.6576) (-4.2804) (3.4646)
+ 28.6580 BSCHPDR(2.0125)
2= 0.745 s.e.e. = 16.043 DW 1.63
120. The price elasticity implied by the above input demand equation is
-0.06. Such a low elasticity is consistent with our earlier explanation of
the quadrippling of cocoa powder prices during the period 1976-1978 when there
was a shortage of cocoa beans. It is also consistent with the facts that, as
stated earlier, cocoa powder has virtually no substitutes in the chocolate
flavoring industry and that expenditures on cocoa powder represent a
relatively small proportion of the input requirement of end product
manufacturers.
121. The equation furthermore shows that the level of chocolate-flavor
production activity influences positively the quantity of intermediate
consumption of cocoa powder.
Cocoa Products Price Equations
122. The prices of cocoa products are hypothesized to adjust to their
equilibrium values which are determined by either the technical conversion
rates (from bean to liquor) or, where there are joint products, by technical
conversion ratios modified to take account of relative demands for the joint
products. Effectively, product prices adjust to eliminate excess processing

- 62 -
margins in their production. A second component in the:'price equations is the
degree of excess demand for the cocoa product in question.
The estimated price equation for liquor is as follows:
A LQPC = 1422.97 + -0.924 BNPC - 0.841 LQPC_ 1 ,(2.57) (14.86) (12.7)
-1706.4 STGR + 0.106 CHPD(3.6) (0.76)
-0.72 BNGR(1.6)
-2R = 0.95 s.e.e. = 132.17 DW = 2.23
The estimated price equation for butter is
A BTPC = -2558.17 + 5.09 * STGR * LQPC(1.3) (5.74)
-1.651 * STGR * PWPC(2.77)
-1.681 * STGR * BTPC_.(5.4)
+ 1394.7 BTLQUSR(1.66)
R = 0.80 s.e.e. = 294.33 DW 1.806.
Finally, the estimated equation for powder prices is
A PWPC = 1271.67 + 1.405 * LQPC - 0.766 * BTPC(2.67) (15.65) (7.51)
0.6714 * PWPC_1 + 7.97 * FBTI(11.33) (1.002)
-26.443 * UNUSFT(1.99)
02R=0.94 s.e.e. = 177.5 DW =2.05

-63-
123. Considerable insight is cast on the estimated equations by rewriting
them in accordance with the theoretical partial adjustment model suggested
above and substituting the empirical counterparts for equilibrium prices. This
reformulation yields:
A LQPC - 0.84 [1.1 BNPC - LQPC_1] - 1706.0 STGRv 0.106 [CHPD + 14229 - 7.16 BNGR]
A BTPC = 1.68 * STGR * [3.03 LQPC - PWPC - BTPC_1 + 1394 BTLQUSR - 1.83]
A PWPC = 0.67[2.09 LQPC -0.14 BTPC - PWPC.1]*7.97 [FBTI + 159.6 - 3.3 UNUSFT]
The equations can now be interpreted in terms of the reasoning outlined
earlier. The first term in the brackets on the right hand side of each
equation represents a measure of the expected margins in the processing of
each product, or, put another way, the difference between the "warranted"
price and the lagged price. In the case of butter prices, the parameter
expressing adjustment of the butter prices to the expected margin is also a
function of the ratio of stocks to lagged grindings.
124. Estimation of the cocoa product price model indicates that the
adjustment of prices to their warranted level is not instantaneous and that,
in fact, product prices are seldom a fixed (technical conversion factor)
multiple of cocoa bean prices as implied by those models which omit cocoa
products sector. For example, the cocoa liquor price adjustment parameter is
less than unity (0.84) and the liquors price is related to the bean price by a
factor of 1.11, not by the technical conversion factor of 1.25. This finding
has an important implication as the cocoa product-cocoa bean price ratio is

- 64 -
often used as a guide in assessing the costs-benefits of processing cocoa
products versus exporting raw cocoa beans, as well as in the choice of the
proc,wding technology. The speed of the adjustment of cocoa butter prices to
their warranted level varies positively with the size of cocoa bean stocks
available for pressing. The average adjustment parameter is 0.6. But when
cocoa beans were relatively scarce as in 1977, it decreased to 0.32--
suggesting a slow adjustment of cocoa butter prices to their warranted
level. The fastest adjustment occurred in 1965, which is also the year the
ratio of cocoa bean stocks to grindings, reached its highest level. The
adjustment coefficient was close to 1.0 and the bean stocks to grinding ratio
was 0.79.
125. The second term in square brackets on the right-hand side of each
equation is a measure of excess demand for the product. In the liquor price
equation, demand for liquor is represented as a function of chocolate output
while liquor supply is represented by grindings. Similarly, in the powder
equation, demand for powder is a function of the food output index while
supply is the quantity of unused fat. In the butter equation the demand for
butter is directly measured as butter use. The supply of butter is difficult
to measure directly since it depends on the quantity of liquor produced less
liquor directly used in chocolate manufacture. The supply of butter is thus
estimated as a constant multiple of liquor use.
126. A s1cmmary of the results of the key estimated equations of the cocoa
product market model is present-ed in Annex E.

- 65 -
Equilibrium Product Prices
127. The equilibrium or warranted prices can be derived ,from the
simultaneous equation system set out below.
LQPCe = 1.1 BNPC (1)
BTPCe = 3.03 LQPC - 0.98 PWPC (2)
PWPCe = 2.10 LQPC - 1.14 BTPC (3)
The system represents threie equations and four unknowns and assumes that
LQP=QPCe, BTP=TPCe, and PWPC = PWPCe. Otherwise, there would be seven unknowns
with three equations. However, there are three equations that can be added to
the above system.
LQPC = LQPCe + (4)
BTPC = BTPCe + r2 (5)
PWPC = PWPCe + r3 (6)
here r. = the respective excess demand variables.1

- 66 -
By substit-ution, the consolidated system of six equations and seven unknowns
can be reduced to the following
LQPCe = 1.1 BNPC (1)
BTPCe = 3.33 BNPC + 3.03 r - 0.98pWpCe - 0.98 r (2)1 3
pWpCe = 2.31 BNPC + 2.10 r - 1.14 BTPCe - 1.14 r2 (3)
To solve the system, the simplest approach is to set LQPC=LQpCe and then set
alternatively PWPC = PWpCe and BTPC = BTPCe. Since the values of the r.s are
unknown, except for the fact that they depend on bean and product prices, the
only way to estimate the relationship between equilibrium butter and powder
prices is by assuming that liquor and butter excess demands are nil
(r'=r2=0) or that liquor and powder excess demands are nl.l. (r1=r3 =0).
128. Using identity (1) and dividing throughout by BNP in the "warranted"
price relations (2) and (3) (having assumed that LIQP equals LIQPe)
gives the following
BTPCe PWPCBNPC = 3.03 * 1.1 - 0.98 (4)
BNPC BNPC

- 67 -
To solve (4) we set LQPC=LQPCe and PWPC = PWPCe; this gives (6) below, which
represents the line which is the locus of points where BTPC is different from
BTpCe. Similarly, to solve (5), we set LIQP = LIQPe and BUTP = BUTPe; which
yields the line represented by equation (7) such that POWP # POWPe. That is
BTPCe - PWPC e(6BpC = 3.33 0.98 BNPC(6)
if BTPC * BTPCe orr 1 = r =02
and
2.31 - 1.14 p (7)
BNPC 231BP
if PWPC # pWpCe or r= r3 = 0
Clearly, we need a further equation linking the product prices to the
determination of bean prices. Without this, the framework of analysis does
not provide relationships that can be used to obtain conditions when all three
product prices are at their "warranted" values so that equations (6) and (7)
can be solved only in terms of BNPC. However, (6) and (7) can be represented
diagrammatically as follows in Figure 4.
129. The two equations indicate the region in the butter/bean price ratio
and powder/bean price ratio space in which the butter/bean and powder/bean
price ratios lie if processing is to be profitable. A comparison with the
observed historical butter/bean and powder/bean price ratios shows that they
all lie in this region.

Figure 4: Product Prce Ratio Space
Powder Ratio
Technical Conversion Rate Butter Ratio: 1.33Powder Ratio: 1.1 8
1.18
i \ \Line BLine(BUTPe#BUTP)
O -1.33 Line P Buffer Ratio(POWPe6pOWP)
World Bank - 40713:2

-69 -
130. These relationships provide certain useful rules of thumb for
processors. Firstly, it is clear, that for a reasonably wide band between the
lines B and D in Figure 4, the butter/bean and cake/bean price ratios outside
the region are indicative of unprofitable operation in terms of butter
recovered, the fat content of the cake, and pressing technology. All the more
so when other factor costs such as labor, capital and fuel are added.
131. Secondly, knowledge of the region delineated above and additional
information as to whether it is the butter or powder market which is out of
equilibrium enables the processor to predict how the price ratios will change.
From equations (2) and ,3), after eliminating the liquor price, we obtain the
following relationship between the 'warranted" butter/bean and powder/bean
price ratios at any liquor/bean price ratio.
ppe ePWPC BTPCeBNPC constant - 1.4 BNPC
132. We do not know the value of the constant, but that of the slope (-
1.4) provides sufficient information with which to judge the direction and
magnitude of change in the powder/bean ratio for.a given butter/bean ratio and
vice versa.
Implications for Cocoa Processing
133. This study has shown that, apart from bean availability, the
important elements in the determination of cocoa processing are (i) the direct
use of liquor in chocolate production, (ii) the alternative technologies for

70 -
cocoa processing and (iii) the relative demands for cocoa butter and
cake/powder. These elements have been exploited in order to estimate a model
of cocoa product prices. This model shows that around 1977 there occurred a
large increase in the direct use of liquor in chocolate confectionary. A
number of structural and conjunctural factors account for this upturn in
direct liquor usage. What is important for cocoa processing was that the
subsequent few years showed an unprecedented increase in the price of
powder/cake relative to bean price and a concomittant fall in the butter
ratio. Against chis background of very substantial changes in the cocoa
products basic price ratio vis-a-vis beans, it is interesting to examine, on
the one hand, the question of choice of techniques amongst the alternative
ways by which cocoa can be processed, and on the other, to ask whether
tendency for the emergence of markets of cocoa products, given the substantial
increase in non-captive processing which has occurred with the increase of
grinding in the producing countries. The recent decision to open a futures
market for cocoa butter quite validates the relevance of this inquiry.
134. On the question of choice of techniques, the most appropriate way to
evaluate alternative activities is to set-up an optimization problem. This is
done by defining the input/output conditions of alternatives such as pressing,

- 71 -
expelling, solvent extraction (or any linear combinations of two or more of
these processes) and by setting the problem of the processor as follows:
max .£ i. x.1 1 1
s.t Ax < b
o < x S 1
where i. is the profit per unit for activity xi. The subscript i refers to a
given activity which could be (say) pressing; A is a matrix of constraints
summarizing the inputs required by the activities and b a vector of input
constraints. The vector of input constraints b is determined not exogenously
but by the pattern of demands facing the processor. The processor can decide
whether to convert the beans at his disposal directly into butter through
expelling and solvent extractions or generate first liquor and then adopt
hydraulic pressing. In this way the pattern of demands for cocoa products
facing the processor determines the most profitable operation amongst
pressing, expelling or any combinations. The above optimization applied to
the prevailing prices during the period 1980-83 clearly bears out this
conjecture. A forecast of product prices which can be used as inputs to the
above optimization model provides evidently a means of aiding the investment
decisions as to which type of cocoa processing capacity (hydraulic press,
expeller, expeller + solvent extractor) should be installed.

- 72 -
135. As regards to investing in cocoa processing in the producing
countries, the existing difficulties in disposing of or competing effectively
in the heterogenous market for cocoa powders mean that technologies whose
joint product mixes are weighted in favor of producing the more homogenous
cocoa butter are largely to be more profitable. The homogeneity of cocoa
butter and the increasing non-captive production are also factors that
contribute to the preconditions necessary for the eventual emergence of a
market for liquor and cocoa butter. To some considerable extent the cash
markets for the products exists already where the product ratios rather than
absolute product prices are traded.
136. The notations used to define variables in this section are described
below in Table 5.

Table 5: VARIABLE NAMES AND DESCRIPTION
Name Description
BNCHPCR Cocoa bean to chocolate price ratioBNGR Grindings of cocoa beansBNGRDM Demand for grinding cocoa beansBNPC Price of cocoa beansBNPCD Price of cocoa beans deflated by food price indexBSCHPDR Biscuit to chocolate production ratioBSPD Biscuit productionBTBNPCR Cocoa butter to cocoa bean price ratioBTCHPDR Cocoa butter to chocolate production ratioBTCHPRC Cocoa butter to chocolate price ratioBTDM Intermediate consumption of cocoa butterBTPD Production of cocoa butterBTPC Price of cocoa butterBTLQUSR Ratio of butter use to liquor useFTMC Fat marginBTXD Excess demand for cocoa butterLQBNPCR Cocoa liquor to cocoa bean price ratioLQCHPCR Cocoa liquor to chocolate price ratioLQDM Intermediate consumption of cocoa liquorLQPD Production of cocoa liquorLQPC Price of cocoa liquorLQXD Excess demand for cocoa liquorPWBNPCR Cocoa powde-r to cocoa bean price ratioPWCHPCR Cocoa powder to chocolate price ratioPWDM Intermediate consumption of cocoa powderPWPD Production of cocoa powderPWPC Price of cocoa powderPWXD Excess demand for cocoa powderSTGRR Stocks to grinding ratioCHPD Chocolate productionCFLPD Chocolate flavored product productionEXBTPD Expeller cocoa butter productionPWCHPCR Cocoa powder to chocolate price ratioLQAV Cocoa liquor available for pressing

- 74 -
VII. CONCLUSION
137. The inclusion of the economics of cocoa processing into the
determination of the prices of cocoa liquor, butter and powder is a necessary
development in modeling of the cocoa market. Morever, produce price
projections are needed for more accurate estimates of cocoa revenues at a time
when cocoa bean producing countries are increasingly engaging in downstream
processing. These projections also should help in investment choices of
appropriate processing facilities. The fact that cocoa products' quotations
are offers and bids by large cocoa bean processors, unlike cocoa bean prices
which are determined through futures market transactions, necessitates the
inclusion of processing margins in the determination of product prices. Cocoa
product prices are not simple constant multiples of the cocoa bean price. It
is argued here that the variations of cocoa product prices are influenced by
the excess demand and the expected profitability of converting cocoa into the
downstream product(s). In the model developed here, cocoa product prices
affect the price of cocoa beans through the grindings relationship. Grindings
are a function of the derived demand for grindings which is the sum of the
bean-equivalent expected demand for the individual cocoa products. Because of
the paucity of observed product data, the study generates output and
intermediate consumption data on cocoa products from technical and econometric
relations. The results seem robust by replicating well the historical
behavior of cocoa product prices and cocoa bean grindings. By endogenizing
cocoa product market decisions, it is found that the price elasticity of bean

- 75 -
grindings is -0.4. Previous elasticity estimates from analysis in which the
cocoa products' price relationship is not specified are around -0.25.
138. Cocoa powder and cocoa butter prices were found to vary consistently
within an analytical framework of joint-product pricing. With the growing
demand for "high-fat" powders, cocoa powder is no longer a residual by-product
of cocoa butter that can be disposed of at low prices. This tendency should
be accentuated as the demand for powder expands. Current market forces also
point to a further expansion of the demand for cocoa products both in the form
of new cocoa-based products (such as chocolate chip cookies, chocolate sodas,
etc.) and increased utilization of cocoa butter in other industries (such as
the cosmetic industry); these developments will intensity in the event that
cocoa bean prices remain low.
139. The study inspires two directions for further research. One is to
solve the maximization problem of the cocoa bean processor using the economic
and technological facts brought forth in the study. The second is to improve
the quality of data on cocoa products.

- 76 -
ANNEX A:
Cocoa Bean and Product Market Dynamics Given a Supply Shock
A shock in the supply of beans is transmitted to the product
markets. However, because cocoa butter and cocoa powder are jointly produced,
the equilibrium price ratio is somewhat undetermined. Manufacturers of both
products have a range of equally profitable price options in a range
consistent with the product transformation space.
In the case illustrated by the following set of graphs, the cocoa
bean market (panel E) suffers an exogenous supply decrease from BNPD1 to BNPD2
in the immediate run. This decrease iS Dassed onto the cocoa butter and cocoa
powder markets (panels A and C) via the production possibility space (panel
B). In panel B, a redv,ction in the supply of beans is represented by an
inward shift of the production possibility curve resulting in a reduction of
the total achievable output of cocoa butter from BTPD1 to BTPD2 and of cocoa
powder from PWPD1 to PWPD2. In the iso-revenue space (panel D), either Eb or
Ep along the isorevenue curve Io can represent the manufacturers' equilibrium
situation. At Eb they accept low bids on powder whereas at Ep they accept low
bids on butter. In the extreme case where market conditions induce a
simultaneous increase in butter and powder prices, the equilibrium is at Ee on
another isorevenue curve Il. Thus, from the original situation Eo, new
outcomes could be on the same price curve in either direction depending on how
the product arbitrage is made or on the -price expansion curve in the direction
of Ee.

Annex A: LJcoa Market Price Dynarrics Under a Bean Supply Shortage Shock
BTPCF Price BTPC A
S2 but
IIl
BTPC-9E EE TC
bilpc1 BTPCI
\I \ I I\
I BNPC BTPDFM/PCI PWP02
[BNPDAI E FPWPD IC PWPDB
BNPD1 rNPD-
PWPDI --EBNPD2 PWPD2 R\PD2
| I PWRPC BTPD
BTPD2 ElTPD1
I II II I Panel A- Represents the Butter Market D: Represents Ihe Space of ISO-Revenue CurvesB B I BNPG B: Is the Product Transformation Space E: Represents the Bean MarketBNPCI BNPC2 C: Represents the Powder Market F: [he Space of Butter Bean Price Ratios
World Bank - 40713 3

ANNEX B
COCOA MARKET RELATIONSHIPS
pply \ocal Processing
| eans |s nventories
Price ofEXPORTS Cocoa Beans OCTION
STRATEGIES I
-.4co~IMPORTS OF BEANS PRICS fo D N F
IMPORTS OF POCINTERMEDIATEPRODUCTSE
-Lqo,bteDemand fors t Grind.ing
I ne c armedi ate .lcProducts Prices of
SUPPLY Of PRICES OF XDEMAND FOREND PRODUCTS END PRODUCTS END PRODUCTS*
|INCOME POPULATION PRICES OF lNON -CHO:COLATECONFECTIONERIES
=Liquor, butter and powder*"Solid plain chocolate, solid chocolate with other food ingredients, chocolate coated goods etc,
World Bank-30999:2

ANNEX C
COCOA PRODUCT FLOW CHART.
COCOA BEANS
COCOA LIQUOR
CHOCOLATE COCOA POWDER COCOA BUTTERFOR BAKING
CHOCOLATE CHOCOLATE DAIRY OSEISPiRACEUTICAEXTENDERS DRINKS FLAVORING COSMETIC
SOURCE: EPDCS.
World Bank-30999:3

-80 -ANNEX D
COCOA PRODUCT OUTPUT USAGE & PRICE DETERMINATION
LIURLIQUOR N.8- Grindgs .13- WDC4Q N C
N
C C LP N 0 C C AR #2 P BN N To u BUTRF F N E
E BUTTER |___Prices of c F uSupply of uPPrices of SProducts D T T M
Beans I 4 Beans E I PM O P T
N A N R IN N E o 0
G 3D R D NI u CHOCOLATE
E C FLAVOREDPOWDER POWDER S T GOODS
I#0= supply of bean block N#1 =identity of liquor supply#2 = identity of butter supply#3 = ilentity of powder supply
prices of products fl±1 I e ofprices of vegetable fats Sugar
IncomePopulationTastes
World Bank-30999:4

- 81 -
ANNEX eTABLE E.l: ESTIMATION RESULTS FOR MAIN EQUATIONS OF THE COCOA PRODUCTS SUBMODEL
COCOA COCOACHOCOLATE BEAN LIQUOR BUTTER POWDER BUTTER POWDER CIIOCOU 'EPRODUCTION PRICE GRINDINGS PRICE PRICE PRICE DEMAND DEMAND PRICF
Constant 4.60 16.21 0.26 2,262.18 -2,874.40 1,190.35 140.53 191.01(10.12) (4.40) (1.35) (2.97) (-1.44) (2.53) (4.39) (4.65)
FBTI 25.17 9.60(5.23) (1.23)
BTPC_ 1 -0.12(2.69)
CHPC-. 0.51(4.12)
BNGRDM 0.88(16.52)
FTMG 0.03(2.20)
BNGR-.1 0.10(1.79)
BNPCD -0.02 0.80(-3.89) (9.09)
LQPC- 1 -0.91
(-12.60)
STGRR -0.86 -1309.10(-3.64) (-2.00)
CHPD 0.64 0.02(3.06) (1.78)
BNGR -2.39 -1.11(-4.10) (-1.73)
STGRRBTPC -1.65(-5.60)
BTLQUSR 1,542.90 7.77(1.66)
STGRRPWPC -1.66(-2.87)
ST5R!BLQPC 5.21(5.85)
LQPC 1.33(15. 70)

- 82
TABLE E.1: ESTIMATION RESULTS FOR MAIN EQUATIONS OF TIlE COCOA PRODUCTS SUBMODEL (continued)
COCOA COCOACHOCOLATE BEAN LIQUOR BUTTER POWDER BUTTER POWDER CHOCOLATEPRODUCTION PR7CE GRINDINGS PRICE PRICE PRICE DEMAND DEMAND PRICE
BTPC -0.76 0.26(-7.52) (4.69)
PWPC -0. 68(-11.64)
UNUSFT -27.43(-2. 06)
BSCHPDR 28.65(2.01)
PWDM-1 0.44(3.46)
BTDM_ 1 0.75(7.77)
PWCHPCR -40.27(-4.28)
BTBNPCR -22.62(-1.19)
BTFTPCR -0.62(-1.07)
BNCHPCR -41.96(-2. 60)
BNDM 1.51 1.72(3.34) (2.78)
BNTS -2.95(5.86)
MUV-1 1.22(8.74)
XRTINDEX -0.94( -1.44)
DW STATISTIC 1.88 1.82 2.02 1.70 1.80 1.98 2.40 1.60 1.50
R2 0.95 0.95 0.99 0.93 0.80 0.94 0.89 0.75 0.95
Note: All variable names are defined in Table 5 except the following:
BNTS - World total supply of cocoa bean.XRTINDEX - Consumption weighted index of exchange rate for the major cocoa importing countries.STGRRBTPC - Stocks-to-grindings ratio times cocoa butter price.STGRRPWPC - Stocks-to-grindings ratio times cocoa powder price.STGRRLQPC - Stocks-to-grindings ratio timeo cocoa liquor price.
'3OURCE: INTERNATIONAL COMMODITY MARKETS DIVISION, INTERNATIONAL ECONOMICS DEPARTMENT.
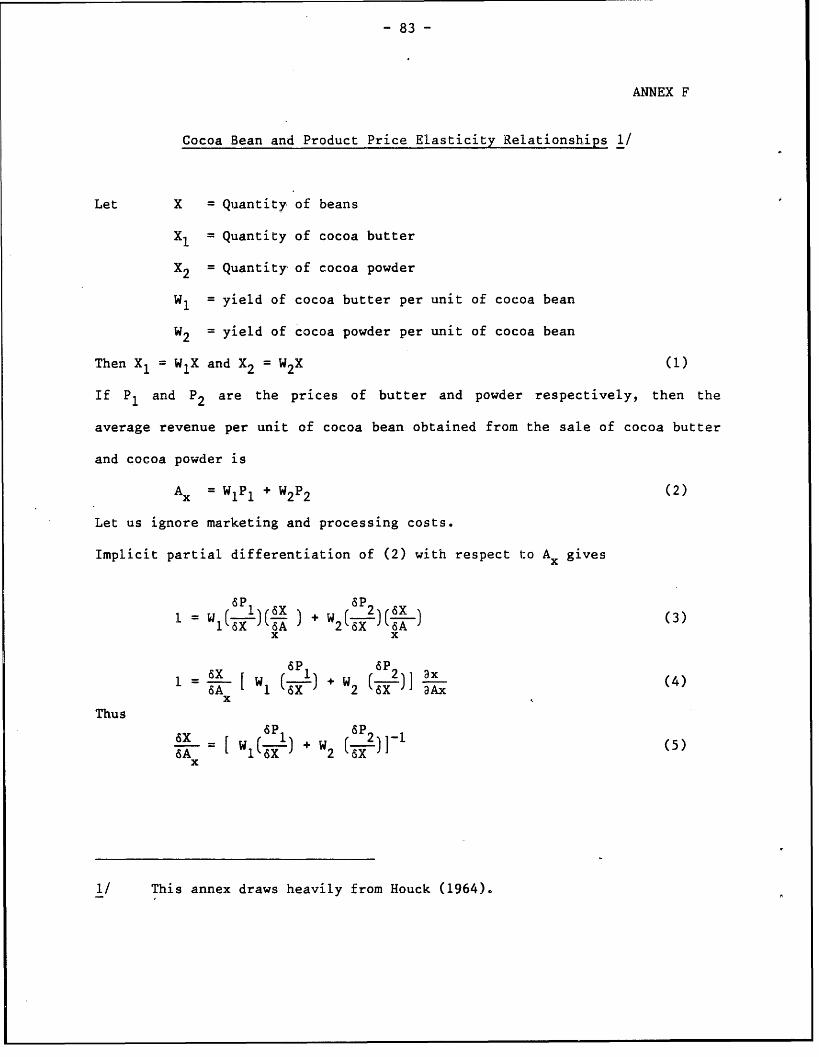
- 83 -
ANNEX F
Cocoa Bean and Product Price Elasticity Relationships 1/
Let X = Quantity of beans
XI = Quantity of cocoa butter
X2 = Quantity of cocoa powder
W, = yield of cocoa butter per unit of cocoa bean
W = yield of cocoa powder per unit of cocoa bean
Then X1 = W1X and X2 = W2X (1)
If P1 and P2 are the prices of butter and powder respectively, then the
average revenue per unit of cocoa bean obtained from the sale of cocoa butter
and cocoa powder is
Ax = W1P1 + W2P2 (2)
Let us ignore marketing and processing costs.
Implicit partial differentiation of (2) with respect t:o Ax gives
P= w( P)(6 ) + 2x x
1 A Wl (X) + 2( )] axAx (4)
Thus
6X = [16) + W2 (6X )1 (5)
x
1/ This annex draws heavily from Houck (1964).

- 84 -
Let the price elasticity of the demand for beans be denoted as
AE = - x- (6)x SA Xx
AMultipiying both sides of (5) by X yields
E = [wx( ) + X 2)] A (7)
Using (1) we can write
X.X =- 1 i = 1.2 X = W (8)w.7 1
Implicit partial differentiation of (8) gives
ax ap.- w.(')(X) i = 1. 2 9
1 1
p.Multiplying both sides by X
1
P. E. aP.
x= W ( ) i = 1.2 (10)1a 1
where Ei is the price elasticity of butter or powder for i =1 or i 2
Further transformation gives:
ap. W. P.ax= (Xi) (E) i = 1.2 (1!)
TX i 1

- 85 -
Using (11) to substitute into (7) yields
E = (W1P - + W(P 1 ) A12)X 1 E 2 X
which is finally
w1p + w2p2E ) + 22(13)x 1 1WP +
E1 1 1 E222
- 86 -
REFERENCES
Abramovitz, Moses, The Allocation of Economic Resources, Stanford UniversityPress, California 1959.
Aronson, S. "An Exporters's Point of View", Proceedings of Inter-AmericanCocoa Forum January 20-30, 1987, San Jose, Costa Rica. Pan AmericanDevelopment Foundation (forthcoming) 1987.
Arrow, K.J., "Toward a Theory of Price Adjustment" in The Allocation ofEconomic Resources, in M. Abramovitz ed., Stanford University Press,California 1959.
Brandon, G.E., Interrelations Among Demand for Farm Products and Implicationsfor Control of Market Supply, Pennsylvania Agricultural Expt. Sta. Bul.680, 1961, p.44.
Bressler, R.G. and R.A. King, Markets, Prices and Inter-regional Trade, JohnWiley and Sons, Inc., New York, 1970.
Gbetibouo, M., Export Strategies for Ivory Coast Cocoa, unpublished PhD.Dissertation, University of Illinois, Champaign-Urbana, Illinois, 1983.
Glaister, S., Mathematical Methods for Economists, 3rd Ed., Basil BlackwellPublisher Ltd., Oxford. 1984.
Griffin, J.M., "Joint Production Technology: The Case of Petrochemicals"Econometrica, vol. 46, No. 2, March 1978, pp. 379-396.
Henderson J.M., and R.E. Quandt, Microeconomic Theory, A MathematicalApproach, 2nd Ed., McGraw Hill, 1958.
Houck, J.P., "Price Elasticities and Joint Products" Journal of FarmEconomics, 1964 pp. 652-656.
Karunasekera, M.Y.D.J., "The Economics of Industrial Processing of Cocoa: inCase Studies on Industrial Processing of Primary Products, Vol. II: Cocoa,Coconut Oil, Tea, The World Bank, Washington, D.C. 1983.
Laitinen, K., Theory of the Multiproduct Firm, North Holland, New York, 1980.
Minifie, B.W., Chocolate, Cocoa and Confectionary. 2nd ed. Avi Publishing Co.,Westport, Connecticut, 1980.
National Geographic, November 1984 issue, Washington, D.C.
Nerlove, M. "Lags in Economic Behavior", Econometrica, Vol. 40, pp. 221-251,1972.

- 87 -
Pasinetti, L.L. ed., Essays of the Theory of Joint Production, ColumbiaUniversity Press, New York, 1980.
Peel, D.A. and I. Walker, "Short-Run Employment Functions, Excess Supply andthe Speed of Adjustment: A Note", Economica, Vol. 45, pp. 195-202.
Samuelson, P.A. Foundations of Economic Analysis, Harvard University Press,Massachusetts, 1983.
Tomek, N.G., and K.L. Robinson, Agricultural Product Prices, CornellUniversity Press, Ithaca, New York, 2nd Ed., 1981.
UNCTAD, Studies in the Processing, Marketing and Distribution of Commodities.the Processing before Export of Cocoa: Areas for InternationalCooperation, United Nations, New York 1984.
UNCTAD/GATT, Cocoa Products: Facts and Figures on the World's Major Markets,Geneva 1975.
Weymar, H.F.9 The Dynamics of the World Cocoa Market, The MIT Press,Massachusetts, 1968.