Embed Size (px)
Citation preview

CodeWarrior Development Studio forMicrocontrollers Version 10.x
Profiling and Analysis Tools UsersGuide
Document Number: CWMCUSWAUGRev 10.6, 02/2014

CodeWarrior Development Studio for Microcontrollers Version 10.x Profiling and Analysis Tools UsersGuide, Rev. 10.6, 02/2014
2 Freescale Semiconductor, Inc.
Contents
Section number Title Page
Chapter 1Introduction
1.1 Release Notes..................................................................................................................................................................9
1.2 Accompanying Documentation......................................................................................................................................9
Chapter 2Getting Started
2.1 Profiling and Analysis Tools..........................................................................................................................................11
2.2 CodeWarrior Interface....................................................................................................................................................12
2.3 Data Collection...............................................................................................................................................................14
2.3.1 Trace Data..........................................................................................................................................................14
2.3.2 Critical Code Data..............................................................................................................................................14
2.3.3 Timeline Data.....................................................................................................................................................15
2.3.4 Performance Data...............................................................................................................................................15
2.3.5 Call Tree.............................................................................................................................................................15
2.3.6 Profiling Data.....................................................................................................................................................15
Chapter 3Collecting Data
3.1 Creating New Project......................................................................................................................................................17
3.1.1 Using HCS08 Target..........................................................................................................................................18
3.1.2 Using ColdFire V1 Target..................................................................................................................................21
3.1.3 Using Kinetis Target..........................................................................................................................................23
3.1.4 Using ColdFire V4e...........................................................................................................................................26
3.1.5 Using MPC56xx Target.....................................................................................................................................29
3.2 Configuring Launcher.....................................................................................................................................................31
3.2.1 Configure HCS08 Target...................................................................................................................................31
3.2.2 Configure ColdFire V1 Target...........................................................................................................................38
3.2.3 Configure Kinetis Target...................................................................................................................................42
3.2.3.1 Configuring Kinetis Cortex M0+ Core................................................................................................47
CodeWarrior Development Studio for Microcontrollers Version 10.x Profiling and Analysis Tools UsersGuide, Rev. 10.6, 02/2014
Freescale Semiconductor, Inc. 3
Section number Title Page
3.2.3.2 Difference Between Kinetis Cores Cortex M4 and Cortex M0+.........................................................49
3.2.3.3 Trace Collection on Kinetis.................................................................................................................50
3.2.3.3.1 Embedded Trace Macrocell (ETM)....................................................................................50
3.2.3.3.1.1 Triggering Trace.............................................................................................51
3.2.3.3.2 Instrumentation Trace Macrocell (ITM).............................................................................52
3.2.3.3.2.1 Timestamps.....................................................................................................53
3.2.3.3.2.2 Synchronization..............................................................................................53
3.2.3.3.3 Embedded Trace Buffer (ETB)...........................................................................................54
3.2.3.3.4 J-Trace.................................................................................................................................54
3.2.4 Configuring Advanced Settings on Kinetis.......................................................................................................55
3.2.5 Configure MPC56xx Target...............................................................................................................................68
3.2.6 Configure S12Z Target......................................................................................................................................68
3.2.7 Configure ColdFire V2-V4 Targets...................................................................................................................71
3.2.8 Configure DSC Target.......................................................................................................................................73
3.3 Collecting Data...............................................................................................................................................................76
3.4 Viewing Data..................................................................................................................................................................77
3.4.1 Data Trace Import Dialog Box...........................................................................................................................79
3.4.2 Controlling Trace Generation............................................................................................................................82
3.4.2.1 Resume/Suspend Toggle Button..........................................................................................................82
3.4.2.2 Reset Button.........................................................................................................................................83
Chapter 4Viewing Data
4.1 Trace Data.......................................................................................................................................................................85
4.1.1 Finding and Filtering Trace Data.......................................................................................................................87
4.1.2 Exporting Trace Data.........................................................................................................................................90
4.1.3 Configuring Time Unit and Time Format..........................................................................................................91
4.1.4 Customizing Trace Data Viewer........................................................................................................................92
4.2 Timeline..........................................................................................................................................................................94
4.2.1 Selection Mode..................................................................................................................................................95
CodeWarrior Development Studio for Microcontrollers Version 10.x Profiling and Analysis Tools UsersGuide, Rev. 10.6, 02/2014
4 Freescale Semiconductor, Inc.
Section number Title Page
4.2.2 Zoom Mode........................................................................................................................................................96
4.2.3 Full View............................................................................................................................................................97
4.2.4 Edit Groups........................................................................................................................................................97
4.2.4.1 Add/Remove Function.........................................................................................................................98
4.2.4.2 Edit Address Range of Function..........................................................................................................98
4.2.4.3 Change Color.......................................................................................................................................98
4.2.4.4 Add/Remove Group.............................................................................................................................98
4.2.4.5 Merge Groups/Functions......................................................................................................................100
4.2.5 Configure Table.................................................................................................................................................101
4.3 Critical Code Data...........................................................................................................................................................101
4.3.1 Critical Code Tab...............................................................................................................................................103
4.3.2 File Coverage Tab..............................................................................................................................................105
4.4 Performance Data............................................................................................................................................................106
4.5 Call Tree..........................................................................................................................................................................109
4.6 Importing Trace Data Offline.........................................................................................................................................111
Chapter 5Setting Tracepoints (HCS08)
5.1 Conditions for Starting/Stopping Triggers.....................................................................................................................117
5.2 Trace Modes....................................................................................................................................................................120
5.2.1 Setting Triggers in Continuously Mode.............................................................................................................121
5.2.1.1 Instruction at Address A, Then Instruction at Address B are Executed...............................................121
5.2.1.2 Instruction at Address A or Address B is Executed.............................................................................126
5.2.1.3 Instruction Inside Range from Address A to Address B is Executed..................................................127
5.2.1.4 Instruction at Address A is Executed and Value on Data Bus Match..................................................131
5.2.1.5 Instruction at Address A is Executed and Value on Data Bus Mismatch............................................133
5.2.1.6 Memory Access Triggers.....................................................................................................................133
5.2.2 Setting Triggers in Automatically Mode...........................................................................................................136
5.2.2.1 From the Disassembly View................................................................................................................136
5.2.2.2 On Data and Memory...........................................................................................................................139
CodeWarrior Development Studio for Microcontrollers Version 10.x Profiling and Analysis Tools UsersGuide, Rev. 10.6, 02/2014
Freescale Semiconductor, Inc. 5
Section number Title Page
5.2.2.3 LOOP1 Mode.......................................................................................................................................142
5.2.2.4 Instruction Outside Range from Address A to Address B is Executed...............................................145
5.2.3 Setting Triggers in Collect Data Trace Mode....................................................................................................148
5.2.3.1 Capture Read/Write Values at Address B............................................................................................148
5.2.3.2 Capture Read/Write Values at Address B, After Access at Address A...............................................152
5.2.4 Collecting Trace in Profile-Only Mode.............................................................................................................155
5.2.5 Collecting Trace in Expert Mode.......................................................................................................................156
5.3 Enabling and Disabling the Tracepoints.........................................................................................................................158
Chapter 6Setting Tracepoints (ColdFire V1)
6.1 Conditions for Starting/Stopping Triggers.....................................................................................................................161
6.2 Trace Modes....................................................................................................................................................................163
6.2.1 Setting Triggers in Continuous Mode................................................................................................................163
6.2.1.1 Trace From Trigger A Onward............................................................................................................163
6.2.1.2 Trace From Trigger A to Trigger B.....................................................................................................166
6.2.2 Setting Triggers in Automatic (One-buffer) Mode............................................................................................170
6.2.2.1 Trace From Trigger A Onward............................................................................................................170
6.2.2.2 Trace From Trigger A to Trigger B.....................................................................................................173
6.2.3 Setting Triggers in Profile-Only Mode..............................................................................................................174
6.2.4 Setting Triggers in Expert Mode........................................................................................................................175
6.3 Tracepoints on Data and Memory...................................................................................................................................177
6.3.1 From Variables View.........................................................................................................................................177
6.3.2 From Memory View...........................................................................................................................................179
6.4 Enable and Disable Tracepoints......................................................................................................................................181
Chapter 7Setting Tracepoints (Kinetis)
7.1 Setting Hardware Tracepoints.........................................................................................................................................183
7.1.1 From Source Code - Kinetis Cortex M4 Core...................................................................................................184
7.1.2 From Source Code - Kinetis Cortex M0+ Core.................................................................................................188
CodeWarrior Development Studio for Microcontrollers Version 10.x Profiling and Analysis Tools UsersGuide, Rev. 10.6, 02/2014
6 Freescale Semiconductor, Inc.
Section number Title Page
7.1.3 From Trace and Profile Tab - Kinetis Cortex M4 Core.....................................................................................192
7.1.4 From Trace and Profile Tab - Kinetis Cortex M0+ Core...................................................................................196
7.2 Setting Software Tracepoints..........................................................................................................................................198
7.2.1 Setting Software Tracepoints Manually.............................................................................................................198
7.2.1.1 Using Freescale Toolchain...................................................................................................................199
7.2.1.2 Using GCC Toolchain..........................................................................................................................203
7.2.2 Setting Software Tracepoints Automatically.....................................................................................................206
7.3 Viewing Tracepoints.......................................................................................................................................................209
7.3.1 View Full Path of Tracepoint Attribute.............................................................................................................210
7.3.2 Group Tracepoints..............................................................................................................................................210
7.3.3 Define Working Sets..........................................................................................................................................211
7.3.4 Add New Analysispoint.....................................................................................................................................212
7.3.5 Enable/Disable Tracepoints...............................................................................................................................213
7.3.6 Navigate to Tracepoint Line..............................................................................................................................214
7.3.7 Remove Tracepoints..........................................................................................................................................214
7.3.8 Context Menu.....................................................................................................................................................214
Chapter 8Data Visualization
8.1 Creating DSC Project......................................................................................................................................................217
8.2 Configuring for Data Visualization................................................................................................................................218
8.3 Setting Analysispoints for Data Visualization................................................................................................................219
8.3.1 Setting Data Analysispoints on Memory View..................................................................................................220
8.3.2 Setting Data Analysispoints on Variables View................................................................................................221
8.3.3 Setting Register Analysispoints on Registers View...........................................................................................221
8.4 Collecting and Viewing Data..........................................................................................................................................222
Chapter 9Launching Scripts
9.1 Run Sample Python Script..............................................................................................................................................229
9.2 Collect Trace Using Jython.............................................................................................................................................231
CodeWarrior Development Studio for Microcontrollers Version 10.x Profiling and Analysis Tools UsersGuide, Rev. 10.6, 02/2014
Freescale Semiconductor, Inc. 7
Section number Title Page
9.3 Export Trace to CSV File...............................................................................................................................................233
9.4 Modify Sample Python Script.........................................................................................................................................235
Chapter 10Simple Instrumentation Profiling on ColdFire V2 - V4e Targets
10.1 Include Profiler Library and Files...................................................................................................................................238
10.2 Configure Project for Profiling.......................................................................................................................................240
10.3 Modify Source Code.......................................................................................................................................................243
10.4 Debug Application and Collect Profiling Information...................................................................................................253
10.5 View Profiling Results....................................................................................................................................................254
10.5.1 Flat View............................................................................................................................................................256
10.5.2 Tree View...........................................................................................................................................................256
10.5.3 Class View.........................................................................................................................................................257
Chapter 11
11.1 Trace Collection with Breakpoints.................................................................................................................................259
Chapter 12Configuring Trace Registers in Source Code
12.1 HCS08.............................................................................................................................................................................263
12.2 ColdFire V1....................................................................................................................................................................264
Chapter 13Low Power WAIT Mode
13.1 Configure Low Power WAIT State................................................................................................................................269
13.2 View Low Power WAIT Results....................................................................................................................................271
CodeWarrior Development Studio for Microcontrollers Version 10.x Profiling and Analysis Tools UsersGuide, Rev. 10.6, 02/2014
8 Freescale Semiconductor, Inc.

Chapter 1IntroductionThe CodeWarrior Profiling and Analysis tool is designed to help you make your codemore efficient so that you can enhance the speed and performance of your applications.The CodeWarrior Profiling and Analysis tool helps you get hard and reliable data usingwhich you can analyze the time spent by your code in performing various tasks. This userguide explains how to use the CodeWarrior Profiling and Analysis tool.
In this chapter, refer to the following topics:
• Release Notes• Accompanying Documentation
1.1 Release NotesBefore using the CodeWarrior IDE, read the developer notes. These notes containimportant information about last-minute changes, bug fixes, incompatible elements, orother topics that may not be included in this user guide.
NOTEThe release notes for specific components of the CodeWarriorIDE are located in the Release_Notes folder in the CodeWarriorinstallation directory.
If you are new to the CodeWarrior IDE, read this chapter and the Getting Started chapter.This chapter provides references to resources of interest to new users; the Getting Startedchapter helps you familiarize with the software features.
CodeWarrior Development Studio for Microcontrollers Version 10.x Profiling and Analysis Tools UsersGuide, Rev. 10.6, 02/2014
Freescale Semiconductor, Inc. 9
1.2 Accompanying DocumentationThe Documentation page describes the documentation included in the CodeWarriorDevelopment Studio for Microcontrollers v10.x. You can access the Documentationpage by:
• opening the START_HERE.html in the <CWInstallDir>\MCU\Help folder,• selecting Help > Documentation from the IDE’s menu bar, or selecting Start >
Programs > Freescale CodeWarrior > CW for MCU v10.x > Documentationfrom the Windows taskbar.
NOTETo view the online help for the CodeWarrior tools, first selectHelp > Help Contents from the IDE's menu bar. Next, selectrequired manual from the Contents list. For generalinformation about the CodeWarrior IDE and debugger, refer tothe Codewarrior Common Features Guide in this folder:<CWInstallDir>\MCU\Help\PDF
Accompanying Documentation
CodeWarrior Development Studio for Microcontrollers Version 10.x Profiling and Analysis Tools UsersGuide, Rev. 10.6, 02/2014
10 Freescale Semiconductor, Inc.

Chapter 2Getting StartedThe CodeWarrior Profiling and Analysis tool lets you collect data of an application. Youcan analyze this data to identify the bottlenecks, such as slow execution of routines orheavily-used routines within the application. This chapter explains features of the CWProfiling and Analysis tool, the CW interface that this tool uses, and the type of data thatis collected using the tool.
Refer to the following topics:
• Profiling and Analysis Tools• CodeWarrior Interface• Data Collection
2.1 Profiling and Analysis Tools
CodeWarrior Profiling and Analysis tools provide visibility into an application as it runson the hardware. This visibility can help you understand how your application runs, aswell as identify operational problems. The tools make it easy to collect the data.
Following are the basic features of the tools.
• Basic setup can be done using the Trace and Profile tab in the DebugConfigurations dialog box.
• Data files can be shared between teams.• Support for the HCS08, Coldfire V1-V4, ColdFire+, ColdFire V4e, Kinetis, DSC
(Digital Signal Controller), MPC56xx, and S12Z targets.• Trace is collected by setting triggers and using various trigger conditions -
Applicable for HCS08, ColdFire V1, Kinetis, DSC, and S12Z targets.• Trace is collected even when no triggers are set - Applicable only for the HCS08
target.• Profiling information is collected - Applicable for Coldfire V2-V4 and ColdFire V4e
targets.
CodeWarrior Development Studio for Microcontrollers Version 10.x Profiling and Analysis Tools UsersGuide, Rev. 10.6, 02/2014
Freescale Semiconductor, Inc. 11
• Depending on the target selected, Software Analysis will extract trace throughdebugger using OSBDM/JTAG, P&E USB-ML-PPCNEXUS, P&E UniversalMultiLink, EthernetTAP, USB TAP, J-Trace, or Tracelink.
• Remote launch support to collect trace by running Software Analysis scripts fromJython console.
The tools also provide user-friendly data viewing features and enables you to:
• step through trace data and the corresponding source code of that trace datasimultaneously
• display results in an intuitive and user friendly manner in the Trace Data , CriticalCode , Timeline , Performance , Call Tree , and Simple Profiler Data viewers
• export trace data, critical code data, profiling information into an Excel file• copy and paste a line of the trace in a text file• import trace data collected on all targets, HCS08, ColdFire V1-V4, ColdFire V4e,
Kinetis, MPC56xx, DSC and S12Z.
NOTEProfiling is not supported on optimized code. Only the O0optimization level is supported.
2.2 CodeWarrior InterfaceThe CodeWarrior Development Studio provides a common interface for developing,debugging, and analyzing applications. The project-oriented Workbench window ofCodeWarrior IDE provides numerous perspectives containing views, editors, and controlsthat appear in menus and toolbars.
CodeWarrior Interface
CodeWarrior Development Studio for Microcontrollers Version 10.x Profiling and Analysis Tools UsersGuide, Rev. 10.6, 02/2014
12 Freescale Semiconductor, Inc.
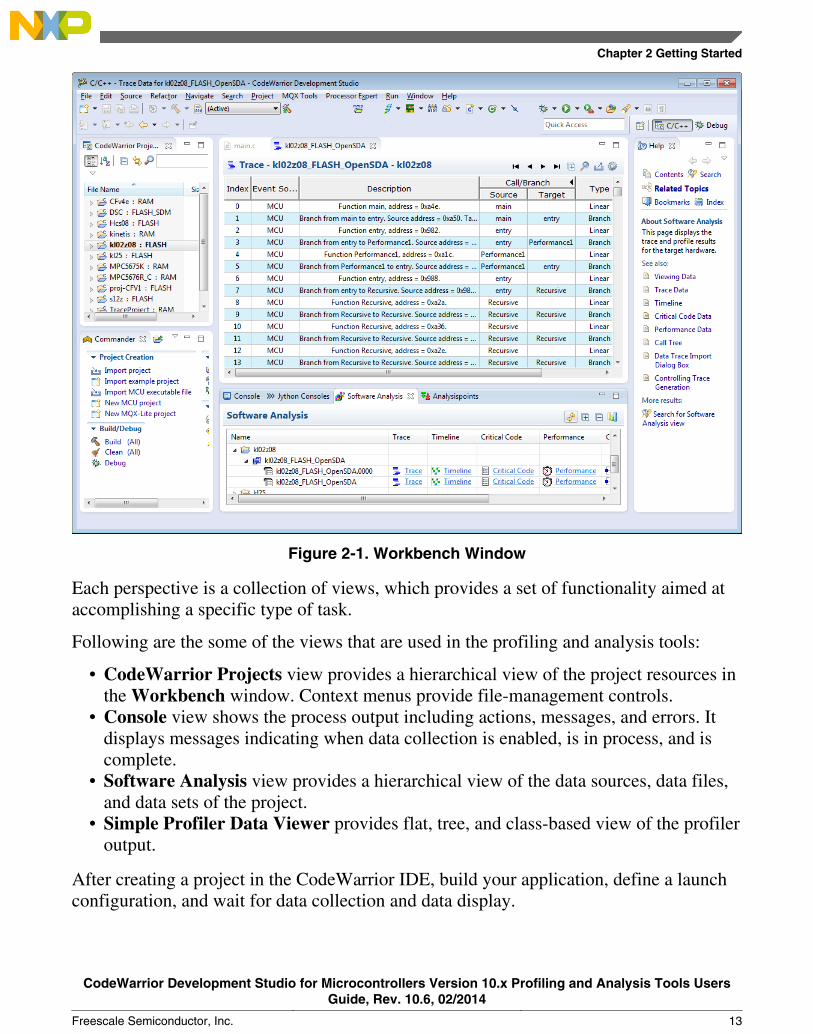
Figure 2-1. Workbench Window
Each perspective is a collection of views, which provides a set of functionality aimed ataccomplishing a specific type of task.
Following are the some of the views that are used in the profiling and analysis tools:
• CodeWarrior Projects view provides a hierarchical view of the project resources inthe Workbench window. Context menus provide file-management controls.
• Console view shows the process output including actions, messages, and errors. Itdisplays messages indicating when data collection is enabled, is in process, and iscomplete.
• Software Analysis view provides a hierarchical view of the data sources, data files,and data sets of the project.
• Simple Profiler Data Viewer provides flat, tree, and class-based view of the profileroutput.
After creating a project in the CodeWarrior IDE, build your application, define a launchconfiguration, and wait for data collection and data display.
Chapter 2 Getting Started
CodeWarrior Development Studio for Microcontrollers Version 10.x Profiling and Analysis Tools UsersGuide, Rev. 10.6, 02/2014
Freescale Semiconductor, Inc. 13
NOTEIn case, you have installed Microcontrollers CodeWarrior in Cdrive using an administrator account and created a stationeryproject for profiling, the error messages are displayed on theconsole when you try to launch the CodeWarrior from a guestaccount.
2.3 Data CollectionYou can collect the following types of data for an application when it runs on the targethardware.
• Trace Data• Critical Code Data• Timeline Data• Performance Data• Call Tree• Profiling Data - This does not require a target hardware, it uses the profiling system
2.3.1 Trace Data
The Trace Data viewer displays the trace data collected by the target hardware.
The features available for the Trace Data viewer include:
• stepping through trace data that is synchronized with the source code of the selectedaddress,
• exporting trace data to an Excel file,• allowing column reordering, and• copying and pasting a line of the trace data.
2.3.2 Critical Code Data
The critical code data is generated based on the trace data. The Critical Code Dataviewer displays name, start address, number of times each instruction is executed, andcode size of each function in the program. The Critical Code Data viewer displays thedetailed information of every instruction traced in the data.
Data Collection
CodeWarrior Development Studio for Microcontrollers Version 10.x Profiling and Analysis Tools UsersGuide, Rev. 10.6, 02/2014
14 Freescale Semiconductor, Inc.
The features available for the Critical Code Data viewer include:
• statistics at function level,• statistics at instruction level,• code view in source editor, and• column ordering and sorting at function level.
2.3.3 Timeline Data
The timeline data displays a graphical view of the functions that are executed in theapplication and the number of cycles each function takes when the application is run.
2.3.4 Performance Data
The performance data includes the metric and invocation information for each functionthat executes in the application. The performance data during measurement enables youto compare the relative efficiencies of various portions of your target program. Bothexclusive and inclusive timing measurements are provided in the performance data.
The parent-child calling relationships between your program's functions are alsoprovided. Each function pair consists of a caller and a callee with data provided for each.
2.3.5 Call Tree
The Call Tree data shows the general application flow in a hierarchical tree in whichstatistics are displayed for each function.
2.3.6 Profiling Data
The profiling data is collected for the ColdFire V2-V4 and ColdFire V4e targets, whichdo not have the hardware capability to collect trace data. The profiling data displays thethe summarized, detailed, and class-based information of each function profiled.
Chapter 2 Getting Started
CodeWarrior Development Studio for Microcontrollers Version 10.x Profiling and Analysis Tools UsersGuide, Rev. 10.6, 02/2014
Freescale Semiconductor, Inc. 15

Data Collection
CodeWarrior Development Studio for Microcontrollers Version 10.x Profiling and Analysis Tools UsersGuide, Rev. 10.6, 02/2014
16 Freescale Semiconductor, Inc.
Chapter 3Collecting DataThe basic process of collecting data when an application runs on the HCS08, ColdFireV1, Kinetis, and ColdFire V4e target hardware includes:
• creating and configuring a project for the target hardware,• setting up the debugger launch configuration to collect the analysis data from the
target hardware, and• running the application on the target hardware to collect data.
This process of collecting data is divided into:
• Creating New Project• Configuring Launcher• Collecting Data• Viewing Data
3.1 Creating New Project
The CodeWarrior IDE is a project-oriented interface. You can use the New Projectwizard to create new Microcontrollers projects for hardware profiling.
• Using HCS08 Target• Using ColdFire V1 Target• Using Kinetis Target• Using ColdFire V4e• Using MPC56xx Target
NOTEYou must create a new project or open an existing projectbefore using the Profiling and Analysis tools.
CodeWarrior Development Studio for Microcontrollers Version 10.x Profiling and Analysis Tools UsersGuide, Rev. 10.6, 02/2014
Freescale Semiconductor, Inc. 17

3.1.1 Using HCS08 Target
To create a new Microcontrollers project using the HCS08 target:
1. Select File > New > Project.
The New Project dialog box appears.
2. Select Bareboard Project and click Next.
The Create an MCU Bareboard Project page appears.
3. Enter the name of your project in the Project Name text box.
NOTEYou can also open the Create an MCU BareboardProject page directly by selecting File > New >Bareboard Project.
4. Clear the Use default location checkbox, and click Browse to specify a differentlocation for the new project. The default setting of the Use default locationcheckbox is checked. The table below describes the Microcontrollers bareboardproject settings.
5. Click Next.
The Devices page appears.
6. Select the target device or board for your project from the HCS08 family. Forexample, select S08 > HCS08QE Family > MC9SO8QE128.
Creating New Project
CodeWarrior Development Studio for Microcontrollers Version 10.x Profiling and Analysis Tools UsersGuide, Rev. 10.6, 02/2014
18 Freescale Semiconductor, Inc.
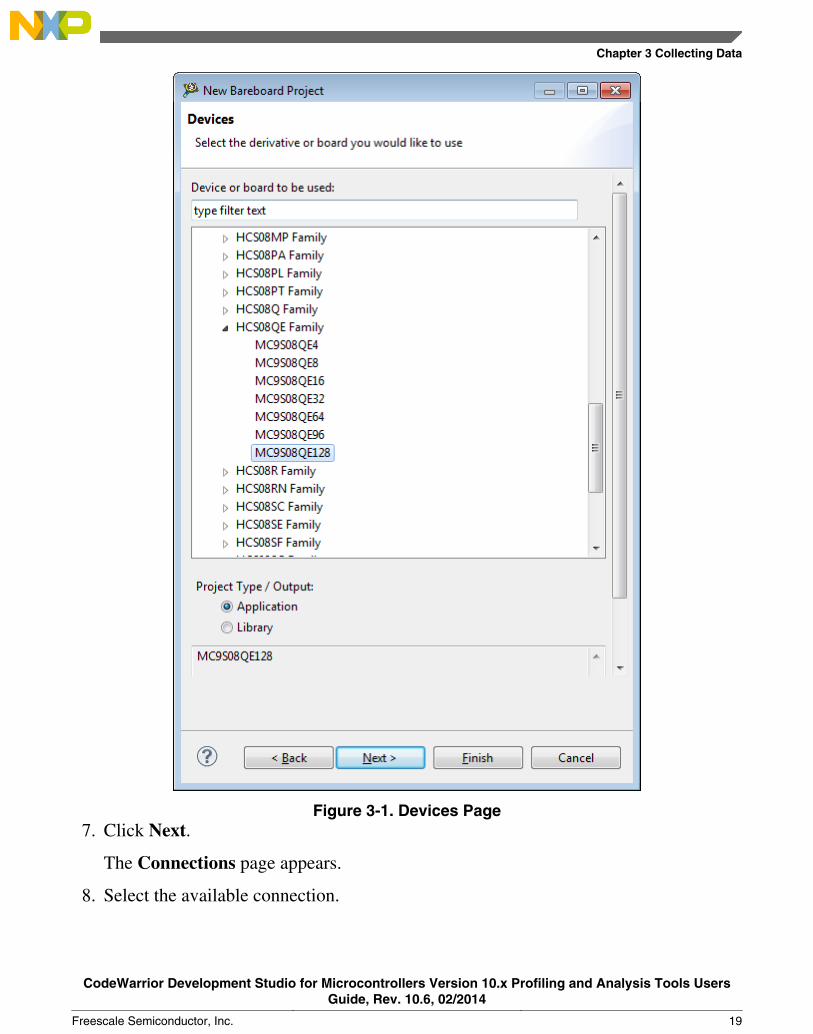
Figure 3-1. Devices Page7. Click Next.
The Connections page appears.
8. Select the available connection.
Chapter 3 Collecting Data
CodeWarrior Development Studio for Microcontrollers Version 10.x Profiling and Analysis Tools UsersGuide, Rev. 10.6, 02/2014
Freescale Semiconductor, Inc. 19
NOTEThe Profiling supports all the connections except thesimulator.
9. Click Next.
The Languages page appears.
You can use this page to select the programming language that you want to use whenwriting the program's source code. You can make multiple selections, creating thecode in multiple formats.
10. Do not change the default settings on the Languages page.11. Click Next.
The Rapid Application Development page appears.
12. Accept the default settings and click Next.13. Click Next.
The C/C++ Options page appears.
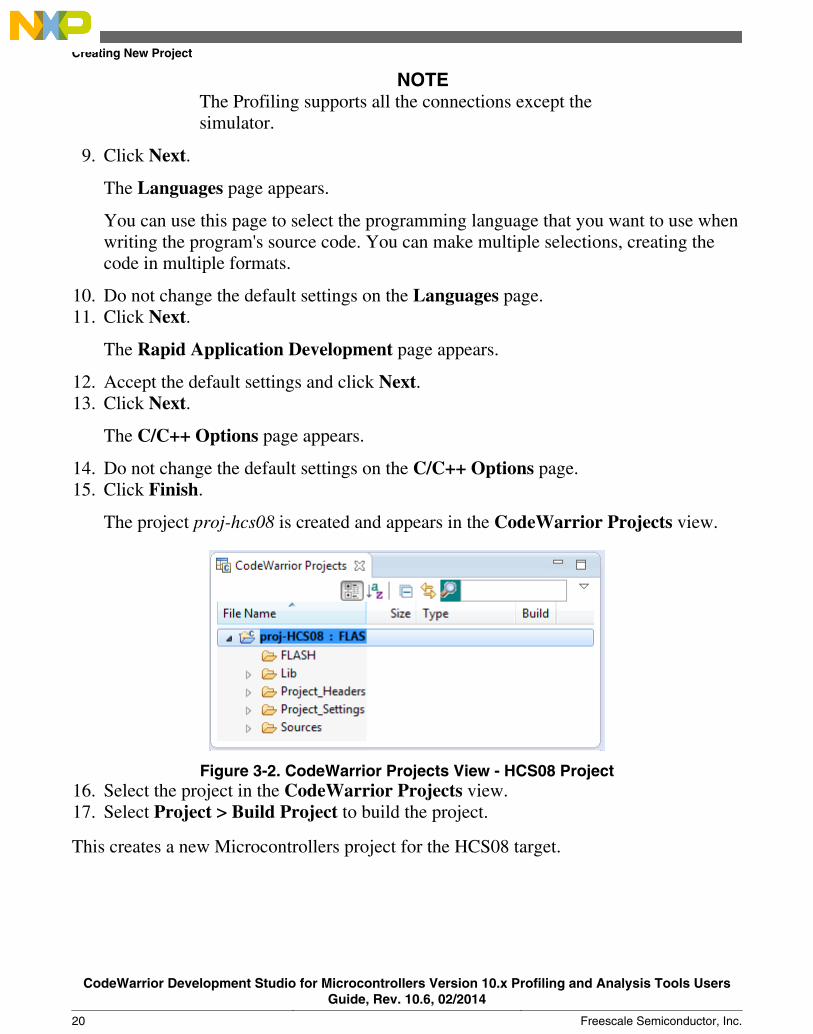
14. Do not change the default settings on the C/C++ Options page.15. Click Finish.
The project proj-hcs08 is created and appears in the CodeWarrior Projects view.
Figure 3-2. CodeWarrior Projects View - HCS08 Project16. Select the project in the CodeWarrior Projects view.17. Select Project > Build Project to build the project.
This creates a new Microcontrollers project for the HCS08 target.
Creating New Project
CodeWarrior Development Studio for Microcontrollers Version 10.x Profiling and Analysis Tools UsersGuide, Rev. 10.6, 02/2014
20 Freescale Semiconductor, Inc.
NOTEFor details on creating a new MCU bareboard project, referCodeWarrior Development Studio for Microcontrollers V10.xTargeting Manual located at C:\Freescale\CW MCU v10.x\MCU\Help.
3.1.2 Using ColdFire V1 Target
To create a new Microcontrollers project using the ColdFire V1 target:
1. Select File > New > Project.
The New Project dialog box appears.
2. Select Bareboard Project and click Next.
The Create an MCU Bareboard Project page appears.
3. Enter the name of your project in the Project Name text box, and specify thelocation of the project if you do not want to use the default location.
NOTEYou can also open the Create an MCU BareboardProject page directly by selecting File > New >Bareboard Project.
4. Click Next.
The Devices page appears.
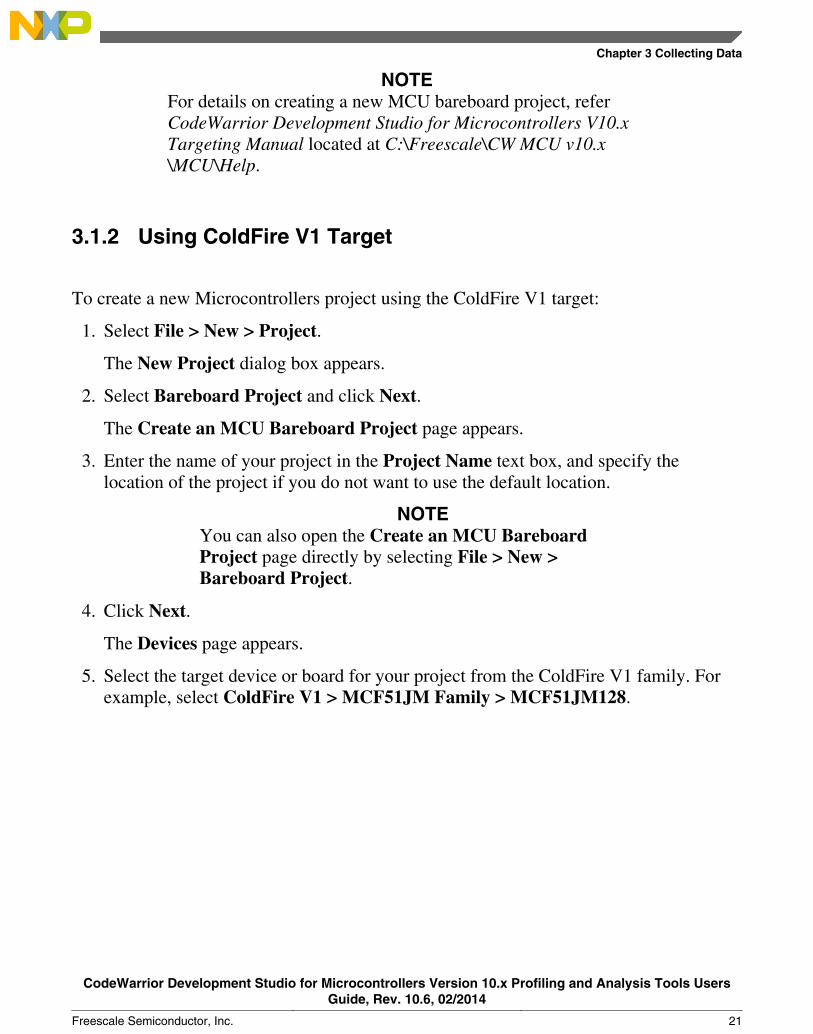
5. Select the target device or board for your project from the ColdFire V1 family. Forexample, select ColdFire V1 > MCF51JM Family > MCF51JM128.
Chapter 3 Collecting Data
CodeWarrior Development Studio for Microcontrollers Version 10.x Profiling and Analysis Tools UsersGuide, Rev. 10.6, 02/2014
Freescale Semiconductor, Inc. 21
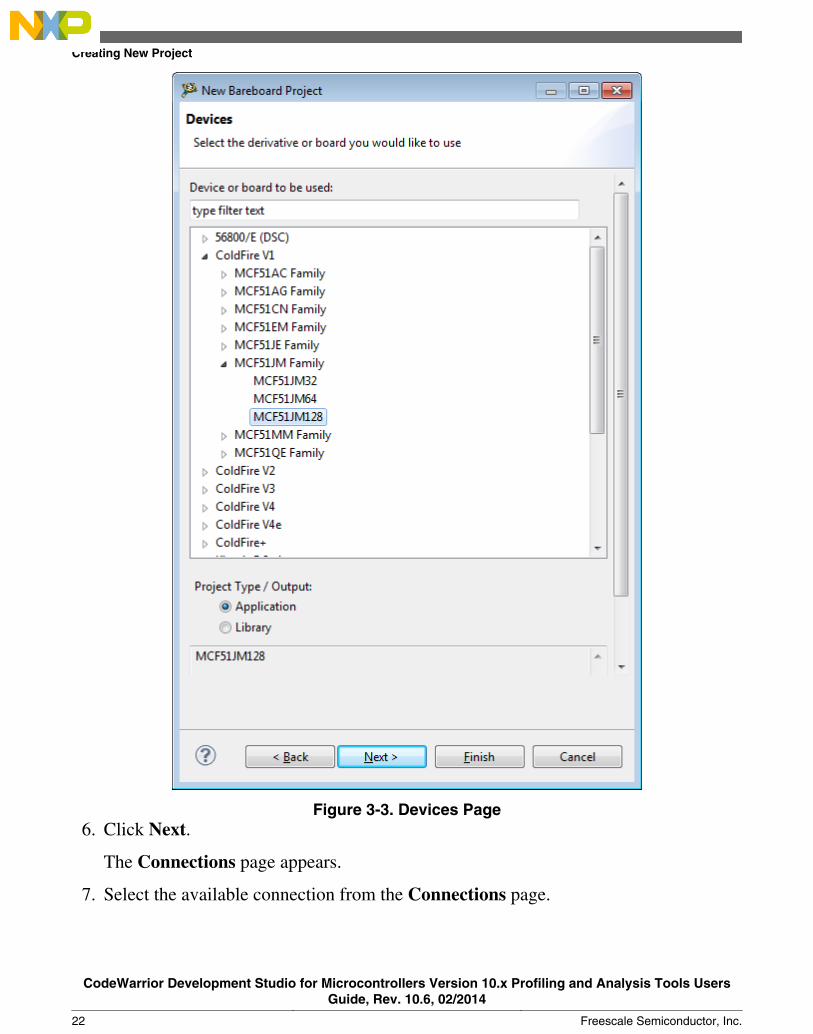
Figure 3-3. Devices Page6. Click Next.
The Connections page appears.
7. Select the available connection from the Connections page.
Creating New Project
CodeWarrior Development Studio for Microcontrollers Version 10.x Profiling and Analysis Tools UsersGuide, Rev. 10.6, 02/2014
22 Freescale Semiconductor, Inc.
NOTEThe Profiling supports all the connections except thesimulator.
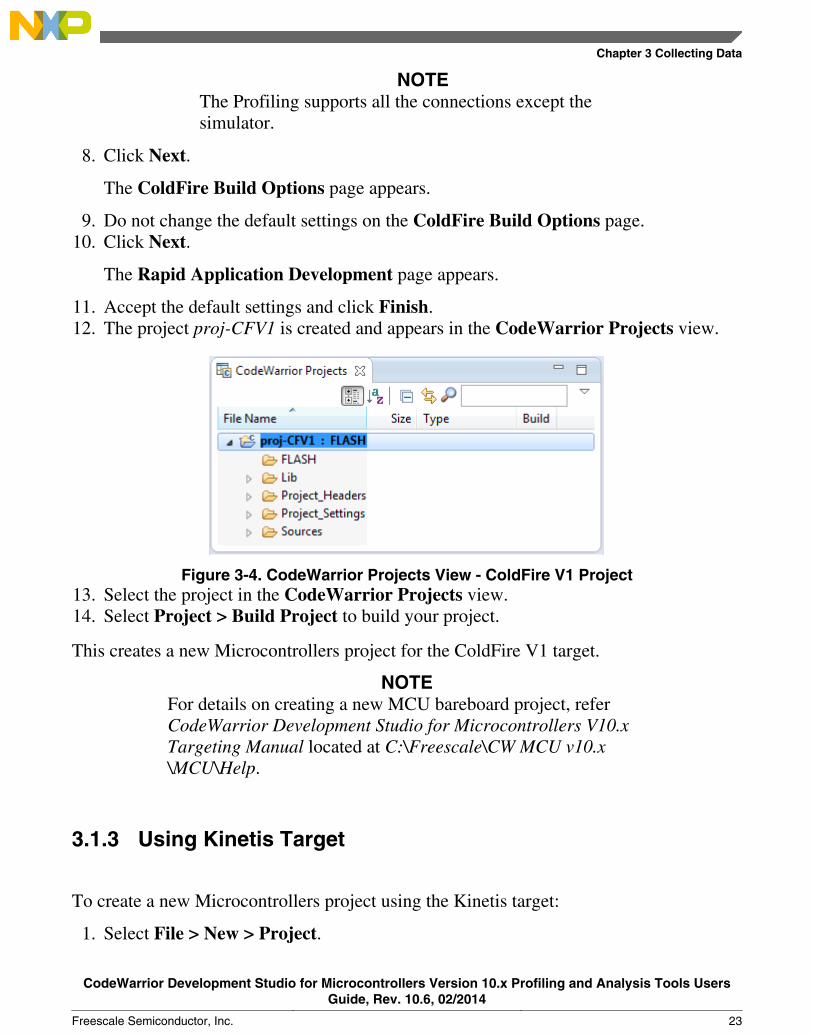
8. Click Next.
The ColdFire Build Options page appears.
9. Do not change the default settings on the ColdFire Build Options page.10. Click Next.
The Rapid Application Development page appears.
11. Accept the default settings and click Finish.12. The project proj-CFV1 is created and appears in the CodeWarrior Projects view.
Figure 3-4. CodeWarrior Projects View - ColdFire V1 Project13. Select the project in the CodeWarrior Projects view.14. Select Project > Build Project to build your project.
This creates a new Microcontrollers project for the ColdFire V1 target.
NOTEFor details on creating a new MCU bareboard project, referCodeWarrior Development Studio for Microcontrollers V10.xTargeting Manual located at C:\Freescale\CW MCU v10.x\MCU\Help.
3.1.3 Using Kinetis Target
To create a new Microcontrollers project using the Kinetis target:
1. Select File > New > Project.
Chapter 3 Collecting Data
CodeWarrior Development Studio for Microcontrollers Version 10.x Profiling and Analysis Tools UsersGuide, Rev. 10.6, 02/2014
Freescale Semiconductor, Inc. 23

The New Project dialog box appears.
2. Select Bareboard Project and click Next.
The Create an MCU Bareboard Project page appears.
3. Enter the name of your project in the Project Name text box, for example,TraceProject, and specify the location of the project if you do not want to use thedefault location.
NOTEYou can also open the Create an MCU BareboardProject page directly by selecting File > New >Bareboard Project.
4. Click Next.
The Devices page appears.
5. Select the target device or board for your project from the Kinetis family. Forexample, select Kinetis K Series > K4x Family > K40D (100 MHz) Family >MK40DN512Z.
Creating New Project
CodeWarrior Development Studio for Microcontrollers Version 10.x Profiling and Analysis Tools UsersGuide, Rev. 10.6, 02/2014
24 Freescale Semiconductor, Inc.
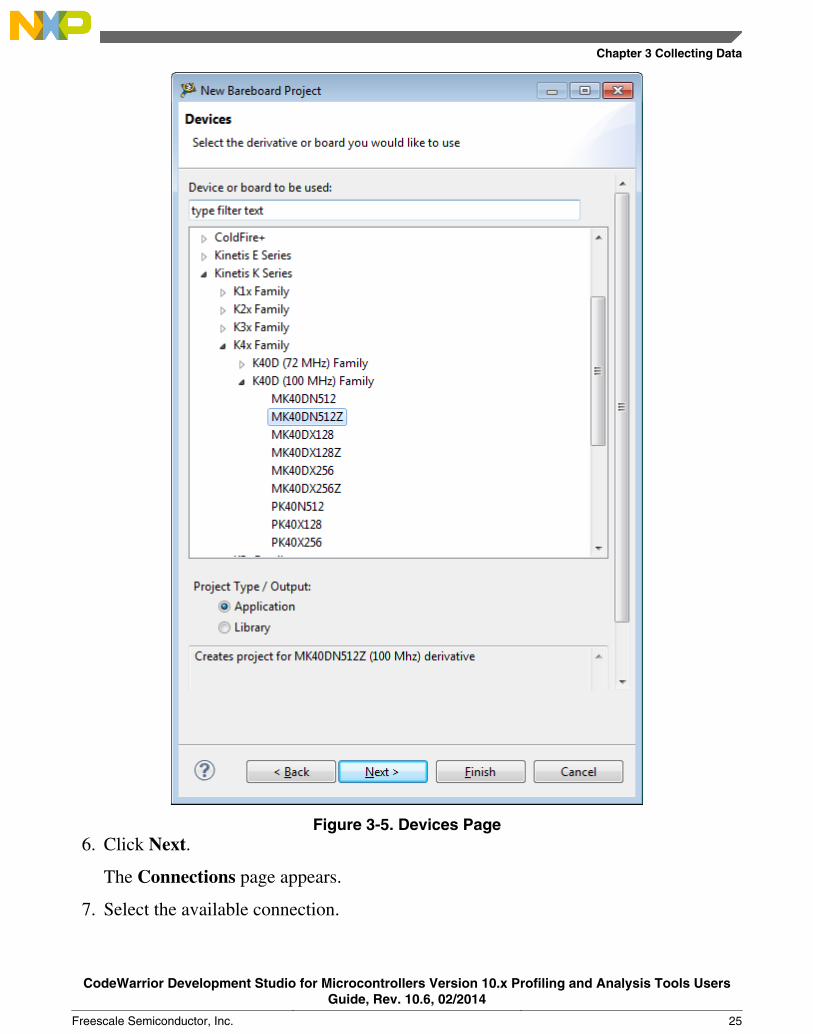
Figure 3-5. Devices Page6. Click Next.
The Connections page appears.
7. Select the available connection.
Chapter 3 Collecting Data
CodeWarrior Development Studio for Microcontrollers Version 10.x Profiling and Analysis Tools UsersGuide, Rev. 10.6, 02/2014
Freescale Semiconductor, Inc. 25
NOTEThe Profiling supports all the connections except thesimulator.
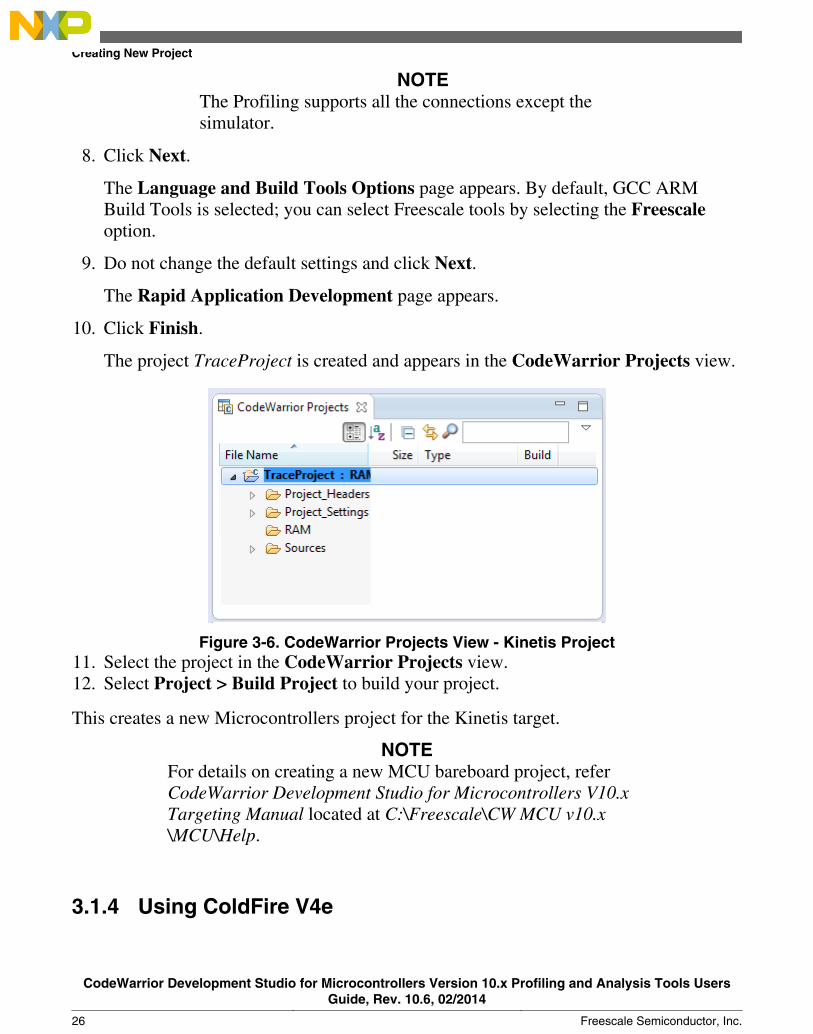
8. Click Next.
The Language and Build Tools Options page appears. By default, GCC ARMBuild Tools is selected; you can select Freescale tools by selecting the Freescaleoption.
9. Do not change the default settings and click Next.
The Rapid Application Development page appears.
10. Click Finish.
The project TraceProject is created and appears in the CodeWarrior Projects view.
Figure 3-6. CodeWarrior Projects View - Kinetis Project11. Select the project in the CodeWarrior Projects view.12. Select Project > Build Project to build your project.
This creates a new Microcontrollers project for the Kinetis target.
NOTEFor details on creating a new MCU bareboard project, referCodeWarrior Development Studio for Microcontrollers V10.xTargeting Manual located at C:\Freescale\CW MCU v10.x\MCU\Help.
3.1.4 Using ColdFire V4e
Creating New Project
CodeWarrior Development Studio for Microcontrollers Version 10.x Profiling and Analysis Tools UsersGuide, Rev. 10.6, 02/2014
26 Freescale Semiconductor, Inc.

To create a new Microcontrollers project using the ColdFire V4e target:
1. Select File > New > Project.
The New Project dialog box appears.
2. Select Bareboard Project and click Next.
The Create an MCU Bareboard Project page appears.
3. Enter the name of your project in the Project Name text box, and specify thelocation of the project if you do not want to use the default location.
4. Click Next.
The Devices page appears.
5. Select the target device or board for your project from the ColdFire V4e family. Forexample, select ColdFire V4e > MCF548x > MCF5485.
Chapter 3 Collecting Data
CodeWarrior Development Studio for Microcontrollers Version 10.x Profiling and Analysis Tools UsersGuide, Rev. 10.6, 02/2014
Freescale Semiconductor, Inc. 27
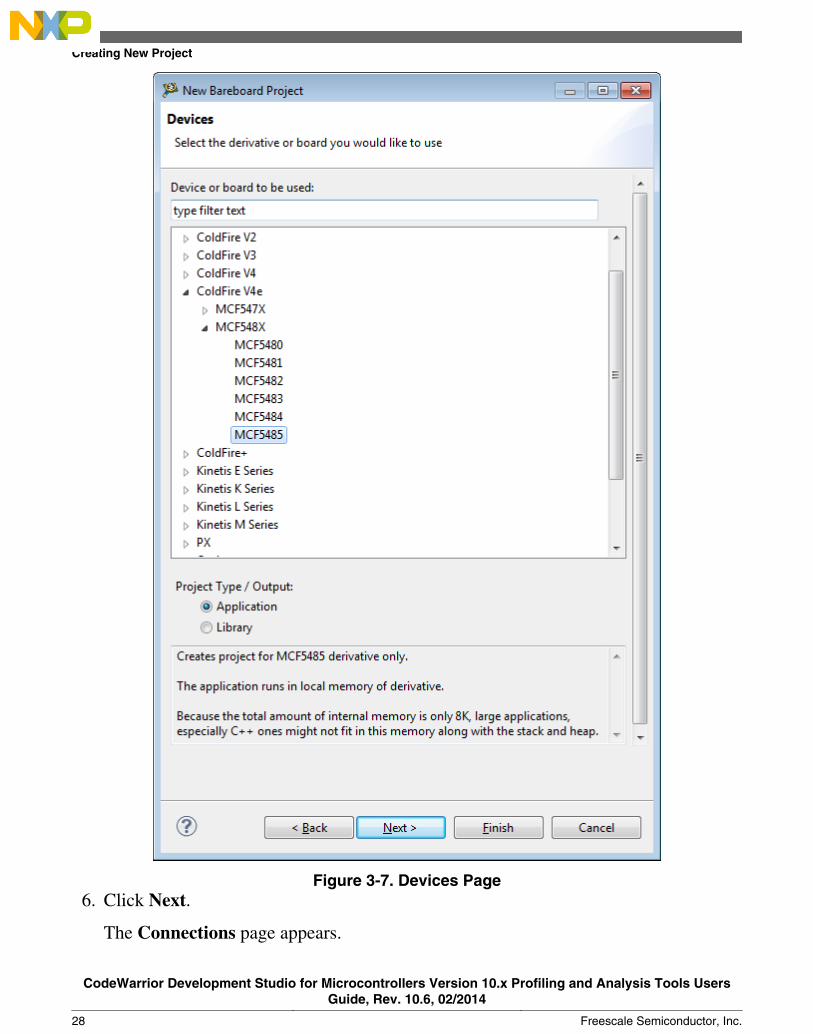
Figure 3-7. Devices Page6. Click Next.
The Connections page appears.
Creating New Project
CodeWarrior Development Studio for Microcontrollers Version 10.x Profiling and Analysis Tools UsersGuide, Rev. 10.6, 02/2014
28 Freescale Semiconductor, Inc.
7. Select the available connection.8. Click Next.
The ColdFire Build Options page appears.
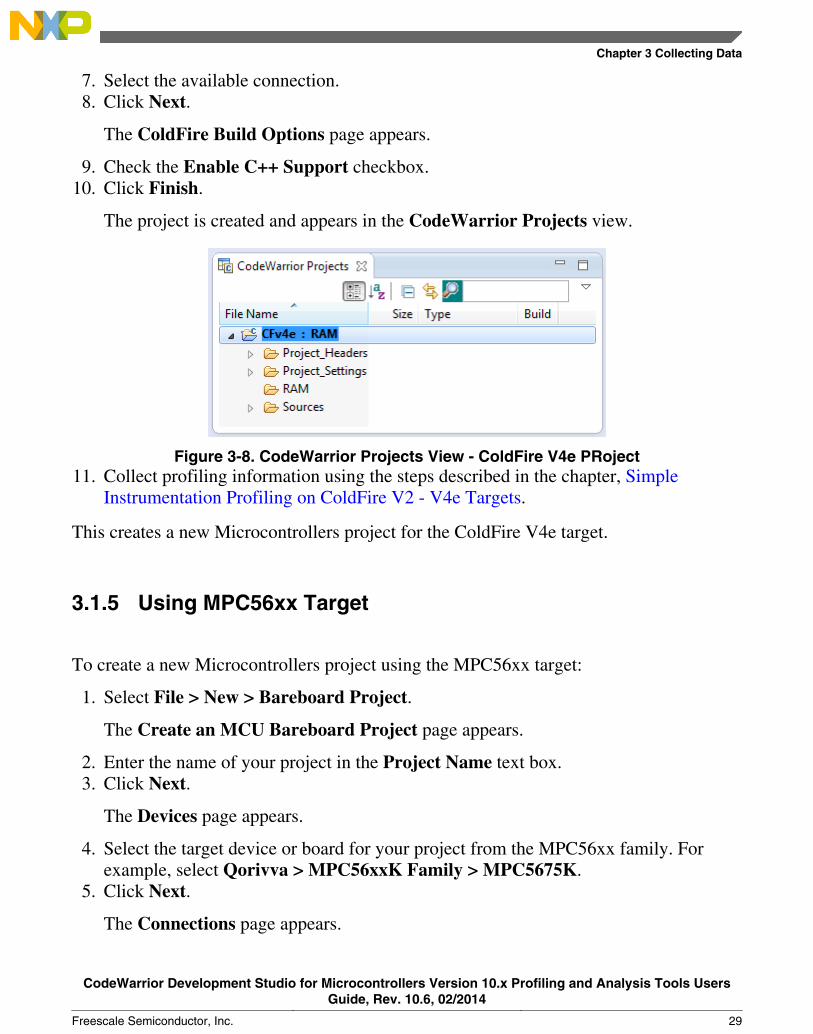
9. Check the Enable C++ Support checkbox.10. Click Finish.
The project is created and appears in the CodeWarrior Projects view.
Figure 3-8. CodeWarrior Projects View - ColdFire V4e PRoject11. Collect profiling information using the steps described in the chapter, Simple
Instrumentation Profiling on ColdFire V2 - V4e Targets.
This creates a new Microcontrollers project for the ColdFire V4e target.
3.1.5 Using MPC56xx Target
To create a new Microcontrollers project using the MPC56xx target:
1. Select File > New > Bareboard Project.
The Create an MCU Bareboard Project page appears.
2. Enter the name of your project in the Project Name text box.3. Click Next.
The Devices page appears.
4. Select the target device or board for your project from the MPC56xx family. Forexample, select Qorivva > MPC56xxK Family > MPC5675K.
5. Click Next.
The Connections page appears.
Chapter 3 Collecting Data
CodeWarrior Development Studio for Microcontrollers Version 10.x Profiling and Analysis Tools UsersGuide, Rev. 10.6, 02/2014
Freescale Semiconductor, Inc. 29
6. Select the available connection, for example, P&E USB Multilink PPCNEXUS.7. Click Next.
The LSM/DPM configuration page appears.
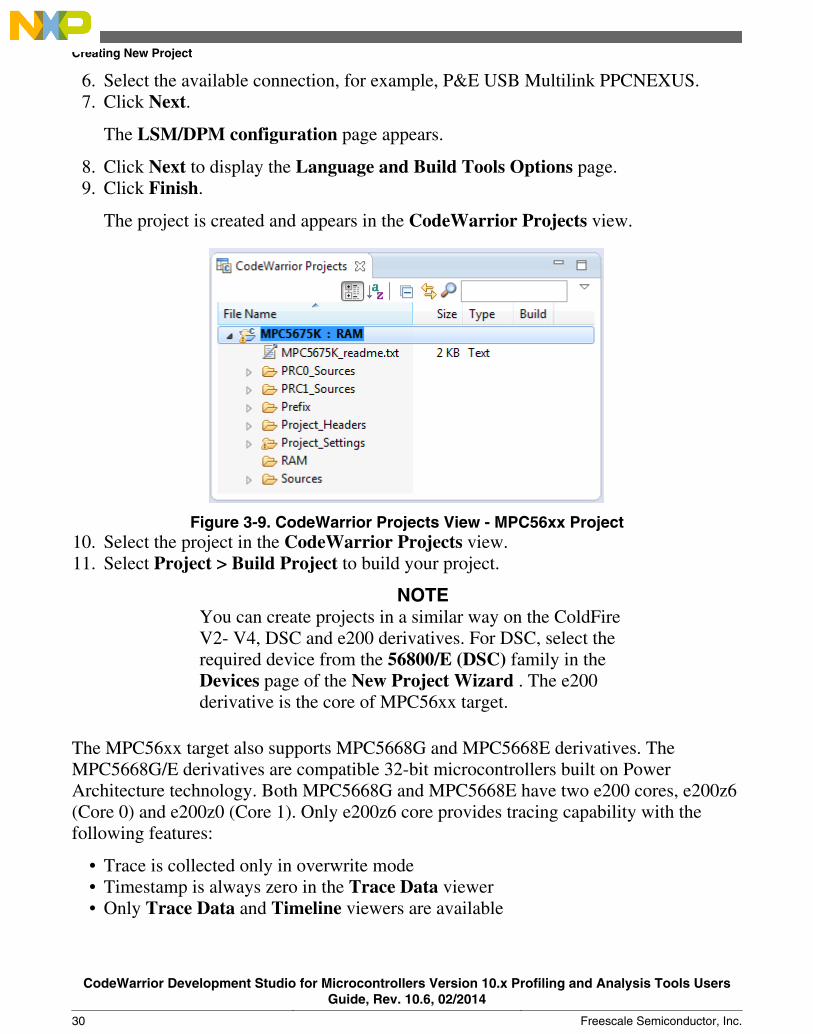
8. Click Next to display the Language and Build Tools Options page.9. Click Finish.
The project is created and appears in the CodeWarrior Projects view.
Figure 3-9. CodeWarrior Projects View - MPC56xx Project10. Select the project in the CodeWarrior Projects view.11. Select Project > Build Project to build your project.
NOTEYou can create projects in a similar way on the ColdFireV2- V4, DSC and e200 derivatives. For DSC, select therequired device from the 56800/E (DSC) family in theDevices page of the New Project Wizard . The e200derivative is the core of MPC56xx target.
The MPC56xx target also supports MPC5668G and MPC5668E derivatives. The MPC5668G/E derivatives are compatible 32-bit microcontrollers built on PowerArchitecture technology. Both MPC5668G and MPC5668E have two e200 cores, e200z6(Core 0) and e200z0 (Core 1). Only e200z6 core provides tracing capability with thefollowing features:
• Trace is collected only in overwrite mode• Timestamp is always zero in the Trace Data viewer• Only Trace Data and Timeline viewers are available
Creating New Project
CodeWarrior Development Studio for Microcontrollers Version 10.x Profiling and Analysis Tools UsersGuide, Rev. 10.6, 02/2014
30 Freescale Semiconductor, Inc.
While creating a MPC5668G/E project, select Qorivva > MPC5668G/E Family >MPC5668G/E to choose the required target and follow the New Project Wizard steps. Inthe Power Architecture Core Configuration page, select the required coreconfiguration. Select e200z6+e200z0h if you want to work on both cores, else selecte200z6 to work on a single core.
3.2 Configuring Launcher
Before debugging an application, you need to configure the Trace and Profile settingsused for the current debug launcher.
• Configure HCS08 Target• Configure ColdFire V1 Target• Configure Kinetis Target• Configuring Advanced Settings on Kinetis• Configure MPC56xx Target• Configure S12Z Target• Configure ColdFire V2-V4 Targets• Configure DSC Target
NOTEUse the same steps to configure launcher for e200 and DSCtargets.
3.2.1 Configure HCS08 Target
To configure the launch configuration for the HCS08 target:
1. In the CodeWarrior Projects view, right-click the project and select Debug As >Debug Configurations from the context menu.
The Debug Configurations dialog box appears.
2. In the Debug Configurations dialog box, expand the CodeWarrior configuration inthe tree structure on the left, and select the launch configuration corresponding to theproject you are using. For example, select proj-HCS08_FLASH_PnE U-MultiLink.
3. On the Main tab page, verify that proj-HCS08 is displayed in the Project field. If itdoes not appear, click Browse and locate the project.
Chapter 3 Collecting Data
CodeWarrior Development Studio for Microcontrollers Version 10.x Profiling and Analysis Tools UsersGuide, Rev. 10.6, 02/2014
Freescale Semiconductor, Inc. 31
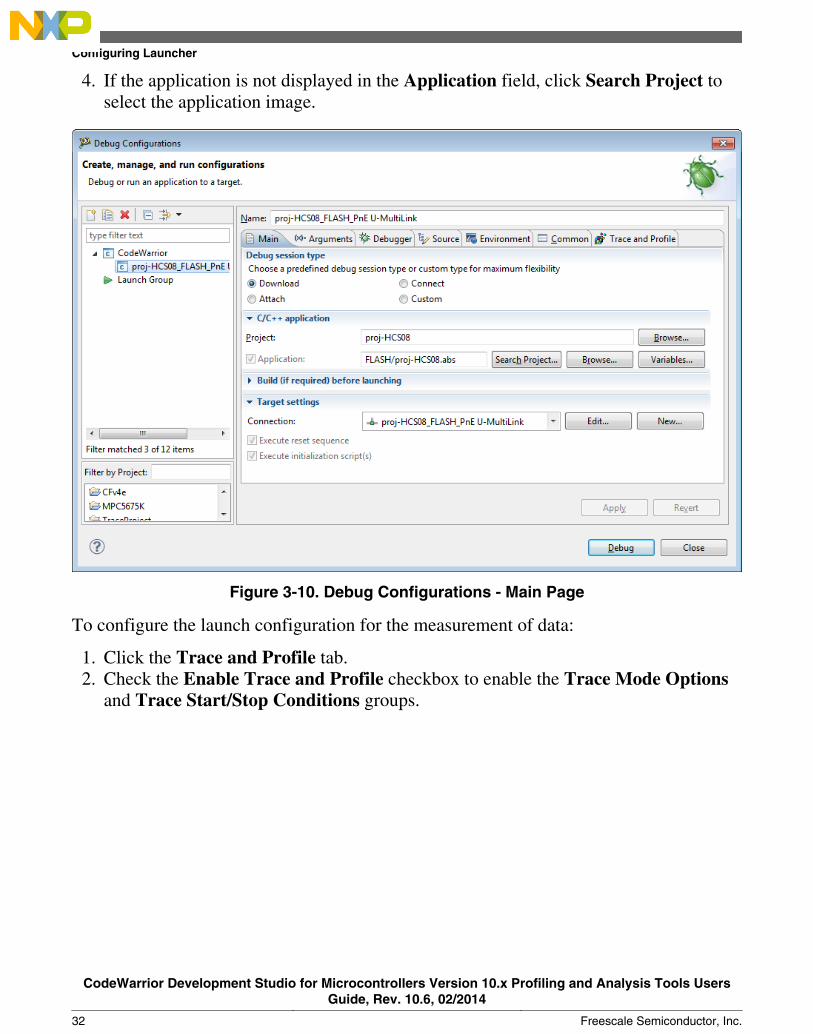
4. If the application is not displayed in the Application field, click Search Project toselect the application image.
Figure 3-10. Debug Configurations - Main Page
To configure the launch configuration for the measurement of data:
1. Click the Trace and Profile tab.2. Check the Enable Trace and Profile checkbox to enable the Trace Mode Options
and Trace Start/Stop Conditions groups.
Configuring Launcher
CodeWarrior Development Studio for Microcontrollers Version 10.x Profiling and Analysis Tools UsersGuide, Rev. 10.6, 02/2014
32 Freescale Semiconductor, Inc.
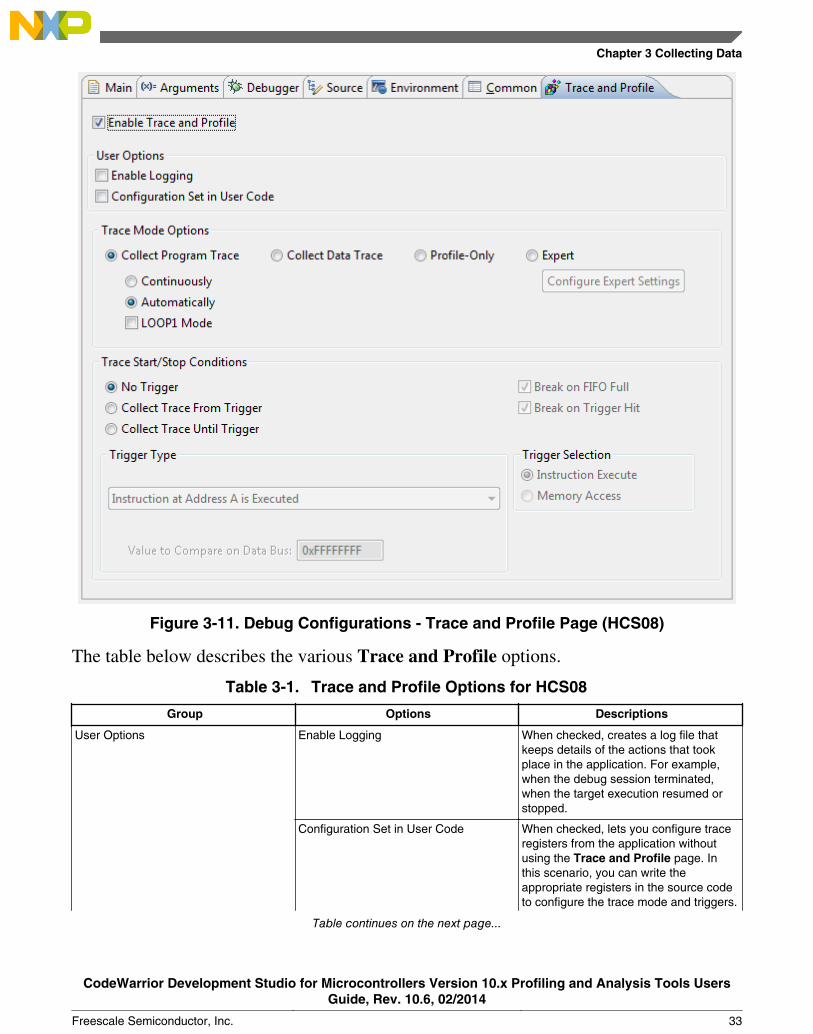
Figure 3-11. Debug Configurations - Trace and Profile Page (HCS08)
The table below describes the various Trace and Profile options.
Table 3-1. Trace and Profile Options for HCS08
Group Options Descriptions
User Options Enable Logging When checked, creates a log file thatkeeps details of the actions that tookplace in the application. For example,when the debug session terminated,when the target execution resumed orstopped.
Configuration Set in User Code When checked, lets you configure traceregisters from the application withoutusing the Trace and Profile page. Inthis scenario, you can write theappropriate registers in the source codeto configure the trace mode and triggers.
Table continues on the next page...
Chapter 3 Collecting Data
CodeWarrior Development Studio for Microcontrollers Version 10.x Profiling and Analysis Tools UsersGuide, Rev. 10.6, 02/2014
Freescale Semiconductor, Inc. 33
Table 3-1. Trace and Profile Options for HCS08 (continued)
Group Options Descriptions
To understand how to configure traceregisters in the application for theHCS08 target, refer Configuring TraceRegisters in Source Code.
Trace Mode Options Collect Program Trace Consists of these options:• Continuously - When selected,
collects the trace datacontinuously. The trace buffer isread, processed, and emptiedperiodically, so that the TraceData viewer can collect all thetrace records generated by theapplication. In this mode, the tracedata is not lost. It is a bit intrusiveas it stops the target repeatedly inthe background for collecting thetrace buffers.
• Automatically - When selected,the entries in the buffer startoverwriting without interruptionwhen the data reaches at the endof the buffer. If there is more tracedata than the size of the buffer, theold entries will be overwritten.
• LOOP1 Mode - Lets you collectthe trace data without anyconsecutive identical addresses. Ifthe next address to be stored inFIFO is the same as the onestored last time, it is ignored. Thismode is particularly useful withshort busy-wait type loops, whichare repeated a large number oftimes or recursive calls, and isrecommended when you want toview the coverage of that code,but not necessarily the number oftimes the code executed.
For more information, referMC9S08QE128 Reference Manual.NOTE: The LOOP1 Mode option isvisible only for the debug version 3(DbgVer 3) targets, that is HCS08 targetwith three comparators. For any othertargets with two comparators, this optionis not visible.
Collect Data Trace Collects the trace data of the values of avariable, which is located at the addresswhere trigger B is set, for all theaccesses (Read/Write/Both).
Profile-Only When selected, collects trace bysampling the program counter (PC) fromtime to time.
Table continues on the next page...
Configuring Launcher
CodeWarrior Development Studio for Microcontrollers Version 10.x Profiling and Analysis Tools UsersGuide, Rev. 10.6, 02/2014
34 Freescale Semiconductor, Inc.
Table 3-1. Trace and Profile Options for HCS08 (continued)
Group Options Descriptions
Expert When selected, enables the ConfigureExpert Settings button and gives youaccess to most of the on-chip DBGmodule registers. To configure expertsettings, download the processorspecific manual from the site: http://www.freescale.com/
Trace Start/Stop Conditions No Trigger Specifies that no triggers are set forcollecting trace. When no triggers areset and trace is collected, the trace datastarts collecting from the beginning ofthe application.
For more information on tracepoints,refer Setting Tracepoints (HCS08).
Collect Trace From Trigger Starts collecting trace when the triggersgenerate, that is when the condition forA and B is met.
For more information on tracepoints,refer Setting Tracepoints (HCS08).
Keep Last Buffer Before Trigger When checked, overwrites the tracebuffer during trace collection before thetrigger is hit. When trigger is hit, tracestarts collecting, gets appended to theexisting buffer, and only the last part ofthe buffer is displayed in the Trace Dataviewer.
It gets enabled in the Continuouslymode when the Collect Trace FromTrigger option is selected.
Break on FIFO Full While debugging, suspends theapplication automatically when buffergets full. The checkbox gets enabled inthe Automatically mode when theCollect Trace From Trigger option isselected.
Collect Trace Until Trigger Starts collecting trace and stops whenthe condition for triggers, A and B is met.This option is not enabled in theContinuously mode.
For more information on tracepoints,refer Setting Tracepoints (HCS08).
Break on Trigger Hit While debugging, suspends theapplication automatically when thetrigger is hit, that is when the triggercondition is met. The checkbox getsenabled when the Collect Trace UntilTrigger option is selected.
Trigger Type Contains various conditions of triggers,A and B for starting/stopping tracecollection.
Table continues on the next page...
Chapter 3 Collecting Data
CodeWarrior Development Studio for Microcontrollers Version 10.x Profiling and Analysis Tools UsersGuide, Rev. 10.6, 02/2014
Freescale Semiconductor, Inc. 35
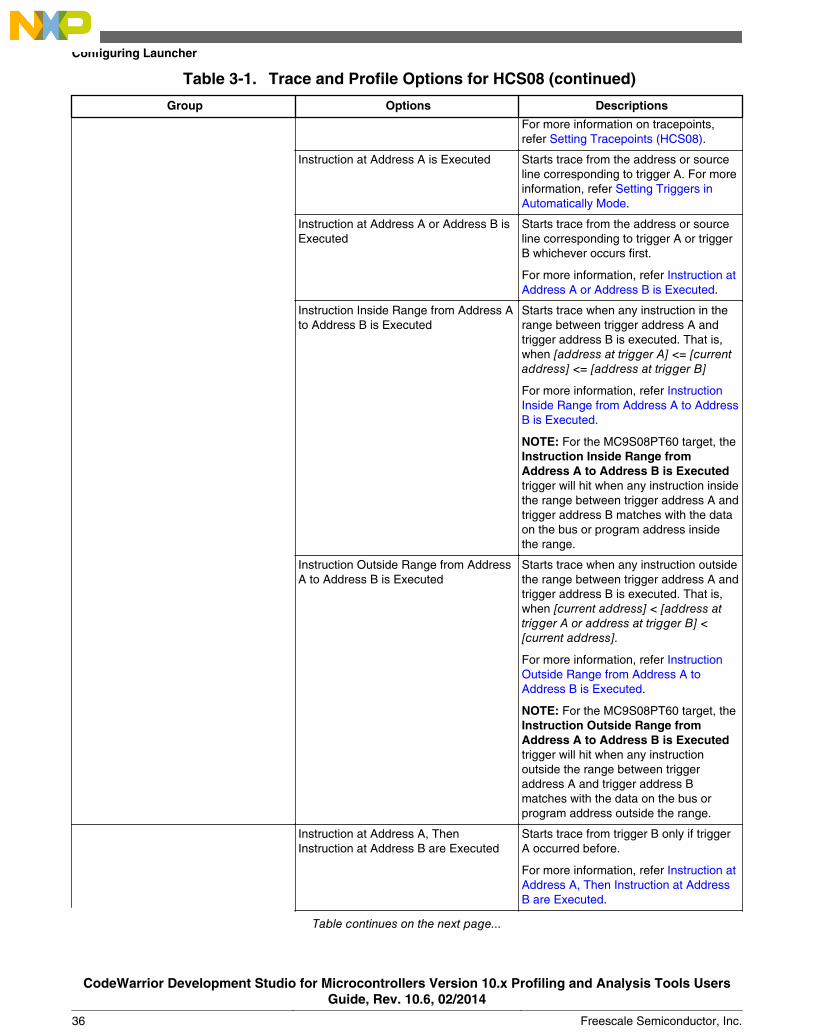
Table 3-1. Trace and Profile Options for HCS08 (continued)
Group Options Descriptions
For more information on tracepoints,refer Setting Tracepoints (HCS08).
Instruction at Address A is Executed Starts trace from the address or sourceline corresponding to trigger A. For moreinformation, refer Setting Triggers inAutomatically Mode.
Instruction at Address A or Address B isExecuted
Starts trace from the address or sourceline corresponding to trigger A or triggerB whichever occurs first.
For more information, refer Instruction atAddress A or Address B is Executed.
Instruction Inside Range from Address Ato Address B is Executed
Starts trace when any instruction in therange between trigger address A andtrigger address B is executed. That is,when [address at trigger A] <= [currentaddress] <= [address at trigger B]
For more information, refer InstructionInside Range from Address A to AddressB is Executed.
NOTE: For the MC9S08PT60 target, theInstruction Inside Range fromAddress A to Address B is Executedtrigger will hit when any instruction insidethe range between trigger address A andtrigger address B matches with the dataon the bus or program address insidethe range.
Instruction Outside Range from AddressA to Address B is Executed
Starts trace when any instruction outsidethe range between trigger address A andtrigger address B is executed. That is,when [current address] < [address attrigger A or address at trigger B] <[current address].
For more information, refer InstructionOutside Range from Address A toAddress B is Executed.
NOTE: For the MC9S08PT60 target, theInstruction Outside Range fromAddress A to Address B is Executedtrigger will hit when any instructionoutside the range between triggeraddress A and trigger address Bmatches with the data on the bus orprogram address outside the range.
Instruction at Address A, ThenInstruction at Address B are Executed
Starts trace from trigger B only if triggerA occurred before.
For more information, refer Instruction atAddress A, Then Instruction at AddressB are Executed.
Table continues on the next page...
Configuring Launcher
CodeWarrior Development Studio for Microcontrollers Version 10.x Profiling and Analysis Tools UsersGuide, Rev. 10.6, 02/2014
36 Freescale Semiconductor, Inc.
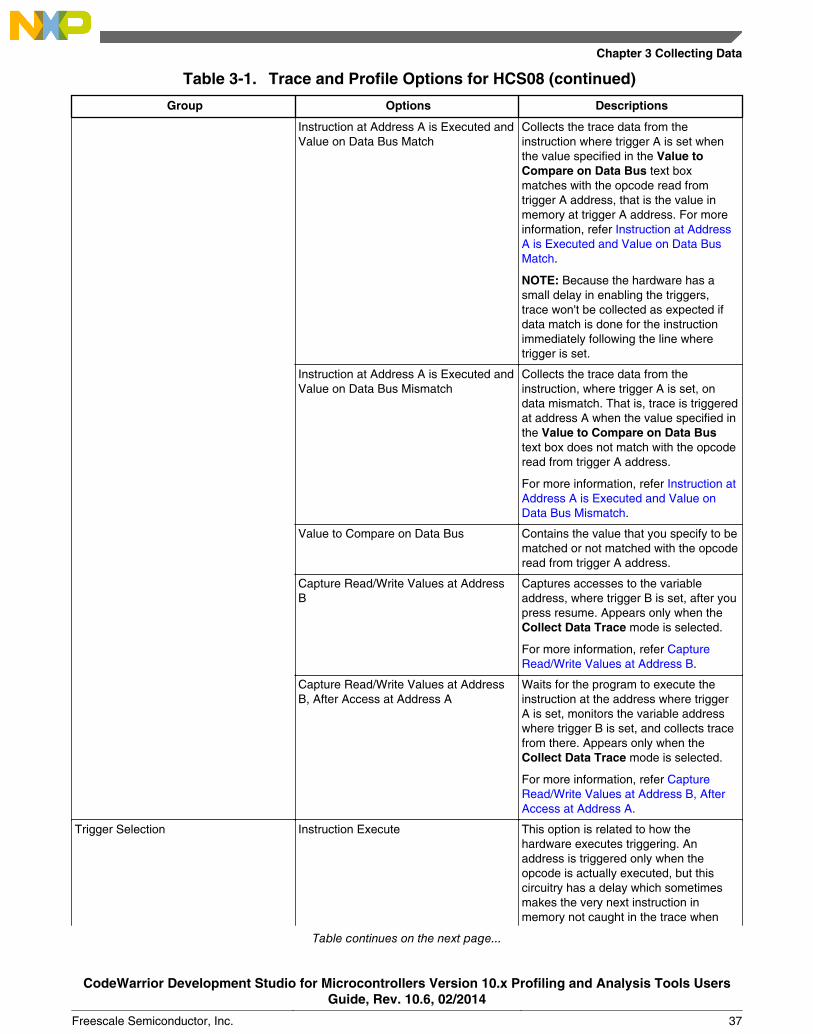
Table 3-1. Trace and Profile Options for HCS08 (continued)
Group Options Descriptions
Instruction at Address A is Executed andValue on Data Bus Match
Collects the trace data from theinstruction where trigger A is set whenthe value specified in the Value toCompare on Data Bus text boxmatches with the opcode read fromtrigger A address, that is the value inmemory at trigger A address. For moreinformation, refer Instruction at AddressA is Executed and Value on Data BusMatch.
NOTE: Because the hardware has asmall delay in enabling the triggers,trace won't be collected as expected ifdata match is done for the instructionimmediately following the line wheretrigger is set.
Instruction at Address A is Executed andValue on Data Bus Mismatch
Collects the trace data from theinstruction, where trigger A is set, ondata mismatch. That is, trace is triggeredat address A when the value specified inthe Value to Compare on Data Bustext box does not match with the opcoderead from trigger A address.
For more information, refer Instruction atAddress A is Executed and Value onData Bus Mismatch.
Value to Compare on Data Bus Contains the value that you specify to bematched or not matched with the opcoderead from trigger A address.
Capture Read/Write Values at AddressB
Captures accesses to the variableaddress, where trigger B is set, after youpress resume. Appears only when theCollect Data Trace mode is selected.
For more information, refer CaptureRead/Write Values at Address B.
Capture Read/Write Values at AddressB, After Access at Address A
Waits for the program to execute theinstruction at the address where triggerA is set, monitors the variable addresswhere trigger B is set, and collects tracefrom there. Appears only when theCollect Data Trace mode is selected.
For more information, refer CaptureRead/Write Values at Address B, AfterAccess at Address A.
Trigger Selection Instruction Execute This option is related to how thehardware executes triggering. Anaddress is triggered only when theopcode is actually executed, but thiscircuitry has a delay which sometimesmakes the very next instruction inmemory not caught in the trace when
Table continues on the next page...
Chapter 3 Collecting Data
CodeWarrior Development Studio for Microcontrollers Version 10.x Profiling and Analysis Tools UsersGuide, Rev. 10.6, 02/2014
Freescale Semiconductor, Inc. 37
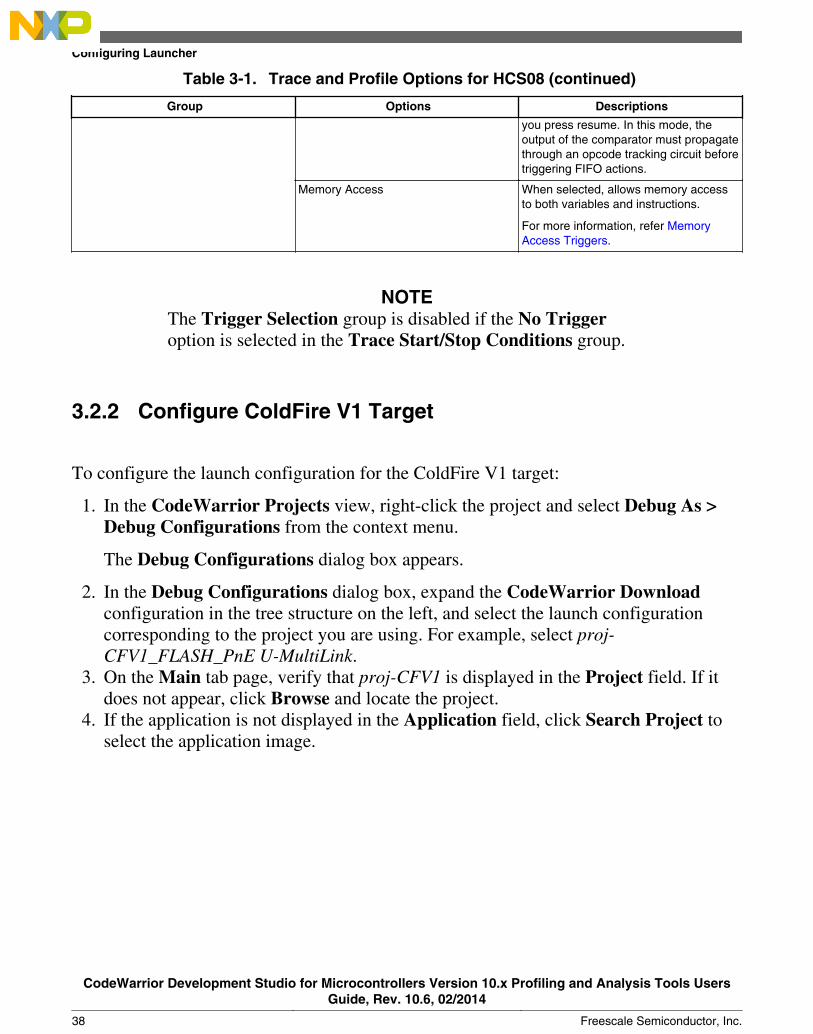
Table 3-1. Trace and Profile Options for HCS08 (continued)
Group Options Descriptions
you press resume. In this mode, theoutput of the comparator must propagatethrough an opcode tracking circuit beforetriggering FIFO actions.
Memory Access When selected, allows memory accessto both variables and instructions.
For more information, refer MemoryAccess Triggers.
NOTEThe Trigger Selection group is disabled if the No Triggeroption is selected in the Trace Start/Stop Conditions group.
3.2.2 Configure ColdFire V1 Target
To configure the launch configuration for the ColdFire V1 target:
1. In the CodeWarrior Projects view, right-click the project and select Debug As >Debug Configurations from the context menu.
The Debug Configurations dialog box appears.
2. In the Debug Configurations dialog box, expand the CodeWarrior Downloadconfiguration in the tree structure on the left, and select the launch configurationcorresponding to the project you are using. For example, select proj-CFV1_FLASH_PnE U-MultiLink.
3. On the Main tab page, verify that proj-CFV1 is displayed in the Project field. If itdoes not appear, click Browse and locate the project.
4. If the application is not displayed in the Application field, click Search Project toselect the application image.
Configuring Launcher
CodeWarrior Development Studio for Microcontrollers Version 10.x Profiling and Analysis Tools UsersGuide, Rev. 10.6, 02/2014
38 Freescale Semiconductor, Inc.
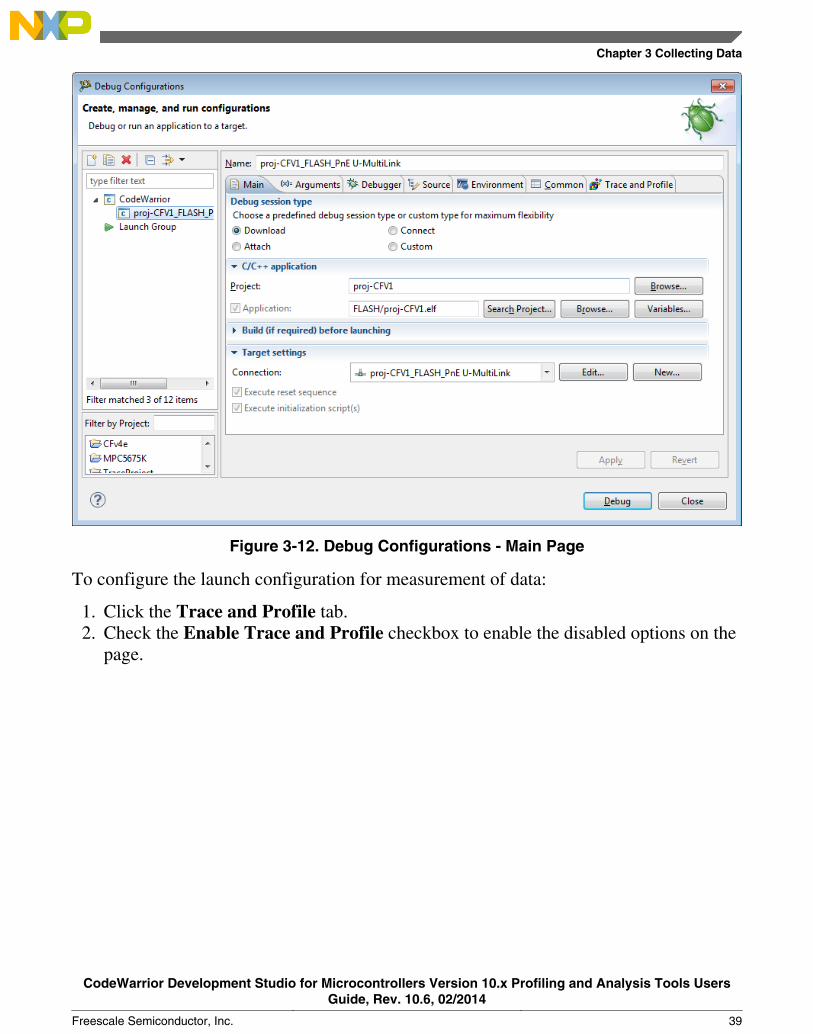
Figure 3-12. Debug Configurations - Main Page
To configure the launch configuration for measurement of data:
1. Click the Trace and Profile tab.2. Check the Enable Trace and Profile checkbox to enable the disabled options on the
page.
Chapter 3 Collecting Data
CodeWarrior Development Studio for Microcontrollers Version 10.x Profiling and Analysis Tools UsersGuide, Rev. 10.6, 02/2014
Freescale Semiconductor, Inc. 39
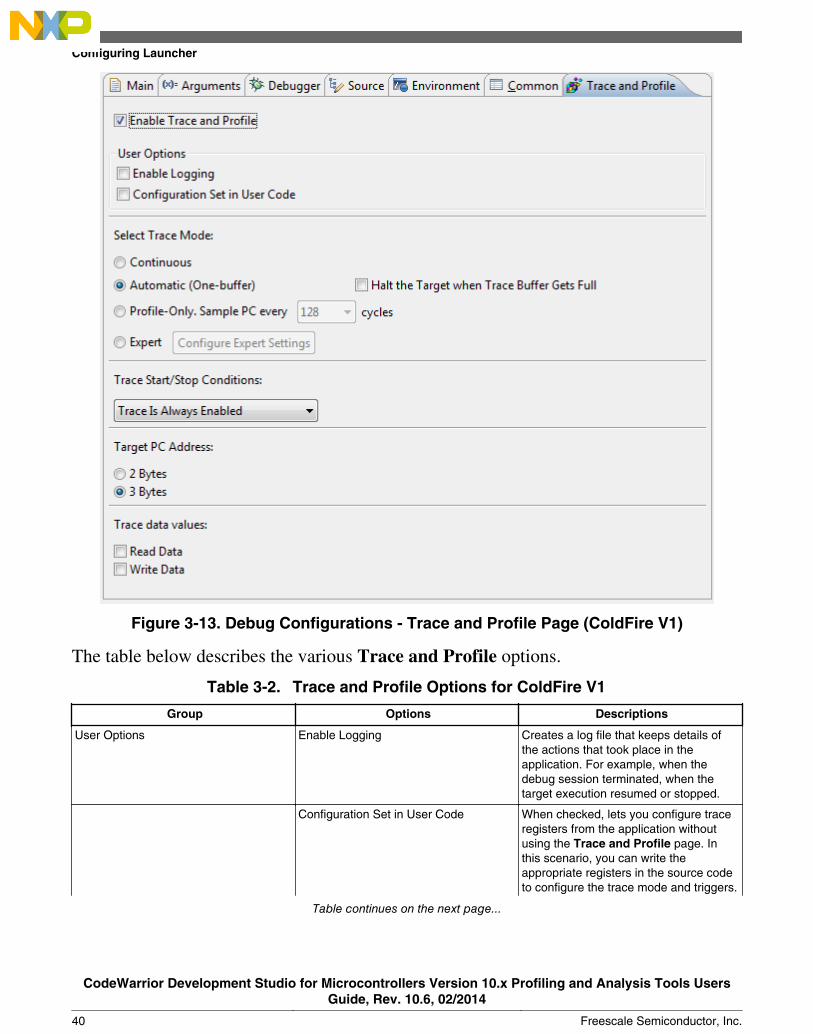
Figure 3-13. Debug Configurations - Trace and Profile Page (ColdFire V1)
The table below describes the various Trace and Profile options.
Table 3-2. Trace and Profile Options for ColdFire V1
Group Options Descriptions
User Options Enable Logging Creates a log file that keeps details ofthe actions that took place in theapplication. For example, when thedebug session terminated, when thetarget execution resumed or stopped.
Configuration Set in User Code When checked, lets you configure traceregisters from the application withoutusing the Trace and Profile page. Inthis scenario, you can write theappropriate registers in the source codeto configure the trace mode and triggers.
Table continues on the next page...
Configuring Launcher
CodeWarrior Development Studio for Microcontrollers Version 10.x Profiling and Analysis Tools UsersGuide, Rev. 10.6, 02/2014
40 Freescale Semiconductor, Inc.
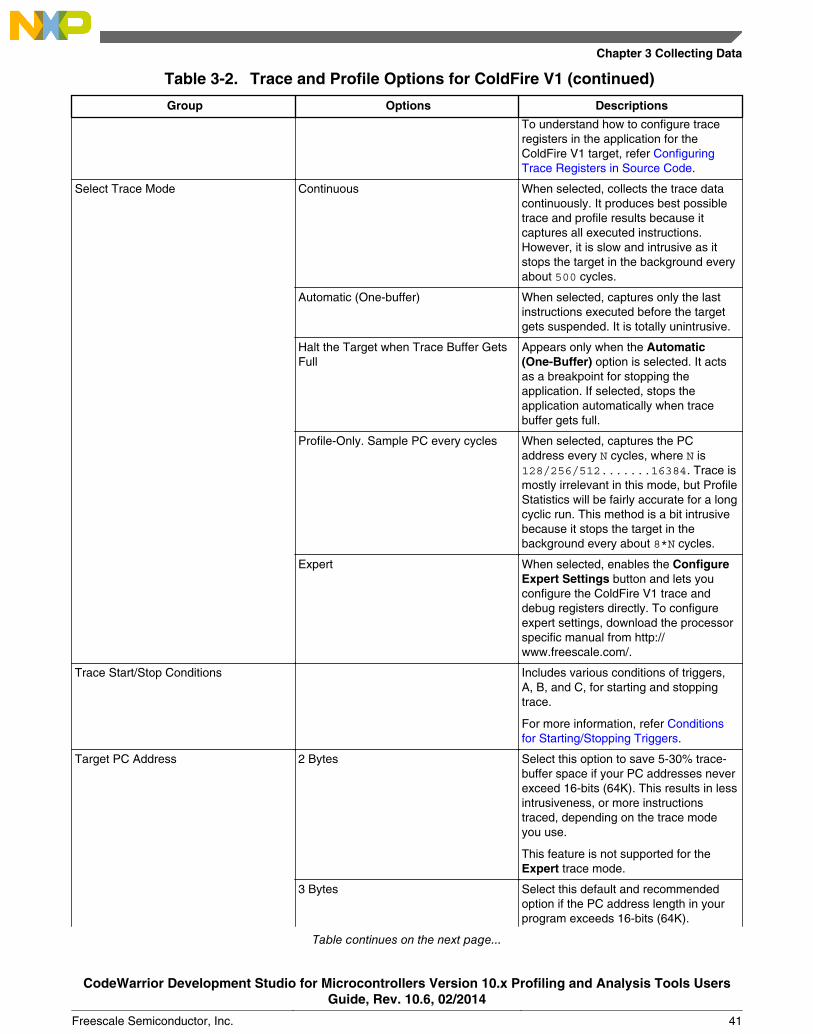
Table 3-2. Trace and Profile Options for ColdFire V1 (continued)
Group Options Descriptions
To understand how to configure traceregisters in the application for theColdFire V1 target, refer ConfiguringTrace Registers in Source Code.
Select Trace Mode Continuous When selected, collects the trace datacontinuously. It produces best possibletrace and profile results because itcaptures all executed instructions.However, it is slow and intrusive as itstops the target in the background everyabout 500 cycles.
Automatic (One-buffer) When selected, captures only the lastinstructions executed before the targetgets suspended. It is totally unintrusive.
Halt the Target when Trace Buffer GetsFull
Appears only when the Automatic(One-Buffer) option is selected. It actsas a breakpoint for stopping theapplication. If selected, stops theapplication automatically when tracebuffer gets full.
Profile-Only. Sample PC every cycles When selected, captures the PCaddress every N cycles, where N is128/256/512.......16384. Trace ismostly irrelevant in this mode, but ProfileStatistics will be fairly accurate for a longcyclic run. This method is a bit intrusivebecause it stops the target in thebackground every about 8*N cycles.
Expert When selected, enables the ConfigureExpert Settings button and lets youconfigure the ColdFire V1 trace anddebug registers directly. To configureexpert settings, download the processorspecific manual from http://www.freescale.com/.
Trace Start/Stop Conditions Includes various conditions of triggers,A, B, and C, for starting and stoppingtrace.
For more information, refer Conditionsfor Starting/Stopping Triggers.
Target PC Address 2 Bytes Select this option to save 5-30% trace-buffer space if your PC addresses neverexceed 16-bits (64K). This results in lessintrusiveness, or more instructionstraced, depending on the trace modeyou use.
This feature is not supported for theExpert trace mode.
3 Bytes Select this default and recommendedoption if the PC address length in yourprogram exceeds 16-bits (64K).
Table continues on the next page...
Chapter 3 Collecting Data
CodeWarrior Development Studio for Microcontrollers Version 10.x Profiling and Analysis Tools UsersGuide, Rev. 10.6, 02/2014
Freescale Semiconductor, Inc. 41

Table 3-2. Trace and Profile Options for ColdFire V1 (continued)
Group Options Descriptions
This feature is not supported for theExpert trace mode.
Trace data values Read Data Traces the values of data operandsbeing read from the memory.
This feature is not supported for theProfile-Only and Expert trace modes.
Write Data Traces the values of data operandsbeing written to the memory.
This feature is not supported for theProfile-Only and Expert trace modes.
3.2.3 Configure Kinetis Target
The Kinetis target has different cores and trace modules. For example, Kinetis K serieshas Cortex M4 core and Kinetis L series has Cortex M0+ core.
To configure the launch configuration for the Kinetis Cortex M4 core:
1. In the CodeWarrior Projects view, right-click the project and select Debug As >Debug Configurations from the context menu.
The Debug Configurations dialog box appears.
2. In the Debug Configurations dialog box, expand the CodeWarrior Downloadconfiguration in the tree structure on the left, and select the launch configurationcorresponding to the project you are using. For example, selectTraceProject_RAM_PnE U-MultiLink.
3. On the Main tab page, verify that name of the project, for example, TraceProject isdisplayed in the Project field. If it does not appear, click Browse and locate theproject.
4. If the application is not displayed in the Application field, click Search Project toselect the application image.
Configuring Launcher
CodeWarrior Development Studio for Microcontrollers Version 10.x Profiling and Analysis Tools UsersGuide, Rev. 10.6, 02/2014
42 Freescale Semiconductor, Inc.
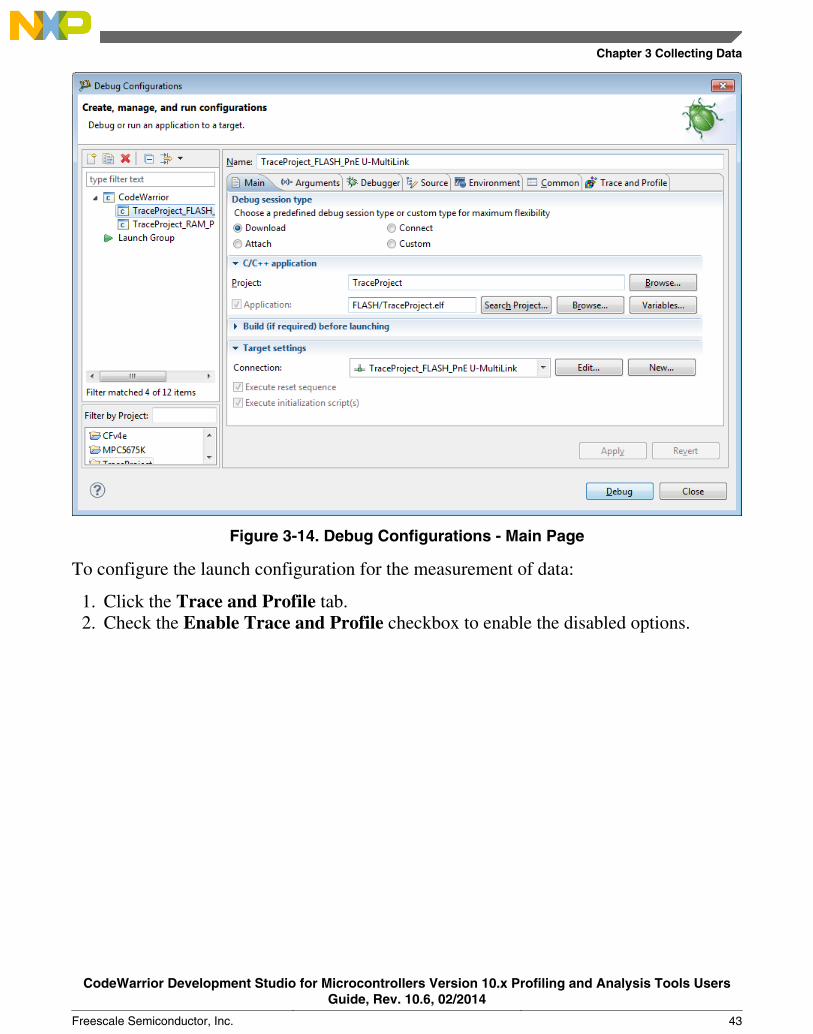
Figure 3-14. Debug Configurations - Main Page
To configure the launch configuration for the measurement of data:
1. Click the Trace and Profile tab.2. Check the Enable Trace and Profile checkbox to enable the disabled options.
Chapter 3 Collecting Data
CodeWarrior Development Studio for Microcontrollers Version 10.x Profiling and Analysis Tools UsersGuide, Rev. 10.6, 02/2014
Freescale Semiconductor, Inc. 43
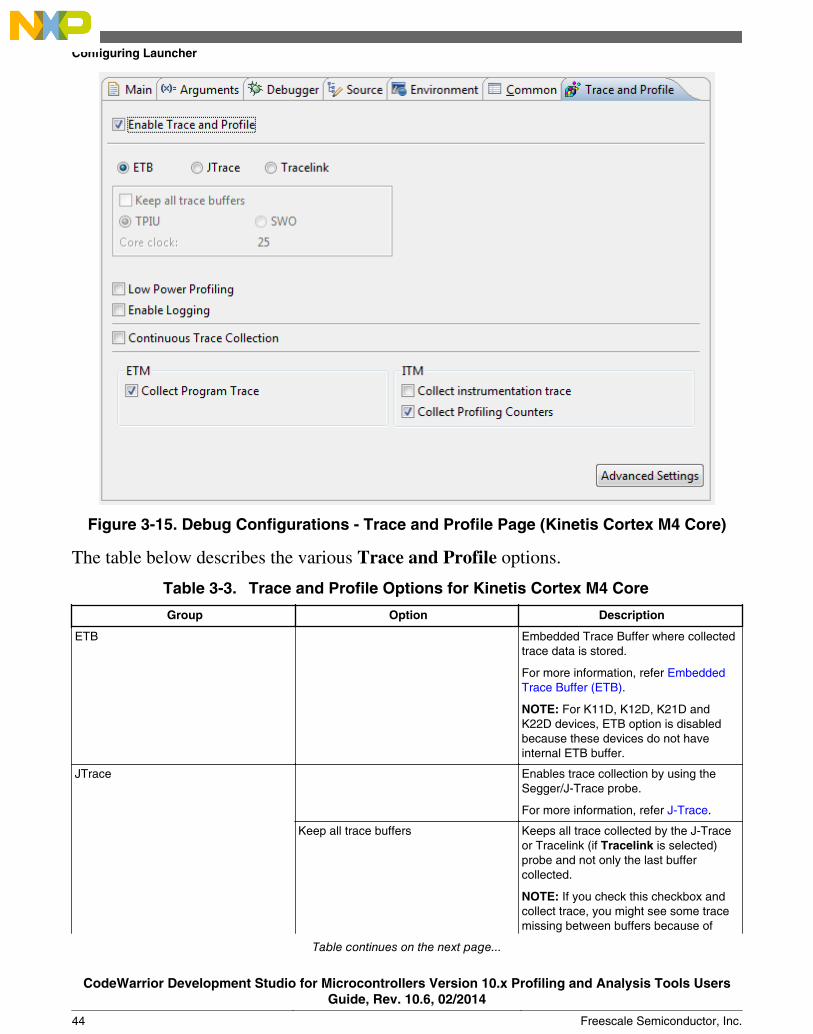
Figure 3-15. Debug Configurations - Trace and Profile Page (Kinetis Cortex M4 Core)
The table below describes the various Trace and Profile options.
Table 3-3. Trace and Profile Options for Kinetis Cortex M4 Core
Group Option Description
ETB Embedded Trace Buffer where collectedtrace data is stored.
For more information, refer EmbeddedTrace Buffer (ETB).
NOTE: For K11D, K12D, K21D andK22D devices, ETB option is disabledbecause these devices do not haveinternal ETB buffer.
JTrace Enables trace collection by using theSegger/J-Trace probe.
For more information, refer J-Trace.
Keep all trace buffers Keeps all trace collected by the J-Traceor Tracelink (if Tracelink is selected)probe and not only the last buffercollected.
NOTE: If you check this checkbox andcollect trace, you might see some tracemissing between buffers because of
Table continues on the next page...
Configuring Launcher
CodeWarrior Development Studio for Microcontrollers Version 10.x Profiling and Analysis Tools UsersGuide, Rev. 10.6, 02/2014
44 Freescale Semiconductor, Inc.
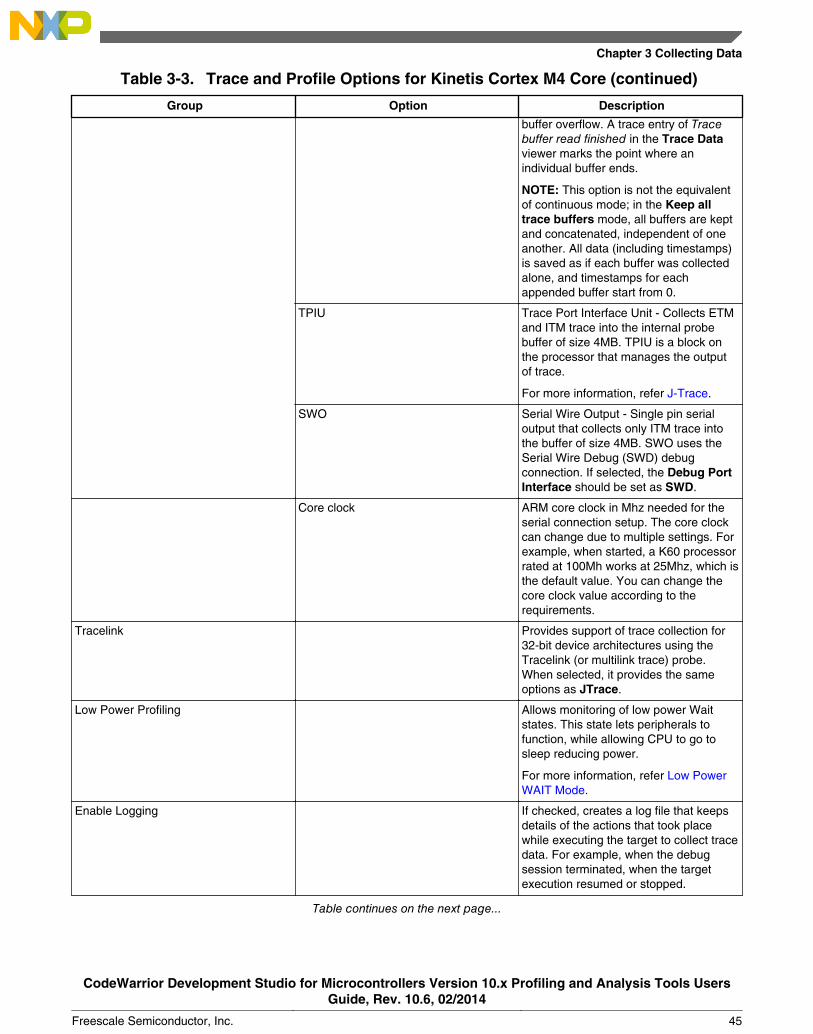
Table 3-3. Trace and Profile Options for Kinetis Cortex M4 Core (continued)
Group Option Description
buffer overflow. A trace entry of Tracebuffer read finished in the Trace Dataviewer marks the point where anindividual buffer ends.
NOTE: This option is not the equivalentof continuous mode; in the Keep alltrace buffers mode, all buffers are keptand concatenated, independent of oneanother. All data (including timestamps)is saved as if each buffer was collectedalone, and timestamps for eachappended buffer start from 0.
TPIU Trace Port Interface Unit - Collects ETMand ITM trace into the internal probebuffer of size 4MB. TPIU is a block onthe processor that manages the outputof trace.
For more information, refer J-Trace.
SWO Serial Wire Output - Single pin serialoutput that collects only ITM trace intothe buffer of size 4MB. SWO uses the Serial Wire Debug (SWD) debugconnection. If selected, the Debug PortInterface should be set as SWD.
Core clock ARM core clock in Mhz needed for theserial connection setup. The core clockcan change due to multiple settings. Forexample, when started, a K60 processorrated at 100Mh works at 25Mhz, which isthe default value. You can change thecore clock value according to therequirements.
Tracelink Provides support of trace collection for32-bit device architectures using theTracelink (or multilink trace) probe.When selected, it provides the sameoptions as JTrace.
Low Power Profiling Allows monitoring of low power Waitstates. This state lets peripherals tofunction, while allowing CPU to go tosleep reducing power.
For more information, refer Low PowerWAIT Mode.
Enable Logging If checked, creates a log file that keepsdetails of the actions that took placewhile executing the target to collect tracedata. For example, when the debugsession terminated, when the targetexecution resumed or stopped.
Table continues on the next page...
Chapter 3 Collecting Data
CodeWarrior Development Studio for Microcontrollers Version 10.x Profiling and Analysis Tools UsersGuide, Rev. 10.6, 02/2014
Freescale Semiconductor, Inc. 45
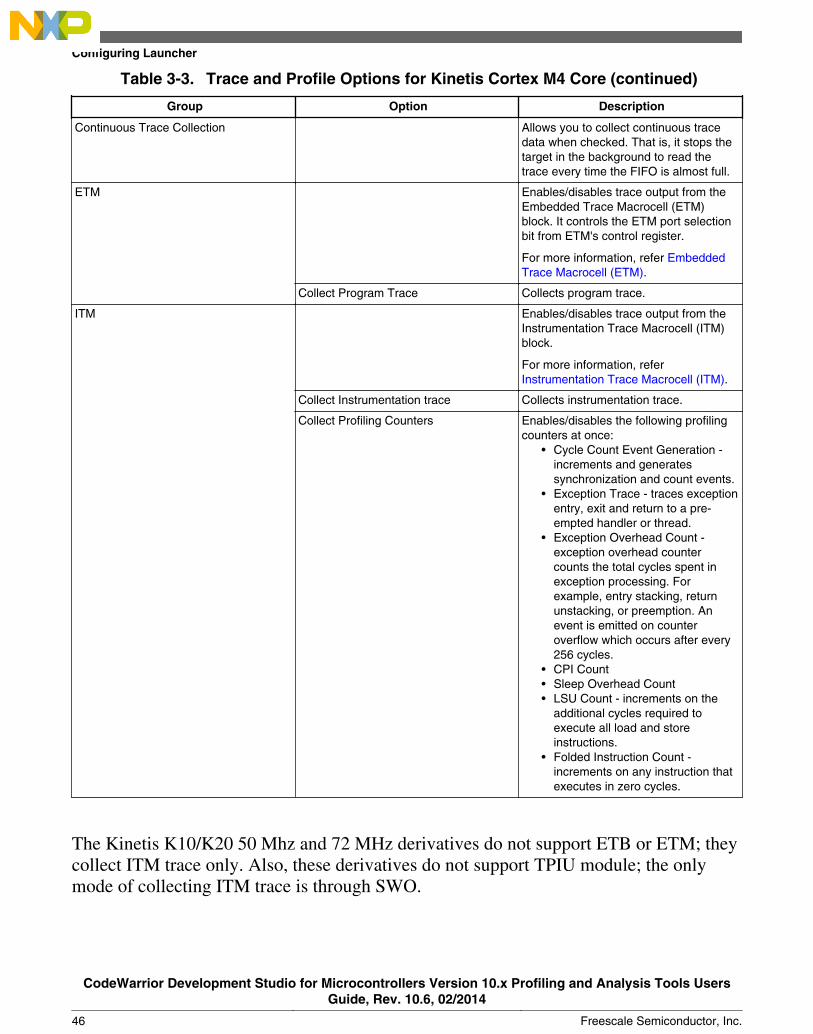
Table 3-3. Trace and Profile Options for Kinetis Cortex M4 Core (continued)
Group Option Description
Continuous Trace Collection Allows you to collect continuous tracedata when checked. That is, it stops thetarget in the background to read thetrace every time the FIFO is almost full.
ETM Enables/disables trace output from the Embedded Trace Macrocell (ETM)block. It controls the ETM port selectionbit from ETM's control register.
For more information, refer EmbeddedTrace Macrocell (ETM).
Collect Program Trace Collects program trace.
ITM Enables/disables trace output from the Instrumentation Trace Macrocell (ITM)block.
For more information, referInstrumentation Trace Macrocell (ITM).
Collect Instrumentation trace Collects instrumentation trace.
Collect Profiling Counters Enables/disables the following profilingcounters at once:
• Cycle Count Event Generation -increments and generatessynchronization and count events.
• Exception Trace - traces exceptionentry, exit and return to a pre-empted handler or thread.
• Exception Overhead Count -exception overhead countercounts the total cycles spent inexception processing. Forexample, entry stacking, returnunstacking, or preemption. Anevent is emitted on counteroverflow which occurs after every256 cycles.
• CPI Count• Sleep Overhead Count• LSU Count - increments on the
additional cycles required toexecute all load and storeinstructions.
• Folded Instruction Count -increments on any instruction thatexecutes in zero cycles.
The Kinetis K10/K20 50 Mhz and 72 MHz derivatives do not support ETB or ETM; theycollect ITM trace only. Also, these derivatives do not support TPIU module; the onlymode of collecting ITM trace is through SWO.
Configuring Launcher
CodeWarrior Development Studio for Microcontrollers Version 10.x Profiling and Analysis Tools UsersGuide, Rev. 10.6, 02/2014
46 Freescale Semiconductor, Inc.

The probes that can collect trace on Kinetis K10/K20 50 Mhz and 72 MHz derivativesare J-Trace and J-link. You can debug but can not collect trace with P&E ARMMultilink. The Trace and Profile tab for these derivatives has only JTrace and ITMoptions enabled.
This topic contains the following sub-topics:• Configuring Kinetis Cortex M0+ Core• Difference Between Kinetis Cores Cortex M4 and Cortex M0+• Trace Collection on Kinetis
3.2.3.1 Configuring Kinetis Cortex M0+ Core
Perform the following steps to configure Kinetis Cortex M0+ core:
1. In the CodeWarrior Projects view, right-click the project and select Debug As >Debug Configurations from the context menu.
The Debug Configurations dialog box appears.
2. In the Debug Configurations dialog box, expand the CodeWarrior Downloadconfiguration in the tree structure on the left, and select the launch configurationcorresponding to the project you are using. For example, selectKl25_test_FLASH_PnE U-MultiLink.
3. Check that the file sa_mtb.c exists in the Sources folder of the CodeWarriorProjects view.
4. Select the Trace and Profile tab.5. Check the Enable Trace and Profile checkbox.6. In the Trace Buffer Size drop-down box, change the value of the trace buffer size to
0x100 for the KL05 device and 0x200 for the KL25 device. There are a variablenumber of predefined sizes depending on the target. The maximum value varies from0x80 on KL05Z to 0x1000 on KL25Z128.
Chapter 3 Collecting Data
CodeWarrior Development Studio for Microcontrollers Version 10.x Profiling and Analysis Tools UsersGuide, Rev. 10.6, 02/2014
Freescale Semiconductor, Inc. 47
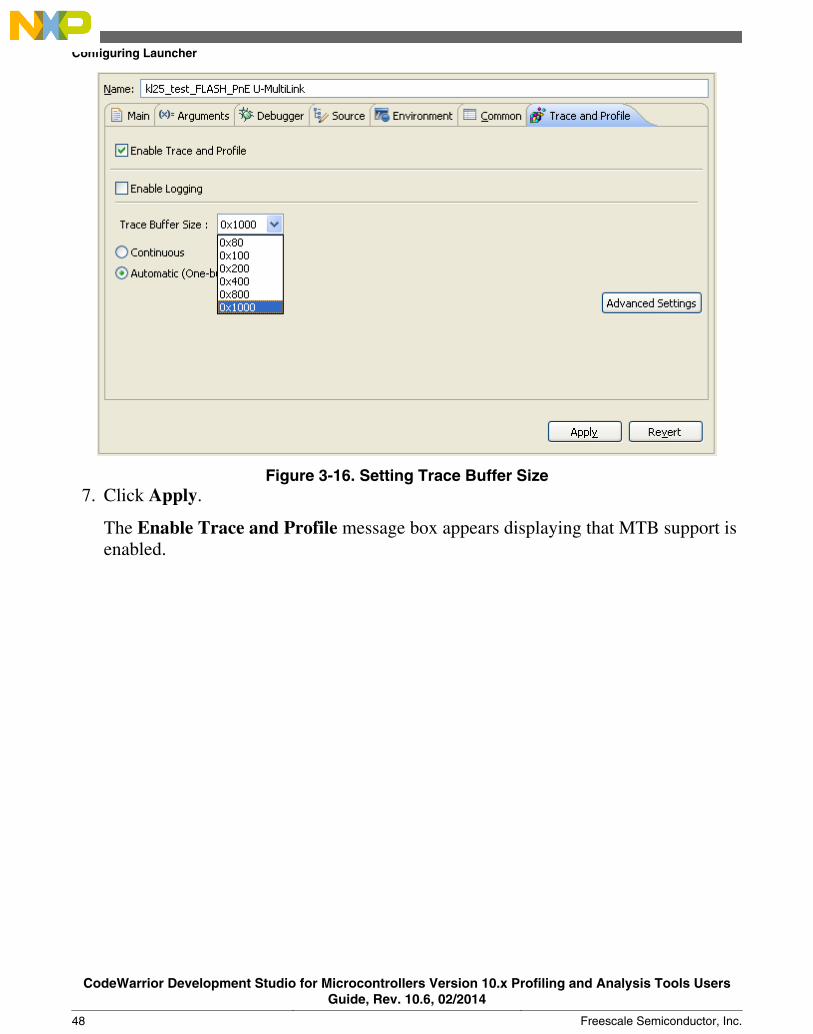
Figure 3-16. Setting Trace Buffer Size7. Click Apply.
The Enable Trace and Profile message box appears displaying that MTB support isenabled.
Configuring Launcher
CodeWarrior Development Studio for Microcontrollers Version 10.x Profiling and Analysis Tools UsersGuide, Rev. 10.6, 02/2014
48 Freescale Semiconductor, Inc.
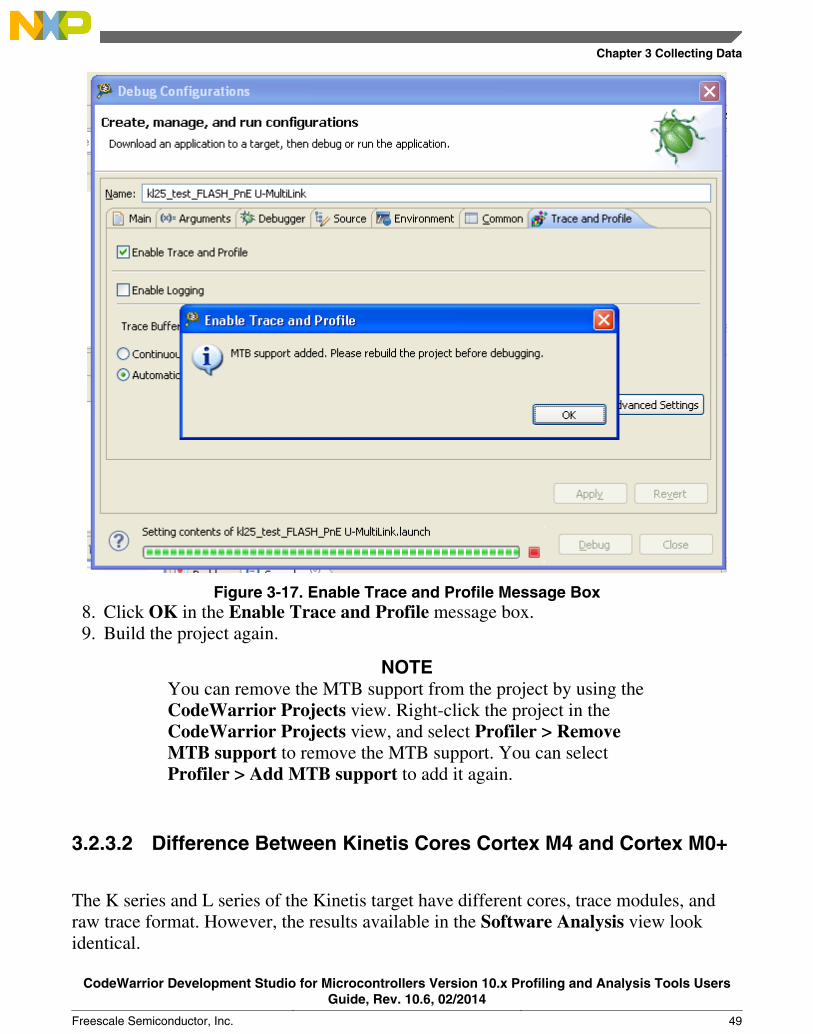
Figure 3-17. Enable Trace and Profile Message Box8. Click OK in the Enable Trace and Profile message box.9. Build the project again.
NOTEYou can remove the MTB support from the project by using theCodeWarrior Projects view. Right-click the project in theCodeWarrior Projects view, and select Profiler > RemoveMTB support to remove the MTB support. You can selectProfiler > Add MTB support to add it again.
3.2.3.2 Difference Between Kinetis Cores Cortex M4 and Cortex M0+
The K series and L series of the Kinetis target have different cores, trace modules, andraw trace format. However, the results available in the Software Analysis view lookidentical.
Chapter 3 Collecting Data
CodeWarrior Development Studio for Microcontrollers Version 10.x Profiling and Analysis Tools UsersGuide, Rev. 10.6, 02/2014
Freescale Semiconductor, Inc. 49
The K series of the Kinetis target has the following features:• Cortex M4 core• ETM and ITM trace with an internal ETB buffer (2Kb) located in RAM• DWT module for trace control/HW Tracepoints with four address comparators and a
large variety of resource counters
The L series of the Kinetis target has the following features:• Cortex M0+ core• Micro Trace Buffer (MTB) trace with an internal buffer, which is configurable up to
32Kb. MTB is located in SRAM. MTB trace is less compressed than ETM tracehaving a ratio of 128 branches for 1Kb of buffer. Like ETM, MTB also supportsautomatic and continuous trace.
• DWT module for trace control/HW Tracepoints with two address comparators andno resource counter.
The differences between Kinetis Cortex M4 core and Cortex M0+ core with respect toETM and MTB are:
• MTB allows you to configure buffer size while ETB size is fixed.• MTB shares the same SRAM memory as program and data, therefore the linker
control file is updated with a new section for MTB so that trace collection does notinterfere with program or data.
• MTB trace is not encoded with relative addresses (as ETM trace is), so it does notrequire SYNC information. Therefore, in the automatic mode, none of the existingtrace will be lost doe to missing SYNC information.
• The K series supports real time trace collection by an external probe due to its TPIUmodule. There are probes with large internal buffers which can collect this externaltrace, for example, Segger J-Trace with 2-16Mb internal buffer; P&E MultilinkTrace with 128 Mb internal buffer. The L series does not support this feature.
3.2.3.3 Trace Collection on Kinetis
Tracing and profiling on the Kinetis target is divided into the following components:
• Embedded Trace Macrocell (ETM)• Instrumentation Trace Macrocell (ITM)• Embedded Trace Buffer (ETB)• J-Trace
3.2.3.3.1 Embedded Trace Macrocell (ETM)
Configuring Launcher
CodeWarrior Development Studio for Microcontrollers Version 10.x Profiling and Analysis Tools UsersGuide, Rev. 10.6, 02/2014
50 Freescale Semiconductor, Inc.
An ETM is a debug component that enables reconstruction of program execution. ETM isa high-speed, low-power debug tool that only supports instruction trace. Therefore, ETMhelps in minimizing area and reducing gate count.
The main features of an ETM are:
• Trace generation
Trace generation outputs information that helps understand the operation of theprocessor. The trace protocol provides a real-time trace capability for processor coresthat are deeply embedded in much larger ASIC designs.
• Triggering and filtering
You can control tracing by specifying the exact set of triggering and filteringresources required for a particular application. Resources include addresscomparators, data value comparators, counters, and sequencers.
ETM compresses the trace information and writes it directly to an on-chip ETB. Anexternal Trace Port Analyzer (TPA) captures the trace information. The trace is read outat low speed using the JTAG interface when the trace capture is complete.
When the trace has been captured, the profiling and analysis tool extracts the informationfrom ETB and decompresses it to provide a full disassembly, with symbols, of the codethat was executed.
3.2.3.3.1.1 Triggering Trace
You can use a trigger signal to specify when a trace run is to occur. You determine thetrigger condition by using the event logic (AND/OR) to configure the event resources,such as address comparators and data value comparators.
The trigger event specifies the conditions that must be met to generate a trigger signal onthe trace port. When the trigger event occurs, the trigger is output as soon as possible, andtherefore might not be aligned with the rest of the trace. The trigger is output over thetrace port using a code that can be readily understood by the Trace Capture Device(TCD).
The TCD uses the trigger in the following ways:
• Trace after
This is often called a start trigger that can indicate to the TCD that the traceinformation must be collected from the trigger point onwards. A start trigger findsout what happens after a particular event, for example, what happens after enteringan interrupt service routine. In addition, a small amount of trace data is collected
Chapter 3 Collecting Data
CodeWarrior Development Studio for Microcontrollers Version 10.x Profiling and Analysis Tools UsersGuide, Rev. 10.6, 02/2014
Freescale Semiconductor, Inc. 51
before the trigger condition. This enables the decompression software to synchronizewith the trace, ensuring that it can successfully decompress the code around thetrigger point.
• Trace before
This is often called a stop trigger which is used to stop collection of the trace. In thiscase, the TCD acts like a large FIFO so that it always contains the most recent traceinformation and the older information overflows out of the trace memory. The triggerindicates that the FIFO must stop, so the memory contains all the trace informationbefore the trigger event. A stop trigger finds out what caused a certain event, forexample, to see what sequence of code was executed before entering an error handlerroutine. In addition, a small amount of trace data is collected after the triggercondition.
• Trace about
This is often called a center trigger which you can set between the start point and thestop point. This allows trace memory to contain a defined number of events beforethe trigger point and a defined number of events after the trigger point.
NOTEThe generation of a trigger does not affect the tracing inany way. In any trace run, only a single trigger can begenerated by ETM.
3.2.3.3.2 Instrumentation Trace Macrocell (ITM)
ITM provides a memory-mapped register interface to allow applications to write logging/event words to the optional external Trace Port Interface Unit (TPIU). ITM is an optionalapplication-driven trace source that supports printf style debugging to trace operatingsystem and application events, and generates diagnostic system information.
ITM also supports control and generation of timestamp information packets. The eventwords and timestamp information are formed into packets and multiplexed with hardwareevent packets from DWT.
NOTEIn order to collect ITM trace, DWT must be enabled. This isbecause sync packet is not sent when ITM is enabled, the DWTcycle counter function must be used to generate the sync packetbefore writing any stimulus registers. This mechanism does noteffect ETM trace in any way.
Configuring Launcher
CodeWarrior Development Studio for Microcontrollers Version 10.x Profiling and Analysis Tools UsersGuide, Rev. 10.6, 02/2014
52 Freescale Semiconductor, Inc.
NOTEIf you collect ITM trace through TPIU (that is not using ETBbuffer), you may lose ITM packets when ITM trace throughputis very high, especially when the executed code includes manybranches with less sequential instructions and there is a lot ofETM trace generating. Since ETM has higher priority than ITMand when the trace generation exceeds the trace port bandwidth,the trace with the smaller priority is lost. To ensure enoughbandwidth for ITM trace, disable ETM and ITM profilingcounters and collect only ITM instrumentation trace withstimulus register 1.
ITM supports Timestamps and Synchronization.
3.2.3.3.2.1 Timestamps
Timestamps provide information on the timing of event generation with respect to theirvisibility at a trace output port. A timestamp packet can be generated and appended to asingle event packet, or a stream of back-to-back packets where multiple events generate apacket stream with no idle time. The timestamp status information is merged with thetimestamp packets to indicate if the timestamp packet transfer is delayed by the FIFO, orif there is a delay in the associated event packet transfer to the output FIFO. Thetimestamp count continues until it can be sampled and delivered in a packet to the FIFO.
The ARMv7 processor can implement either or both of the following types oftimestamps:
• Local timestamps
Local timestamps provide delta timestamp values, which means that each localtimestamp indicates the elapsed time since generating the previous local timestamp.The ITM generates local timestamps from timestamp clock in the ITM block. Eachtime ITM generates a local timestamp packet, it resets this clock to provide the deltafunctionality.
• Global timestamps
Global timestamps provide absolute timestamp values based on a system globaltimestamp clock. They provide synchronization between different trace sources inthe system.
3.2.3.3.2.2 Synchronization
Chapter 3 Collecting Data
CodeWarrior Development Studio for Microcontrollers Version 10.x Profiling and Analysis Tools UsersGuide, Rev. 10.6, 02/2014
Freescale Semiconductor, Inc. 53
Synchronization packets are independent of timestamp packets. They are used to recoverbit to byte alignment information. The packets are required on synchronous TPIU portsthat are dedicated to an ARMv7-M core or in complex systems where multiple tracestreams are formatted into a single output. When enabled, synchronization packets areemitted on a regular basis and can be used as a system heartbeat.
3.2.3.3.3 Embedded Trace Buffer (ETB)
ETB stores data that ETM or ITM or both produces. ETB provides on-chip storage oftrace data using a configurable sized RAM. This reduces the clock rate and removes therequirement of high-speed for collecting trace data. The debugging tools access thebuffered data using a JTAG interface.
ETB contains a trace formatter, an internal input block that embeds the trace source IDwithin the data to create a single trace stream. The trace formatter uses a protocol thatallows trace from several sources to be merged into a single stream and later separated.This protocol outputs data in 16-byte frames.
The ETM and ITM blocks generate trace. The processor dumps the generated trace intoETB, which is a memory buffer from the on-chip memory. The bottleneck here is how totransfer the collected trace data from the chip's memory to the computer. This is whereprobes are useful which implement a protocol that allows communication between thechip and the computer. These probes have the ability to read registers and chip's memory.
ETB stores only 2KB of trace data and it transfers data at a very slow speed. Analternative to ETB is to output the trace data to a port instead of storing it in the chip'smemory. There is a block on the processor that manages the output of trace called TracePort Interface Unit (TPIU). If the trace is output to an external port, it must be stored inreal-time, and therefore, a probe is necessary.
3.2.3.3.4 J-Trace
The J-Trace probe has an internal memory buffer of 4MB where it can store trace data. Itsupports two modes of trace collection, TPIU (or Rawtrace) and Serial Wire Output(SWO), depending on the configuration of the processor. TPIU can output complex trace,that is both ETM and ITM. SWO is a lightweight standard and can only output ITMtrace. The benefits of using J-Trace probe is the bigger memory size and the bettercollection speed. The drawback is that you cannot collect continuous trace, only the last4MB of trace is stored.
To collect trace data on the Kinetis target using the JTrace connection:
Configuring Launcher
CodeWarrior Development Studio for Microcontrollers Version 10.x Profiling and Analysis Tools UsersGuide, Rev. 10.6, 02/2014
54 Freescale Semiconductor, Inc.
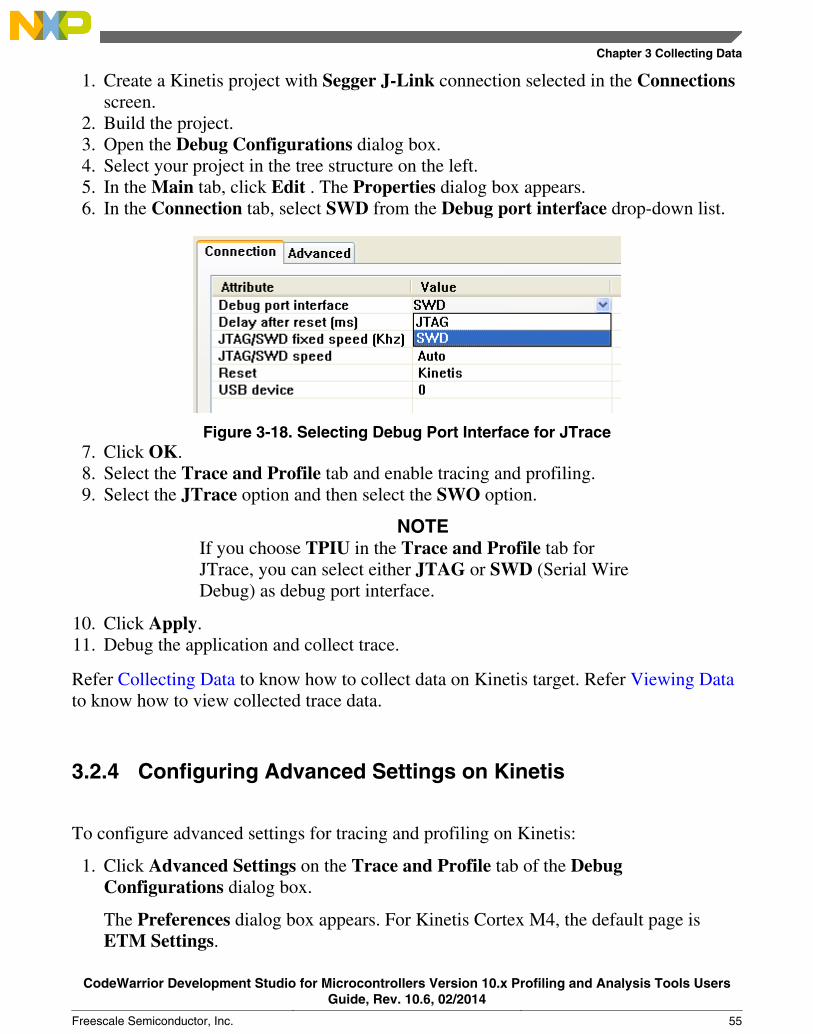
1. Create a Kinetis project with Segger J-Link connection selected in the Connectionsscreen.
2. Build the project.3. Open the Debug Configurations dialog box.4. Select your project in the tree structure on the left.5. In the Main tab, click Edit . The Properties dialog box appears.6. In the Connection tab, select SWD from the Debug port interface drop-down list.
Figure 3-18. Selecting Debug Port Interface for JTrace7. Click OK.8. Select the Trace and Profile tab and enable tracing and profiling.9. Select the JTrace option and then select the SWO option.
NOTEIf you choose TPIU in the Trace and Profile tab forJTrace, you can select either JTAG or SWD (Serial WireDebug) as debug port interface.
10. Click Apply.11. Debug the application and collect trace.
Refer Collecting Data to know how to collect data on Kinetis target. Refer Viewing Datato know how to view collected trace data.
3.2.4 Configuring Advanced Settings on Kinetis
To configure advanced settings for tracing and profiling on Kinetis:
1. Click Advanced Settings on the Trace and Profile tab of the DebugConfigurations dialog box.
The Preferences dialog box appears. For Kinetis Cortex M4, the default page isETM Settings.
Chapter 3 Collecting Data
CodeWarrior Development Studio for Microcontrollers Version 10.x Profiling and Analysis Tools UsersGuide, Rev. 10.6, 02/2014
Freescale Semiconductor, Inc. 55

NOTEUse the Advanced Settings button if you want to configureadvanced settings for collecting trace.
NOTEIf you are configuring Kinetis Cortex M4 project, thePreferences dialog box displays ETM, ITM, and ETB tracesettings since Kinetis Cortex M4 supports ETM and ITMtrace. Kinetis Cortex M0+ supports MTB trace, therefore,the Preferences dialog box for a Kinetis Cortex M0+project displays MTB trace settings only.
2. If you are configuring settings for Kinetis Cortex M4, ensure that the Enable ETMTracing checkbox is checked.
Configuring Launcher
CodeWarrior Development Studio for Microcontrollers Version 10.x Profiling and Analysis Tools UsersGuide, Rev. 10.6, 02/2014
56 Freescale Semiconductor, Inc.
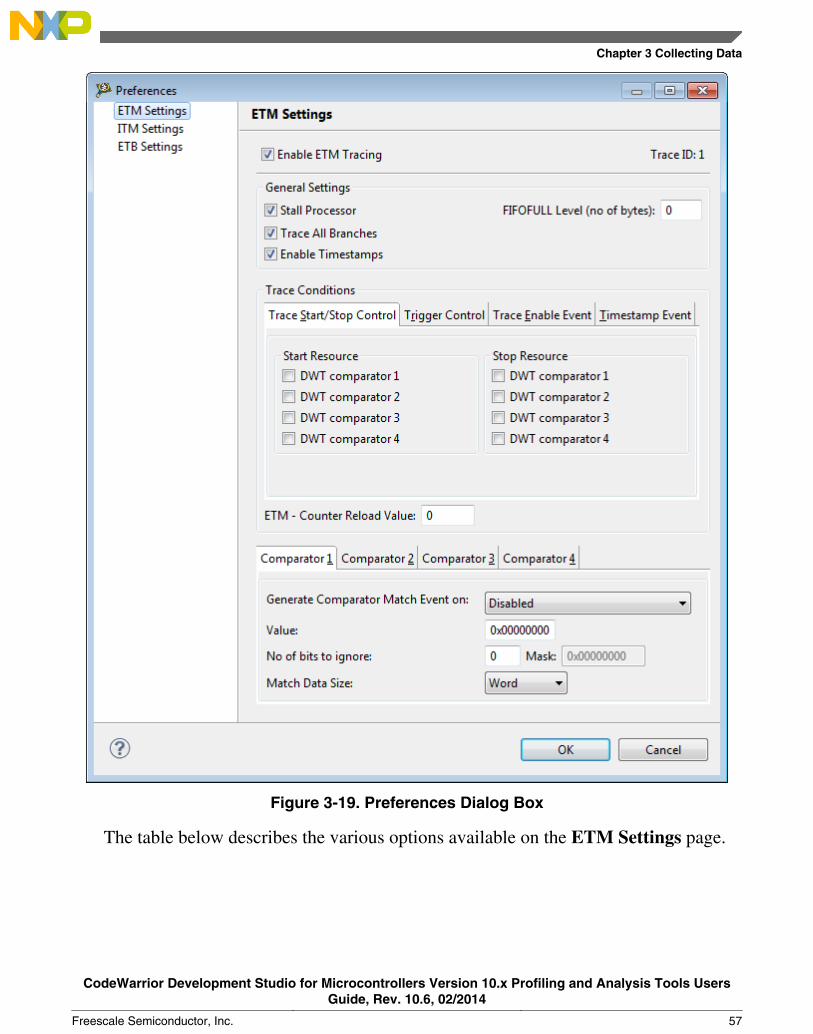
Figure 3-19. Preferences Dialog Box
The table below describes the various options available on the ETM Settings page.
Chapter 3 Collecting Data
CodeWarrior Development Studio for Microcontrollers Version 10.x Profiling and Analysis Tools UsersGuide, Rev. 10.6, 02/2014
Freescale Semiconductor, Inc. 57
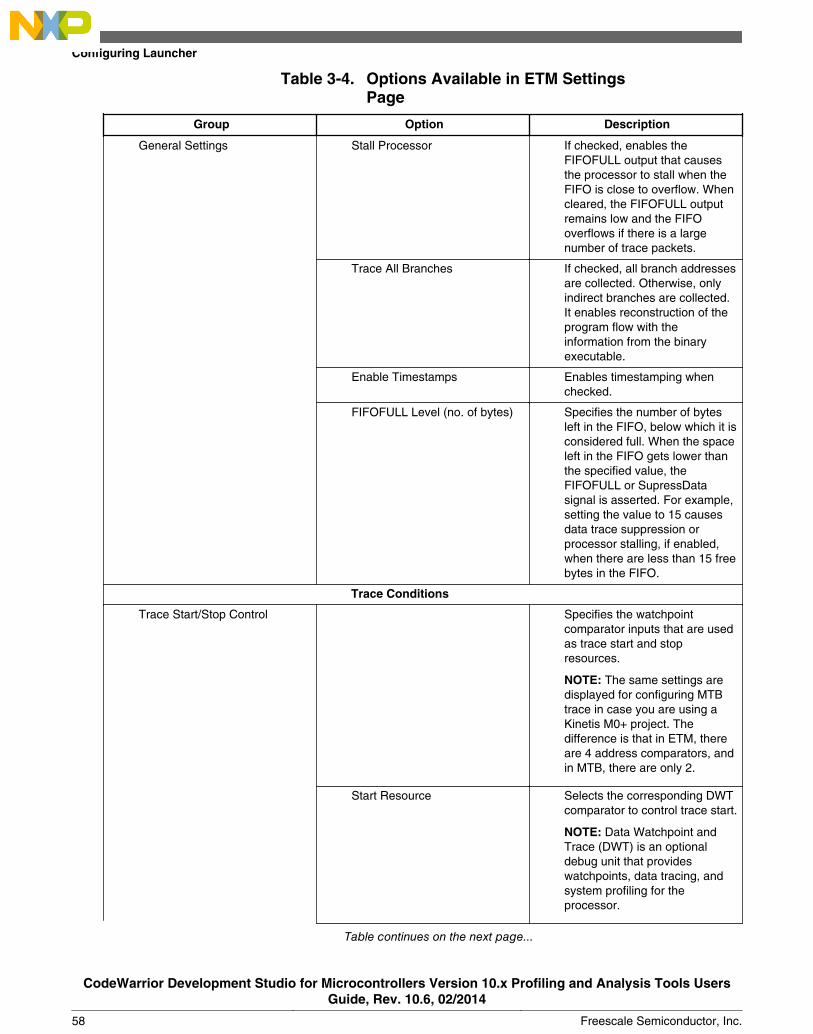
Table 3-4. Options Available in ETM SettingsPage
Group Option Description
General Settings Stall Processor If checked, enables theFIFOFULL output that causesthe processor to stall when theFIFO is close to overflow. Whencleared, the FIFOFULL outputremains low and the FIFOoverflows if there is a largenumber of trace packets.
Trace All Branches If checked, all branch addressesare collected. Otherwise, onlyindirect branches are collected.It enables reconstruction of theprogram flow with theinformation from the binaryexecutable.
Enable Timestamps Enables timestamping whenchecked.
FIFOFULL Level (no. of bytes) Specifies the number of bytesleft in the FIFO, below which it isconsidered full. When the spaceleft in the FIFO gets lower thanthe specified value, theFIFOFULL or SupressDatasignal is asserted. For example,setting the value to 15 causesdata trace suppression orprocessor stalling, if enabled,when there are less than 15 freebytes in the FIFO.
Trace Conditions
Trace Start/Stop Control Specifies the watchpointcomparator inputs that are usedas trace start and stopresources.
NOTE: The same settings aredisplayed for configuring MTBtrace in case you are using aKinetis M0+ project. Thedifference is that in ETM, thereare 4 address comparators, andin MTB, there are only 2.
Start Resource Selects the corresponding DWTcomparator to control trace start.
NOTE: Data Watchpoint andTrace (DWT) is an optionaldebug unit that provideswatchpoints, data tracing, andsystem profiling for theprocessor.
Table continues on the next page...
Configuring Launcher
CodeWarrior Development Studio for Microcontrollers Version 10.x Profiling and Analysis Tools UsersGuide, Rev. 10.6, 02/2014
58 Freescale Semiconductor, Inc.
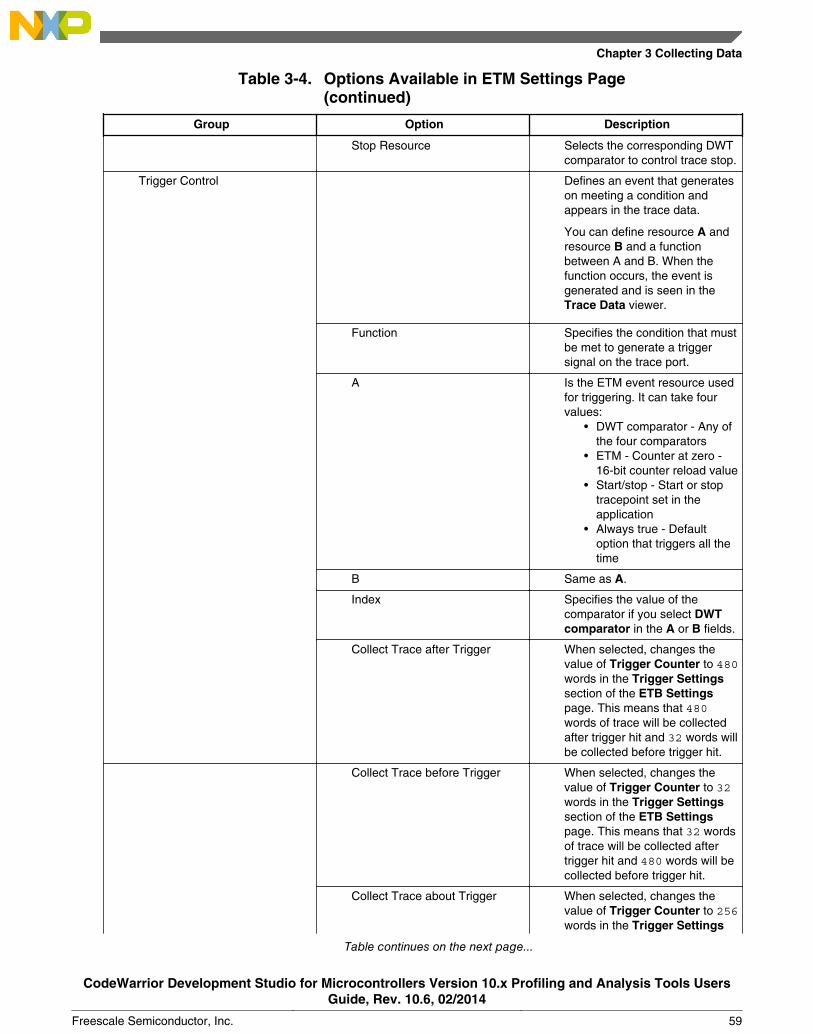
Table 3-4. Options Available in ETM Settings Page(continued)
Group Option Description
Stop Resource Selects the corresponding DWTcomparator to control trace stop.
Trigger Control Defines an event that generateson meeting a condition andappears in the trace data.
You can define resource A andresource B and a functionbetween A and B. When thefunction occurs, the event isgenerated and is seen in theTrace Data viewer.
Function Specifies the condition that mustbe met to generate a triggersignal on the trace port.
A Is the ETM event resource usedfor triggering. It can take fourvalues:
• DWT comparator - Any ofthe four comparators
• ETM - Counter at zero -16-bit counter reload value
• Start/stop - Start or stoptracepoint set in theapplication
• Always true - Defaultoption that triggers all thetime
B Same as A.
Index Specifies the value of thecomparator if you select DWTcomparator in the A or B fields.
Collect Trace after Trigger When selected, changes thevalue of Trigger Counter to 480words in the Trigger Settingssection of the ETB Settingspage. This means that 480words of trace will be collectedafter trigger hit and 32 words willbe collected before trigger hit.
Collect Trace before Trigger When selected, changes thevalue of Trigger Counter to 32words in the Trigger Settingssection of the ETB Settingspage. This means that 32 wordsof trace will be collected aftertrigger hit and 480 words will becollected before trigger hit.
Collect Trace about Trigger When selected, changes thevalue of Trigger Counter to 256words in the Trigger Settings
Table continues on the next page...
Chapter 3 Collecting Data
CodeWarrior Development Studio for Microcontrollers Version 10.x Profiling and Analysis Tools UsersGuide, Rev. 10.6, 02/2014
Freescale Semiconductor, Inc. 59
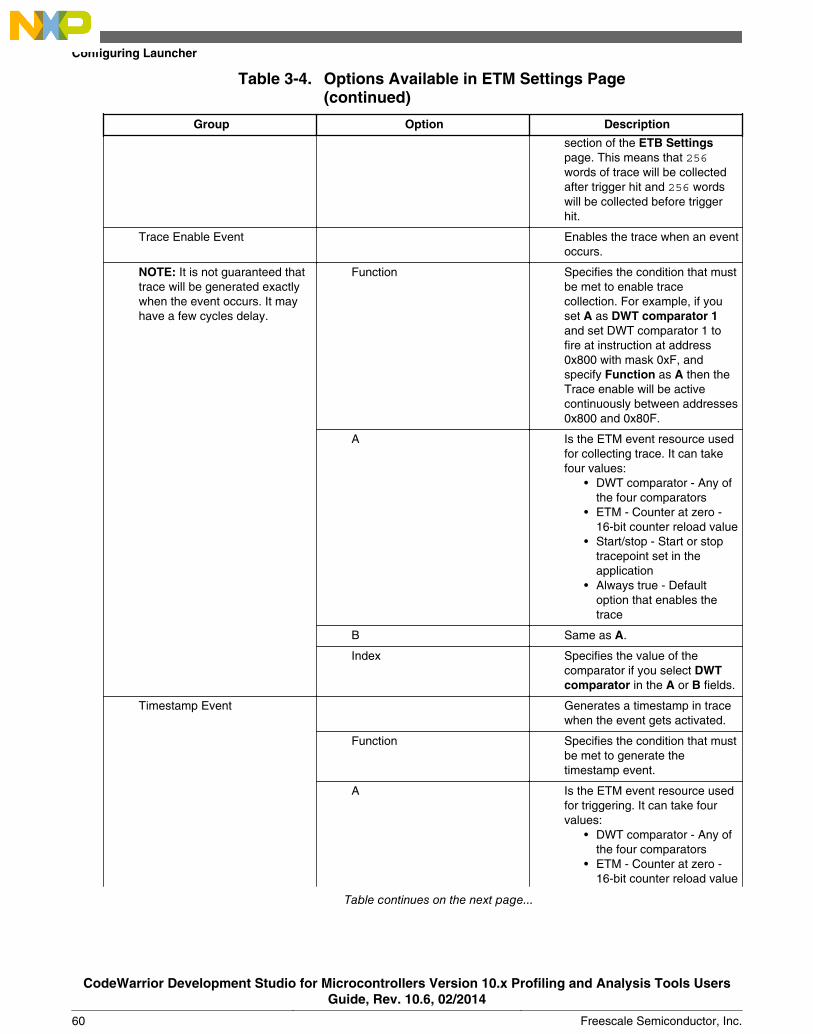
Table 3-4. Options Available in ETM Settings Page(continued)
Group Option Description
section of the ETB Settingspage. This means that 256words of trace will be collectedafter trigger hit and 256 wordswill be collected before triggerhit.
Trace Enable Event Enables the trace when an eventoccurs.
NOTE: It is not guaranteed thattrace will be generated exactlywhen the event occurs. It mayhave a few cycles delay.
Function Specifies the condition that mustbe met to enable tracecollection. For example, if youset A as DWT comparator 1and set DWT comparator 1 tofire at instruction at address0x800 with mask 0xF, andspecify Function as A then theTrace enable will be activecontinuously between addresses0x800 and 0x80F.
A Is the ETM event resource usedfor collecting trace. It can takefour values:
• DWT comparator - Any ofthe four comparators
• ETM - Counter at zero -16-bit counter reload value
• Start/stop - Start or stoptracepoint set in theapplication
• Always true - Defaultoption that enables thetrace
B Same as A.
Index Specifies the value of thecomparator if you select DWTcomparator in the A or B fields.
Timestamp Event Generates a timestamp in tracewhen the event gets activated.
Function Specifies the condition that mustbe met to generate thetimestamp event.
A Is the ETM event resource usedfor triggering. It can take fourvalues:
• DWT comparator - Any ofthe four comparators
• ETM - Counter at zero -16-bit counter reload value
Table continues on the next page...
Configuring Launcher
CodeWarrior Development Studio for Microcontrollers Version 10.x Profiling and Analysis Tools UsersGuide, Rev. 10.6, 02/2014
60 Freescale Semiconductor, Inc.
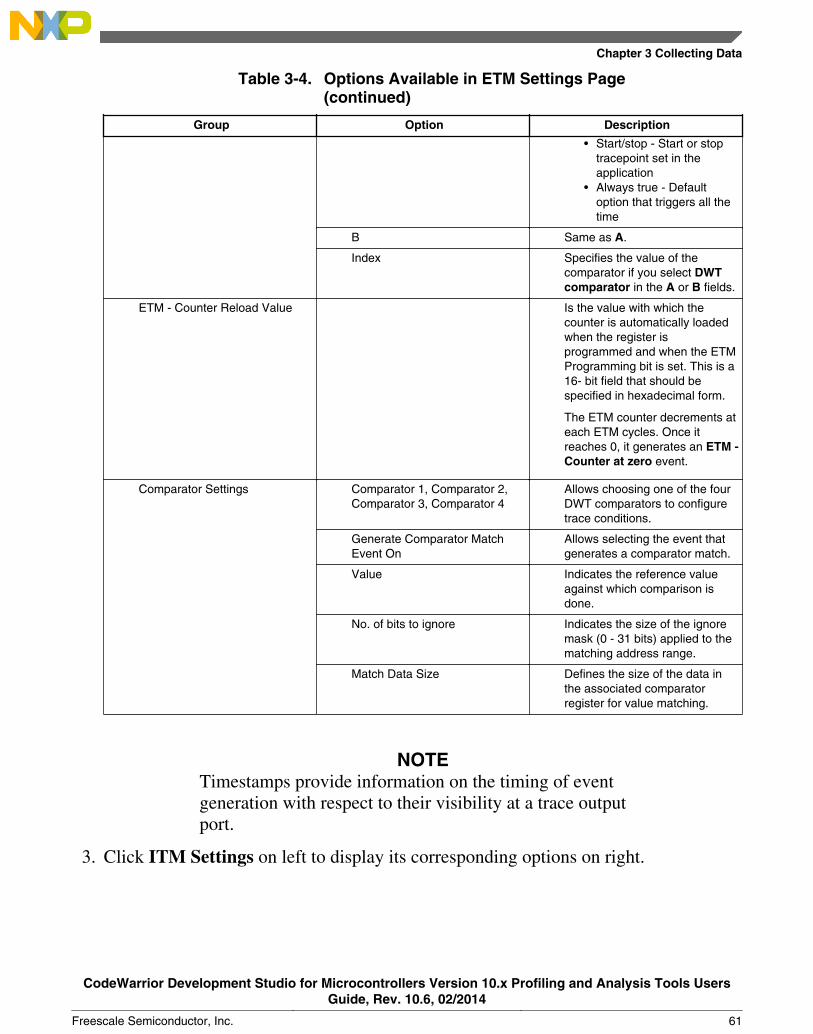
Table 3-4. Options Available in ETM Settings Page(continued)
Group Option Description
• Start/stop - Start or stoptracepoint set in theapplication
• Always true - Defaultoption that triggers all thetime
B Same as A.
Index Specifies the value of thecomparator if you select DWTcomparator in the A or B fields.
ETM - Counter Reload Value Is the value with which thecounter is automatically loadedwhen the register isprogrammed and when the ETMProgramming bit is set. This is a16- bit field that should bespecified in hexadecimal form.
The ETM counter decrements ateach ETM cycles. Once itreaches 0, it generates an ETM -Counter at zero event.
Comparator Settings Comparator 1, Comparator 2,Comparator 3, Comparator 4
Allows choosing one of the fourDWT comparators to configuretrace conditions.
Generate Comparator MatchEvent On
Allows selecting the event thatgenerates a comparator match.
Value Indicates the reference valueagainst which comparison isdone.
No. of bits to ignore Indicates the size of the ignoremask (0 - 31 bits) applied to thematching address range.
Match Data Size Defines the size of the data inthe associated comparatorregister for value matching.
NOTETimestamps provide information on the timing of eventgeneration with respect to their visibility at a trace outputport.
3. Click ITM Settings on left to display its corresponding options on right.
Chapter 3 Collecting Data
CodeWarrior Development Studio for Microcontrollers Version 10.x Profiling and Analysis Tools UsersGuide, Rev. 10.6, 02/2014
Freescale Semiconductor, Inc. 61
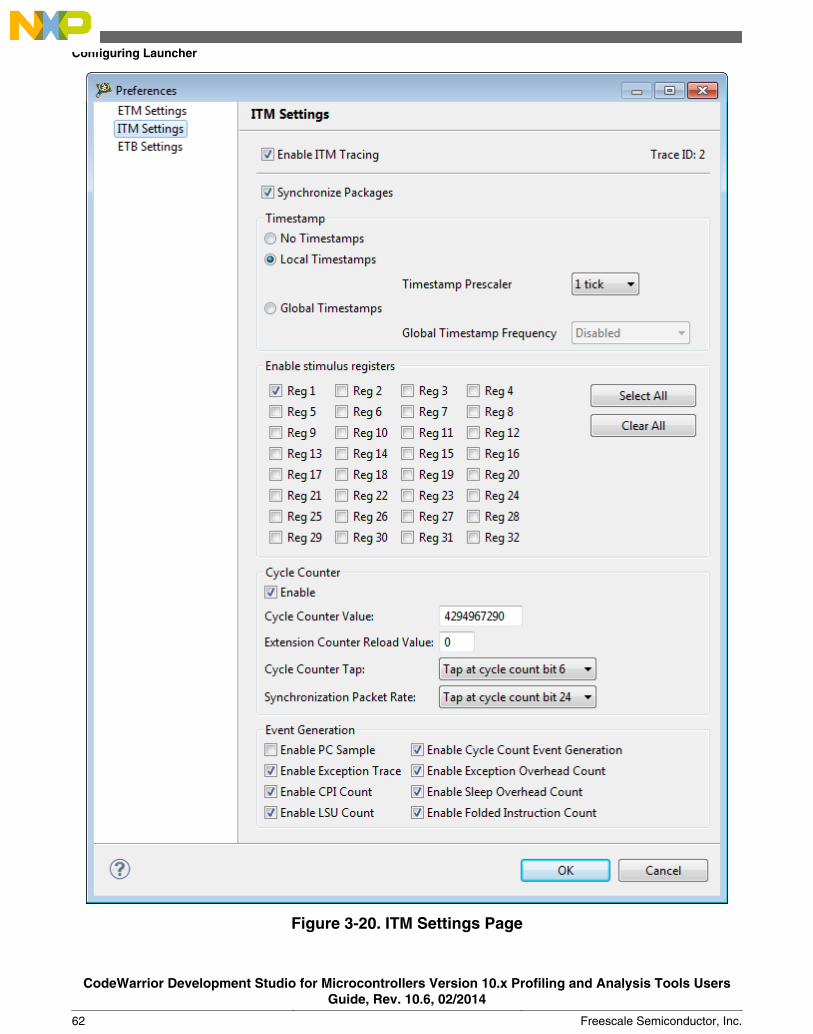
Figure 3-20. ITM Settings Page
Configuring Launcher
CodeWarrior Development Studio for Microcontrollers Version 10.x Profiling and Analysis Tools UsersGuide, Rev. 10.6, 02/2014
62 Freescale Semiconductor, Inc.
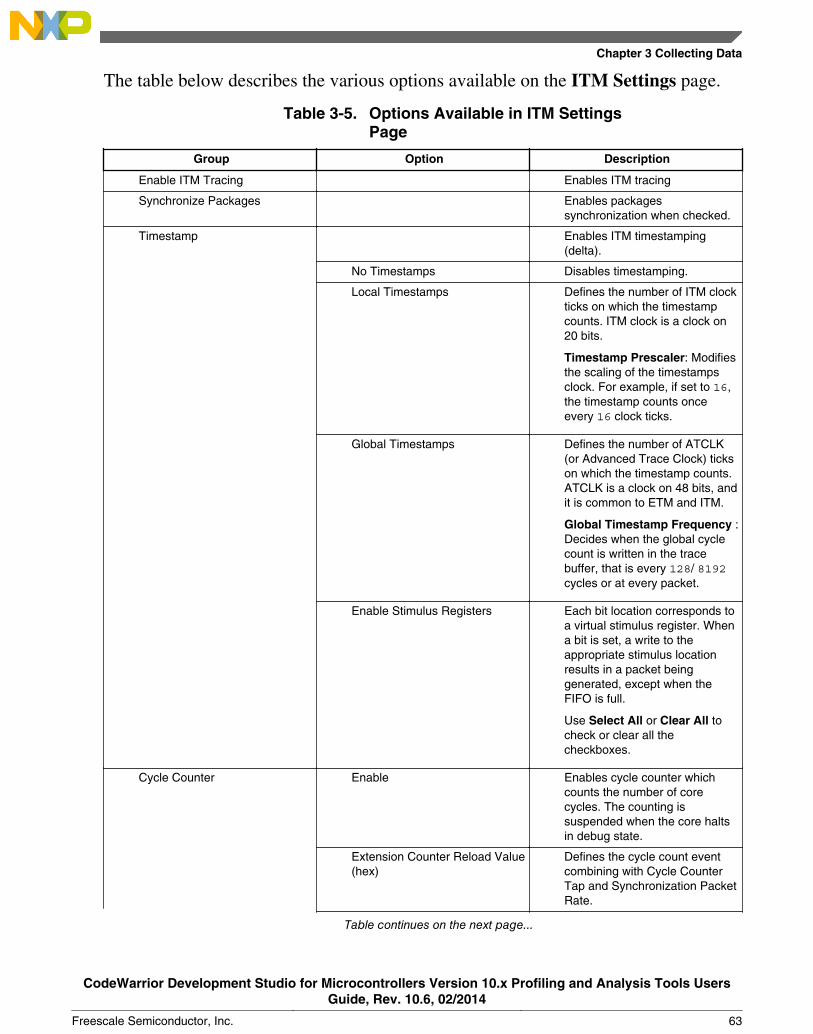
The table below describes the various options available on the ITM Settings page.
Table 3-5. Options Available in ITM SettingsPage
Group Option Description
Enable ITM Tracing Enables ITM tracing
Synchronize Packages Enables packagessynchronization when checked.
Timestamp Enables ITM timestamping(delta).
No Timestamps Disables timestamping.
Local Timestamps Defines the number of ITM clockticks on which the timestampcounts. ITM clock is a clock on20 bits.
Timestamp Prescaler: Modifiesthe scaling of the timestampsclock. For example, if set to 16,the timestamp counts onceevery 16 clock ticks.
Global Timestamps Defines the number of ATCLK(or Advanced Trace Clock) tickson which the timestamp counts.ATCLK is a clock on 48 bits, andit is common to ETM and ITM.
Global Timestamp Frequency :Decides when the global cyclecount is written in the tracebuffer, that is every 128/ 8192cycles or at every packet.
Enable Stimulus Registers Each bit location corresponds toa virtual stimulus register. Whena bit is set, a write to theappropriate stimulus locationresults in a packet beinggenerated, except when theFIFO is full.
Use Select All or Clear All tocheck or clear all thecheckboxes.
Cycle Counter Enable Enables cycle counter whichcounts the number of corecycles. The counting issuspended when the core haltsin debug state.
Extension Counter Reload Value(hex)
Defines the cycle count eventcombining with Cycle CounterTap and Synchronization PacketRate.
Table continues on the next page...
Chapter 3 Collecting Data
CodeWarrior Development Studio for Microcontrollers Version 10.x Profiling and Analysis Tools UsersGuide, Rev. 10.6, 02/2014
Freescale Semiconductor, Inc. 63
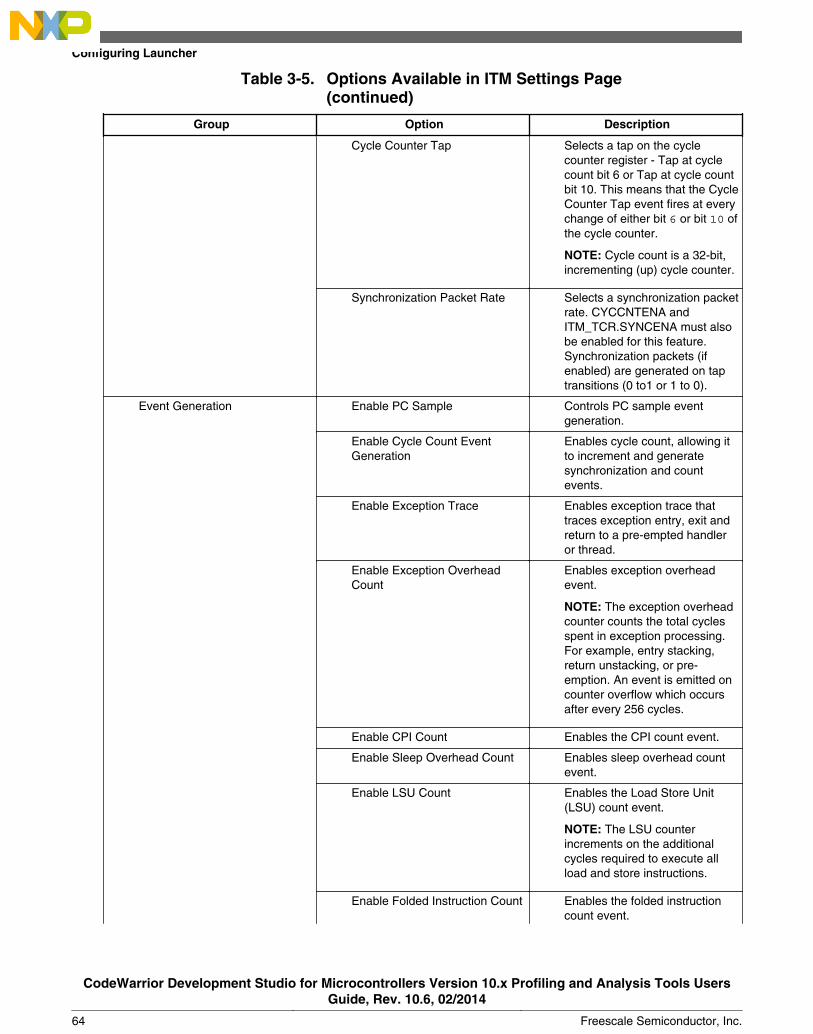
Table 3-5. Options Available in ITM Settings Page(continued)
Group Option Description
Cycle Counter Tap Selects a tap on the cyclecounter register - Tap at cyclecount bit 6 or Tap at cycle countbit 10. This means that the CycleCounter Tap event fires at everychange of either bit 6 or bit 10 ofthe cycle counter.
NOTE: Cycle count is a 32-bit,incrementing (up) cycle counter.
Synchronization Packet Rate Selects a synchronization packetrate. CYCCNTENA andITM_TCR.SYNCENA must alsobe enabled for this feature.Synchronization packets (ifenabled) are generated on taptransitions (0 to1 or 1 to 0).
Event Generation Enable PC Sample Controls PC sample eventgeneration.
Enable Cycle Count EventGeneration
Enables cycle count, allowing itto increment and generatesynchronization and countevents.
Enable Exception Trace Enables exception trace thattraces exception entry, exit andreturn to a pre-empted handleror thread.
Enable Exception OverheadCount
Enables exception overheadevent.
NOTE: The exception overheadcounter counts the total cyclesspent in exception processing.For example, entry stacking,return unstacking, or pre-emption. An event is emitted oncounter overflow which occursafter every 256 cycles.
Enable CPI Count Enables the CPI count event.
Enable Sleep Overhead Count Enables sleep overhead countevent.
Enable LSU Count Enables the Load Store Unit(LSU) count event.
NOTE: The LSU counterincrements on the additionalcycles required to execute allload and store instructions.
Enable Folded Instruction Count Enables the folded instructioncount event.
Configuring Launcher
CodeWarrior Development Studio for Microcontrollers Version 10.x Profiling and Analysis Tools UsersGuide, Rev. 10.6, 02/2014
64 Freescale Semiconductor, Inc.
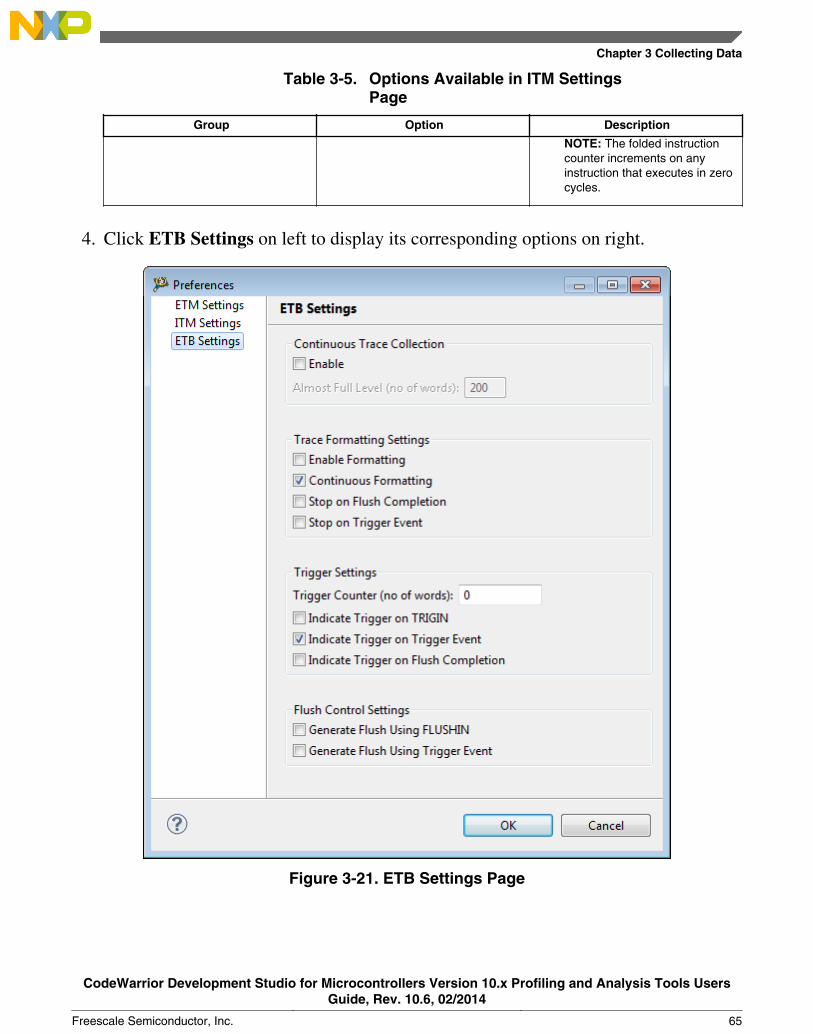
Table 3-5. Options Available in ITM SettingsPage
Group Option Description
NOTE: The folded instructioncounter increments on anyinstruction that executes in zerocycles.
4. Click ETB Settings on left to display its corresponding options on right.
Figure 3-21. ETB Settings Page
Chapter 3 Collecting Data
CodeWarrior Development Studio for Microcontrollers Version 10.x Profiling and Analysis Tools UsersGuide, Rev. 10.6, 02/2014
Freescale Semiconductor, Inc. 65
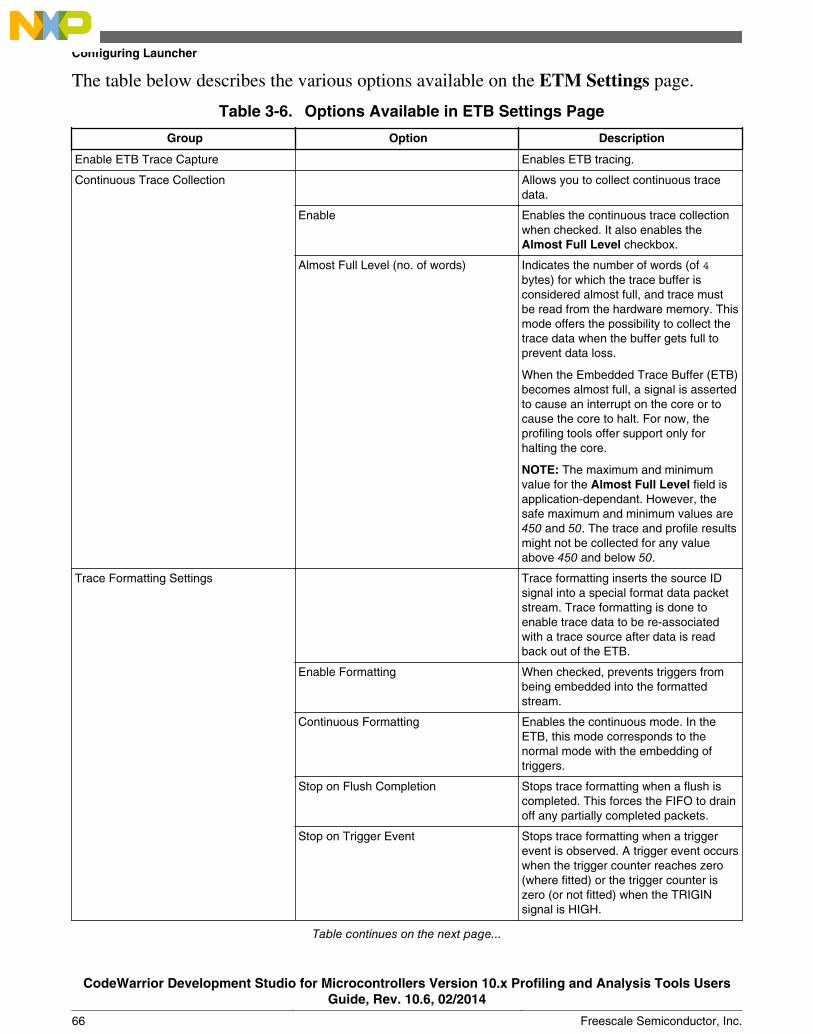
The table below describes the various options available on the ETM Settings page.
Table 3-6. Options Available in ETB Settings Page
Group Option Description
Enable ETB Trace Capture Enables ETB tracing.
Continuous Trace Collection Allows you to collect continuous tracedata.
Enable Enables the continuous trace collectionwhen checked. It also enables theAlmost Full Level checkbox.
Almost Full Level (no. of words) Indicates the number of words (of 4bytes) for which the trace buffer isconsidered almost full, and trace mustbe read from the hardware memory. Thismode offers the possibility to collect thetrace data when the buffer gets full toprevent data loss.
When the Embedded Trace Buffer (ETB)becomes almost full, a signal is assertedto cause an interrupt on the core or tocause the core to halt. For now, theprofiling tools offer support only forhalting the core.
NOTE: The maximum and minimumvalue for the Almost Full Level field isapplication-dependant. However, thesafe maximum and minimum values are450 and 50. The trace and profile resultsmight not be collected for any valueabove 450 and below 50.
Trace Formatting Settings Trace formatting inserts the source IDsignal into a special format data packetstream. Trace formatting is done toenable trace data to be re-associatedwith a trace source after data is readback out of the ETB.
Enable Formatting When checked, prevents triggers frombeing embedded into the formattedstream.
Continuous Formatting Enables the continuous mode. In theETB, this mode corresponds to thenormal mode with the embedding oftriggers.
Stop on Flush Completion Stops trace formatting when a flush iscompleted. This forces the FIFO to drainoff any partially completed packets.
Stop on Trigger Event Stops trace formatting when a triggerevent is observed. A trigger event occurswhen the trigger counter reaches zero(where fitted) or the trigger counter iszero (or not fitted) when the TRIGINsignal is HIGH.
Table continues on the next page...
Configuring Launcher
CodeWarrior Development Studio for Microcontrollers Version 10.x Profiling and Analysis Tools UsersGuide, Rev. 10.6, 02/2014
66 Freescale Semiconductor, Inc.
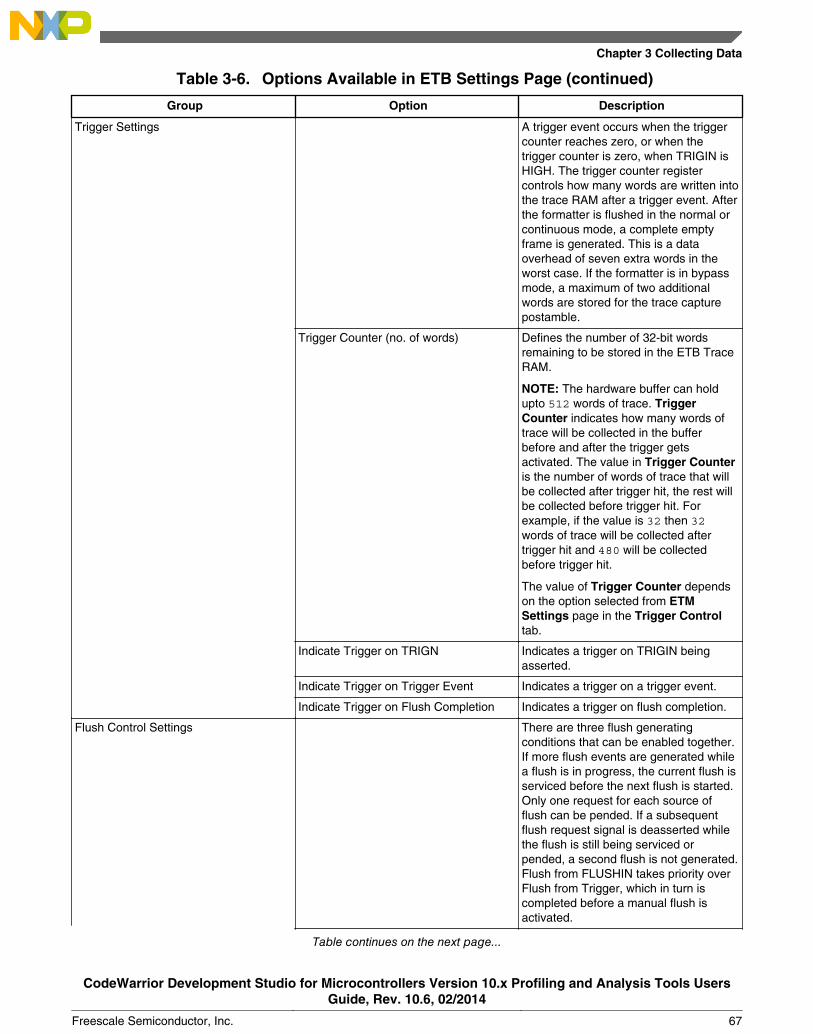
Table 3-6. Options Available in ETB Settings Page (continued)
Group Option Description
Trigger Settings A trigger event occurs when the triggercounter reaches zero, or when thetrigger counter is zero, when TRIGIN isHIGH. The trigger counter registercontrols how many words are written intothe trace RAM after a trigger event. Afterthe formatter is flushed in the normal orcontinuous mode, a complete emptyframe is generated. This is a dataoverhead of seven extra words in theworst case. If the formatter is in bypassmode, a maximum of two additionalwords are stored for the trace capturepostamble.
Trigger Counter (no. of words) Defines the number of 32-bit wordsremaining to be stored in the ETB TraceRAM.
NOTE: The hardware buffer can holdupto 512 words of trace. TriggerCounter indicates how many words oftrace will be collected in the bufferbefore and after the trigger getsactivated. The value in Trigger Counteris the number of words of trace that willbe collected after trigger hit, the rest willbe collected before trigger hit. Forexample, if the value is 32 then 32words of trace will be collected aftertrigger hit and 480 will be collectedbefore trigger hit.
The value of Trigger Counter dependson the option selected from ETMSettings page in the Trigger Controltab.
Indicate Trigger on TRIGN Indicates a trigger on TRIGIN beingasserted.
Indicate Trigger on Trigger Event Indicates a trigger on a trigger event.
Indicate Trigger on Flush Completion Indicates a trigger on flush completion.
Flush Control Settings There are three flush generatingconditions that can be enabled together.If more flush events are generated whilea flush is in progress, the current flush isserviced before the next flush is started.Only one request for each source offlush can be pended. If a subsequentflush request signal is deasserted whilethe flush is still being serviced orpended, a second flush is not generated.Flush from FLUSHIN takes priority overFlush from Trigger, which in turn iscompleted before a manual flush isactivated.
Table continues on the next page...
Chapter 3 Collecting Data
CodeWarrior Development Studio for Microcontrollers Version 10.x Profiling and Analysis Tools UsersGuide, Rev. 10.6, 02/2014
Freescale Semiconductor, Inc. 67
Table 3-6. Options Available in ETB Settings Page (continued)
Group Option Description
Generate Flush Using FLUSHIN Generates flush using the FLUSHINinterface.
Generate Flush Using Trigger Event Generates flush using the trigger event.
3.2.5 Configure MPC56xx Target
To configure the launch configuration for the MPC56xx target:
1. In the CodeWarrior Projects view, right-click the project and select Debug As >Debug Configurations from the context menu.
The Debug Configurations dialog box appears.
2. In the Debug Configurations dialog box, expand the CodeWarrior Downloadconfiguration in the tree structure on the left, and select the launch configurationcorresponding to the project you are using. For example, selectMPC5675K_RAM_PnE USB-ML-PPCNEXUS.
To configure the launch configuration for the measurement of data:
1. Click the Trace and Profile tab.2. Check the Enable Trace and Profile checkbox.
This configures the launch configuration for the MPC56xx target.
NOTETracing is not supported for MPC56xx processors with z0 coreas these processors do not have a trace buffer.
3.2.6 Configure S12Z Target
To configure the launch configuration for the S12Z target:
1. In the CodeWarrior Projects view, right-click the project and select Debug As >Debug Configurations from the context menu.
The Debug Configurations dialog box appears.
Configuring Launcher
CodeWarrior Development Studio for Microcontrollers Version 10.x Profiling and Analysis Tools UsersGuide, Rev. 10.6, 02/2014
68 Freescale Semiconductor, Inc.
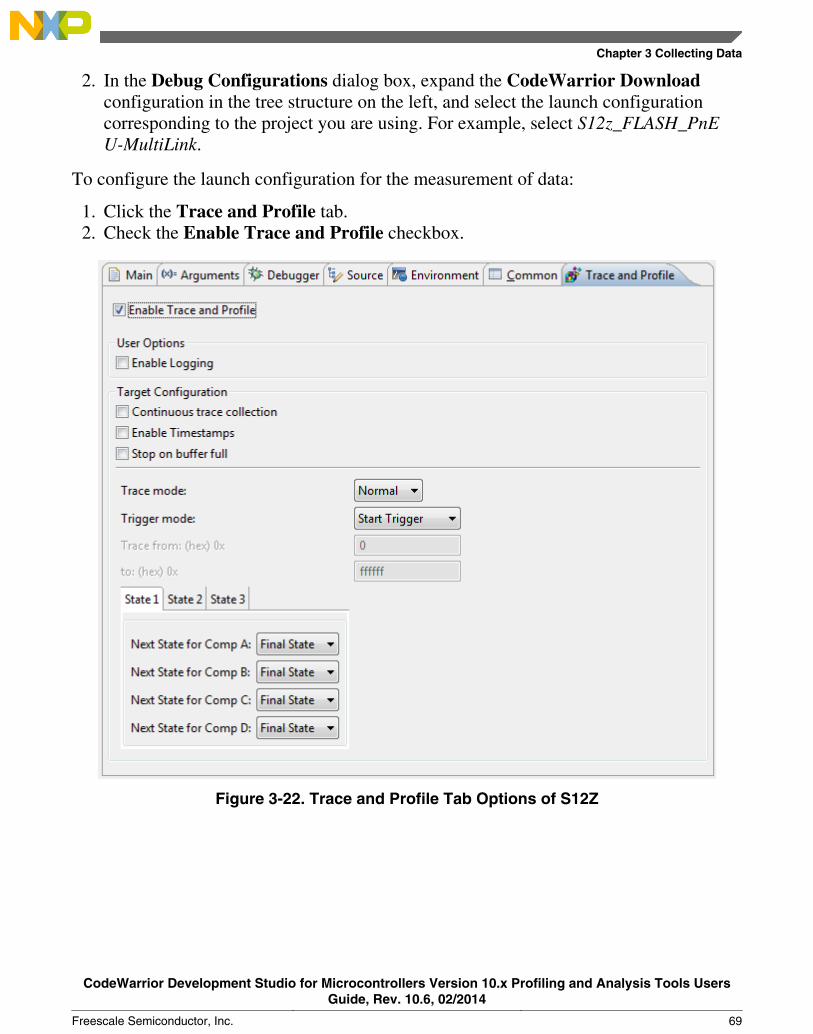
2. In the Debug Configurations dialog box, expand the CodeWarrior Downloadconfiguration in the tree structure on the left, and select the launch configurationcorresponding to the project you are using. For example, select S12z_FLASH_PnEU-MultiLink.
To configure the launch configuration for the measurement of data:
1. Click the Trace and Profile tab.2. Check the Enable Trace and Profile checkbox.
Figure 3-22. Trace and Profile Tab Options of S12Z
Chapter 3 Collecting Data
CodeWarrior Development Studio for Microcontrollers Version 10.x Profiling and Analysis Tools UsersGuide, Rev. 10.6, 02/2014
Freescale Semiconductor, Inc. 69
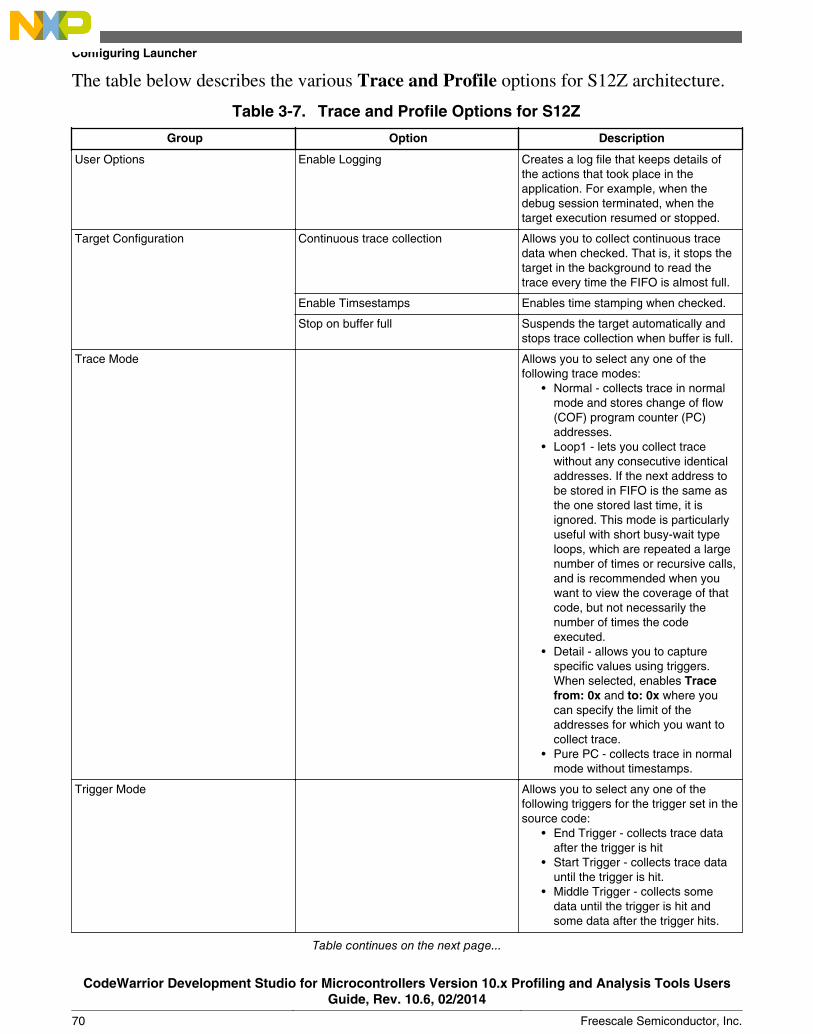
The table below describes the various Trace and Profile options for S12Z architecture.
Table 3-7. Trace and Profile Options for S12Z
Group Option Description
User Options Enable Logging Creates a log file that keeps details ofthe actions that took place in theapplication. For example, when thedebug session terminated, when thetarget execution resumed or stopped.
Target Configuration Continuous trace collection Allows you to collect continuous tracedata when checked. That is, it stops thetarget in the background to read thetrace every time the FIFO is almost full.
Enable Timsestamps Enables time stamping when checked.
Stop on buffer full Suspends the target automatically andstops trace collection when buffer is full.
Trace Mode Allows you to select any one of thefollowing trace modes:
• Normal - collects trace in normalmode and stores change of flow(COF) program counter (PC)addresses.
• Loop1 - lets you collect tracewithout any consecutive identicaladdresses. If the next address tobe stored in FIFO is the same asthe one stored last time, it isignored. This mode is particularlyuseful with short busy-wait typeloops, which are repeated a largenumber of times or recursive calls,and is recommended when youwant to view the coverage of thatcode, but not necessarily thenumber of times the codeexecuted.
• Detail - allows you to capturespecific values using triggers.When selected, enables Tracefrom: 0x and to: 0x where youcan specify the limit of theaddresses for which you want tocollect trace.
• Pure PC - collects trace in normalmode without timestamps.
Trigger Mode Allows you to select any one of thefollowing triggers for the trigger set in thesource code:
• End Trigger - collects trace dataafter the trigger is hit
• Start Trigger - collects trace datauntil the trigger is hit.
• Middle Trigger - collects somedata until the trigger is hit andsome data after the trigger hits.
Table continues on the next page...
Configuring Launcher
CodeWarrior Development Studio for Microcontrollers Version 10.x Profiling and Analysis Tools UsersGuide, Rev. 10.6, 02/2014
70 Freescale Semiconductor, Inc.
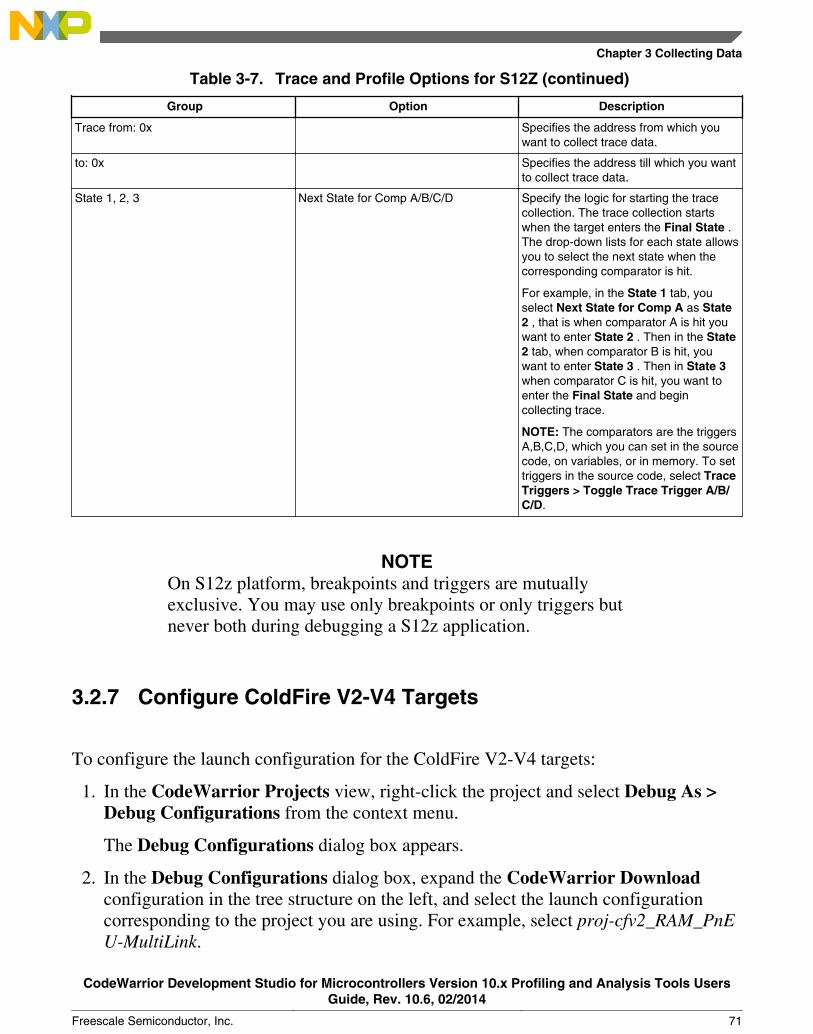
Table 3-7. Trace and Profile Options for S12Z (continued)
Group Option Description
Trace from: 0x Specifies the address from which youwant to collect trace data.
to: 0x Specifies the address till which you wantto collect trace data.
State 1, 2, 3 Next State for Comp A/B/C/D Specify the logic for starting the tracecollection. The trace collection startswhen the target enters the Final State .The drop-down lists for each state allowsyou to select the next state when thecorresponding comparator is hit.
For example, in the State 1 tab, youselect Next State for Comp A as State2 , that is when comparator A is hit youwant to enter State 2 . Then in the State2 tab, when comparator B is hit, youwant to enter State 3 . Then in State 3when comparator C is hit, you want toenter the Final State and begincollecting trace.
NOTE: The comparators are the triggersA,B,C,D, which you can set in the sourcecode, on variables, or in memory. To settriggers in the source code, select TraceTriggers > Toggle Trace Trigger A/B/C/D.
NOTEOn S12z platform, breakpoints and triggers are mutuallyexclusive. You may use only breakpoints or only triggers butnever both during debugging a S12z application.
3.2.7 Configure ColdFire V2-V4 Targets
To configure the launch configuration for the ColdFire V2-V4 targets:
1. In the CodeWarrior Projects view, right-click the project and select Debug As >Debug Configurations from the context menu.
The Debug Configurations dialog box appears.
2. In the Debug Configurations dialog box, expand the CodeWarrior Downloadconfiguration in the tree structure on the left, and select the launch configurationcorresponding to the project you are using. For example, select proj-cfv2_RAM_PnEU-MultiLink.
Chapter 3 Collecting Data
CodeWarrior Development Studio for Microcontrollers Version 10.x Profiling and Analysis Tools UsersGuide, Rev. 10.6, 02/2014
Freescale Semiconductor, Inc. 71
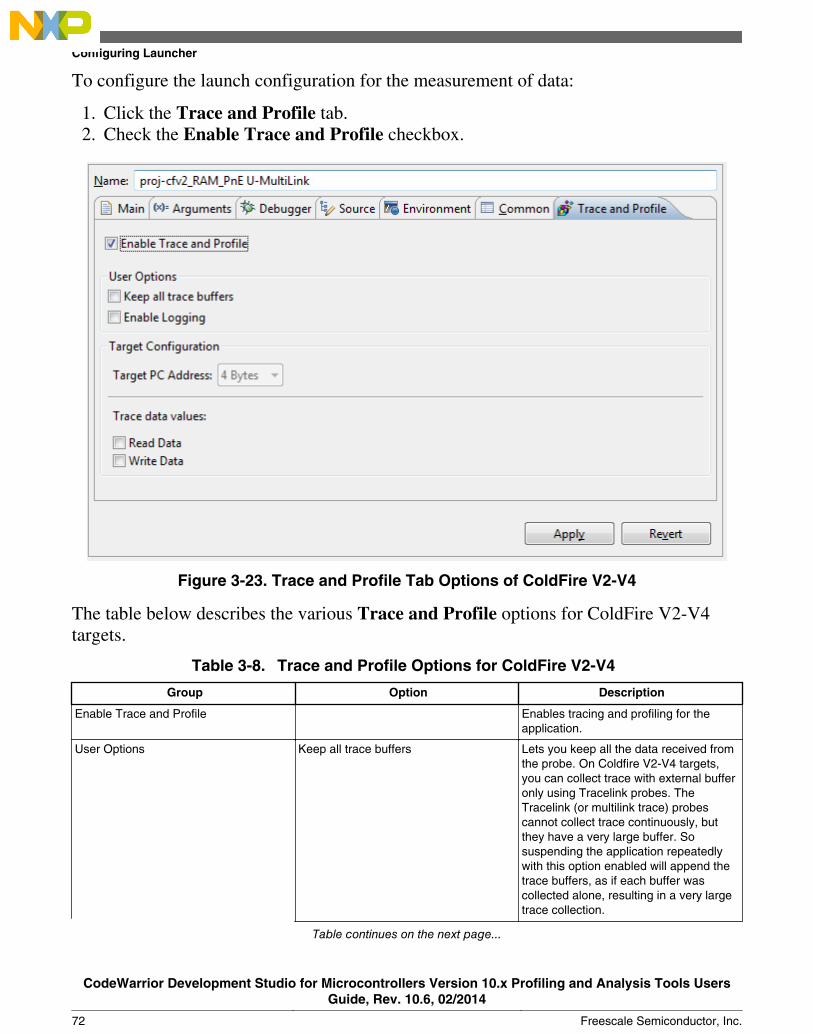
To configure the launch configuration for the measurement of data:
1. Click the Trace and Profile tab.2. Check the Enable Trace and Profile checkbox.
Figure 3-23. Trace and Profile Tab Options of ColdFire V2-V4
The table below describes the various Trace and Profile options for ColdFire V2-V4targets.
Table 3-8. Trace and Profile Options for ColdFire V2-V4
Group Option Description
Enable Trace and Profile Enables tracing and profiling for theapplication.
User Options Keep all trace buffers Lets you keep all the data received fromthe probe. On Coldfire V2-V4 targets,you can collect trace with external bufferonly using Tracelink probes. TheTracelink (or multilink trace) probescannot collect trace continuously, butthey have a very large buffer. Sosuspending the application repeatedlywith this option enabled will append thetrace buffers, as if each buffer wascollected alone, resulting in a very largetrace collection.
Table continues on the next page...
Configuring Launcher
CodeWarrior Development Studio for Microcontrollers Version 10.x Profiling and Analysis Tools UsersGuide, Rev. 10.6, 02/2014
72 Freescale Semiconductor, Inc.
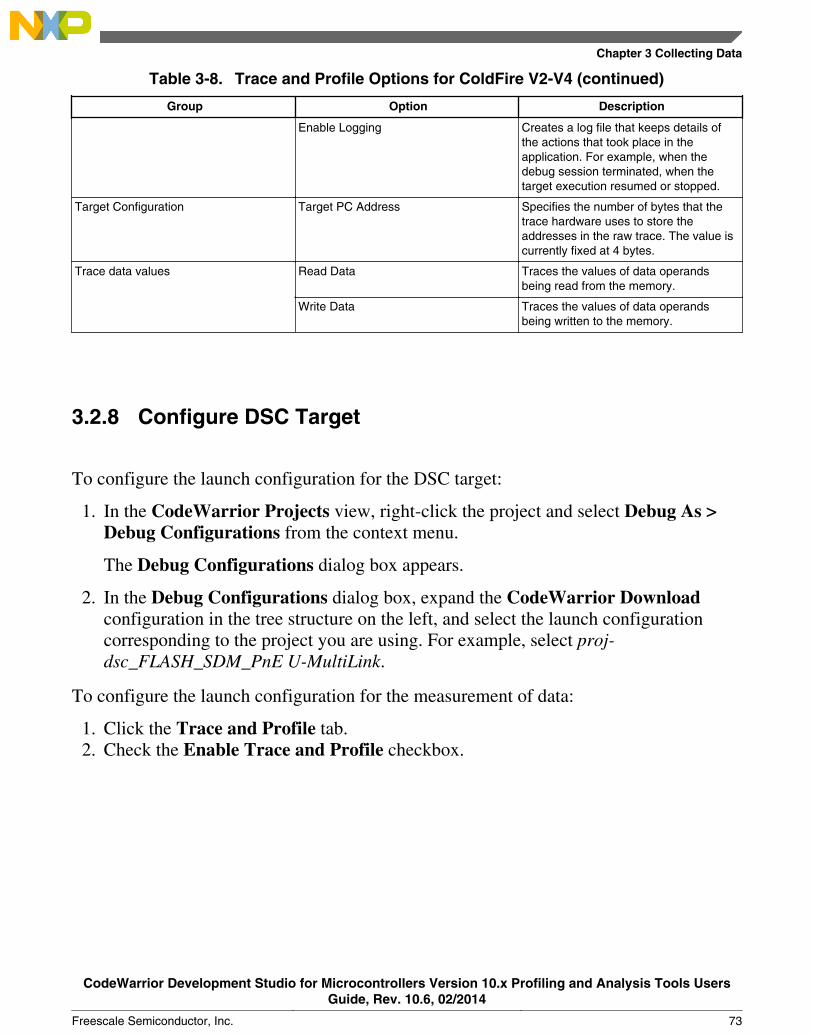
Table 3-8. Trace and Profile Options for ColdFire V2-V4 (continued)
Group Option Description
Enable Logging Creates a log file that keeps details ofthe actions that took place in theapplication. For example, when thedebug session terminated, when thetarget execution resumed or stopped.
Target Configuration Target PC Address Specifies the number of bytes that thetrace hardware uses to store theaddresses in the raw trace. The value iscurrently fixed at 4 bytes.
Trace data values Read Data Traces the values of data operandsbeing read from the memory.
Write Data Traces the values of data operandsbeing written to the memory.
3.2.8 Configure DSC Target
To configure the launch configuration for the DSC target:
1. In the CodeWarrior Projects view, right-click the project and select Debug As >Debug Configurations from the context menu.
The Debug Configurations dialog box appears.
2. In the Debug Configurations dialog box, expand the CodeWarrior Downloadconfiguration in the tree structure on the left, and select the launch configurationcorresponding to the project you are using. For example, select proj-dsc_FLASH_SDM_PnE U-MultiLink.
To configure the launch configuration for the measurement of data:
1. Click the Trace and Profile tab.2. Check the Enable Trace and Profile checkbox.
Chapter 3 Collecting Data
CodeWarrior Development Studio for Microcontrollers Version 10.x Profiling and Analysis Tools UsersGuide, Rev. 10.6, 02/2014
Freescale Semiconductor, Inc. 73
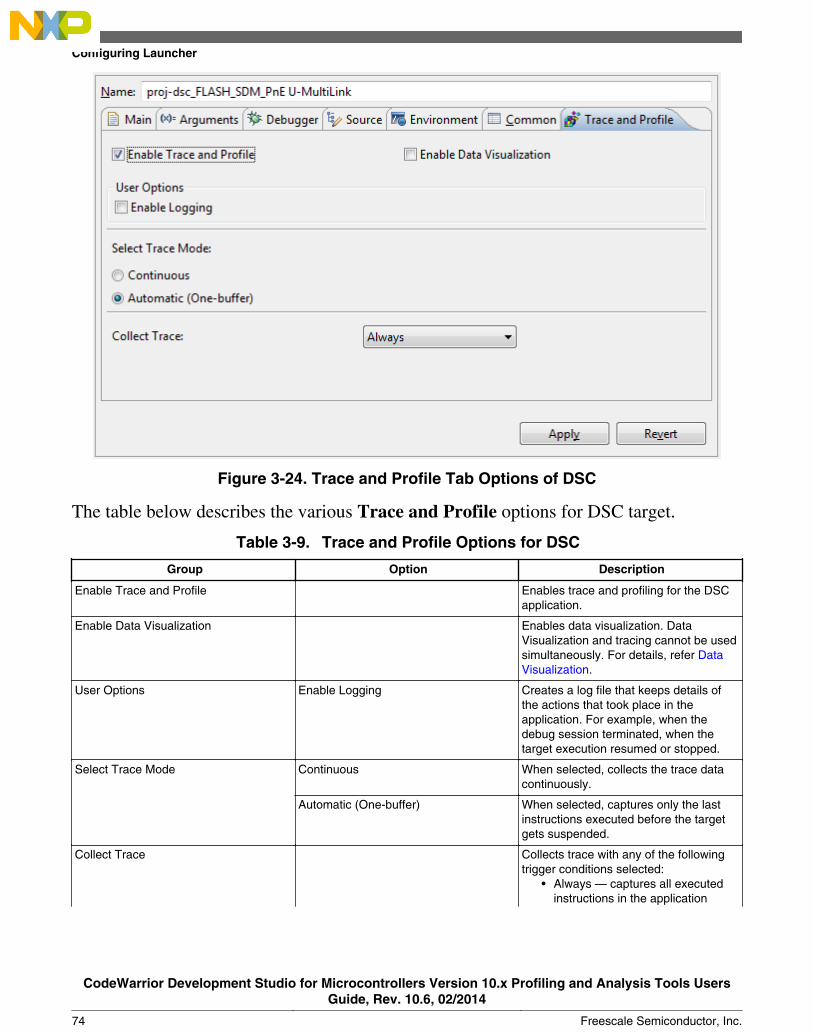
Figure 3-24. Trace and Profile Tab Options of DSC
The table below describes the various Trace and Profile options for DSC target.
Table 3-9. Trace and Profile Options for DSC
Group Option Description
Enable Trace and Profile Enables trace and profiling for the DSCapplication.
Enable Data Visualization Enables data visualization. DataVisualization and tracing cannot be usedsimultaneously. For details, refer DataVisualization.
User Options Enable Logging Creates a log file that keeps details ofthe actions that took place in theapplication. For example, when thedebug session terminated, when thetarget execution resumed or stopped.
Select Trace Mode Continuous When selected, collects the trace datacontinuously.
Automatic (One-buffer) When selected, captures only the lastinstructions executed before the targetgets suspended.
Collect Trace Collects trace with any of the followingtrigger conditions selected:
• Always — captures all executedinstructions in the application
Configuring Launcher
CodeWarrior Development Studio for Microcontrollers Version 10.x Profiling and Analysis Tools UsersGuide, Rev. 10.6, 02/2014
74 Freescale Semiconductor, Inc.
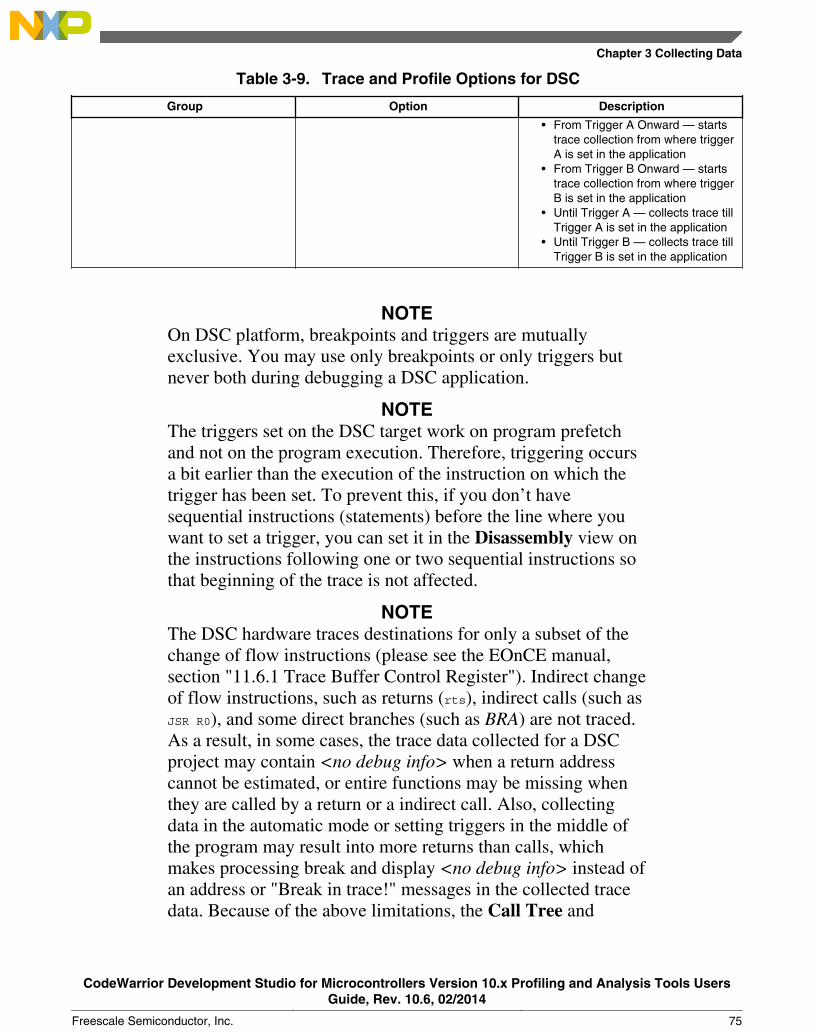
Table 3-9. Trace and Profile Options for DSC
Group Option Description
• From Trigger A Onward — startstrace collection from where triggerA is set in the application
• From Trigger B Onward — startstrace collection from where triggerB is set in the application
• Until Trigger A — collects trace tillTrigger A is set in the application
• Until Trigger B — collects trace tillTrigger B is set in the application
NOTEOn DSC platform, breakpoints and triggers are mutuallyexclusive. You may use only breakpoints or only triggers butnever both during debugging a DSC application.
NOTEThe triggers set on the DSC target work on program prefetchand not on the program execution. Therefore, triggering occursa bit earlier than the execution of the instruction on which thetrigger has been set. To prevent this, if you don’t havesequential instructions (statements) before the line where youwant to set a trigger, you can set it in the Disassembly view onthe instructions following one or two sequential instructions sothat beginning of the trace is not affected.
NOTEThe DSC hardware traces destinations for only a subset of thechange of flow instructions (please see the EOnCE manual,section "11.6.1 Trace Buffer Control Register"). Indirect changeof flow instructions, such as returns (rts), indirect calls (such asJSR R0), and some direct branches (such as BRA) are not traced.As a result, in some cases, the trace data collected for a DSCproject may contain <no debug info> when a return addresscannot be estimated, or entire functions may be missing whenthey are called by a return or a indirect call. Also, collectingdata in the automatic mode or setting triggers in the middle ofthe program may result into more returns than calls, whichmakes processing break and display <no debug info> instead ofan address or "Break in trace!" messages in the collected tracedata. Because of the above limitations, the Call Tree and
Chapter 3 Collecting Data
CodeWarrior Development Studio for Microcontrollers Version 10.x Profiling and Analysis Tools UsersGuide, Rev. 10.6, 02/2014
Freescale Semiconductor, Inc. 75
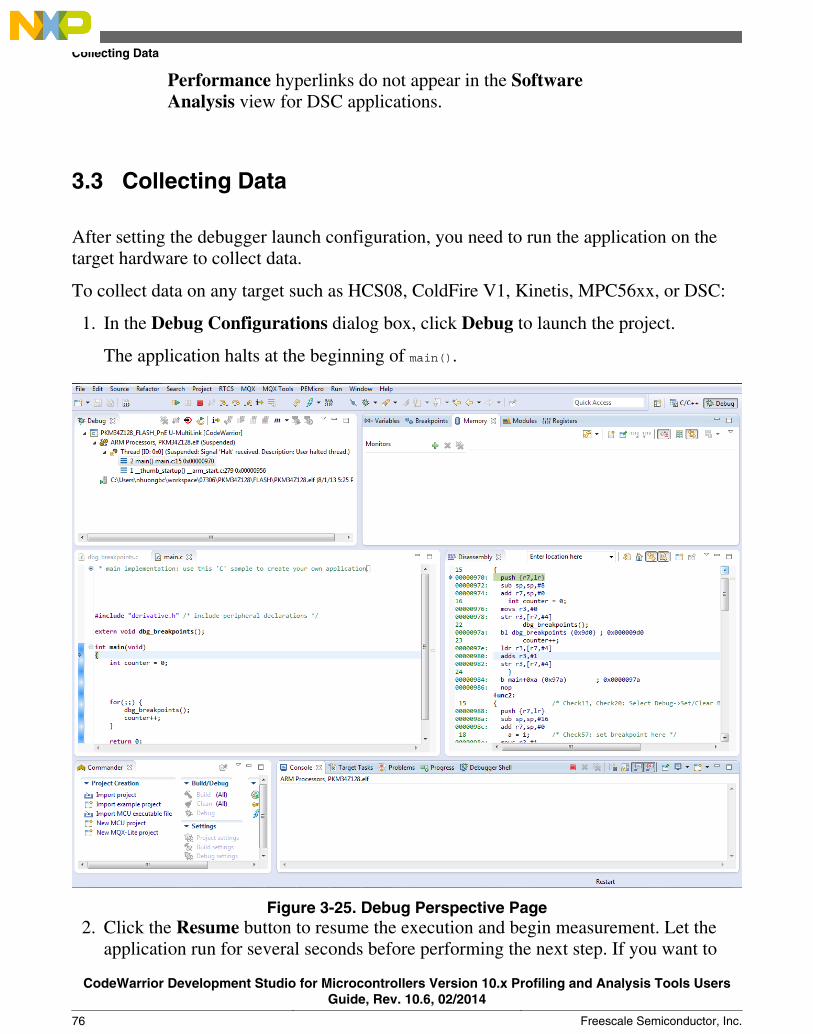
Performance hyperlinks do not appear in the SoftwareAnalysis view for DSC applications.
3.3 Collecting Data
After setting the debugger launch configuration, you need to run the application on thetarget hardware to collect data.
To collect data on any target such as HCS08, ColdFire V1, Kinetis, MPC56xx, or DSC:
1. In the Debug Configurations dialog box, click Debug to launch the project.
The application halts at the beginning of main().
Figure 3-25. Debug Perspective Page2. Click the Resume button to resume the execution and begin measurement. Let the
application run for several seconds before performing the next step. If you want to
Collecting Data
CodeWarrior Development Studio for Microcontrollers Version 10.x Profiling and Analysis Tools UsersGuide, Rev. 10.6, 02/2014
76 Freescale Semiconductor, Inc.
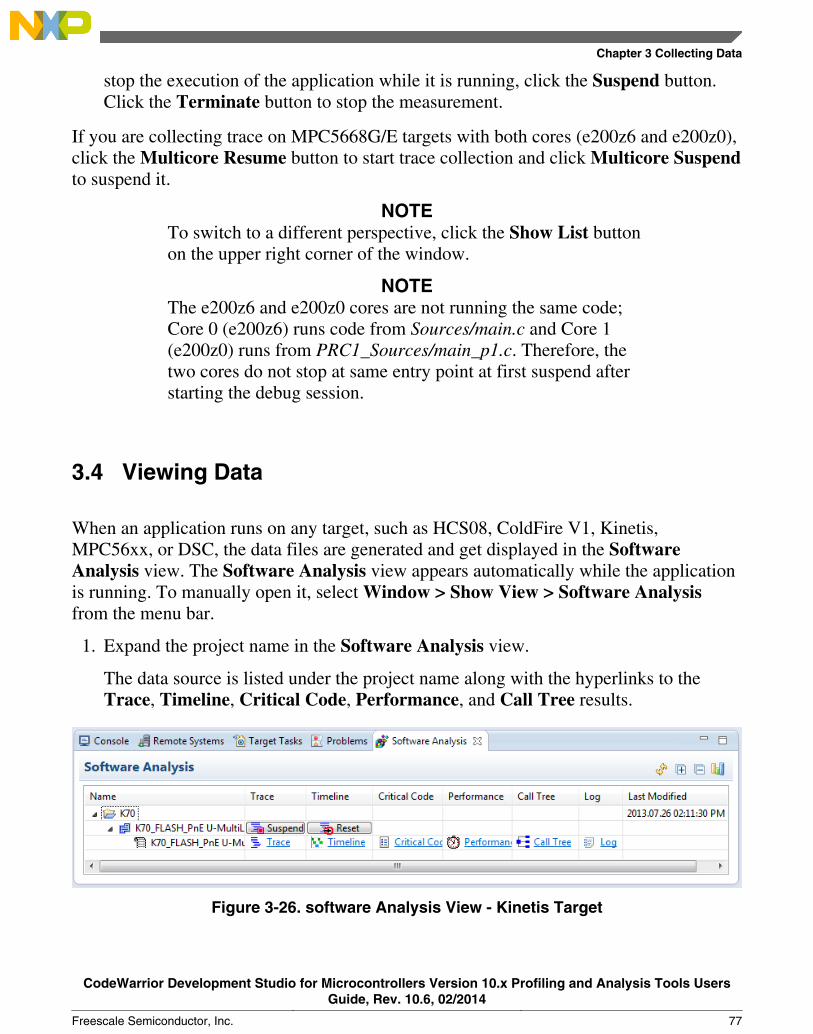
stop the execution of the application while it is running, click the Suspend button.Click the Terminate button to stop the measurement.
If you are collecting trace on MPC5668G/E targets with both cores (e200z6 and e200z0),click the Multicore Resume button to start trace collection and click Multicore Suspendto suspend it.
NOTETo switch to a different perspective, click the Show List buttonon the upper right corner of the window.
NOTEThe e200z6 and e200z0 cores are not running the same code;Core 0 (e200z6) runs code from Sources/main.c and Core 1(e200z0) runs from PRC1_Sources/main_p1.c. Therefore, thetwo cores do not stop at same entry point at first suspend afterstarting the debug session.
3.4 Viewing Data
When an application runs on any target, such as HCS08, ColdFire V1, Kinetis,MPC56xx, or DSC, the data files are generated and get displayed in the SoftwareAnalysis view. The Software Analysis view appears automatically while the applicationis running. To manually open it, select Window > Show View > Software Analysisfrom the menu bar.
1. Expand the project name in the Software Analysis view.
The data source is listed under the project name along with the hyperlinks to theTrace, Timeline, Critical Code, Performance, and Call Tree results.
Figure 3-26. software Analysis View - Kinetis Target
Chapter 3 Collecting Data
CodeWarrior Development Studio for Microcontrollers Version 10.x Profiling and Analysis Tools UsersGuide, Rev. 10.6, 02/2014
Freescale Semiconductor, Inc. 77
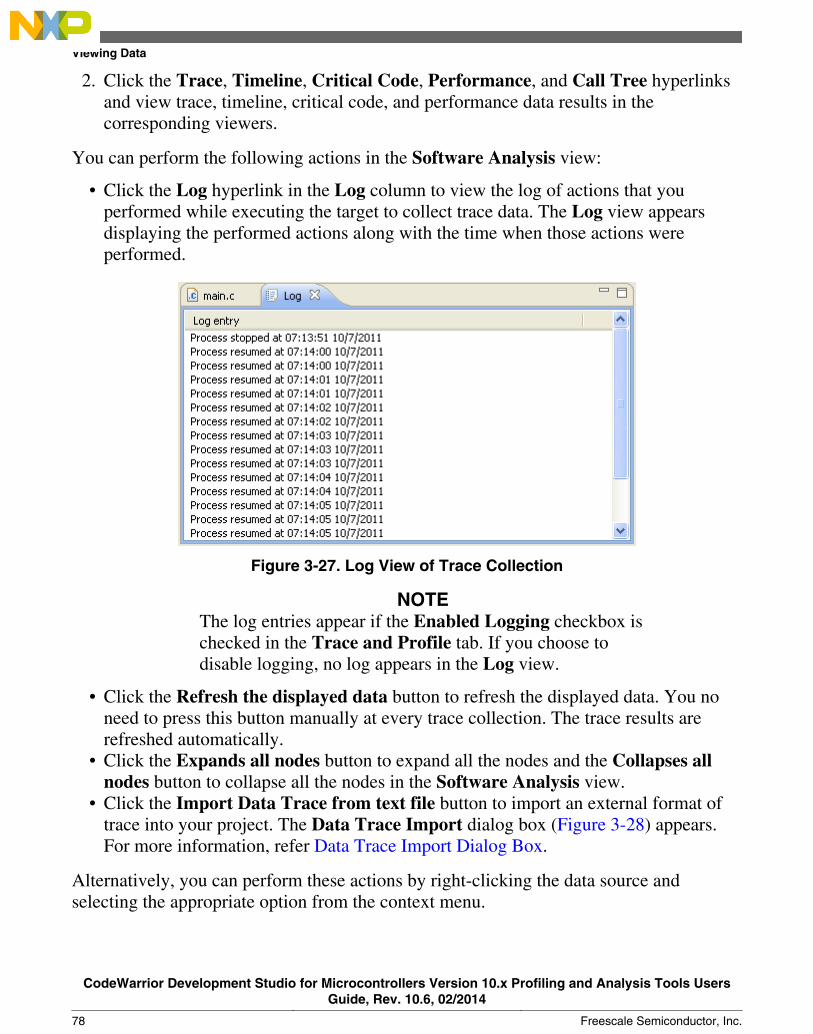
2. Click the Trace, Timeline, Critical Code, Performance, and Call Tree hyperlinksand view trace, timeline, critical code, and performance data results in thecorresponding viewers.
You can perform the following actions in the Software Analysis view:
• Click the Log hyperlink in the Log column to view the log of actions that youperformed while executing the target to collect trace data. The Log view appearsdisplaying the performed actions along with the time when those actions wereperformed.
Figure 3-27. Log View of Trace Collection
NOTEThe log entries appear if the Enabled Logging checkbox ischecked in the Trace and Profile tab. If you choose todisable logging, no log appears in the Log view.
• Click the Refresh the displayed data button to refresh the displayed data. You noneed to press this button manually at every trace collection. The trace results arerefreshed automatically.
• Click the Expands all nodes button to expand all the nodes and the Collapses allnodes button to collapse all the nodes in the Software Analysis view.
• Click the Import Data Trace from text file button to import an external format oftrace into your project. The Data Trace Import dialog box (Figure 3-28) appears.For more information, refer Data Trace Import Dialog Box.
Alternatively, you can perform these actions by right-clicking the data source andselecting the appropriate option from the context menu.
Viewing Data
CodeWarrior Development Studio for Microcontrollers Version 10.x Profiling and Analysis Tools UsersGuide, Rev. 10.6, 02/2014
78 Freescale Semiconductor, Inc.
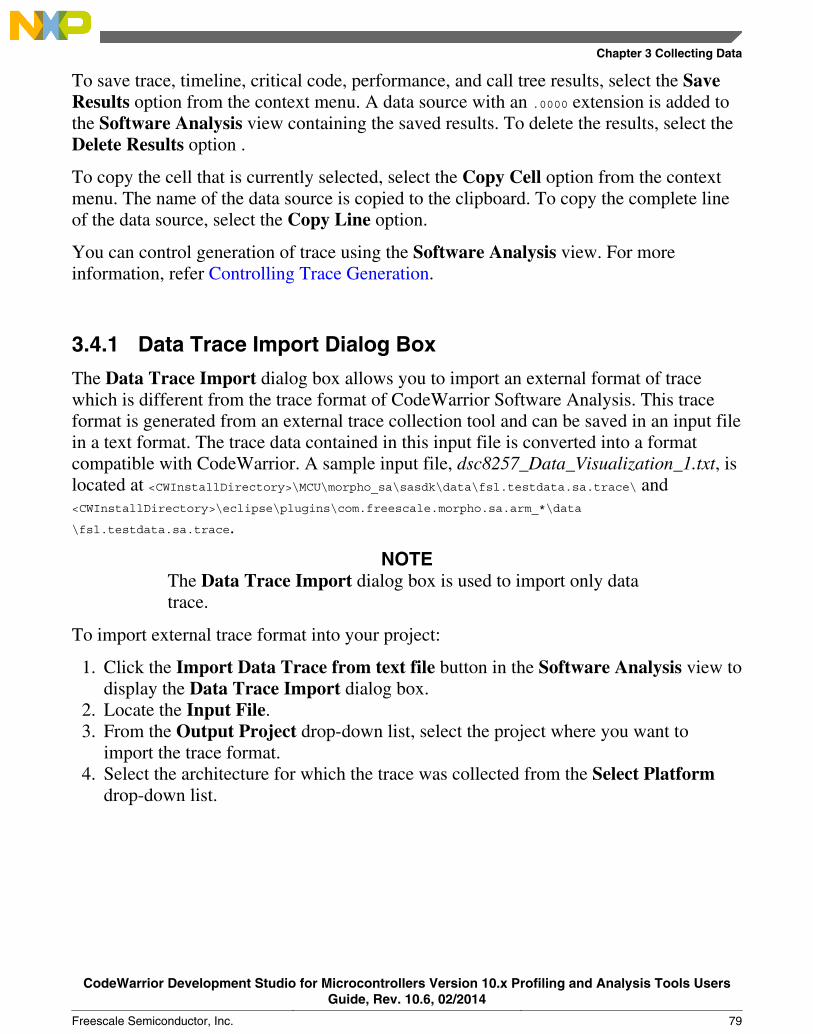
To save trace, timeline, critical code, performance, and call tree results, select the SaveResults option from the context menu. A data source with an .0000 extension is added tothe Software Analysis view containing the saved results. To delete the results, select the Delete Results option .
To copy the cell that is currently selected, select the Copy Cell option from the contextmenu. The name of the data source is copied to the clipboard. To copy the complete lineof the data source, select the Copy Line option.
You can control generation of trace using the Software Analysis view. For moreinformation, refer Controlling Trace Generation.
3.4.1 Data Trace Import Dialog Box
The Data Trace Import dialog box allows you to import an external format of tracewhich is different from the trace format of CodeWarrior Software Analysis. This traceformat is generated from an external trace collection tool and can be saved in an input filein a text format. The trace data contained in this input file is converted into a formatcompatible with CodeWarrior. A sample input file, dsc8257_Data_Visualization_1.txt, islocated at <CWInstallDirectory>\MCU\morpho_sa\sasdk\data\fsl.testdata.sa.trace\ and<CWInstallDirectory>\eclipse\plugins\com.freescale.morpho.sa.arm_*\data
\fsl.testdata.sa.trace.
NOTEThe Data Trace Import dialog box is used to import only datatrace.
To import external trace format into your project:
1. Click the Import Data Trace from text file button in the Software Analysis view todisplay the Data Trace Import dialog box.
2. Locate the Input File.3. From the Output Project drop-down list, select the project where you want to
import the trace format.4. Select the architecture for which the trace was collected from the Select Platform
drop-down list.
Chapter 3 Collecting Data
CodeWarrior Development Studio for Microcontrollers Version 10.x Profiling and Analysis Tools UsersGuide, Rev. 10.6, 02/2014
Freescale Semiconductor, Inc. 79
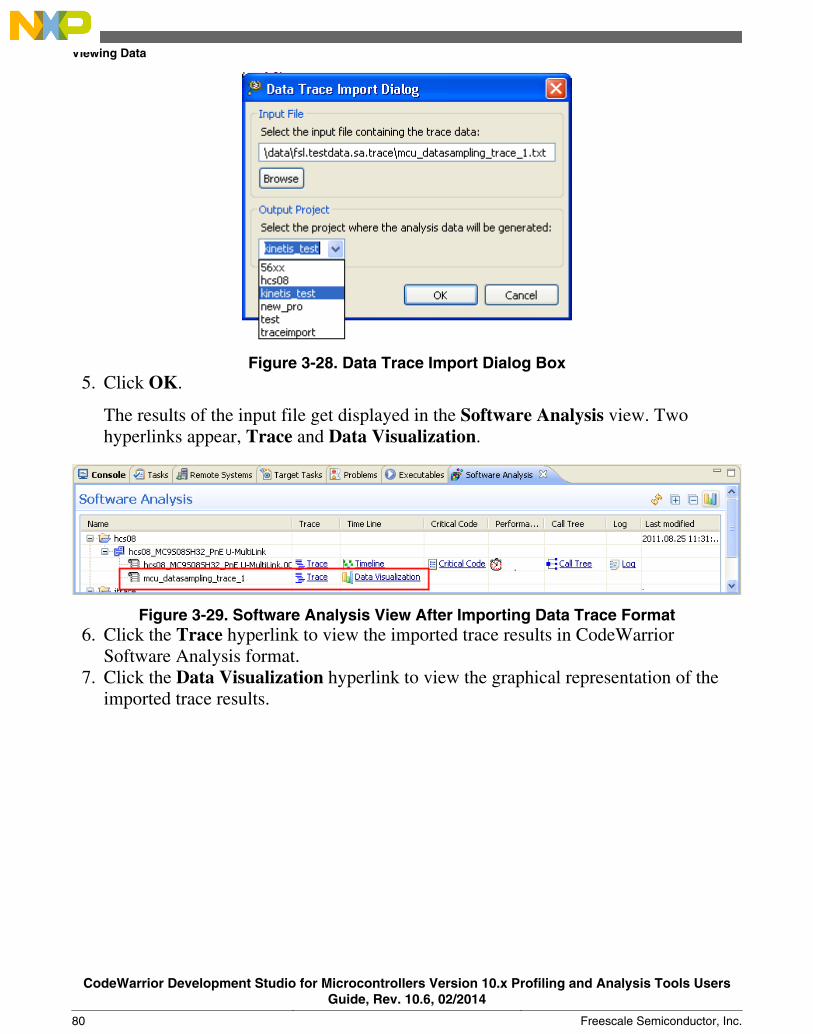
Figure 3-28. Data Trace Import Dialog Box5. Click OK.
The results of the input file get displayed in the Software Analysis view. Twohyperlinks appear, Trace and Data Visualization.
Figure 3-29. Software Analysis View After Importing Data Trace Format6. Click the Trace hyperlink to view the imported trace results in CodeWarrior
Software Analysis format.7. Click the Data Visualization hyperlink to view the graphical representation of the
imported trace results.
Viewing Data
CodeWarrior Development Studio for Microcontrollers Version 10.x Profiling and Analysis Tools UsersGuide, Rev. 10.6, 02/2014
80 Freescale Semiconductor, Inc.
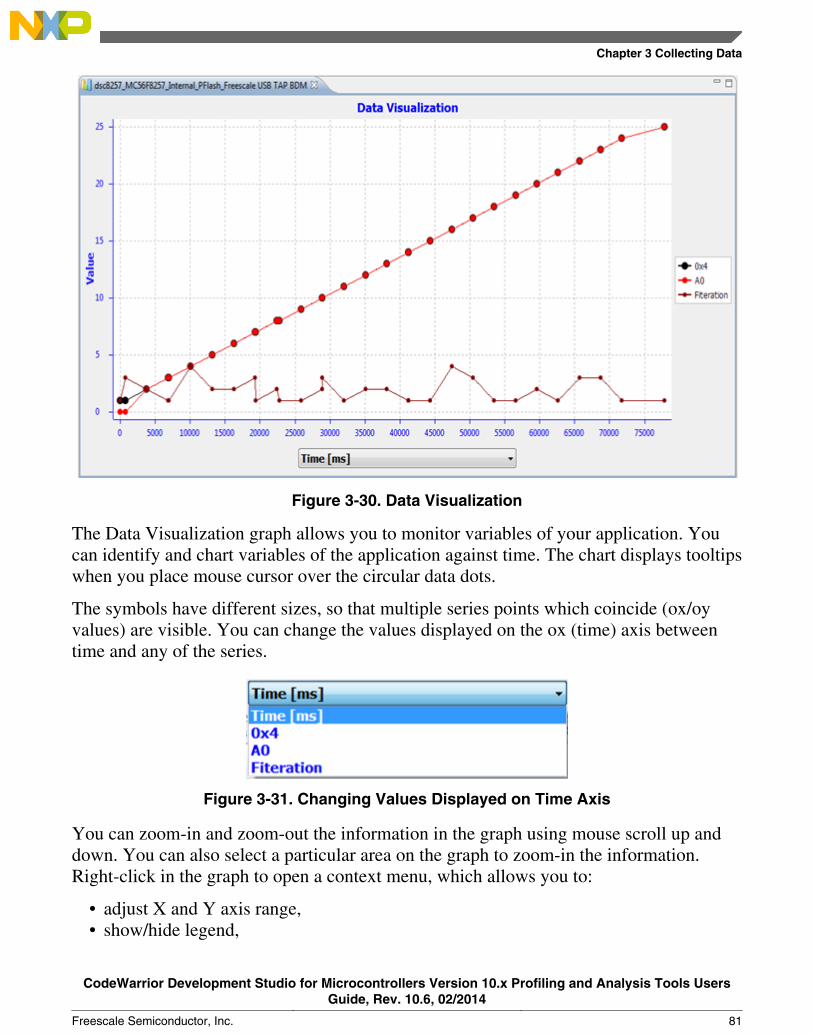
Figure 3-30. Data Visualization
The Data Visualization graph allows you to monitor variables of your application. Youcan identify and chart variables of the application against time. The chart displays tooltipswhen you place mouse cursor over the circular data dots.
The symbols have different sizes, so that multiple series points which coincide (ox/oyvalues) are visible. You can change the values displayed on the ox (time) axis betweentime and any of the series.
Figure 3-31. Changing Values Displayed on Time Axis
You can zoom-in and zoom-out the information in the graph using mouse scroll up anddown. You can also select a particular area on the graph to zoom-in the information.Right-click in the graph to open a context menu, which allows you to:
• adjust X and Y axis range,• show/hide legend,
Chapter 3 Collecting Data
CodeWarrior Development Studio for Microcontrollers Version 10.x Profiling and Analysis Tools UsersGuide, Rev. 10.6, 02/2014
Freescale Semiconductor, Inc. 81
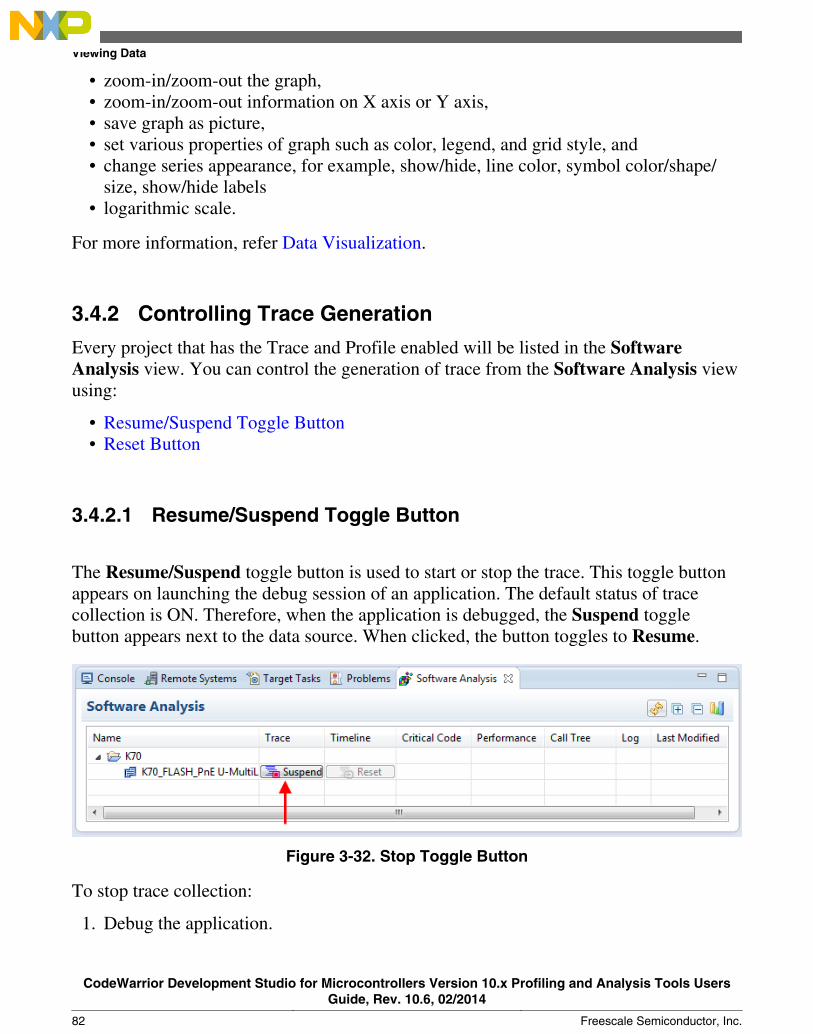
• zoom-in/zoom-out the graph,• zoom-in/zoom-out information on X axis or Y axis,• save graph as picture,• set various properties of graph such as color, legend, and grid style, and• change series appearance, for example, show/hide, line color, symbol color/shape/
size, show/hide labels• logarithmic scale.
For more information, refer Data Visualization.
3.4.2 Controlling Trace Generation
Every project that has the Trace and Profile enabled will be listed in the SoftwareAnalysis view. You can control the generation of trace from the Software Analysis viewusing:
• Resume/Suspend Toggle Button• Reset Button
3.4.2.1 Resume/Suspend Toggle Button
The Resume/Suspend toggle button is used to start or stop the trace. This toggle buttonappears on launching the debug session of an application. The default status of tracecollection is ON. Therefore, when the application is debugged, the Suspend togglebutton appears next to the data source. When clicked, the button toggles to Resume.
Figure 3-32. Stop Toggle Button
To stop trace collection:
1. Debug the application.
Viewing Data
CodeWarrior Development Studio for Microcontrollers Version 10.x Profiling and Analysis Tools UsersGuide, Rev. 10.6, 02/2014
82 Freescale Semiconductor, Inc.
The Suspend toggle button appears next to the data source name in the SoftwareAnalysis view.
2. When the application halts at the program entry point main(), click the Suspendtoggle button.
The button toggles to Resume.
3. Click Resume in the Debug view.4. Click Suspend in the Debug view after some time.5. Look at the trace data in the Software Analysis view.
The trace is not collected.
To start trace collection:
1. Click Resume toggle button.
The button toggles to Suspend.
2. Click Resume in the Debug view.3. Click Suspend in the Debug view after some time.4. Look at the trace data in the Software Analysis view.
The trace is collected.
The toggle button disappears when you click Resume in the Debug view or terminate thedebug session. After clicking Suspend in the Debug view, it is visible again with the lastselected status.
3.4.2.2 Reset Button
The Reset button lets you to reset trace during the debug session. The trace data can bereset only when the debug session is suspended. The Reset button is enabled only whendebug session is suspended and there is trace available to be reset. The user interfaceprovides three options that you can use to perform the rest action:
• The Reset button in the Software Analysis view• The Reset button in the Debug view• The Reset option in the context menu on right-clicking in the Debug view
Chapter 3 Collecting Data
CodeWarrior Development Studio for Microcontrollers Version 10.x Profiling and Analysis Tools UsersGuide, Rev. 10.6, 02/2014
Freescale Semiconductor, Inc. 83
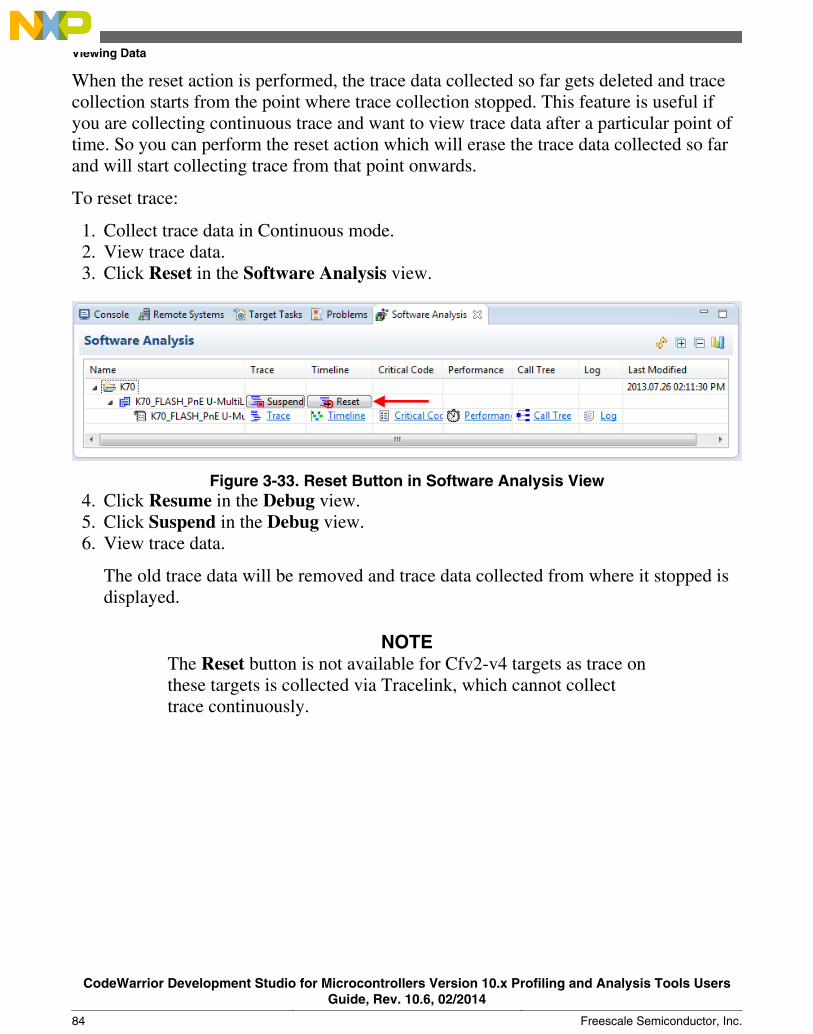
When the reset action is performed, the trace data collected so far gets deleted and tracecollection starts from the point where trace collection stopped. This feature is useful ifyou are collecting continuous trace and want to view trace data after a particular point oftime. So you can perform the reset action which will erase the trace data collected so farand will start collecting trace from that point onwards.
To reset trace:
1. Collect trace data in Continuous mode.2. View trace data.3. Click Reset in the Software Analysis view.
Figure 3-33. Reset Button in Software Analysis View4. Click Resume in the Debug view.5. Click Suspend in the Debug view.6. View trace data.
The old trace data will be removed and trace data collected from where it stopped isdisplayed.
NOTEThe Reset button is not available for Cfv2-v4 targets as trace onthese targets is collected via Tracelink, which cannot collecttrace continuously.
Viewing Data
CodeWarrior Development Studio for Microcontrollers Version 10.x Profiling and Analysis Tools UsersGuide, Rev. 10.6, 02/2014
84 Freescale Semiconductor, Inc.
Chapter 4Viewing Data
You can view the collected data for various targets such as HCS08, ColdFire V1, Kinetis,MPC56xx and DSC from the data file generated after running the application in thefollowing viewers.
• Trace Data• Timeline• Critical Code Data• Performance Data• Call Tree
You can also view trace data of the other project by importing the trace data file ofanother project into your project using the Import wizard. For more information, referImporting Trace Data Offline.
NOTEThis chapter demonstrates how to view collected data on theKinetis target. The process of viewing data for all the targets issame.
4.1 Trace Data
To view trace data:
1. In the Software Analysis view, expand the project name.
The data source is listed under the project name.
CodeWarrior Development Studio for Microcontrollers Version 10.x Profiling and Analysis Tools UsersGuide, Rev. 10.6, 02/2014
Freescale Semiconductor, Inc. 85
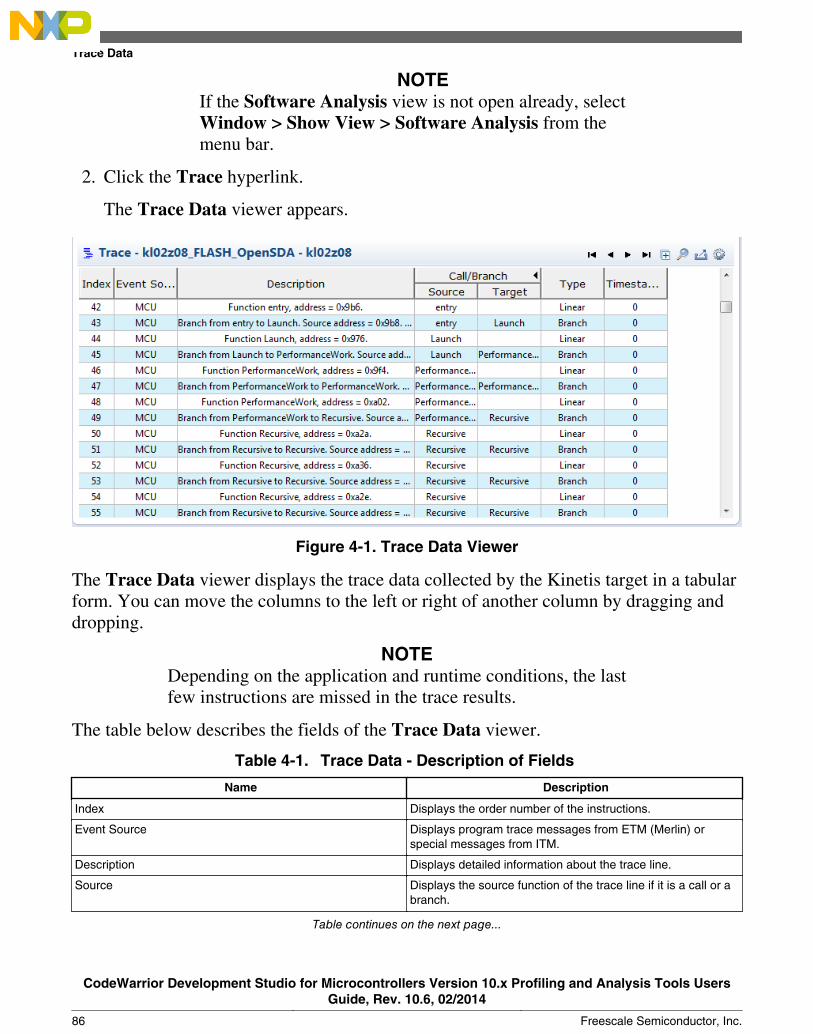
NOTEIf the Software Analysis view is not open already, selectWindow > Show View > Software Analysis from themenu bar.
2. Click the Trace hyperlink.
The Trace Data viewer appears.
Figure 4-1. Trace Data Viewer
The Trace Data viewer displays the trace data collected by the Kinetis target in a tabularform. You can move the columns to the left or right of another column by dragging anddropping.
NOTEDepending on the application and runtime conditions, the lastfew instructions are missed in the trace results.
The table below describes the fields of the Trace Data viewer.
Table 4-1. Trace Data - Description of Fields
Name Description
Index Displays the order number of the instructions.
Event Source Displays program trace messages from ETM (Merlin) orspecial messages from ITM.
Description Displays detailed information about the trace line.
Source Displays the source function of the trace line if it is a call or abranch.
Table continues on the next page...
Trace Data
CodeWarrior Development Studio for Microcontrollers Version 10.x Profiling and Analysis Tools UsersGuide, Rev. 10.6, 02/2014
86 Freescale Semiconductor, Inc.
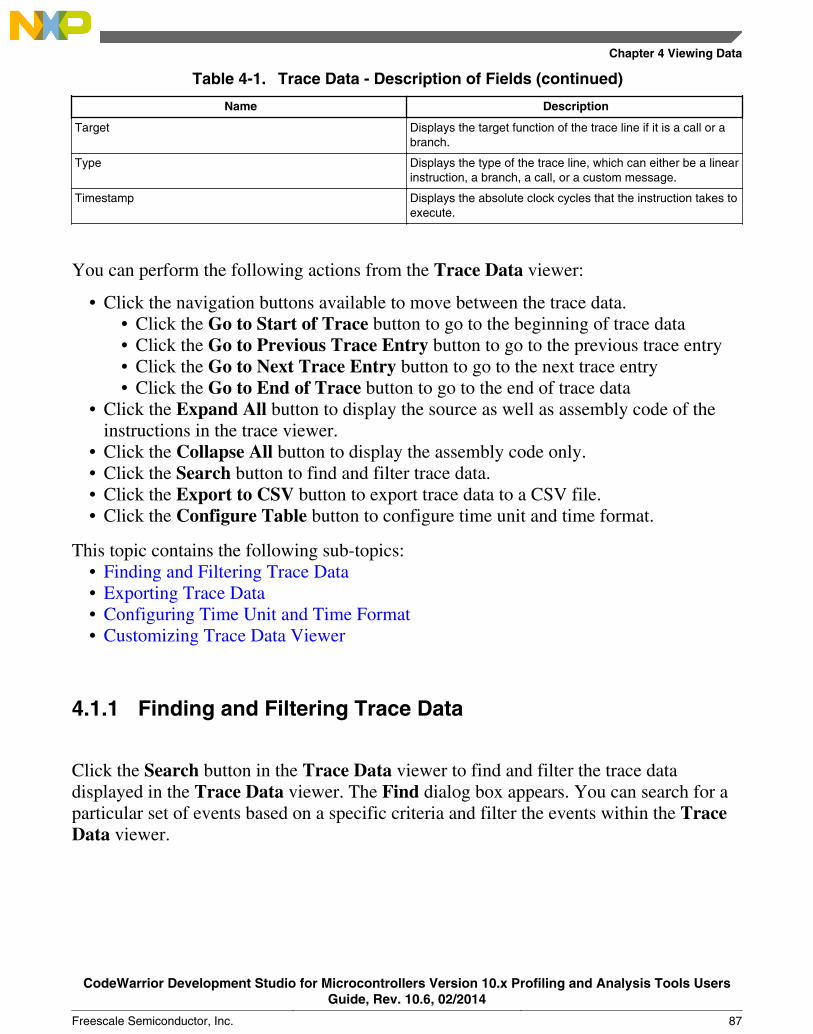
Table 4-1. Trace Data - Description of Fields (continued)
Name Description
Target Displays the target function of the trace line if it is a call or abranch.
Type Displays the type of the trace line, which can either be a linearinstruction, a branch, a call, or a custom message.
Timestamp Displays the absolute clock cycles that the instruction takes toexecute.
You can perform the following actions from the Trace Data viewer:
• Click the navigation buttons available to move between the trace data.• Click the Go to Start of Trace button to go to the beginning of trace data• Click the Go to Previous Trace Entry button to go to the previous trace entry• Click the Go to Next Trace Entry button to go to the next trace entry• Click the Go to End of Trace button to go to the end of trace data
• Click the Expand All button to display the source as well as assembly code of theinstructions in the trace viewer.
• Click the Collapse All button to display the assembly code only.• Click the Search button to find and filter trace data.• Click the Export to CSV button to export trace data to a CSV file.• Click the Configure Table button to configure time unit and time format.
This topic contains the following sub-topics:• Finding and Filtering Trace Data• Exporting Trace Data• Configuring Time Unit and Time Format• Customizing Trace Data Viewer
4.1.1 Finding and Filtering Trace Data
Click the Search button in the Trace Data viewer to find and filter the trace datadisplayed in the Trace Data viewer. The Find dialog box appears. You can search for aparticular set of events based on a specific criteria and filter the events within the TraceData viewer.
Chapter 4 Viewing Data
CodeWarrior Development Studio for Microcontrollers Version 10.x Profiling and Analysis Tools UsersGuide, Rev. 10.6, 02/2014
Freescale Semiconductor, Inc. 87
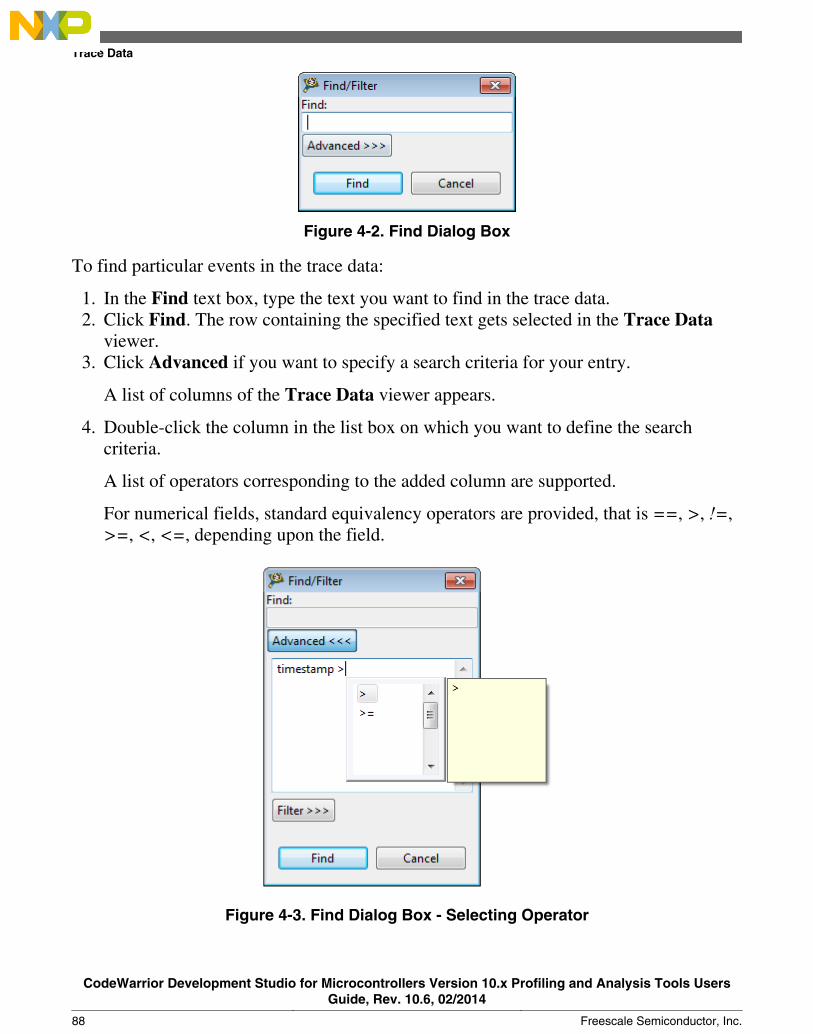
Figure 4-2. Find Dialog Box
To find particular events in the trace data:
1. In the Find text box, type the text you want to find in the trace data.2. Click Find. The row containing the specified text gets selected in the Trace Data
viewer.3. Click Advanced if you want to specify a search criteria for your entry.
A list of columns of the Trace Data viewer appears.
4. Double-click the column in the list box on which you want to define the searchcriteria.
A list of operators corresponding to the added column are supported.
For numerical fields, standard equivalency operators are provided, that is ==, >, !=,>=, <, <=, depending upon the field.
Figure 4-3. Find Dialog Box - Selecting Operator
Trace Data
CodeWarrior Development Studio for Microcontrollers Version 10.x Profiling and Analysis Tools UsersGuide, Rev. 10.6, 02/2014
88 Freescale Semiconductor, Inc.
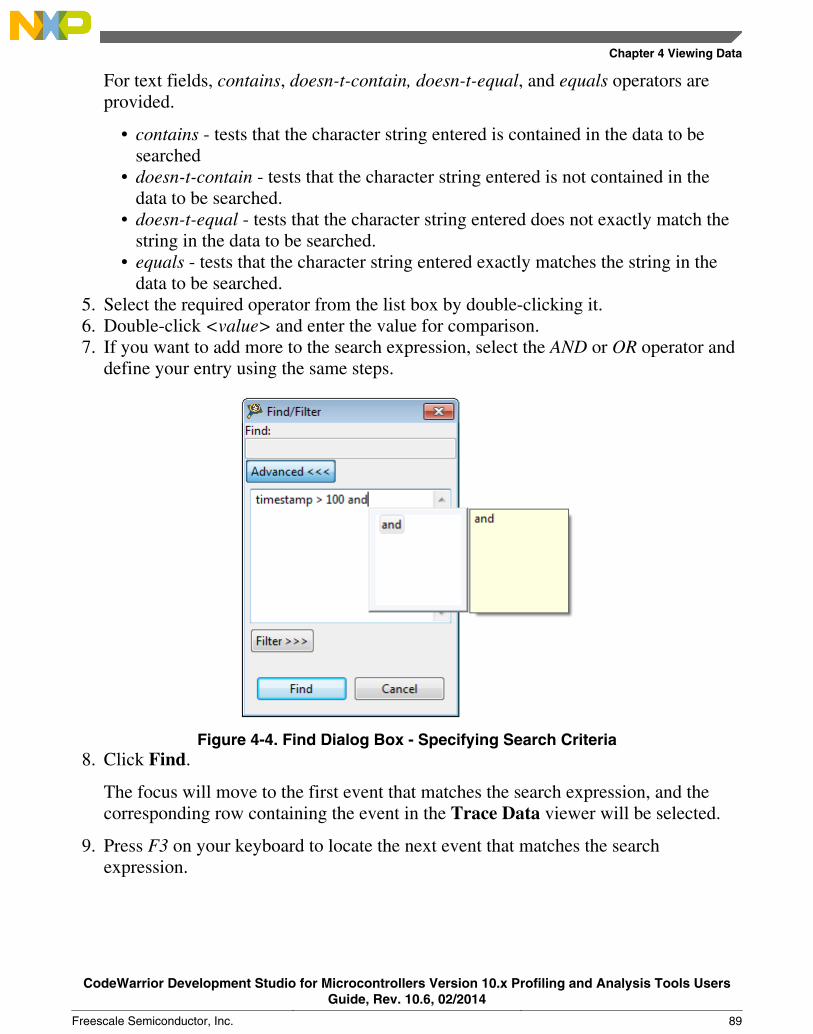
For text fields, contains, doesn-t-contain, doesn-t-equal, and equals operators areprovided.
• contains - tests that the character string entered is contained in the data to besearched
• doesn-t-contain - tests that the character string entered is not contained in thedata to be searched.
• doesn-t-equal - tests that the character string entered does not exactly match thestring in the data to be searched.
• equals - tests that the character string entered exactly matches the string in thedata to be searched.
5. Select the required operator from the list box by double-clicking it.6. Double-click <value> and enter the value for comparison.7. If you want to add more to the search expression, select the AND or OR operator and
define your entry using the same steps.
Figure 4-4. Find Dialog Box - Specifying Search Criteria8. Click Find.
The focus will move to the first event that matches the search expression, and thecorresponding row containing the event in the Trace Data viewer will be selected.
9. Press F3 on your keyboard to locate the next event that matches the searchexpression.
Chapter 4 Viewing Data
CodeWarrior Development Studio for Microcontrollers Version 10.x Profiling and Analysis Tools UsersGuide, Rev. 10.6, 02/2014
Freescale Semiconductor, Inc. 89
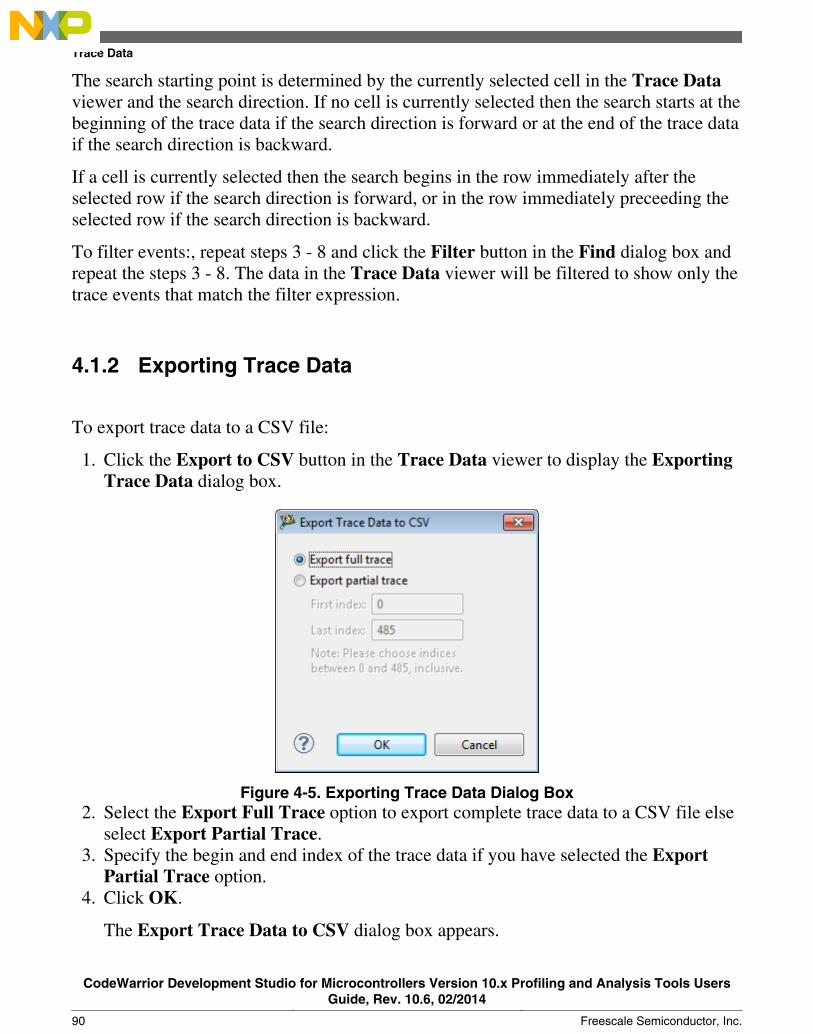
The search starting point is determined by the currently selected cell in the Trace Dataviewer and the search direction. If no cell is currently selected then the search starts at thebeginning of the trace data if the search direction is forward or at the end of the trace dataif the search direction is backward.
If a cell is currently selected then the search begins in the row immediately after theselected row if the search direction is forward, or in the row immediately preceeding theselected row if the search direction is backward.
To filter events:, repeat steps 3 - 8 and click the Filter button in the Find dialog box andrepeat the steps 3 - 8. The data in the Trace Data viewer will be filtered to show only thetrace events that match the filter expression.
4.1.2 Exporting Trace Data
To export trace data to a CSV file:
1. Click the Export to CSV button in the Trace Data viewer to display the ExportingTrace Data dialog box.
Figure 4-5. Exporting Trace Data Dialog Box2. Select the Export Full Trace option to export complete trace data to a CSV file else
select Export Partial Trace.3. Specify the begin and end index of the trace data if you have selected the Export
Partial Trace option.4. Click OK.
The Export Trace Data to CSV dialog box appears.
Trace Data
CodeWarrior Development Studio for Microcontrollers Version 10.x Profiling and Analysis Tools UsersGuide, Rev. 10.6, 02/2014
90 Freescale Semiconductor, Inc.
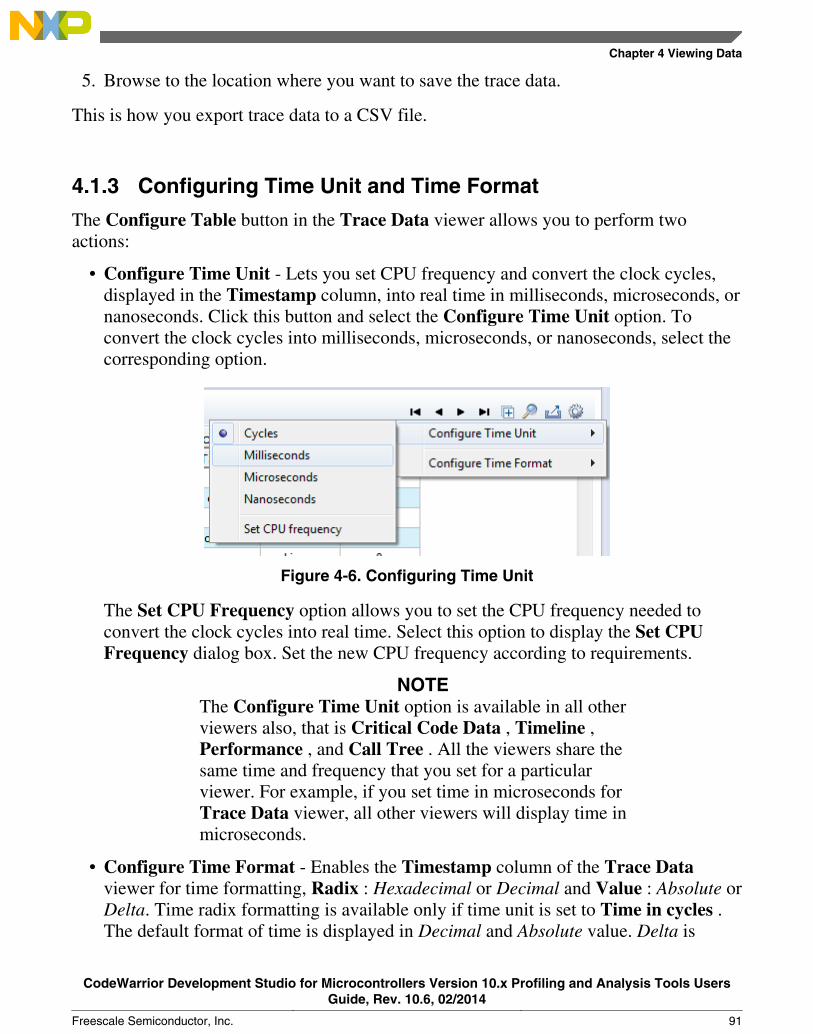
5. Browse to the location where you want to save the trace data.
This is how you export trace data to a CSV file.
4.1.3 Configuring Time Unit and Time Format
The Configure Table button in the Trace Data viewer allows you to perform twoactions:
• Configure Time Unit - Lets you set CPU frequency and convert the clock cycles,displayed in the Timestamp column, into real time in milliseconds, microseconds, ornanoseconds. Click this button and select the Configure Time Unit option. Toconvert the clock cycles into milliseconds, microseconds, or nanoseconds, select thecorresponding option.
Figure 4-6. Configuring Time Unit
The Set CPU Frequency option allows you to set the CPU frequency needed toconvert the clock cycles into real time. Select this option to display the Set CPUFrequency dialog box. Set the new CPU frequency according to requirements.
NOTEThe Configure Time Unit option is available in all otherviewers also, that is Critical Code Data , Timeline ,Performance , and Call Tree . All the viewers share thesame time and frequency that you set for a particularviewer. For example, if you set time in microseconds forTrace Data viewer, all other viewers will display time inmicroseconds.
• Configure Time Format - Enables the Timestamp column of the Trace Dataviewer for time formatting, Radix : Hexadecimal or Decimal and Value : Absolute orDelta. Time radix formatting is available only if time unit is set to Time in cycles .The default format of time is displayed in Decimal and Absolute value. Delta is
Chapter 4 Viewing Data
CodeWarrior Development Studio for Microcontrollers Version 10.x Profiling and Analysis Tools UsersGuide, Rev. 10.6, 02/2014
Freescale Semiconductor, Inc. 91
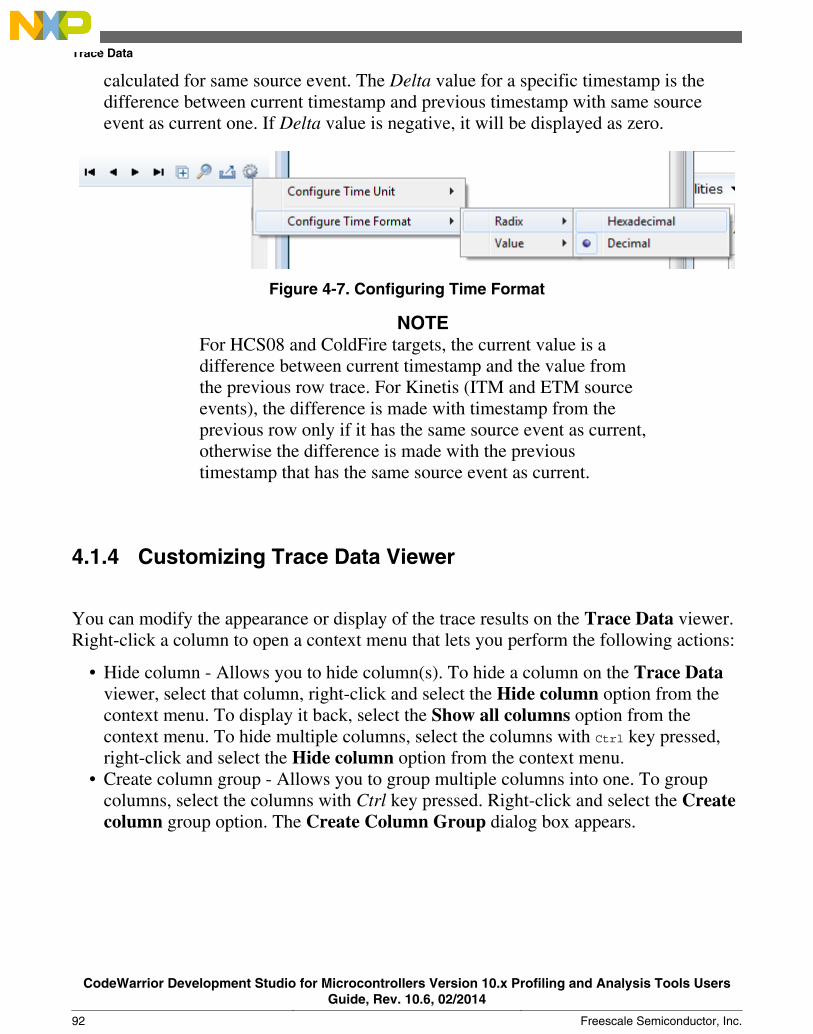
calculated for same source event. The Delta value for a specific timestamp is thedifference between current timestamp and previous timestamp with same sourceevent as current one. If Delta value is negative, it will be displayed as zero.
Figure 4-7. Configuring Time Format
NOTEFor HCS08 and ColdFire targets, the current value is adifference between current timestamp and the value fromthe previous row trace. For Kinetis (ITM and ETM sourceevents), the difference is made with timestamp from theprevious row only if it has the same source event as current,otherwise the difference is made with the previoustimestamp that has the same source event as current.
4.1.4 Customizing Trace Data Viewer
You can modify the appearance or display of the trace results on the Trace Data viewer.Right-click a column to open a context menu that lets you perform the following actions:
• Hide column - Allows you to hide column(s). To hide a column on the Trace Dataviewer, select that column, right-click and select the Hide column option from thecontext menu. To display it back, select the Show all columns option from thecontext menu. To hide multiple columns, select the columns with Ctrl key pressed,right-click and select the Hide column option from the context menu.
• Create column group - Allows you to group multiple columns into one. To groupcolumns, select the columns with Ctrl key pressed. Right-click and select the Createcolumn group option. The Create Column Group dialog box appears.
Trace Data
CodeWarrior Development Studio for Microcontrollers Version 10.x Profiling and Analysis Tools UsersGuide, Rev. 10.6, 02/2014
92 Freescale Semiconductor, Inc.
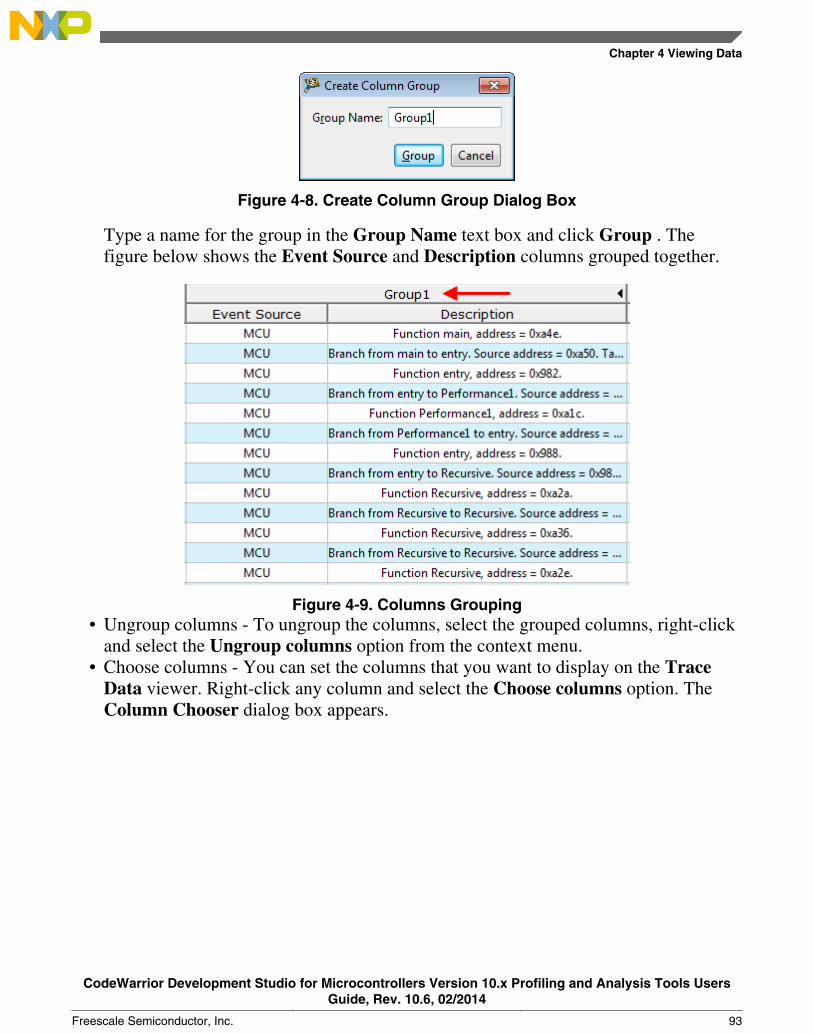
Figure 4-8. Create Column Group Dialog Box
Type a name for the group in the Group Name text box and click Group . Thefigure below shows the Event Source and Description columns grouped together.
Figure 4-9. Columns Grouping• Ungroup columns - To ungroup the columns, select the grouped columns, right-click
and select the Ungroup columns option from the context menu.• Choose columns - You can set the columns that you want to display on the Trace
Data viewer. Right-click any column and select the Choose columns option. TheColumn Chooser dialog box appears.
Chapter 4 Viewing Data
CodeWarrior Development Studio for Microcontrollers Version 10.x Profiling and Analysis Tools UsersGuide, Rev. 10.6, 02/2014
Freescale Semiconductor, Inc. 93
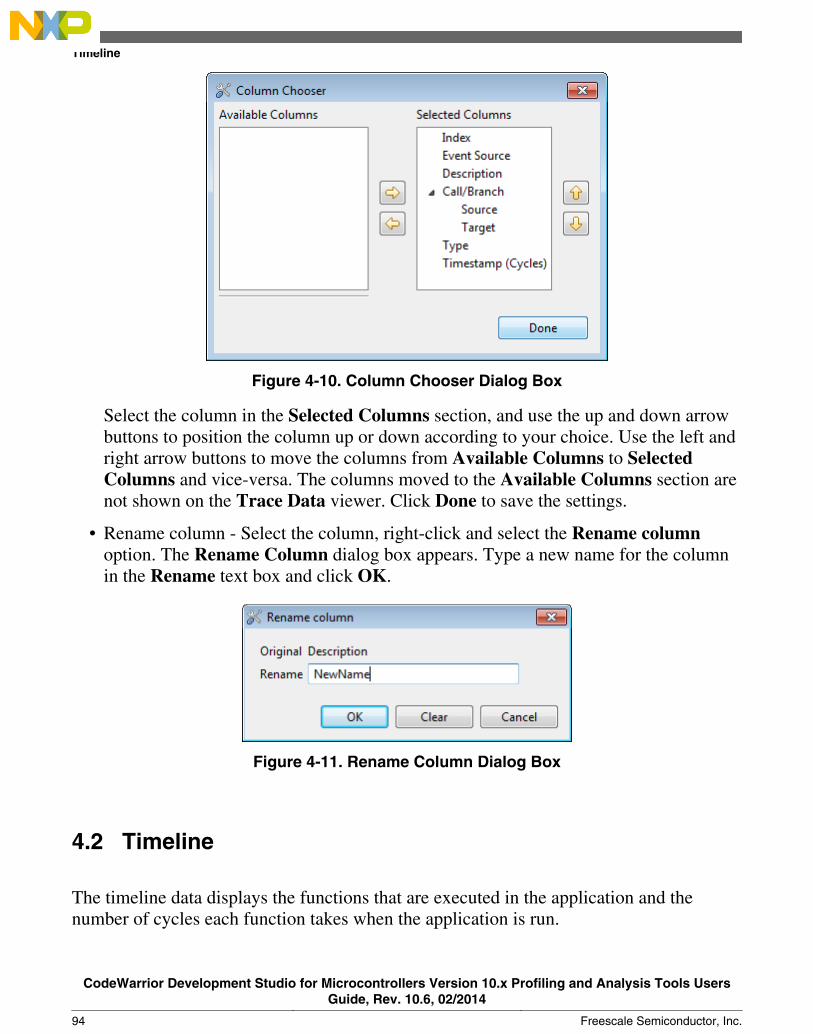
Figure 4-10. Column Chooser Dialog Box
Select the column in the Selected Columns section, and use the up and down arrowbuttons to position the column up or down according to your choice. Use the left andright arrow buttons to move the columns from Available Columns to SelectedColumns and vice-versa. The columns moved to the Available Columns section arenot shown on the Trace Data viewer. Click Done to save the settings.
• Rename column - Select the column, right-click and select the Rename columnoption. The Rename Column dialog box appears. Type a new name for the columnin the Rename text box and click OK.
Figure 4-11. Rename Column Dialog Box
4.2 Timeline
The timeline data displays the functions that are executed in the application and thenumber of cycles each function takes when the application is run.
Timeline
CodeWarrior Development Studio for Microcontrollers Version 10.x Profiling and Analysis Tools UsersGuide, Rev. 10.6, 02/2014
94 Freescale Semiconductor, Inc.
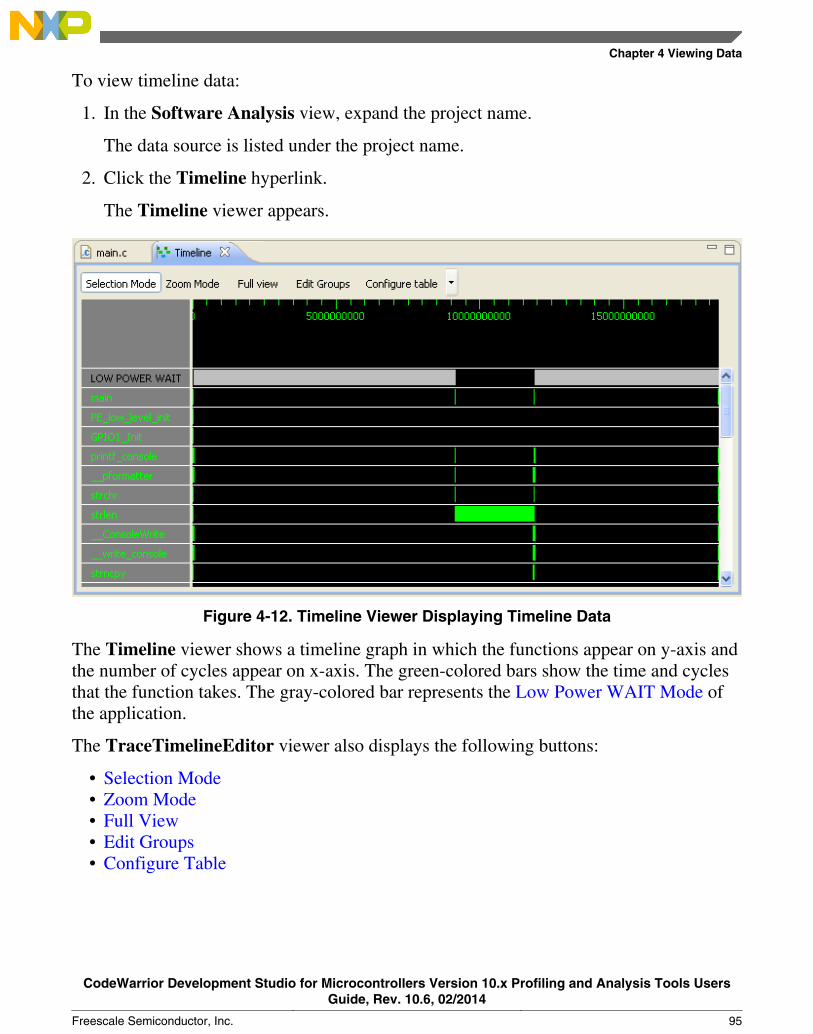
To view timeline data:
1. In the Software Analysis view, expand the project name.
The data source is listed under the project name.
2. Click the Timeline hyperlink.
The Timeline viewer appears.
Figure 4-12. Timeline Viewer Displaying Timeline Data
The Timeline viewer shows a timeline graph in which the functions appear on y-axis andthe number of cycles appear on x-axis. The green-colored bars show the time and cyclesthat the function takes. The gray-colored bar represents the Low Power WAIT Mode ofthe application.
The TraceTimelineEditor viewer also displays the following buttons:
• Selection Mode• Zoom Mode• Full View• Edit Groups• Configure Table
Chapter 4 Viewing Data
CodeWarrior Development Studio for Microcontrollers Version 10.x Profiling and Analysis Tools UsersGuide, Rev. 10.6, 02/2014
Freescale Semiconductor, Inc. 95
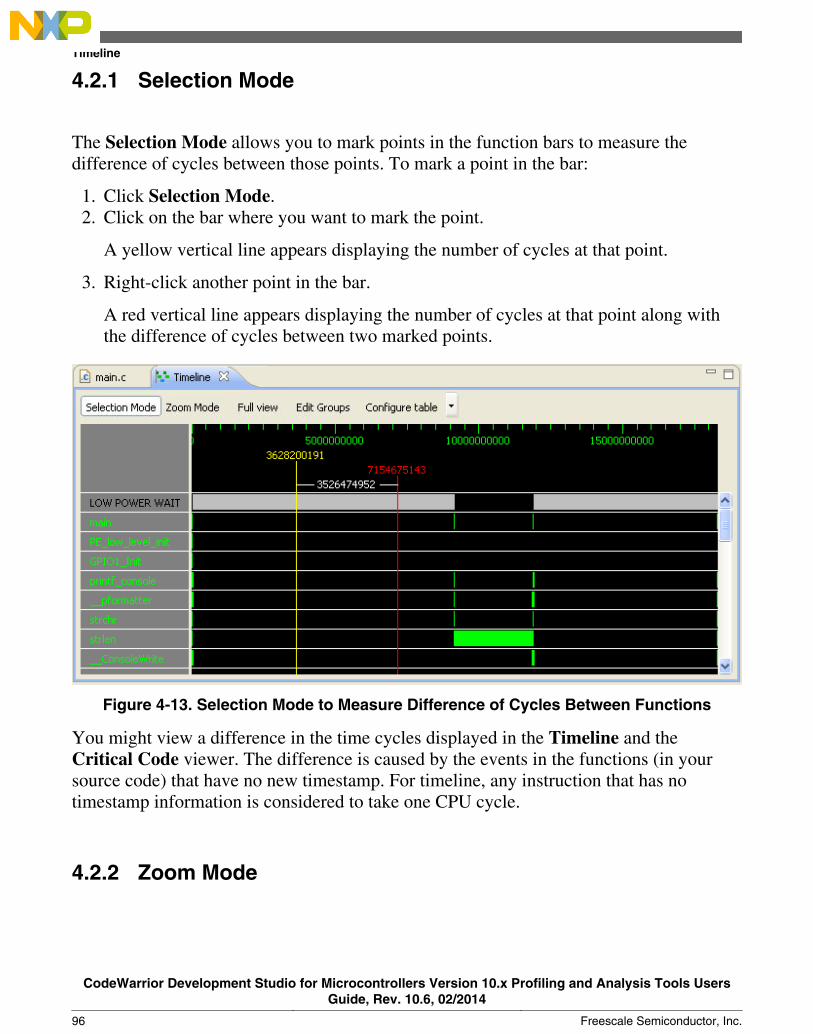
4.2.1 Selection Mode
The Selection Mode allows you to mark points in the function bars to measure thedifference of cycles between those points. To mark a point in the bar:
1. Click Selection Mode.2. Click on the bar where you want to mark the point.
A yellow vertical line appears displaying the number of cycles at that point.
3. Right-click another point in the bar.
A red vertical line appears displaying the number of cycles at that point along withthe difference of cycles between two marked points.
Figure 4-13. Selection Mode to Measure Difference of Cycles Between Functions
You might view a difference in the time cycles displayed in the Timeline and theCritical Code viewer. The difference is caused by the events in the functions (in yoursource code) that have no new timestamp. For timeline, any instruction that has notimestamp information is considered to take one CPU cycle.
4.2.2 Zoom Mode
Timeline
CodeWarrior Development Studio for Microcontrollers Version 10.x Profiling and Analysis Tools UsersGuide, Rev. 10.6, 02/2014
96 Freescale Semiconductor, Inc.
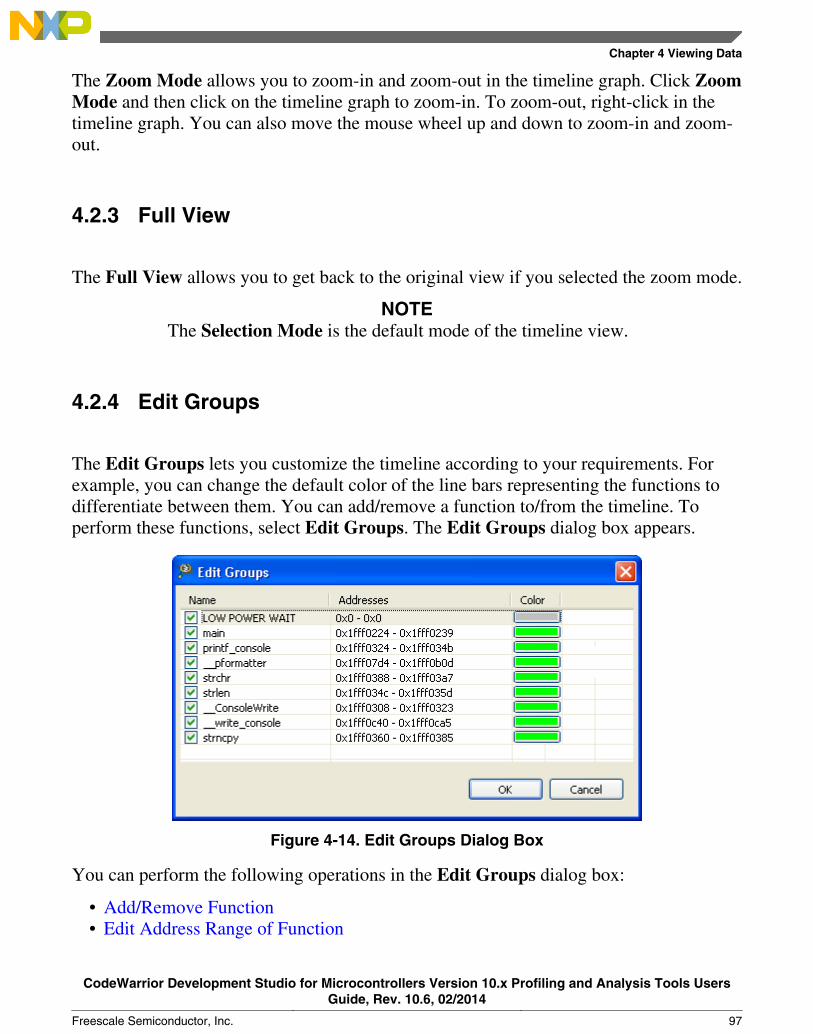
The Zoom Mode allows you to zoom-in and zoom-out in the timeline graph. Click ZoomMode and then click on the timeline graph to zoom-in. To zoom-out, right-click in thetimeline graph. You can also move the mouse wheel up and down to zoom-in and zoom-out.
4.2.3 Full View
The Full View allows you to get back to the original view if you selected the zoom mode.
NOTEThe Selection Mode is the default mode of the timeline view.
4.2.4 Edit Groups
The Edit Groups lets you customize the timeline according to your requirements. Forexample, you can change the default color of the line bars representing the functions todifferentiate between them. You can add/remove a function to/from the timeline. Toperform these functions, select Edit Groups. The Edit Groups dialog box appears.
Figure 4-14. Edit Groups Dialog Box
You can perform the following operations in the Edit Groups dialog box:
• Add/Remove Function• Edit Address Range of Function
Chapter 4 Viewing Data
CodeWarrior Development Studio for Microcontrollers Version 10.x Profiling and Analysis Tools UsersGuide, Rev. 10.6, 02/2014
Freescale Semiconductor, Inc. 97
• Change Color• Add/Remove Group• Merge Groups/Functions
4.2.4.1 Add/Remove Function
Right-click the function name in the Name column, and select Insert Function or pressCtrl+F to add a function. Select Delete Selected from the context menu to delete thefunction from the graph. You can disable a function from the graph by clearing thecorresponding checkbox in the Name column. Check it again to include it in the graph.
4.2.4.2 Edit Address Range of Function
1. Select the function of which you want to change the address range.2. Double-click the cell of the Addresses column of the selected function.
The cell becomes editable.
3. Type an address range for the group/function in the cell.
You can specify multiple address ranges to a function. The multiple address ranges areseparated by a comma.
4.2.4.3 Change Color
You can change the color of a function displayed as a horizontal bar in the timelinegraph. Click the Color column of the corresponding function, and select the color of yourchoice from the Color window that appears.
4.2.4.4 Add/Remove Group
A group is a range of addresses. In case, you want to view trace of a part of a functiononly, for example, for loop, you can find the addresses of the loop and create a group forthose addresses.
To add a group:
Timeline
CodeWarrior Development Studio for Microcontrollers Version 10.x Profiling and Analysis Tools UsersGuide, Rev. 10.6, 02/2014
98 Freescale Semiconductor, Inc.
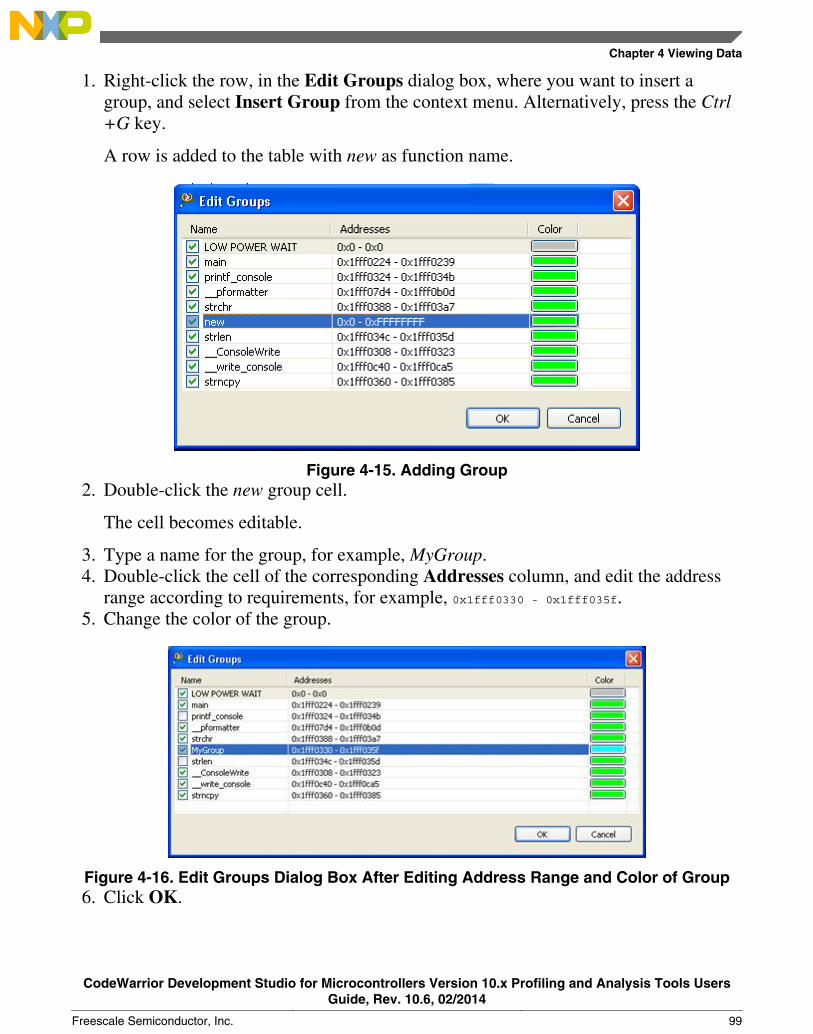
1. Right-click the row, in the Edit Groups dialog box, where you want to insert agroup, and select Insert Group from the context menu. Alternatively, press the Ctrl+G key.
A row is added to the table with new as function name.
Figure 4-15. Adding Group2. Double-click the new group cell.
The cell becomes editable.
3. Type a name for the group, for example, MyGroup.4. Double-click the cell of the corresponding Addresses column, and edit the address
range according to requirements, for example, 0x1fff0330 - 0x1fff035f.5. Change the color of the group.
Figure 4-16. Edit Groups Dialog Box After Editing Address Range and Color of Group6. Click OK.
Chapter 4 Viewing Data
CodeWarrior Development Studio for Microcontrollers Version 10.x Profiling and Analysis Tools UsersGuide, Rev. 10.6, 02/2014
Freescale Semiconductor, Inc. 99
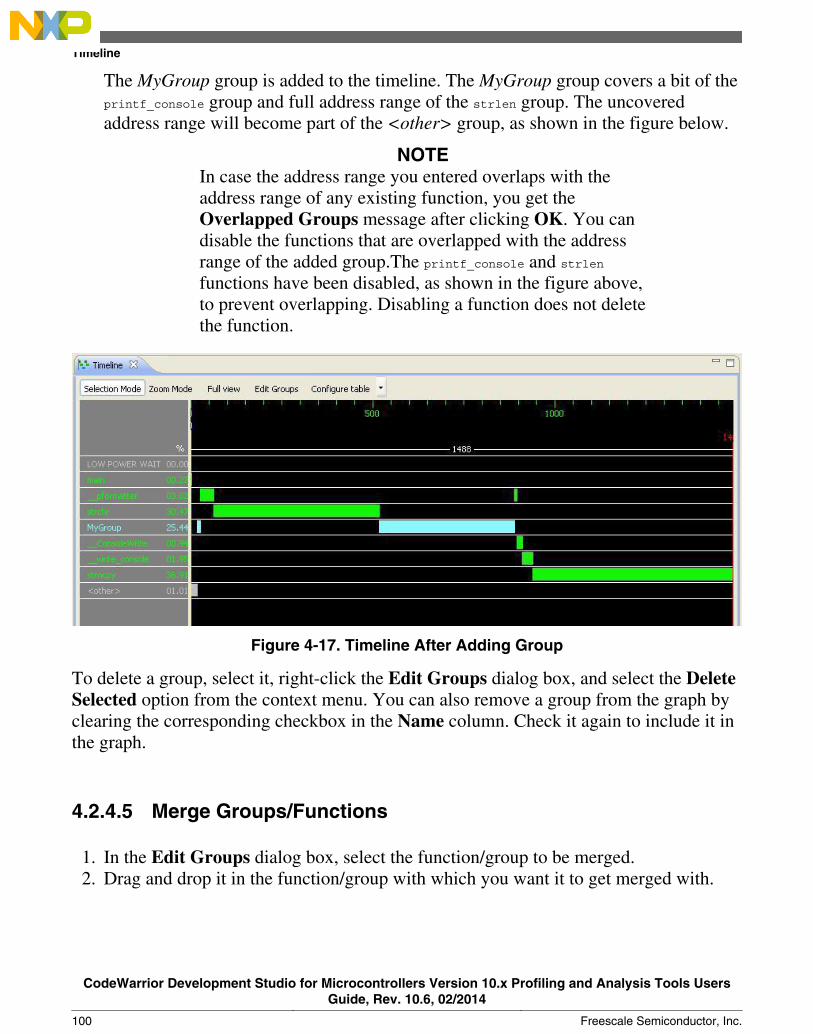
The MyGroup group is added to the timeline. The MyGroup group covers a bit of theprintf_console group and full address range of the strlen group. The uncoveredaddress range will become part of the <other> group, as shown in the figure below.
NOTEIn case the address range you entered overlaps with theaddress range of any existing function, you get theOverlapped Groups message after clicking OK. You candisable the functions that are overlapped with the addressrange of the added group.The printf_console and strlenfunctions have been disabled, as shown in the figure above,to prevent overlapping. Disabling a function does not deletethe function.
Figure 4-17. Timeline After Adding Group
To delete a group, select it, right-click the Edit Groups dialog box, and select the DeleteSelected option from the context menu. You can also remove a group from the graph byclearing the corresponding checkbox in the Name column. Check it again to include it inthe graph.
4.2.4.5 Merge Groups/Functions
1. In the Edit Groups dialog box, select the function/group to be merged.2. Drag and drop it in the function/group with which you want it to get merged with.
Timeline
CodeWarrior Development Studio for Microcontrollers Version 10.x Profiling and Analysis Tools UsersGuide, Rev. 10.6, 02/2014
100 Freescale Semiconductor, Inc.
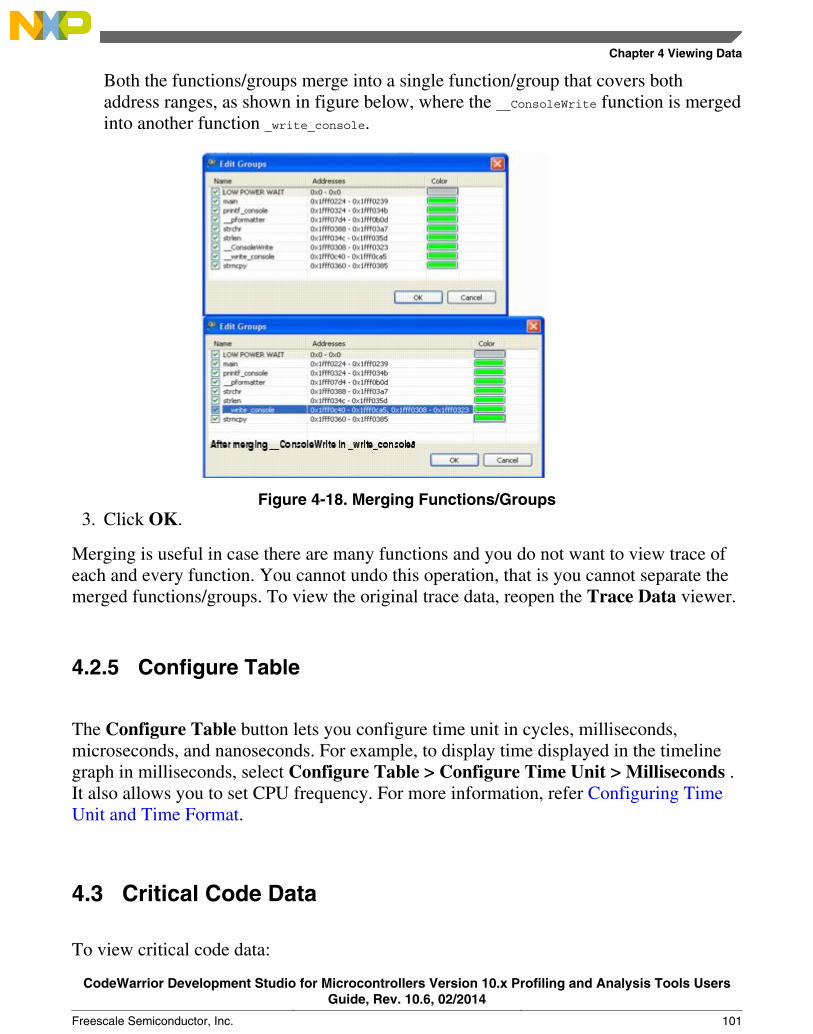
Both the functions/groups merge into a single function/group that covers bothaddress ranges, as shown in figure below, where the __ConsoleWrite function is mergedinto another function _write_console.
Figure 4-18. Merging Functions/Groups3. Click OK.
Merging is useful in case there are many functions and you do not want to view trace ofeach and every function. You cannot undo this operation, that is you cannot separate themerged functions/groups. To view the original trace data, reopen the Trace Data viewer.
4.2.5 Configure Table
The Configure Table button lets you configure time unit in cycles, milliseconds,microseconds, and nanoseconds. For example, to display time displayed in the timelinegraph in milliseconds, select Configure Table > Configure Time Unit > Milliseconds .It also allows you to set CPU frequency. For more information, refer Configuring TimeUnit and Time Format.
4.3 Critical Code Data
To view critical code data:
Chapter 4 Viewing Data
CodeWarrior Development Studio for Microcontrollers Version 10.x Profiling and Analysis Tools UsersGuide, Rev. 10.6, 02/2014
Freescale Semiconductor, Inc. 101
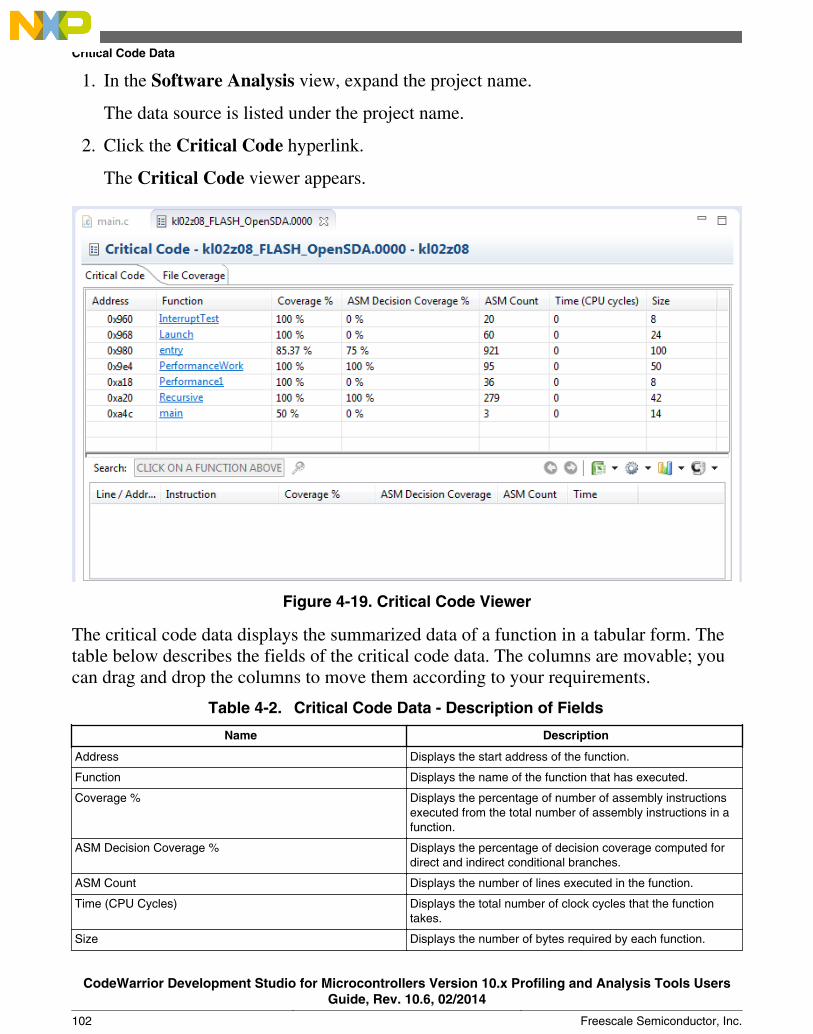
1. In the Software Analysis view, expand the project name.
The data source is listed under the project name.
2. Click the Critical Code hyperlink.
The Critical Code viewer appears.
Figure 4-19. Critical Code Viewer
The critical code data displays the summarized data of a function in a tabular form. Thetable below describes the fields of the critical code data. The columns are movable; youcan drag and drop the columns to move them according to your requirements.
Table 4-2. Critical Code Data - Description of Fields
Name Description
Address Displays the start address of the function.
Function Displays the name of the function that has executed.
Coverage % Displays the percentage of number of assembly instructionsexecuted from the total number of assembly instructions in afunction.
ASM Decision Coverage % Displays the percentage of decision coverage computed fordirect and indirect conditional branches.
ASM Count Displays the number of lines executed in the function.
Time (CPU Cycles) Displays the total number of clock cycles that the functiontakes.
Size Displays the number of bytes required by each function.
Critical Code Data
CodeWarrior Development Studio for Microcontrollers Version 10.x Profiling and Analysis Tools UsersGuide, Rev. 10.6, 02/2014
102 Freescale Semiconductor, Inc.
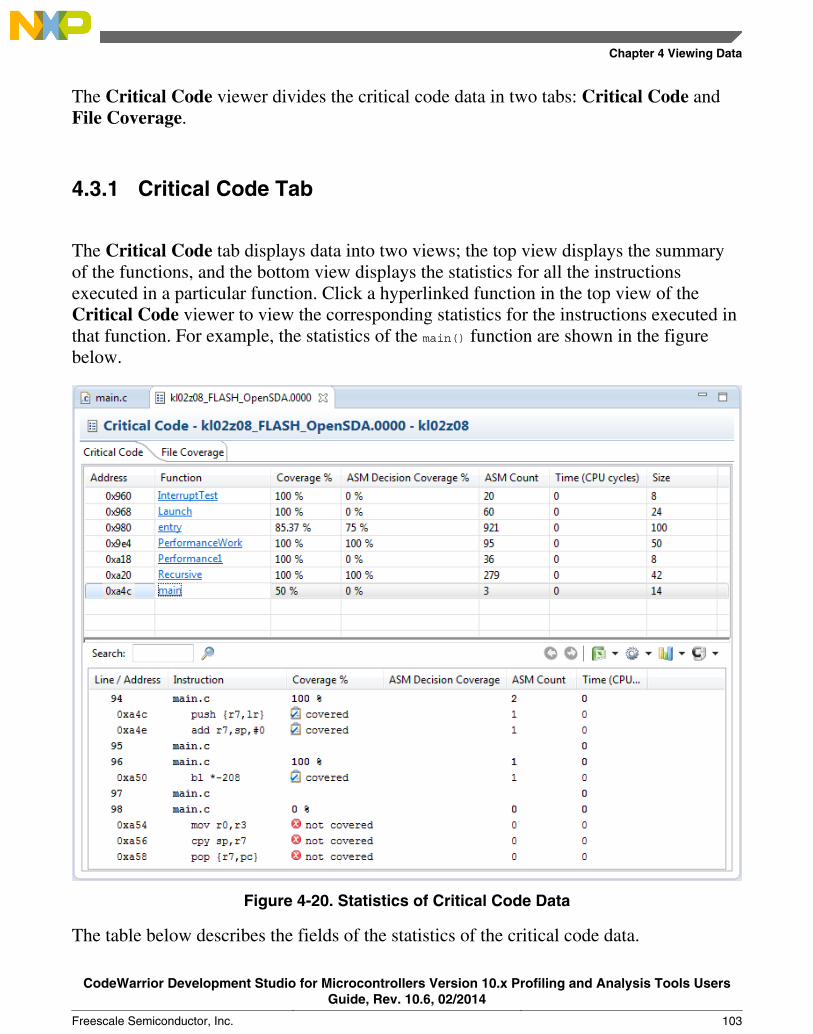
The Critical Code viewer divides the critical code data in two tabs: Critical Code andFile Coverage.
4.3.1 Critical Code Tab
The Critical Code tab displays data into two views; the top view displays the summaryof the functions, and the bottom view displays the statistics for all the instructionsexecuted in a particular function. Click a hyperlinked function in the top view of theCritical Code viewer to view the corresponding statistics for the instructions executed inthat function. For example, the statistics of the main() function are shown in the figurebelow.
Figure 4-20. Statistics of Critical Code Data
The table below describes the fields of the statistics of the critical code data.
Chapter 4 Viewing Data
CodeWarrior Development Studio for Microcontrollers Version 10.x Profiling and Analysis Tools UsersGuide, Rev. 10.6, 02/2014
Freescale Semiconductor, Inc. 103
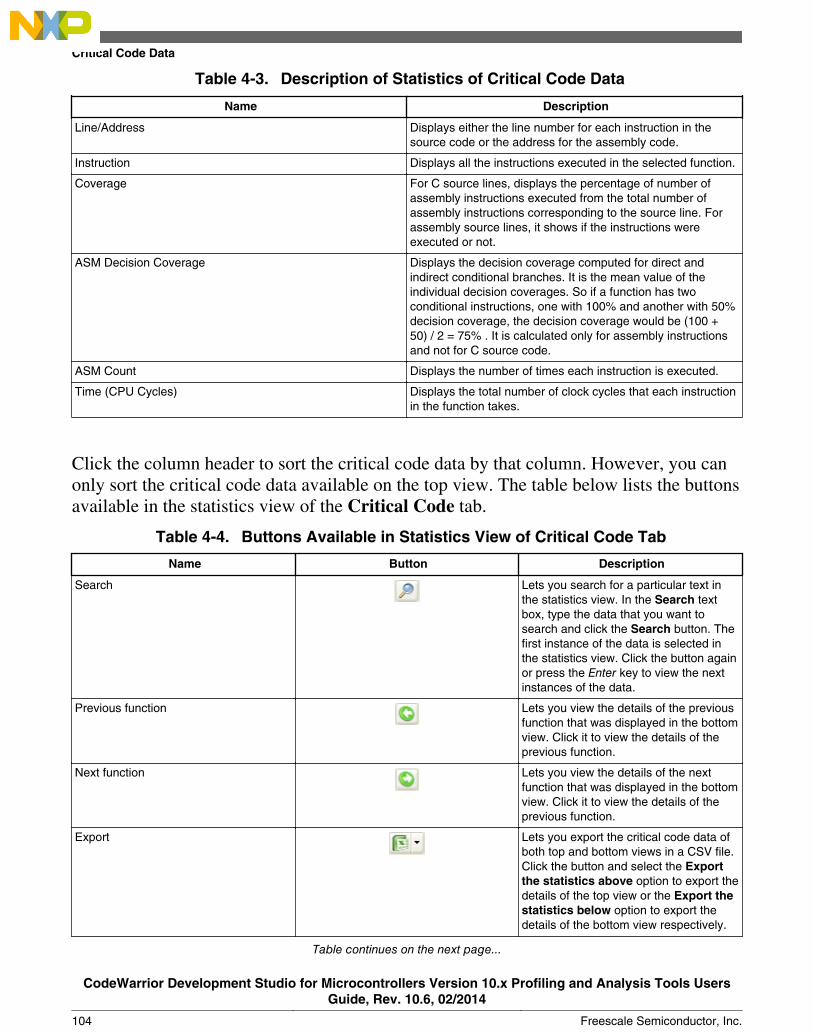
Table 4-3. Description of Statistics of Critical Code Data
Name Description
Line/Address Displays either the line number for each instruction in thesource code or the address for the assembly code.
Instruction Displays all the instructions executed in the selected function.
Coverage For C source lines, displays the percentage of number ofassembly instructions executed from the total number ofassembly instructions corresponding to the source line. Forassembly source lines, it shows if the instructions wereexecuted or not.
ASM Decision Coverage Displays the decision coverage computed for direct andindirect conditional branches. It is the mean value of theindividual decision coverages. So if a function has twoconditional instructions, one with 100% and another with 50%decision coverage, the decision coverage would be (100 +50) / 2 = 75% . It is calculated only for assembly instructionsand not for C source code.
ASM Count Displays the number of times each instruction is executed.
Time (CPU Cycles) Displays the total number of clock cycles that each instructionin the function takes.
Click the column header to sort the critical code data by that column. However, you canonly sort the critical code data available on the top view. The table below lists the buttonsavailable in the statistics view of the Critical Code tab.
Table 4-4. Buttons Available in Statistics View of Critical Code Tab
Name Button Description
Search Lets you search for a particular text inthe statistics view. In the Search textbox, type the data that you want tosearch and click the Search button. Thefirst instance of the data is selected inthe statistics view. Click the button againor press the Enter key to view the nextinstances of the data.
Previous function Lets you view the details of the previousfunction that was displayed in the bottomview. Click it to view the details of theprevious function.
Next function Lets you view the details of the nextfunction that was displayed in the bottomview. Click it to view the details of theprevious function.
Export Lets you export the critical code data ofboth top and bottom views in a CSV file.Click the button and select the Exportthe statistics above option to export thedetails of the top view or the Export thestatistics below option to export thedetails of the bottom view respectively.
Table continues on the next page...
Critical Code Data
CodeWarrior Development Studio for Microcontrollers Version 10.x Profiling and Analysis Tools UsersGuide, Rev. 10.6, 02/2014
104 Freescale Semiconductor, Inc.
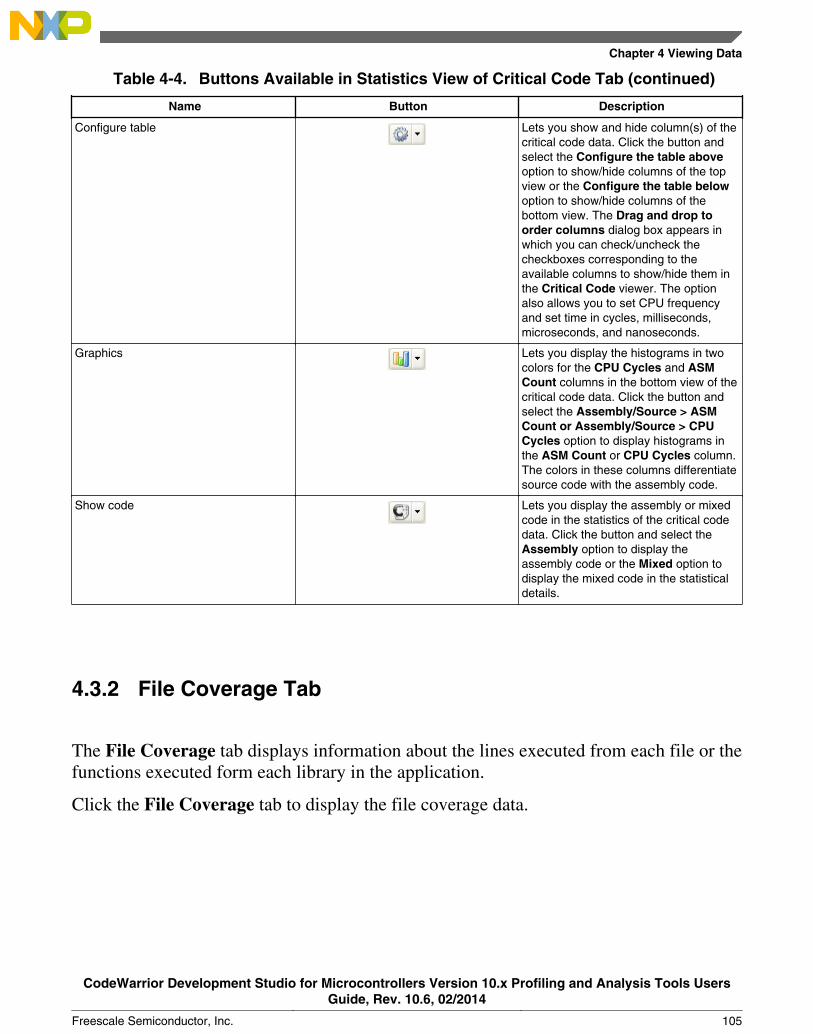
Table 4-4. Buttons Available in Statistics View of Critical Code Tab (continued)
Name Button Description
Configure table Lets you show and hide column(s) of thecritical code data. Click the button andselect the Configure the table aboveoption to show/hide columns of the topview or the Configure the table belowoption to show/hide columns of thebottom view. The Drag and drop toorder columns dialog box appears inwhich you can check/uncheck thecheckboxes corresponding to theavailable columns to show/hide them inthe Critical Code viewer. The optionalso allows you to set CPU frequencyand set time in cycles, milliseconds,microseconds, and nanoseconds.
Graphics Lets you display the histograms in twocolors for the CPU Cycles and ASMCount columns in the bottom view of thecritical code data. Click the button andselect the Assembly/Source > ASMCount or Assembly/Source > CPUCycles option to display histograms inthe ASM Count or CPU Cycles column.The colors in these columns differentiatesource code with the assembly code.
Show code Lets you display the assembly or mixedcode in the statistics of the critical codedata. Click the button and select theAssembly option to display theassembly code or the Mixed option todisplay the mixed code in the statisticaldetails.
4.3.2 File Coverage Tab
The File Coverage tab displays information about the lines executed from each file or thefunctions executed form each library in the application.
Click the File Coverage tab to display the file coverage data.
Chapter 4 Viewing Data
CodeWarrior Development Studio for Microcontrollers Version 10.x Profiling and Analysis Tools UsersGuide, Rev. 10.6, 02/2014
Freescale Semiconductor, Inc. 105
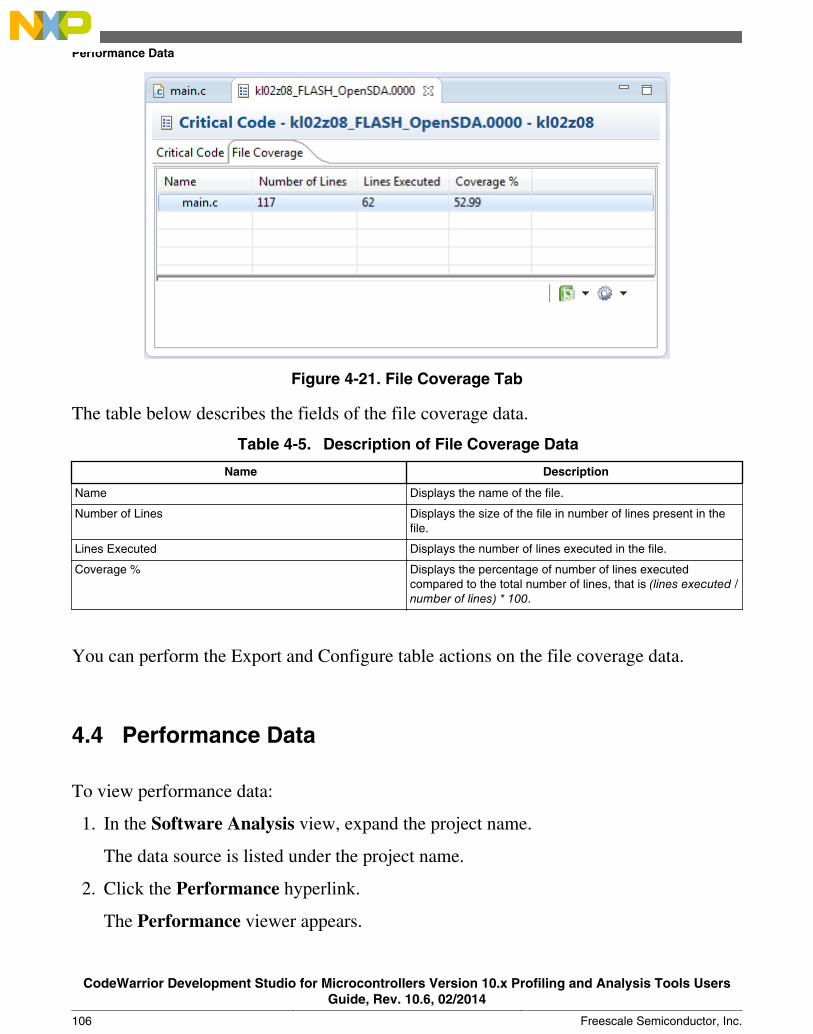
Figure 4-21. File Coverage Tab
The table below describes the fields of the file coverage data.
Table 4-5. Description of File Coverage Data
Name Description
Name Displays the name of the file.
Number of Lines Displays the size of the file in number of lines present in thefile.
Lines Executed Displays the number of lines executed in the file.
Coverage % Displays the percentage of number of lines executedcompared to the total number of lines, that is (lines executed /number of lines) * 100.
You can perform the Export and Configure table actions on the file coverage data.
4.4 Performance Data
To view performance data:
1. In the Software Analysis view, expand the project name.
The data source is listed under the project name.
2. Click the Performance hyperlink.
The Performance viewer appears.
Performance Data
CodeWarrior Development Studio for Microcontrollers Version 10.x Profiling and Analysis Tools UsersGuide, Rev. 10.6, 02/2014
106 Freescale Semiconductor, Inc.
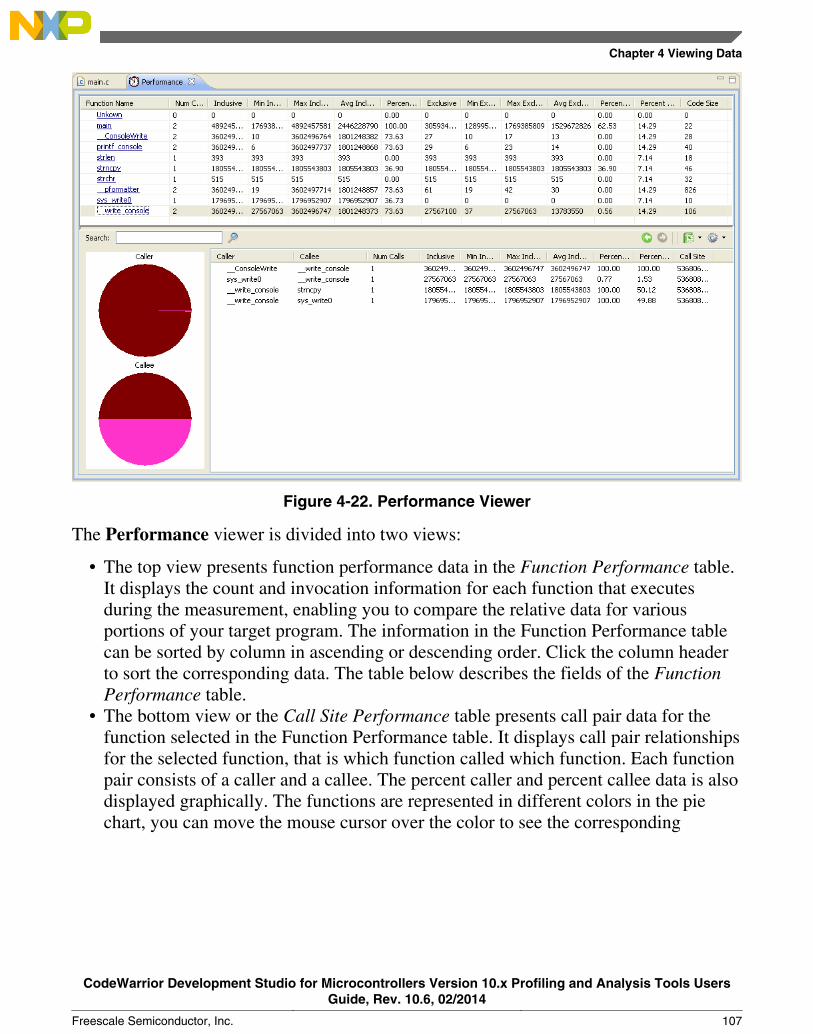
Figure 4-22. Performance Viewer
The Performance viewer is divided into two views:
• The top view presents function performance data in the Function Performance table.It displays the count and invocation information for each function that executesduring the measurement, enabling you to compare the relative data for variousportions of your target program. The information in the Function Performance tablecan be sorted by column in ascending or descending order. Click the column headerto sort the corresponding data. The table below describes the fields of the FunctionPerformance table.
• The bottom view or the Call Site Performance table presents call pair data for thefunction selected in the Function Performance table. It displays call pair relationshipsfor the selected function, that is which function called which function. Each functionpair consists of a caller and a callee. The percent caller and percent callee data is alsodisplayed graphically. The functions are represented in different colors in the piechart, you can move the mouse cursor over the color to see the corresponding
Chapter 4 Viewing Data
CodeWarrior Development Studio for Microcontrollers Version 10.x Profiling and Analysis Tools UsersGuide, Rev. 10.6, 02/2014
Freescale Semiconductor, Inc. 107
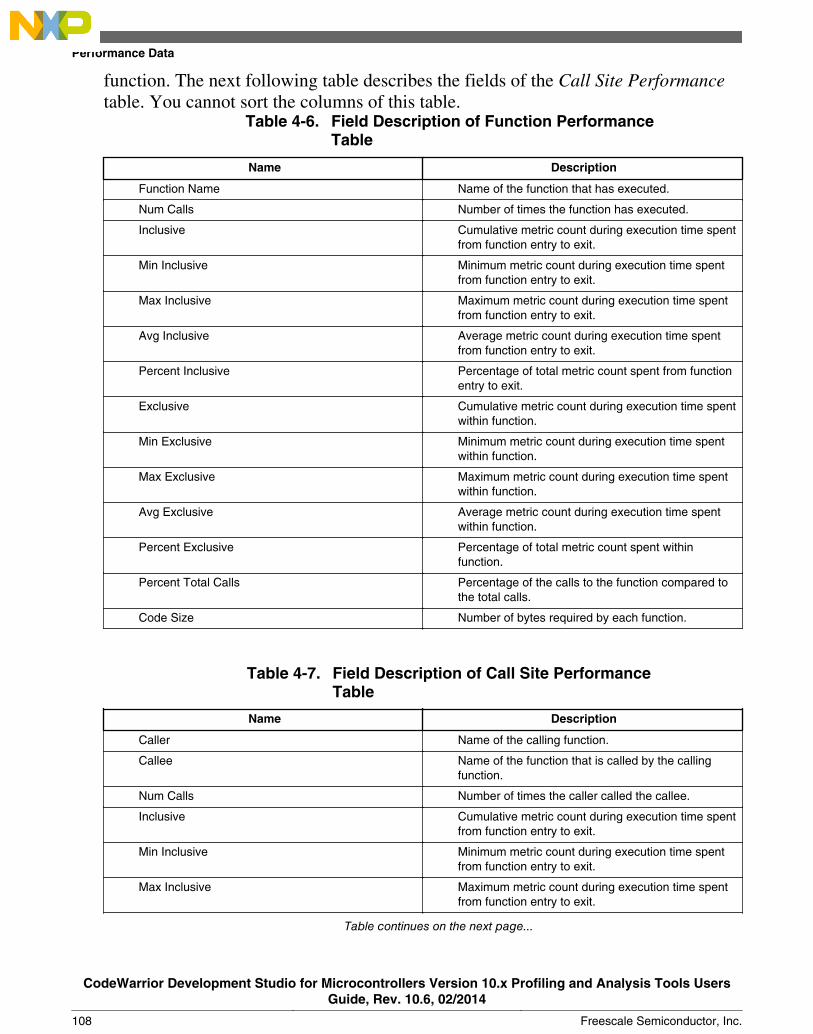
function. The next following table describes the fields of the Call Site Performancetable. You cannot sort the columns of this table.
Table 4-6. Field Description of Function PerformanceTable
Name Description
Function Name Name of the function that has executed.
Num Calls Number of times the function has executed.
Inclusive Cumulative metric count during execution time spentfrom function entry to exit.
Min Inclusive Minimum metric count during execution time spentfrom function entry to exit.
Max Inclusive Maximum metric count during execution time spentfrom function entry to exit.
Avg Inclusive Average metric count during execution time spentfrom function entry to exit.
Percent Inclusive Percentage of total metric count spent from functionentry to exit.
Exclusive Cumulative metric count during execution time spentwithin function.
Min Exclusive Minimum metric count during execution time spentwithin function.
Max Exclusive Maximum metric count during execution time spentwithin function.
Avg Exclusive Average metric count during execution time spentwithin function.
Percent Exclusive Percentage of total metric count spent withinfunction.
Percent Total Calls Percentage of the calls to the function compared tothe total calls.
Code Size Number of bytes required by each function.
Table 4-7. Field Description of Call Site PerformanceTable
Name Description
Caller Name of the calling function.
Callee Name of the function that is called by the callingfunction.
Num Calls Number of times the caller called the callee.
Inclusive Cumulative metric count during execution time spentfrom function entry to exit.
Min Inclusive Minimum metric count during execution time spentfrom function entry to exit.
Max Inclusive Maximum metric count during execution time spentfrom function entry to exit.
Table continues on the next page...
Performance Data
CodeWarrior Development Studio for Microcontrollers Version 10.x Profiling and Analysis Tools UsersGuide, Rev. 10.6, 02/2014
108 Freescale Semiconductor, Inc.

Table 4-7. Field Description of Call Site Performance Table(continued)
Name Description
Avg Inclusive Average metric count during execution time spentfrom function entry to exit.
Percent Callee Percent of total metric count during the time theselected function is the caller of a specific callee.The data is also shown in the Caller pie chart.
Percent Caller Percent of total metric count during the time theselected function is the callee of a specific caller.The data is also shown in the Callee pie chart.
Call Site Address from where the function was called.
You can move the columns to the left or right of another column depending on yourrequirements by dragging and dropping. You can perform the Export and Configure tableactions on the performance data similar to critical code data. You can also view theprevious and next functions of the performance data using the icons available in the lowersection of the Performance viewer.
4.5 Call Tree
To view call tree data:
1. In the Software Analysis view, expand the project name.
The data source is listed under the project name.
2. Click the Call Tree hyperlink.
The Call Tree viewer appears.
Chapter 4 Viewing Data
CodeWarrior Development Studio for Microcontrollers Version 10.x Profiling and Analysis Tools UsersGuide, Rev. 10.6, 02/2014
Freescale Semiconductor, Inc. 109
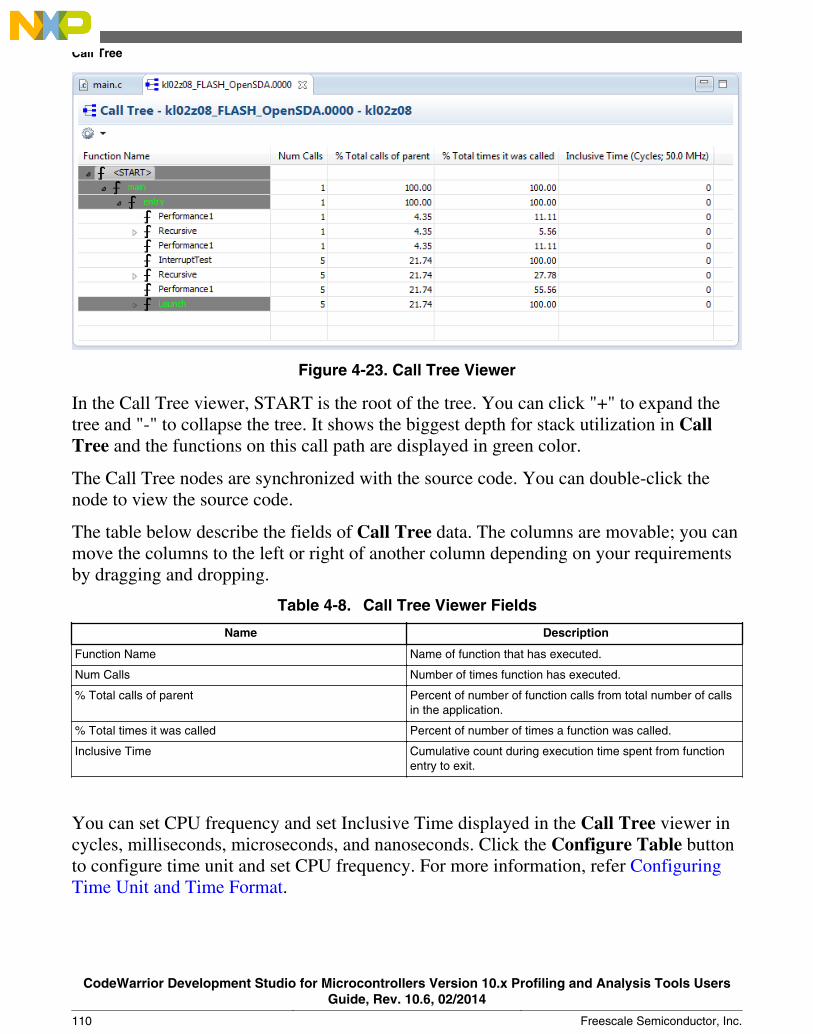
Figure 4-23. Call Tree Viewer
In the Call Tree viewer, START is the root of the tree. You can click "+" to expand thetree and "-" to collapse the tree. It shows the biggest depth for stack utilization in CallTree and the functions on this call path are displayed in green color.
The Call Tree nodes are synchronized with the source code. You can double-click thenode to view the source code.
The table below describe the fields of Call Tree data. The columns are movable; you canmove the columns to the left or right of another column depending on your requirementsby dragging and dropping.
Table 4-8. Call Tree Viewer Fields
Name Description
Function Name Name of function that has executed.
Num Calls Number of times function has executed.
% Total calls of parent Percent of number of function calls from total number of callsin the application.
% Total times it was called Percent of number of times a function was called.
Inclusive Time Cumulative count during execution time spent from functionentry to exit.
You can set CPU frequency and set Inclusive Time displayed in the Call Tree viewer incycles, milliseconds, microseconds, and nanoseconds. Click the Configure Table buttonto configure time unit and set CPU frequency. For more information, refer ConfiguringTime Unit and Time Format.
Call Tree
CodeWarrior Development Studio for Microcontrollers Version 10.x Profiling and Analysis Tools UsersGuide, Rev. 10.6, 02/2014
110 Freescale Semiconductor, Inc.
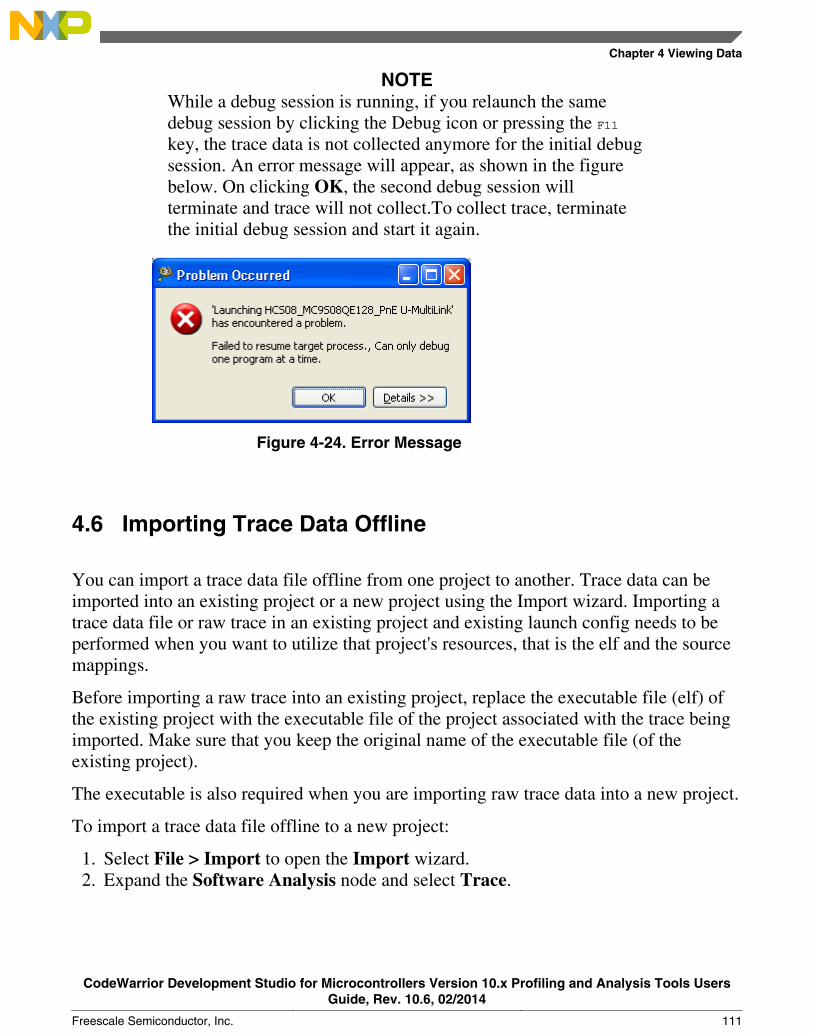
NOTEWhile a debug session is running, if you relaunch the samedebug session by clicking the Debug icon or pressing the F11key, the trace data is not collected anymore for the initial debugsession. An error message will appear, as shown in the figurebelow. On clicking OK, the second debug session willterminate and trace will not collect.To collect trace, terminatethe initial debug session and start it again.
Figure 4-24. Error Message
4.6 Importing Trace Data Offline
You can import a trace data file offline from one project to another. Trace data can beimported into an existing project or a new project using the Import wizard. Importing atrace data file or raw trace in an existing project and existing launch config needs to beperformed when you want to utilize that project's resources, that is the elf and the sourcemappings.
Before importing a raw trace into an existing project, replace the executable file (elf) ofthe existing project with the executable file of the project associated with the trace beingimported. Make sure that you keep the original name of the executable file (of theexisting project).
The executable is also required when you are importing raw trace data into a new project.
To import a trace data file offline to a new project:
1. Select File > Import to open the Import wizard.2. Expand the Software Analysis node and select Trace.
Chapter 4 Viewing Data
CodeWarrior Development Studio for Microcontrollers Version 10.x Profiling and Analysis Tools UsersGuide, Rev. 10.6, 02/2014
Freescale Semiconductor, Inc. 111
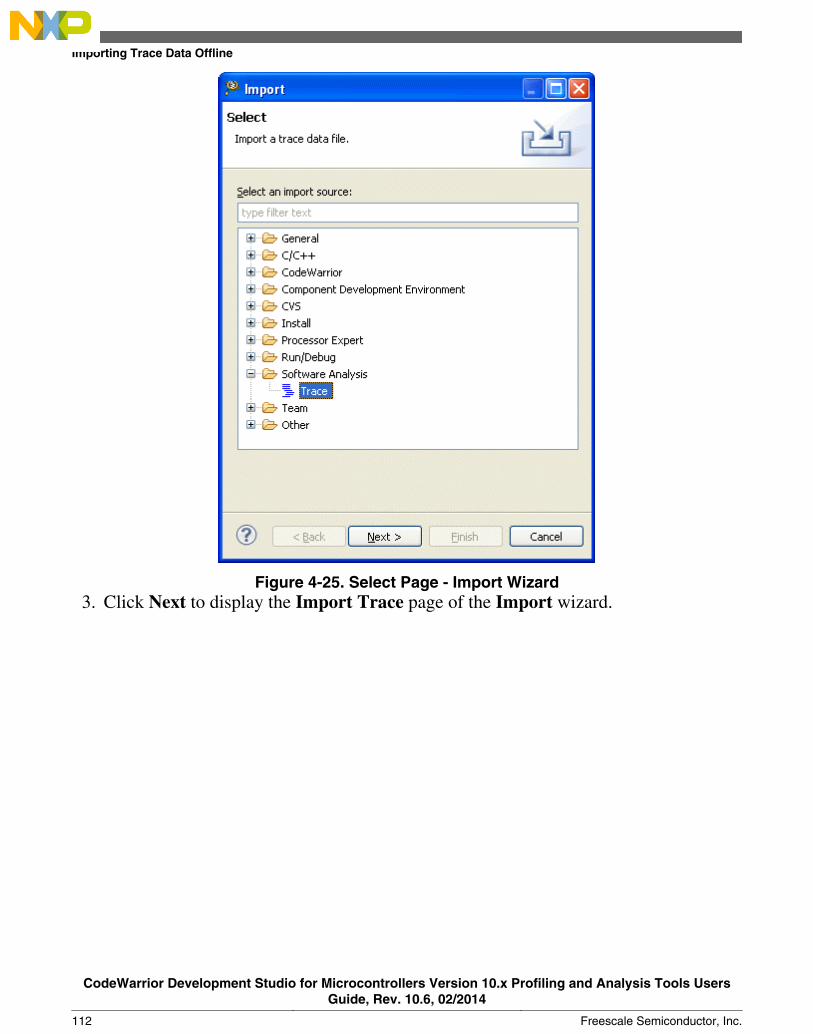
Figure 4-25. Select Page - Import Wizard3. Click Next to display the Import Trace page of the Import wizard.
Importing Trace Data Offline
CodeWarrior Development Studio for Microcontrollers Version 10.x Profiling and Analysis Tools UsersGuide, Rev. 10.6, 02/2014
112 Freescale Semiconductor, Inc.
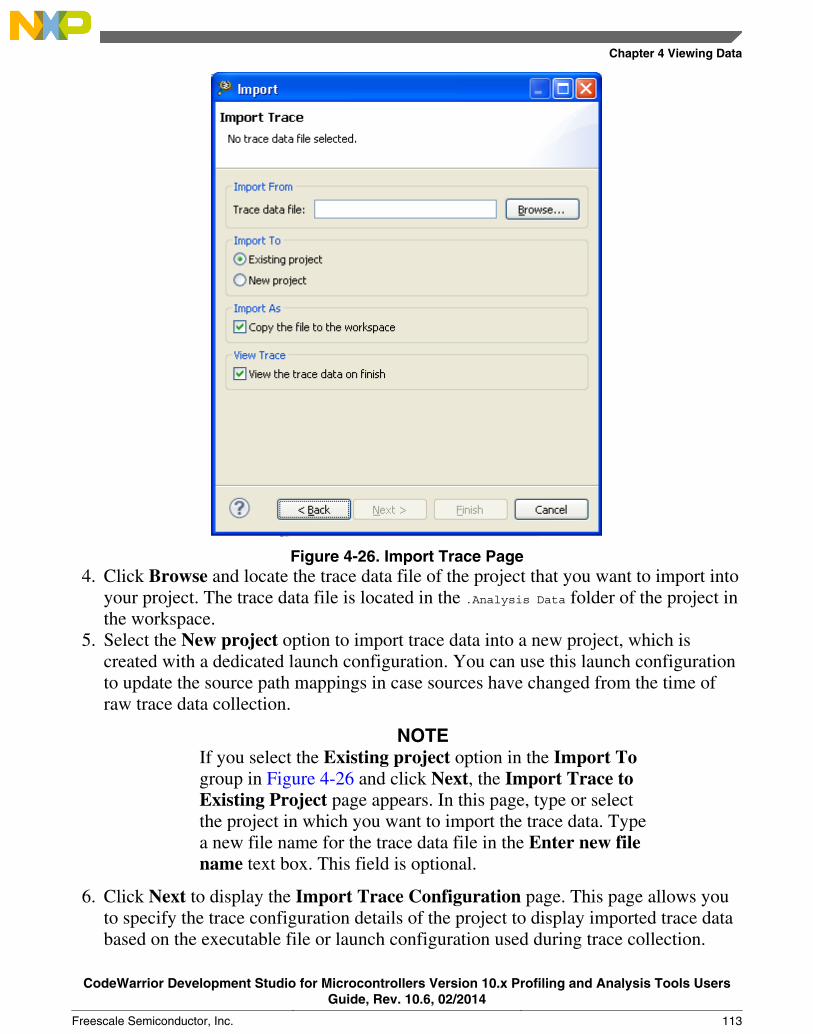
Figure 4-26. Import Trace Page4. Click Browse and locate the trace data file of the project that you want to import into
your project. The trace data file is located in the .Analysis Data folder of the project inthe workspace.
5. Select the New project option to import trace data into a new project, which iscreated with a dedicated launch configuration. You can use this launch configurationto update the source path mappings in case sources have changed from the time ofraw trace data collection.
NOTEIf you select the Existing project option in the Import Togroup in Figure 4-26 and click Next, the Import Trace toExisting Project page appears. In this page, type or selectthe project in which you want to import the trace data. Typea new file name for the trace data file in the Enter new filename text box. This field is optional.
6. Click Next to display the Import Trace Configuration page. This page allows youto specify the trace configuration details of the project to display imported trace databased on the executable file or launch configuration used during trace collection.
Chapter 4 Viewing Data
CodeWarrior Development Studio for Microcontrollers Version 10.x Profiling and Analysis Tools UsersGuide, Rev. 10.6, 02/2014
Freescale Semiconductor, Inc. 113
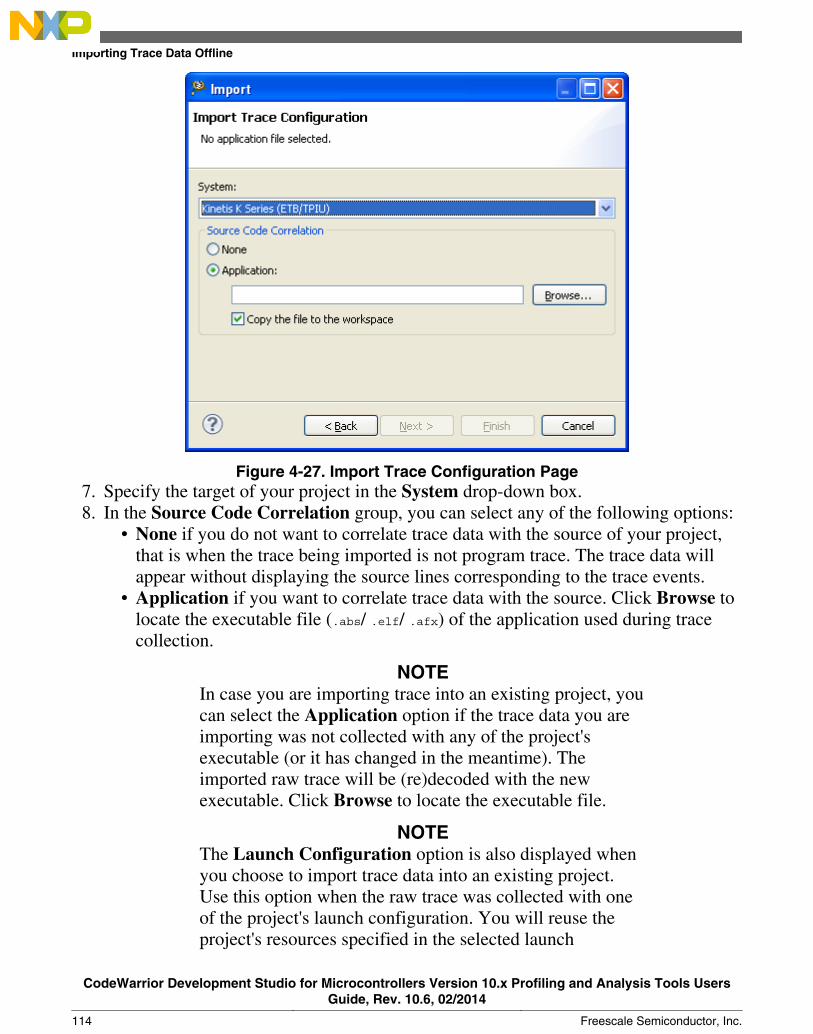
Figure 4-27. Import Trace Configuration Page7. Specify the target of your project in the System drop-down box.8. In the Source Code Correlation group, you can select any of the following options:
• None if you do not want to correlate trace data with the source of your project,that is when the trace being imported is not program trace. The trace data willappear without displaying the source lines corresponding to the trace events.
• Application if you want to correlate trace data with the source. Click Browse tolocate the executable file (.abs/ .elf/ .afx) of the application used during tracecollection.
NOTEIn case you are importing trace into an existing project, youcan select the Application option if the trace data you areimporting was not collected with any of the project'sexecutable (or it has changed in the meantime). Theimported raw trace will be (re)decoded with the newexecutable. Click Browse to locate the executable file.
NOTEThe Launch Configuration option is also displayed whenyou choose to import trace data into an existing project.Use this option when the raw trace was collected with oneof the project's launch configuration. You will reuse theproject's resources specified in the selected launch
Importing Trace Data Offline
CodeWarrior Development Studio for Microcontrollers Version 10.x Profiling and Analysis Tools UsersGuide, Rev. 10.6, 02/2014
114 Freescale Semiconductor, Inc.
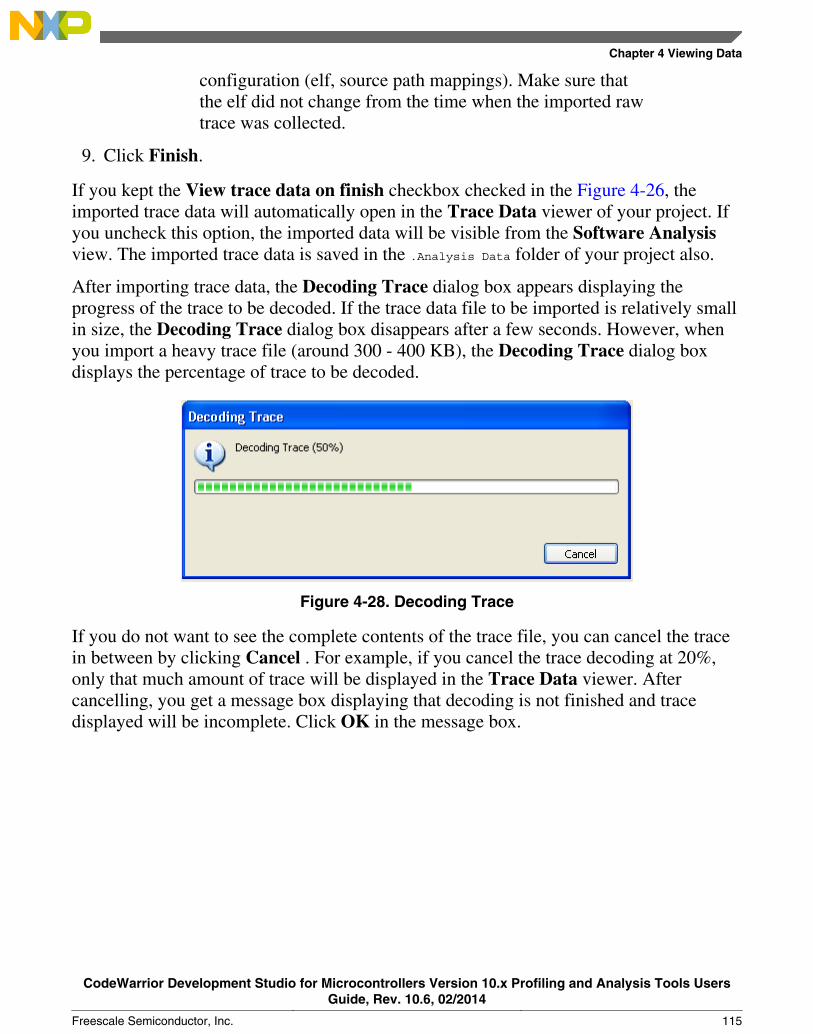
configuration (elf, source path mappings). Make sure thatthe elf did not change from the time when the imported rawtrace was collected.
9. Click Finish.
If you kept the View trace data on finish checkbox checked in the Figure 4-26, theimported trace data will automatically open in the Trace Data viewer of your project. Ifyou uncheck this option, the imported data will be visible from the Software Analysisview. The imported trace data is saved in the .Analysis Data folder of your project also.
After importing trace data, the Decoding Trace dialog box appears displaying theprogress of the trace to be decoded. If the trace data file to be imported is relatively smallin size, the Decoding Trace dialog box disappears after a few seconds. However, whenyou import a heavy trace file (around 300 - 400 KB), the Decoding Trace dialog boxdisplays the percentage of trace to be decoded.
Figure 4-28. Decoding Trace
If you do not want to see the complete contents of the trace file, you can cancel the tracein between by clicking Cancel . For example, if you cancel the trace decoding at 20%,only that much amount of trace will be displayed in the Trace Data viewer. Aftercancelling, you get a message box displaying that decoding is not finished and tracedisplayed will be incomplete. Click OK in the message box.
Chapter 4 Viewing Data
CodeWarrior Development Studio for Microcontrollers Version 10.x Profiling and Analysis Tools UsersGuide, Rev. 10.6, 02/2014
Freescale Semiconductor, Inc. 115

Importing Trace Data Offline
CodeWarrior Development Studio for Microcontrollers Version 10.x Profiling and Analysis Tools UsersGuide, Rev. 10.6, 02/2014
116 Freescale Semiconductor, Inc.
Chapter 5Setting Tracepoints (HCS08)Tracepoint is a point in the target program where start or stop triggers are set at a line ofthe source code or the assembly code or on the memory address. The start and stoptracepoints are triggers for enabling and disabling the trace output. Tracepoints are usedfor optimizing trace collection by tracing only on the code of interest and discarding therest of the code.
The advantage of setting start and stop tracepoints is that the trace data can be capturedfrom the specific part of the program. This solves the problem of tracing a largeapplication because a full trace is sometimes extremely difficult to follow. Tracepointsreduce intrusiveness and help collecting the trace data closer to the point of interest.
The trace data displays the trace result based on the tracepoints. This chapter explainshow to set start and stop tracepoints and how to enable and disable a tracepoint.
The tracepoints for the HCS08 target can be set on:
• addresses and source files
The tracepoints on addresses and source files can be set in the editor area and theDisassembly view. The source line tracepoint is set in the editor area, and theaddress tracepoint is set in the Disassembly view.
• data and memory
The tracepoints on data and memory can be set from the Variables and Memoryviews.
This chapter consists of the following topics:
• Conditions for Starting/Stopping Triggers• Trace Modes• Enabling and Disabling the Tracepoints
CodeWarrior Development Studio for Microcontrollers Version 10.x Profiling and Analysis Tools UsersGuide, Rev. 10.6, 02/2014
Freescale Semiconductor, Inc. 117
5.1 Conditions for Starting/Stopping Triggers
In the HCS08 target, A and B are two address comparators referred as triggers that makeone big trigger. The trace collection starts or ends depending on the From or Until triggerselected along with a combination of actions involving A and B.
Both the triggers, A and B, perform the same action depending on the option selectedfrom the Trace Start/Stop Conditions group. If you select the Collect Trace FromTrigger option, both A and B are used for starting the trace collection. If you select theCollect Trace Until Trigger option, both A and B are used for stopping the tracecollection.
If From trigger is selected, the application activates the trace when conditions A and Bare met and starts collecting the trace data.
• In the Automatically mode, if you set the Break on FIFO Full option, theapplication runs until the trace buffer fills and then stops automatically. If you do notset the Break on FIFO Full option, the application keeps running until you suspendit manually, but does not collect trace anymore. So either way, the trace is collectedonly till the trace buffer gets filled for the first time.
• In the Continuously mode, if you do not check the Keep Last Buffer BeforeTrigger checkbox, the application runs until the trace buffer fills. While theapplication is being debugged, it stops temporarily in background, resumesexecution, and then collects a new buffer of trace without using triggers anymore.This new buffer of trace is collected till you manually suspend the application.
If you set the Keep Last Buffer Before Trigger option, the trace is collected andtrace buffer is overwritten until the trigger is hit, that is until trigger conditions aremet. The application stops temporarily, resumes, and collects more trace withoutusing triggers anymore till you manually suspend the application.
NOTEIn the Continuously mode, the application always stops atthe address where you have suspended the applicationmanually. The application does not stop on the triggeraddress. The Keep Last Buffer Before Trigger optiononly control the data that is traced around the trigger. Afterthe necessary trigger conditions are met, the trace data iscollected normally till you suspend the applicationmanually.
• In the Collect Data Trace mode, the data involved in a read and/or write access tothe addresses specified by triggers, A and B, such as the address of a particularcontrol register or program variable, is captured. If the Break on FIFO Full option is
Conditions for Starting/Stopping Triggers
CodeWarrior Development Studio for Microcontrollers Version 10.x Profiling and Analysis Tools UsersGuide, Rev. 10.6, 02/2014
118 Freescale Semiconductor, Inc.
set, the application stops automatically, else the application stops when you suspendit manually.
If Until trigger is selected, the application starts collecting trace and stops whenconditions for A and B are met.
• In the Automatically mode, when you set the Break on Trigger Hit option, thetrace gets collected until the trigger is hit, that is until trigger conditions are met. Thetrace buffer is overwritten during trace collection; therefore, when conditions for Aand B are met, only last part of the buffer can be read. Whether the application stopsautomatically or manually, the trace data that is collected is only the last part of thebuffer before the trigger.
NOTEIn the Continuously and Automatically modes, if theInstruction Execute option is selected, triggers are set onthe program instruction execution. If the Memory Accessoption is selected, the triggers are set on memory locationsand variables.
For the following trigger modes, trace starts from the triggered address rather than fromthe first address in the trace buffer.
• Instruction at Address A is Executed• Instruction at Address A or at Address B is Executed• Instruction at Address A, Then Instruction at Address B are Executed• Instruction at Address A is Executed and Value on Data Bus Match• Instruction at Address A is Executed and Value on Data Bus Mismatch
For the following trigger modes, the trigger address cannot be determined. Therefore,trace starts from the first entry in the trace buffer.
• Instruction Inside Range from Address A to Address B is Executed• Instruction Outside Range from Address A to Address B is Executed
NOTEFor more information on trigger modes, refer Table 3-1.
WarningIf you are setting breakpoints with triggers for trace control inthe HCS08 target, ensure that you do not to use more than onebreakpoint. This is because on HCS08, two hardware debugmodules, BDC (Background debug controller) and DBG (debugmodule) are used. Both debug modules can be used for settinghardware breakpoints, while only DBG can be used for setting
Chapter 5 Setting Tracepoints (HCS08)
CodeWarrior Development Studio for Microcontrollers Version 10.x Profiling and Analysis Tools UsersGuide, Rev. 10.6, 02/2014
Freescale Semiconductor, Inc. 119
triggers. The first breakpoint is set using BDC, any otherbreakpoints will use DBG and will conflict with the triggers.Therefore, it is mandatory not to use more than one breakpointwhen setting triggers on the HCS08 platform.
5.2 Trace Modes
The triggers can be set in the following trace modes:
• Collect Program Trace• Continuously
This topic covers the following trigger types: Instruction at Address A, thenInstruction at Address B are executed, Instruction at Address A or Address B isexecuted, Instruction Inside Range from Address A to Address B is Executed,Instruction at Address A is Executed and Data Match/Mismatch on Data Bus.
• Automatically
This topic covers the following trigger types, Instruction at Address A isexecuted and Instruction Outside Range from Address A to Address B isExecuted.
• Collect Data Trace
This topic covers the following trigger types: Capture Read/Write Values at AddressB and Capture Read/Write Values at Address B, After Access at Address A.
• Profile-Only• Expert
NOTEThe HCS08 target does not generate trace data on the defaultstationery project. This is because the default source code doesnot contain any branch required for an HCS08 application togenerate trace. To generate trace, you need to add a subroutineto the default code and call it from the main() function.
This topic contains the following sub-topics:• Setting Triggers in Continuously Mode• Setting Triggers in Automatically Mode• Setting Triggers in Collect Data Trace Mode
Trace Modes
CodeWarrior Development Studio for Microcontrollers Version 10.x Profiling and Analysis Tools UsersGuide, Rev. 10.6, 02/2014
120 Freescale Semiconductor, Inc.
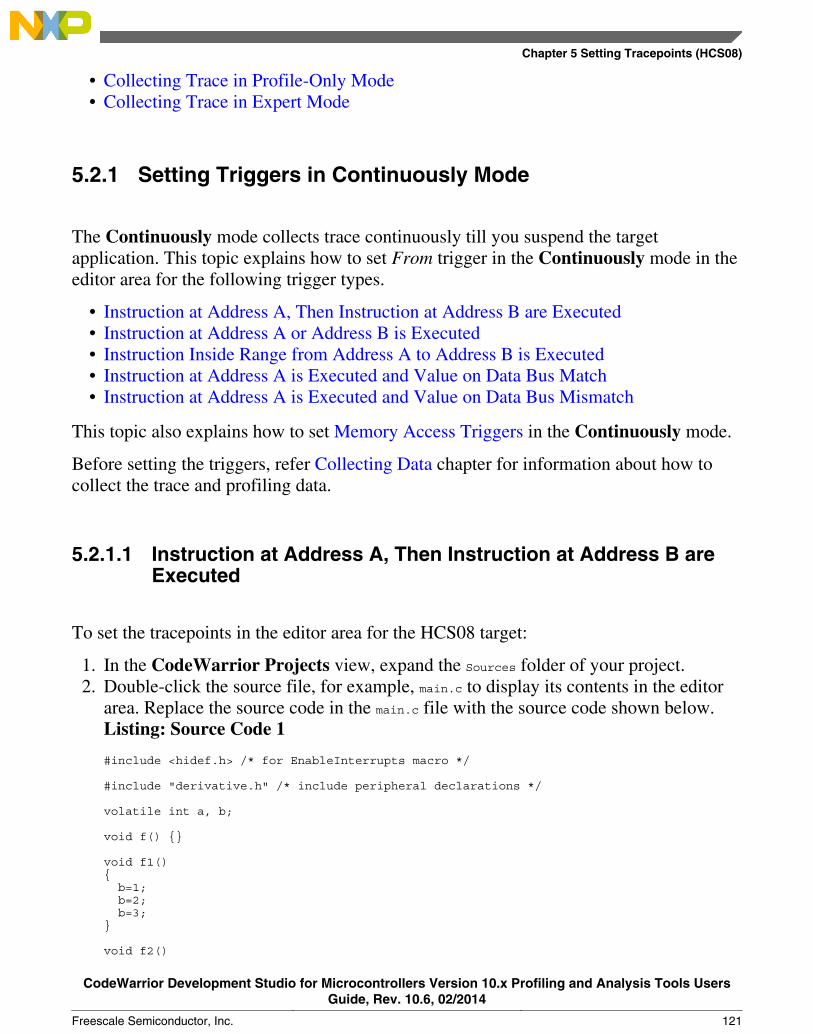
• Collecting Trace in Profile-Only Mode• Collecting Trace in Expert Mode
5.2.1 Setting Triggers in Continuously Mode
The Continuously mode collects trace continuously till you suspend the targetapplication. This topic explains how to set From trigger in the Continuously mode in theeditor area for the following trigger types.
• Instruction at Address A, Then Instruction at Address B are Executed• Instruction at Address A or Address B is Executed• Instruction Inside Range from Address A to Address B is Executed• Instruction at Address A is Executed and Value on Data Bus Match• Instruction at Address A is Executed and Value on Data Bus Mismatch
This topic also explains how to set Memory Access Triggers in the Continuously mode.
Before setting the triggers, refer Collecting Data chapter for information about how tocollect the trace and profiling data.
5.2.1.1 Instruction at Address A, Then Instruction at Address B areExecuted
To set the tracepoints in the editor area for the HCS08 target:
1. In the CodeWarrior Projects view, expand the Sources folder of your project.2. Double-click the source file, for example, main.c to display its contents in the editor
area. Replace the source code in the main.c file with the source code shown below.Listing: Source Code 1
#include <hidef.h> /* for EnableInterrupts macro */
#include "derivative.h" /* include peripheral declarations */
volatile int a, b;
void f() {}
void f1(){ b=1; b=2; b=3;}
void f2()
Chapter 5 Setting Tracepoints (HCS08)
CodeWarrior Development Studio for Microcontrollers Version 10.x Profiling and Analysis Tools UsersGuide, Rev. 10.6, 02/2014
Freescale Semiconductor, Inc. 121

{ a=1; a=2; a=3;}
void main(void) { EnableInterrupts; /* include your code here */f();
f();
f();
for(;;) { __RESET_WATCHDOG();/* feeds the dog */
f1(); f2(); } /* loop forever */
/* please make sure that you never leave main */
}
3. Save and build the project.4. Open the Debug Configurations dialog box, and select your project in the tree
structure.5. Click the Trace and Profile tab, and check the Enable Trace and Profile checkbox.6. Click Apply and close the Debug Configurations dialog box.7. In the editor area, right-click the marker bar corresponding to the statement, f1();.8. Select Trace Triggers > Toggle Trace Trigger A from the context menu. The same
option is also used to remove trigger A from the marker bar.9. Right-click the marker bar corresponding to the statement, f2();.
10. Select the Trace Triggers > Toggle Trace Trigger B option from the context menu.The same option is also used to remove trigger B from the marker bar.
NOTEIt is recommended to set both triggers in the same functionso that the trace data that is collected is meaningful.
Trace Modes
CodeWarrior Development Studio for Microcontrollers Version 10.x Profiling and Analysis Tools UsersGuide, Rev. 10.6, 02/2014
122 Freescale Semiconductor, Inc.
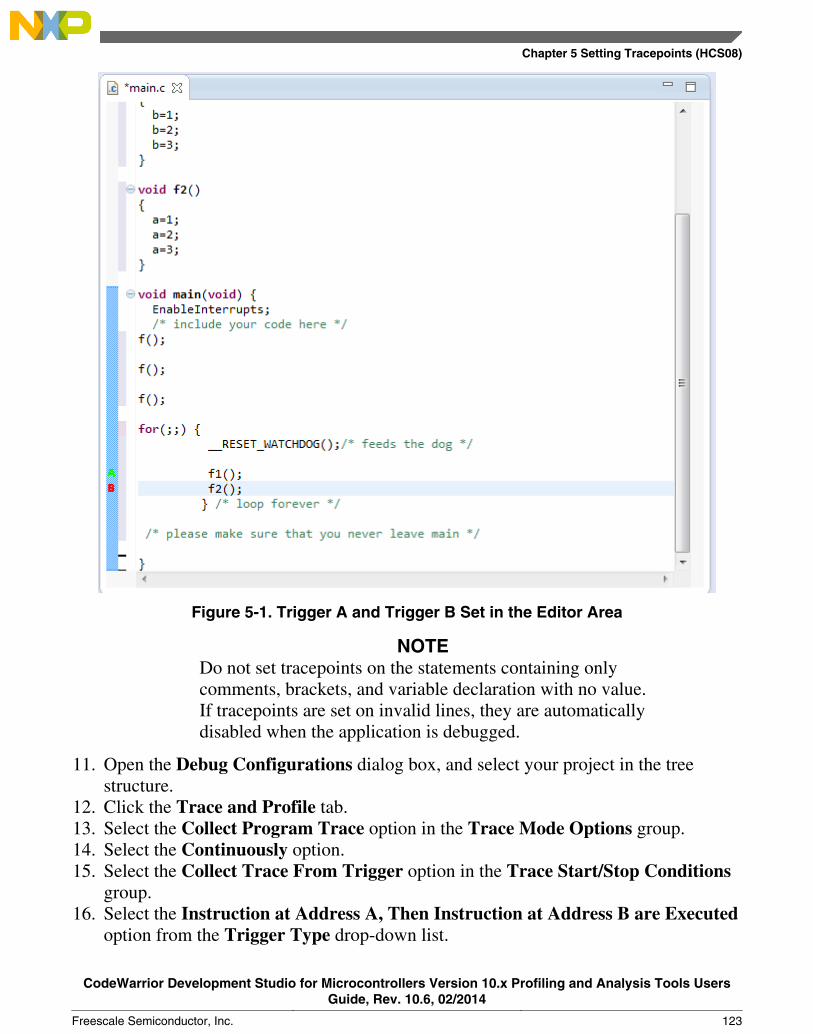
Figure 5-1. Trigger A and Trigger B Set in the Editor Area
NOTEDo not set tracepoints on the statements containing onlycomments, brackets, and variable declaration with no value.If tracepoints are set on invalid lines, they are automaticallydisabled when the application is debugged.
11. Open the Debug Configurations dialog box, and select your project in the treestructure.
12. Click the Trace and Profile tab.13. Select the Collect Program Trace option in the Trace Mode Options group.14. Select the Continuously option.15. Select the Collect Trace From Trigger option in the Trace Start/Stop Conditions
group.16. Select the Instruction at Address A, Then Instruction at Address B are Executed
option from the Trigger Type drop-down list.
Chapter 5 Setting Tracepoints (HCS08)
CodeWarrior Development Studio for Microcontrollers Version 10.x Profiling and Analysis Tools UsersGuide, Rev. 10.6, 02/2014
Freescale Semiconductor, Inc. 123
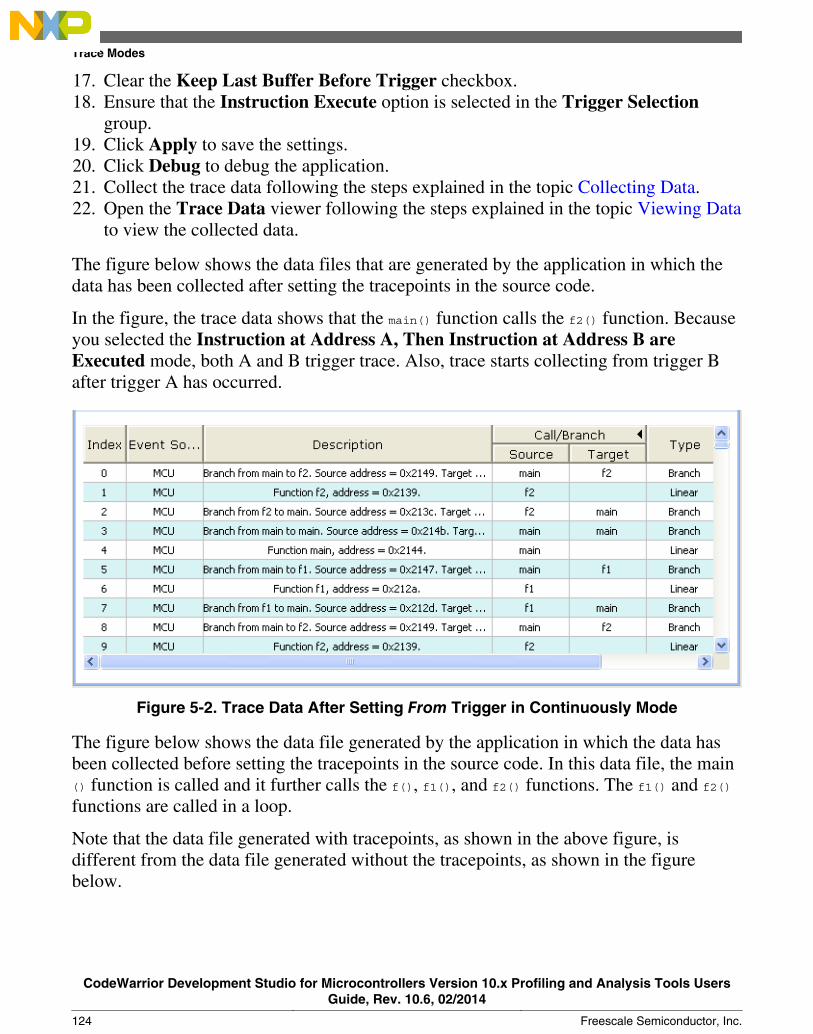
17. Clear the Keep Last Buffer Before Trigger checkbox.18. Ensure that the Instruction Execute option is selected in the Trigger Selection
group.19. Click Apply to save the settings.20. Click Debug to debug the application.21. Collect the trace data following the steps explained in the topic Collecting Data.22. Open the Trace Data viewer following the steps explained in the topic Viewing Data
to view the collected data.
The figure below shows the data files that are generated by the application in which thedata has been collected after setting the tracepoints in the source code.
In the figure, the trace data shows that the main() function calls the f2() function. Becauseyou selected the Instruction at Address A, Then Instruction at Address B areExecuted mode, both A and B trigger trace. Also, trace starts collecting from trigger Bafter trigger A has occurred.
Figure 5-2. Trace Data After Setting From Trigger in Continuously Mode
The figure below shows the data file generated by the application in which the data hasbeen collected before setting the tracepoints in the source code. In this data file, the main() function is called and it further calls the f(), f1(), and f2() functions. The f1() and f2()functions are called in a loop.
Note that the data file generated with tracepoints, as shown in the above figure, isdifferent from the data file generated without the tracepoints, as shown in the figurebelow.
Trace Modes
CodeWarrior Development Studio for Microcontrollers Version 10.x Profiling and Analysis Tools UsersGuide, Rev. 10.6, 02/2014
124 Freescale Semiconductor, Inc.
NOTEThe trace data only contains destinations that cannot beobtained from disassembly. For example, return addresses,which are kept on stack, or conditional destinations, such asjump address and next address.
Figure 5-3. Trace Data Before Setting Tracepoints
NOTEHover mouse pointer over a tracepoint icon in the marker bar toview the attributes of the tracepoint on the corresponding lineof code.
The graph in figure below shows the timeline of the trace data which is collected aftersetting the tracepoints. In this graph, you can see that the main() function calls the f1() andf2() functions and not the f() function. To have a clearer view of the graph, you canzoom-in or zoom-out in the graph by scrolling the mouse wheel up or down.
Chapter 5 Setting Tracepoints (HCS08)
CodeWarrior Development Studio for Microcontrollers Version 10.x Profiling and Analysis Tools UsersGuide, Rev. 10.6, 02/2014
Freescale Semiconductor, Inc. 125
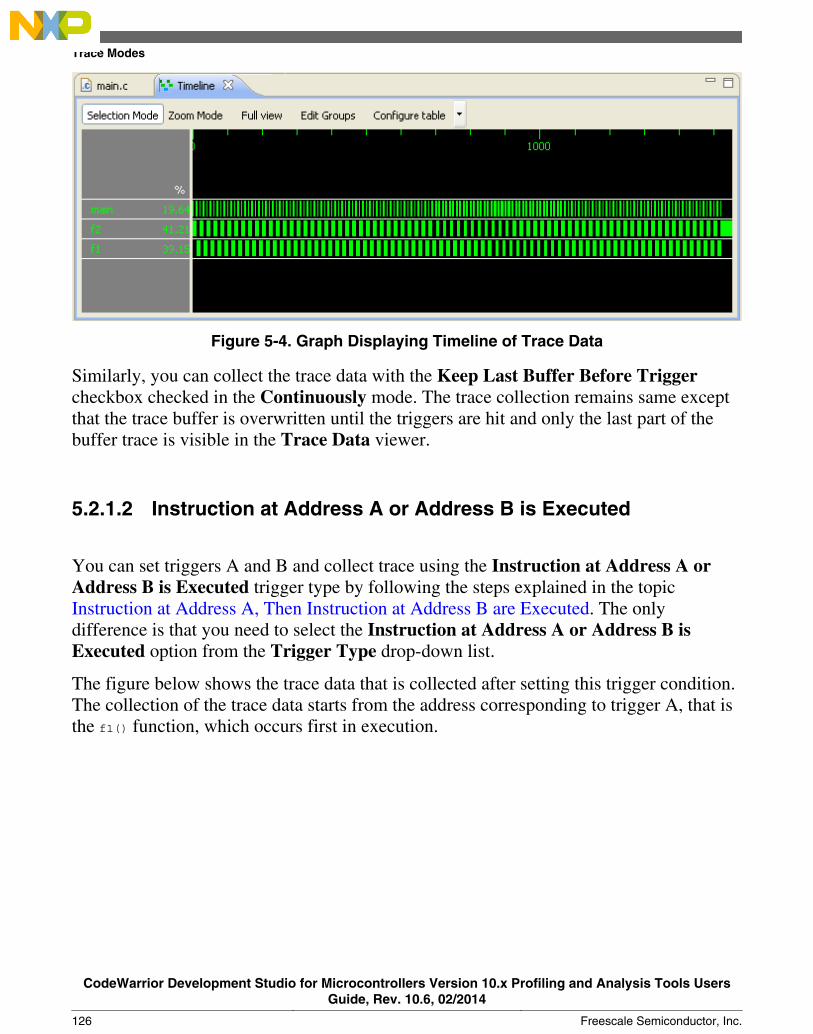
Figure 5-4. Graph Displaying Timeline of Trace Data
Similarly, you can collect the trace data with the Keep Last Buffer Before Triggercheckbox checked in the Continuously mode. The trace collection remains same exceptthat the trace buffer is overwritten until the triggers are hit and only the last part of thebuffer trace is visible in the Trace Data viewer.
5.2.1.2 Instruction at Address A or Address B is Executed
You can set triggers A and B and collect trace using the Instruction at Address A orAddress B is Executed trigger type by following the steps explained in the topicInstruction at Address A, Then Instruction at Address B are Executed. The onlydifference is that you need to select the Instruction at Address A or Address B isExecuted option from the Trigger Type drop-down list.
The figure below shows the trace data that is collected after setting this trigger condition.The collection of the trace data starts from the address corresponding to trigger A, that isthe f1() function, which occurs first in execution.
Trace Modes
CodeWarrior Development Studio for Microcontrollers Version 10.x Profiling and Analysis Tools UsersGuide, Rev. 10.6, 02/2014
126 Freescale Semiconductor, Inc.
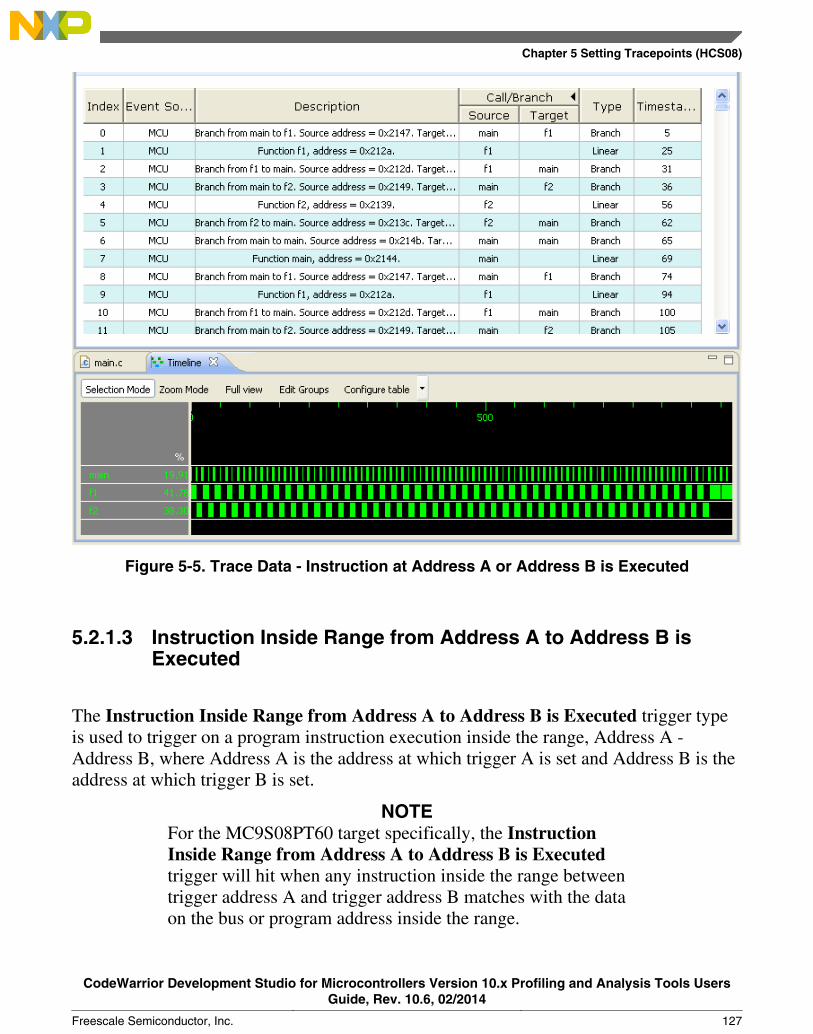
Figure 5-5. Trace Data - Instruction at Address A or Address B is Executed
5.2.1.3 Instruction Inside Range from Address A to Address B isExecuted
The Instruction Inside Range from Address A to Address B is Executed trigger typeis used to trigger on a program instruction execution inside the range, Address A -Address B, where Address A is the address at which trigger A is set and Address B is theaddress at which trigger B is set.
NOTEFor the MC9S08PT60 target specifically, the InstructionInside Range from Address A to Address B is Executedtrigger will hit when any instruction inside the range betweentrigger address A and trigger address B matches with the dataon the bus or program address inside the range.
Chapter 5 Setting Tracepoints (HCS08)
CodeWarrior Development Studio for Microcontrollers Version 10.x Profiling and Analysis Tools UsersGuide, Rev. 10.6, 02/2014
Freescale Semiconductor, Inc. 127
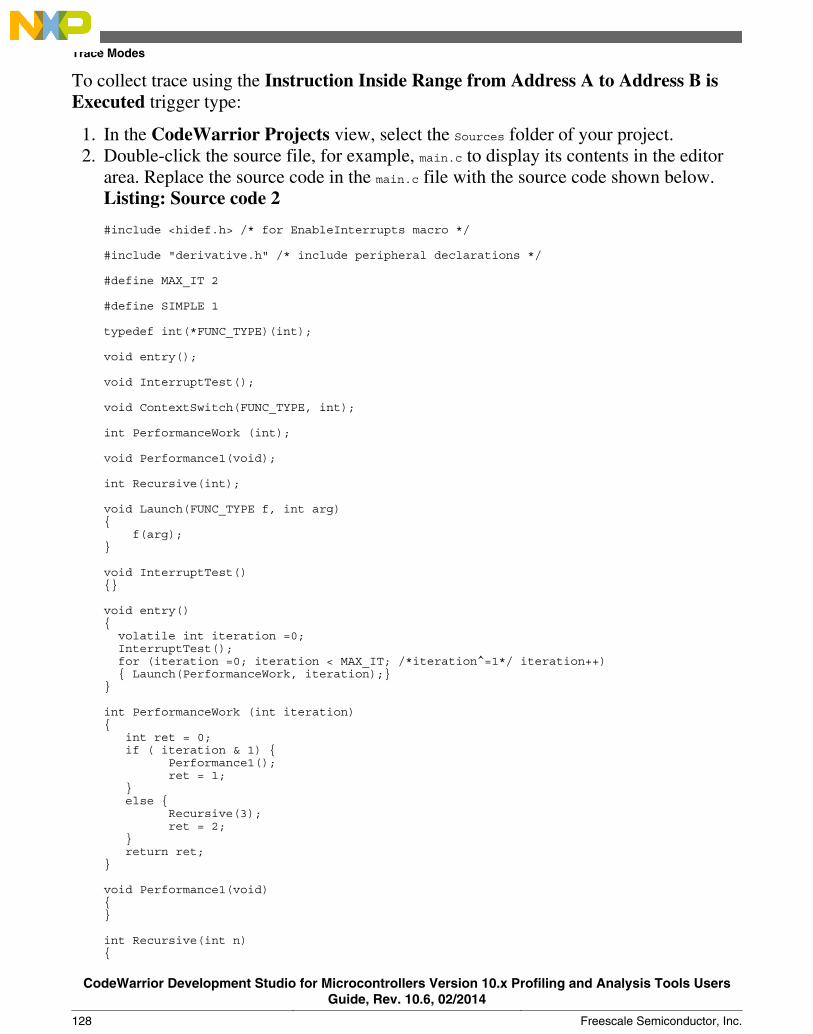
To collect trace using the Instruction Inside Range from Address A to Address B isExecuted trigger type:
1. In the CodeWarrior Projects view, select the Sources folder of your project.2. Double-click the source file, for example, main.c to display its contents in the editor
area. Replace the source code in the main.c file with the source code shown below.Listing: Source code 2
#include <hidef.h> /* for EnableInterrupts macro */
#include "derivative.h" /* include peripheral declarations */
#define MAX_IT 2
#define SIMPLE 1
typedef int(*FUNC_TYPE)(int);
void entry();
void InterruptTest();
void ContextSwitch(FUNC_TYPE, int);
int PerformanceWork (int);
void Performance1(void);
int Recursive(int);
void Launch(FUNC_TYPE f, int arg){ f(arg);}
void InterruptTest(){}
void entry(){ volatile int iteration =0; InterruptTest(); for (iteration =0; iteration < MAX_IT; /*iteration^=1*/ iteration++) { Launch(PerformanceWork, iteration);}}
int PerformanceWork (int iteration){ int ret = 0; if ( iteration & 1) { Performance1(); ret = 1; } else { Recursive(3); ret = 2; } return ret;}
void Performance1(void){}
int Recursive(int n){
Trace Modes
CodeWarrior Development Studio for Microcontrollers Version 10.x Profiling and Analysis Tools UsersGuide, Rev. 10.6, 02/2014
128 Freescale Semiconductor, Inc.
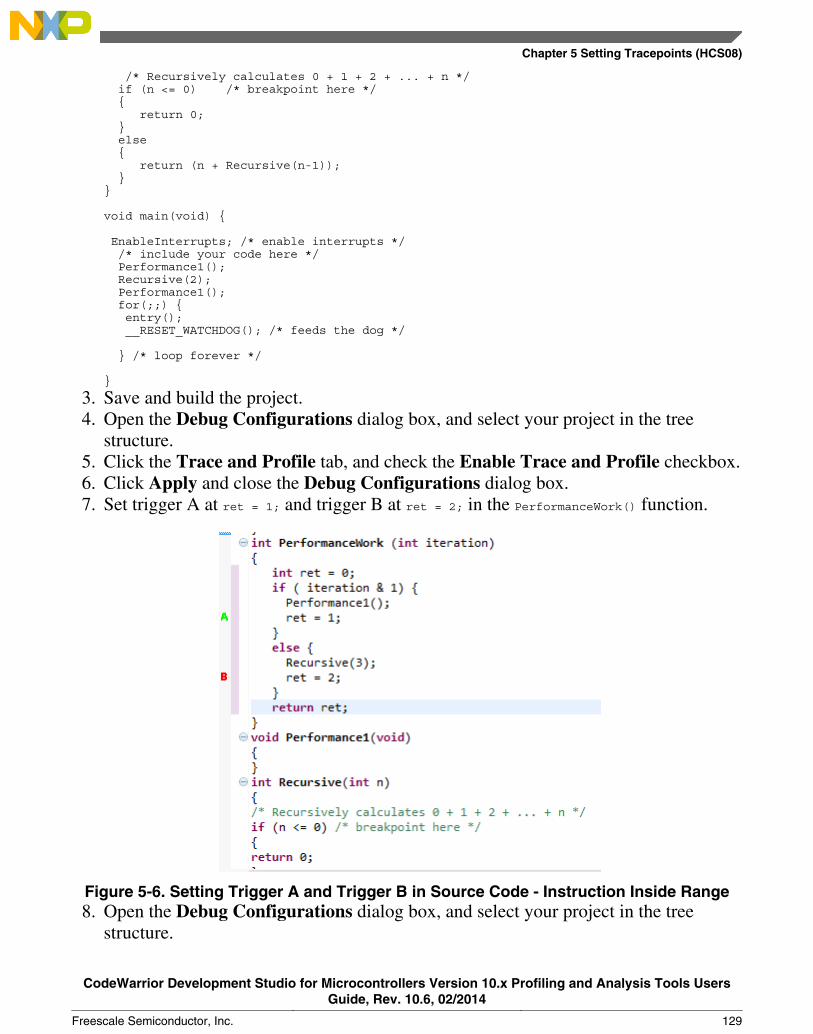
/* Recursively calculates 0 + 1 + 2 + ... + n */ if (n <= 0) /* breakpoint here */ { return 0; } else { return (n + Recursive(n-1)); }}
void main(void) {
EnableInterrupts; /* enable interrupts */ /* include your code here */ Performance1(); Recursive(2); Performance1(); for(;;) { entry(); __RESET_WATCHDOG(); /* feeds the dog */
} /* loop forever */
}
3. Save and build the project.4. Open the Debug Configurations dialog box, and select your project in the tree
structure.5. Click the Trace and Profile tab, and check the Enable Trace and Profile checkbox.6. Click Apply and close the Debug Configurations dialog box.7. Set trigger A at ret = 1; and trigger B at ret = 2; in the PerformanceWork() function.
Figure 5-6. Setting Trigger A and Trigger B in Source Code - Instruction Inside Range8. Open the Debug Configurations dialog box, and select your project in the tree
structure.
Chapter 5 Setting Tracepoints (HCS08)
CodeWarrior Development Studio for Microcontrollers Version 10.x Profiling and Analysis Tools UsersGuide, Rev. 10.6, 02/2014
Freescale Semiconductor, Inc. 129
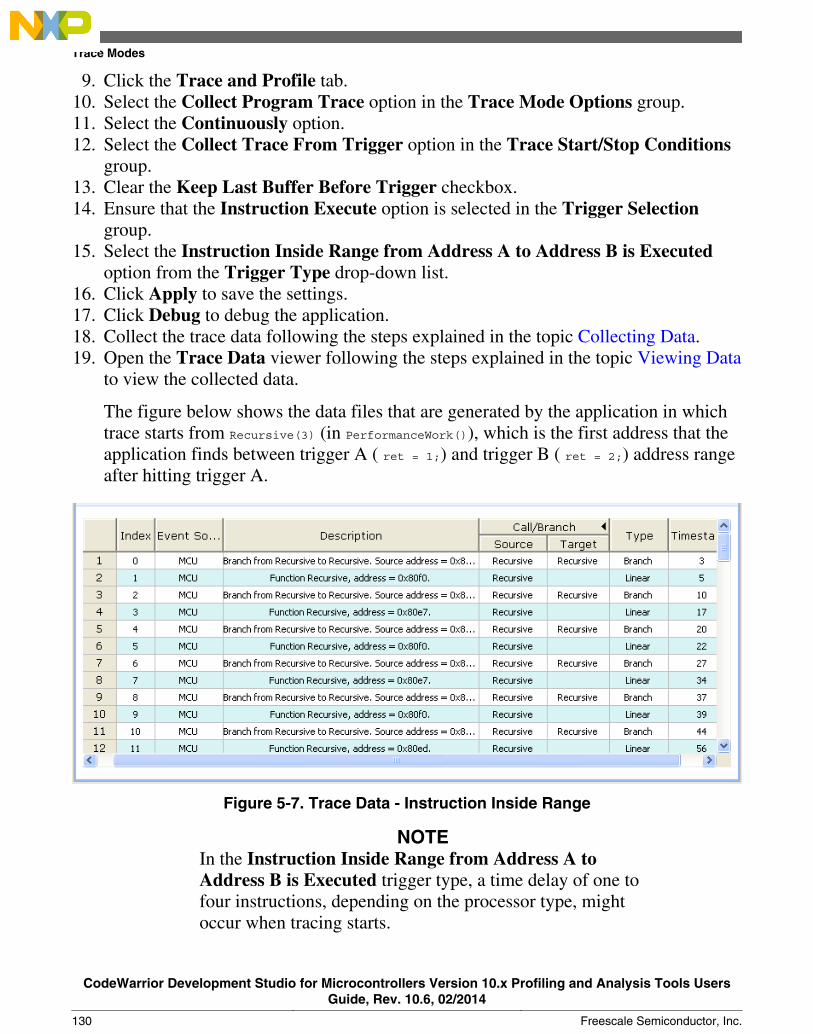
9. Click the Trace and Profile tab.10. Select the Collect Program Trace option in the Trace Mode Options group.11. Select the Continuously option.12. Select the Collect Trace From Trigger option in the Trace Start/Stop Conditions
group.13. Clear the Keep Last Buffer Before Trigger checkbox.14. Ensure that the Instruction Execute option is selected in the Trigger Selection
group.15. Select the Instruction Inside Range from Address A to Address B is Executed
option from the Trigger Type drop-down list.16. Click Apply to save the settings.17. Click Debug to debug the application.18. Collect the trace data following the steps explained in the topic Collecting Data.19. Open the Trace Data viewer following the steps explained in the topic Viewing Data
to view the collected data.
The figure below shows the data files that are generated by the application in whichtrace starts from Recursive(3) (in PerformanceWork()), which is the first address that theapplication finds between trigger A ( ret = 1;) and trigger B ( ret = 2;) address rangeafter hitting trigger A.
Figure 5-7. Trace Data - Instruction Inside Range
NOTEIn the Instruction Inside Range from Address A toAddress B is Executed trigger type, a time delay of one tofour instructions, depending on the processor type, mightoccur when tracing starts.
Trace Modes
CodeWarrior Development Studio for Microcontrollers Version 10.x Profiling and Analysis Tools UsersGuide, Rev. 10.6, 02/2014
130 Freescale Semiconductor, Inc.

This is how you can collect trace using the Instruction Inside Range from Address Ato Address B is Executed trigger type.
5.2.1.4 Instruction at Address A is Executed and Value on Data BusMatch
The Instruction at Address A is Executed and Value on Data Bus Match trigger typeis used to trigger on a program instruction execution at trigger A address when theopcode of that instruction matches a specific byte value. This trigger type is useful indetecting the self-modifying instructions or code in RAM so that you can trace whatexactly executes when the instructions are modified.
For example, if in a source code, a random pointer is changing the instruction executed atan address to a specific value (opcode), you can set a trigger at this instruction. Also, youneed to specify that particular opcode value while configuring the debug launcher. Now,when the application executes and reaches the instruction where trigger is set, thespecified opcode value matches with the opcode of the instruction and the trigger is fired.
To set the Instruction at Address A is Executed and Value on Data Bus Match triggertype:
1. In the CodeWarrior Projects view, select the Sources folder of your project.2. Double-click the source file, for example, main.c to display its contents in the editor
area. Replace the source code in the main.c file with the source code shown in Listing:Source code 2.
3. Save and build the project.4. Open the Debug Configurations dialog box, and select your project in the tree
structure.5. Click the Trace and Profile tab, and check the Enable Trace and Profile checkbox.6. Select the Collect Program Trace option in the Trace Mode Options group.7. Select the Continuously option.8. Ensure that the Instruction Execute option is selected in the Trigger Selection
group.9. Select the Collect Trace From Trigger option in the Trace Start/Stop Conditions
group.10. Check the Keep Last Buffer Before Trigger checkbox if not checked.11. Select the Instruction at Address A is Executed and Value on Data Bus Match
option from the Trigger Type drop-down list.12. Click Apply to save the settings.13. Click Debug to debug the application and collect the trace data.
Chapter 5 Setting Tracepoints (HCS08)
CodeWarrior Development Studio for Microcontrollers Version 10.x Profiling and Analysis Tools UsersGuide, Rev. 10.6, 02/2014
Freescale Semiconductor, Inc. 131
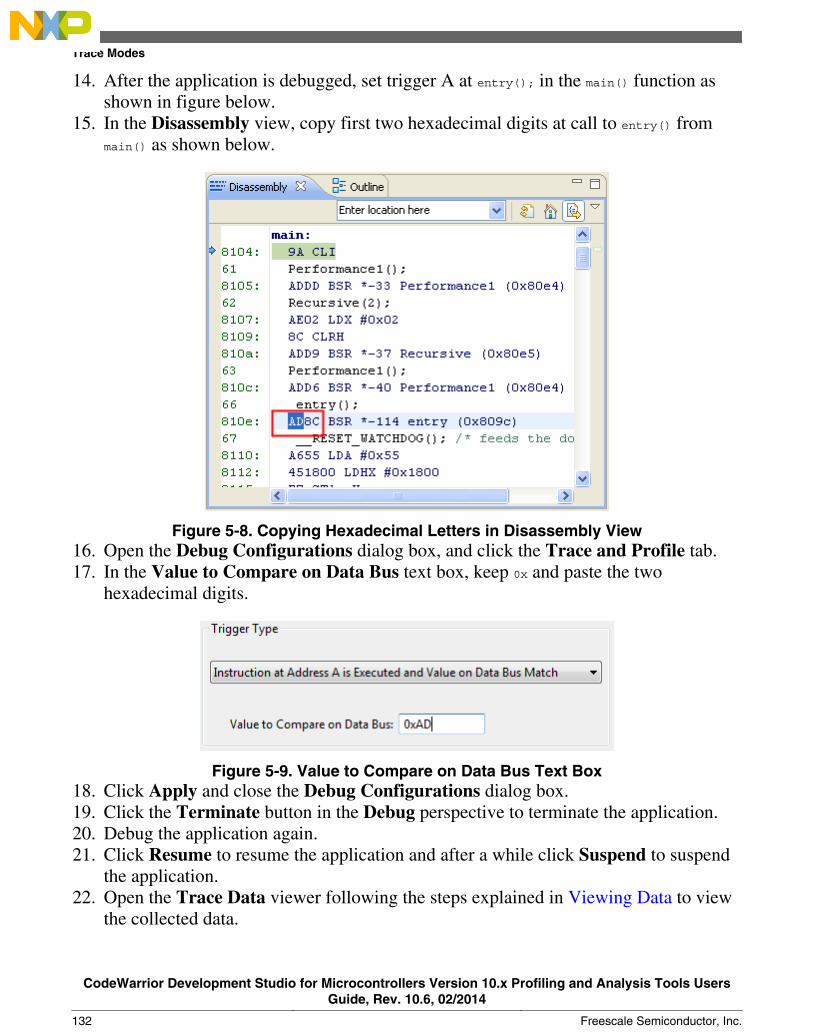
14. After the application is debugged, set trigger A at entry(); in the main() function asshown in figure below.
15. In the Disassembly view, copy first two hexadecimal digits at call to entry() frommain() as shown below.
Figure 5-8. Copying Hexadecimal Letters in Disassembly View16. Open the Debug Configurations dialog box, and click the Trace and Profile tab.17. In the Value to Compare on Data Bus text box, keep 0x and paste the two
hexadecimal digits.
Figure 5-9. Value to Compare on Data Bus Text Box18. Click Apply and close the Debug Configurations dialog box.19. Click the Terminate button in the Debug perspective to terminate the application.20. Debug the application again.21. Click Resume to resume the application and after a while click Suspend to suspend
the application.22. Open the Trace Data viewer following the steps explained in Viewing Data to view
the collected data.
Trace Modes
CodeWarrior Development Studio for Microcontrollers Version 10.x Profiling and Analysis Tools UsersGuide, Rev. 10.6, 02/2014
132 Freescale Semiconductor, Inc.
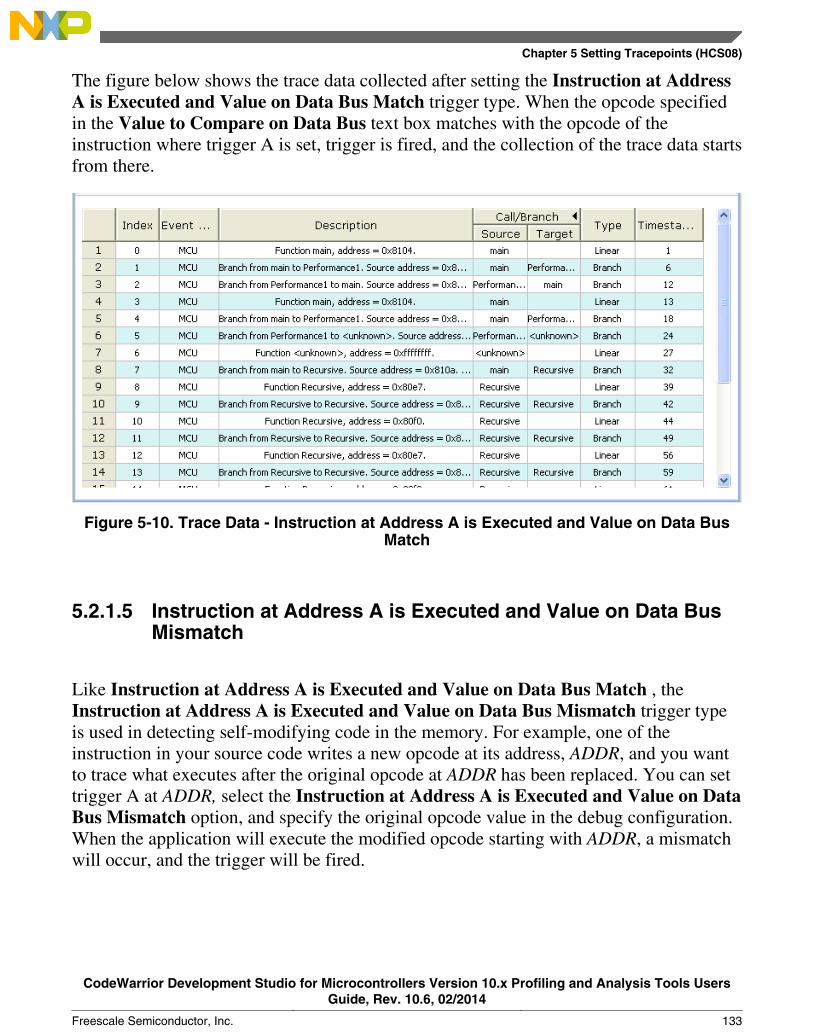
The figure below shows the trace data collected after setting the Instruction at AddressA is Executed and Value on Data Bus Match trigger type. When the opcode specifiedin the Value to Compare on Data Bus text box matches with the opcode of theinstruction where trigger A is set, trigger is fired, and the collection of the trace data startsfrom there.
Figure 5-10. Trace Data - Instruction at Address A is Executed and Value on Data BusMatch
5.2.1.5 Instruction at Address A is Executed and Value on Data BusMismatch
Like Instruction at Address A is Executed and Value on Data Bus Match , theInstruction at Address A is Executed and Value on Data Bus Mismatch trigger typeis used in detecting self-modifying code in the memory. For example, one of theinstruction in your source code writes a new opcode at its address, ADDR, and you wantto trace what executes after the original opcode at ADDR has been replaced. You can settrigger A at ADDR, select the Instruction at Address A is Executed and Value on DataBus Mismatch option, and specify the original opcode value in the debug configuration.When the application will execute the modified opcode starting with ADDR, a mismatchwill occur, and the trigger will be fired.
Chapter 5 Setting Tracepoints (HCS08)
CodeWarrior Development Studio for Microcontrollers Version 10.x Profiling and Analysis Tools UsersGuide, Rev. 10.6, 02/2014
Freescale Semiconductor, Inc. 133

5.2.1.6 Memory Access Triggers
The memory access triggers allow memory access to both variables and instructions. Amemory access trigger if set on an instruction fires when the instruction is fetched fromthe memory. A memory access trigger if set on a variable fires when the variable isfetched from the memory or when the variable is written back to the memory. When amemory access trigger is set on a variable, trace collection starts from the first access tothat variable address.
To collect trace using Memory at Address A is Accessed:
1. In the CodeWarrior Projects view, expand the Sources folder of your project.2. Double-click the source file, for example, main.c to display its contents in the editor
area. Replace the source code in the main.c file with the source code shown in Listing:Source code 2.
3. Press the Enter key after the statement, void ContextSwitch(FUNC_TYPE, int); in thesource code.
4. Type the statement, volatile int a; at the cursor position.5. In the main () function of the source code, before for(;;), type the statement, a = 1;.6. Save and build the project.7. Open the Debug Configurations dialog box, and select your project in the tree
structure.8. Click the Trace and Profile tab, and check the Enable Trace and Profile checkbox.9. Select the Collect Program Trace option in the Trace Mode Options group.
10. Select the Continuously option.11. Select the Collect Trace From Trigger option in the Trace Start/Stop Conditions
group.12. Clear the Keep Last Buffer Before Trigger checkbox.13. Select the Memory Access option in the Trigger Selection group.14. Select the Memory at Address A is Accessed option from the Trigger Type drop-
down list.15. Click Apply to save the settings.16. Click Debug to debug the application.17. After the application is debugged, right-click in the Variables view, and select the
Add Global Variables option from the context menu.
The Add Globals dialog box appears.
18. Scroll down and select the variable a.19. Click OK.
The Add Globals dialog box closes and the variable a is added in the Variablesview.
Trace Modes
CodeWarrior Development Studio for Microcontrollers Version 10.x Profiling and Analysis Tools UsersGuide, Rev. 10.6, 02/2014
134 Freescale Semiconductor, Inc.
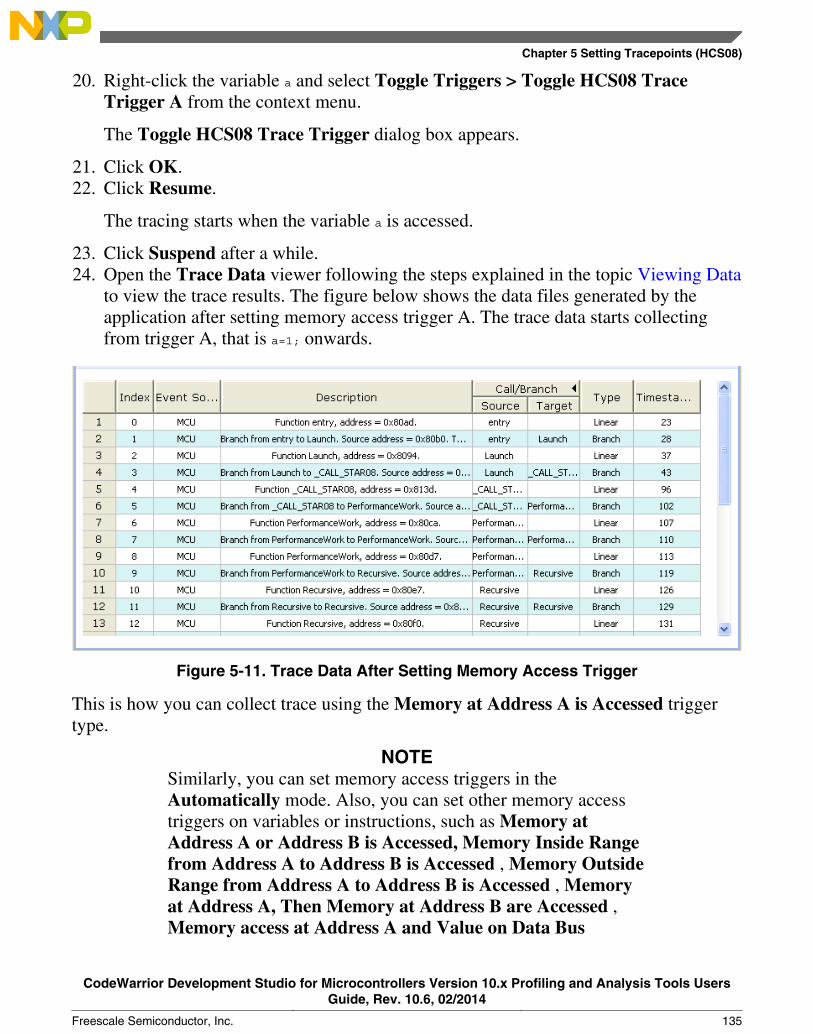
20. Right-click the variable a and select Toggle Triggers > Toggle HCS08 TraceTrigger A from the context menu.
The Toggle HCS08 Trace Trigger dialog box appears.
21. Click OK.22. Click Resume.
The tracing starts when the variable a is accessed.
23. Click Suspend after a while.24. Open the Trace Data viewer following the steps explained in the topic Viewing Data
to view the trace results. The figure below shows the data files generated by theapplication after setting memory access trigger A. The trace data starts collectingfrom trigger A, that is a=1; onwards.
Figure 5-11. Trace Data After Setting Memory Access Trigger
This is how you can collect trace using the Memory at Address A is Accessed triggertype.
NOTESimilarly, you can set memory access triggers in theAutomatically mode. Also, you can set other memory accesstriggers on variables or instructions, such as Memory atAddress A or Address B is Accessed, Memory Inside Rangefrom Address A to Address B is Accessed , Memory OutsideRange from Address A to Address B is Accessed , Memoryat Address A, Then Memory at Address B are Accessed ,Memory access at Address A and Value on Data Bus
Chapter 5 Setting Tracepoints (HCS08)
CodeWarrior Development Studio for Microcontrollers Version 10.x Profiling and Analysis Tools UsersGuide, Rev. 10.6, 02/2014
Freescale Semiconductor, Inc. 135
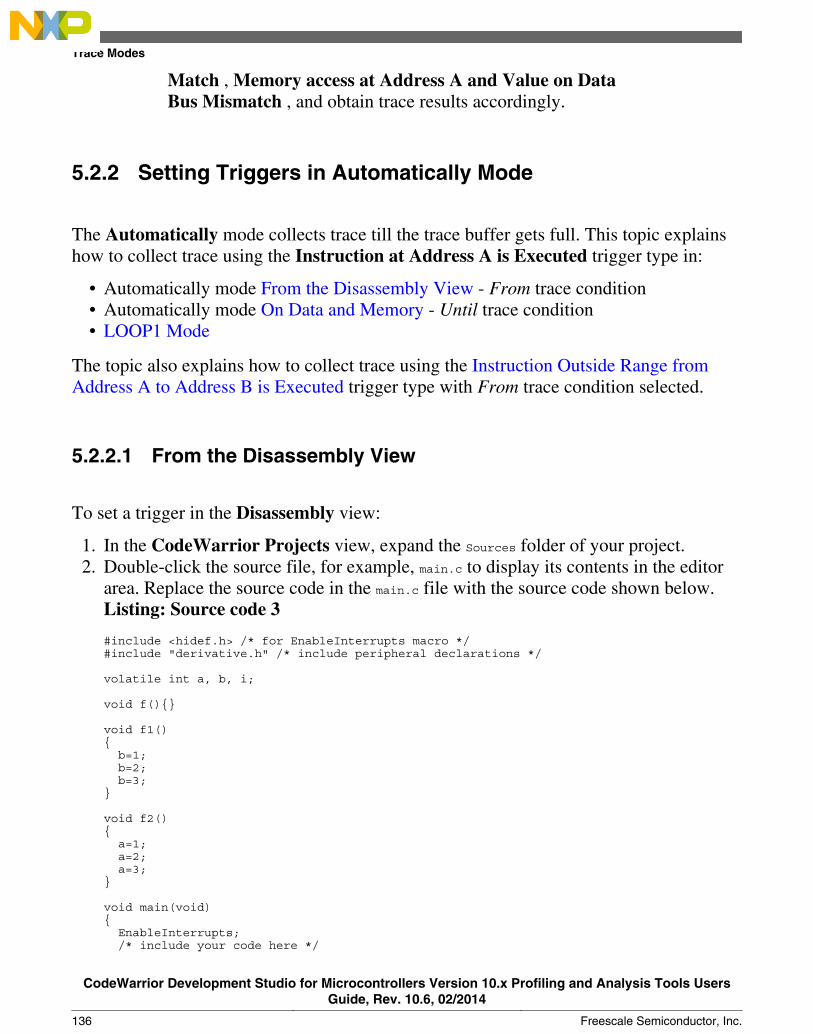
Match , Memory access at Address A and Value on DataBus Mismatch , and obtain trace results accordingly.
5.2.2 Setting Triggers in Automatically Mode
The Automatically mode collects trace till the trace buffer gets full. This topic explainshow to collect trace using the Instruction at Address A is Executed trigger type in:
• Automatically mode From the Disassembly View - From trace condition• Automatically mode On Data and Memory - Until trace condition• LOOP1 Mode
The topic also explains how to collect trace using the Instruction Outside Range fromAddress A to Address B is Executed trigger type with From trace condition selected.
5.2.2.1 From the Disassembly View
To set a trigger in the Disassembly view:
1. In the CodeWarrior Projects view, expand the Sources folder of your project.2. Double-click the source file, for example, main.c to display its contents in the editor
area. Replace the source code in the main.c file with the source code shown below.Listing: Source code 3
#include <hidef.h> /* for EnableInterrupts macro */#include "derivative.h" /* include peripheral declarations */
volatile int a, b, i;
void f(){}
void f1(){ b=1; b=2; b=3;}
void f2(){ a=1; a=2; a=3;}
void main(void){ EnableInterrupts; /* include your code here */
Trace Modes
CodeWarrior Development Studio for Microcontrollers Version 10.x Profiling and Analysis Tools UsersGuide, Rev. 10.6, 02/2014
136 Freescale Semiconductor, Inc.
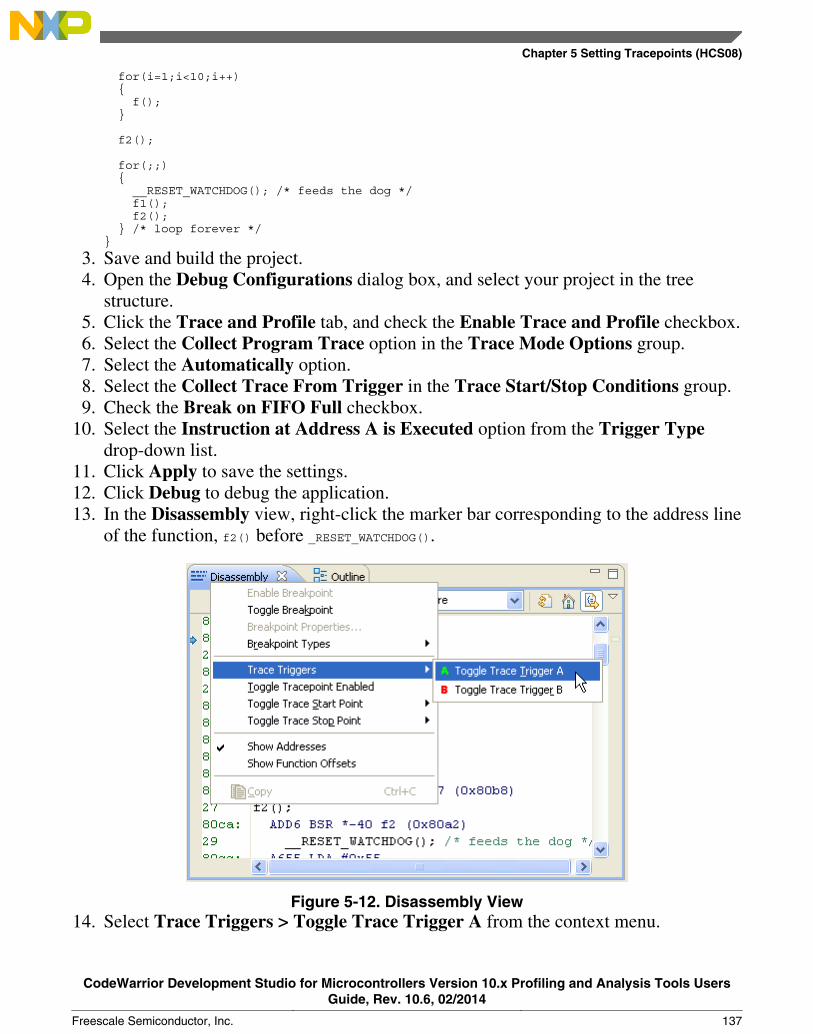
for(i=1;i<10;i++) { f(); }
f2(); for(;;) { __RESET_WATCHDOG(); /* feeds the dog */ f1(); f2(); } /* loop forever */}
3. Save and build the project.4. Open the Debug Configurations dialog box, and select your project in the tree
structure.5. Click the Trace and Profile tab, and check the Enable Trace and Profile checkbox.6. Select the Collect Program Trace option in the Trace Mode Options group.7. Select the Automatically option.8. Select the Collect Trace From Trigger in the Trace Start/Stop Conditions group.9. Check the Break on FIFO Full checkbox.
10. Select the Instruction at Address A is Executed option from the Trigger Typedrop-down list.
11. Click Apply to save the settings.12. Click Debug to debug the application.13. In the Disassembly view, right-click the marker bar corresponding to the address line
of the function, f2() before _RESET_WATCHDOG().
Figure 5-12. Disassembly View14. Select Trace Triggers > Toggle Trace Trigger A from the context menu.
Chapter 5 Setting Tracepoints (HCS08)
CodeWarrior Development Studio for Microcontrollers Version 10.x Profiling and Analysis Tools UsersGuide, Rev. 10.6, 02/2014
Freescale Semiconductor, Inc. 137
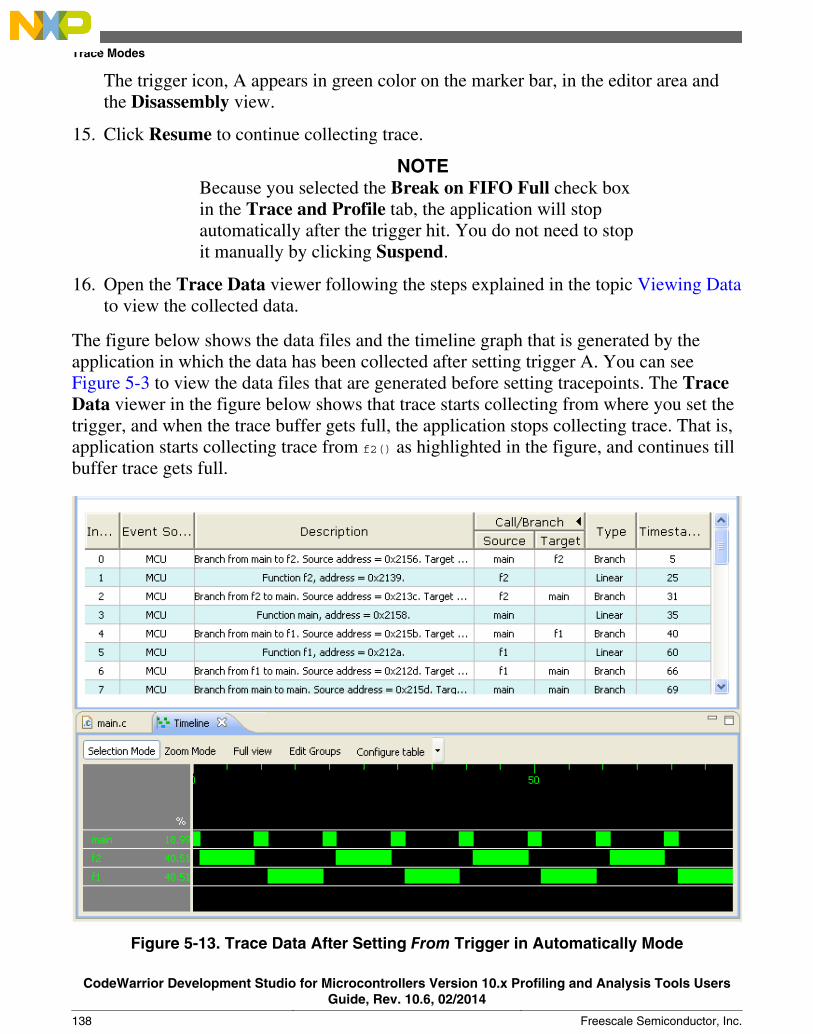
The trigger icon, A appears in green color on the marker bar, in the editor area andthe Disassembly view.
15. Click Resume to continue collecting trace.
NOTEBecause you selected the Break on FIFO Full check boxin the Trace and Profile tab, the application will stopautomatically after the trigger hit. You do not need to stopit manually by clicking Suspend.
16. Open the Trace Data viewer following the steps explained in the topic Viewing Datato view the collected data.
The figure below shows the data files and the timeline graph that is generated by theapplication in which the data has been collected after setting trigger A. You can seeFigure 5-3 to view the data files that are generated before setting tracepoints. The TraceData viewer in the figure below shows that trace starts collecting from where you set thetrigger, and when the trace buffer gets full, the application stops collecting trace. That is,application starts collecting trace from f2() as highlighted in the figure, and continues tillbuffer trace gets full.
Figure 5-13. Trace Data After Setting From Trigger in Automatically Mode
Trace Modes
CodeWarrior Development Studio for Microcontrollers Version 10.x Profiling and Analysis Tools UsersGuide, Rev. 10.6, 02/2014
138 Freescale Semiconductor, Inc.
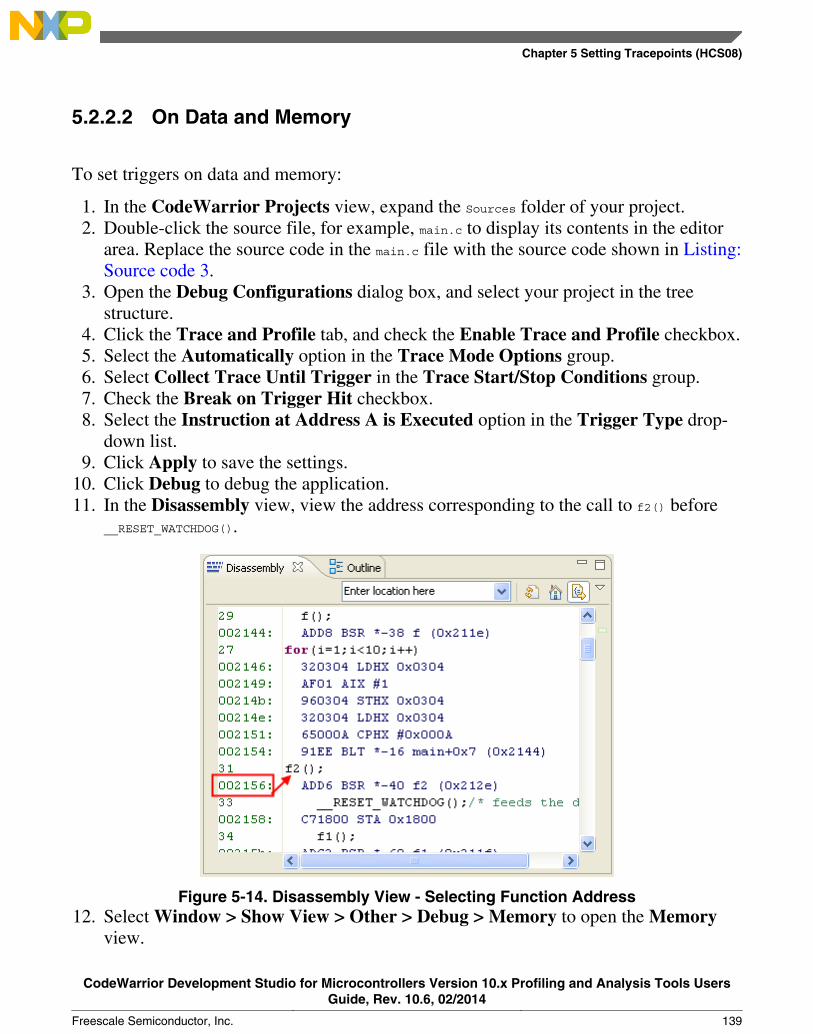
5.2.2.2 On Data and Memory
To set triggers on data and memory:
1. In the CodeWarrior Projects view, expand the Sources folder of your project.2. Double-click the source file, for example, main.c to display its contents in the editor
area. Replace the source code in the main.c file with the source code shown in Listing:Source code 3.
3. Open the Debug Configurations dialog box, and select your project in the treestructure.
4. Click the Trace and Profile tab, and check the Enable Trace and Profile checkbox.5. Select the Automatically option in the Trace Mode Options group.6. Select Collect Trace Until Trigger in the Trace Start/Stop Conditions group.7. Check the Break on Trigger Hit checkbox.8. Select the Instruction at Address A is Executed option in the Trigger Type drop-
down list.9. Click Apply to save the settings.
10. Click Debug to debug the application.11. In the Disassembly view, view the address corresponding to the call to f2() before
__RESET_WATCHDOG().
Figure 5-14. Disassembly View - Selecting Function Address12. Select Window > Show View > Other > Debug > Memory to open the Memory
view.
Chapter 5 Setting Tracepoints (HCS08)
CodeWarrior Development Studio for Microcontrollers Version 10.x Profiling and Analysis Tools UsersGuide, Rev. 10.6, 02/2014
Freescale Semiconductor, Inc. 139
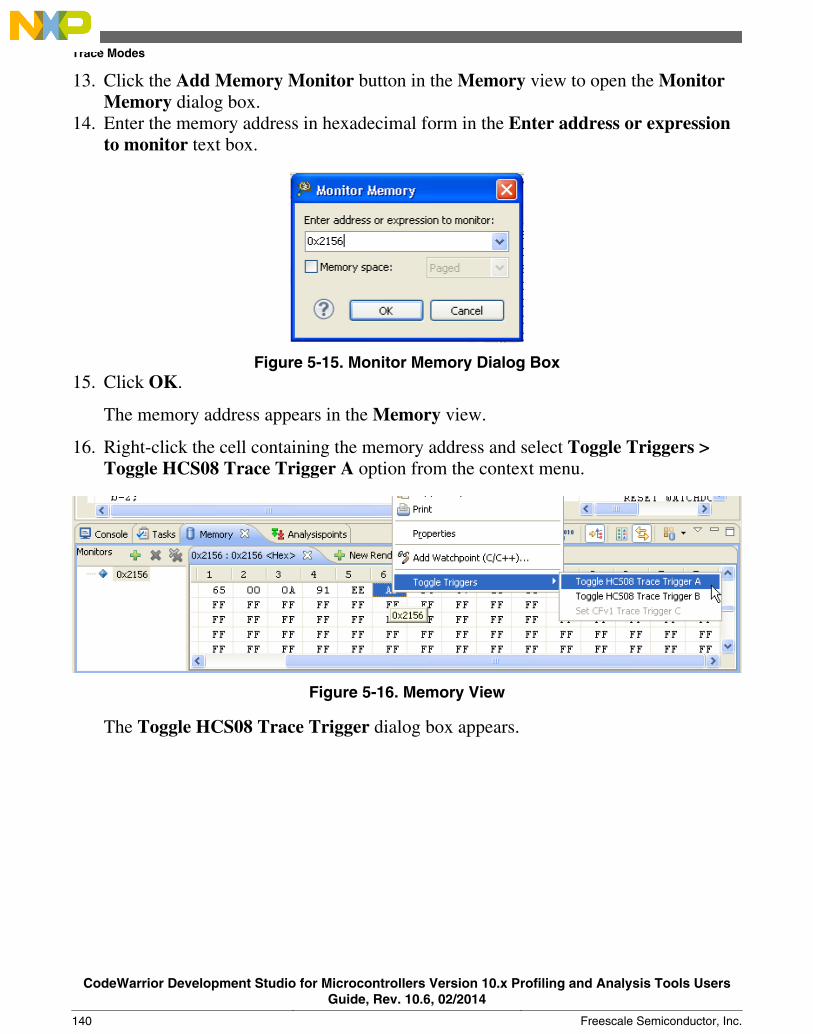
13. Click the Add Memory Monitor button in the Memory view to open the MonitorMemory dialog box.
14. Enter the memory address in hexadecimal form in the Enter address or expressionto monitor text box.
Figure 5-15. Monitor Memory Dialog Box15. Click OK.
The memory address appears in the Memory view.
16. Right-click the cell containing the memory address and select Toggle Triggers >Toggle HCS08 Trace Trigger A option from the context menu.
Figure 5-16. Memory View
The Toggle HCS08 Trace Trigger dialog box appears.
Trace Modes
CodeWarrior Development Studio for Microcontrollers Version 10.x Profiling and Analysis Tools UsersGuide, Rev. 10.6, 02/2014
140 Freescale Semiconductor, Inc.
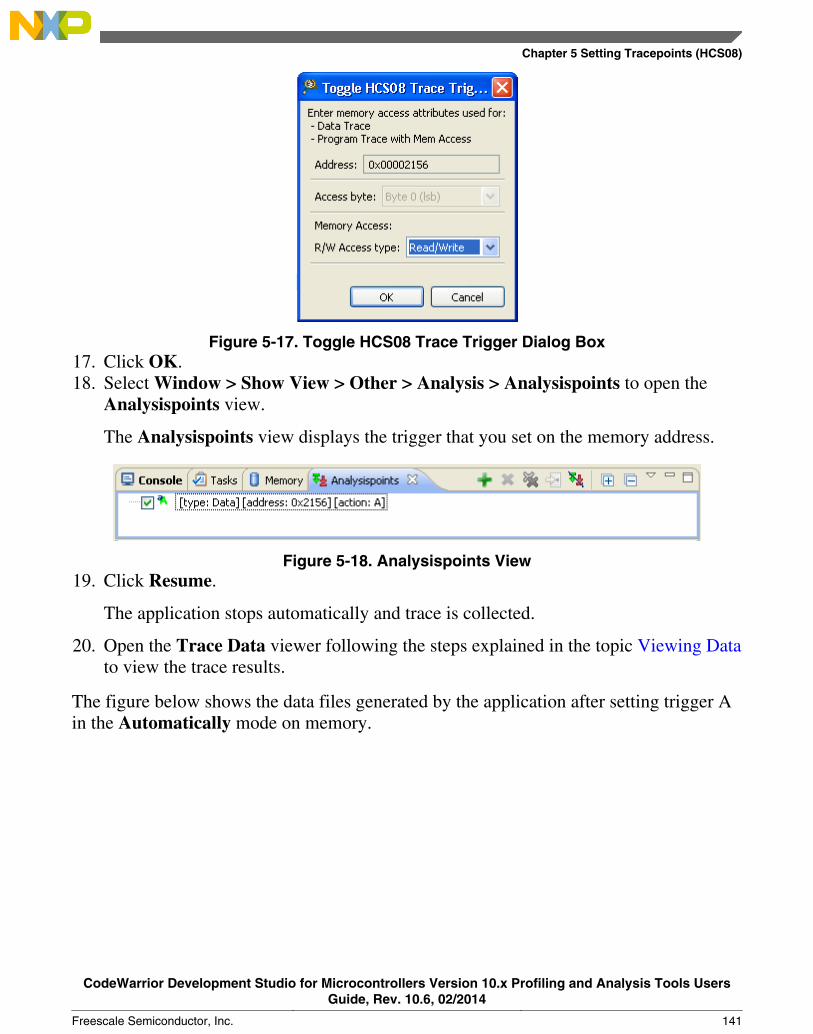
Figure 5-17. Toggle HCS08 Trace Trigger Dialog Box17. Click OK.18. Select Window > Show View > Other > Analysis > Analysispoints to open the
Analysispoints view.
The Analysispoints view displays the trigger that you set on the memory address.
Figure 5-18. Analysispoints View19. Click Resume.
The application stops automatically and trace is collected.
20. Open the Trace Data viewer following the steps explained in the topic Viewing Datato view the trace results.
The figure below shows the data files generated by the application after setting trigger Ain the Automatically mode on memory.
Chapter 5 Setting Tracepoints (HCS08)
CodeWarrior Development Studio for Microcontrollers Version 10.x Profiling and Analysis Tools UsersGuide, Rev. 10.6, 02/2014
Freescale Semiconductor, Inc. 141
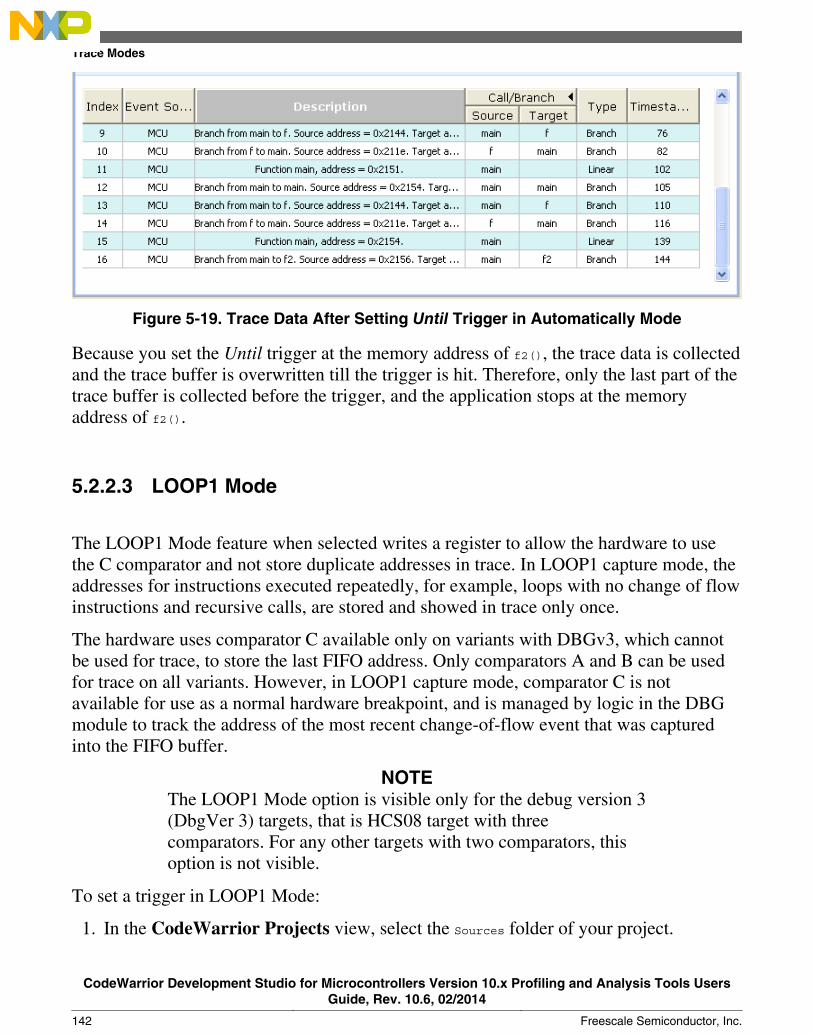
Figure 5-19. Trace Data After Setting Until Trigger in Automatically Mode
Because you set the Until trigger at the memory address of f2(), the trace data is collectedand the trace buffer is overwritten till the trigger is hit. Therefore, only the last part of thetrace buffer is collected before the trigger, and the application stops at the memoryaddress of f2().
5.2.2.3 LOOP1 Mode
The LOOP1 Mode feature when selected writes a register to allow the hardware to usethe C comparator and not store duplicate addresses in trace. In LOOP1 capture mode, theaddresses for instructions executed repeatedly, for example, loops with no change of flowinstructions and recursive calls, are stored and showed in trace only once.
The hardware uses comparator C available only on variants with DBGv3, which cannotbe used for trace, to store the last FIFO address. Only comparators A and B can be usedfor trace on all variants. However, in LOOP1 capture mode, comparator C is notavailable for use as a normal hardware breakpoint, and is managed by logic in the DBGmodule to track the address of the most recent change-of-flow event that was capturedinto the FIFO buffer.
NOTEThe LOOP1 Mode option is visible only for the debug version 3(DbgVer 3) targets, that is HCS08 target with threecomparators. For any other targets with two comparators, thisoption is not visible.
To set a trigger in LOOP1 Mode:
1. In the CodeWarrior Projects view, select the Sources folder of your project.
Trace Modes
CodeWarrior Development Studio for Microcontrollers Version 10.x Profiling and Analysis Tools UsersGuide, Rev. 10.6, 02/2014
142 Freescale Semiconductor, Inc.

2. Double-click the source file, for example, main.c to display its contents in the editorarea. Replace the source code in the main.c file with the source code shown in Listing:Source code 4
3. Save and build the project.4. Open the Debug Configurations dialog box, and select your project in the tree
structure.5. Click the Trace and Profile tab, and check the Enable Trace and Profile checkbox.6. Click Apply to save the settings, and close the Debug Configurations dialog box.7. In the editor area, right-click the marker bar corresponding to the statement,
Recursive(3); in the main() function.8. Select Trace Triggers > Toggle Trace Trigger A from the context menu.9. Open the Debug Configurations dialog box, and click the Trace and Profile tab.
10. Select the Collect Program Trace option in the Trace Mode Options group.11. Select the Automatically option.12. Select the LOOP1 Mode check box.13. Select Collect Trace From Trigger in the Trace Start/Stop Conditions group.14. Check the Break on FIFO Full checkbox.15. Select Instruction at Address A is Executed from the Trigger Type drop-down
list.16. Click Apply to save the settings.17. Click Debug to debug the application.18. Click Resume.
The application stops automatically and collects data in data file.
19. Open the Trace Data viewer following the steps explained in the Viewing Data topicto see the trace results. The following figures show the data files generated by theapplication after setting trigger A in the LOOP1 Mode.
Chapter 5 Setting Tracepoints (HCS08)
CodeWarrior Development Studio for Microcontrollers Version 10.x Profiling and Analysis Tools UsersGuide, Rev. 10.6, 02/2014
Freescale Semiconductor, Inc. 143
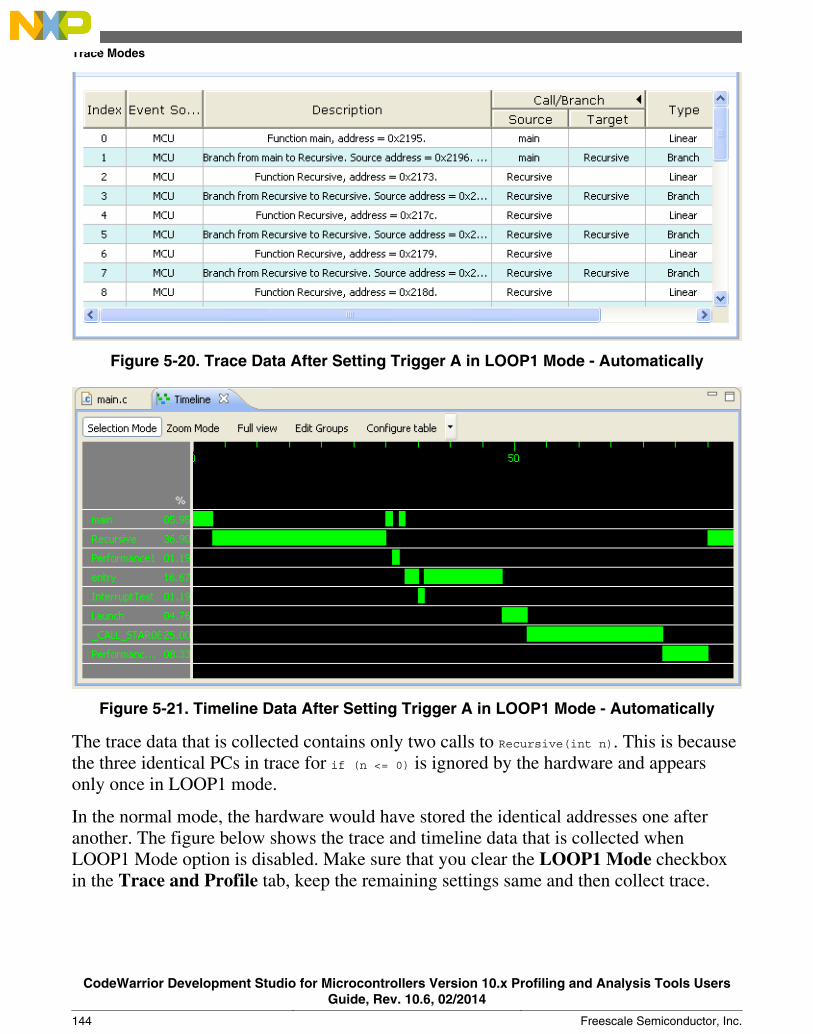
Figure 5-20. Trace Data After Setting Trigger A in LOOP1 Mode - Automatically
Figure 5-21. Timeline Data After Setting Trigger A in LOOP1 Mode - Automatically
The trace data that is collected contains only two calls to Recursive(int n). This is becausethe three identical PCs in trace for if (n <= 0) is ignored by the hardware and appearsonly once in LOOP1 mode.
In the normal mode, the hardware would have stored the identical addresses one afteranother. The figure below shows the trace and timeline data that is collected whenLOOP1 Mode option is disabled. Make sure that you clear the LOOP1 Mode checkboxin the Trace and Profile tab, keep the remaining settings same and then collect trace.
Trace Modes
CodeWarrior Development Studio for Microcontrollers Version 10.x Profiling and Analysis Tools UsersGuide, Rev. 10.6, 02/2014
144 Freescale Semiconductor, Inc.
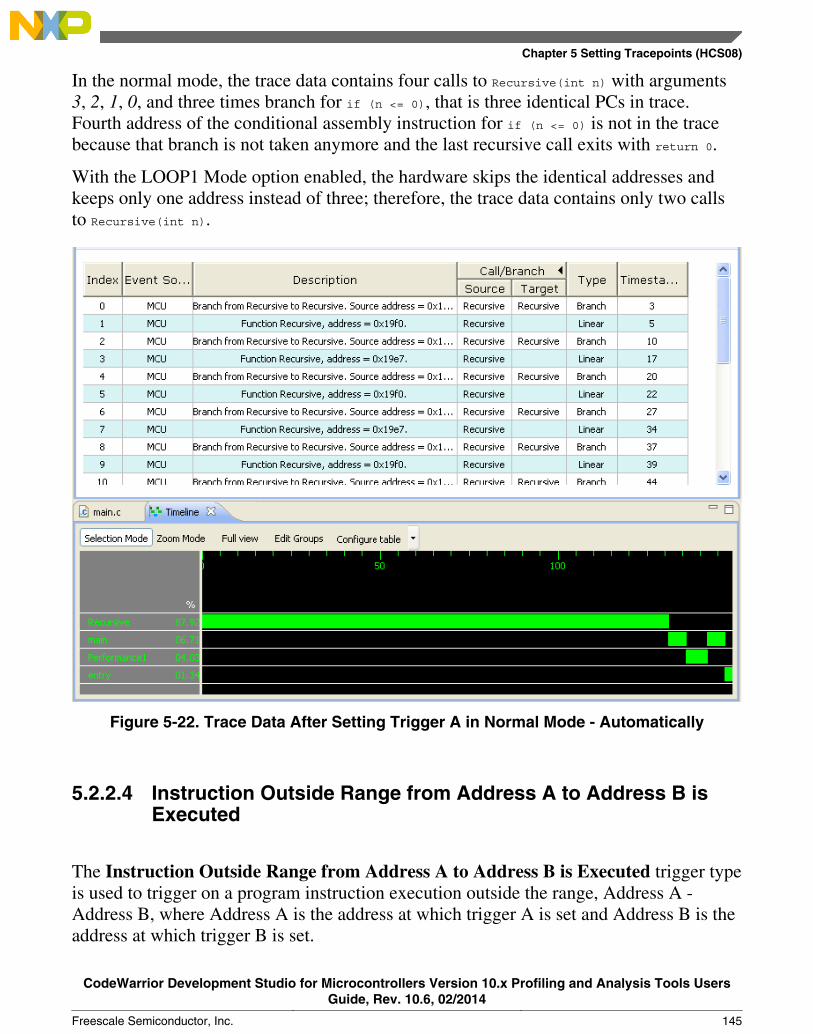
In the normal mode, the trace data contains four calls to Recursive(int n) with arguments3, 2, 1, 0, and three times branch for if (n <= 0), that is three identical PCs in trace.Fourth address of the conditional assembly instruction for if (n <= 0) is not in the tracebecause that branch is not taken anymore and the last recursive call exits with return 0.
With the LOOP1 Mode option enabled, the hardware skips the identical addresses andkeeps only one address instead of three; therefore, the trace data contains only two callsto Recursive(int n).
Figure 5-22. Trace Data After Setting Trigger A in Normal Mode - Automatically
5.2.2.4 Instruction Outside Range from Address A to Address B isExecuted
The Instruction Outside Range from Address A to Address B is Executed trigger typeis used to trigger on a program instruction execution outside the range, Address A -Address B, where Address A is the address at which trigger A is set and Address B is theaddress at which trigger B is set.
Chapter 5 Setting Tracepoints (HCS08)
CodeWarrior Development Studio for Microcontrollers Version 10.x Profiling and Analysis Tools UsersGuide, Rev. 10.6, 02/2014
Freescale Semiconductor, Inc. 145
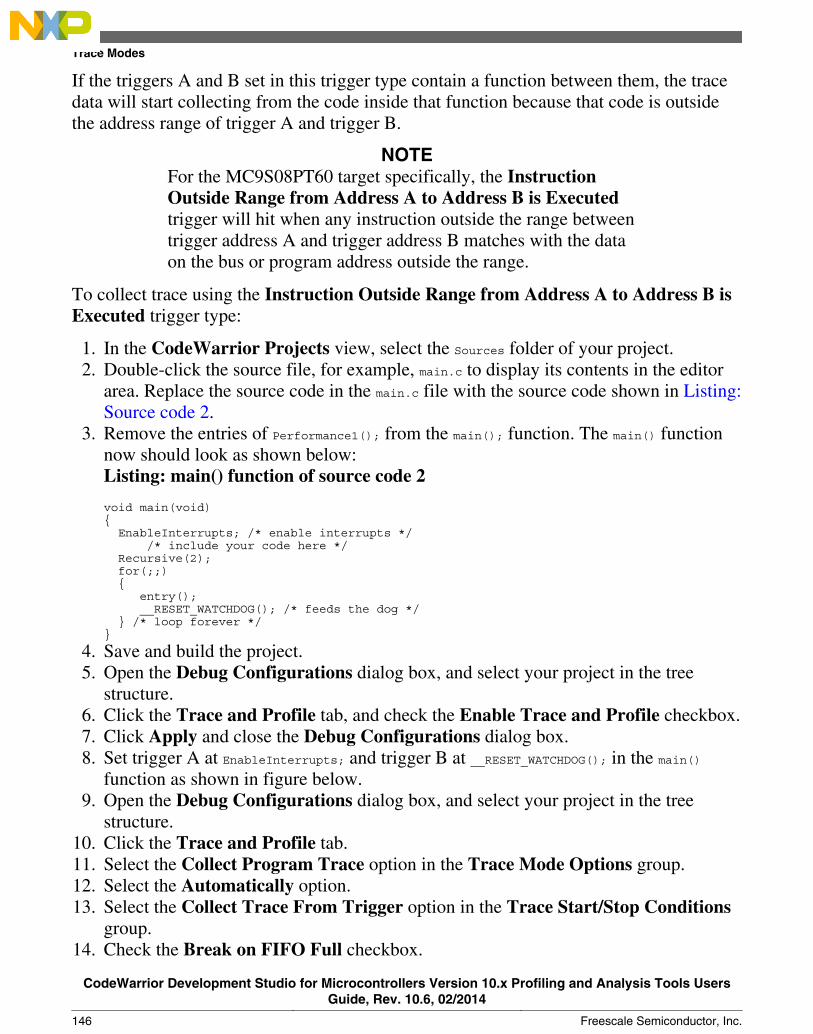
If the triggers A and B set in this trigger type contain a function between them, the tracedata will start collecting from the code inside that function because that code is outsidethe address range of trigger A and trigger B.
NOTEFor the MC9S08PT60 target specifically, the InstructionOutside Range from Address A to Address B is Executedtrigger will hit when any instruction outside the range betweentrigger address A and trigger address B matches with the dataon the bus or program address outside the range.
To collect trace using the Instruction Outside Range from Address A to Address B isExecuted trigger type:
1. In the CodeWarrior Projects view, select the Sources folder of your project.2. Double-click the source file, for example, main.c to display its contents in the editor
area. Replace the source code in the main.c file with the source code shown in Listing:Source code 2.
3. Remove the entries of Performance1(); from the main(); function. The main() functionnow should look as shown below:Listing: main() function of source code 2
void main(void){ EnableInterrupts; /* enable interrupts */ /* include your code here */ Recursive(2); for(;;) { entry(); __RESET_WATCHDOG(); /* feeds the dog */ } /* loop forever */}
4. Save and build the project.5. Open the Debug Configurations dialog box, and select your project in the tree
structure.6. Click the Trace and Profile tab, and check the Enable Trace and Profile checkbox.7. Click Apply and close the Debug Configurations dialog box.8. Set trigger A at EnableInterrupts; and trigger B at __RESET_WATCHDOG(); in the main()
function as shown in figure below.9. Open the Debug Configurations dialog box, and select your project in the tree
structure.10. Click the Trace and Profile tab.11. Select the Collect Program Trace option in the Trace Mode Options group.12. Select the Automatically option.13. Select the Collect Trace From Trigger option in the Trace Start/Stop Conditions
group.14. Check the Break on FIFO Full checkbox.
Trace Modes
CodeWarrior Development Studio for Microcontrollers Version 10.x Profiling and Analysis Tools UsersGuide, Rev. 10.6, 02/2014
146 Freescale Semiconductor, Inc.
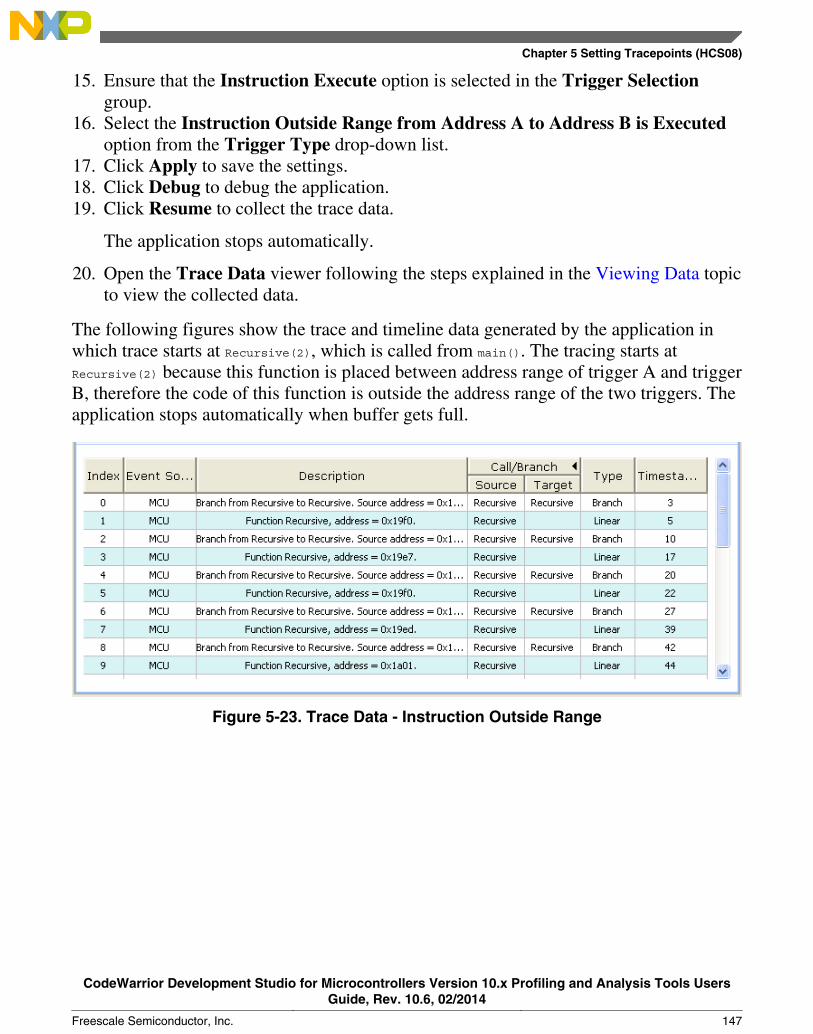
15. Ensure that the Instruction Execute option is selected in the Trigger Selectiongroup.
16. Select the Instruction Outside Range from Address A to Address B is Executedoption from the Trigger Type drop-down list.
17. Click Apply to save the settings.18. Click Debug to debug the application.19. Click Resume to collect the trace data.
The application stops automatically.
20. Open the Trace Data viewer following the steps explained in the Viewing Data topicto view the collected data.
The following figures show the trace and timeline data generated by the application inwhich trace starts at Recursive(2), which is called from main(). The tracing starts atRecursive(2) because this function is placed between address range of trigger A and triggerB, therefore the code of this function is outside the address range of the two triggers. Theapplication stops automatically when buffer gets full.
Figure 5-23. Trace Data - Instruction Outside Range
Chapter 5 Setting Tracepoints (HCS08)
CodeWarrior Development Studio for Microcontrollers Version 10.x Profiling and Analysis Tools UsersGuide, Rev. 10.6, 02/2014
Freescale Semiconductor, Inc. 147
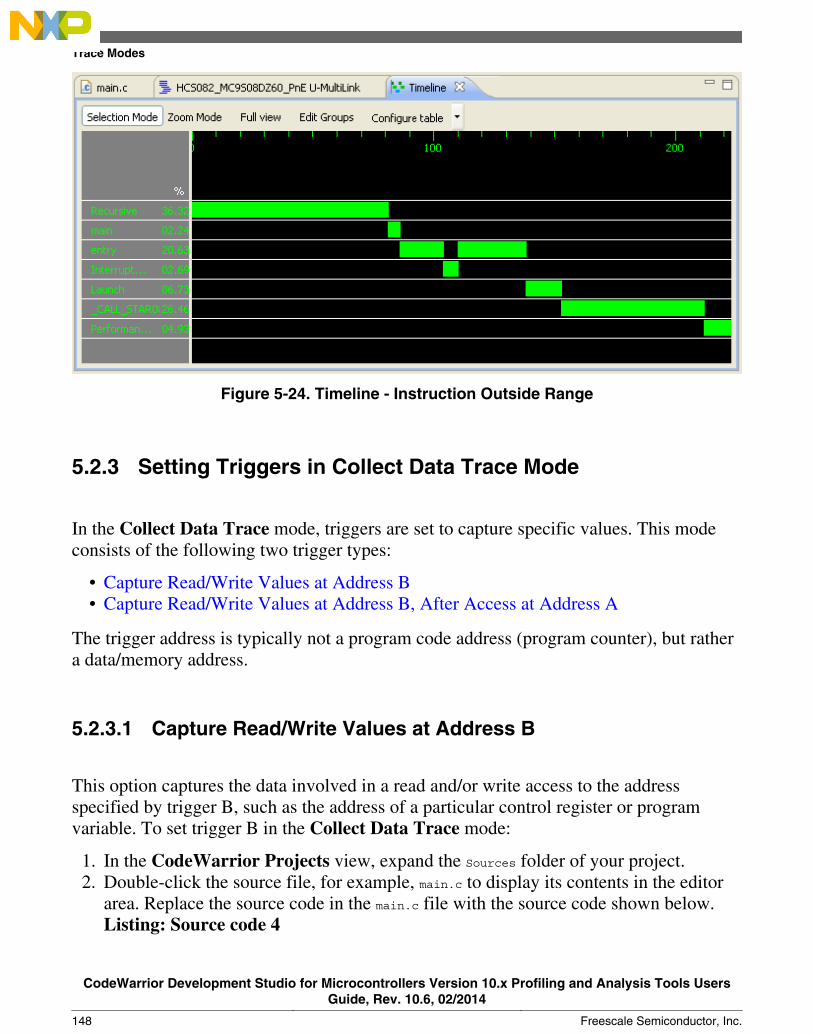
Figure 5-24. Timeline - Instruction Outside Range
5.2.3 Setting Triggers in Collect Data Trace Mode
In the Collect Data Trace mode, triggers are set to capture specific values. This modeconsists of the following two trigger types:
• Capture Read/Write Values at Address B• Capture Read/Write Values at Address B, After Access at Address A
The trigger address is typically not a program code address (program counter), but rathera data/memory address.
5.2.3.1 Capture Read/Write Values at Address B
This option captures the data involved in a read and/or write access to the addressspecified by trigger B, such as the address of a particular control register or programvariable. To set trigger B in the Collect Data Trace mode:
1. In the CodeWarrior Projects view, expand the Sources folder of your project.2. Double-click the source file, for example, main.c to display its contents in the editor
area. Replace the source code in the main.c file with the source code shown below.Listing: Source code 4
Trace Modes
CodeWarrior Development Studio for Microcontrollers Version 10.x Profiling and Analysis Tools UsersGuide, Rev. 10.6, 02/2014
148 Freescale Semiconductor, Inc.
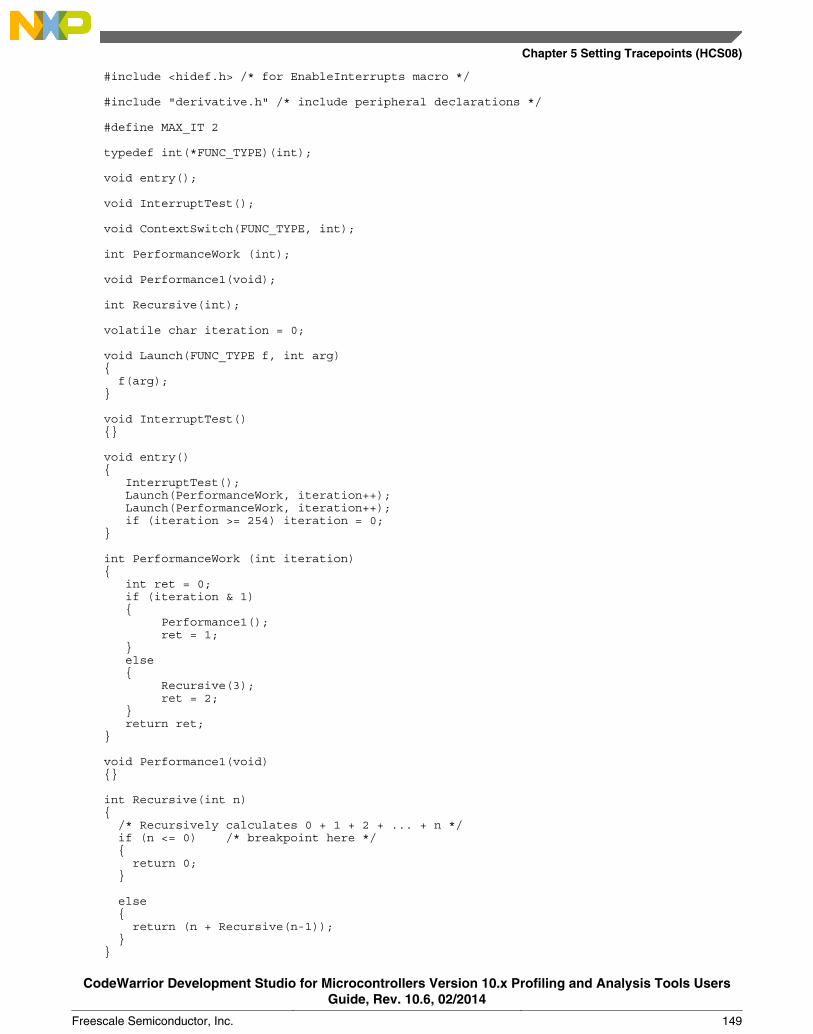
#include <hidef.h> /* for EnableInterrupts macro */
#include "derivative.h" /* include peripheral declarations */
#define MAX_IT 2
typedef int(*FUNC_TYPE)(int);
void entry();
void InterruptTest();
void ContextSwitch(FUNC_TYPE, int);
int PerformanceWork (int);
void Performance1(void);
int Recursive(int);
volatile char iteration = 0;
void Launch(FUNC_TYPE f, int arg){ f(arg);}
void InterruptTest(){}
void entry(){ InterruptTest(); Launch(PerformanceWork, iteration++); Launch(PerformanceWork, iteration++); if (iteration >= 254) iteration = 0;}
int PerformanceWork (int iteration){ int ret = 0; if (iteration & 1) { Performance1(); ret = 1; } else { Recursive(3); ret = 2; } return ret;}
void Performance1(void){}
int Recursive(int n){ /* Recursively calculates 0 + 1 + 2 + ... + n */ if (n <= 0) /* breakpoint here */ { return 0; }
else { return (n + Recursive(n-1)); }}
Chapter 5 Setting Tracepoints (HCS08)
CodeWarrior Development Studio for Microcontrollers Version 10.x Profiling and Analysis Tools UsersGuide, Rev. 10.6, 02/2014
Freescale Semiconductor, Inc. 149

void main(void){ EnableInterrupts; /* enable interrupts */ /* include your code here */ Performance1(); Recursive(3); Performance1(); for(;;) { entry(); __RESET_WATCHDOG(); /* feeds the dog */ } /* loop forever */ /* please make sure that you never leave main */}
3. Save and build the project.4. Open the Debug Configurations dialog box, and select your project in the tree
structure.5. Click the Trace and Profile tab, and check the Enable Trace and Profile checkbox.6. Select the Collect Data Trace option in the Trace Mode Options group.7. Select Collect Trace From Trigger in the Trace Start/Stop Conditions group.8. Check the Break on FIFO Full checkbox.9. Select Capture Read/Write Values at Address B from the Trigger Type drop-
down list.10. Click Apply to save the settings.11. Click Debug to debug the application.12. In the Debug window, right-click in the Name column of the Variables view.13. Select the Add Global Variables option from the context menu.
The Add Globals dialog box appears.
14. Select iteration from the list of available variables.15. Click OK.
The entry for the iteration variable gets added to the Variables view.
16. Right-click the variable iteration and select Toggle Triggers > Toggle HCS08Trace Trigger B from the context menu.
The Toggle HCS08 Trace Trigger B dialog box appears.
17. Click OK.18. Select Window > Show View > Other > Analysis > Analysispoints to open the
Analysispoints view.
The Analysispoints view displays trigger B that you set on the iteration variable.
Trace Modes
CodeWarrior Development Studio for Microcontrollers Version 10.x Profiling and Analysis Tools UsersGuide, Rev. 10.6, 02/2014
150 Freescale Semiconductor, Inc.
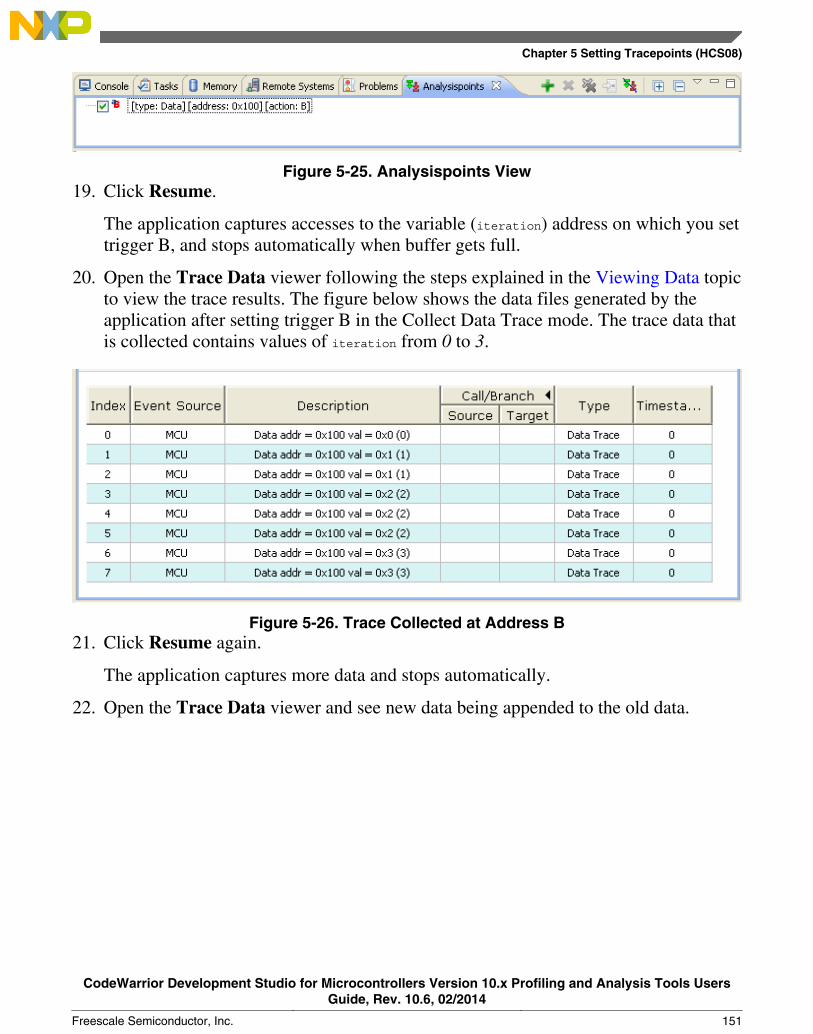
Figure 5-25. Analysispoints View19. Click Resume.
The application captures accesses to the variable (iteration) address on which you settrigger B, and stops automatically when buffer gets full.
20. Open the Trace Data viewer following the steps explained in the Viewing Data topicto view the trace results. The figure below shows the data files generated by theapplication after setting trigger B in the Collect Data Trace mode. The trace data thatis collected contains values of iteration from 0 to 3.
Figure 5-26. Trace Collected at Address B21. Click Resume again.
The application captures more data and stops automatically.
22. Open the Trace Data viewer and see new data being appended to the old data.
Chapter 5 Setting Tracepoints (HCS08)
CodeWarrior Development Studio for Microcontrollers Version 10.x Profiling and Analysis Tools UsersGuide, Rev. 10.6, 02/2014
Freescale Semiconductor, Inc. 151
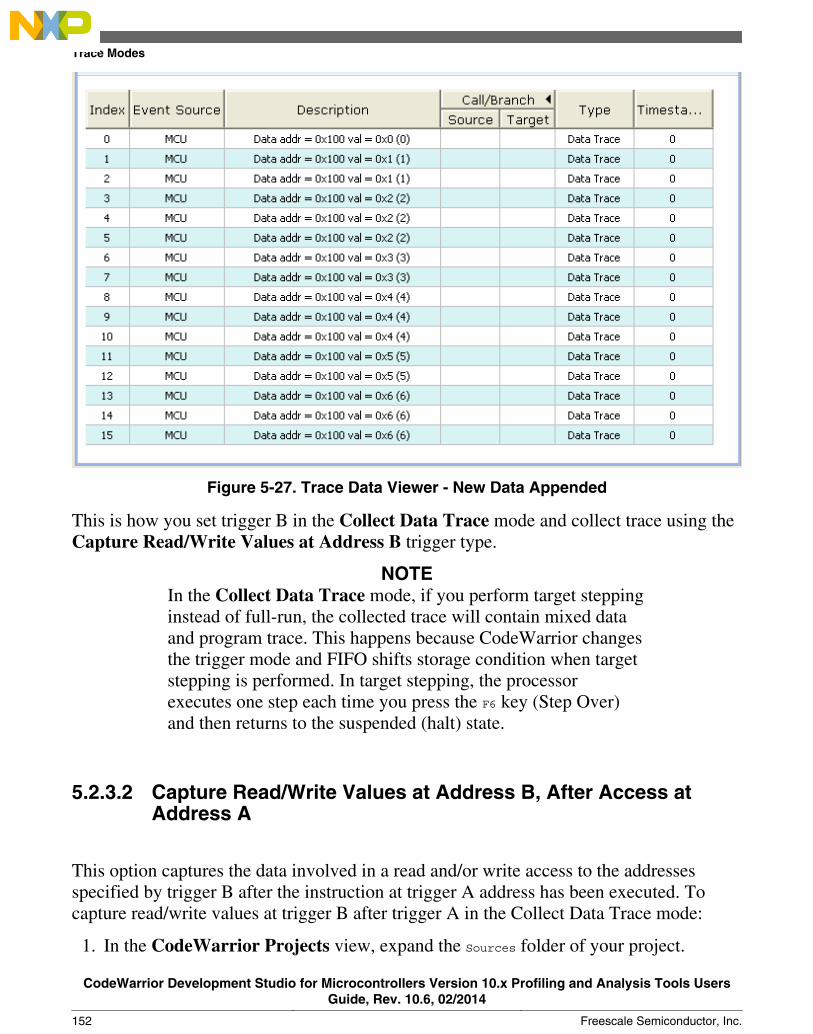
Figure 5-27. Trace Data Viewer - New Data Appended
This is how you set trigger B in the Collect Data Trace mode and collect trace using theCapture Read/Write Values at Address B trigger type.
NOTEIn the Collect Data Trace mode, if you perform target steppinginstead of full-run, the collected trace will contain mixed dataand program trace. This happens because CodeWarrior changesthe trigger mode and FIFO shifts storage condition when targetstepping is performed. In target stepping, the processorexecutes one step each time you press the F6 key (Step Over)and then returns to the suspended (halt) state.
5.2.3.2 Capture Read/Write Values at Address B, After Access atAddress A
This option captures the data involved in a read and/or write access to the addressesspecified by trigger B after the instruction at trigger A address has been executed. Tocapture read/write values at trigger B after trigger A in the Collect Data Trace mode:
1. In the CodeWarrior Projects view, expand the Sources folder of your project.
Trace Modes
CodeWarrior Development Studio for Microcontrollers Version 10.x Profiling and Analysis Tools UsersGuide, Rev. 10.6, 02/2014
152 Freescale Semiconductor, Inc.
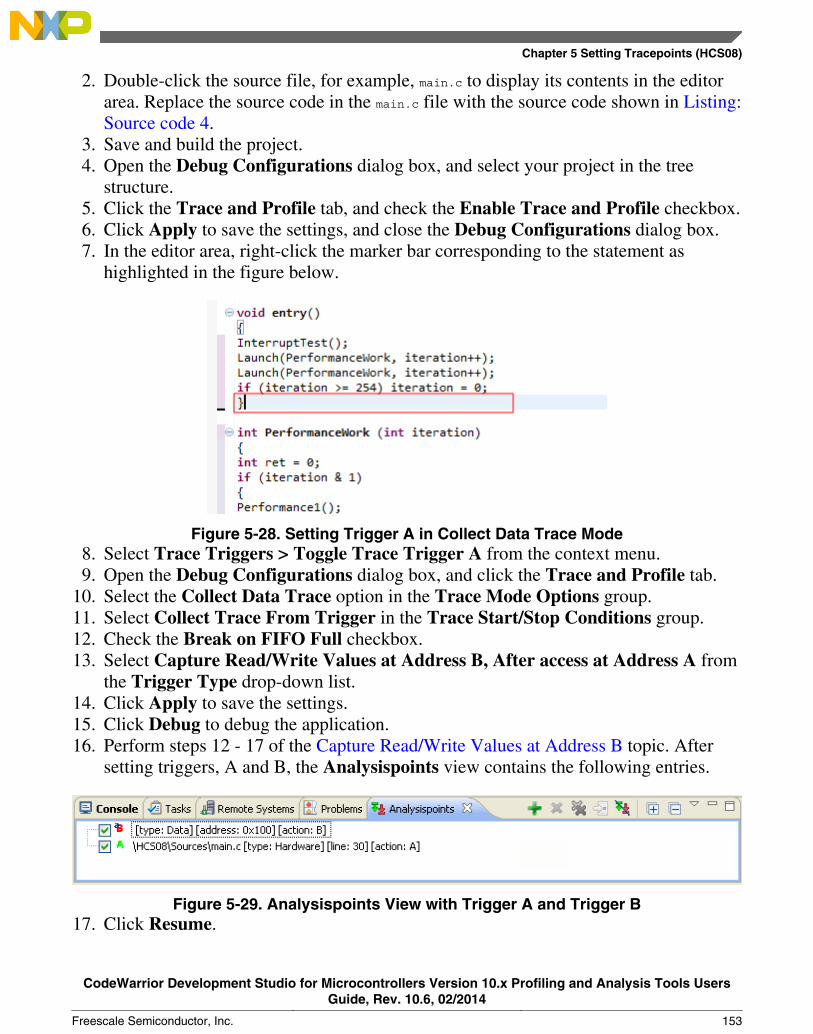
2. Double-click the source file, for example, main.c to display its contents in the editorarea. Replace the source code in the main.c file with the source code shown in Listing:Source code 4.
3. Save and build the project.4. Open the Debug Configurations dialog box, and select your project in the tree
structure.5. Click the Trace and Profile tab, and check the Enable Trace and Profile checkbox.6. Click Apply to save the settings, and close the Debug Configurations dialog box.7. In the editor area, right-click the marker bar corresponding to the statement as
highlighted in the figure below.
Figure 5-28. Setting Trigger A in Collect Data Trace Mode8. Select Trace Triggers > Toggle Trace Trigger A from the context menu.9. Open the Debug Configurations dialog box, and click the Trace and Profile tab.
10. Select the Collect Data Trace option in the Trace Mode Options group.11. Select Collect Trace From Trigger in the Trace Start/Stop Conditions group.12. Check the Break on FIFO Full checkbox.13. Select Capture Read/Write Values at Address B, After access at Address A from
the Trigger Type drop-down list.14. Click Apply to save the settings.15. Click Debug to debug the application.16. Perform steps 12 - 17 of the Capture Read/Write Values at Address B topic. After
setting triggers, A and B, the Analysispoints view contains the following entries.
Figure 5-29. Analysispoints View with Trigger A and Trigger B17. Click Resume.
Chapter 5 Setting Tracepoints (HCS08)
CodeWarrior Development Studio for Microcontrollers Version 10.x Profiling and Analysis Tools UsersGuide, Rev. 10.6, 02/2014
Freescale Semiconductor, Inc. 153
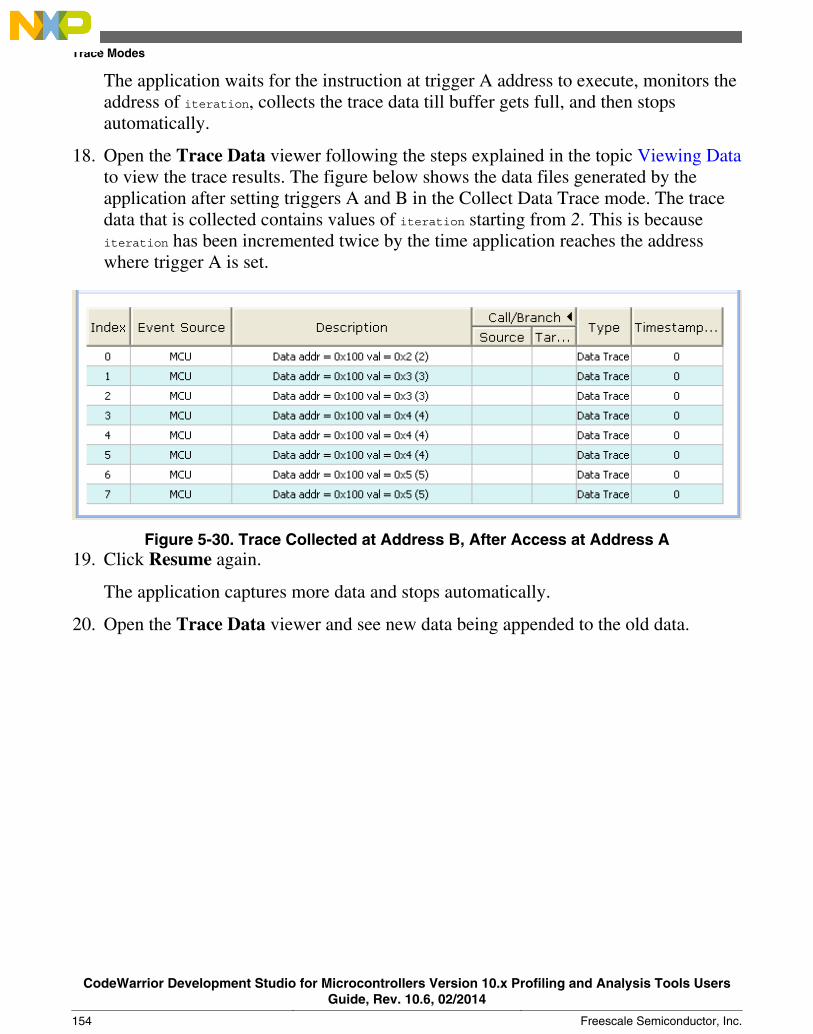
The application waits for the instruction at trigger A address to execute, monitors theaddress of iteration, collects the trace data till buffer gets full, and then stopsautomatically.
18. Open the Trace Data viewer following the steps explained in the topic Viewing Datato view the trace results. The figure below shows the data files generated by theapplication after setting triggers A and B in the Collect Data Trace mode. The tracedata that is collected contains values of iteration starting from 2. This is becauseiteration has been incremented twice by the time application reaches the addresswhere trigger A is set.
Figure 5-30. Trace Collected at Address B, After Access at Address A19. Click Resume again.
The application captures more data and stops automatically.
20. Open the Trace Data viewer and see new data being appended to the old data.
Trace Modes
CodeWarrior Development Studio for Microcontrollers Version 10.x Profiling and Analysis Tools UsersGuide, Rev. 10.6, 02/2014
154 Freescale Semiconductor, Inc.
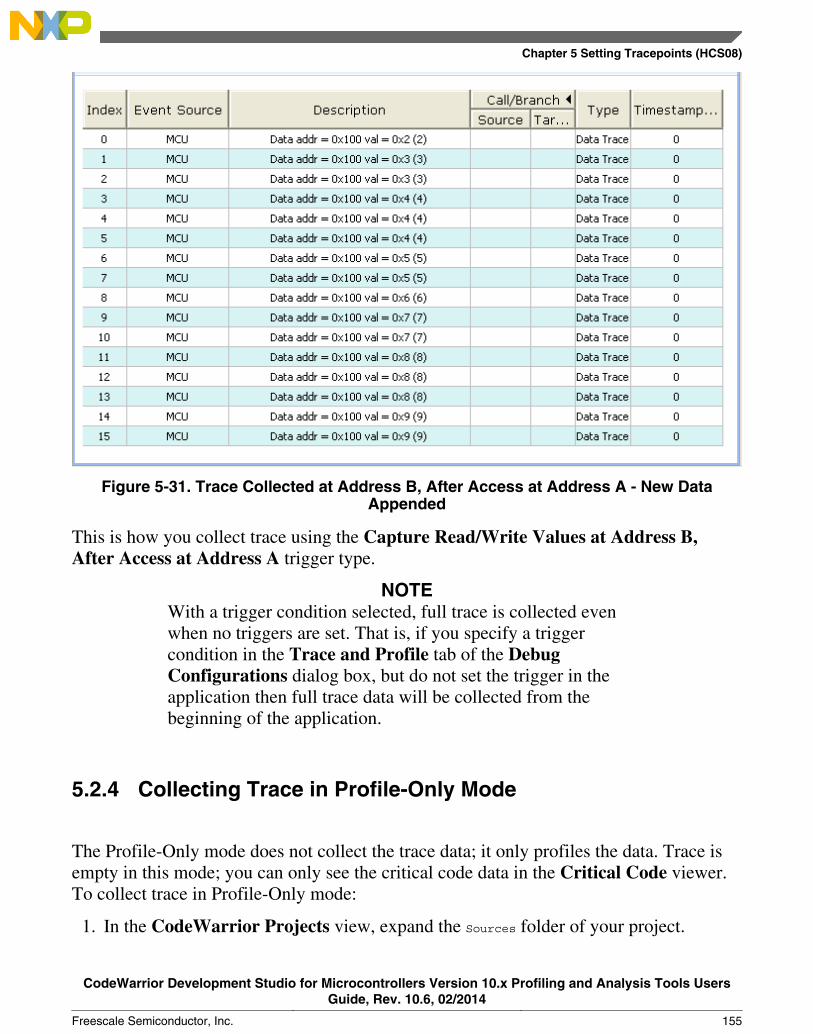
Figure 5-31. Trace Collected at Address B, After Access at Address A - New DataAppended
This is how you collect trace using the Capture Read/Write Values at Address B,After Access at Address A trigger type.
NOTEWith a trigger condition selected, full trace is collected evenwhen no triggers are set. That is, if you specify a triggercondition in the Trace and Profile tab of the DebugConfigurations dialog box, but do not set the trigger in theapplication then full trace data will be collected from thebeginning of the application.
5.2.4 Collecting Trace in Profile-Only Mode
The Profile-Only mode does not collect the trace data; it only profiles the data. Trace isempty in this mode; you can only see the critical code data in the Critical Code viewer.To collect trace in Profile-Only mode:
1. In the CodeWarrior Projects view, expand the Sources folder of your project.
Chapter 5 Setting Tracepoints (HCS08)
CodeWarrior Development Studio for Microcontrollers Version 10.x Profiling and Analysis Tools UsersGuide, Rev. 10.6, 02/2014
Freescale Semiconductor, Inc. 155
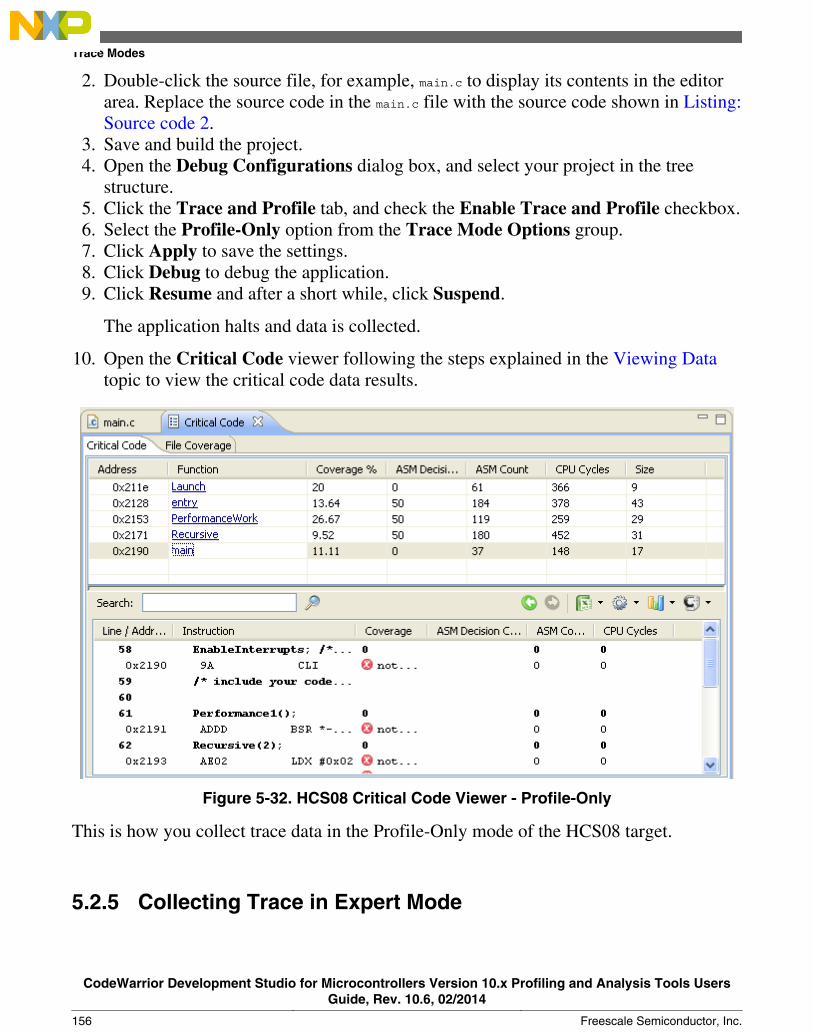
2. Double-click the source file, for example, main.c to display its contents in the editorarea. Replace the source code in the main.c file with the source code shown in Listing:Source code 2.
3. Save and build the project.4. Open the Debug Configurations dialog box, and select your project in the tree
structure.5. Click the Trace and Profile tab, and check the Enable Trace and Profile checkbox.6. Select the Profile-Only option from the Trace Mode Options group.7. Click Apply to save the settings.8. Click Debug to debug the application.9. Click Resume and after a short while, click Suspend.
The application halts and data is collected.
10. Open the Critical Code viewer following the steps explained in the Viewing Datatopic to view the critical code data results.
Figure 5-32. HCS08 Critical Code Viewer - Profile-Only
This is how you collect trace data in the Profile-Only mode of the HCS08 target.
5.2.5 Collecting Trace in Expert Mode
Trace Modes
CodeWarrior Development Studio for Microcontrollers Version 10.x Profiling and Analysis Tools UsersGuide, Rev. 10.6, 02/2014
156 Freescale Semiconductor, Inc.
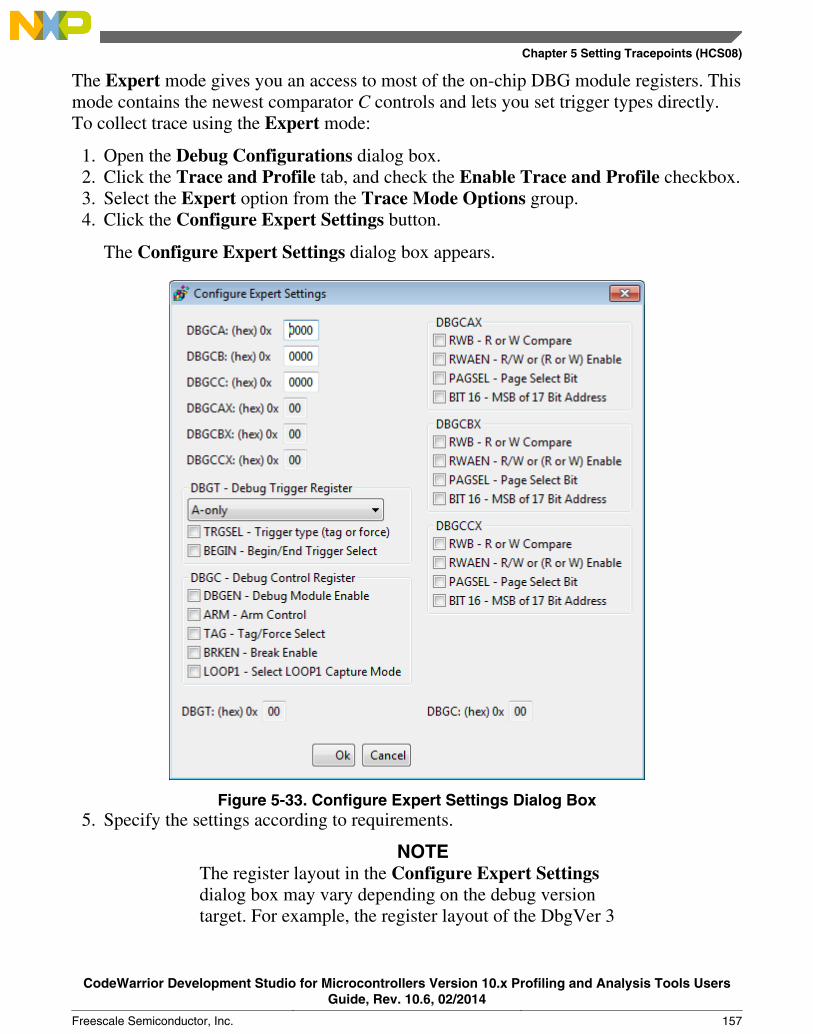
The Expert mode gives you an access to most of the on-chip DBG module registers. Thismode contains the newest comparator C controls and lets you set trigger types directly.To collect trace using the Expert mode:
1. Open the Debug Configurations dialog box.2. Click the Trace and Profile tab, and check the Enable Trace and Profile checkbox.3. Select the Expert option from the Trace Mode Options group.4. Click the Configure Expert Settings button.
The Configure Expert Settings dialog box appears.
Figure 5-33. Configure Expert Settings Dialog Box5. Specify the settings according to requirements.
NOTEThe register layout in the Configure Expert Settingsdialog box may vary depending on the debug versiontarget. For example, the register layout of the DbgVer 3
Chapter 5 Setting Tracepoints (HCS08)
CodeWarrior Development Studio for Microcontrollers Version 10.x Profiling and Analysis Tools UsersGuide, Rev. 10.6, 02/2014
Freescale Semiconductor, Inc. 157
target might be different from the register layout of theDbgVer 2 target.
6. Click OK to save the settings.7. Click Apply in the Debug Configurations dialog box.8. Click Debug and collect trace.
NOTEIn Expert mode, only Trace and Timeline data is collected.
This is how you collect trace data in the Expert mode of the HCS08 target.
NOTEFor HCS08 PT16 and PA4 families (PT/PL/PA16, PT/PL/PA8,PA4, PA2), the trace triggers set on the Variables or Memoryviews, with Memory Access set to “Write” or “Read/Write”,will not work correctly due to a hardware issue of the DBGmodule when writing to SRAM memory. When using thesetype of triggers:
• Data Trace will not work as expected. Only the readaccesses will be traced or the hardware trace will betriggered.
• Program trace start/stop conditions involving data busmatch/mismatch will not work. The hardware trace will notbe triggered.
• Advanced developers using the Configuration set in Usercode option or the Expert trace option must avoid usingtrigger conditions (writing trigger registers manually)which involve tracing or triggering on write accesses, suchas “Event B only”, “A then Event only B”, “A and (not) B”hardware trigger modes.
This is applicable for some early revisions of the PT60 family(PT/PL/PA60 and PT/PL/PA32) also.
5.3 Enabling and Disabling the Tracepoints
If you want to enable the tracepoints, right-click the marker bar where trigger A andtrigger B are already set and in disabled state, select the Enable Tracepoint option fromthe context menu.
Enabling and Disabling the Tracepoints
CodeWarrior Development Studio for Microcontrollers Version 10.x Profiling and Analysis Tools UsersGuide, Rev. 10.6, 02/2014
158 Freescale Semiconductor, Inc.
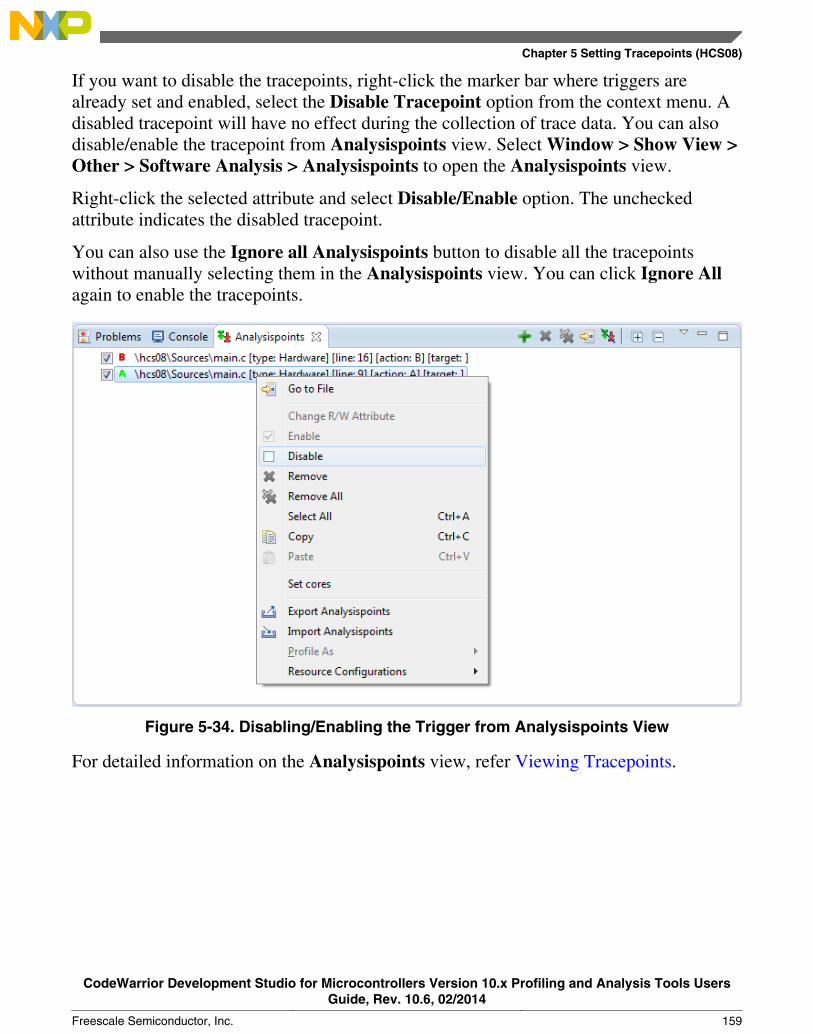
If you want to disable the tracepoints, right-click the marker bar where triggers arealready set and enabled, select the Disable Tracepoint option from the context menu. Adisabled tracepoint will have no effect during the collection of trace data. You can alsodisable/enable the tracepoint from Analysispoints view. Select Window > Show View >Other > Software Analysis > Analysispoints to open the Analysispoints view.
Right-click the selected attribute and select Disable/Enable option. The uncheckedattribute indicates the disabled tracepoint.
You can also use the Ignore all Analysispoints button to disable all the tracepointswithout manually selecting them in the Analysispoints view. You can click Ignore Allagain to enable the tracepoints.
Figure 5-34. Disabling/Enabling the Trigger from Analysispoints View
For detailed information on the Analysispoints view, refer Viewing Tracepoints.
Chapter 5 Setting Tracepoints (HCS08)
CodeWarrior Development Studio for Microcontrollers Version 10.x Profiling and Analysis Tools UsersGuide, Rev. 10.6, 02/2014
Freescale Semiconductor, Inc. 159

Enabling and Disabling the Tracepoints
CodeWarrior Development Studio for Microcontrollers Version 10.x Profiling and Analysis Tools UsersGuide, Rev. 10.6, 02/2014
160 Freescale Semiconductor, Inc.

Chapter 6Setting Tracepoints (ColdFire V1)Tracepoint is a point in the target program where start or stop triggers are set at a line ofsource code or assembly code and on the memory address. The start and stop tracepointsare triggers for enabling and disabling the trace output. The advantage of setting start andstop tracepoints is to capture the trace data from the specific part of the program. Theysolve the problem of tracing a very large application. A full trace would be extremelydifficult to follow and would also require a large amount of target memory to store it. Thetrace data displays the trace result based on the tracepoints. This chapter explains how toset start and stop tracepoints and how to enable and disable a tracepoint.
The tracepoints for the ColdFire V1 target can be set on:
• addresses and source files
The tracepoints on addresses and source files can be set in the editor area and theDisassembly view. The source line tracepoint is set in the editor area, and theaddress tracepoint is set in the Disassembly view.
• data and memory
The tracepoints on data and memory can be set from the Variables and Memoryviews.
This chapter consists of the following topics:
• Conditions for Starting/Stopping Triggers• Trace Modes• Tracepoints on Data and Memory• Enable and Disable Tracepoints
6.1 Conditions for Starting/Stopping Triggers
CodeWarrior Development Studio for Microcontrollers Version 10.x Profiling and Analysis Tools UsersGuide, Rev. 10.6, 02/2014
Freescale Semiconductor, Inc. 161

In the ColdFire V1 target, the triggers, A, B, and C are used to start and stop the tracecollection. The triggers, A and B are set on a function address and trigger C is set on avariable address. The trace collection starts or ends depending on the trace mode selectedalong with a combination of the following actions involving A, B, and C.
• Trace is always enabled - Trace remains enabled all the time during the applicationrun. The trace data is collected from the beginning till end of the debug session.
• Trace from Trigger A Onward - Trace is disabled initially. Once the applicationstarts and the execution reaches the instruction where trigger A is set, trace isautomatically enabled by the hardware, without stopping the core. Trace remainsenabled for the rest of the debug session, that is until you suspend the application.
• Trace from Trigger A to Trigger B - The trace gets enabled at trigger A and startscollecting from there. Once the execution reaches the instruction where trigger B isset, the trace is automatically disabled by the hardware. After the trace is disabled, itis not restarted. However, if the application is stopped either automatically ormanually, the CodeWarrior resets the trace module. Therefore, if you resume theapplication later and the execution reaches trigger A again, trace automaticallyrestarts and repeats the same cycle.
• Trace from Trigger A to Trigger C - Same as Trace from Trigger A to Trigger Bexcept that trigger C is set on the variable addresses.
• Trace from Trigger B Onward - The application starts and enables trace at triggerB, which remains enabled through out the debug session.
• Trace from Trigger B to Trigger A - Trace enables at trigger B and disables attrigger A. The trace collection follows the same approach as Trace from Trigger Ato Trigger B.
• Trace from Trigger B to Trigger C - Trace enables at trigger B and disables attrigger C. The trace collection follows the same approach as Trace from Trigger Ato Trigger B.
• Trace from Trigger C Onward - The application starts and enables trace at triggerC, which remains enabled through out the debug session.
• Trace from Trigger C to Trigger A - Trace enables at trigger C and disables attrigger A. The trace collection follows the same approach as Trace from Trigger Ato Trigger B.
• Trace from Trigger C to Trigger B - Trace enables at trigger C and disables attrigger B. The trace collection follows the same approach as Trace from Trigger Ato Trigger B.
NOTEIn the Automatic (One-buffer) mode, if you check the Haltthe Target when Trace Buffer Gets Full checkbox, the tracestarts collecting from trigger A till the buffer gets full. If you donot check the checkbox, the trace is collected till you suspend
Conditions for Starting/Stopping Triggers
CodeWarrior Development Studio for Microcontrollers Version 10.x Profiling and Analysis Tools UsersGuide, Rev. 10.6, 02/2014
162 Freescale Semiconductor, Inc.
the application manually. And you will only see the last portionof trace in the Trace Data viewer because the internal tracebuffer is overwritten. It holds for all the above options.
WarningDo not use breakpoints with triggers when collecting trace onthe ColdFire V1 target. This is because there is only onehardware debug module on ColdFire V1 which is shared forsetting hardware breakpoints or trace triggers. So you can eitherset breakpoint or trace trigger using this debug module.
6.2 Trace Modes
The triggers can be set in the following trace modes:
• Continuous - Setting Triggers in Continuous Mode• Automatic (One-buffer) - Setting Triggers in Automatic (One-buffer) Mode• Profile-Only - Setting Triggers in Profile-Only Mode• Expert - Setting Triggers in Expert Mode
6.2.1 Setting Triggers in Continuous Mode
The Continuous mode collects trace continuously till you suspend the target application.This topic explains how to set the following trace conditions in the editor area in theContinuous mode:
• Trace From Trigger A Onward• Trace From Trigger A to Trigger B
Before setting the tracepoints, see Collecting Data chapter for the procedure of how tocollect the trace and profiling data.
6.2.1.1 Trace From Trigger A Onward
To set trigger A in the editor area for the ColdFire V1 target:
1. In the CodeWarrior Projects view, select the Sources folder of your project.
Chapter 6 Setting Tracepoints (ColdFire V1)
CodeWarrior Development Studio for Microcontrollers Version 10.x Profiling and Analysis Tools UsersGuide, Rev. 10.6, 02/2014
Freescale Semiconductor, Inc. 163

2. Double-click the source file, for example, main.c to display its contents in the editorarea. Replace the source code of the main.c file with the source code shown below.Listing: Source code for trace collection
#include <hidef.h> /* for EnableInterrupts macro */
#include "derivative.h" /* include peripheral declarations */
volatile int a, b, c, i;
void f(){ c=1; c=2; c=3;}
void f1(){ b=1; b=2; b=3;}
void f2(){ a=1; a=2; a=3;}
void main(void) { EnableInterrupts; /* include your code here */ for(i=1;i<10;i++) { f(); }
f2();
for(;;) { __RESET_WATCHDOG();/* feeds the dog */
f1(); f2(); } /* loop forever */}
3. Save and build the project.4. Open the Debug Configurations dialog box, and select your project in the tree
structure.5. Click the Trace and Profile tab, and check the Enable Trace and Profile checkbox.6. Click Apply to save the settings, and close the Debug Configurations dialog box.7. In the editor area, select the statement, f2(); (before the for (;;) statement).8. Right-click the marker bar, select the Trace Triggers > Toggle Trace Trigger A
option from the context menu. The trigger A icon appears on the marker bar in greencolor. The same option is also used to remove trigger A from the marker bar.
Trace Modes
CodeWarrior Development Studio for Microcontrollers Version 10.x Profiling and Analysis Tools UsersGuide, Rev. 10.6, 02/2014
164 Freescale Semiconductor, Inc.
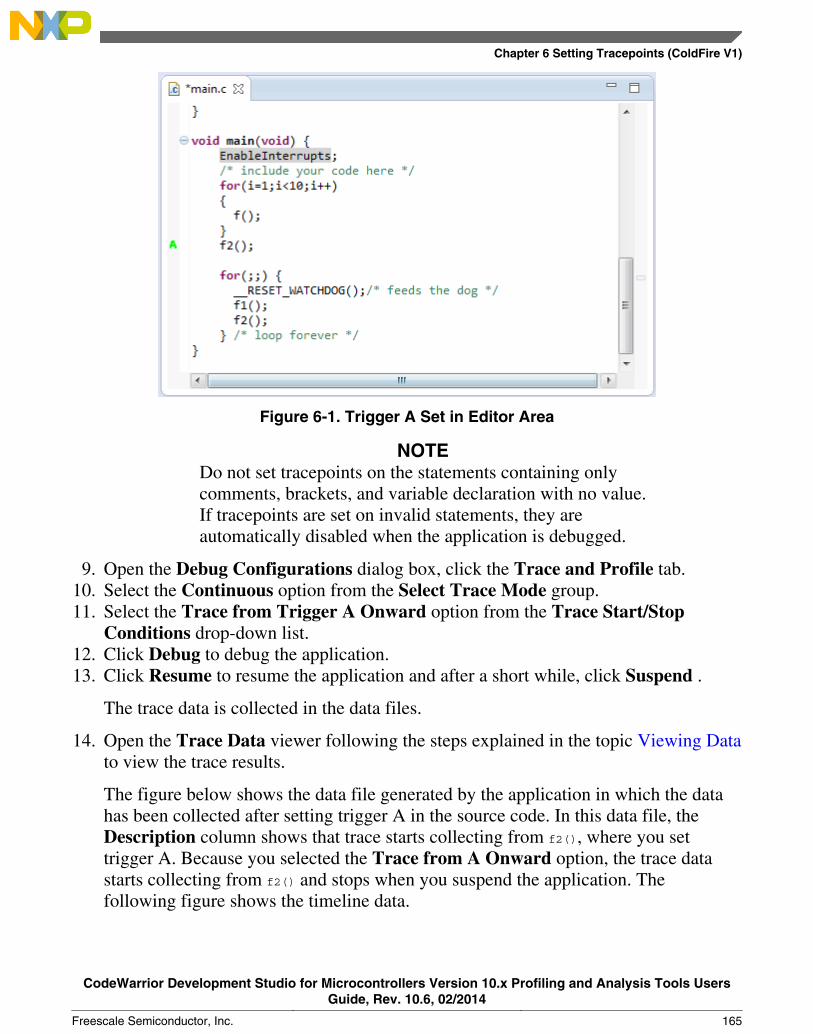
Figure 6-1. Trigger A Set in Editor Area
NOTEDo not set tracepoints on the statements containing onlycomments, brackets, and variable declaration with no value.If tracepoints are set on invalid statements, they areautomatically disabled when the application is debugged.
9. Open the Debug Configurations dialog box, click the Trace and Profile tab.10. Select the Continuous option from the Select Trace Mode group.11. Select the Trace from Trigger A Onward option from the Trace Start/Stop
Conditions drop-down list.12. Click Debug to debug the application.13. Click Resume to resume the application and after a short while, click Suspend .
The trace data is collected in the data files.
14. Open the Trace Data viewer following the steps explained in the topic Viewing Datato view the trace results.
The figure below shows the data file generated by the application in which the datahas been collected after setting trigger A in the source code. In this data file, theDescription column shows that trace starts collecting from f2(), where you settrigger A. Because you selected the Trace from A Onward option, the trace datastarts collecting from f2() and stops when you suspend the application. Thefollowing figure shows the timeline data.
Chapter 6 Setting Tracepoints (ColdFire V1)
CodeWarrior Development Studio for Microcontrollers Version 10.x Profiling and Analysis Tools UsersGuide, Rev. 10.6, 02/2014
Freescale Semiconductor, Inc. 165
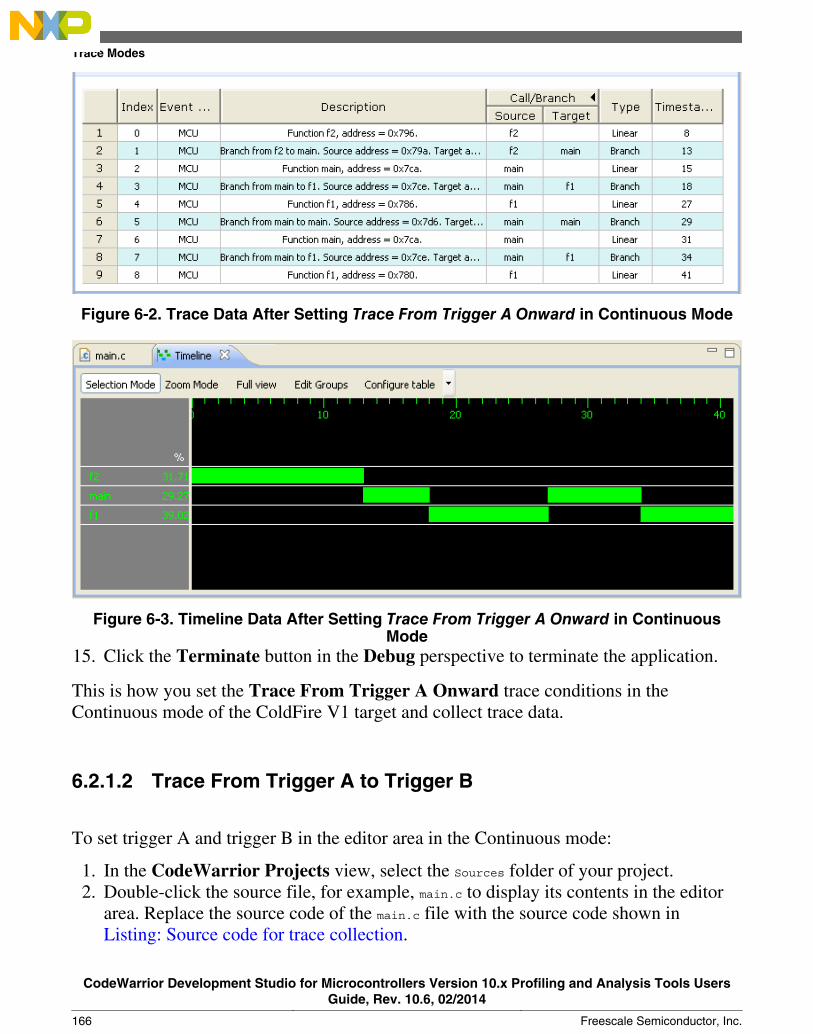
Figure 6-2. Trace Data After Setting Trace From Trigger A Onward in Continuous Mode
Figure 6-3. Timeline Data After Setting Trace From Trigger A Onward in ContinuousMode
15. Click the Terminate button in the Debug perspective to terminate the application.
This is how you set the Trace From Trigger A Onward trace conditions in theContinuous mode of the ColdFire V1 target and collect trace data.
6.2.1.2 Trace From Trigger A to Trigger B
To set trigger A and trigger B in the editor area in the Continuous mode:
1. In the CodeWarrior Projects view, select the Sources folder of your project.2. Double-click the source file, for example, main.c to display its contents in the editor
area. Replace the source code of the main.c file with the source code shown inListing: Source code for trace collection.
Trace Modes
CodeWarrior Development Studio for Microcontrollers Version 10.x Profiling and Analysis Tools UsersGuide, Rev. 10.6, 02/2014
166 Freescale Semiconductor, Inc.
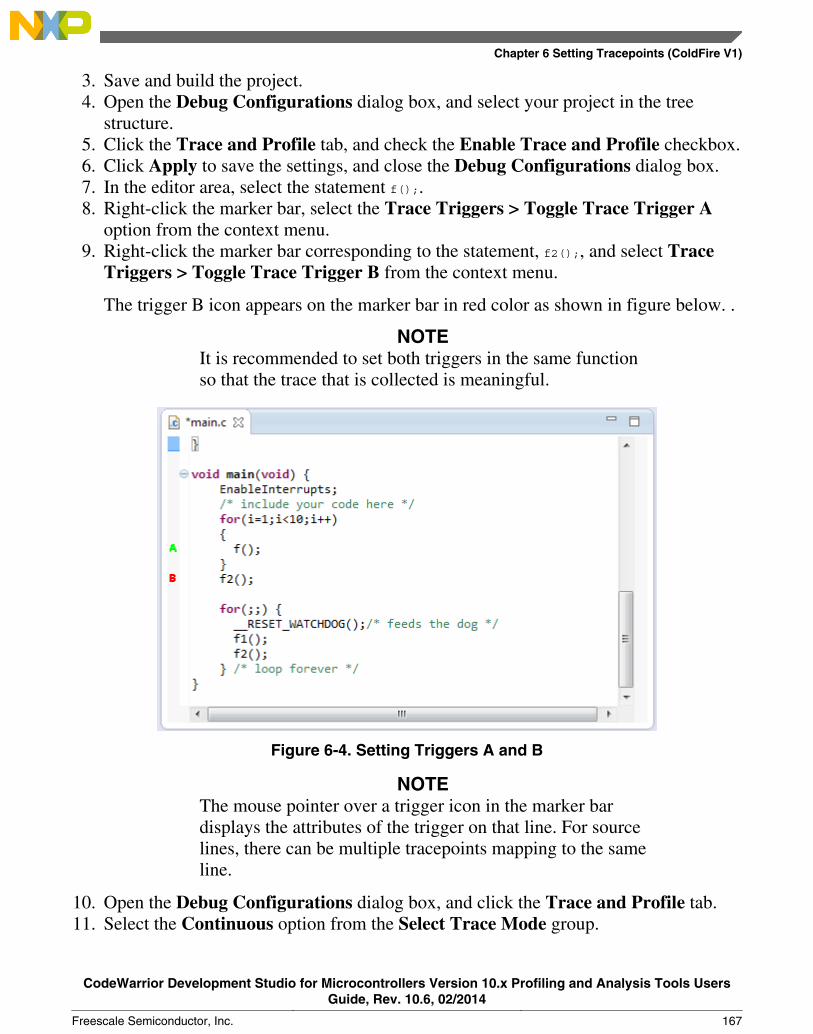
3. Save and build the project.4. Open the Debug Configurations dialog box, and select your project in the tree
structure.5. Click the Trace and Profile tab, and check the Enable Trace and Profile checkbox.6. Click Apply to save the settings, and close the Debug Configurations dialog box.7. In the editor area, select the statement f();.8. Right-click the marker bar, select the Trace Triggers > Toggle Trace Trigger A
option from the context menu.9. Right-click the marker bar corresponding to the statement, f2();, and select Trace
Triggers > Toggle Trace Trigger B from the context menu.
The trigger B icon appears on the marker bar in red color as shown in figure below. .
NOTEIt is recommended to set both triggers in the same functionso that the trace that is collected is meaningful.
Figure 6-4. Setting Triggers A and B
NOTEThe mouse pointer over a trigger icon in the marker bardisplays the attributes of the trigger on that line. For sourcelines, there can be multiple tracepoints mapping to the sameline.
10. Open the Debug Configurations dialog box, and click the Trace and Profile tab.11. Select the Continuous option from the Select Trace Mode group.
Chapter 6 Setting Tracepoints (ColdFire V1)
CodeWarrior Development Studio for Microcontrollers Version 10.x Profiling and Analysis Tools UsersGuide, Rev. 10.6, 02/2014
Freescale Semiconductor, Inc. 167

12. Select the Trace from Trigger A to Trigger B option from the Trace Start/StopConditions drop-down list.
13. Click Apply to save the settings.14. Click Debug to debug the application.15. Click Resume to collect the trace data.16. Click Suspend to stop the target application.17. Open the Trace Data viewer following the steps explained in the topic Viewing Data
to view the trace results.
The figure below shows the data files and the timeline graph that is generated by theapplication in which the data has been collected after setting triggers, A and B. TheTrace Data viewer in the figure shows that trace starts collecting from the f()function where you set trigger A.
Figure 6-5. Trace Data View After Setting Trace From Trigger A to Trigger B inContinuous Mode - Begin
The figure below shows that trace stops at the f2() function where you set trigger B.
Trace Modes
CodeWarrior Development Studio for Microcontrollers Version 10.x Profiling and Analysis Tools UsersGuide, Rev. 10.6, 02/2014
168 Freescale Semiconductor, Inc.

Figure 6-6. Trace Data View After Setting Trace From Trigger A to Trigger B inContinuous Mode - End
NOTEIf trigger A and trigger B have less than three executedinstructions between them, the stop point is not taken intoconsideration by the hardware. That is, the hardware missestrigger B if it is set close (less than three executedinstructions) to trigger A. This is because there is a three-instruction delay in the hardware pipeline; therefore triggerA is acknowledged at the third executed instruction fromwhere it is actually set. However, incase triggers are set in aloop, hardware will acknowledge trigger B when the loop isexecuted second time. A three-instruction delay duringtrace collection also occurs when a breakpoint is set on ajsr instruction in the Disassembly view. This stops thetrace abruptly; therefore a red line is displayed in the TraceData viewer to mark the points where the trace is broken.For more information, refer Trace Collection withBreakpoints.
The graph in figure below shows the timeline of the trace data. In this graph, you cansee that the trace data starts collecting from f(), that is trigger A, and stops at f2(),that is trigger B. To have a clearer view of the graph, you can zoom-in or zoom-outin the graph by scrolling the mouse up or down.
Chapter 6 Setting Tracepoints (ColdFire V1)
CodeWarrior Development Studio for Microcontrollers Version 10.x Profiling and Analysis Tools UsersGuide, Rev. 10.6, 02/2014
Freescale Semiconductor, Inc. 169
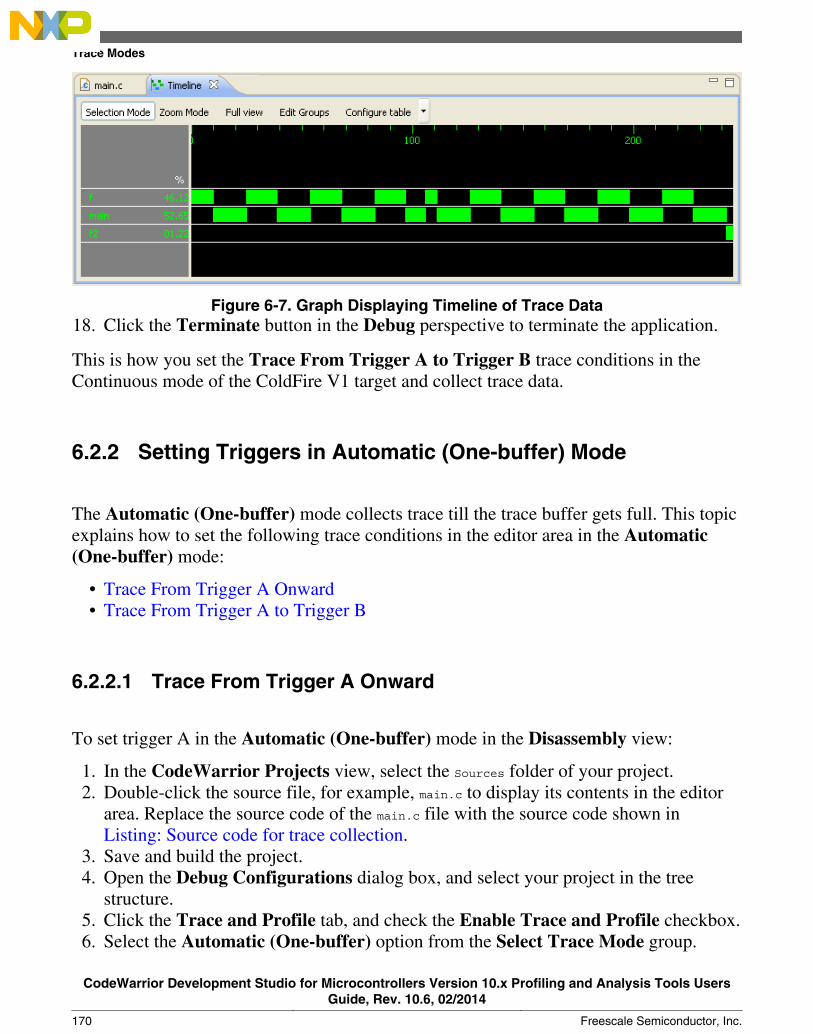
Figure 6-7. Graph Displaying Timeline of Trace Data18. Click the Terminate button in the Debug perspective to terminate the application.
This is how you set the Trace From Trigger A to Trigger B trace conditions in theContinuous mode of the ColdFire V1 target and collect trace data.
6.2.2 Setting Triggers in Automatic (One-buffer) Mode
The Automatic (One-buffer) mode collects trace till the trace buffer gets full. This topicexplains how to set the following trace conditions in the editor area in the Automatic(One-buffer) mode:
• Trace From Trigger A Onward• Trace From Trigger A to Trigger B
6.2.2.1 Trace From Trigger A Onward
To set trigger A in the Automatic (One-buffer) mode in the Disassembly view:
1. In the CodeWarrior Projects view, select the Sources folder of your project.2. Double-click the source file, for example, main.c to display its contents in the editor
area. Replace the source code of the main.c file with the source code shown inListing: Source code for trace collection.
3. Save and build the project.4. Open the Debug Configurations dialog box, and select your project in the tree
structure.5. Click the Trace and Profile tab, and check the Enable Trace and Profile checkbox.6. Select the Automatic (One-buffer) option from the Select Trace Mode group.
Trace Modes
CodeWarrior Development Studio for Microcontrollers Version 10.x Profiling and Analysis Tools UsersGuide, Rev. 10.6, 02/2014
170 Freescale Semiconductor, Inc.
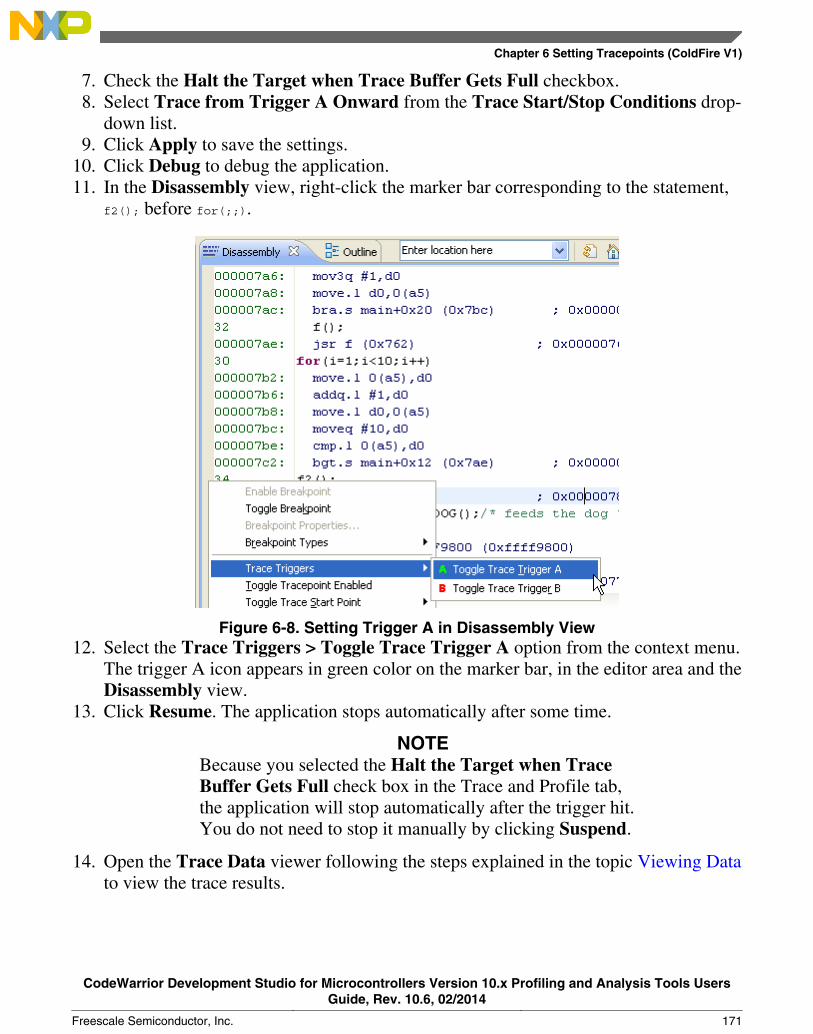
7. Check the Halt the Target when Trace Buffer Gets Full checkbox.8. Select Trace from Trigger A Onward from the Trace Start/Stop Conditions drop-
down list.9. Click Apply to save the settings.
10. Click Debug to debug the application.11. In the Disassembly view, right-click the marker bar corresponding to the statement,
f2(); before for(;;).
Figure 6-8. Setting Trigger A in Disassembly View12. Select the Trace Triggers > Toggle Trace Trigger A option from the context menu.
The trigger A icon appears in green color on the marker bar, in the editor area and theDisassembly view.
13. Click Resume. The application stops automatically after some time.
NOTEBecause you selected the Halt the Target when TraceBuffer Gets Full check box in the Trace and Profile tab,the application will stop automatically after the trigger hit.You do not need to stop it manually by clicking Suspend.
14. Open the Trace Data viewer following the steps explained in the topic Viewing Datato view the trace results.
Chapter 6 Setting Tracepoints (ColdFire V1)
CodeWarrior Development Studio for Microcontrollers Version 10.x Profiling and Analysis Tools UsersGuide, Rev. 10.6, 02/2014
Freescale Semiconductor, Inc. 171
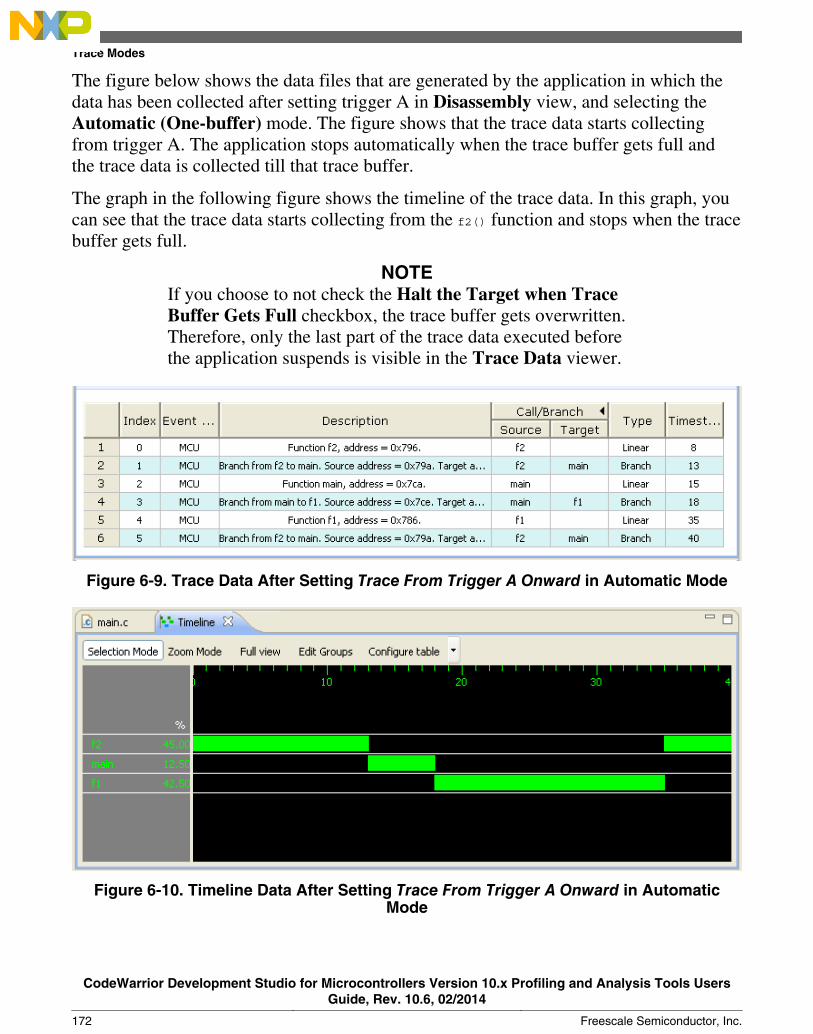
The figure below shows the data files that are generated by the application in which thedata has been collected after setting trigger A in Disassembly view, and selecting theAutomatic (One-buffer) mode. The figure shows that the trace data starts collectingfrom trigger A. The application stops automatically when the trace buffer gets full andthe trace data is collected till that trace buffer.
The graph in the following figure shows the timeline of the trace data. In this graph, youcan see that the trace data starts collecting from the f2() function and stops when the tracebuffer gets full.
NOTEIf you choose to not check the Halt the Target when TraceBuffer Gets Full checkbox, the trace buffer gets overwritten.Therefore, only the last part of the trace data executed beforethe application suspends is visible in the Trace Data viewer.
Figure 6-9. Trace Data After Setting Trace From Trigger A Onward in Automatic Mode
Figure 6-10. Timeline Data After Setting Trace From Trigger A Onward in AutomaticMode
Trace Modes
CodeWarrior Development Studio for Microcontrollers Version 10.x Profiling and Analysis Tools UsersGuide, Rev. 10.6, 02/2014
172 Freescale Semiconductor, Inc.

This is how you collect trace data in the Automatic (One-buffer) mode of the ColdFireV1 target.
NOTESimilarly, you can set the Trace from Trigger B Onwardtrace condition in both Continuous and Automatic modes andcollect the trace data.
6.2.2.2 Trace From Trigger A to Trigger B
To set triggers, A and B in the Automatic (One-buffer) mode in the Disassembly view:
1. In the CodeWarrior Projects view, select the Sources folder of your project.2. Double-click the source file, for example, main.c to display its contents in the editor
area. Replace the source code of the main.c file with the source code shown inListing: Source code for trace collection.
3. Save and build the project.4. Open the Debug Configurations dialog box, and select your project in the tree
structure.5. Click the Trace and Profile tab, and check the Enable Trace and Profiling
checkbox.6. Select the Automatic (One-buffer) option from the Select Trace Mode group.7. Check the Halt the Target when Trace Buffer Gets Full checkbox.8. Select Trace from Trigger A to Trigger B from the Trace Start/Stop Conditions
drop-down list.9. Click Apply to save the settings.
10. Click Debug to debug the application.11. Open the Disassembly view.12. Right-click the marker bar corresponding to the statement, f();.13. Select Trace Triggers > Toggle Trace Trigger A from the context menu. The
trigger A icon appears in green color on the marker bar, in the editor area and theDisassembly view.
14. Right-click the marker bar corresponding to the statement, f2();.15. Select Trace Triggers > Toggle Trace Trigger B from the context menu. The
trigger B icon appears in red color on the marker bar, in the editor area and theDisassembly view.
16. Click Resume. The application stops automatically after some time and trace data iscollected.
17. Open the Trace Data viewer following the steps explained in the topic Viewing Datato view the trace results.
Chapter 6 Setting Tracepoints (ColdFire V1)
CodeWarrior Development Studio for Microcontrollers Version 10.x Profiling and Analysis Tools UsersGuide, Rev. 10.6, 02/2014
Freescale Semiconductor, Inc. 173
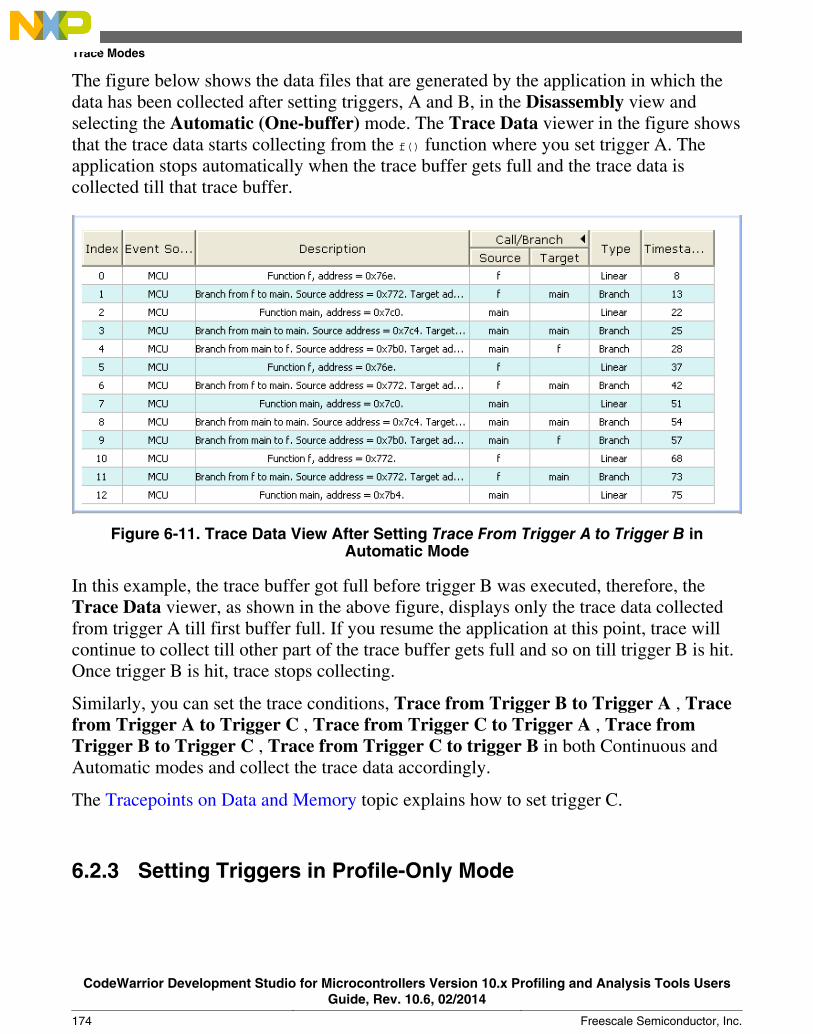
The figure below shows the data files that are generated by the application in which thedata has been collected after setting triggers, A and B, in the Disassembly view andselecting the Automatic (One-buffer) mode. The Trace Data viewer in the figure showsthat the trace data starts collecting from the f() function where you set trigger A. Theapplication stops automatically when the trace buffer gets full and the trace data iscollected till that trace buffer.
Figure 6-11. Trace Data View After Setting Trace From Trigger A to Trigger B inAutomatic Mode
In this example, the trace buffer got full before trigger B was executed, therefore, theTrace Data viewer, as shown in the above figure, displays only the trace data collectedfrom trigger A till first buffer full. If you resume the application at this point, trace willcontinue to collect till other part of the trace buffer gets full and so on till trigger B is hit.Once trigger B is hit, trace stops collecting.
Similarly, you can set the trace conditions, Trace from Trigger B to Trigger A , Tracefrom Trigger A to Trigger C , Trace from Trigger C to Trigger A , Trace fromTrigger B to Trigger C , Trace from Trigger C to trigger B in both Continuous andAutomatic modes and collect the trace data accordingly.
The Tracepoints on Data and Memory topic explains how to set trigger C.
6.2.3 Setting Triggers in Profile-Only Mode
Trace Modes
CodeWarrior Development Studio for Microcontrollers Version 10.x Profiling and Analysis Tools UsersGuide, Rev. 10.6, 02/2014
174 Freescale Semiconductor, Inc.
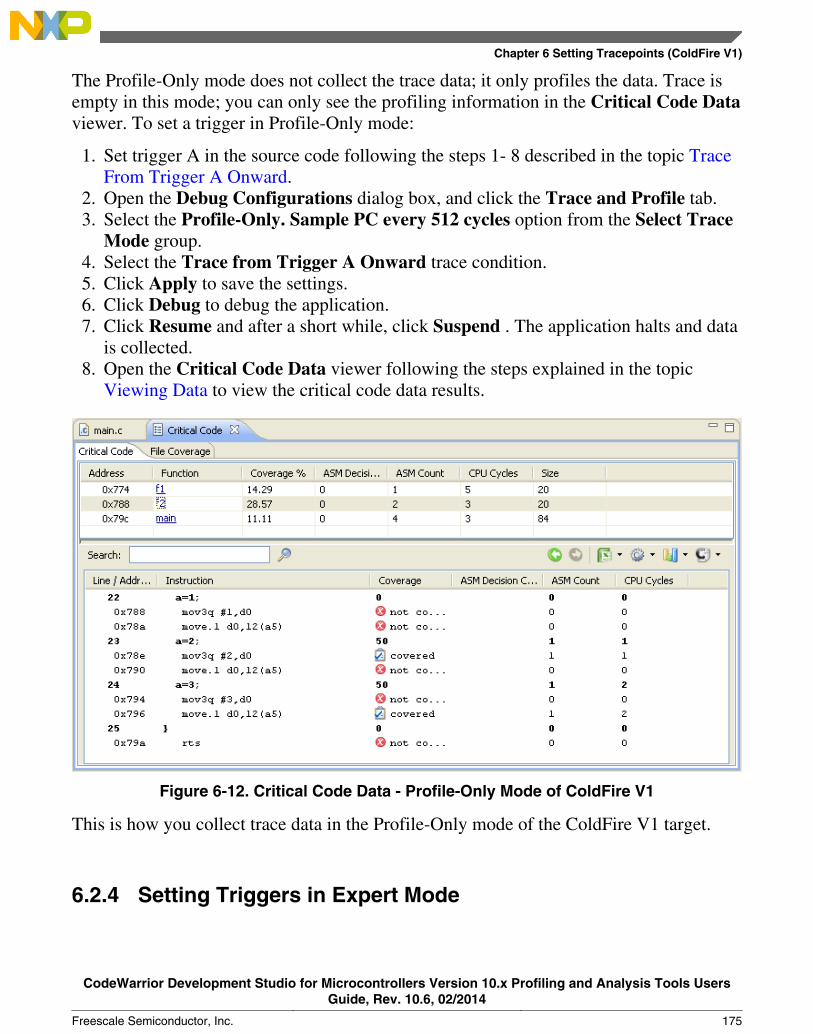
The Profile-Only mode does not collect the trace data; it only profiles the data. Trace isempty in this mode; you can only see the profiling information in the Critical Code Dataviewer. To set a trigger in Profile-Only mode:
1. Set trigger A in the source code following the steps 1- 8 described in the topic TraceFrom Trigger A Onward.
2. Open the Debug Configurations dialog box, and click the Trace and Profile tab.3. Select the Profile-Only. Sample PC every 512 cycles option from the Select Trace
Mode group.4. Select the Trace from Trigger A Onward trace condition.5. Click Apply to save the settings.6. Click Debug to debug the application.7. Click Resume and after a short while, click Suspend . The application halts and data
is collected.8. Open the Critical Code Data viewer following the steps explained in the topic
Viewing Data to view the critical code data results.
Figure 6-12. Critical Code Data - Profile-Only Mode of ColdFire V1
This is how you collect trace data in the Profile-Only mode of the ColdFire V1 target.
6.2.4 Setting Triggers in Expert Mode
Chapter 6 Setting Tracepoints (ColdFire V1)
CodeWarrior Development Studio for Microcontrollers Version 10.x Profiling and Analysis Tools UsersGuide, Rev. 10.6, 02/2014
Freescale Semiconductor, Inc. 175
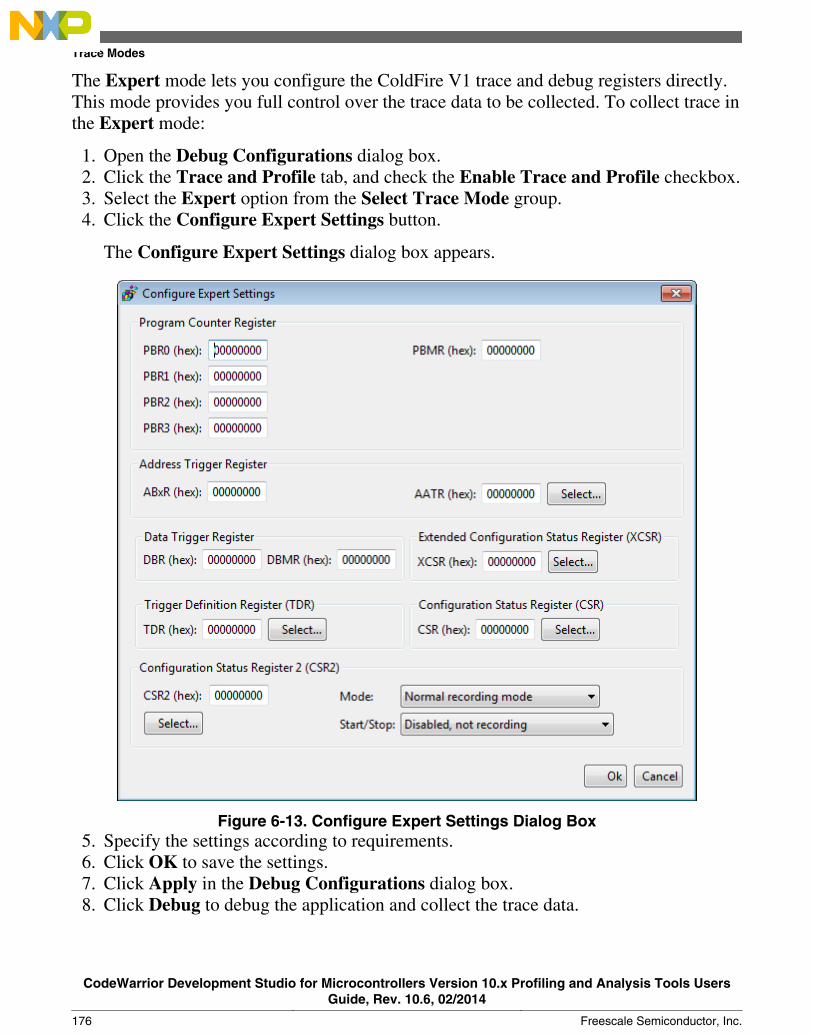
The Expert mode lets you configure the ColdFire V1 trace and debug registers directly.This mode provides you full control over the trace data to be collected. To collect trace inthe Expert mode:
1. Open the Debug Configurations dialog box.2. Click the Trace and Profile tab, and check the Enable Trace and Profile checkbox.3. Select the Expert option from the Select Trace Mode group.4. Click the Configure Expert Settings button.
The Configure Expert Settings dialog box appears.
Figure 6-13. Configure Expert Settings Dialog Box5. Specify the settings according to requirements.6. Click OK to save the settings.7. Click Apply in the Debug Configurations dialog box.8. Click Debug to debug the application and collect the trace data.
Trace Modes
CodeWarrior Development Studio for Microcontrollers Version 10.x Profiling and Analysis Tools UsersGuide, Rev. 10.6, 02/2014
176 Freescale Semiconductor, Inc.

NOTEIn Expert mode, only Trace and Timeline data is collected.
This is how you collect trace data in the Expert mode of the ColdFire V1 target.
6.3 Tracepoints on Data and Memory
This topic explains how to collect trace data after setting tracepoints on data and memoryfrom both the Variables and the Memory views. You can set only trigger C on data andmemory on a variable address. When you set trigger C on a variable address, the tracedata collection starts when the first time that variable is accessed in the execution. Thistopic uses the same source code as displayed in Listing: Source code for trace collection.
• From Variables View• From Memory View
6.3.1 From Variables View
To set trigger C from the Variables view:
1. In the CodeWarrior Projects view, select the Sources folder of your project.2. Double-click the source file, for example, main.c to display its contents in the editor
area. Replace the source code of the main.c file with the source code shown inListing: Source code for trace collection.
3. Save and build the project.4. Open the Debug Configurations dialog box, and select your project in the tree
structure.5. Click the Trace and Profile tab, and check the Enable Trace and Profile checkbox.6. Select the Continuous option from Select Trace Mode .7. Select the Trace from Trigger C Onward option from the Trace Start/Stop
Conditions group.8. Click Apply to save the settings.9. Click Debug to debug the application.
10. In the Variables view, right-click a cell in the Name column.11. Select the Add Global Variables option from the context menu. The Add Globals
dialog box appears.
Chapter 6 Setting Tracepoints (ColdFire V1)
CodeWarrior Development Studio for Microcontrollers Version 10.x Profiling and Analysis Tools UsersGuide, Rev. 10.6, 02/2014
Freescale Semiconductor, Inc. 177
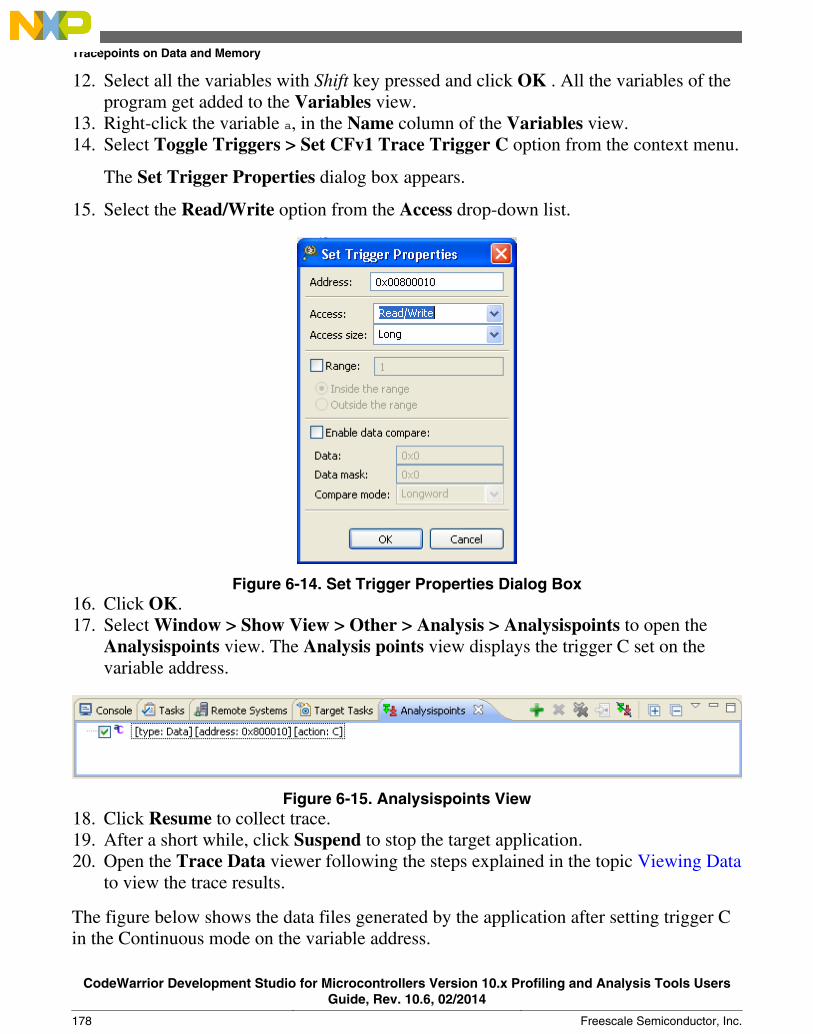
12. Select all the variables with Shift key pressed and click OK . All the variables of theprogram get added to the Variables view.
13. Right-click the variable a, in the Name column of the Variables view.14. Select Toggle Triggers > Set CFv1 Trace Trigger C option from the context menu.
The Set Trigger Properties dialog box appears.
15. Select the Read/Write option from the Access drop-down list.
Figure 6-14. Set Trigger Properties Dialog Box16. Click OK.17. Select Window > Show View > Other > Analysis > Analysispoints to open the
Analysispoints view. The Analysis points view displays the trigger C set on thevariable address.
Figure 6-15. Analysispoints View18. Click Resume to collect trace.19. After a short while, click Suspend to stop the target application.20. Open the Trace Data viewer following the steps explained in the topic Viewing Data
to view the trace results.
The figure below shows the data files generated by the application after setting trigger Cin the Continuous mode on the variable address.
Tracepoints on Data and Memory
CodeWarrior Development Studio for Microcontrollers Version 10.x Profiling and Analysis Tools UsersGuide, Rev. 10.6, 02/2014
178 Freescale Semiconductor, Inc.
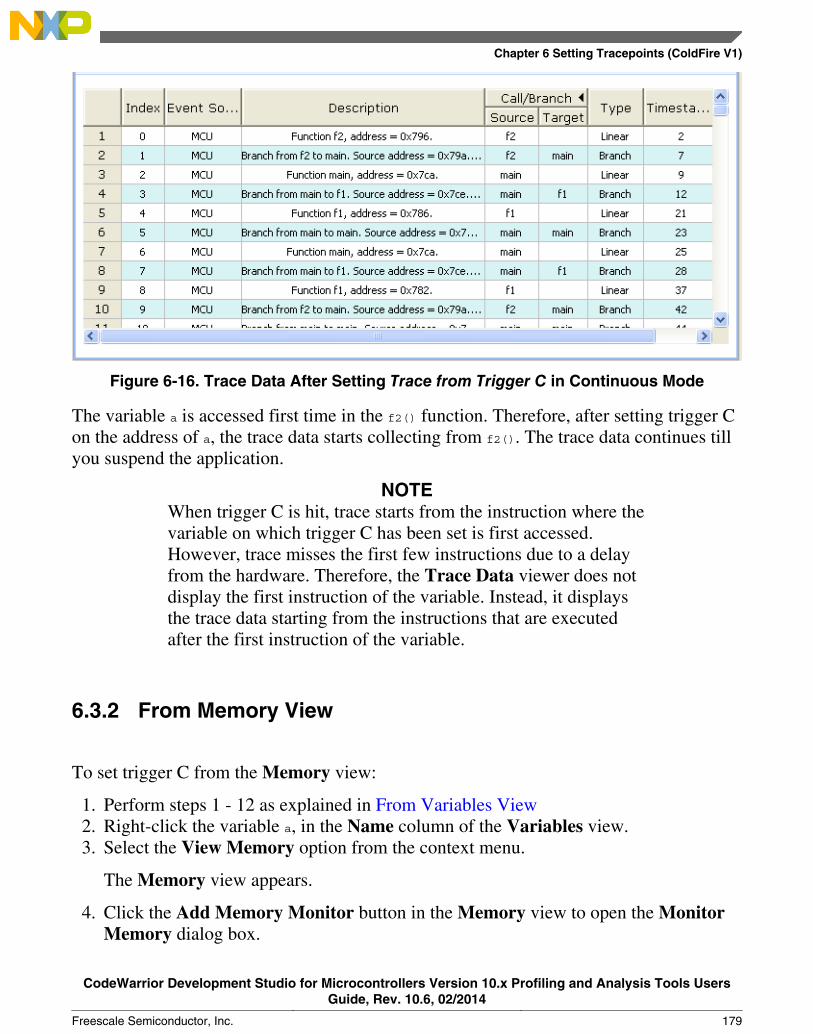
Figure 6-16. Trace Data After Setting Trace from Trigger C in Continuous Mode
The variable a is accessed first time in the f2() function. Therefore, after setting trigger Con the address of a, the trace data starts collecting from f2(). The trace data continues tillyou suspend the application.
NOTEWhen trigger C is hit, trace starts from the instruction where thevariable on which trigger C has been set is first accessed.However, trace misses the first few instructions due to a delayfrom the hardware. Therefore, the Trace Data viewer does notdisplay the first instruction of the variable. Instead, it displaysthe trace data starting from the instructions that are executedafter the first instruction of the variable.
6.3.2 From Memory View
To set trigger C from the Memory view:
1. Perform steps 1 - 12 as explained in From Variables View2. Right-click the variable a, in the Name column of the Variables view.3. Select the View Memory option from the context menu.
The Memory view appears.
4. Click the Add Memory Monitor button in the Memory view to open the MonitorMemory dialog box.
Chapter 6 Setting Tracepoints (ColdFire V1)
CodeWarrior Development Studio for Microcontrollers Version 10.x Profiling and Analysis Tools UsersGuide, Rev. 10.6, 02/2014
Freescale Semiconductor, Inc. 179
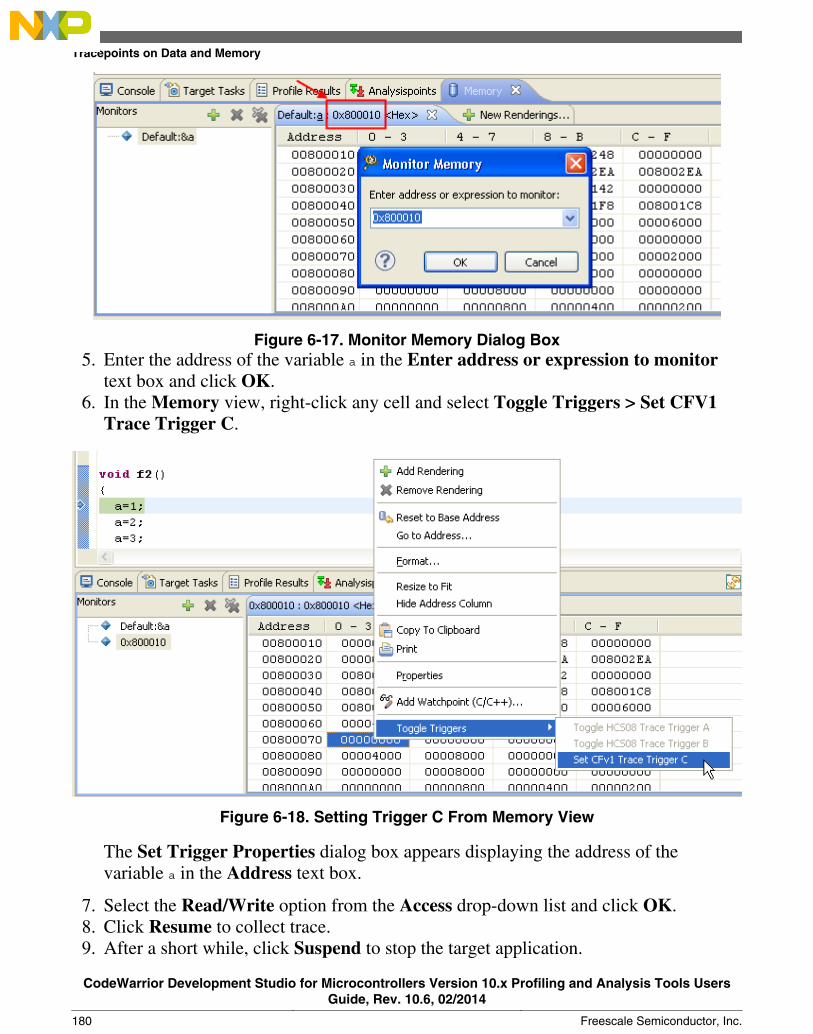
Figure 6-17. Monitor Memory Dialog Box5. Enter the address of the variable a in the Enter address or expression to monitor
text box and click OK.6. In the Memory view, right-click any cell and select Toggle Triggers > Set CFV1
Trace Trigger C.
Figure 6-18. Setting Trigger C From Memory View
The Set Trigger Properties dialog box appears displaying the address of thevariable a in the Address text box.
7. Select the Read/Write option from the Access drop-down list and click OK.8. Click Resume to collect trace.9. After a short while, click Suspend to stop the target application.
Tracepoints on Data and Memory
CodeWarrior Development Studio for Microcontrollers Version 10.x Profiling and Analysis Tools UsersGuide, Rev. 10.6, 02/2014
180 Freescale Semiconductor, Inc.

The data files are generated by the application as shown in Figure 6-16, after settingtrigger C in the Continuous mode on the variable address.
6.4 Enable and Disable Tracepoints
If you want to enable the tracepoints, right-click the Marker bar where triggers arealready set and in disabled state, select the Enable Tracepoint option from the contextmenu.
If you want to disable the tracepoints, right-click the marker bar where triggers arealready set and enabled, select the Disable Tracepoint option from the context menu. Adisabled tracepoint will have no effect during the collection of trace data. You can alsodisable/enable the tracepoint from Analysispoints view. Select Window > Show View >Other > Software Analysis > Analysispoints to open the Analysispoints view.
Right-click the selected attribute and select Disable/Enable option. The uncheckedattribute indicates the disabled tracepoint.
You can also use the Ignore all Analysispoints button to disable all the tracepointswithout manually selecting them in the Analysispoints view. You can click Ignore Allagain to enable the tracepoints.
Chapter 6 Setting Tracepoints (ColdFire V1)
CodeWarrior Development Studio for Microcontrollers Version 10.x Profiling and Analysis Tools UsersGuide, Rev. 10.6, 02/2014
Freescale Semiconductor, Inc. 181
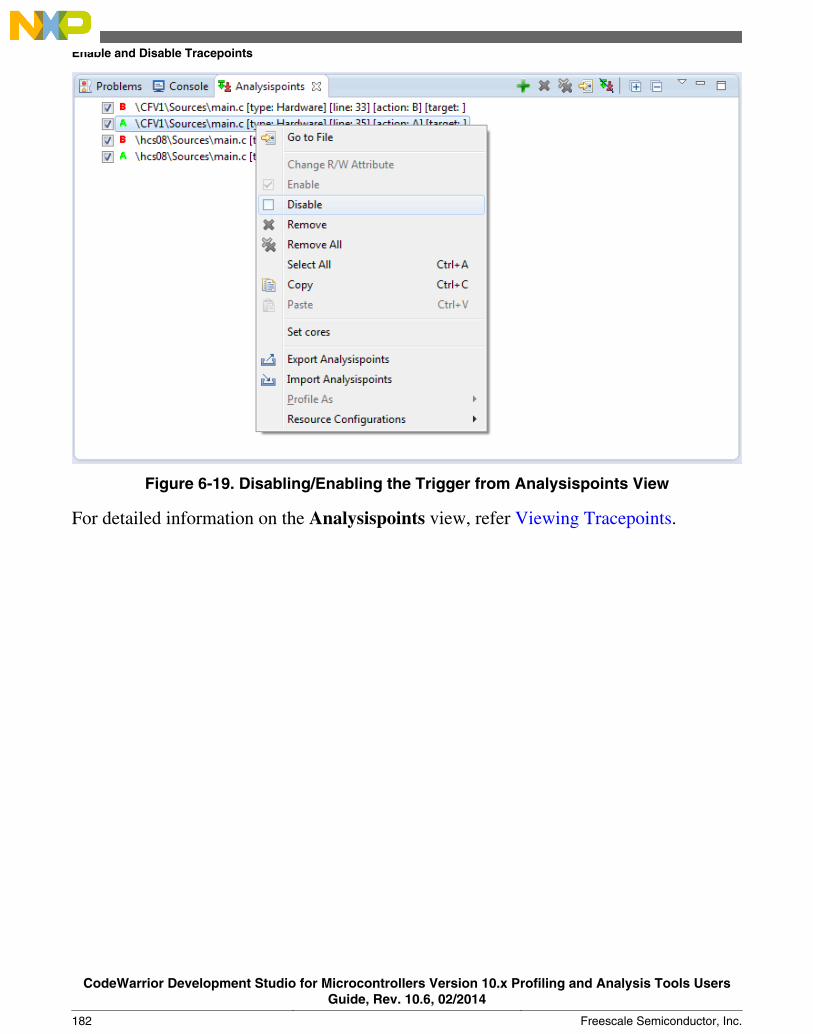
Figure 6-19. Disabling/Enabling the Trigger from Analysispoints View
For detailed information on the Analysispoints view, refer Viewing Tracepoints.
Enable and Disable Tracepoints
CodeWarrior Development Studio for Microcontrollers Version 10.x Profiling and Analysis Tools UsersGuide, Rev. 10.6, 02/2014
182 Freescale Semiconductor, Inc.
Chapter 7Setting Tracepoints (Kinetis)The Kinetis target supports hardware and software tracepoints for trace collection.Hardware tracepoints use hardware resources to start and stop trace. Hardwaretracepoints allow only a limited number of comparators to be set for trace collectionbecause they use DWT comparators to start or stop the trace collection. There are fourcomparators for Kinetis Cortex M4 core and two comparators for Kinetis Cortex M0+core.
Software tracepoints on the other hand do not use hardware resources and generateinterrupts from software to start and stop trace. They allow you to install infinite numberof comparators for trace collection, limited only by the memory available for storingtracepoint data. Software tracepoints are more intrusive than hardware tracepointsbecause of the overhead added by the interrupts being used. Kinetis Cortex M0+ coredoes not support software tracepoints.
This chapter consists of the following topics:
• Setting Hardware Tracepoints• Setting Software Tracepoints• Viewing Tracepoints
7.1 Setting Hardware Tracepoints
You can set hardware tracepoints from the source code as well as from the Disassemblyview. A hardware tracepoint is set from the source code on an instruction; while it is setfrom the Disassembly view on an address. You can also set hardware tracepoints fromthe Trace and Profile tab of the Debug Configurations window by configuring theDWT settings. Configuring DWT settings includes setting comparators as triggers alongwith their reference value and selecting the event that generates the comparators match.When this event occurs, triggers are fired and trace is collected.
• From Source Code - Kinetis Cortex M4 Core
CodeWarrior Development Studio for Microcontrollers Version 10.x Profiling and Analysis Tools UsersGuide, Rev. 10.6, 02/2014
Freescale Semiconductor, Inc. 183
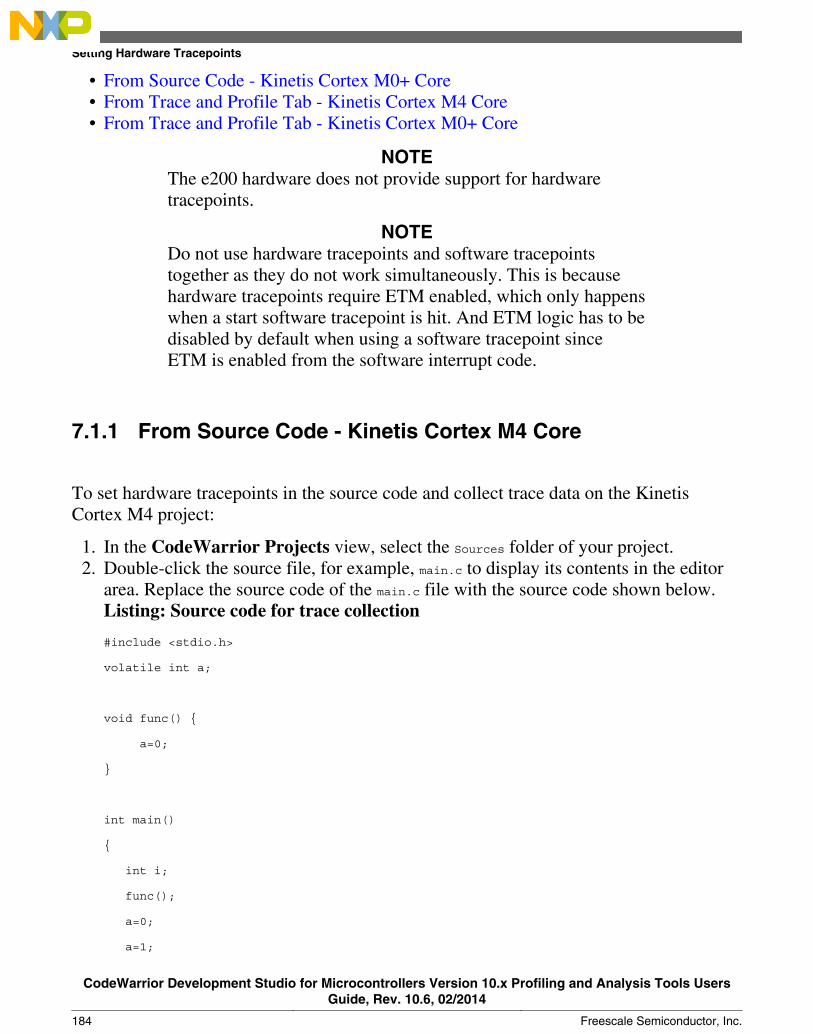
• From Source Code - Kinetis Cortex M0+ Core• From Trace and Profile Tab - Kinetis Cortex M4 Core• From Trace and Profile Tab - Kinetis Cortex M0+ Core
NOTEThe e200 hardware does not provide support for hardwaretracepoints.
NOTEDo not use hardware tracepoints and software tracepointstogether as they do not work simultaneously. This is becausehardware tracepoints require ETM enabled, which only happenswhen a start software tracepoint is hit. And ETM logic has to bedisabled by default when using a software tracepoint sinceETM is enabled from the software interrupt code.
7.1.1 From Source Code - Kinetis Cortex M4 Core
To set hardware tracepoints in the source code and collect trace data on the KinetisCortex M4 project:
1. In the CodeWarrior Projects view, select the Sources folder of your project.2. Double-click the source file, for example, main.c to display its contents in the editor
area. Replace the source code of the main.c file with the source code shown below.Listing: Source code for trace collection
#include <stdio.h>
volatile int a;
void func() {
a=0;
}
int main()
{
int i;
func();
a=0;
a=1;
Setting Hardware Tracepoints
CodeWarrior Development Studio for Microcontrollers Version 10.x Profiling and Analysis Tools UsersGuide, Rev. 10.6, 02/2014
184 Freescale Semiconductor, Inc.

a=2;
a=3;
a=4;
if (a==4) a=3;
if (a==3) a=1;
if (a==1) a=4;
if (a==4) a=5;
func();
return 0;
}
3. Save and build the project.4. Open the Debug Configurations dialog box, and select your project in the tree
structure.5. Click the Trace and Profile tab, and check the Enable Trace and Profile checkbox.6. Click Apply to save the settings, and close the Debug Configurations dialog box.7. In the editor area, select the statement: if (a==4) a=3;.8. Right-click the marker bar, select the Toggle Trace Start Point > Hardware Trace
Point option from the context menu. The same option is also used to remove the starttrigger from the marker bar.
Chapter 7 Setting Tracepoints (Kinetis)
CodeWarrior Development Studio for Microcontrollers Version 10.x Profiling and Analysis Tools UsersGuide, Rev. 10.6, 02/2014
Freescale Semiconductor, Inc. 185
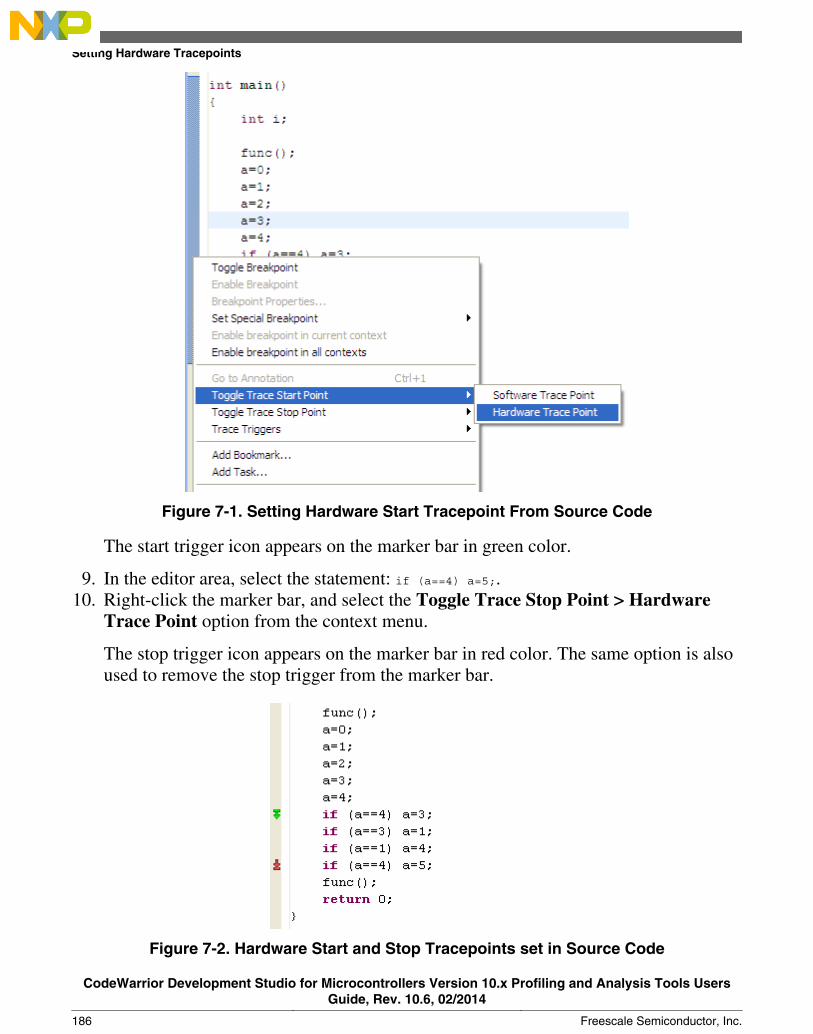
Figure 7-1. Setting Hardware Start Tracepoint From Source Code
The start trigger icon appears on the marker bar in green color.
9. In the editor area, select the statement: if (a==4) a=5;.10. Right-click the marker bar, and select the Toggle Trace Stop Point > Hardware
Trace Point option from the context menu.
The stop trigger icon appears on the marker bar in red color. The same option is alsoused to remove the stop trigger from the marker bar.
Figure 7-2. Hardware Start and Stop Tracepoints set in Source Code
Setting Hardware Tracepoints
CodeWarrior Development Studio for Microcontrollers Version 10.x Profiling and Analysis Tools UsersGuide, Rev. 10.6, 02/2014
186 Freescale Semiconductor, Inc.
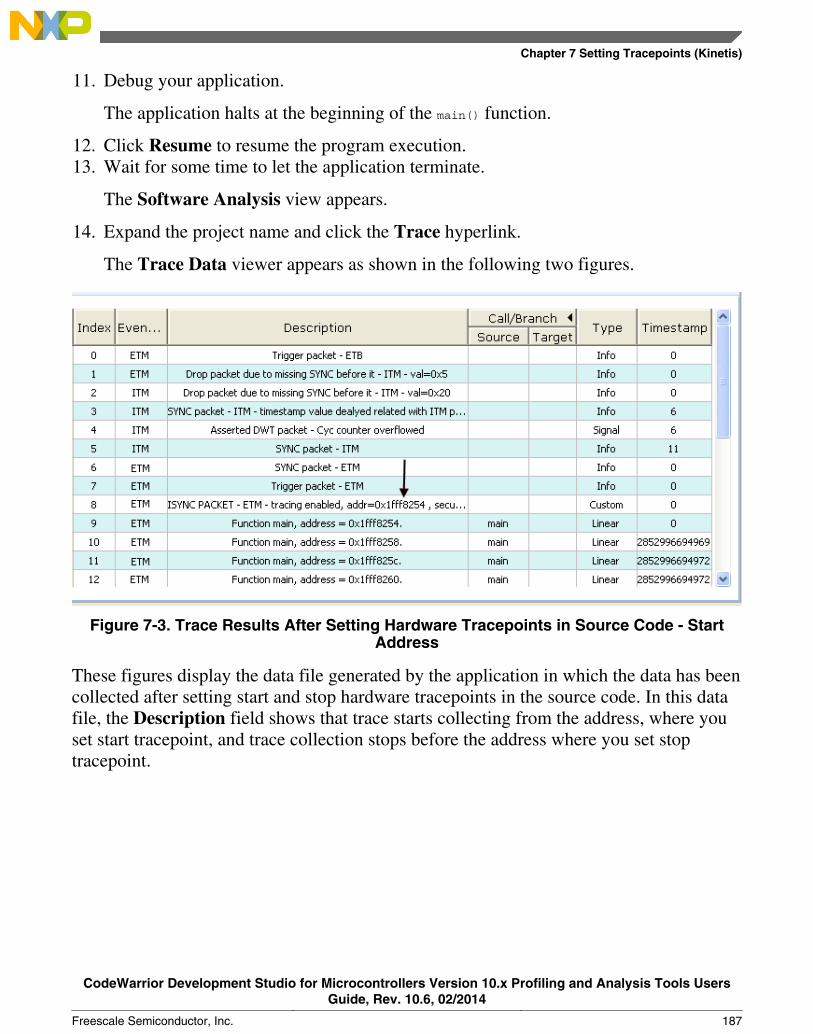
11. Debug your application.
The application halts at the beginning of the main() function.
12. Click Resume to resume the program execution.13. Wait for some time to let the application terminate.
The Software Analysis view appears.
14. Expand the project name and click the Trace hyperlink.
The Trace Data viewer appears as shown in the following two figures.
Figure 7-3. Trace Results After Setting Hardware Tracepoints in Source Code - StartAddress
These figures display the data file generated by the application in which the data has beencollected after setting start and stop hardware tracepoints in the source code. In this datafile, the Description field shows that trace starts collecting from the address, where youset start tracepoint, and trace collection stops before the address where you set stoptracepoint.
Chapter 7 Setting Tracepoints (Kinetis)
CodeWarrior Development Studio for Microcontrollers Version 10.x Profiling and Analysis Tools UsersGuide, Rev. 10.6, 02/2014
Freescale Semiconductor, Inc. 187
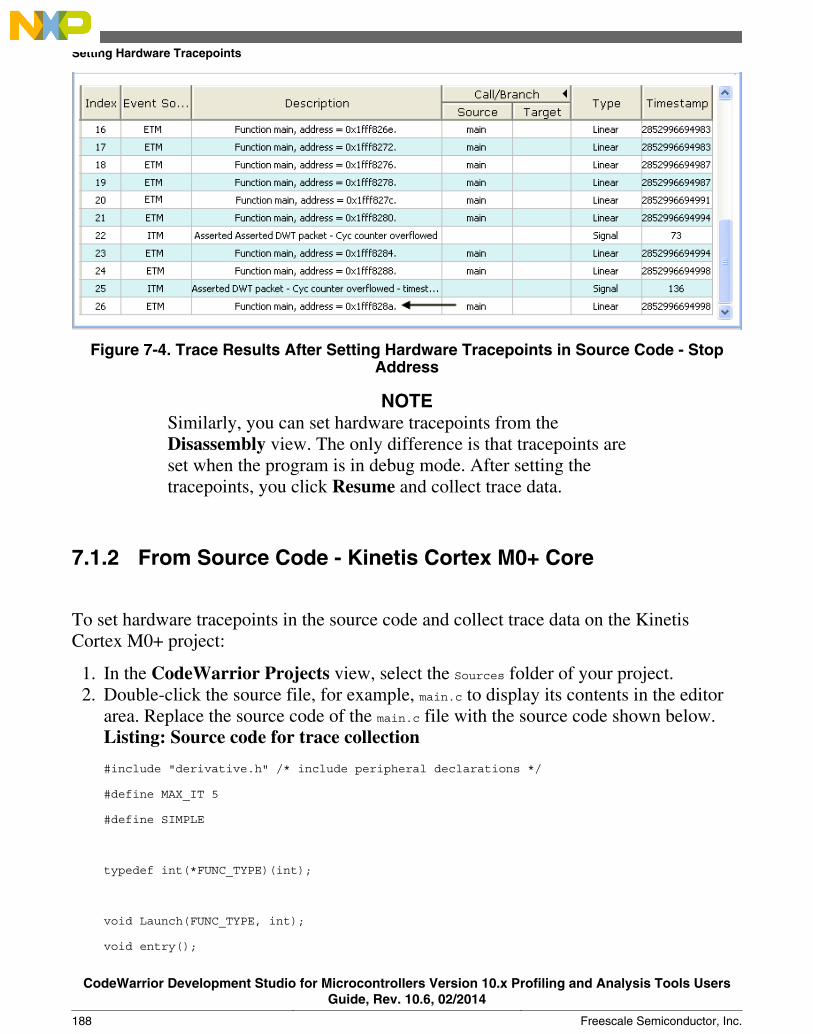
Figure 7-4. Trace Results After Setting Hardware Tracepoints in Source Code - StopAddress
NOTESimilarly, you can set hardware tracepoints from theDisassembly view. The only difference is that tracepoints areset when the program is in debug mode. After setting thetracepoints, you click Resume and collect trace data.
7.1.2 From Source Code - Kinetis Cortex M0+ Core
To set hardware tracepoints in the source code and collect trace data on the KinetisCortex M0+ project:
1. In the CodeWarrior Projects view, select the Sources folder of your project.2. Double-click the source file, for example, main.c to display its contents in the editor
area. Replace the source code of the main.c file with the source code shown below.Listing: Source code for trace collection
#include "derivative.h" /* include peripheral declarations */
#define MAX_IT 5
#define SIMPLE
typedef int(*FUNC_TYPE)(int);
void Launch(FUNC_TYPE, int);
void entry();
Setting Hardware Tracepoints
CodeWarrior Development Studio for Microcontrollers Version 10.x Profiling and Analysis Tools UsersGuide, Rev. 10.6, 02/2014
188 Freescale Semiconductor, Inc.
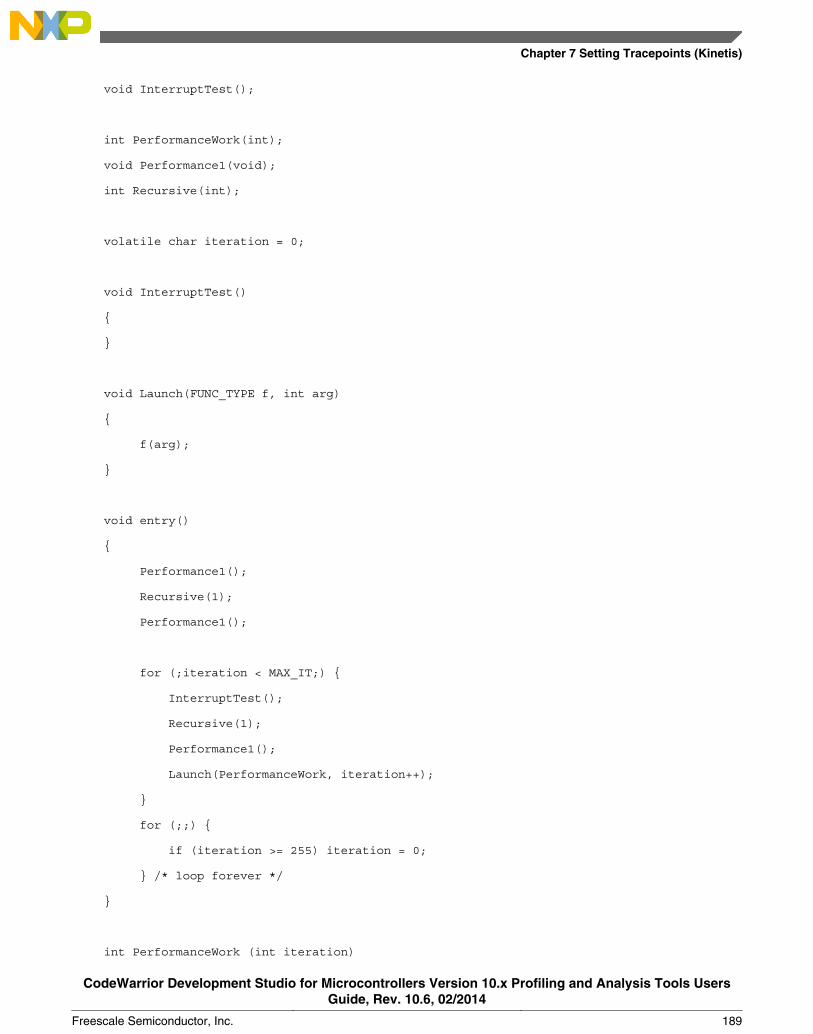
void InterruptTest();
int PerformanceWork(int);
void Performance1(void);
int Recursive(int);
volatile char iteration = 0;
void InterruptTest()
{
}
void Launch(FUNC_TYPE f, int arg)
{
f(arg);
}
void entry()
{
Performance1();
Recursive(1);
Performance1();
for (;iteration < MAX_IT;) {
InterruptTest();
Recursive(1);
Performance1();
Launch(PerformanceWork, iteration++);
}
for (;;) {
if (iteration >= 255) iteration = 0;
} /* loop forever */
}
int PerformanceWork (int iteration)
Chapter 7 Setting Tracepoints (Kinetis)
CodeWarrior Development Studio for Microcontrollers Version 10.x Profiling and Analysis Tools UsersGuide, Rev. 10.6, 02/2014
Freescale Semiconductor, Inc. 189
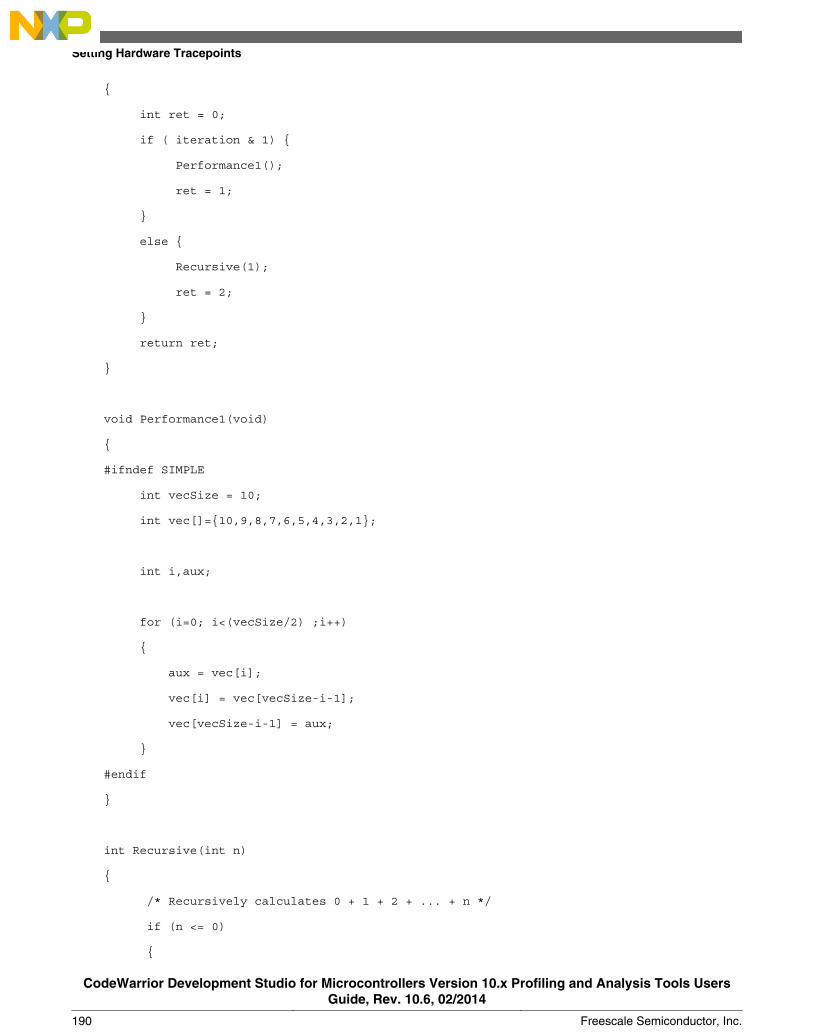
{
int ret = 0;
if ( iteration & 1) {
Performance1();
ret = 1;
}
else {
Recursive(1);
ret = 2;
}
return ret;
}
void Performance1(void)
{
#ifndef SIMPLE
int vecSize = 10;
int vec[]={10,9,8,7,6,5,4,3,2,1};
int i,aux;
for (i=0; i<(vecSize/2) ;i++)
{
aux = vec[i];
vec[i] = vec[vecSize-i-1];
vec[vecSize-i-1] = aux;
}
#endif
}
int Recursive(int n)
{
/* Recursively calculates 0 + 1 + 2 + ... + n */
if (n <= 0)
{
Setting Hardware Tracepoints
CodeWarrior Development Studio for Microcontrollers Version 10.x Profiling and Analysis Tools UsersGuide, Rev. 10.6, 02/2014
190 Freescale Semiconductor, Inc.
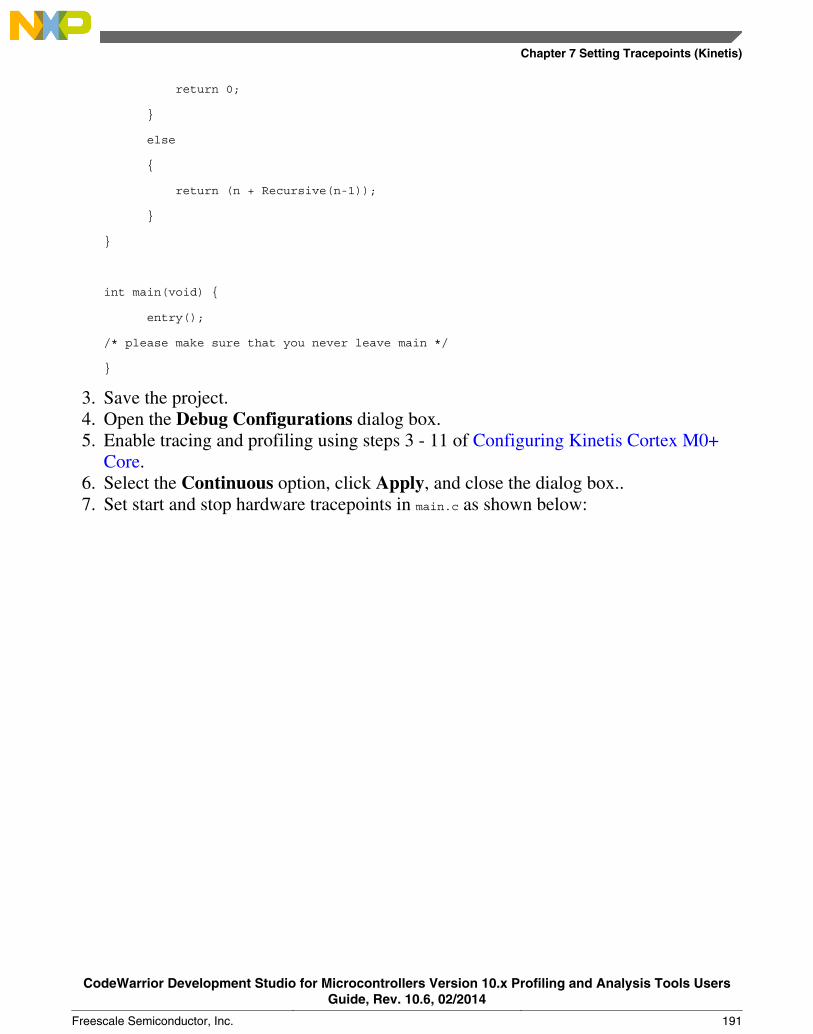
return 0;
}
else
{
return (n + Recursive(n-1));
}
}
int main(void) {
entry();
/* please make sure that you never leave main */
}
3. Save the project.4. Open the Debug Configurations dialog box.5. Enable tracing and profiling using steps 3 - 11 of Configuring Kinetis Cortex M0+
Core.6. Select the Continuous option, click Apply, and close the dialog box..7. Set start and stop hardware tracepoints in main.c as shown below:
Chapter 7 Setting Tracepoints (Kinetis)
CodeWarrior Development Studio for Microcontrollers Version 10.x Profiling and Analysis Tools UsersGuide, Rev. 10.6, 02/2014
Freescale Semiconductor, Inc. 191
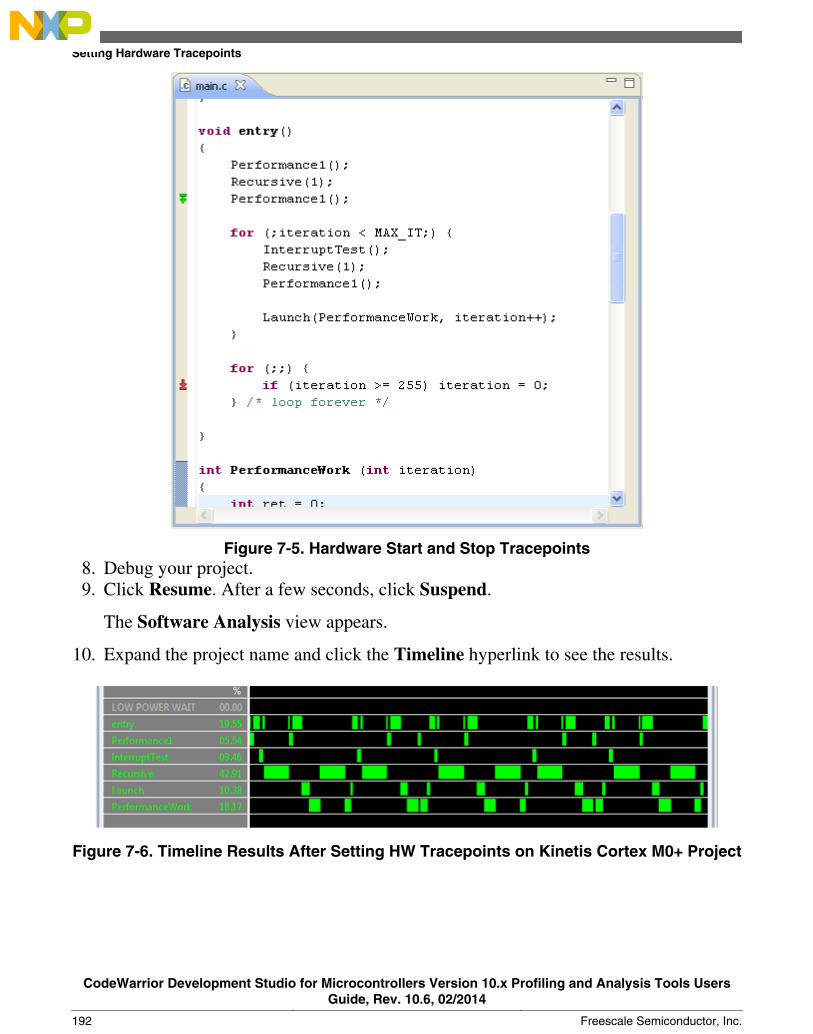
Figure 7-5. Hardware Start and Stop Tracepoints8. Debug your project.9. Click Resume. After a few seconds, click Suspend.
The Software Analysis view appears.
10. Expand the project name and click the Timeline hyperlink to see the results.
Figure 7-6. Timeline Results After Setting HW Tracepoints on Kinetis Cortex M0+ Project
Setting Hardware Tracepoints
CodeWarrior Development Studio for Microcontrollers Version 10.x Profiling and Analysis Tools UsersGuide, Rev. 10.6, 02/2014
192 Freescale Semiconductor, Inc.

7.1.3 From Trace and Profile Tab - Kinetis Cortex M4 Core
This topic explains how to set comparator 1 and comparator 2 as hardware tracepoints fortrace collection. You can take any combination of comparators to be used as hardwaretracepoints. You simply need to specify the correct corresponding reference value againstthem.
This topic uses the addresses of the instructions, of Listing: Source code for tracecollection, at which you set start and stop hardware tracepoint. These addresses will beset against comparator 1 and comparator 2 to collect the same trace results that appear onsetting hardware tracepoints from the source code.
To set hardware tracepoints using the Trace and Profile tab and collect trace on aKinetis Cortex M4 project:
1. Build your project.2. Open the Debug Configurations dialog box, and select your project in the tree
structure.3. Click the Trace and Profile tab, and check the Enable Trace and Profile checkbox.4. Click the Advanced Settings button.
The Preferences dialog box appears.
Chapter 7 Setting Tracepoints (Kinetis)
CodeWarrior Development Studio for Microcontrollers Version 10.x Profiling and Analysis Tools UsersGuide, Rev. 10.6, 02/2014
Freescale Semiconductor, Inc. 193
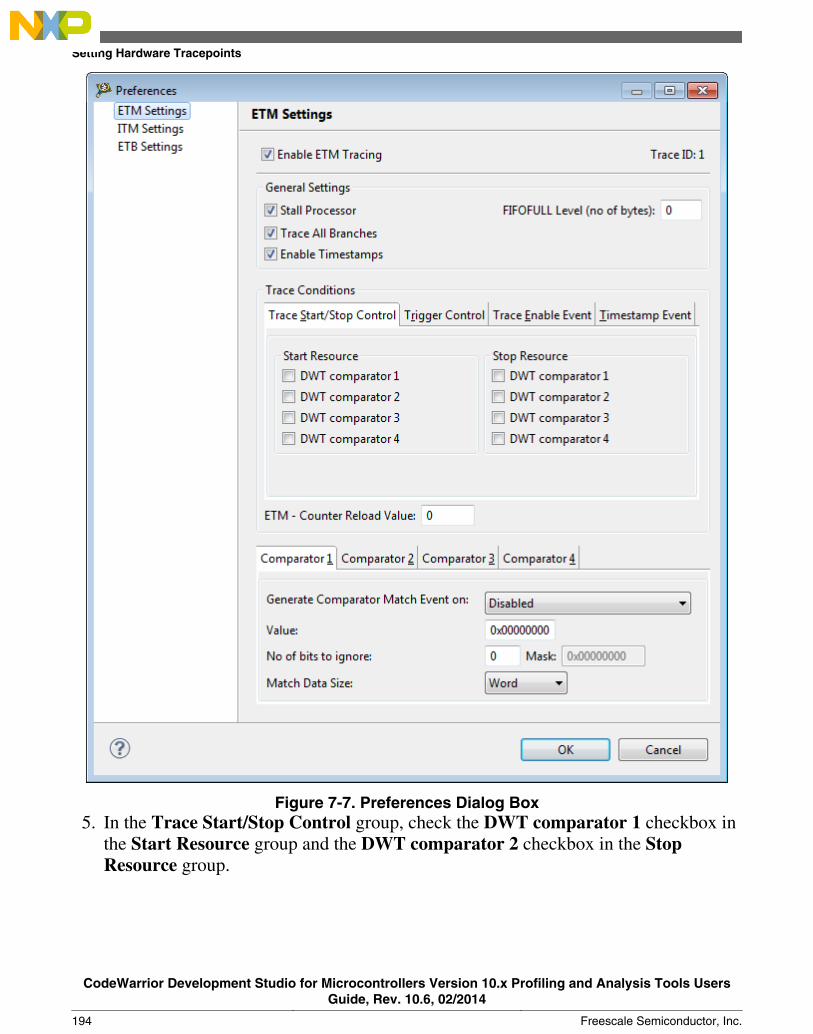
Figure 7-7. Preferences Dialog Box5. In the Trace Start/Stop Control group, check the DWT comparator 1 checkbox in
the Start Resource group and the DWT comparator 2 checkbox in the StopResource group.
Setting Hardware Tracepoints
CodeWarrior Development Studio for Microcontrollers Version 10.x Profiling and Analysis Tools UsersGuide, Rev. 10.6, 02/2014
194 Freescale Semiconductor, Inc.
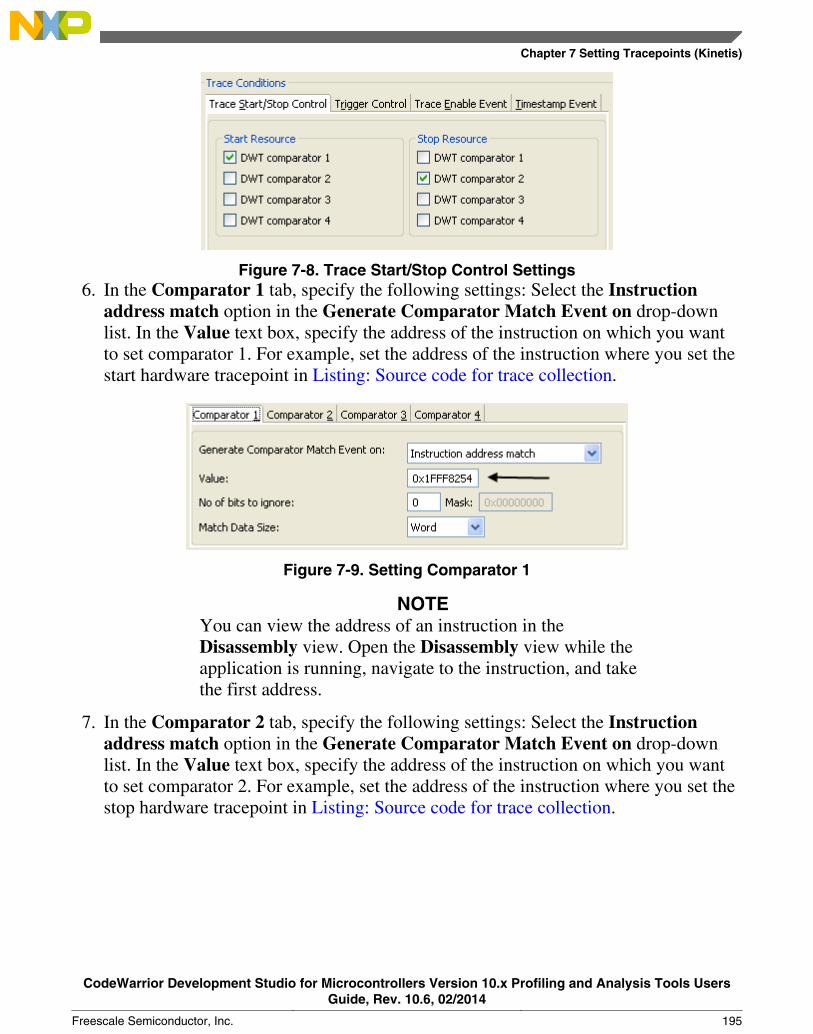
Figure 7-8. Trace Start/Stop Control Settings6. In the Comparator 1 tab, specify the following settings: Select the Instruction
address match option in the Generate Comparator Match Event on drop-downlist. In the Value text box, specify the address of the instruction on which you wantto set comparator 1. For example, set the address of the instruction where you set thestart hardware tracepoint in Listing: Source code for trace collection.
Figure 7-9. Setting Comparator 1
NOTEYou can view the address of an instruction in theDisassembly view. Open the Disassembly view while theapplication is running, navigate to the instruction, and takethe first address.
7. In the Comparator 2 tab, specify the following settings: Select the Instructionaddress match option in the Generate Comparator Match Event on drop-downlist. In the Value text box, specify the address of the instruction on which you wantto set comparator 2. For example, set the address of the instruction where you set thestop hardware tracepoint in Listing: Source code for trace collection.
Chapter 7 Setting Tracepoints (Kinetis)
CodeWarrior Development Studio for Microcontrollers Version 10.x Profiling and Analysis Tools UsersGuide, Rev. 10.6, 02/2014
Freescale Semiconductor, Inc. 195
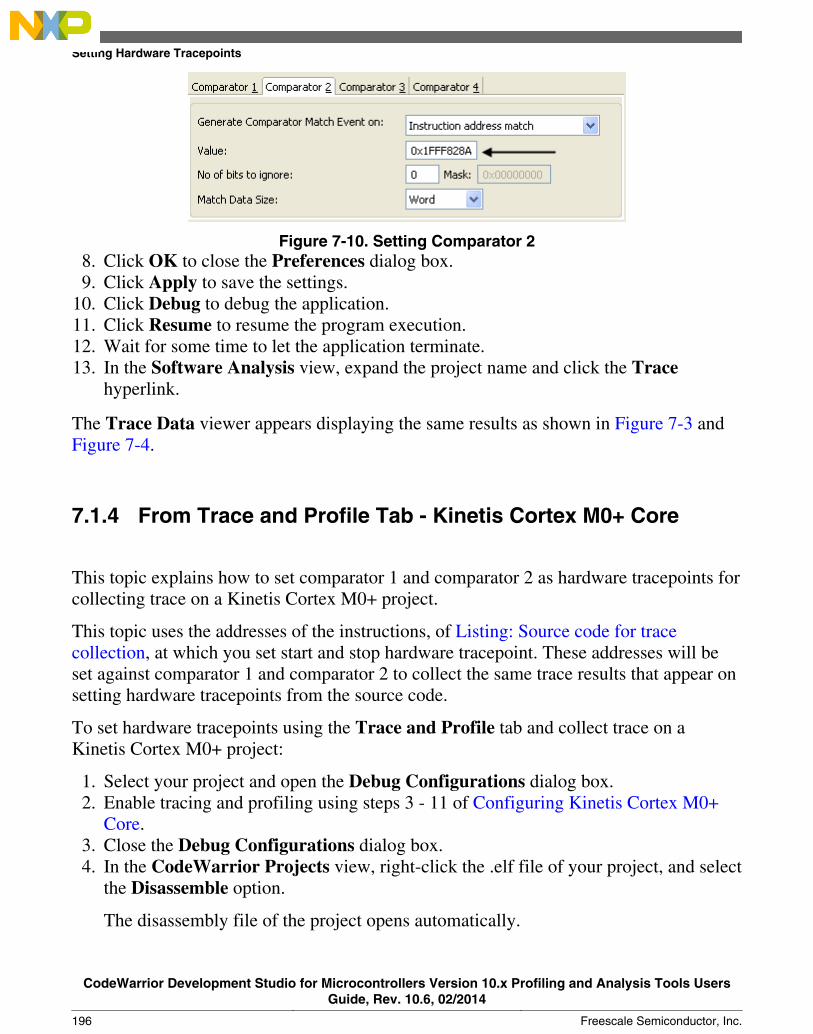
Figure 7-10. Setting Comparator 28. Click OK to close the Preferences dialog box.9. Click Apply to save the settings.
10. Click Debug to debug the application.11. Click Resume to resume the program execution.12. Wait for some time to let the application terminate.13. In the Software Analysis view, expand the project name and click the Trace
hyperlink.
The Trace Data viewer appears displaying the same results as shown in Figure 7-3 andFigure 7-4.
7.1.4 From Trace and Profile Tab - Kinetis Cortex M0+ Core
This topic explains how to set comparator 1 and comparator 2 as hardware tracepoints forcollecting trace on a Kinetis Cortex M0+ project.
This topic uses the addresses of the instructions, of Listing: Source code for tracecollection, at which you set start and stop hardware tracepoint. These addresses will beset against comparator 1 and comparator 2 to collect the same trace results that appear onsetting hardware tracepoints from the source code.
To set hardware tracepoints using the Trace and Profile tab and collect trace on aKinetis Cortex M0+ project:
1. Select your project and open the Debug Configurations dialog box.2. Enable tracing and profiling using steps 3 - 11 of Configuring Kinetis Cortex M0+
Core.3. Close the Debug Configurations dialog box.4. In the CodeWarrior Projects view, right-click the .elf file of your project, and select
the Disassemble option.
The disassembly file of the project opens automatically.
Setting Hardware Tracepoints
CodeWarrior Development Studio for Microcontrollers Version 10.x Profiling and Analysis Tools UsersGuide, Rev. 10.6, 02/2014
196 Freescale Semiconductor, Inc.
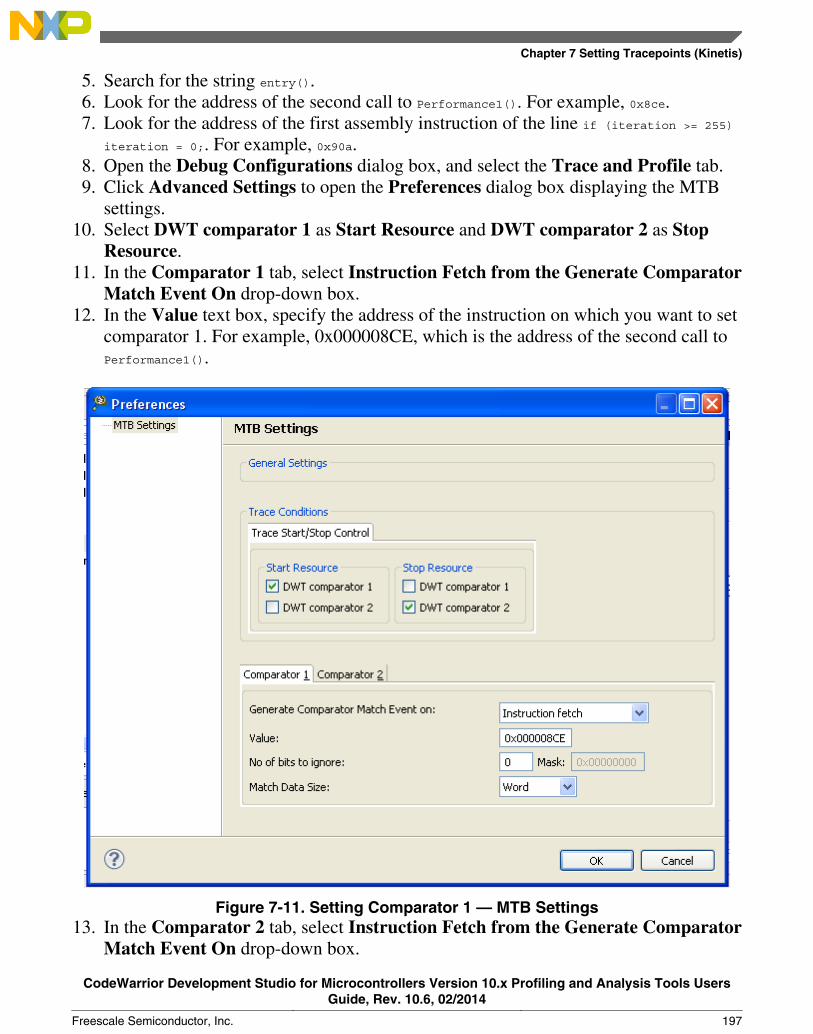
5. Search for the string entry().6. Look for the address of the second call to Performance1(). For example, 0x8ce.7. Look for the address of the first assembly instruction of the line if (iteration >= 255)
iteration = 0;. For example, 0x90a.8. Open the Debug Configurations dialog box, and select the Trace and Profile tab.9. Click Advanced Settings to open the Preferences dialog box displaying the MTB
settings.10. Select DWT comparator 1 as Start Resource and DWT comparator 2 as Stop
Resource.11. In the Comparator 1 tab, select Instruction Fetch from the Generate Comparator
Match Event On drop-down box.12. In the Value text box, specify the address of the instruction on which you want to set
comparator 1. For example, 0x000008CE, which is the address of the second call toPerformance1().
Figure 7-11. Setting Comparator 1 — MTB Settings13. In the Comparator 2 tab, select Instruction Fetch from the Generate Comparator
Match Event On drop-down box.
Chapter 7 Setting Tracepoints (Kinetis)
CodeWarrior Development Studio for Microcontrollers Version 10.x Profiling and Analysis Tools UsersGuide, Rev. 10.6, 02/2014
Freescale Semiconductor, Inc. 197
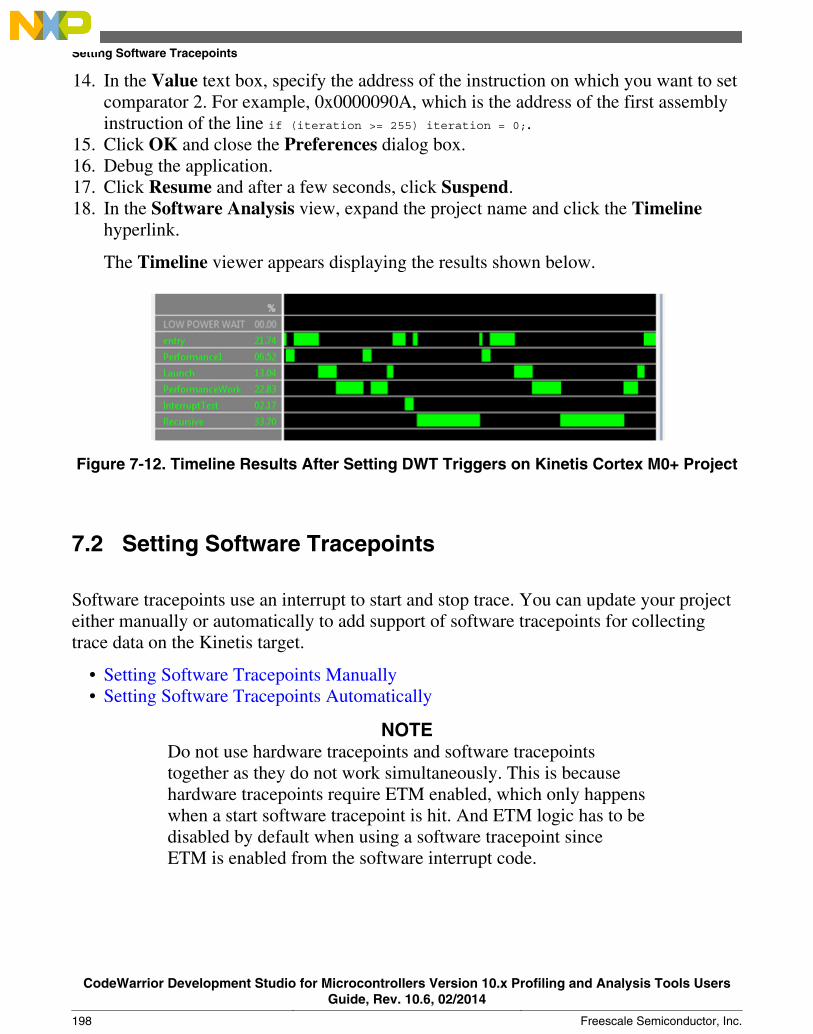
14. In the Value text box, specify the address of the instruction on which you want to setcomparator 2. For example, 0x0000090A, which is the address of the first assemblyinstruction of the line if (iteration >= 255) iteration = 0;.
15. Click OK and close the Preferences dialog box.16. Debug the application.17. Click Resume and after a few seconds, click Suspend.18. In the Software Analysis view, expand the project name and click the Timeline
hyperlink.
The Timeline viewer appears displaying the results shown below.
Figure 7-12. Timeline Results After Setting DWT Triggers on Kinetis Cortex M0+ Project
7.2 Setting Software Tracepoints
Software tracepoints use an interrupt to start and stop trace. You can update your projecteither manually or automatically to add support of software tracepoints for collectingtrace data on the Kinetis target.
• Setting Software Tracepoints Manually• Setting Software Tracepoints Automatically
NOTEDo not use hardware tracepoints and software tracepointstogether as they do not work simultaneously. This is becausehardware tracepoints require ETM enabled, which only happenswhen a start software tracepoint is hit. And ETM logic has to bedisabled by default when using a software tracepoint sinceETM is enabled from the software interrupt code.
Setting Software Tracepoints
CodeWarrior Development Studio for Microcontrollers Version 10.x Profiling and Analysis Tools UsersGuide, Rev. 10.6, 02/2014
198 Freescale Semiconductor, Inc.
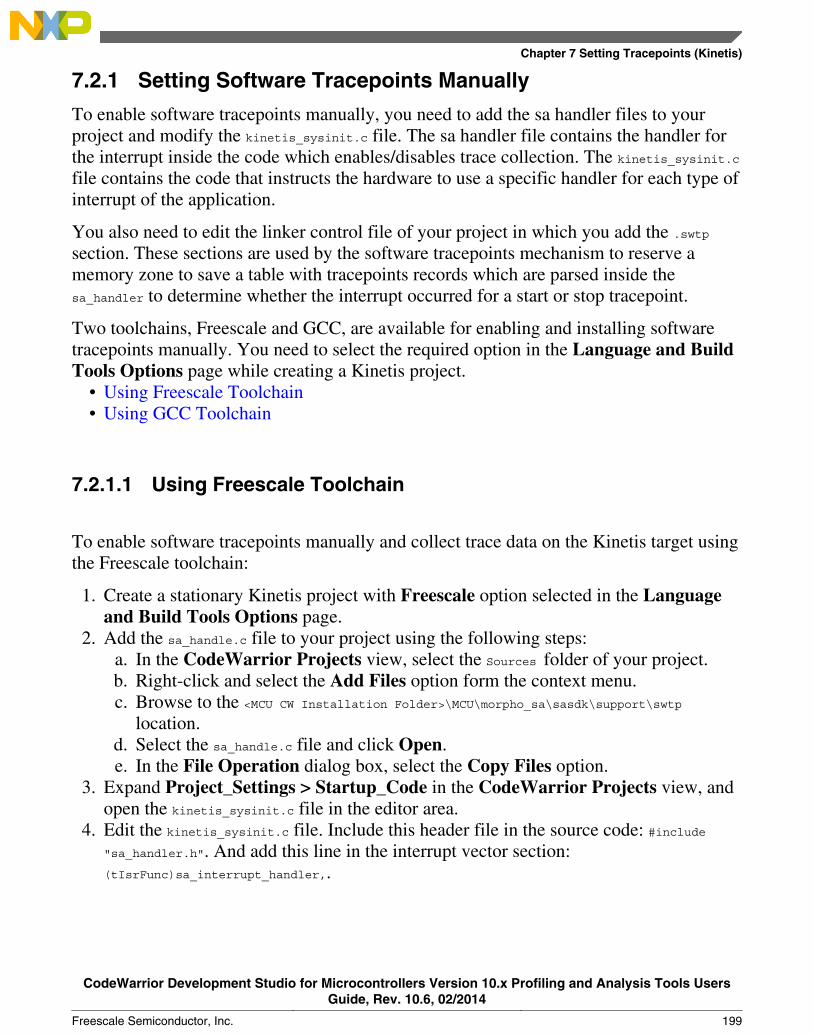
7.2.1 Setting Software Tracepoints Manually
To enable software tracepoints manually, you need to add the sa handler files to yourproject and modify the kinetis_sysinit.c file. The sa handler file contains the handler forthe interrupt inside the code which enables/disables trace collection. The kinetis_sysinit.cfile contains the code that instructs the hardware to use a specific handler for each type ofinterrupt of the application.
You also need to edit the linker control file of your project in which you add the .swtpsection. These sections are used by the software tracepoints mechanism to reserve amemory zone to save a table with tracepoints records which are parsed inside thesa_handler to determine whether the interrupt occurred for a start or stop tracepoint.
Two toolchains, Freescale and GCC, are available for enabling and installing softwaretracepoints manually. You need to select the required option in the Language and BuildTools Options page while creating a Kinetis project.
• Using Freescale Toolchain• Using GCC Toolchain
7.2.1.1 Using Freescale Toolchain
To enable software tracepoints manually and collect trace data on the Kinetis target usingthe Freescale toolchain:
1. Create a stationary Kinetis project with Freescale option selected in the Languageand Build Tools Options page.
2. Add the sa_handle.c file to your project using the following steps:a. In the CodeWarrior Projects view, select the Sources folder of your project.b. Right-click and select the Add Files option form the context menu.c. Browse to the <MCU CW Installation Folder>\MCU\morpho_sa\sasdk\support\swtp
location.d. Select the sa_handle.c file and click Open.e. In the File Operation dialog box, select the Copy Files option.
3. Expand Project_Settings > Startup_Code in the CodeWarrior Projects view, andopen the kinetis_sysinit.c file in the editor area.
4. Edit the kinetis_sysinit.c file. Include this header file in the source code: #include"sa_handler.h". And add this line in the interrupt vector section:(tIsrFunc)sa_interrupt_handler,.
Chapter 7 Setting Tracepoints (Kinetis)
CodeWarrior Development Studio for Microcontrollers Version 10.x Profiling and Analysis Tools UsersGuide, Rev. 10.6, 02/2014
Freescale Semiconductor, Inc. 199
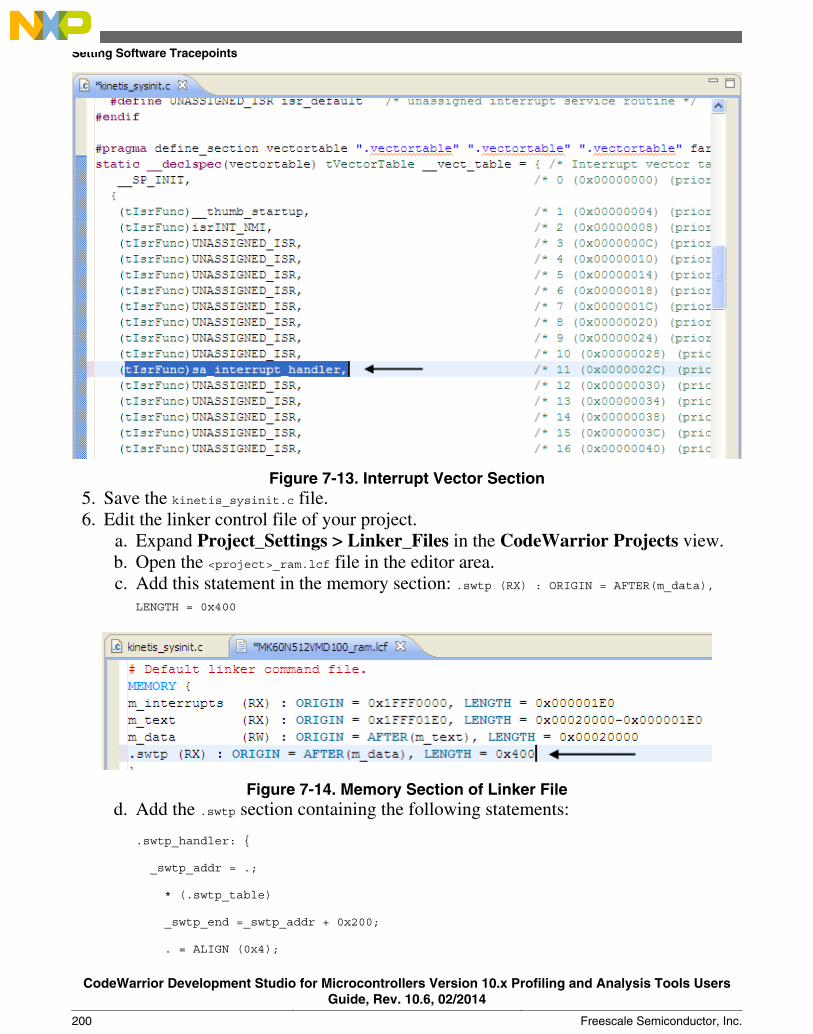
Figure 7-13. Interrupt Vector Section5. Save the kinetis_sysinit.c file.6. Edit the linker control file of your project.
a. Expand Project_Settings > Linker_Files in the CodeWarrior Projects view.b. Open the <project>_ram.lcf file in the editor area.c. Add this statement in the memory section: .swtp (RX) : ORIGIN = AFTER(m_data),
LENGTH = 0x400
Figure 7-14. Memory Section of Linker Filed. Add the .swtp section containing the following statements:
.swtp_handler: {
_swtp_addr = .;
* (.swtp_table)
_swtp_end =_swtp_addr + 0x200;
. = ALIGN (0x4);
Setting Software Tracepoints
CodeWarrior Development Studio for Microcontrollers Version 10.x Profiling and Analysis Tools UsersGuide, Rev. 10.6, 02/2014
200 Freescale Semiconductor, Inc.
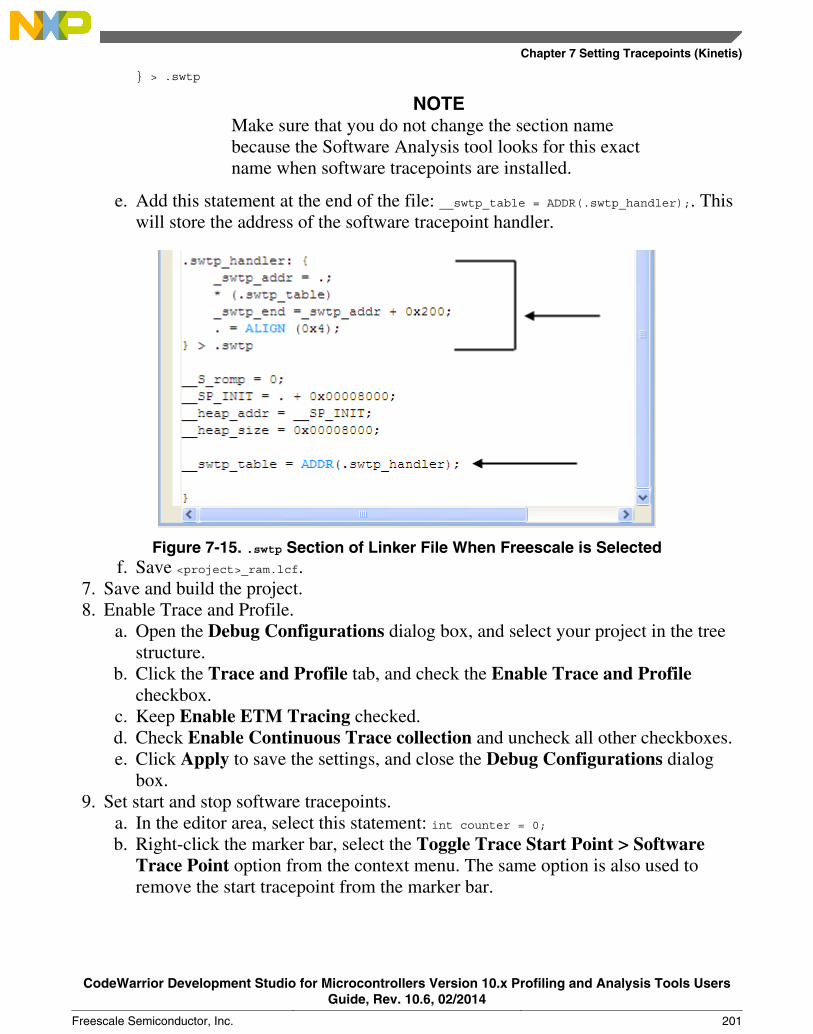
} > .swtp
NOTEMake sure that you do not change the section namebecause the Software Analysis tool looks for this exactname when software tracepoints are installed.
e. Add this statement at the end of the file: __swtp_table = ADDR(.swtp_handler);. Thiswill store the address of the software tracepoint handler.
Figure 7-15. .swtp Section of Linker File When Freescale is Selectedf. Save <project>_ram.lcf.
7. Save and build the project.8. Enable Trace and Profile.
a. Open the Debug Configurations dialog box, and select your project in the treestructure.
b. Click the Trace and Profile tab, and check the Enable Trace and Profilecheckbox.
c. Keep Enable ETM Tracing checked.d. Check Enable Continuous Trace collection and uncheck all other checkboxes.e. Click Apply to save the settings, and close the Debug Configurations dialog
box.9. Set start and stop software tracepoints.
a. In the editor area, select this statement: int counter = 0;b. Right-click the marker bar, select the Toggle Trace Start Point > Software
Trace Point option from the context menu. The same option is also used toremove the start tracepoint from the marker bar.
Chapter 7 Setting Tracepoints (Kinetis)
CodeWarrior Development Studio for Microcontrollers Version 10.x Profiling and Analysis Tools UsersGuide, Rev. 10.6, 02/2014
Freescale Semiconductor, Inc. 201
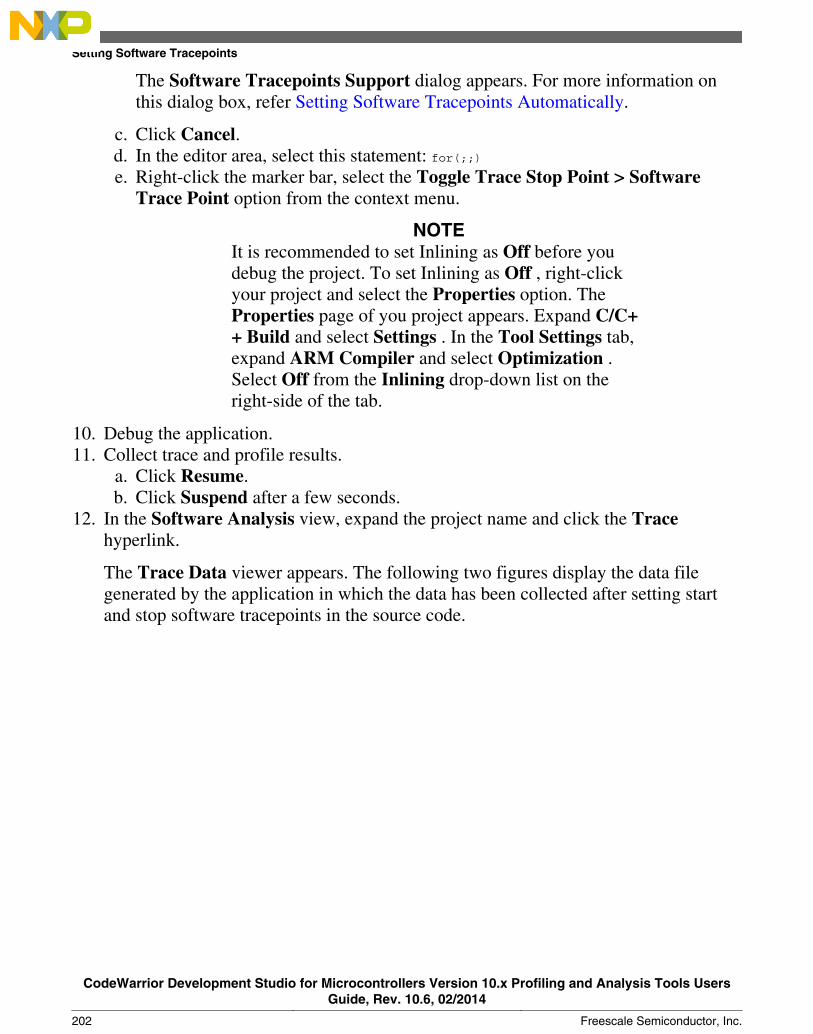
The Software Tracepoints Support dialog appears. For more information onthis dialog box, refer Setting Software Tracepoints Automatically.
c. Click Cancel.d. In the editor area, select this statement: for(;;)e. Right-click the marker bar, select the Toggle Trace Stop Point > Software
Trace Point option from the context menu.
NOTEIt is recommended to set Inlining as Off before youdebug the project. To set Inlining as Off , right-clickyour project and select the Properties option. TheProperties page of you project appears. Expand C/C++ Build and select Settings . In the Tool Settings tab,expand ARM Compiler and select Optimization .Select Off from the Inlining drop-down list on theright-side of the tab.
10. Debug the application.11. Collect trace and profile results.
a. Click Resume.b. Click Suspend after a few seconds.
12. In the Software Analysis view, expand the project name and click the Tracehyperlink.
The Trace Data viewer appears. The following two figures display the data filegenerated by the application in which the data has been collected after setting startand stop software tracepoints in the source code.
Setting Software Tracepoints
CodeWarrior Development Studio for Microcontrollers Version 10.x Profiling and Analysis Tools UsersGuide, Rev. 10.6, 02/2014
202 Freescale Semiconductor, Inc.
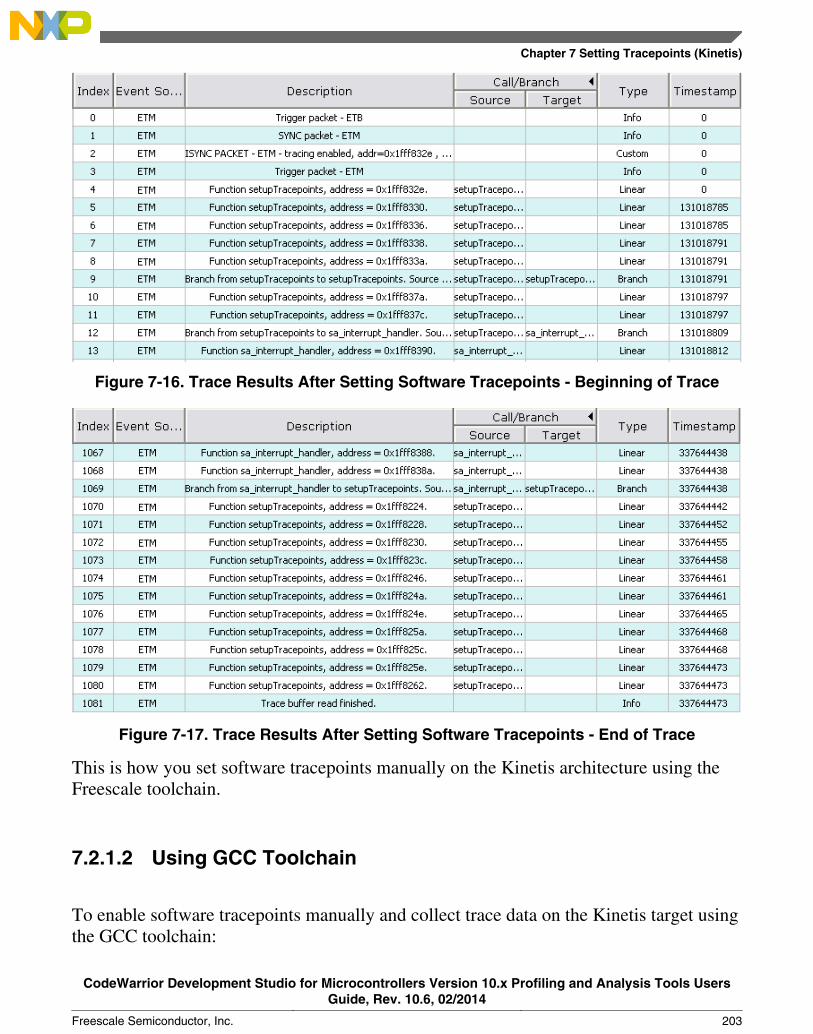
Figure 7-16. Trace Results After Setting Software Tracepoints - Beginning of Trace
Figure 7-17. Trace Results After Setting Software Tracepoints - End of Trace
This is how you set software tracepoints manually on the Kinetis architecture using theFreescale toolchain.
7.2.1.2 Using GCC Toolchain
To enable software tracepoints manually and collect trace data on the Kinetis target usingthe GCC toolchain:
Chapter 7 Setting Tracepoints (Kinetis)
CodeWarrior Development Studio for Microcontrollers Version 10.x Profiling and Analysis Tools UsersGuide, Rev. 10.6, 02/2014
Freescale Semiconductor, Inc. 203
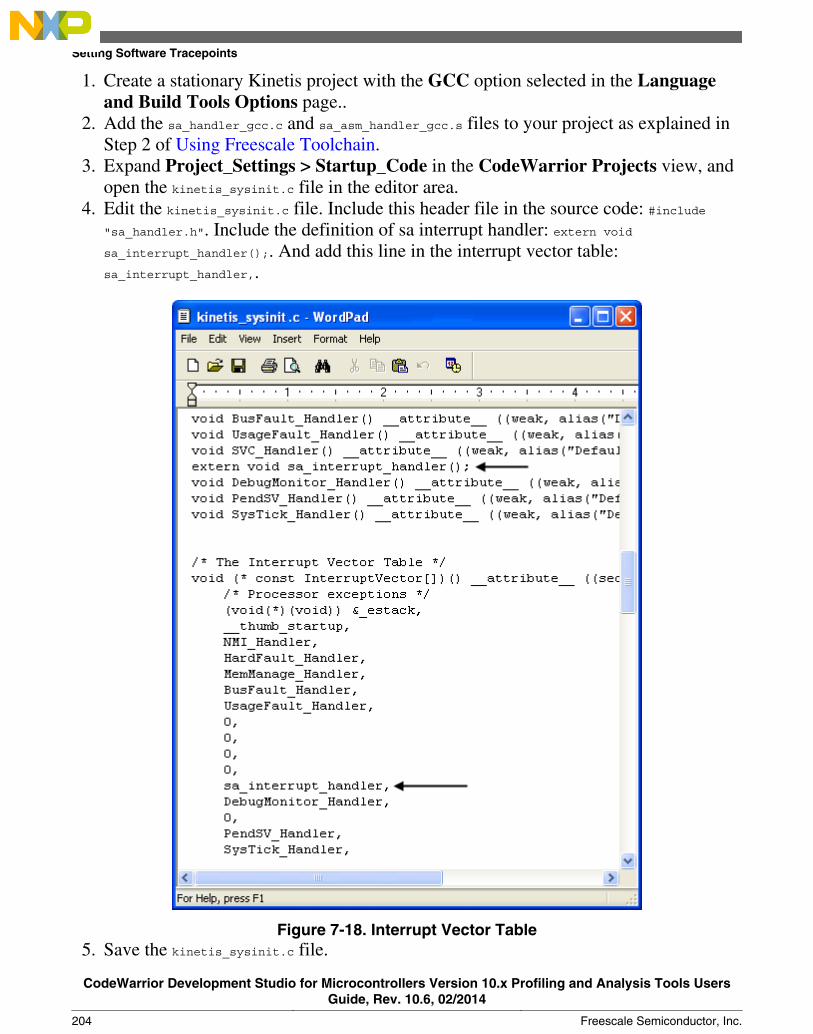
1. Create a stationary Kinetis project with the GCC option selected in the Languageand Build Tools Options page..
2. Add the sa_handler_gcc.c and sa_asm_handler_gcc.s files to your project as explained inStep 2 of Using Freescale Toolchain.
3. Expand Project_Settings > Startup_Code in the CodeWarrior Projects view, andopen the kinetis_sysinit.c file in the editor area.
4. Edit the kinetis_sysinit.c file. Include this header file in the source code: #include"sa_handler.h". Include the definition of sa interrupt handler: extern voidsa_interrupt_handler();. And add this line in the interrupt vector table:sa_interrupt_handler,.
Figure 7-18. Interrupt Vector Table5. Save the kinetis_sysinit.c file.
Setting Software Tracepoints
CodeWarrior Development Studio for Microcontrollers Version 10.x Profiling and Analysis Tools UsersGuide, Rev. 10.6, 02/2014
204 Freescale Semiconductor, Inc.
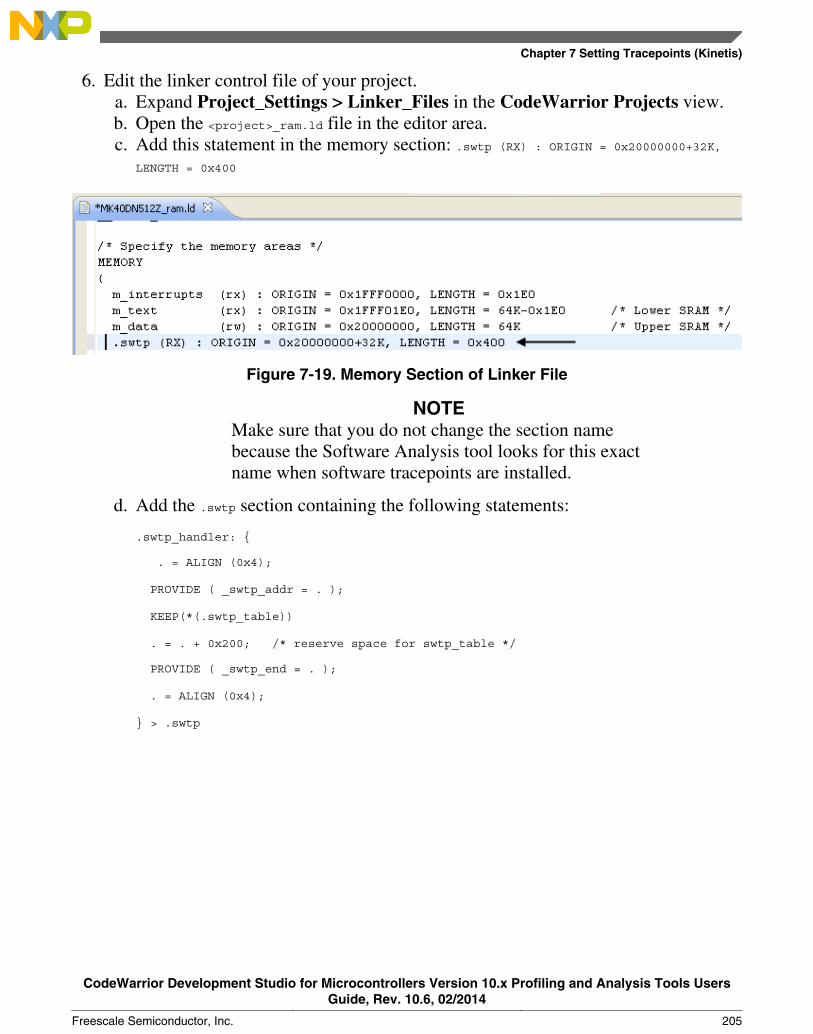
6. Edit the linker control file of your project.a. Expand Project_Settings > Linker_Files in the CodeWarrior Projects view.b. Open the <project>_ram.ld file in the editor area.c. Add this statement in the memory section: .swtp (RX) : ORIGIN = 0x20000000+32K,
LENGTH = 0x400
Figure 7-19. Memory Section of Linker File
NOTEMake sure that you do not change the section namebecause the Software Analysis tool looks for this exactname when software tracepoints are installed.
d. Add the .swtp section containing the following statements:
.swtp_handler: {
. = ALIGN (0x4);
PROVIDE ( _swtp_addr = . );
KEEP(*(.swtp_table))
. = . + 0x200; /* reserve space for swtp_table */
PROVIDE ( _swtp_end = . );
. = ALIGN (0x4);
} > .swtp
Chapter 7 Setting Tracepoints (Kinetis)
CodeWarrior Development Studio for Microcontrollers Version 10.x Profiling and Analysis Tools UsersGuide, Rev. 10.6, 02/2014
Freescale Semiconductor, Inc. 205
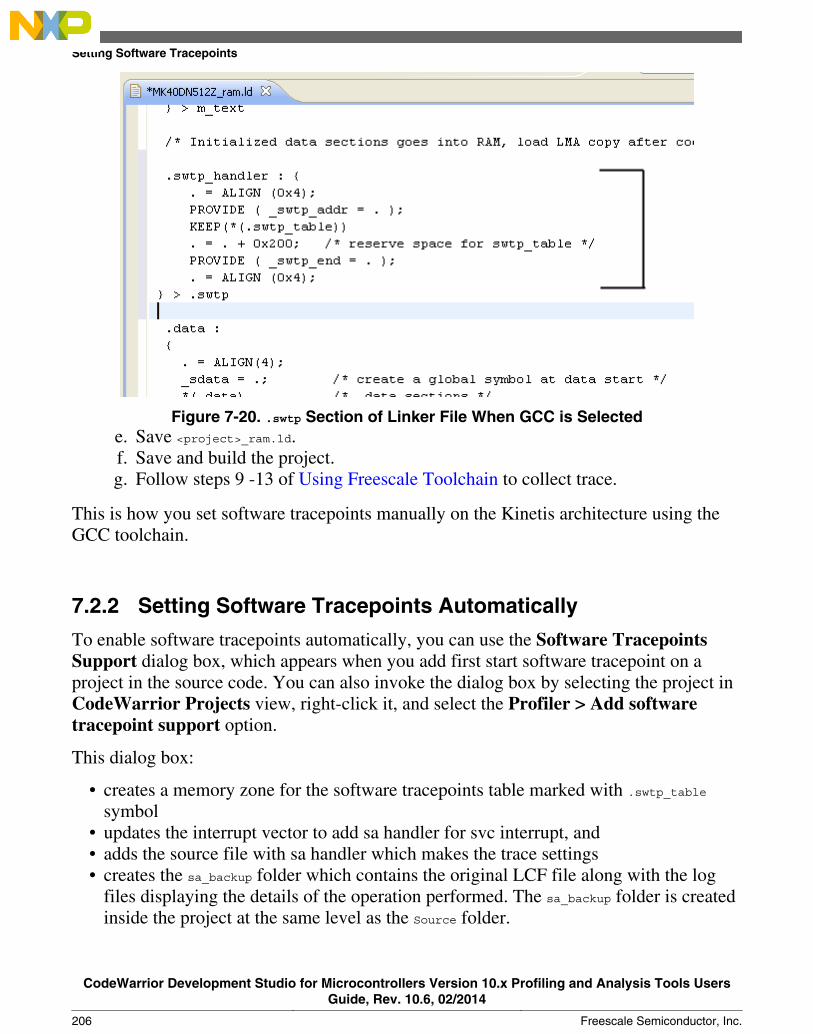
Figure 7-20. .swtp Section of Linker File When GCC is Selectede. Save <project>_ram.ld.f. Save and build the project.g. Follow steps 9 -13 of Using Freescale Toolchain to collect trace.
This is how you set software tracepoints manually on the Kinetis architecture using theGCC toolchain.
7.2.2 Setting Software Tracepoints Automatically
To enable software tracepoints automatically, you can use the Software TracepointsSupport dialog box, which appears when you add first start software tracepoint on aproject in the source code. You can also invoke the dialog box by selecting the project inCodeWarrior Projects view, right-click it, and select the Profiler > Add softwaretracepoint support option.
This dialog box:
• creates a memory zone for the software tracepoints table marked with .swtp_tablesymbol
• updates the interrupt vector to add sa handler for svc interrupt, and• adds the source file with sa handler which makes the trace settings• creates the sa_backup folder which contains the original LCF file along with the log
files displaying the details of the operation performed. The sa_backup folder is createdinside the project at the same level as the Source folder.
Setting Software Tracepoints
CodeWarrior Development Studio for Microcontrollers Version 10.x Profiling and Analysis Tools UsersGuide, Rev. 10.6, 02/2014
206 Freescale Semiconductor, Inc.
NOTEIf you remove the sa_backup folder, the LCF file will not berestored to the initial form before adding softwaretracepoint support.
Perform the following steps to enable software tracepoints automatically and collect tracedata. The steps are same for Freescale as well as GCC toolchain.
1. Open the Debug Configurations dialog box, and select your project in the treestructure.
2. Click the Trace and Profile tab, and check the Enable Trace and Profile checkbox.3. Check Continuous Trace collection and uncheck all other checkboxes.4. Click Apply to save the settings, and close the Debug Configurations dialog box.5. In the editor area, select this statement: int counter = 0;6. Right-click the marker bar, select the Toggle Trace Start Point > Software Trace
Point option from the context menu. The same option is also used to remove the starttracepoint from the marker bar.
The Software Tracepoints Support dialog box appears.
NOTEIf you click Cancel in the Software Tracepoints Supportdialog box, the start tracepoint is set in the source code, butyou are required to enable the software tracepointsfunctionality manually as discussed in Setting SoftwareTracepoints Manually.
Chapter 7 Setting Tracepoints (Kinetis)
CodeWarrior Development Studio for Microcontrollers Version 10.x Profiling and Analysis Tools UsersGuide, Rev. 10.6, 02/2014
Freescale Semiconductor, Inc. 207
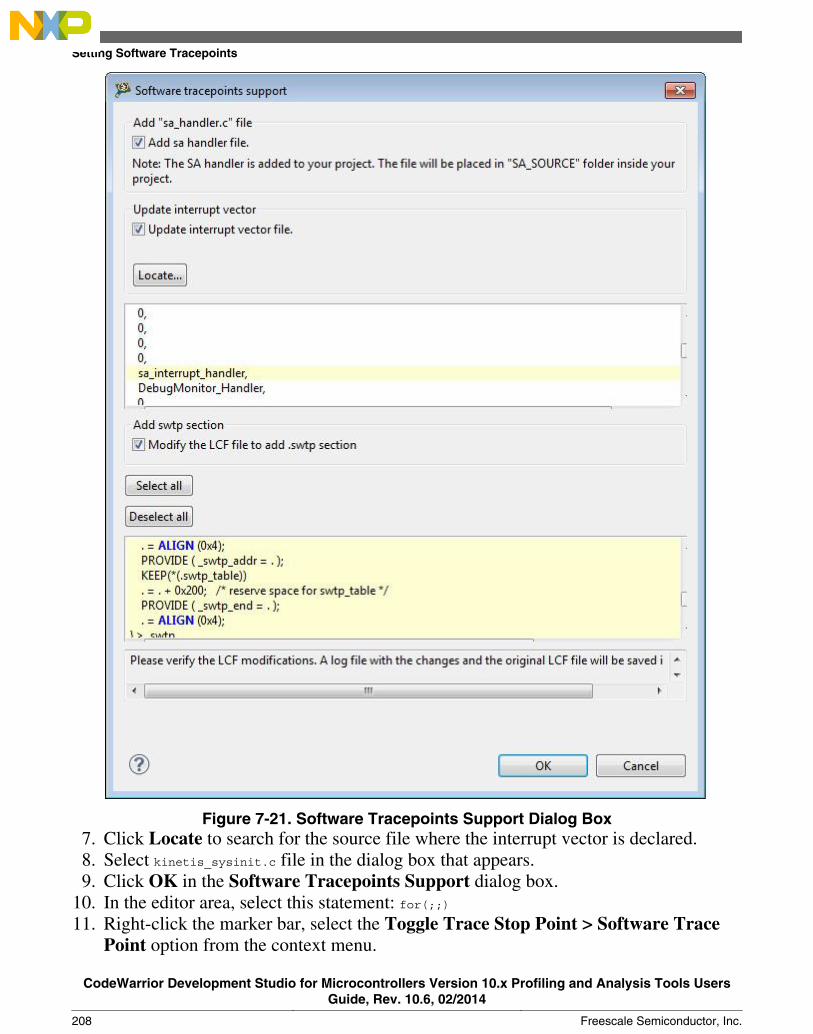
Figure 7-21. Software Tracepoints Support Dialog Box7. Click Locate to search for the source file where the interrupt vector is declared.8. Select kinetis_sysinit.c file in the dialog box that appears.9. Click OK in the Software Tracepoints Support dialog box.
10. In the editor area, select this statement: for(;;)11. Right-click the marker bar, select the Toggle Trace Stop Point > Software Trace
Point option from the context menu.
Setting Software Tracepoints
CodeWarrior Development Studio for Microcontrollers Version 10.x Profiling and Analysis Tools UsersGuide, Rev. 10.6, 02/2014
208 Freescale Semiconductor, Inc.
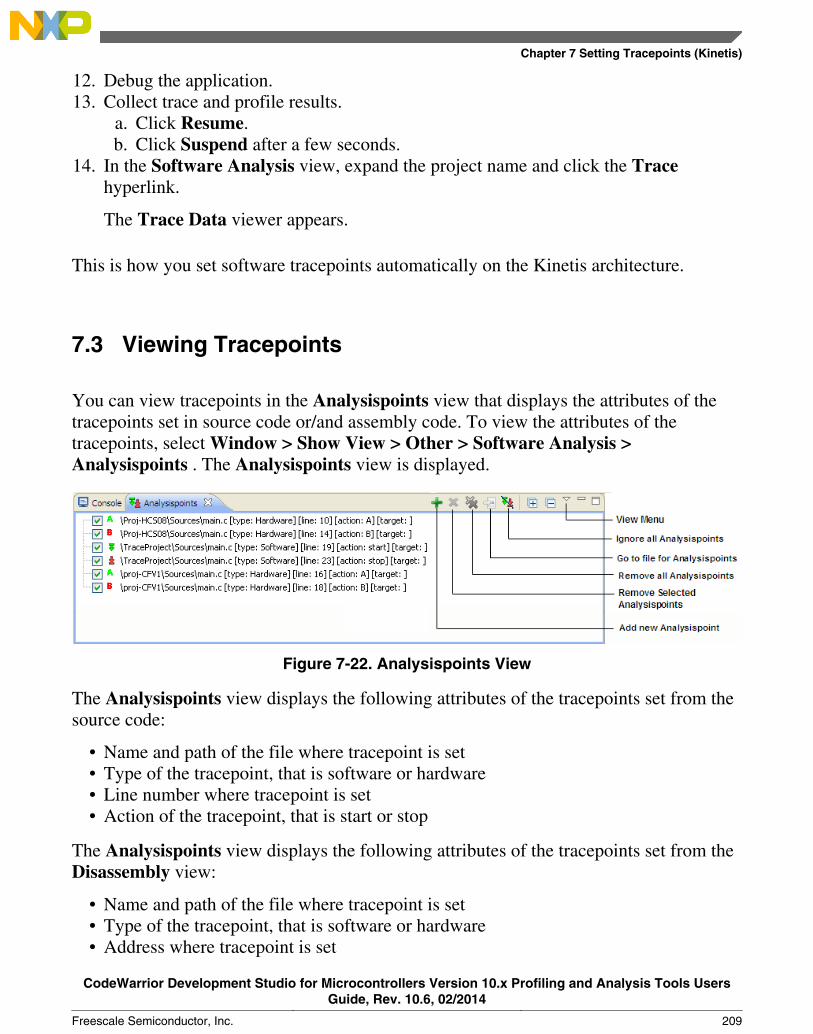
12. Debug the application.13. Collect trace and profile results.
a. Click Resume.b. Click Suspend after a few seconds.
14. In the Software Analysis view, expand the project name and click the Tracehyperlink.
The Trace Data viewer appears.
This is how you set software tracepoints automatically on the Kinetis architecture.
7.3 Viewing Tracepoints
You can view tracepoints in the Analysispoints view that displays the attributes of thetracepoints set in source code or/and assembly code. To view the attributes of thetracepoints, select Window > Show View > Other > Software Analysis >Analysispoints . The Analysispoints view is displayed.
Figure 7-22. Analysispoints View
The Analysispoints view displays the following attributes of the tracepoints set from thesource code:
• Name and path of the file where tracepoint is set• Type of the tracepoint, that is software or hardware• Line number where tracepoint is set• Action of the tracepoint, that is start or stop
The Analysispoints view displays the following attributes of the tracepoints set from theDisassembly view:
• Name and path of the file where tracepoint is set• Type of the tracepoint, that is software or hardware• Address where tracepoint is set
Chapter 7 Setting Tracepoints (Kinetis)
CodeWarrior Development Studio for Microcontrollers Version 10.x Profiling and Analysis Tools UsersGuide, Rev. 10.6, 02/2014
Freescale Semiconductor, Inc. 209
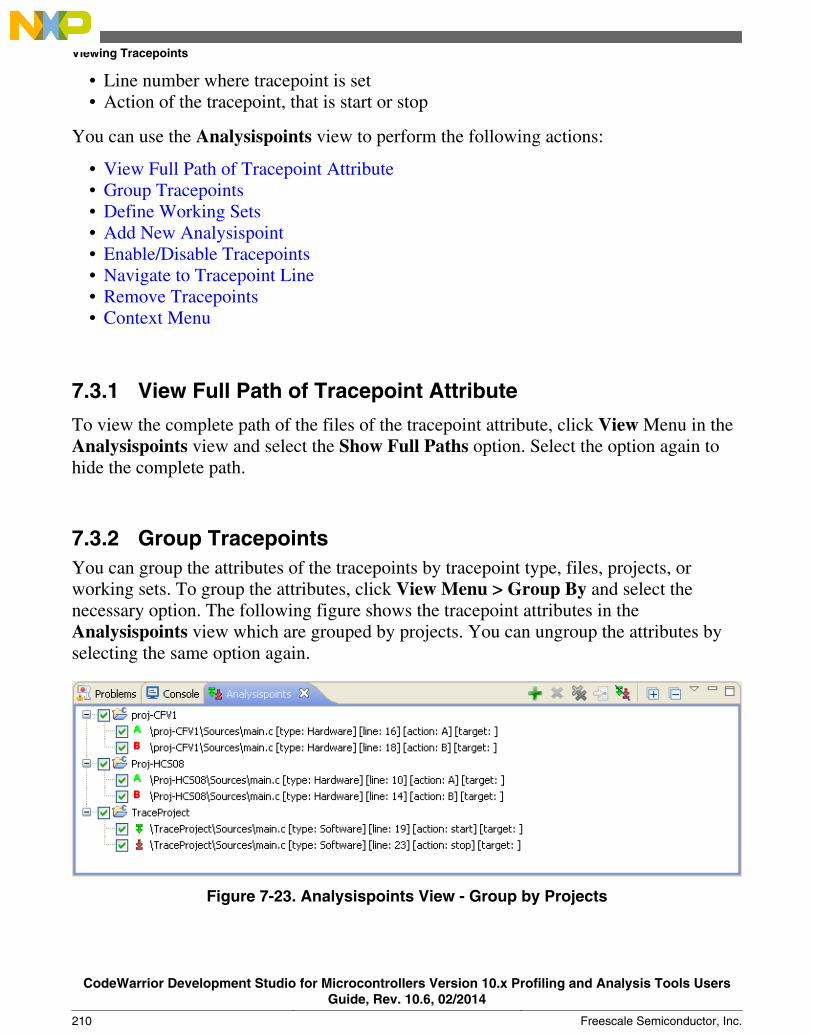
• Line number where tracepoint is set• Action of the tracepoint, that is start or stop
You can use the Analysispoints view to perform the following actions:
• View Full Path of Tracepoint Attribute• Group Tracepoints• Define Working Sets• Add New Analysispoint• Enable/Disable Tracepoints• Navigate to Tracepoint Line• Remove Tracepoints• Context Menu
7.3.1 View Full Path of Tracepoint Attribute
To view the complete path of the files of the tracepoint attribute, click View Menu in theAnalysispoints view and select the Show Full Paths option. Select the option again tohide the complete path.
7.3.2 Group TracepointsYou can group the attributes of the tracepoints by tracepoint type, files, projects, orworking sets. To group the attributes, click View Menu > Group By and select thenecessary option. The following figure shows the tracepoint attributes in theAnalysispoints view which are grouped by projects. You can ungroup the attributes byselecting the same option again.
Figure 7-23. Analysispoints View - Group by Projects
Viewing Tracepoints
CodeWarrior Development Studio for Microcontrollers Version 10.x Profiling and Analysis Tools UsersGuide, Rev. 10.6, 02/2014
210 Freescale Semiconductor, Inc.
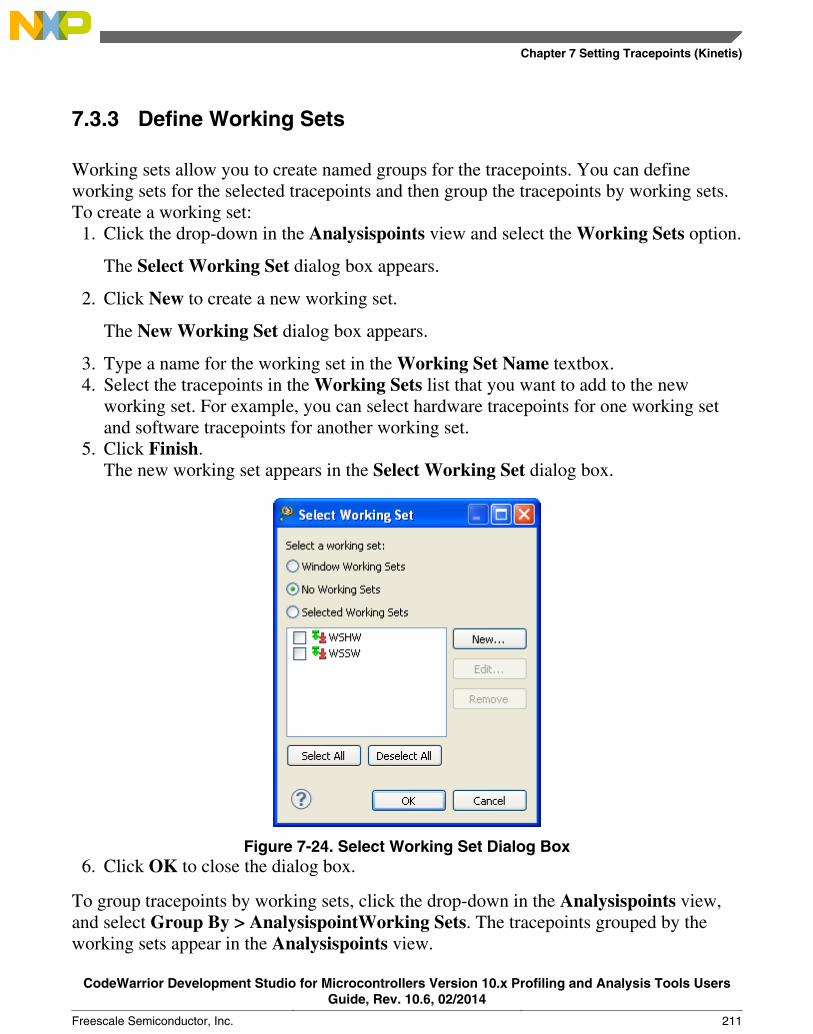
7.3.3 Define Working Sets
Working sets allow you to create named groups for the tracepoints. You can defineworking sets for the selected tracepoints and then group the tracepoints by working sets.To create a working set:
1. Click the drop-down in the Analysispoints view and select the Working Sets option.
The Select Working Set dialog box appears.
2. Click New to create a new working set.
The New Working Set dialog box appears.
3. Type a name for the working set in the Working Set Name textbox.4. Select the tracepoints in the Working Sets list that you want to add to the new
working set. For example, you can select hardware tracepoints for one working setand software tracepoints for another working set.
5. Click Finish.The new working set appears in the Select Working Set dialog box.
Figure 7-24. Select Working Set Dialog Box6. Click OK to close the dialog box.
To group tracepoints by working sets, click the drop-down in the Analysispoints view,and select Group By > AnalysispointWorking Sets. The tracepoints grouped by theworking sets appear in the Analysispoints view.
Chapter 7 Setting Tracepoints (Kinetis)
CodeWarrior Development Studio for Microcontrollers Version 10.x Profiling and Analysis Tools UsersGuide, Rev. 10.6, 02/2014
Freescale Semiconductor, Inc. 211
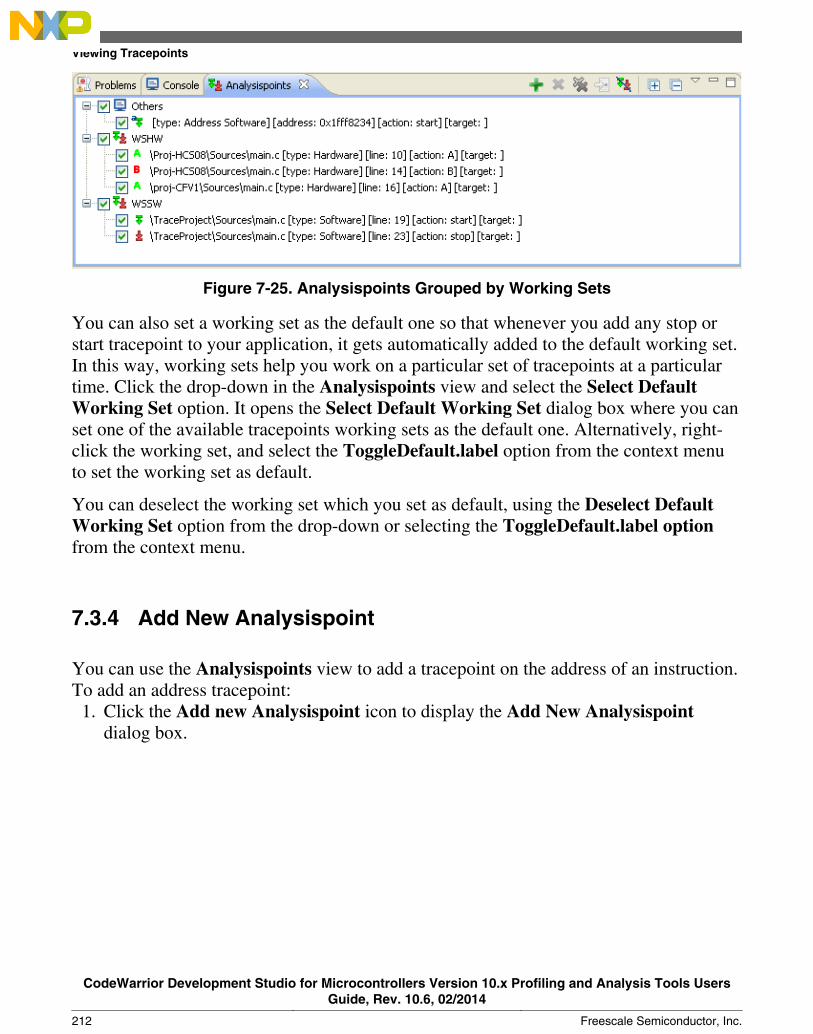
Figure 7-25. Analysispoints Grouped by Working Sets
You can also set a working set as the default one so that whenever you add any stop orstart tracepoint to your application, it gets automatically added to the default working set.In this way, working sets help you work on a particular set of tracepoints at a particulartime. Click the drop-down in the Analysispoints view and select the Select DefaultWorking Set option. It opens the Select Default Working Set dialog box where you canset one of the available tracepoints working sets as the default one. Alternatively, right-click the working set, and select the ToggleDefault.label option from the context menuto set the working set as default.
You can deselect the working set which you set as default, using the Deselect DefaultWorking Set option from the drop-down or selecting the ToggleDefault.label optionfrom the context menu.
7.3.4 Add New Analysispoint
You can use the Analysispoints view to add a tracepoint on the address of an instruction.To add an address tracepoint:
1. Click the Add new Analysispoint icon to display the Add New Analysispointdialog box.
Viewing Tracepoints
CodeWarrior Development Studio for Microcontrollers Version 10.x Profiling and Analysis Tools UsersGuide, Rev. 10.6, 02/2014
212 Freescale Semiconductor, Inc.
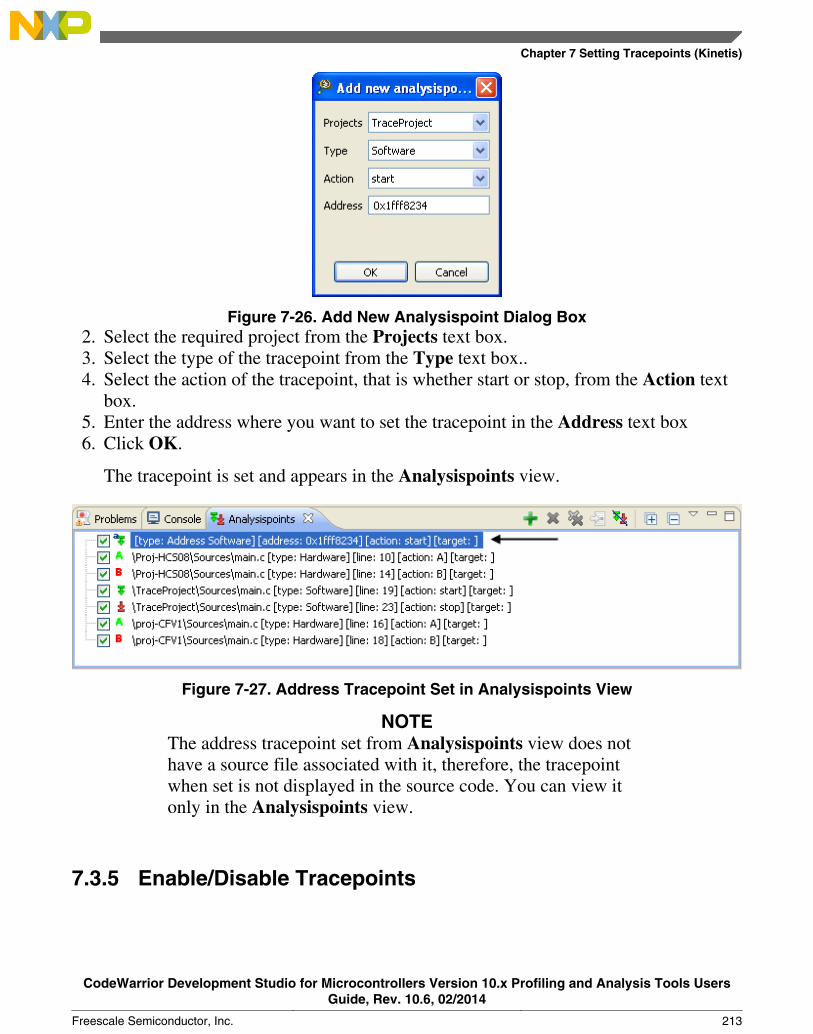
Figure 7-26. Add New Analysispoint Dialog Box2. Select the required project from the Projects text box.3. Select the type of the tracepoint from the Type text box..4. Select the action of the tracepoint, that is whether start or stop, from the Action text
box.5. Enter the address where you want to set the tracepoint in the Address text box6. Click OK.
The tracepoint is set and appears in the Analysispoints view.
Figure 7-27. Address Tracepoint Set in Analysispoints View
NOTEThe address tracepoint set from Analysispoints view does nothave a source file associated with it, therefore, the tracepointwhen set is not displayed in the source code. You can view itonly in the Analysispoints view.
7.3.5 Enable/Disable Tracepoints
Chapter 7 Setting Tracepoints (Kinetis)
CodeWarrior Development Studio for Microcontrollers Version 10.x Profiling and Analysis Tools UsersGuide, Rev. 10.6, 02/2014
Freescale Semiconductor, Inc. 213
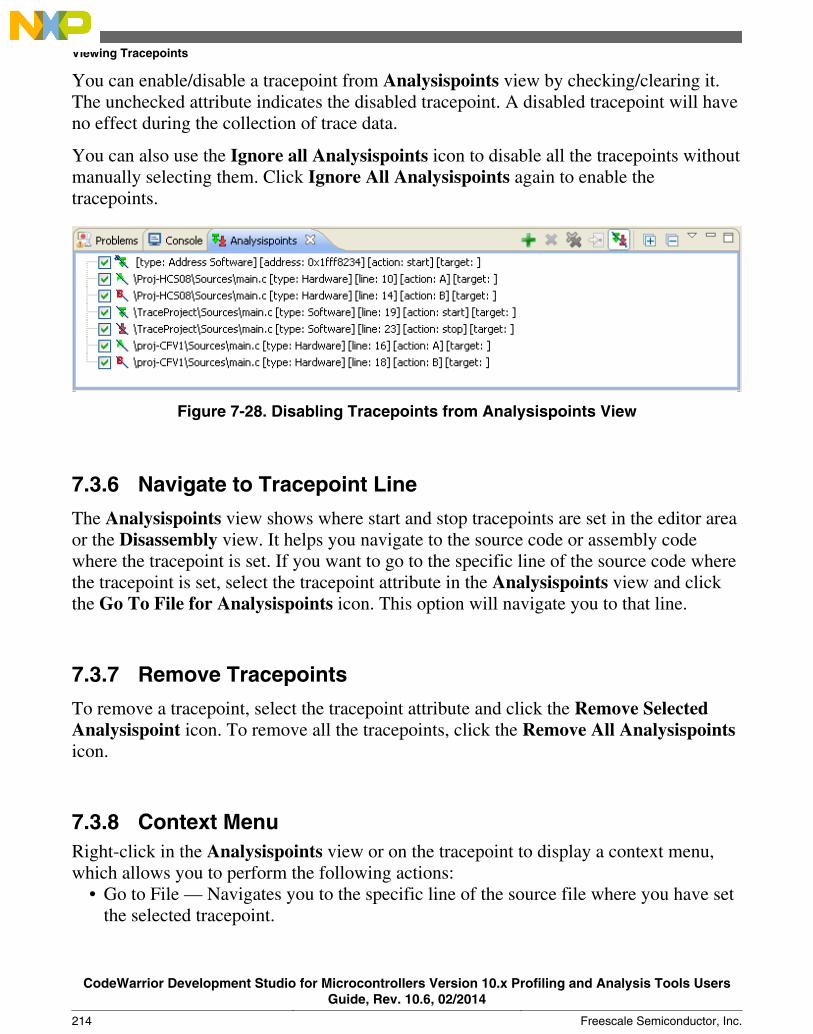
You can enable/disable a tracepoint from Analysispoints view by checking/clearing it.The unchecked attribute indicates the disabled tracepoint. A disabled tracepoint will haveno effect during the collection of trace data.
You can also use the Ignore all Analysispoints icon to disable all the tracepoints withoutmanually selecting them. Click Ignore All Analysispoints again to enable thetracepoints.
Figure 7-28. Disabling Tracepoints from Analysispoints View
7.3.6 Navigate to Tracepoint Line
The Analysispoints view shows where start and stop tracepoints are set in the editor areaor the Disassembly view. It helps you navigate to the source code or assembly codewhere the tracepoint is set. If you want to go to the specific line of the source code wherethe tracepoint is set, select the tracepoint attribute in the Analysispoints view and clickthe Go To File for Analysispoints icon. This option will navigate you to that line.
7.3.7 Remove Tracepoints
To remove a tracepoint, select the tracepoint attribute and click the Remove SelectedAnalysispoint icon. To remove all the tracepoints, click the Remove All Analysispointsicon.
7.3.8 Context MenuRight-click in the Analysispoints view or on the tracepoint to display a context menu,which allows you to perform the following actions:
• Go to File — Navigates you to the specific line of the source file where you have setthe selected tracepoint.
Viewing Tracepoints
CodeWarrior Development Studio for Microcontrollers Version 10.x Profiling and Analysis Tools UsersGuide, Rev. 10.6, 02/2014
214 Freescale Semiconductor, Inc.

• Enable/Disable — Allows you to enable/disable tracepoints. A disabled tracepointwill have no effect during the collection of trace data.
• Remove — Removes the selected tracepoint.• Remove All — Removes all tracepoints that are displayed in the Analysispoints
view.• Select All — Selects all tracepoints in the Analysispoints view.• Copy — Copies the selected tracepoint on the clipboard.• Set Cores — Lets you select the cores for which you want to set tracepoints. This
feature is applicable for multicore tracing, which is not yet supported in CodeWarriorMicrocontrollers.
• Export Analysispoints — Lets you save the tracepoints in a .apt file at a desiredlocation. Select this option to display the Export Analysis Points dialog box. Selectthe tracepoint(s) that you want to save, and click Browse to navigate to a locationwhere you want to save the tracepoint(s), in the Save Analysis Points As dialog box.Specify a filename in which the tracepoints will be exported. The full path willappear in the Destination text box. Click Finish.
Chapter 7 Setting Tracepoints (Kinetis)
CodeWarrior Development Studio for Microcontrollers Version 10.x Profiling and Analysis Tools UsersGuide, Rev. 10.6, 02/2014
Freescale Semiconductor, Inc. 215
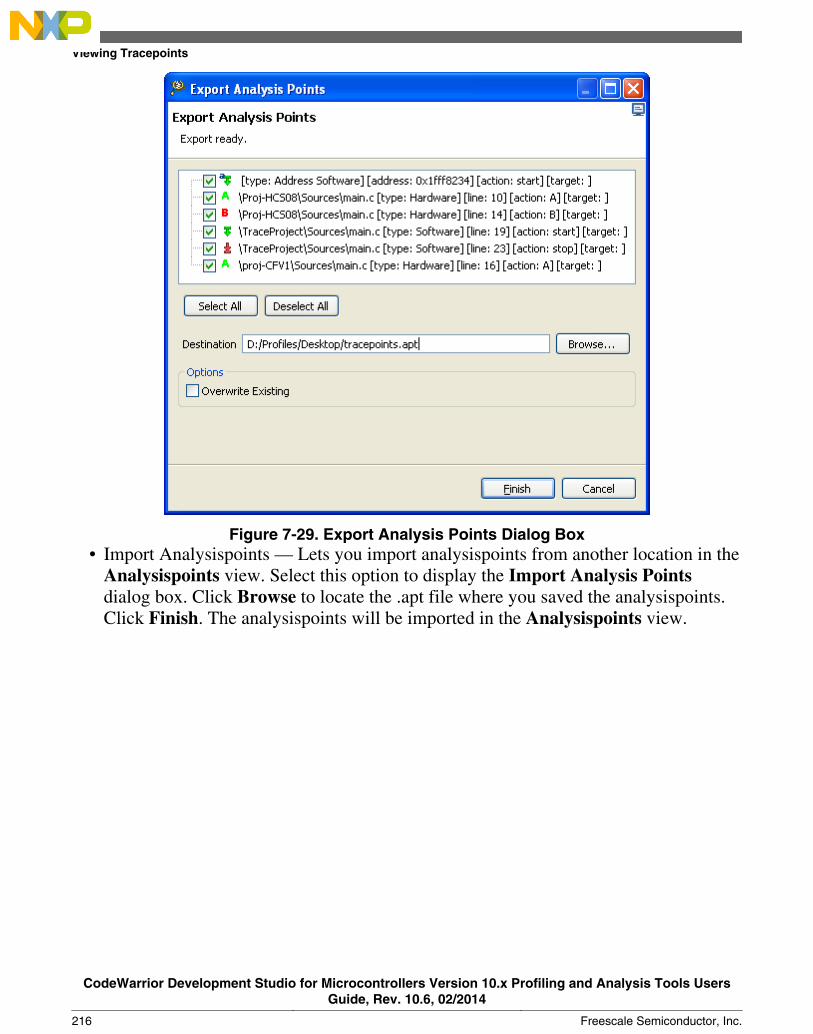
Figure 7-29. Export Analysis Points Dialog Box• Import Analysispoints — Lets you import analysispoints from another location in the
Analysispoints view. Select this option to display the Import Analysis Pointsdialog box. Click Browse to locate the .apt file where you saved the analysispoints.Click Finish. The analysispoints will be imported in the Analysispoints view.
Viewing Tracepoints
CodeWarrior Development Studio for Microcontrollers Version 10.x Profiling and Analysis Tools UsersGuide, Rev. 10.6, 02/2014
216 Freescale Semiconductor, Inc.
Chapter 8Data VisualizationData visualization allows you to visualize during runtime the evolution of certainapplication data, such as variables, registers, memory, which represent parametersdefining the functionality of certain equipment, for example, a motor.
Data Visualization is available for DSC architectures only. Data visualization helps DSCusers identify and chart variables against time and other variables. Data Visualization:
• samples the values of registers, variables and/or raw memory data as the applicationis running
• displays the collected data in a chart as the application is running• samples the required data without stopping the core if the target allows or allows you
to set visualization points (special type of breakpoints) which would automaticallystop the target, read the required data and resume the target immediately.
NOTEThe JTAG interface on the DSC is powerful enough toextract the value of variables. To do this, a specialVisualization Breakpoint is set. When this breakpoint isreached, the JTAG interface relays the information aboutthe variables being monitored so that they can be graphed.
This chapter consists of the following topics:
• Creating DSC Project• Configuring for Data Visualization• Setting Analysispoints for Data Visualization• Collecting and Viewing Data
8.1 Creating DSC ProjectTo create a DSC project:
CodeWarrior Development Studio for Microcontrollers Version 10.x Profiling and Analysis Tools UsersGuide, Rev. 10.6, 02/2014
Freescale Semiconductor, Inc. 217
1. Select File > New > Bareboard Project.
The Create an MCU Bareboard Project page appears.
2. Enter the name of your project in the Project Name text box and click Next.
The Devices page appears.
3. Select the target device or board for your project from the DSC family. For example,select 56800/E (DSC) > MC56F825X > MC56F8257.
4. Click Next.
The Connections page appears.
5. Select the available connection.6. Click Next two times and then click Finish.
The project is created and appears in the CodeWarrior Projects view. You can nowbuild your project.
8.2 Configuring for Data VisualizationTo configure your DSC project for data visualization:
1. Open the Debug Configurations dialog box.2. Click the Trace and Profile tab.3. Check the Enable Data Visualization checkbox.
The options corresponding to Trace and Profile get disabled. This is because DataVisualization and tracing cannot be used simultaneously. Trace collection and DataVisualization sampling may be used together on the platforms which support readingtarget memory and registers while running. In this case, both checkboxes will be enabledand may be selected at the same time.
Configuring for Data Visualization
CodeWarrior Development Studio for Microcontrollers Version 10.x Profiling and Analysis Tools UsersGuide, Rev. 10.6, 02/2014
218 Freescale Semiconductor, Inc.
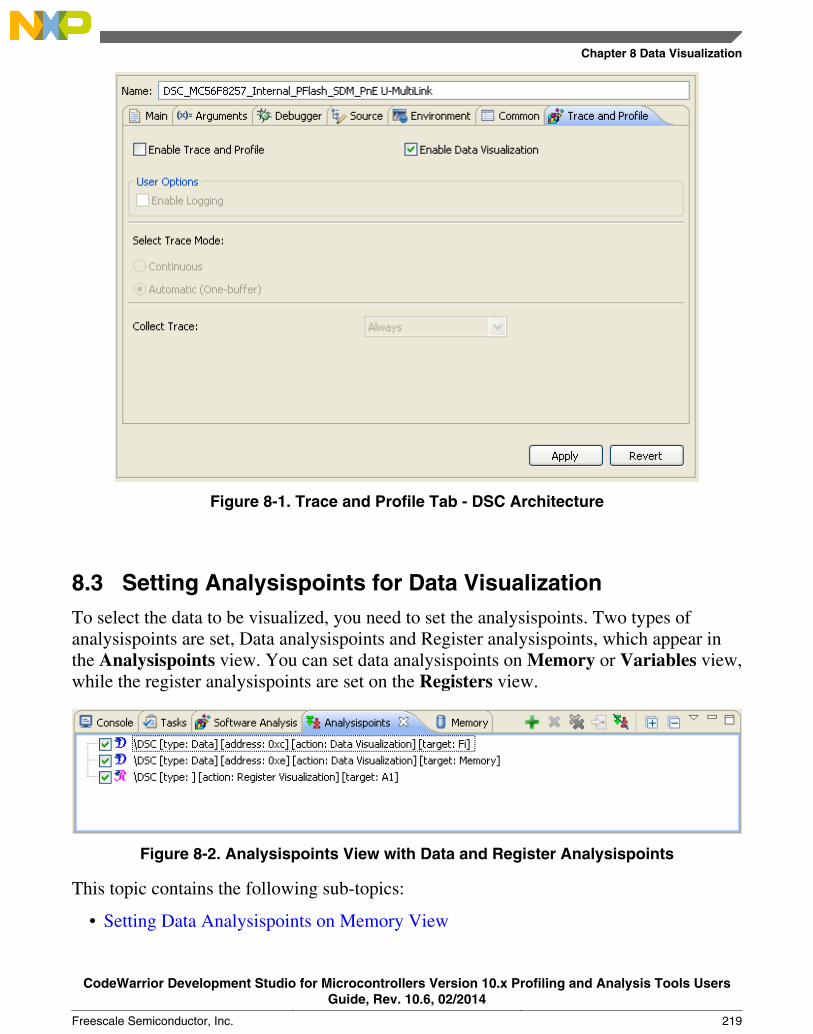
Figure 8-1. Trace and Profile Tab - DSC Architecture
8.3 Setting Analysispoints for Data VisualizationTo select the data to be visualized, you need to set the analysispoints. Two types ofanalysispoints are set, Data analysispoints and Register analysispoints, which appear inthe Analysispoints view. You can set data analysispoints on Memory or Variables view,while the register analysispoints are set on the Registers view.
Figure 8-2. Analysispoints View with Data and Register Analysispoints
This topic contains the following sub-topics:
• Setting Data Analysispoints on Memory View
Chapter 8 Data Visualization
CodeWarrior Development Studio for Microcontrollers Version 10.x Profiling and Analysis Tools UsersGuide, Rev. 10.6, 02/2014
Freescale Semiconductor, Inc. 219
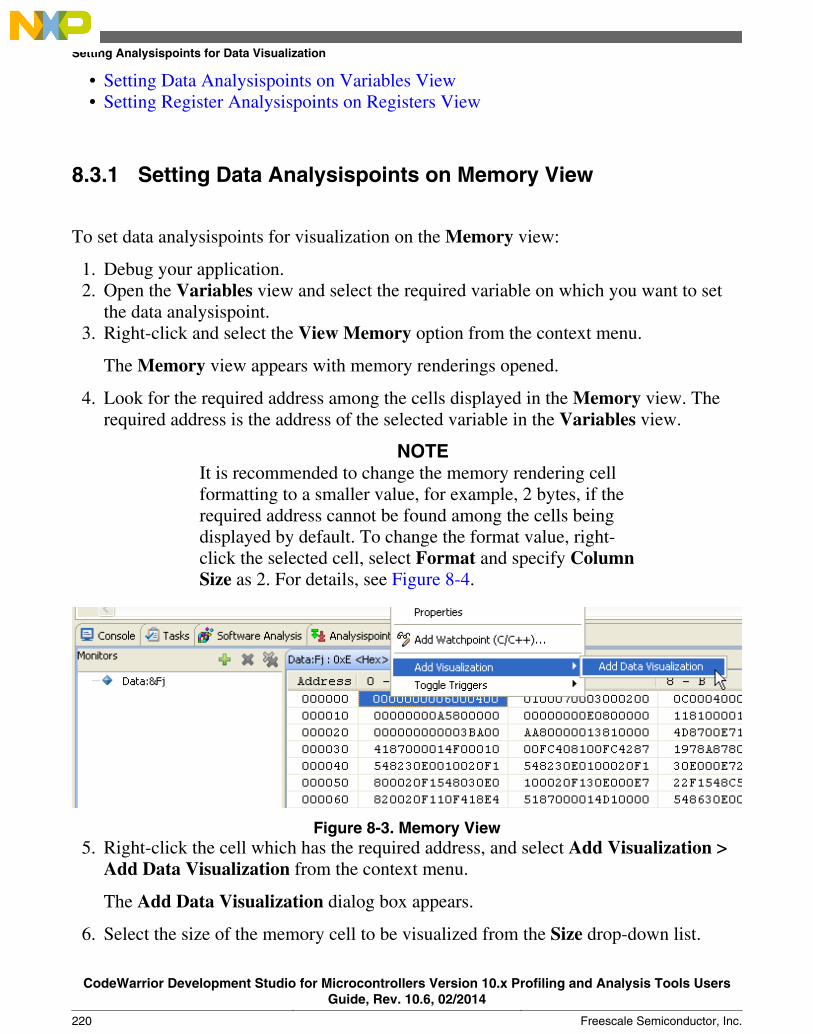
• Setting Data Analysispoints on Variables View• Setting Register Analysispoints on Registers View
8.3.1 Setting Data Analysispoints on Memory View
To set data analysispoints for visualization on the Memory view:
1. Debug your application.2. Open the Variables view and select the required variable on which you want to set
the data analysispoint.3. Right-click and select the View Memory option from the context menu.
The Memory view appears with memory renderings opened.
4. Look for the required address among the cells displayed in the Memory view. Therequired address is the address of the selected variable in the Variables view.
NOTEIt is recommended to change the memory rendering cellformatting to a smaller value, for example, 2 bytes, if therequired address cannot be found among the cells beingdisplayed by default. To change the format value, right-click the selected cell, select Format and specify ColumnSize as 2. For details, see Figure 8-4.
Figure 8-3. Memory View5. Right-click the cell which has the required address, and select Add Visualization >
Add Data Visualization from the context menu.
The Add Data Visualization dialog box appears.
6. Select the size of the memory cell to be visualized from the Size drop-down list.
Setting Analysispoints for Data Visualization
CodeWarrior Development Studio for Microcontrollers Version 10.x Profiling and Analysis Tools UsersGuide, Rev. 10.6, 02/2014
220 Freescale Semiconductor, Inc.

7. Click OK to add a memory data analysispoint to the Analysispoints view.
This sets data analysispoints for visualization on the Memory view.
8.3.2 Setting Data Analysispoints on Variables View
To set data analysispoints for visualization on the Variables view:
1. Debug your application.2. Open the Variables view.3. Select the required variable on which you want to set the data analysispoint.
NOTEBy default, the global variables are not displayed in theVariables view. To view global variables, right-click andselect Add Global Variables from the context menu. In theAdd Globals dialog box that appears, select the variablesthat you want to add and click OK.
4. Right-click and select Add Visualization > Add Data Visualization from thecontext menu.
The Add Data Visualization dialog box appears.
5. Select the size of the memory cell to be visualized from the Size drop-down list.6. Click OK to add a variable data analysispoint to the Analysispoints view.
This sets data analysispoints for visualization on the Variables view.
8.3.3 Setting Register Analysispoints on Registers View
To set register analysispoints for visualization on the Variables view:
1. Debug your application.2. Open the Registers view.3. Select the required register on which you want to set the register analysispoint.4. Right-click and select Add Visualization > Add Data Visualization from the
context menu.
The Add Data Visualization dialog box appears.
Chapter 8 Data Visualization
CodeWarrior Development Studio for Microcontrollers Version 10.x Profiling and Analysis Tools UsersGuide, Rev. 10.6, 02/2014
Freescale Semiconductor, Inc. 221

5. Select the size of the memory cell to be visualized from the Size drop-down list.6. Click OK to add a register analysispoint to the Analysispoints view.
This sets data analysispoints for visualization on the Registers view.
8.4 Collecting and Viewing DataThis section demonstrates data visualization by using an example.
To collect and view data for data visualization:
1. Create a DSC project with the source code shown below.Listing: Sample source code used for data visualization
#include <stdio.h>
#include <stdlib.h>
#define SIZE 10
#define NO_PRINT
// prototypes
void swap(int *a, int *b);
void print_array(int arr[], int length);
int i = 0;
long j = 0;
int arr[SIZE] = { 4, 6, 7, 1, 2, 3, 4, 12, 4, 5 };
int main(void) {
#ifndef NO_PRINT
printf("\n\n\n======================================\n");
Collecting and Viewing Data
CodeWarrior Development Studio for Microcontrollers Version 10.x Profiling and Analysis Tools UsersGuide, Rev. 10.6, 02/2014
222 Freescale Semiconductor, Inc.
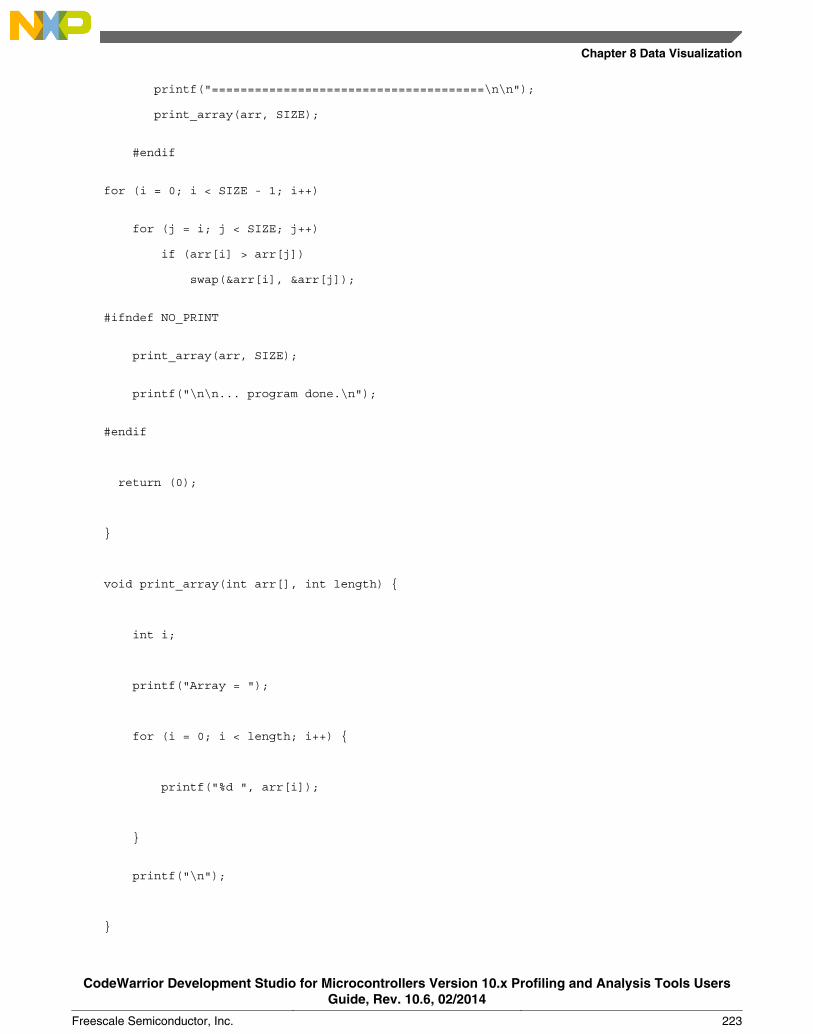
printf("======================================\n\n");
print_array(arr, SIZE);
#endif
for (i = 0; i < SIZE - 1; i++)
for (j = i; j < SIZE; j++)
if (arr[i] > arr[j])
swap(&arr[i], &arr[j]);
#ifndef NO_PRINT
print_array(arr, SIZE);
printf("\n\n... program done.\n");
#endif
return (0);
}
void print_array(int arr[], int length) {
int i;
printf("Array = ");
for (i = 0; i < length; i++) {
printf("%d ", arr[i]);
}
printf("\n");
}
Chapter 8 Data Visualization
CodeWarrior Development Studio for Microcontrollers Version 10.x Profiling and Analysis Tools UsersGuide, Rev. 10.6, 02/2014
Freescale Semiconductor, Inc. 223
void swap(int *a, int *b) {
int c = *a;
*a = *b;
*b = c;
}
2. Save and build your project.3. Debug the project.4. Set data analysispoints.
a. Open the Variables view. Right-click and select the Add Global Variablesoption from the context menu.
The Add Globals dialog box appears.
b. Select all variables Farr, Fi, Fj and click OK.c. Select Fi and select Add Visualization > Add Data Visualization.
The Add Data Visualization dialog box appears.
d. Accept the default settings and click OK.e. Select Fj, right-click and select View Memory from the context menu.
The Memory view appears with memory renderings opened.
f. Right-click the selected cell in the Memory view, and select the Format optionfrom the context menu.
The Format dialog box appears.
Collecting and Viewing Data
CodeWarrior Development Studio for Microcontrollers Version 10.x Profiling and Analysis Tools UsersGuide, Rev. 10.6, 02/2014
224 Freescale Semiconductor, Inc.
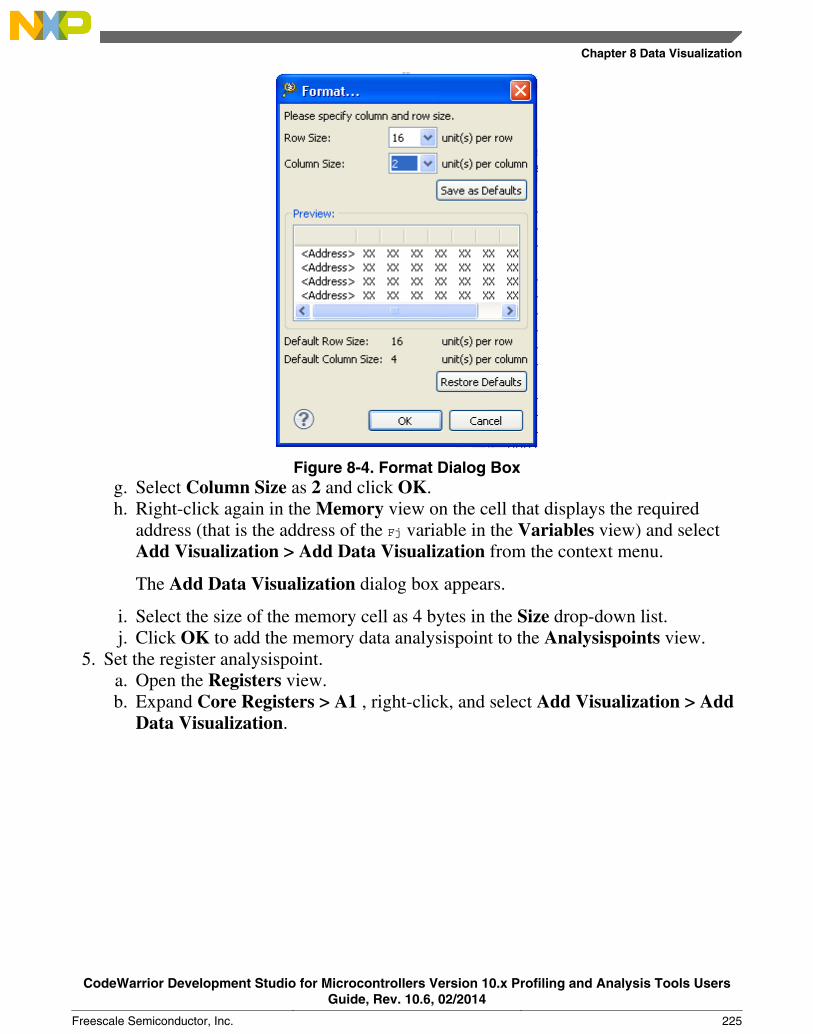
Figure 8-4. Format Dialog Boxg. Select Column Size as 2 and click OK.h. Right-click again in the Memory view on the cell that displays the required
address (that is the address of the Fj variable in the Variables view) and selectAdd Visualization > Add Data Visualization from the context menu.
The Add Data Visualization dialog box appears.
i. Select the size of the memory cell as 4 bytes in the Size drop-down list.j. Click OK to add the memory data analysispoint to the Analysispoints view.
5. Set the register analysispoint.a. Open the Registers view.b. Expand Core Registers > A1 , right-click, and select Add Visualization > Add
Data Visualization.
Chapter 8 Data Visualization
CodeWarrior Development Studio for Microcontrollers Version 10.x Profiling and Analysis Tools UsersGuide, Rev. 10.6, 02/2014
Freescale Semiconductor, Inc. 225
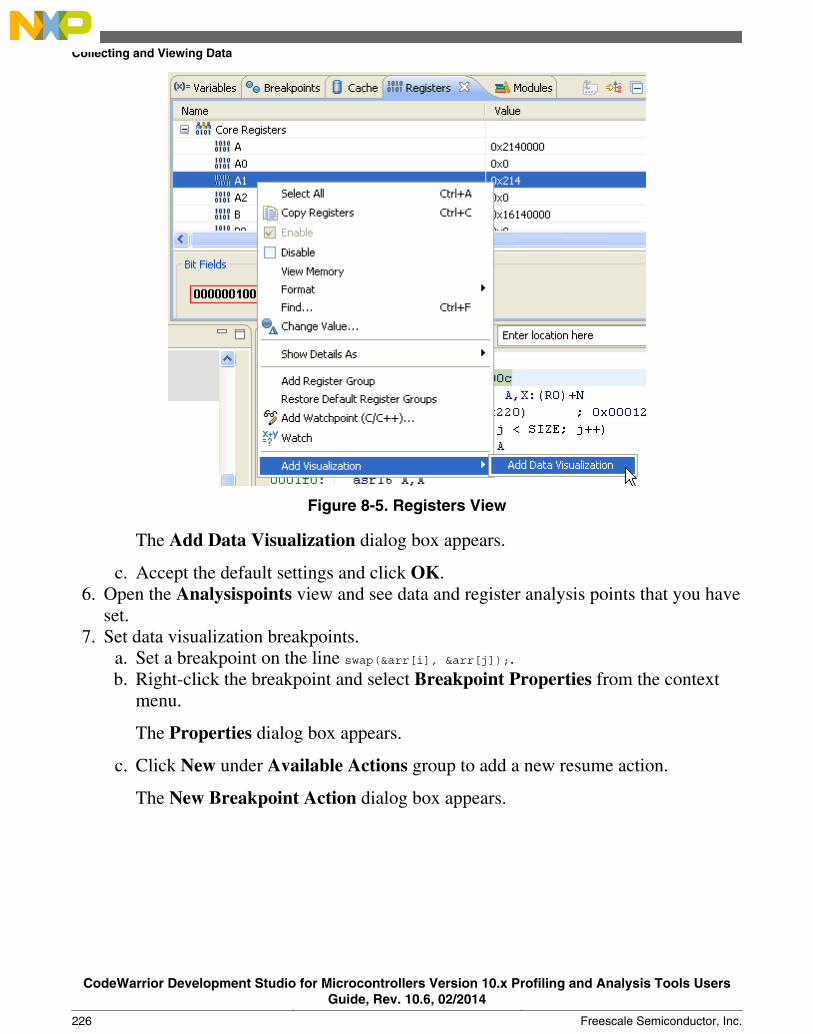
Figure 8-5. Registers View
The Add Data Visualization dialog box appears.
c. Accept the default settings and click OK.6. Open the Analysispoints view and see data and register analysis points that you have
set.7. Set data visualization breakpoints.
a. Set a breakpoint on the line swap(&arr[i], &arr[j]);.b. Right-click the breakpoint and select Breakpoint Properties from the context
menu.
The Properties dialog box appears.
c. Click New under Available Actions group to add a new resume action.
The New Breakpoint Action dialog box appears.
Collecting and Viewing Data
CodeWarrior Development Studio for Microcontrollers Version 10.x Profiling and Analysis Tools UsersGuide, Rev. 10.6, 02/2014
226 Freescale Semiconductor, Inc.
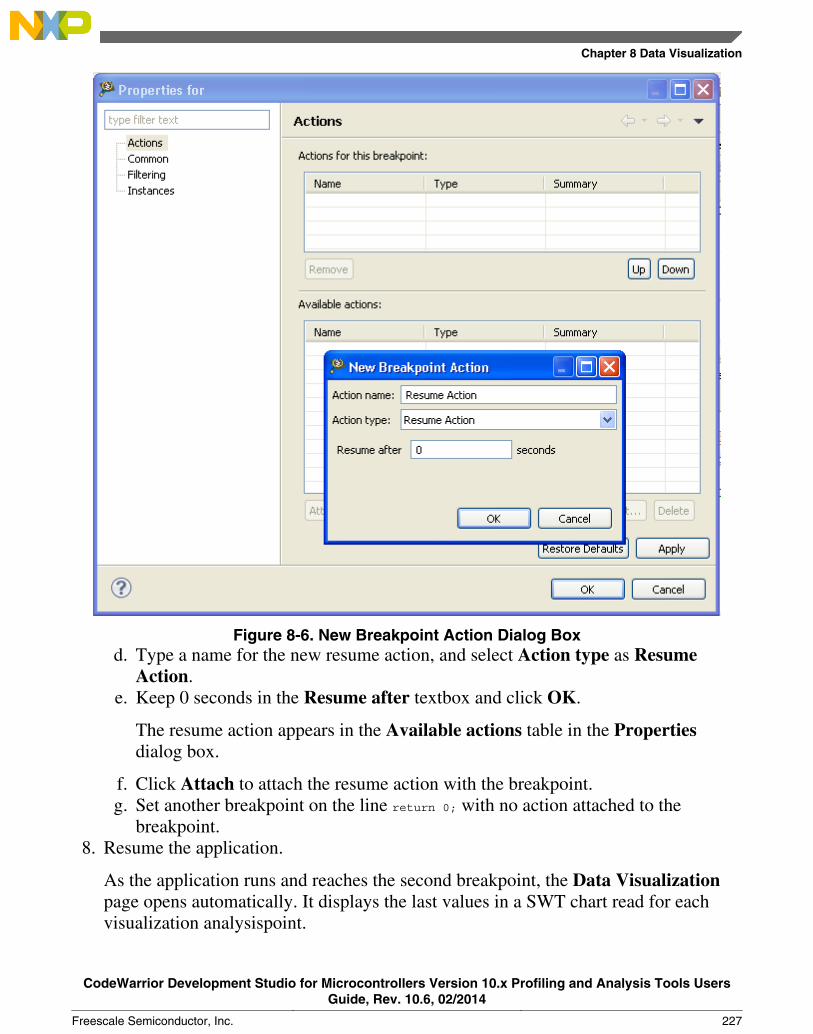
Figure 8-6. New Breakpoint Action Dialog Boxd. Type a name for the new resume action, and select Action type as Resume
Action.e. Keep 0 seconds in the Resume after textbox and click OK.
The resume action appears in the Available actions table in the Propertiesdialog box.
f. Click Attach to attach the resume action with the breakpoint.g. Set another breakpoint on the line return 0; with no action attached to the
breakpoint.8. Resume the application.
As the application runs and reaches the second breakpoint, the Data Visualizationpage opens automatically. It displays the last values in a SWT chart read for eachvisualization analysispoint.
Chapter 8 Data Visualization
CodeWarrior Development Studio for Microcontrollers Version 10.x Profiling and Analysis Tools UsersGuide, Rev. 10.6, 02/2014
Freescale Semiconductor, Inc. 227

9. Terminate the application.
The Software Analysis view opens and populates with a new result set. Only Trace ,Data Visualization and Log are visible. The Data Visualization chart populateswith the full set of collected values.
NOTEThe sampled data can also be seen as a data trace, withData Read events for memory data and Profile Countersevents for variable and register values.
10. Open the Trace Data viewer.
The Trace Data viewer contains the same data.
11. Select another metric for the x-axis, for example, Fj and view results related to it.
NOTEThe metric versus time is displayed as lines with symbols,while metric versus metric is displayed as symbols only.
For more information, refer Data Trace Import Dialog Box.
Collecting and Viewing Data
CodeWarrior Development Studio for Microcontrollers Version 10.x Profiling and Analysis Tools UsersGuide, Rev. 10.6, 02/2014
228 Freescale Semiconductor, Inc.
Chapter 9Launching Scripts
The Profiling and Analysis tools help you launch scripts written in Python language.These scripts allow you to collect and export trace data automatically using remotelaunch. This feature is integrated with CodeWarrior IDE scripting. The scripts arelaunched in remote launch using the Jython console. The remote launch feature ofCodeWarrior allows launch configurations to be executed remotely.
NOTEThe Profiling and Analysis tools specific scripting APIs areavailable in the SA_Scripting.doc document, which is located at<CW Installation Directory>\MCU\morpho_sa\sasdk\support.
You can export the data in a CSV file or set the tracepoints in the source code bylaunching a Python script. You can write the script to contain all details required toconfigure tracing and profiling. For example, enabling trace and profile, settingbreakpoints, launching the application, resuming, suspending, and terminating. You canalso set the trace mode, for example, automatic or continuous for trace collection in thescript itself. You can also modify the sample Python scripts according to your needs toextend the functionality to other platforms by changing the configuration attributes. Afterwriting these scripts, you run them in the Jython console and collect trace.
This chapter consists of the following topics:
• Run Sample Python Script• Collect Trace Using Jython• Export Trace to CSV File• Modify Sample Python Script
9.1 Run Sample Python Script
CodeWarrior Development Studio for Microcontrollers Version 10.x Profiling and Analysis Tools UsersGuide, Rev. 10.6, 02/2014
Freescale Semiconductor, Inc. 229
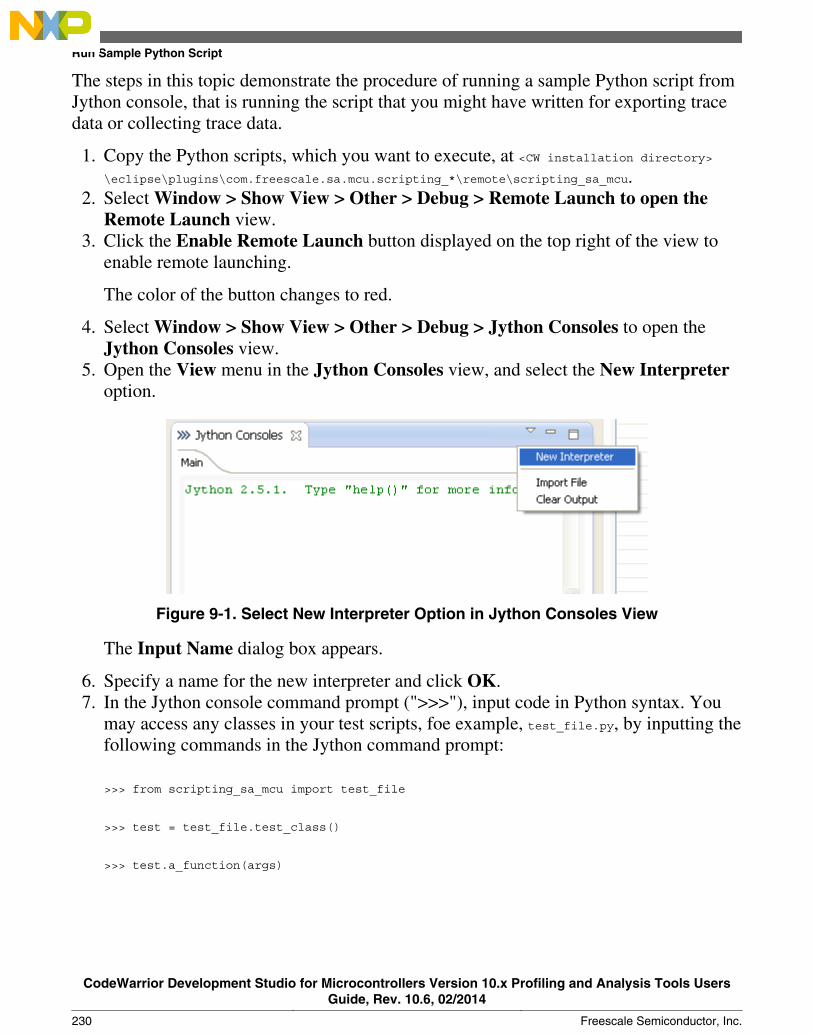
The steps in this topic demonstrate the procedure of running a sample Python script fromJython console, that is running the script that you might have written for exporting tracedata or collecting trace data.
1. Copy the Python scripts, which you want to execute, at <CW installation directory>\eclipse\plugins\com.freescale.sa.mcu.scripting_*\remote\scripting_sa_mcu.
2. Select Window > Show View > Other > Debug > Remote Launch to open theRemote Launch view.
3. Click the Enable Remote Launch button displayed on the top right of the view toenable remote launching.
The color of the button changes to red.
4. Select Window > Show View > Other > Debug > Jython Consoles to open theJython Consoles view.
5. Open the View menu in the Jython Consoles view, and select the New Interpreteroption.
Figure 9-1. Select New Interpreter Option in Jython Consoles View
The Input Name dialog box appears.
6. Specify a name for the new interpreter and click OK.7. In the Jython console command prompt (">>>"), input code in Python syntax. You
may access any classes in your test scripts, foe example, test_file.py, by inputting thefollowing commands in the Jython command prompt:
>>> from scripting_sa_mcu import test_file
>>> test = test_file.test_class()
>>> test.a_function(args)
Run Sample Python Script
CodeWarrior Development Studio for Microcontrollers Version 10.x Profiling and Analysis Tools UsersGuide, Rev. 10.6, 02/2014
230 Freescale Semiconductor, Inc.

NOTEThe advantage of using Jython is that besides Pythonmodules, it can also access Java modules in the similarmanner.
This is how you run a sample Python script from Jython console.
9.2 Collect Trace Using Jython
To collect trace using remote launch through Jython console, perform the following steps.These steps demonstrate the procedure of launching configuration and collecting bothcontinuous and automatic trace on the HCS08 MC9SO8QE128 target using the samplescripts, TestCollectContinuousHcs08.py and TestCollectAutomaticHcs08.py.
These scripts are available at <CW Installation Directory>\eclipse\plugins\com.freescale.sa.mcu.scripting_*\remote\scripting_sa_mcu.
1. Create a new HCS08 project with the name hcs08.2. Replace the source code of main.c with the code shown below.
Listing: HCS08 Source Code
#include <hidef.h> /* for EnableInterrupts macro */
#include "derivative.h" /* include peripheral declarations */
volatile i = 0;
void f() {
if (i < 100) {
i++;
return;
}
i = 0;
}
void main(void) {
Chapter 9 Launching Scripts
CodeWarrior Development Studio for Microcontrollers Version 10.x Profiling and Analysis Tools UsersGuide, Rev. 10.6, 02/2014
Freescale Semiconductor, Inc. 231
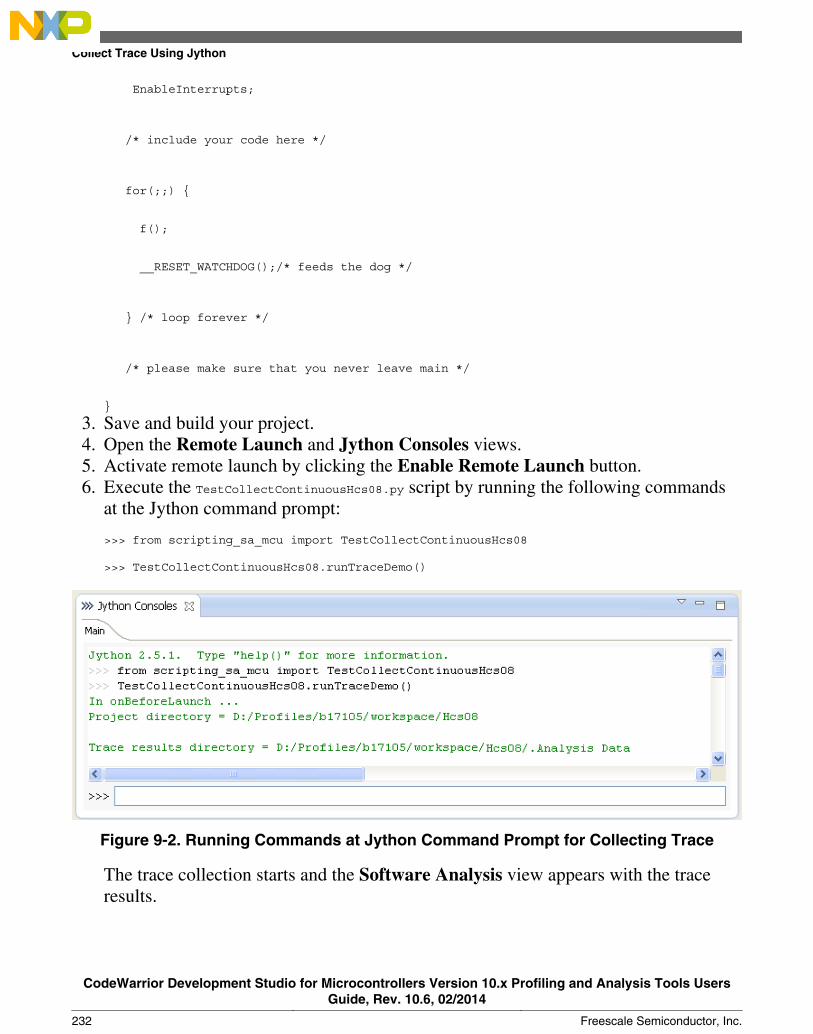
EnableInterrupts;
/* include your code here */
for(;;) {
f();
__RESET_WATCHDOG();/* feeds the dog */
} /* loop forever */
/* please make sure that you never leave main */
}
3. Save and build your project.4. Open the Remote Launch and Jython Consoles views.5. Activate remote launch by clicking the Enable Remote Launch button.6. Execute the TestCollectContinuousHcs08.py script by running the following commands
at the Jython command prompt:
>>> from scripting_sa_mcu import TestCollectContinuousHcs08
>>> TestCollectContinuousHcs08.runTraceDemo()
Figure 9-2. Running Commands at Jython Command Prompt for Collecting Trace
The trace collection starts and the Software Analysis view appears with the traceresults.
Collect Trace Using Jython
CodeWarrior Development Studio for Microcontrollers Version 10.x Profiling and Analysis Tools UsersGuide, Rev. 10.6, 02/2014
232 Freescale Semiconductor, Inc.
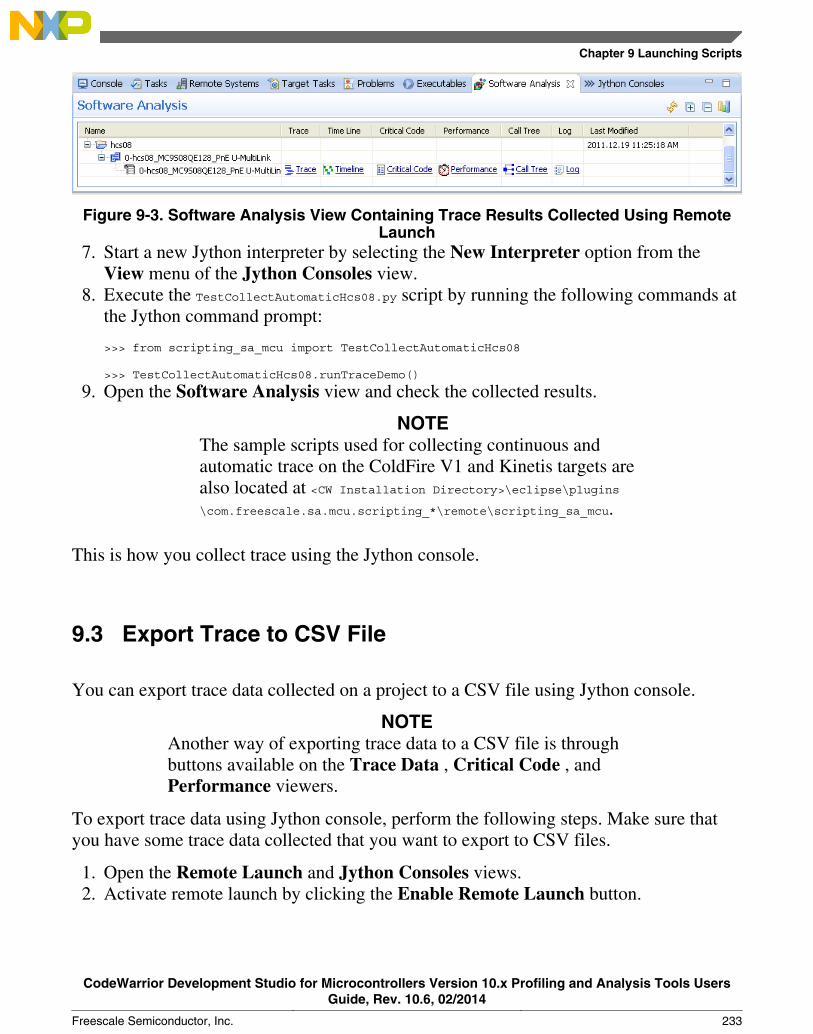
Figure 9-3. Software Analysis View Containing Trace Results Collected Using RemoteLaunch
7. Start a new Jython interpreter by selecting the New Interpreter option from theView menu of the Jython Consoles view.
8. Execute the TestCollectAutomaticHcs08.py script by running the following commands atthe Jython command prompt:
>>> from scripting_sa_mcu import TestCollectAutomaticHcs08
>>> TestCollectAutomaticHcs08.runTraceDemo()
9. Open the Software Analysis view and check the collected results.
NOTEThe sample scripts used for collecting continuous andautomatic trace on the ColdFire V1 and Kinetis targets arealso located at <CW Installation Directory>\eclipse\plugins\com.freescale.sa.mcu.scripting_*\remote\scripting_sa_mcu.
This is how you collect trace using the Jython console.
9.3 Export Trace to CSV File
You can export trace data collected on a project to a CSV file using Jython console.
NOTEAnother way of exporting trace data to a CSV file is throughbuttons available on the Trace Data , Critical Code , andPerformance viewers.
To export trace data using Jython console, perform the following steps. Make sure thatyou have some trace data collected that you want to export to CSV files.
1. Open the Remote Launch and Jython Consoles views.2. Activate remote launch by clicking the Enable Remote Launch button.
Chapter 9 Launching Scripts
CodeWarrior Development Studio for Microcontrollers Version 10.x Profiling and Analysis Tools UsersGuide, Rev. 10.6, 02/2014
Freescale Semiconductor, Inc. 233
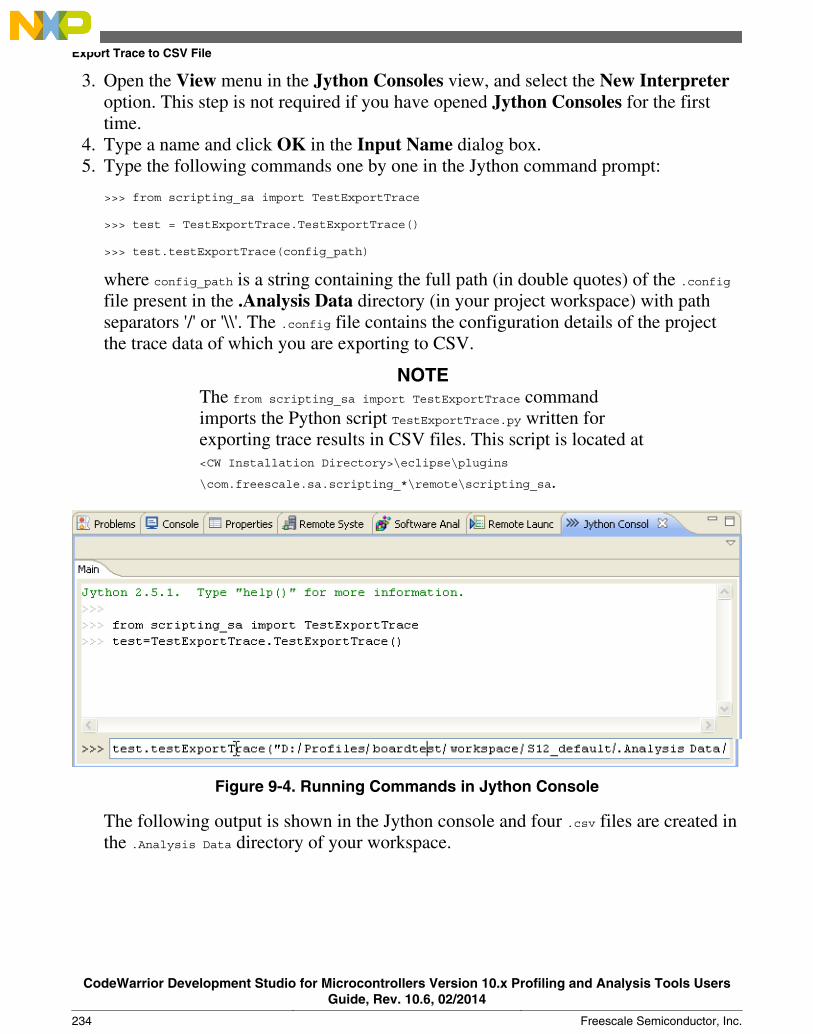
3. Open the View menu in the Jython Consoles view, and select the New Interpreteroption. This step is not required if you have opened Jython Consoles for the firsttime.
4. Type a name and click OK in the Input Name dialog box.5. Type the following commands one by one in the Jython command prompt:
>>> from scripting_sa import TestExportTrace
>>> test = TestExportTrace.TestExportTrace()
>>> test.testExportTrace(config_path)
where config_path is a string containing the full path (in double quotes) of the .configfile present in the .Analysis Data directory (in your project workspace) with pathseparators '/' or '\\'. The .config file contains the configuration details of the projectthe trace data of which you are exporting to CSV.
NOTEThe from scripting_sa import TestExportTrace commandimports the Python script TestExportTrace.py written forexporting trace results in CSV files. This script is located at<CW Installation Directory>\eclipse\plugins
\com.freescale.sa.scripting_*\remote\scripting_sa.
Figure 9-4. Running Commands in Jython Console
The following output is shown in the Jython console and four .csv files are created inthe .Analysis Data directory of your workspace.
Export Trace to CSV File
CodeWarrior Development Studio for Microcontrollers Version 10.x Profiling and Analysis Tools UsersGuide, Rev. 10.6, 02/2014
234 Freescale Semiconductor, Inc.
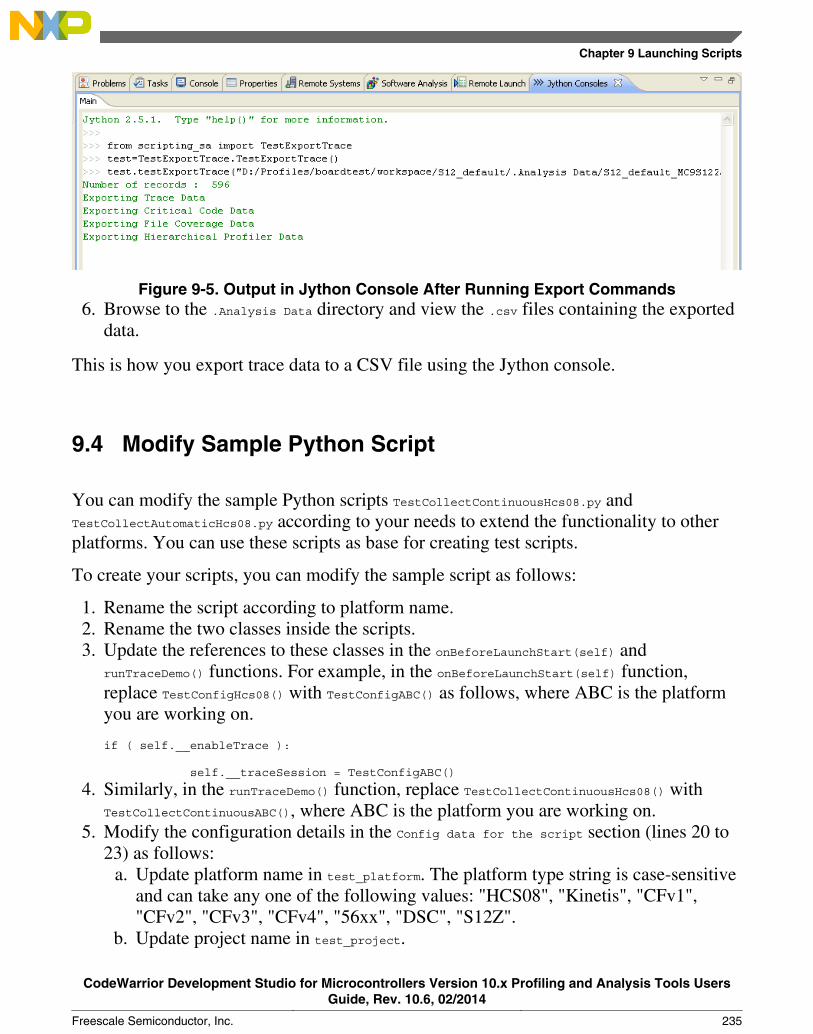
Figure 9-5. Output in Jython Console After Running Export Commands6. Browse to the .Analysis Data directory and view the .csv files containing the exported
data.
This is how you export trace data to a CSV file using the Jython console.
9.4 Modify Sample Python Script
You can modify the sample Python scripts TestCollectContinuousHcs08.py andTestCollectAutomaticHcs08.py according to your needs to extend the functionality to otherplatforms. You can use these scripts as base for creating test scripts.
To create your scripts, you can modify the sample script as follows:
1. Rename the script according to platform name.2. Rename the two classes inside the scripts.3. Update the references to these classes in the onBeforeLaunchStart(self) and
runTraceDemo() functions. For example, in the onBeforeLaunchStart(self) function,replace TestConfigHcs08() with TestConfigABC() as follows, where ABC is the platformyou are working on.
if ( self.__enableTrace ):
self.__traceSession = TestConfigABC()
4. Similarly, in the runTraceDemo() function, replace TestCollectContinuousHcs08() withTestCollectContinuousABC(), where ABC is the platform you are working on.
5. Modify the configuration details in the Config data for the script section (lines 20 to23) as follows:
a. Update platform name in test_platform. The platform type string is case-sensitiveand can take any one of the following values: "HCS08", "Kinetis", "CFv1","CFv2", "CFv3", "CFv4", "56xx", "DSC", "S12Z".
b. Update project name in test_project.
Chapter 9 Launching Scripts
CodeWarrior Development Studio for Microcontrollers Version 10.x Profiling and Analysis Tools UsersGuide, Rev. 10.6, 02/2014
Freescale Semiconductor, Inc. 235

c. Update launch configuration name in test_launchconfig.d. Update the breakpoint line in test_bp_line, that is the line where you want to set a
breakpoint. For example, for the Kinetis stationery project, you may use line 21for the breakpoint.
6. Update other configuration details after line 57 according to your needs.
NOTEBesides checking that trace is collected and a new result setnamed 0-{launch_config_name} is created in the SoftwareAnalysis view, you may edit the file 0-{launch_config_name}.traceConfig available in the project root.You can see that the attributes corresponding to theself.__analysisConfig.setXXX functions called in the samplescripts are changed in the .traceConfig file. For example, ifself.__analysisConfig.setContinuousTrace(True) is called fromthe scripts (see line 59 in the sample scripts) then inthe .traceConfig file, you should notice that the"Continuous" attribute is changed to true. The remotelaunch creates a copy of the launch configuration createdby the New Project Wizard and deletes it after the debugsession terminates successfully, so checking the trace andprofile tab controls for changes is not possible.
This is how you can modify a sample Python script.
Modify Sample Python Script
CodeWarrior Development Studio for Microcontrollers Version 10.x Profiling and Analysis Tools UsersGuide, Rev. 10.6, 02/2014
236 Freescale Semiconductor, Inc.

Chapter 10Simple Instrumentation Profiling on ColdFire V2 -V4e TargetsThe ColdFire V2 - V4 targets collect the profiling information by using the profilingsystem. These targets do not have the hardware capability to collect trace. The profilingsystem consists of three main components:
• The statically-linked code library of compiled code containing the profiler. Thislibrary is created and distributed within the CodeWarrior product.
• An Application Programming Interface (API) to control the profiler• The Simple Profiler Viewer to view and analyze the profile results
The profiling system collects information using a profiler, which analyzes the amount oftime a program spends performing various tasks and detects bottlenecks between thefunctions/routines. This type of information-tracking can be useful for determining thecost of calling a routine. The cost of a routine call is not only the time spent in theroutine, it is also the time spent in its children, that is the subsidiary routines it calls, theroutines they call, and so on.
To use the profiler for profiling an application, perform the following actions:
• Include the profiler library and files in the CodeWarrior project• Configure your project to turn on profiling• Modify the application source code to make use of the profiler API• Debug the application and collect profiling information• Open the Simple Profiler Viewer to view the results
This process of profiling gets you all the data you need to perform a professional-levelanalysis of the runtime behavior of your application.
NOTEThis chapter explains profiling on ColdFire V4e target, theprocess of profiling is same for ColdFire V2 - V4 targets.
This chapter contains the following topics:• Include Profiler Library and Files
CodeWarrior Development Studio for Microcontrollers Version 10.x Profiling and Analysis Tools UsersGuide, Rev. 10.6, 02/2014
Freescale Semiconductor, Inc. 237
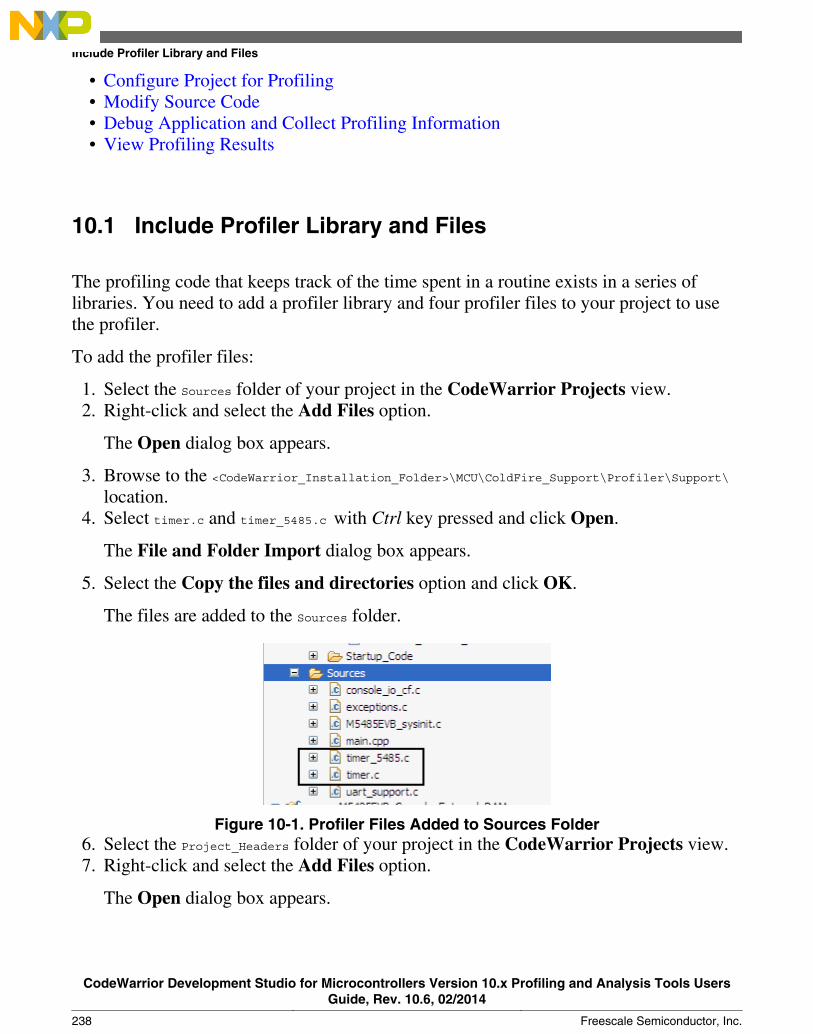
• Configure Project for Profiling• Modify Source Code• Debug Application and Collect Profiling Information• View Profiling Results
10.1 Include Profiler Library and Files
The profiling code that keeps track of the time spent in a routine exists in a series oflibraries. You need to add a profiler library and four profiler files to your project to usethe profiler.
To add the profiler files:
1. Select the Sources folder of your project in the CodeWarrior Projects view.2. Right-click and select the Add Files option.
The Open dialog box appears.
3. Browse to the <CodeWarrior_Installation_Folder>\MCU\ColdFire_Support\Profiler\Support\location.
4. Select timer.c and timer_5485.c with Ctrl key pressed and click Open.
The File and Folder Import dialog box appears.
5. Select the Copy the files and directories option and click OK.
The files are added to the Sources folder.
Figure 10-1. Profiler Files Added to Sources Folder6. Select the Project_Headers folder of your project in the CodeWarrior Projects view.7. Right-click and select the Add Files option.
The Open dialog box appears.
Include Profiler Library and Files
CodeWarrior Development Studio for Microcontrollers Version 10.x Profiling and Analysis Tools UsersGuide, Rev. 10.6, 02/2014
238 Freescale Semiconductor, Inc.
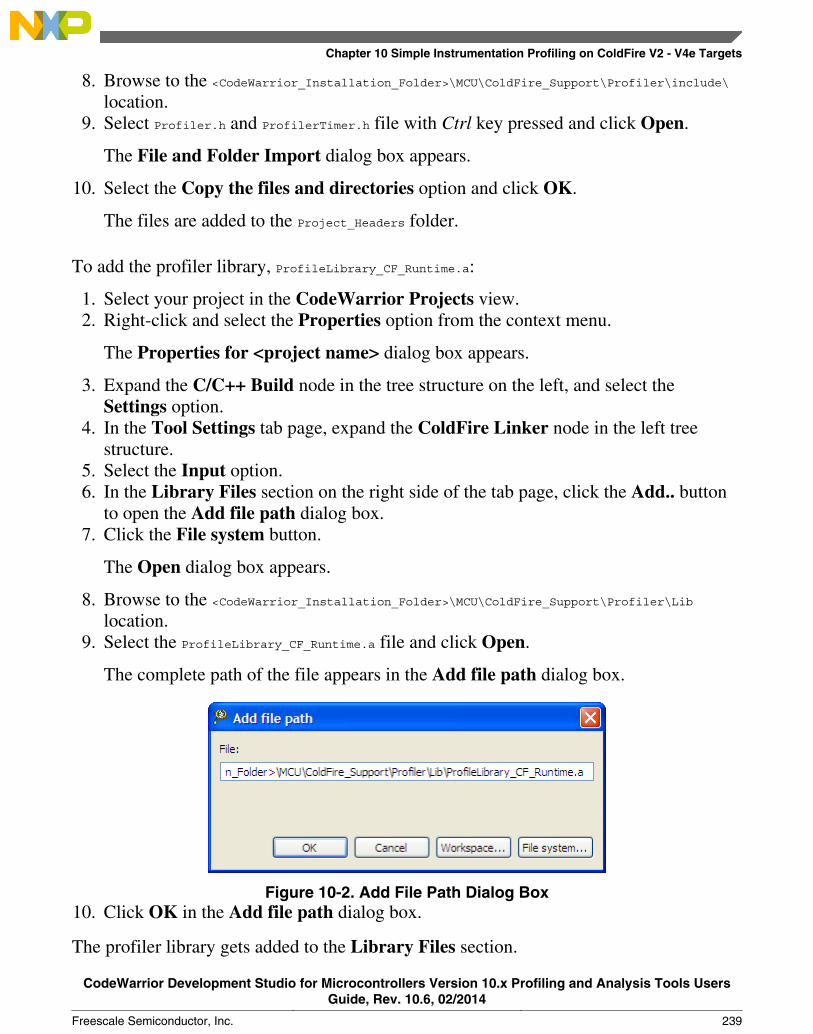
8. Browse to the <CodeWarrior_Installation_Folder>\MCU\ColdFire_Support\Profiler\include\location.
9. Select Profiler.h and ProfilerTimer.h file with Ctrl key pressed and click Open.
The File and Folder Import dialog box appears.
10. Select the Copy the files and directories option and click OK.
The files are added to the Project_Headers folder.
To add the profiler library, ProfileLibrary_CF_Runtime.a:
1. Select your project in the CodeWarrior Projects view.2. Right-click and select the Properties option from the context menu.
The Properties for <project name> dialog box appears.
3. Expand the C/C++ Build node in the tree structure on the left, and select theSettings option.
4. In the Tool Settings tab page, expand the ColdFire Linker node in the left treestructure.
5. Select the Input option.6. In the Library Files section on the right side of the tab page, click the Add.. button
to open the Add file path dialog box.7. Click the File system button.
The Open dialog box appears.
8. Browse to the <CodeWarrior_Installation_Folder>\MCU\ColdFire_Support\Profiler\Liblocation.
9. Select the ProfileLibrary_CF_Runtime.a file and click Open.
The complete path of the file appears in the Add file path dialog box.
Figure 10-2. Add File Path Dialog Box10. Click OK in the Add file path dialog box.
The profiler library gets added to the Library Files section.
Chapter 10 Simple Instrumentation Profiling on ColdFire V2 - V4e Targets
CodeWarrior Development Studio for Microcontrollers Version 10.x Profiling and Analysis Tools UsersGuide, Rev. 10.6, 02/2014
Freescale Semiconductor, Inc. 239
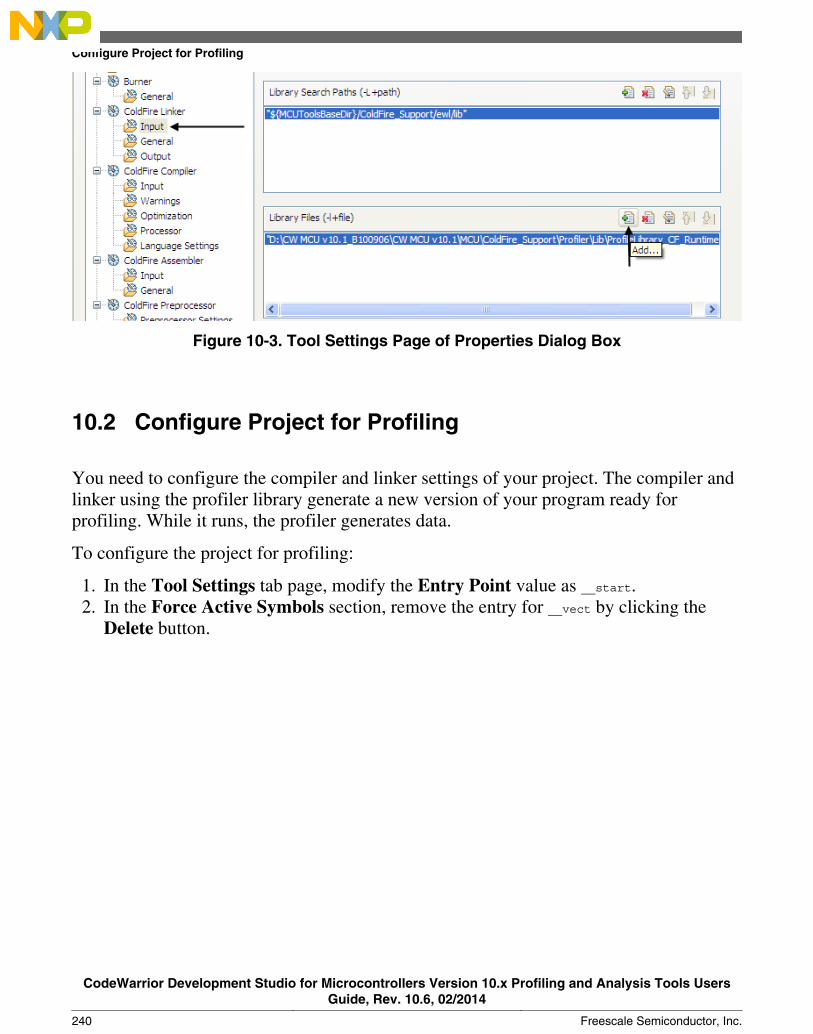
Figure 10-3. Tool Settings Page of Properties Dialog Box
10.2 Configure Project for Profiling
You need to configure the compiler and linker settings of your project. The compiler andlinker using the profiler library generate a new version of your program ready forprofiling. While it runs, the profiler generates data.
To configure the project for profiling:
1. In the Tool Settings tab page, modify the Entry Point value as __start.2. In the Force Active Symbols section, remove the entry for __vect by clicking the
Delete button.
Configure Project for Profiling
CodeWarrior Development Studio for Microcontrollers Version 10.x Profiling and Analysis Tools UsersGuide, Rev. 10.6, 02/2014
240 Freescale Semiconductor, Inc.
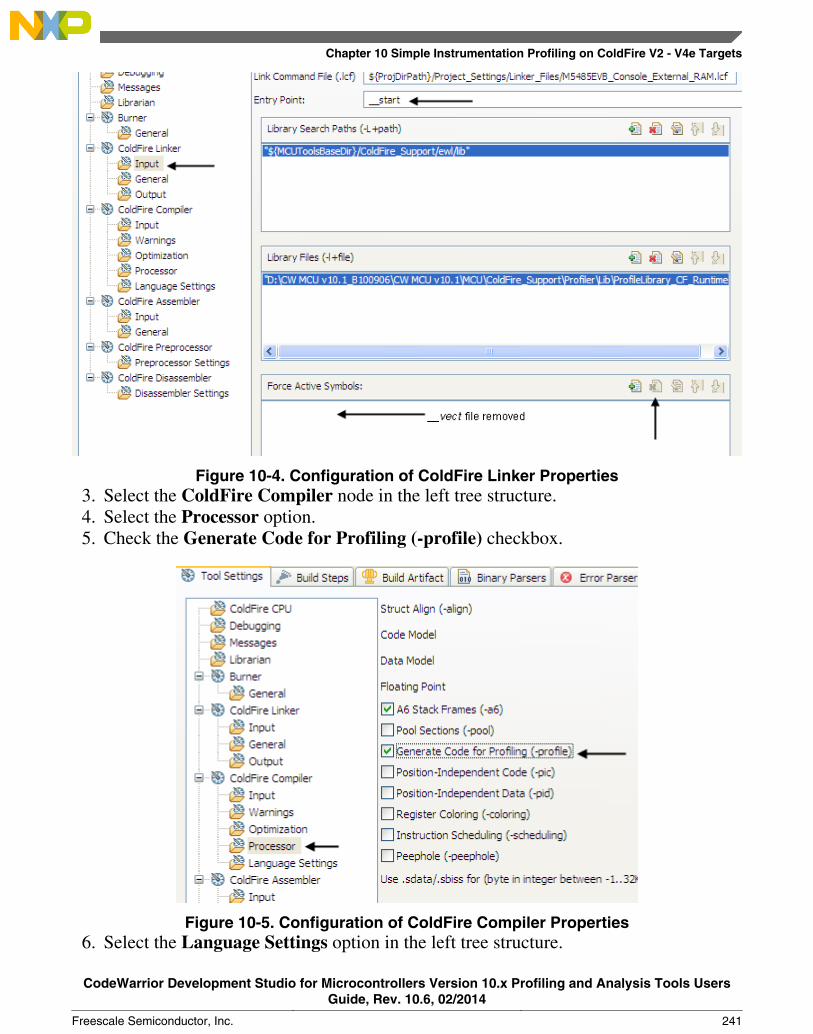
Figure 10-4. Configuration of ColdFire Linker Properties3. Select the ColdFire Compiler node in the left tree structure.4. Select the Processor option.5. Check the Generate Code for Profiling (-profile) checkbox.
Figure 10-5. Configuration of ColdFire Compiler Properties6. Select the Language Settings option in the left tree structure.
Chapter 10 Simple Instrumentation Profiling on ColdFire V2 - V4e Targets
CodeWarrior Development Studio for Microcontrollers Version 10.x Profiling and Analysis Tools UsersGuide, Rev. 10.6, 02/2014
Freescale Semiconductor, Inc. 241
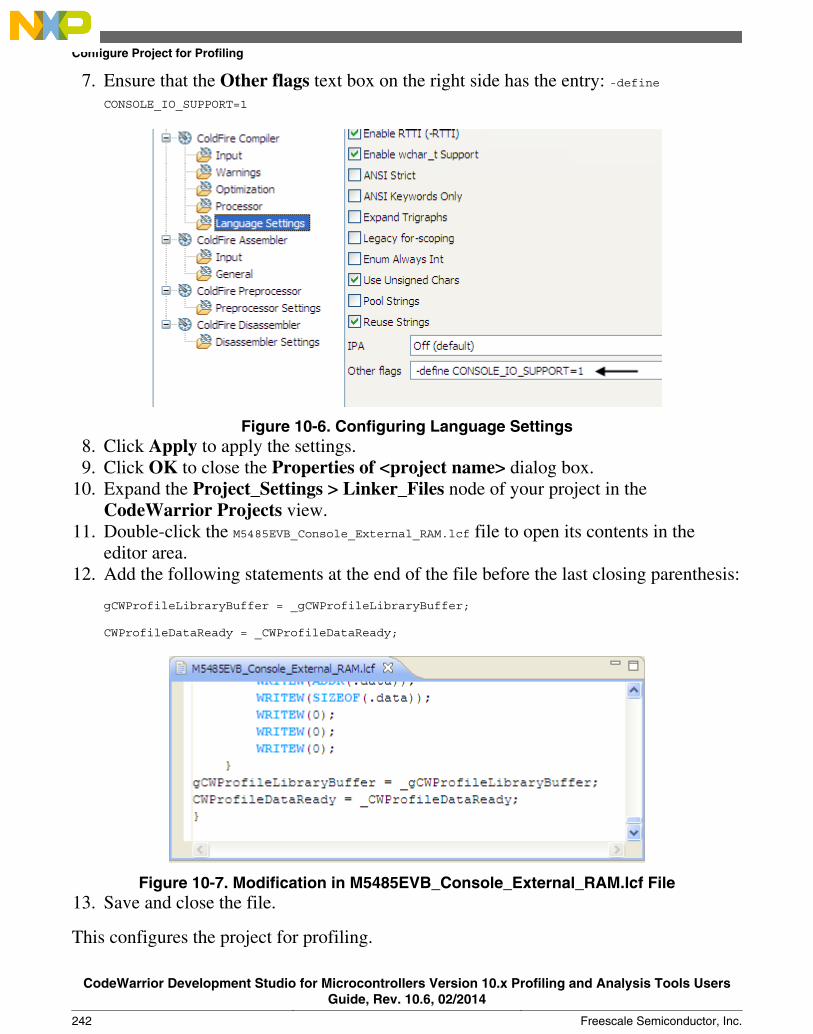
7. Ensure that the Other flags text box on the right side has the entry: -defineCONSOLE_IO_SUPPORT=1
Figure 10-6. Configuring Language Settings8. Click Apply to apply the settings.9. Click OK to close the Properties of <project name> dialog box.
10. Expand the Project_Settings > Linker_Files node of your project in theCodeWarrior Projects view.
11. Double-click the M5485EVB_Console_External_RAM.lcf file to open its contents in theeditor area.
12. Add the following statements at the end of the file before the last closing parenthesis:
gCWProfileLibraryBuffer = _gCWProfileLibraryBuffer;
CWProfileDataReady = _CWProfileDataReady;
Figure 10-7. Modification in M5485EVB_Console_External_RAM.lcf File13. Save and close the file.
This configures the project for profiling.
Configure Project for Profiling
CodeWarrior Development Studio for Microcontrollers Version 10.x Profiling and Analysis Tools UsersGuide, Rev. 10.6, 02/2014
242 Freescale Semiconductor, Inc.
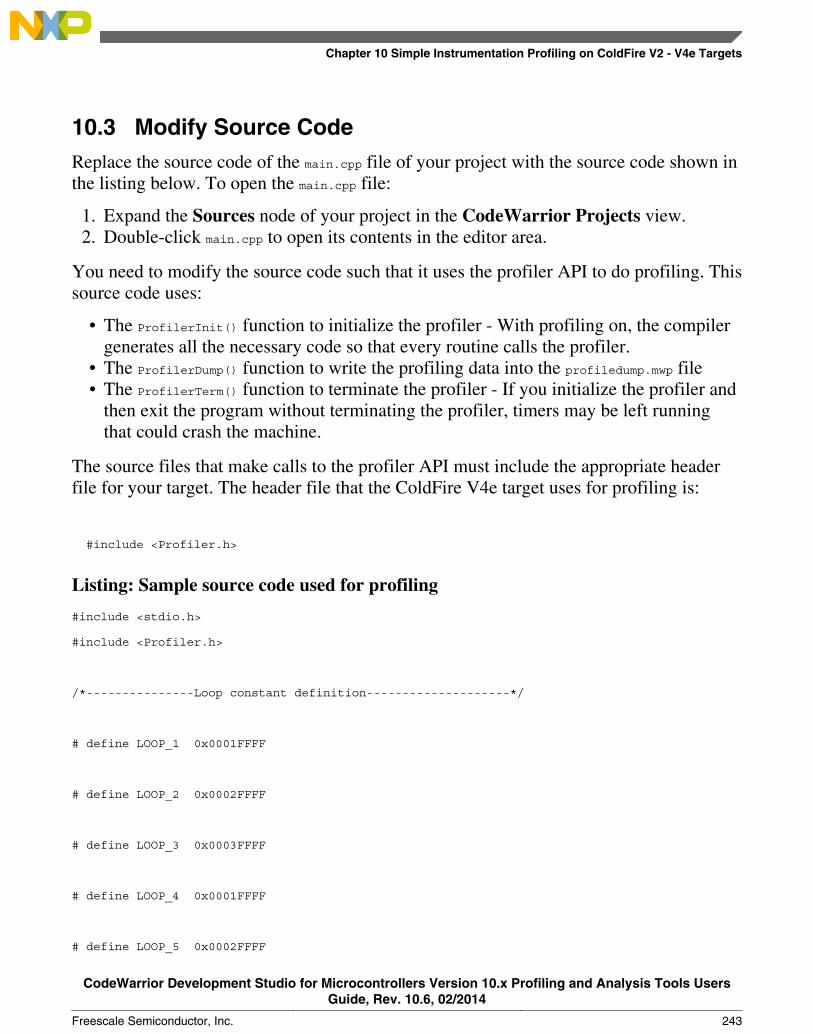
10.3 Modify Source CodeReplace the source code of the main.cpp file of your project with the source code shown inthe listing below. To open the main.cpp file:
1. Expand the Sources node of your project in the CodeWarrior Projects view.2. Double-click main.cpp to open its contents in the editor area.
You need to modify the source code such that it uses the profiler API to do profiling. Thissource code uses:
• The ProfilerInit() function to initialize the profiler - With profiling on, the compilergenerates all the necessary code so that every routine calls the profiler.
• The ProfilerDump() function to write the profiling data into the profiledump.mwp file• The ProfilerTerm() function to terminate the profiler - If you initialize the profiler and
then exit the program without terminating the profiler, timers may be left runningthat could crash the machine.
The source files that make calls to the profiler API must include the appropriate headerfile for your target. The header file that the ColdFire V4e target uses for profiling is:
#include <Profiler.h>
Listing: Sample source code used for profiling
#include <stdio.h>
#include <Profiler.h>
/*---------------Loop constant definition--------------------*/
# define LOOP_1 0x0001FFFF
# define LOOP_2 0x0002FFFF
# define LOOP_3 0x0003FFFF
# define LOOP_4 0x0001FFFF
# define LOOP_5 0x0002FFFF
Chapter 10 Simple Instrumentation Profiling on ColdFire V2 - V4e Targets
CodeWarrior Development Studio for Microcontrollers Version 10.x Profiling and Analysis Tools UsersGuide, Rev. 10.6, 02/2014
Freescale Semiconductor, Inc. 243
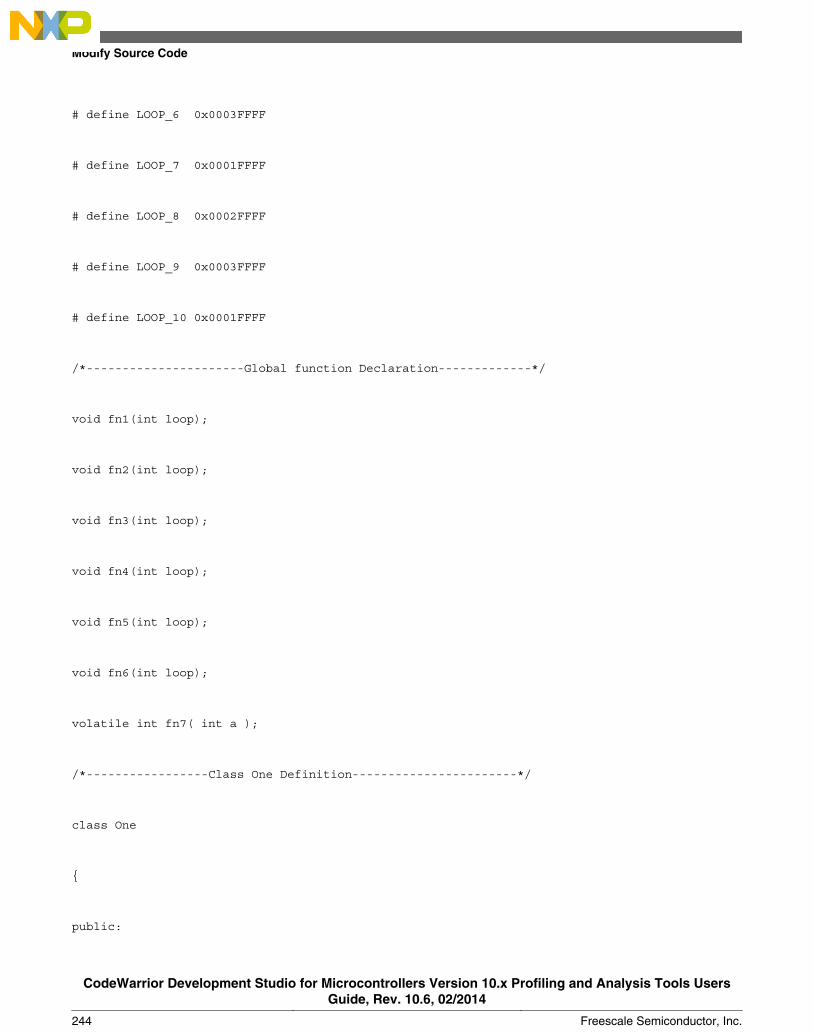
# define LOOP_6 0x0003FFFF
# define LOOP_7 0x0001FFFF
# define LOOP_8 0x0002FFFF
# define LOOP_9 0x0003FFFF
# define LOOP_10 0x0001FFFF
/*----------------------Global function Declaration-------------*/
void fn1(int loop);
void fn2(int loop);
void fn3(int loop);
void fn4(int loop);
void fn5(int loop);
void fn6(int loop);
volatile int fn7( int a );
/*-----------------Class One Definition-----------------------*/
class One
{
public:
Modify Source Code
CodeWarrior Development Studio for Microcontrollers Version 10.x Profiling and Analysis Tools UsersGuide, Rev. 10.6, 02/2014
244 Freescale Semiconductor, Inc.
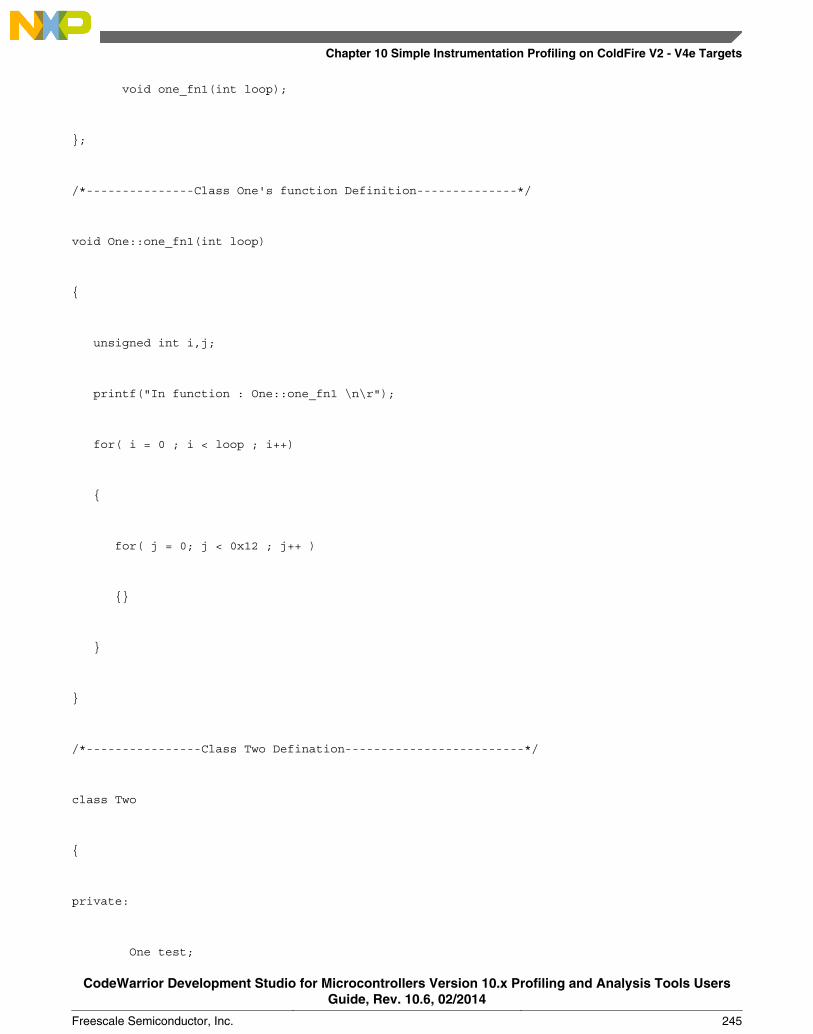
void one_fn1(int loop);
};
/*---------------Class One's function Definition--------------*/
void One::one_fn1(int loop)
{
unsigned int i,j;
printf("In function : One::one_fn1 \n\r");
for( i = 0 ; i < loop ; i++)
{
for( j = 0; j < 0x12 ; j++ )
{}
}
}
/*----------------Class Two Defination-------------------------*/
class Two
{
private:
One test;
Chapter 10 Simple Instrumentation Profiling on ColdFire V2 - V4e Targets
CodeWarrior Development Studio for Microcontrollers Version 10.x Profiling and Analysis Tools UsersGuide, Rev. 10.6, 02/2014
Freescale Semiconductor, Inc. 245
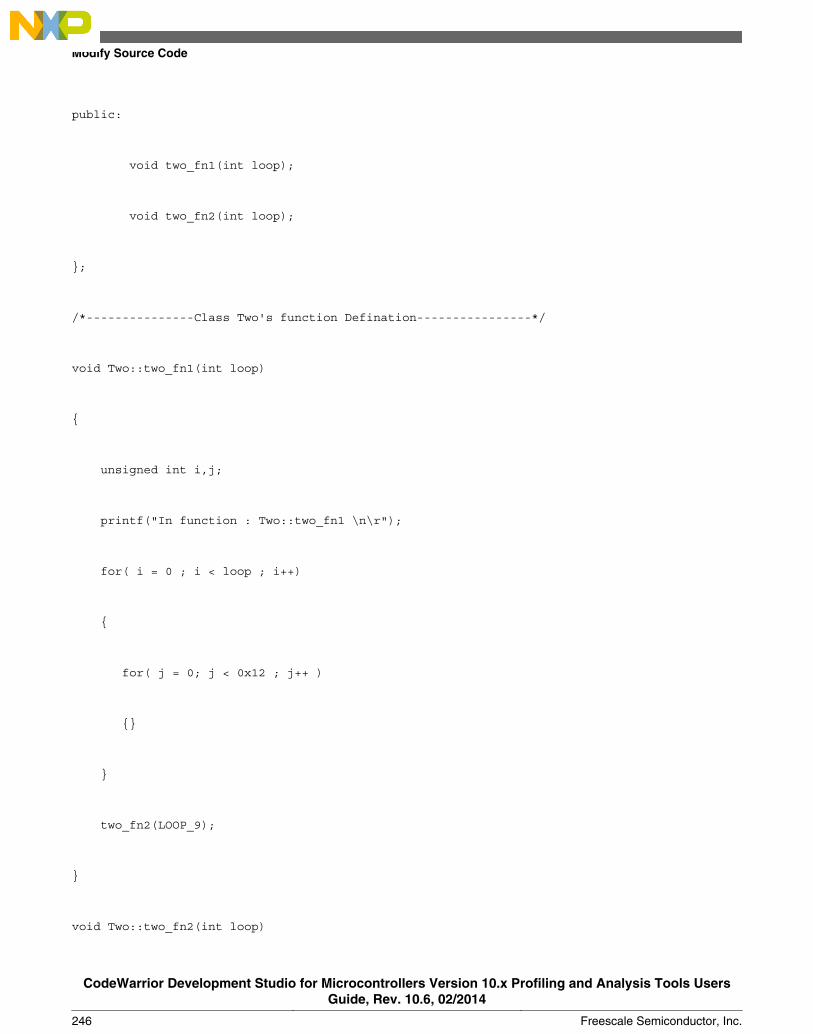
public:
void two_fn1(int loop);
void two_fn2(int loop);
};
/*---------------Class Two's function Defination----------------*/
void Two::two_fn1(int loop)
{
unsigned int i,j;
printf("In function : Two::two_fn1 \n\r");
for( i = 0 ; i < loop ; i++)
{
for( j = 0; j < 0x12 ; j++ )
{}
}
two_fn2(LOOP_9);
}
void Two::two_fn2(int loop)
Modify Source Code
CodeWarrior Development Studio for Microcontrollers Version 10.x Profiling and Analysis Tools UsersGuide, Rev. 10.6, 02/2014
246 Freescale Semiconductor, Inc.
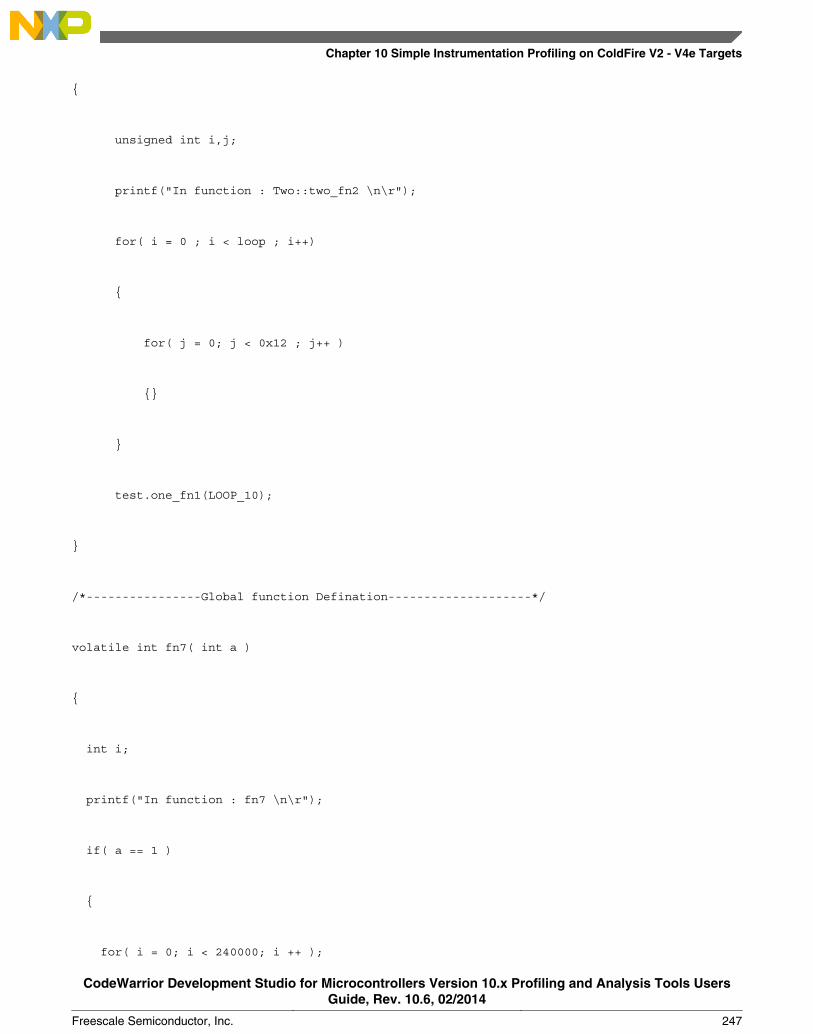
{
unsigned int i,j;
printf("In function : Two::two_fn2 \n\r");
for( i = 0 ; i < loop ; i++)
{
for( j = 0; j < 0x12 ; j++ )
{}
}
test.one_fn1(LOOP_10);
}
/*----------------Global function Defination--------------------*/
volatile int fn7( int a )
{
int i;
printf("In function : fn7 \n\r");
if( a == 1 )
{
for( i = 0; i < 240000; i ++ );
Chapter 10 Simple Instrumentation Profiling on ColdFire V2 - V4e Targets
CodeWarrior Development Studio for Microcontrollers Version 10.x Profiling and Analysis Tools UsersGuide, Rev. 10.6, 02/2014
Freescale Semiconductor, Inc. 247
return 1;
}
else
return a * fn7( a - 1 );
}
void fn6(int loop)
{
unsigned int i,j;
printf("In function : fn6 \n\r");
for( i = 0 ; i < loop ; i++)
{
for( j = 0; j < 0x12 ; j++ )
{}
}
}
void fn5(int loop)
{
Modify Source Code
CodeWarrior Development Studio for Microcontrollers Version 10.x Profiling and Analysis Tools UsersGuide, Rev. 10.6, 02/2014
248 Freescale Semiconductor, Inc.
unsigned int i,j;
printf("In function : fn5 \n\r");
for( i = 0 ; i < loop ; i++)
{
for( j = 0; j < 0x12 ; j++ )
{}
}
}
void fn4(int loop)
{
unsigned int i,j;
printf("In function : fn4 \n\r");
for( i = 0 ; i < loop ; i++)
{
for( j = 0; j < 0x12 ; j++ )
{}
}
}
Chapter 10 Simple Instrumentation Profiling on ColdFire V2 - V4e Targets
CodeWarrior Development Studio for Microcontrollers Version 10.x Profiling and Analysis Tools UsersGuide, Rev. 10.6, 02/2014
Freescale Semiconductor, Inc. 249
void fn3(int loop)
{
unsigned int i,j;
printf("In function : fn3 \n\r");
for( i = 0 ; i < loop ; i++)
{
for( j = 0; j < 0x12 ; j++ )
{}
}
}
void fn2(int loop)
{
unsigned int i,j;
printf("In function : fn2 \n\r");
for( i = 0 ; i < loop ; i++)
{
for( j = 0; j < 0x12 ; j++ )
Modify Source Code
CodeWarrior Development Studio for Microcontrollers Version 10.x Profiling and Analysis Tools UsersGuide, Rev. 10.6, 02/2014
250 Freescale Semiconductor, Inc.
{}
}
fn3(LOOP_3);
}
void fn1(int loop)
{
unsigned int i,j;
printf("In function : fn1 \n\r");
for( i = 0 ; i < loop ; i++)
{
for( j = 0; j < 0x12 ; j++ )
{}
}
fn2(LOOP_2);
}
/*---------------main function Definition----------------------*/
int main()
{
Chapter 10 Simple Instrumentation Profiling on ColdFire V2 - V4e Targets
CodeWarrior Development Studio for Microcontrollers Version 10.x Profiling and Analysis Tools UsersGuide, Rev. 10.6, 02/2014
Freescale Semiconductor, Inc. 251
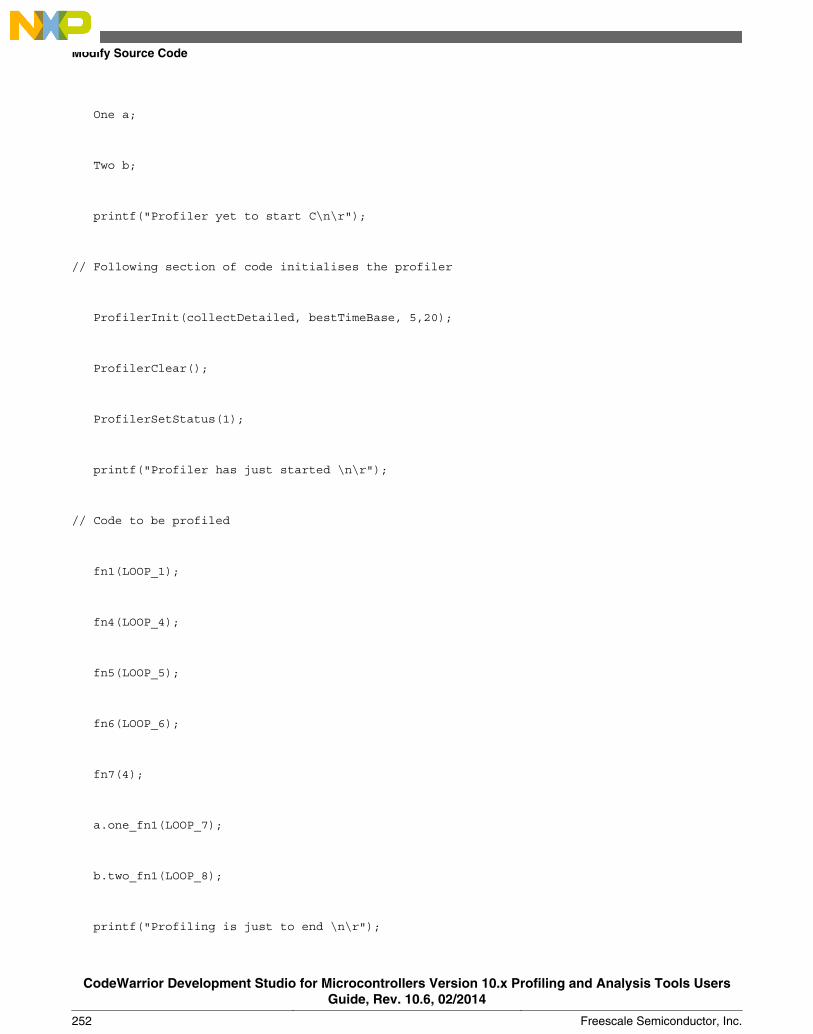
One a;
Two b;
printf("Profiler yet to start C\n\r");
// Following section of code initialises the profiler
ProfilerInit(collectDetailed, bestTimeBase, 5,20);
ProfilerClear();
ProfilerSetStatus(1);
printf("Profiler has just started \n\r");
// Code to be profiled
fn1(LOOP_1);
fn4(LOOP_4);
fn5(LOOP_5);
fn6(LOOP_6);
fn7(4);
a.one_fn1(LOOP_7);
b.two_fn1(LOOP_8);
printf("Profiling is just to end \n\r");
Modify Source Code
CodeWarrior Development Studio for Microcontrollers Version 10.x Profiling and Analysis Tools UsersGuide, Rev. 10.6, 02/2014
252 Freescale Semiconductor, Inc.
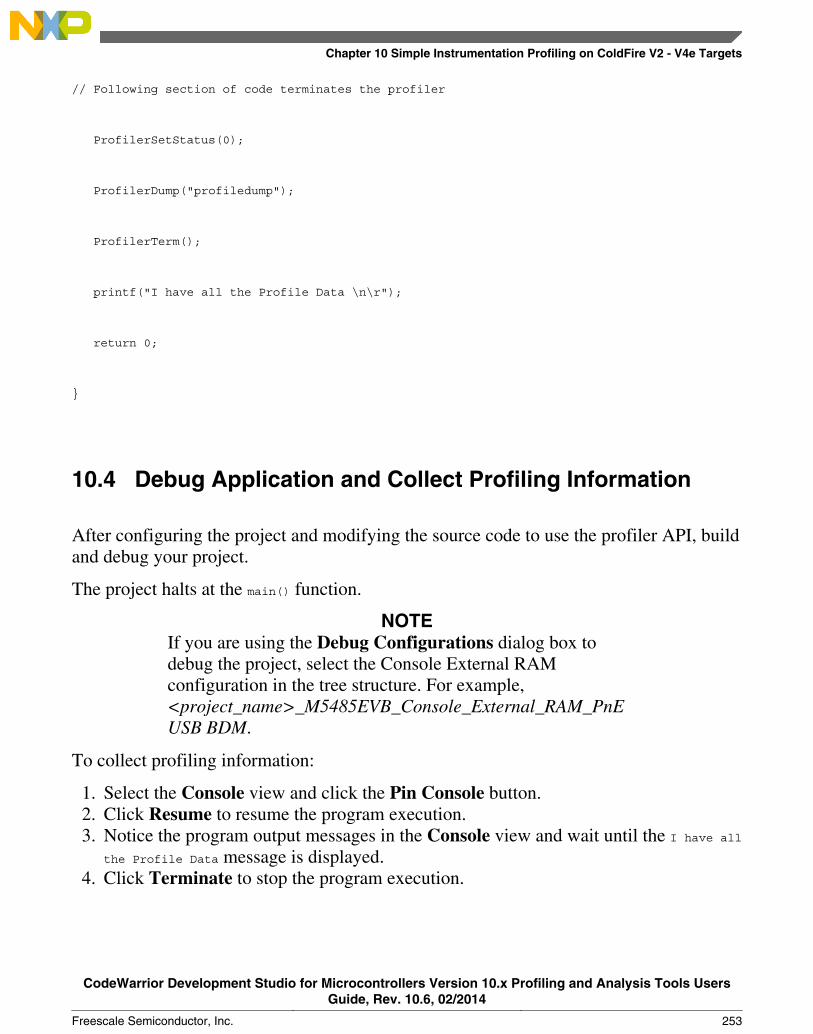
// Following section of code terminates the profiler
ProfilerSetStatus(0);
ProfilerDump("profiledump");
ProfilerTerm();
printf("I have all the Profile Data \n\r");
return 0;
}
10.4 Debug Application and Collect Profiling Information
After configuring the project and modifying the source code to use the profiler API, buildand debug your project.
The project halts at the main() function.
NOTEIf you are using the Debug Configurations dialog box todebug the project, select the Console External RAMconfiguration in the tree structure. For example,<project_name>_M5485EVB_Console_External_RAM_PnEUSB BDM.
To collect profiling information:
1. Select the Console view and click the Pin Console button.2. Click Resume to resume the program execution.3. Notice the program output messages in the Console view and wait until the I have all
the Profile Data message is displayed.4. Click Terminate to stop the program execution.
Chapter 10 Simple Instrumentation Profiling on ColdFire V2 - V4e Targets
CodeWarrior Development Studio for Microcontrollers Version 10.x Profiling and Analysis Tools UsersGuide, Rev. 10.6, 02/2014
Freescale Semiconductor, Inc. 253
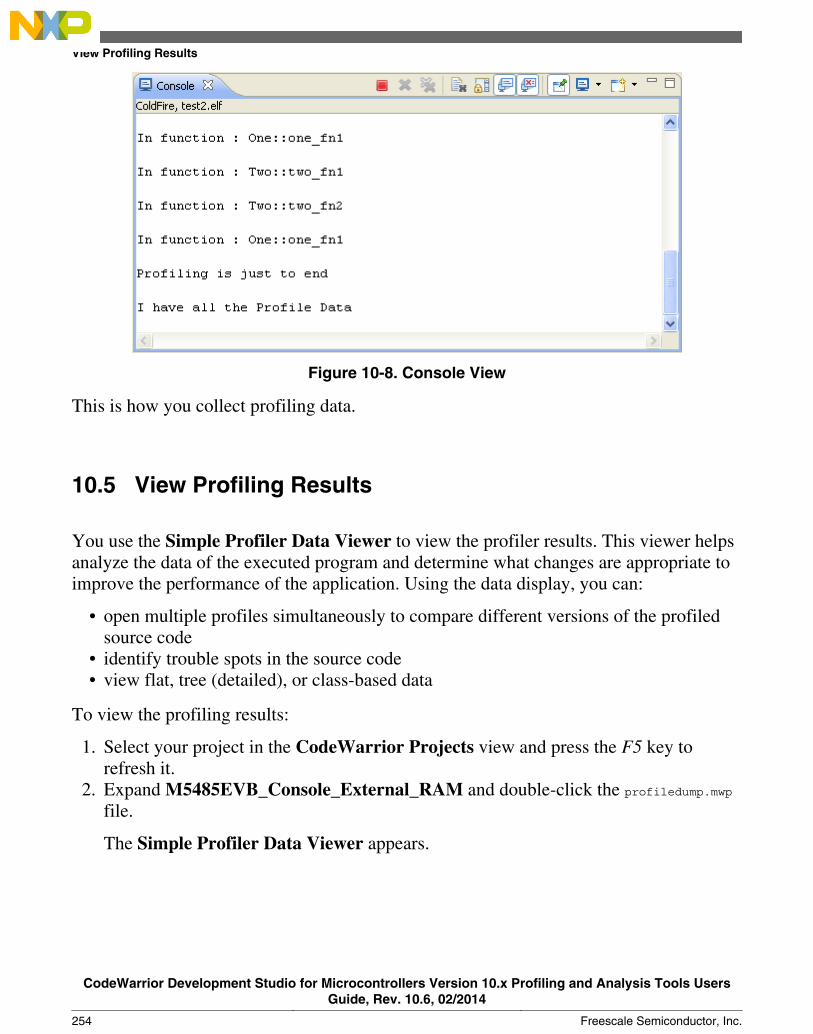
Figure 10-8. Console View
This is how you collect profiling data.
10.5 View Profiling Results
You use the Simple Profiler Data Viewer to view the profiler results. This viewer helpsanalyze the data of the executed program and determine what changes are appropriate toimprove the performance of the application. Using the data display, you can:
• open multiple profiles simultaneously to compare different versions of the profiledsource code
• identify trouble spots in the source code• view flat, tree (detailed), or class-based data
To view the profiling results:
1. Select your project in the CodeWarrior Projects view and press the F5 key torefresh it.
2. Expand M5485EVB_Console_External_RAM and double-click the profiledump.mwpfile.
The Simple Profiler Data Viewer appears.
View Profiling Results
CodeWarrior Development Studio for Microcontrollers Version 10.x Profiling and Analysis Tools UsersGuide, Rev. 10.6, 02/2014
254 Freescale Semiconductor, Inc.
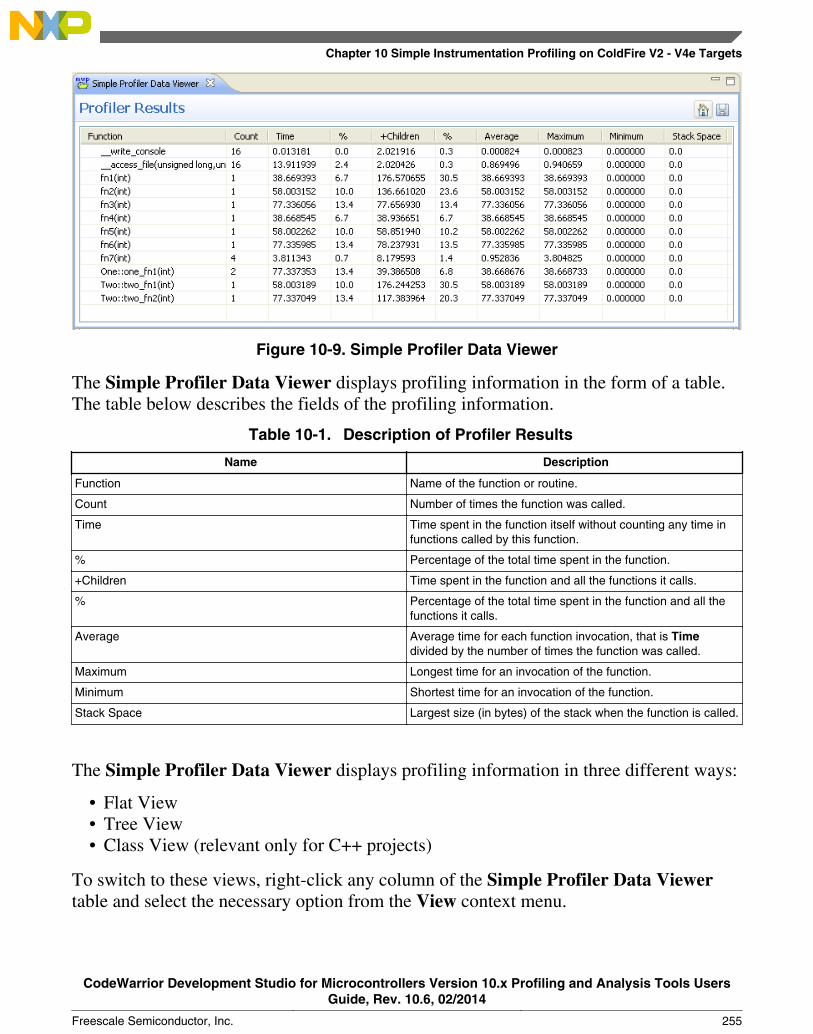
Figure 10-9. Simple Profiler Data Viewer
The Simple Profiler Data Viewer displays profiling information in the form of a table.The table below describes the fields of the profiling information.
Table 10-1. Description of Profiler Results
Name Description
Function Name of the function or routine.
Count Number of times the function was called.
Time Time spent in the function itself without counting any time infunctions called by this function.
% Percentage of the total time spent in the function.
+Children Time spent in the function and all the functions it calls.
% Percentage of the total time spent in the function and all thefunctions it calls.
Average Average time for each function invocation, that is Timedivided by the number of times the function was called.
Maximum Longest time for an invocation of the function.
Minimum Shortest time for an invocation of the function.
Stack Space Largest size (in bytes) of the stack when the function is called.
The Simple Profiler Data Viewer displays profiling information in three different ways:
• Flat View• Tree View• Class View (relevant only for C++ projects)
To switch to these views, right-click any column of the Simple Profiler Data Viewertable and select the necessary option from the View context menu.
Chapter 10 Simple Instrumentation Profiling on ColdFire V2 - V4e Targets
CodeWarrior Development Studio for Microcontrollers Version 10.x Profiling and Analysis Tools UsersGuide, Rev. 10.6, 02/2014
Freescale Semiconductor, Inc. 255
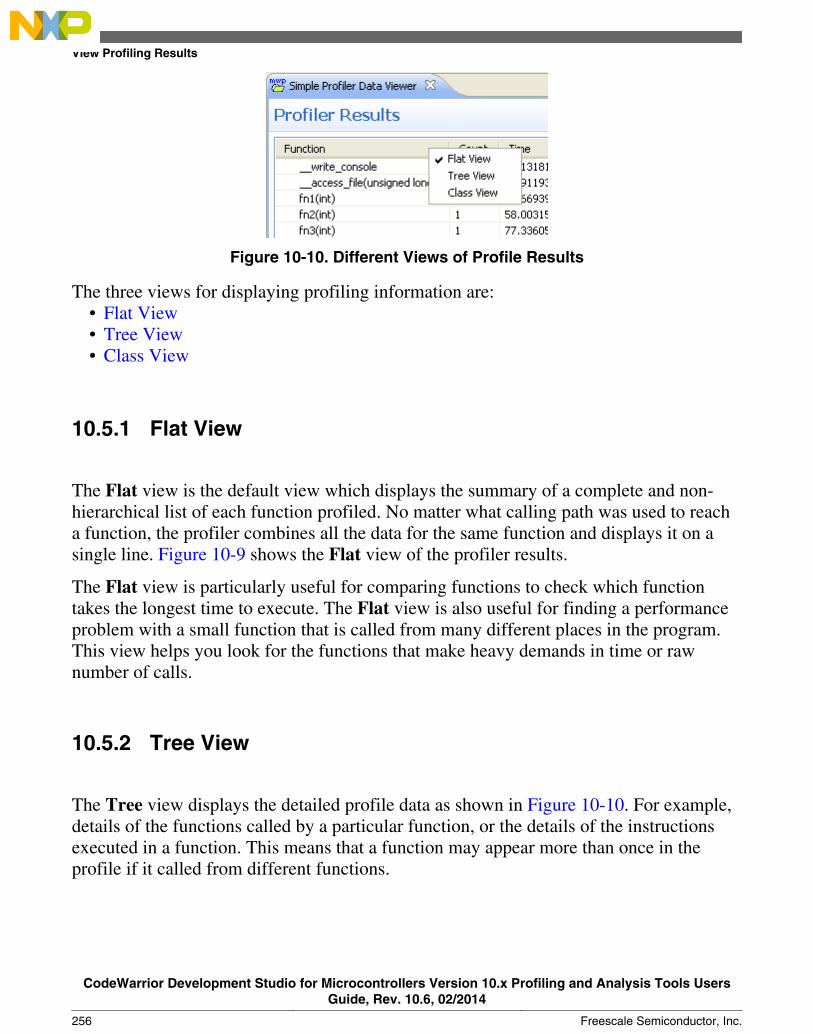
Figure 10-10. Different Views of Profile Results
The three views for displaying profiling information are:• Flat View• Tree View• Class View
10.5.1 Flat View
The Flat view is the default view which displays the summary of a complete and non-hierarchical list of each function profiled. No matter what calling path was used to reacha function, the profiler combines all the data for the same function and displays it on asingle line. Figure 10-9 shows the Flat view of the profiler results.
The Flat view is particularly useful for comparing functions to check which functiontakes the longest time to execute. The Flat view is also useful for finding a performanceproblem with a small function that is called from many different places in the program.This view helps you look for the functions that make heavy demands in time or rawnumber of calls.
10.5.2 Tree View
The Tree view displays the detailed profile data as shown in Figure 10-10. For example,details of the functions called by a particular function, or the details of the instructionsexecuted in a function. This means that a function may appear more than once in theprofile if it called from different functions.
View Profiling Results
CodeWarrior Development Studio for Microcontrollers Version 10.x Profiling and Analysis Tools UsersGuide, Rev. 10.6, 02/2014
256 Freescale Semiconductor, Inc.
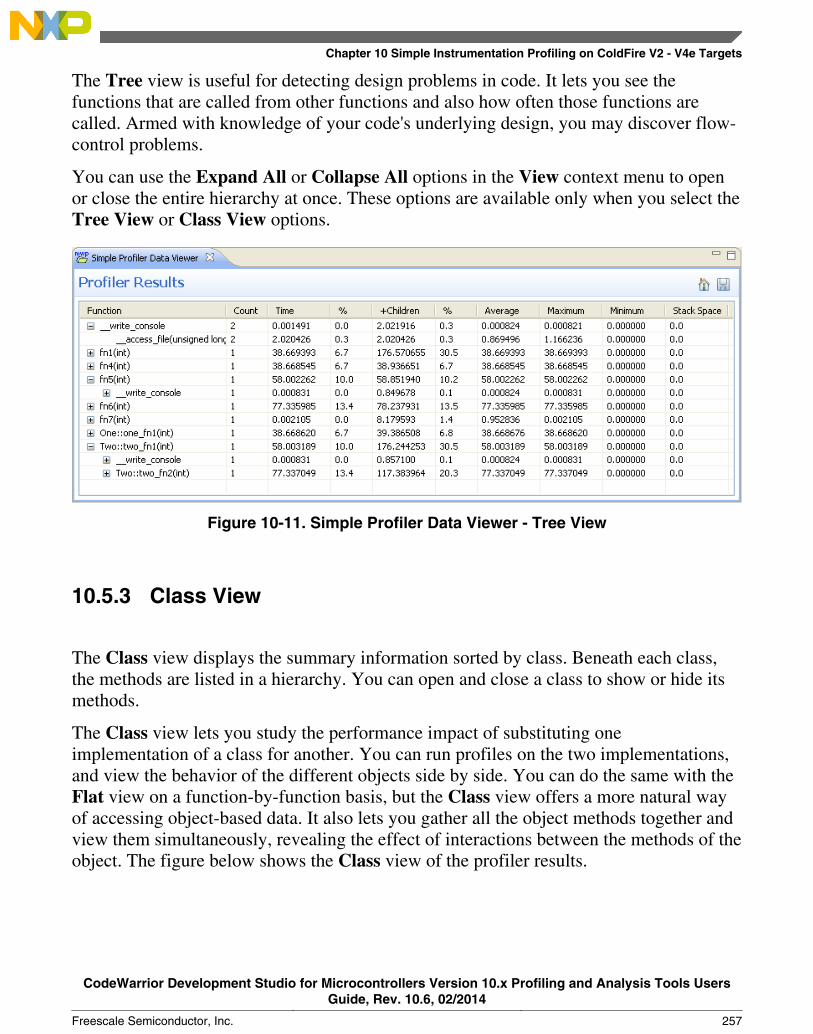
The Tree view is useful for detecting design problems in code. It lets you see thefunctions that are called from other functions and also how often those functions arecalled. Armed with knowledge of your code's underlying design, you may discover flow-control problems.
You can use the Expand All or Collapse All options in the View context menu to openor close the entire hierarchy at once. These options are available only when you select theTree View or Class View options.
Figure 10-11. Simple Profiler Data Viewer - Tree View
10.5.3 Class View
The Class view displays the summary information sorted by class. Beneath each class,the methods are listed in a hierarchy. You can open and close a class to show or hide itsmethods.
The Class view lets you study the performance impact of substituting oneimplementation of a class for another. You can run profiles on the two implementations,and view the behavior of the different objects side by side. You can do the same with theFlat view on a function-by-function basis, but the Class view offers a more natural wayof accessing object-based data. It also lets you gather all the object methods together andview them simultaneously, revealing the effect of interactions between the methods of theobject. The figure below shows the Class view of the profiler results.
Chapter 10 Simple Instrumentation Profiling on ColdFire V2 - V4e Targets
CodeWarrior Development Studio for Microcontrollers Version 10.x Profiling and Analysis Tools UsersGuide, Rev. 10.6, 02/2014
Freescale Semiconductor, Inc. 257
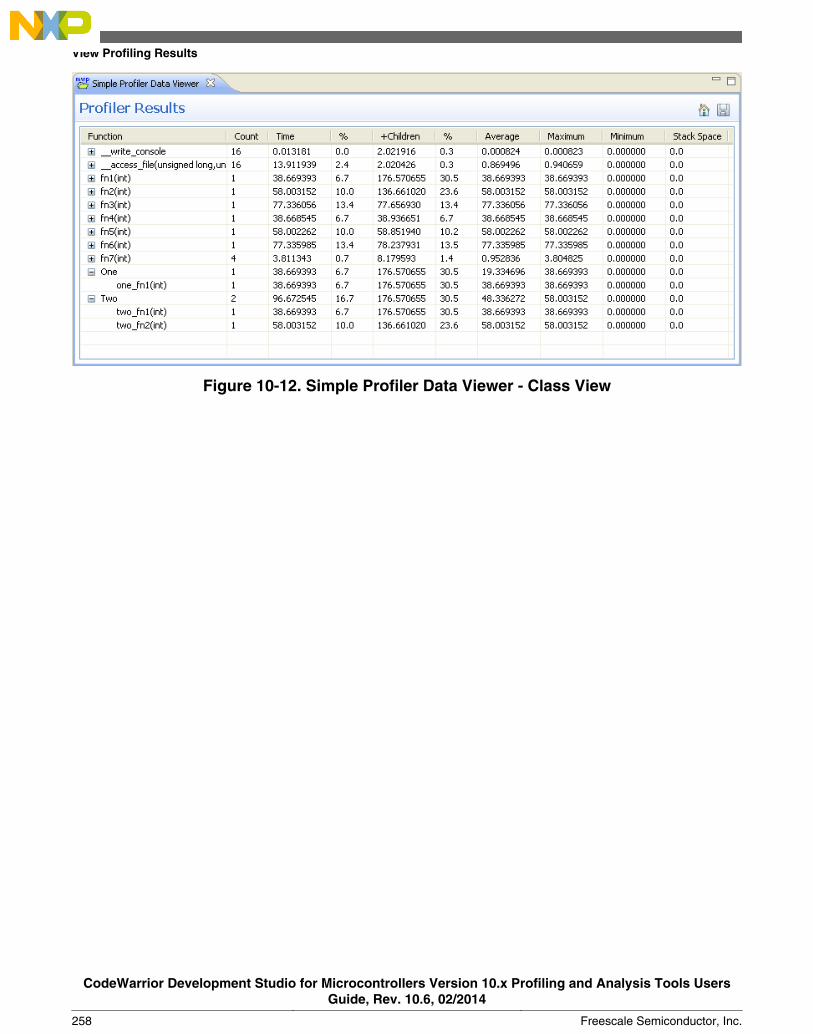
Figure 10-12. Simple Profiler Data Viewer - Class View
View Profiling Results
CodeWarrior Development Studio for Microcontrollers Version 10.x Profiling and Analysis Tools UsersGuide, Rev. 10.6, 02/2014
258 Freescale Semiconductor, Inc.

Chapter 11
11.1 Trace Collection with Breakpoints
A breakpoint suspends the debug session automatically when the instruction on which itis set is executed. When a breakpoint is set in trace collection, it halts the application at aparticular source line and stops collecting the trace data. You can start collecting traceagain from that source line by resuming the debug session.
You can set breakpoints either in the editor area or in the Disassembly view. Thefollowing steps demonstrate how to set a breakpoint in the editor area and collect tracedata on the ColdFire V1 target:
1. Open the Debug Configurations dialog box, and select your project in the treestructure.
2. Click the Trace and Profile tab, and check the Enable Trace and Profile checkbox.3. Select the Continuous option from the Select Trace Mode group.4. Ensure that the Trace is Always Enabled option is selected in the Trace Start/Stop
Conditions drop-down list.5. Click Apply to save the settings.6. Click Debug to start the debug session.7. In the editor area, double-click the marker bar corresponding to the instruction on
which you want to set the breakpoint.
CodeWarrior Development Studio for Microcontrollers Version 10.x Profiling and Analysis Tools UsersGuide, Rev. 10.6, 02/2014
Freescale Semiconductor, Inc. 259
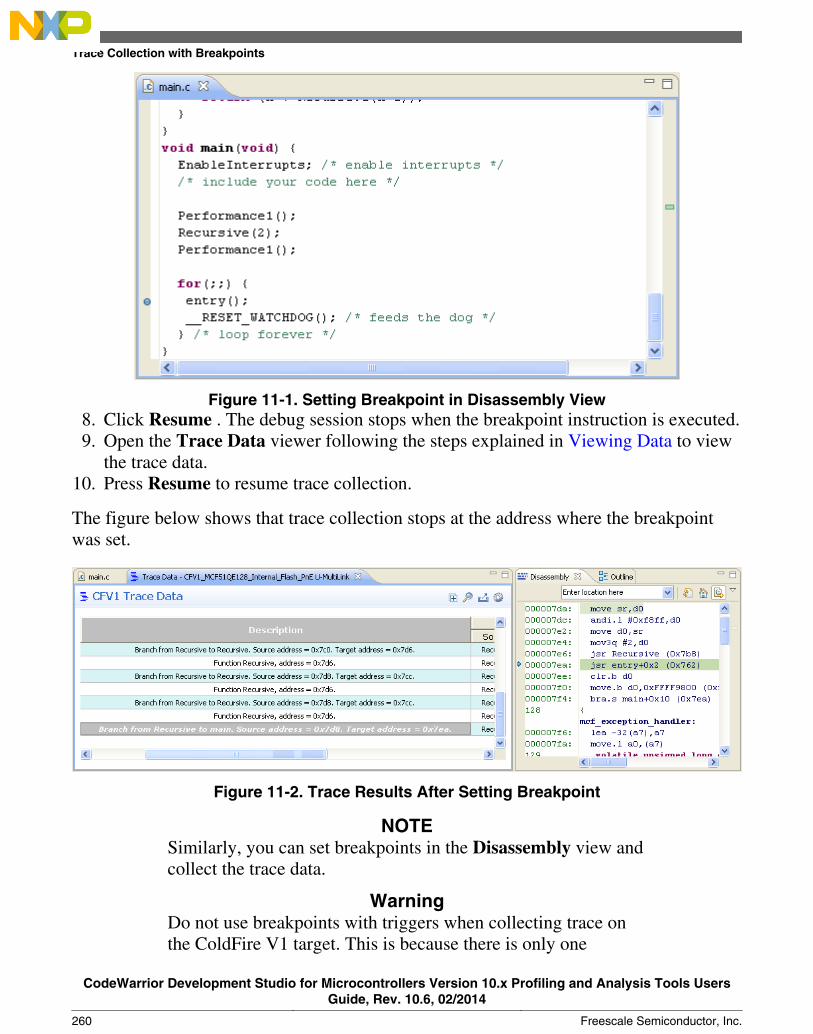
Figure 11-1. Setting Breakpoint in Disassembly View8. Click Resume . The debug session stops when the breakpoint instruction is executed.9. Open the Trace Data viewer following the steps explained in Viewing Data to view
the trace data.10. Press Resume to resume trace collection.
The figure below shows that trace collection stops at the address where the breakpointwas set.
Figure 11-2. Trace Results After Setting Breakpoint
NOTESimilarly, you can set breakpoints in the Disassembly view andcollect the trace data.
WarningDo not use breakpoints with triggers when collecting trace onthe ColdFire V1 target. This is because there is only one
Trace Collection with Breakpoints
CodeWarrior Development Studio for Microcontrollers Version 10.x Profiling and Analysis Tools UsersGuide, Rev. 10.6, 02/2014
260 Freescale Semiconductor, Inc.
hardware debug module on ColdFire V1 which is shared forsetting hardware breakpoints or trace triggers. So you can eitherset breakpoint or trace trigger using this debug module.
On HCS08, if you are setting breakpoints with triggers for tracecontrol, ensure that you do not to use more than one breakpoint.This is because on HCS08, two hardware debug modules, BDC(Background debug controller) and DBG (debug module) areused. Both debug modules can be used for setting hardwarebreakpoints, while only DBG can be used for setting triggers.The first breakpoint is set using BDC, any other breakpointswill use DBG and will conflict with the triggers.
On DSC and S12z platforms, breakpoints and triggers aremutually exclusive.
On the Kinetis platform, there are four DWT comparatorswhich can be used for maximum four events. The SoftwareAnalysis tool checks which DWT comparators are already usedfor breakpoints and only uses the remaining ones for triggers.
Chapter 11
CodeWarrior Development Studio for Microcontrollers Version 10.x Profiling and Analysis Tools UsersGuide, Rev. 10.6, 02/2014
Freescale Semiconductor, Inc. 261

Trace Collection with Breakpoints
CodeWarrior Development Studio for Microcontrollers Version 10.x Profiling and Analysis Tools UsersGuide, Rev. 10.6, 02/2014
262 Freescale Semiconductor, Inc.
Chapter 12Configuring Trace Registers in Source Code
You can the configure trace registers in the source code without using the CodeWarriorIntegrated Development Environment for both HCS08 and ColdFire V1 targets.
12.1 HCS08To setup the trace mode for HCS08, you must configure the DBGT and DBGC registersin the source code, preferably within the main() function and before any processing and/orfunctions calls. This is not mandatory but recommended as the main() function is calledimmediately after processor is reset. Therefore, to collect trace from this point forward,you must configure these registers in the beginning of the main() function.
You can configure only the Automatically mode for the HCS08 target. TheContinuously and Profile-Only modes are implemented in the host software and thereare no registers on the target associated with these modes.
For HCS08, the trace registers are mapped in the memory, so they have addressesassociated. Therefore, you need to simply write desired values to these registers in thesource code. An example to configure the trace registers in the source code of the HCS08target is discussed below.
1. Create a stationary project.2. Open the source code editor area.3. Replace the source code written in the main() function with the source code shown
below:Listing: Configuration of DBGC and DBGT registers in main() function forHCS08 target
void main(void){ EnableInterrupts; DBGT = 0x80; // write debug trigger register DBGC = 0xC0; // write debug control register
for(;;) {
CodeWarrior Development Studio for Microcontrollers Version 10.x Profiling and Analysis Tools UsersGuide, Rev. 10.6, 02/2014
Freescale Semiconductor, Inc. 263
__RESET_WATCHDOG(); foo(); }}
4. Save and build the project.5. Open the Debug Configurations dialog box, and select your project in the tree
structure.6. Click the Trace and Profile tab, and check the Enable Trace and Profile checkbox.7. Check the Configuration Set in User Code checkbox in the User Options group.
The rest of the controls on the page turn disabled.8. Click Apply to save the settings.9. Click Debug to debug the application.
10. Click Resume to resume the execution and begin measurement. Let the applicationrun for several seconds.
11. Click Suspend .12. Open the Trace Data viewer following the steps explained in the topic Viewing Data
to view the collected data.
You can also set triggers at the required addresses by writing the following statements inthe main() function of your source code:
DBGCA = 0xE1CD; //write comparator A; sets trigger A at 0xE1CD
DBGCB = 0xE1DB; //write comparator B; sets trigger B at 0xE1DB
12.2 ColdFire V1For ColdFire V1, the trace registers are not mapped in the memory space. Therefore, theonly way to access these registers is by using the wdebug instruction, while the processor isrunning in the supervisor mode.
To configure the trace registers in the source code in the Automatic mode on the ColdFireV1 target:
1. Create a stationary project.2. Open the source code editor area.3. Replace the source code of main.c with the source code shown below:
Listing: Configuration of trace registers for ColdFire V1
#include <hidef.h> /* for EnableInterrupts macro */
#include "derivative.h" /* include peripheral declarations */
#include <stdio.h>
#include <ctype.h>
ColdFire V1
CodeWarrior Development Studio for Microcontrollers Version 10.x Profiling and Analysis Tools UsersGuide, Rev. 10.6, 02/2014
264 Freescale Semiconductor, Inc.
/* Define the used DRc */
#define MCFDEBUG_CSR 0x0 /* Configuration status*/
#define MCFDEBUG_XCSR 0x1 /* Extended configuration status register*/
#define MCFDEBUG_CSR2 0x2 /* Configuration status register 2 */
#define TRACE_AUTOMATIC 0
#define TRACE_CONTINUOUS 1
#define TRACE_PCSYNC 2
#define TRACE_NONE 3
#define TRACE_MODE TRACE_AUTOMATIC
volatile unsigned short dbg_spc[6];
volatile unsigned short *dbg;
inline void wdebug(int reg, unsigned long data) {
// Force alignment to long word boundary
dbg = (unsigned short *)((((unsigned long)dbg_spc) + 3) & 0xfffffffc);
// Build up the debug instruction
dbg[0] = 0x2c80 | (reg & 0xf);
dbg[1] = (data >> 16) & 0xffff;
dbg[2] = data & 0xffff;
dbg[3] = 0;
asm(" MOVE.L dbg ,A1");
asm(" WDEBUG (A1) ");
}
inline void setSupervisorModel(void)
{
asm ( " MOVE.W #0x2000,D0" );
asm ( " MOVE.W D0,SR" );
}
Chapter 12 Configuring Trace Registers in Source Code
CodeWarrior Development Studio for Microcontrollers Version 10.x Profiling and Analysis Tools UsersGuide, Rev. 10.6, 02/2014
Freescale Semiconductor, Inc. 265
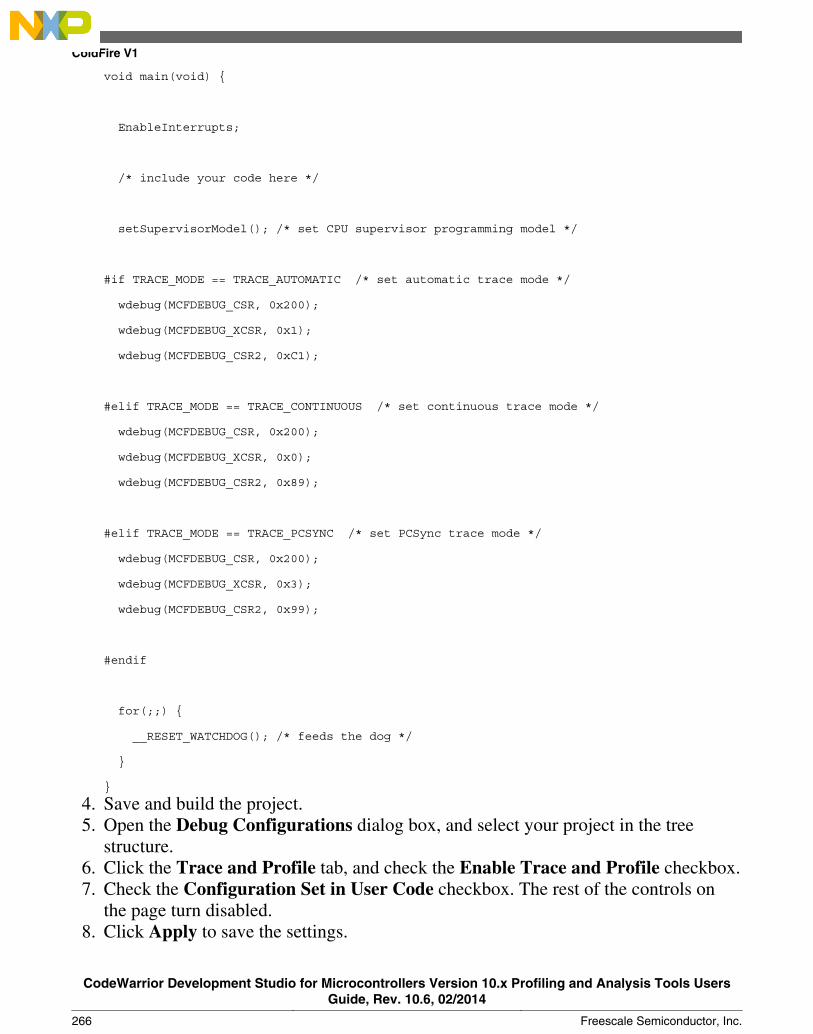
void main(void) {
EnableInterrupts;
/* include your code here */
setSupervisorModel(); /* set CPU supervisor programming model */
#if TRACE_MODE == TRACE_AUTOMATIC /* set automatic trace mode */
wdebug(MCFDEBUG_CSR, 0x200);
wdebug(MCFDEBUG_XCSR, 0x1);
wdebug(MCFDEBUG_CSR2, 0xC1);
#elif TRACE_MODE == TRACE_CONTINUOUS /* set continuous trace mode */
wdebug(MCFDEBUG_CSR, 0x200);
wdebug(MCFDEBUG_XCSR, 0x0);
wdebug(MCFDEBUG_CSR2, 0x89);
#elif TRACE_MODE == TRACE_PCSYNC /* set PCSync trace mode */
wdebug(MCFDEBUG_CSR, 0x200);
wdebug(MCFDEBUG_XCSR, 0x3);
wdebug(MCFDEBUG_CSR2, 0x99);
#endif
for(;;) {
__RESET_WATCHDOG(); /* feeds the dog */
}
}
4. Save and build the project.5. Open the Debug Configurations dialog box, and select your project in the tree
structure.6. Click the Trace and Profile tab, and check the Enable Trace and Profile checkbox.7. Check the Configuration Set in User Code checkbox. The rest of the controls on
the page turn disabled.8. Click Apply to save the settings.
ColdFire V1
CodeWarrior Development Studio for Microcontrollers Version 10.x Profiling and Analysis Tools UsersGuide, Rev. 10.6, 02/2014
266 Freescale Semiconductor, Inc.
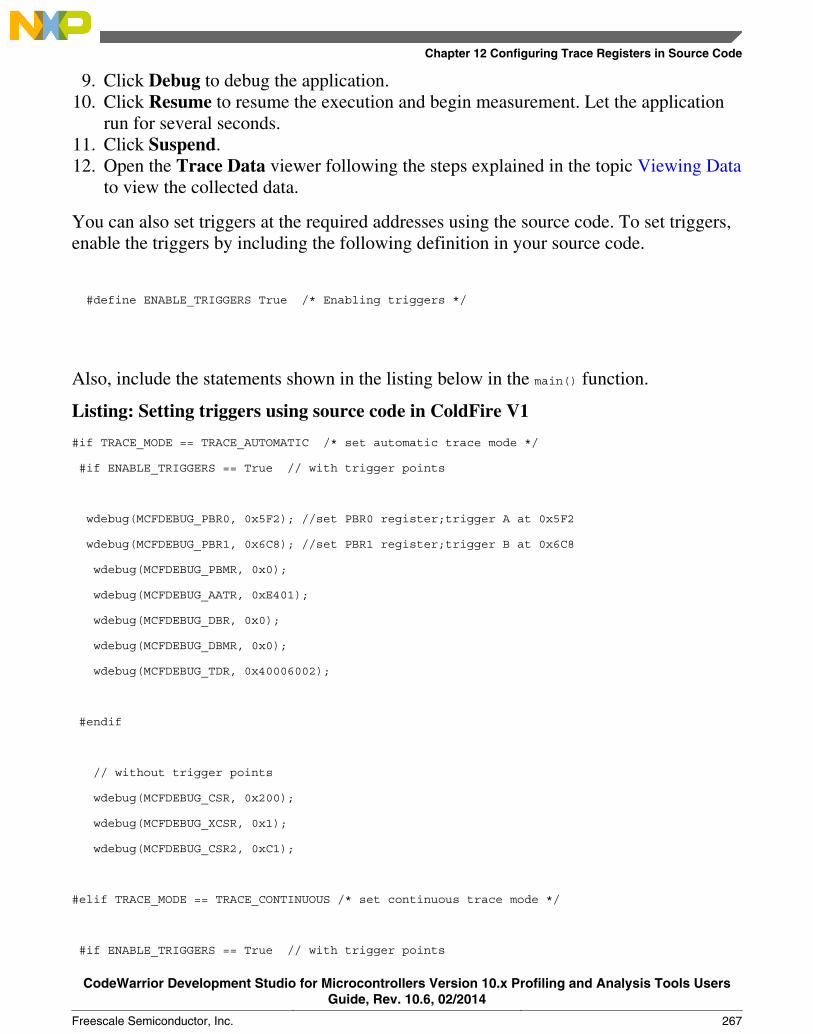
9. Click Debug to debug the application.10. Click Resume to resume the execution and begin measurement. Let the application
run for several seconds.11. Click Suspend.12. Open the Trace Data viewer following the steps explained in the topic Viewing Data
to view the collected data.
You can also set triggers at the required addresses using the source code. To set triggers,enable the triggers by including the following definition in your source code.
#define ENABLE_TRIGGERS True /* Enabling triggers */
Also, include the statements shown in the listing below in the main() function.
Listing: Setting triggers using source code in ColdFire V1
#if TRACE_MODE == TRACE_AUTOMATIC /* set automatic trace mode */
#if ENABLE_TRIGGERS == True // with trigger points
wdebug(MCFDEBUG_PBR0, 0x5F2); //set PBR0 register;trigger A at 0x5F2
wdebug(MCFDEBUG_PBR1, 0x6C8); //set PBR1 register;trigger B at 0x6C8
wdebug(MCFDEBUG_PBMR, 0x0);
wdebug(MCFDEBUG_AATR, 0xE401);
wdebug(MCFDEBUG_DBR, 0x0);
wdebug(MCFDEBUG_DBMR, 0x0);
wdebug(MCFDEBUG_TDR, 0x40006002);
#endif
// without trigger points
wdebug(MCFDEBUG_CSR, 0x200);
wdebug(MCFDEBUG_XCSR, 0x1);
wdebug(MCFDEBUG_CSR2, 0xC1);
#elif TRACE_MODE == TRACE_CONTINUOUS /* set continuous trace mode */
#if ENABLE_TRIGGERS == True // with trigger points
Chapter 12 Configuring Trace Registers in Source Code
CodeWarrior Development Studio for Microcontrollers Version 10.x Profiling and Analysis Tools UsersGuide, Rev. 10.6, 02/2014
Freescale Semiconductor, Inc. 267
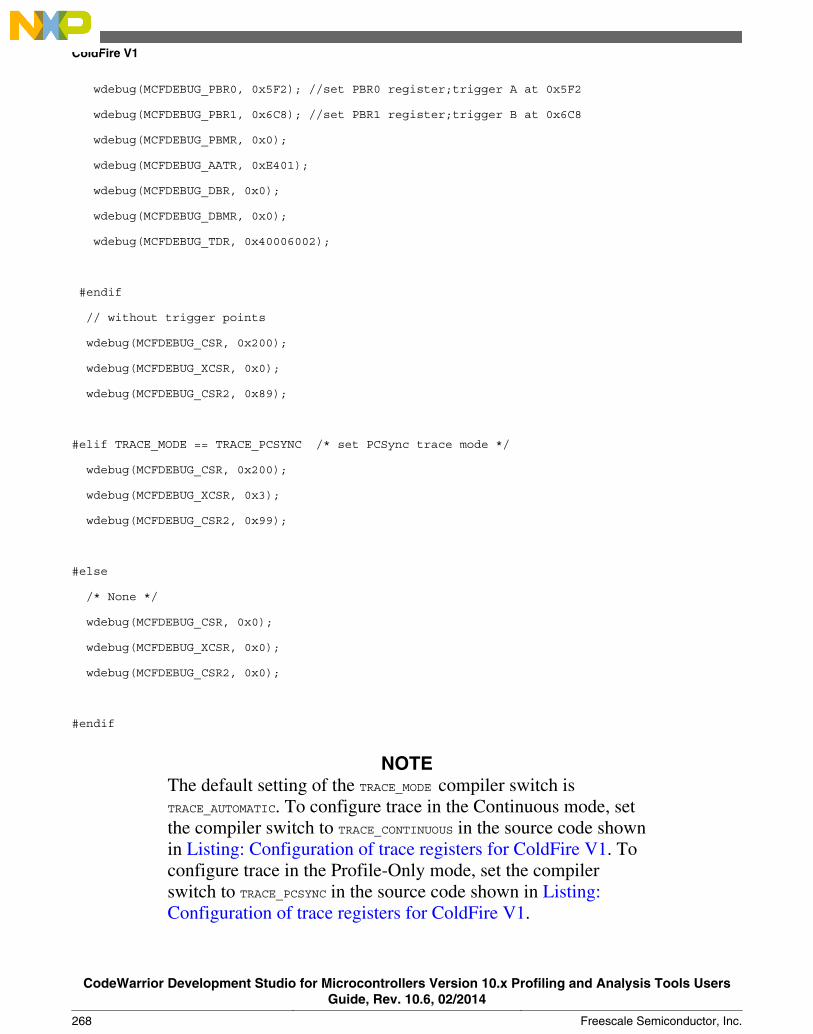
wdebug(MCFDEBUG_PBR0, 0x5F2); //set PBR0 register;trigger A at 0x5F2
wdebug(MCFDEBUG_PBR1, 0x6C8); //set PBR1 register;trigger B at 0x6C8
wdebug(MCFDEBUG_PBMR, 0x0);
wdebug(MCFDEBUG_AATR, 0xE401);
wdebug(MCFDEBUG_DBR, 0x0);
wdebug(MCFDEBUG_DBMR, 0x0);
wdebug(MCFDEBUG_TDR, 0x40006002);
#endif
// without trigger points
wdebug(MCFDEBUG_CSR, 0x200);
wdebug(MCFDEBUG_XCSR, 0x0);
wdebug(MCFDEBUG_CSR2, 0x89);
#elif TRACE_MODE == TRACE_PCSYNC /* set PCSync trace mode */
wdebug(MCFDEBUG_CSR, 0x200);
wdebug(MCFDEBUG_XCSR, 0x3);
wdebug(MCFDEBUG_CSR2, 0x99);
#else
/* None */
wdebug(MCFDEBUG_CSR, 0x0);
wdebug(MCFDEBUG_XCSR, 0x0);
wdebug(MCFDEBUG_CSR2, 0x0);
#endif
NOTEThe default setting of the TRACE_MODE compiler switch isTRACE_AUTOMATIC. To configure trace in the Continuous mode, setthe compiler switch to TRACE_CONTINUOUS in the source code shownin Listing: Configuration of trace registers for ColdFire V1. Toconfigure trace in the Profile-Only mode, set the compilerswitch to TRACE_PCSYNC in the source code shown in Listing:Configuration of trace registers for ColdFire V1.
ColdFire V1
CodeWarrior Development Studio for Microcontrollers Version 10.x Profiling and Analysis Tools UsersGuide, Rev. 10.6, 02/2014
268 Freescale Semiconductor, Inc.
Chapter 13Low Power WAIT Mode
Currently, CodeWarrior supports two low power modes: normal WAIT and normalSTOP. The Microcontrollers Software Analysis Tools component provides support forthe normal WAIT state. This state allows peripherals to function, while allowing CPU togo to sleep reducing power.
The Wait For Interrupt (WFI) instruction is used to enter the low power WAIT state.When an interrupt request occurs, the CPU exits the WAIT mode and resumesprocessing, beginning with the stacking operations leading to the interrupt serviceroutine.
NOTEWhen a processor issues a WFI instruction, it can suspendexecution and enter a low power state. The processor canremain in that state until it detects a reset or one of thefollowing WFI wake-up events:
• an asynchronous exception at a priority that preempts anycurrently active exceptions.
• a debug event with debug enabled.
When the hardware detects a WFI wake-up event, or earlier ifthe implementation chooses, the WFI instruction completes.
To activate low power mode monitoring and view results, you need to:
1. Configure Low Power WAIT State2. Debug the project and collect trace data.3. View Low Power WAIT Results
These steps are described in the following topics.
CodeWarrior Development Studio for Microcontrollers Version 10.x Profiling and Analysis Tools UsersGuide, Rev. 10.6, 02/2014
Freescale Semiconductor, Inc. 269
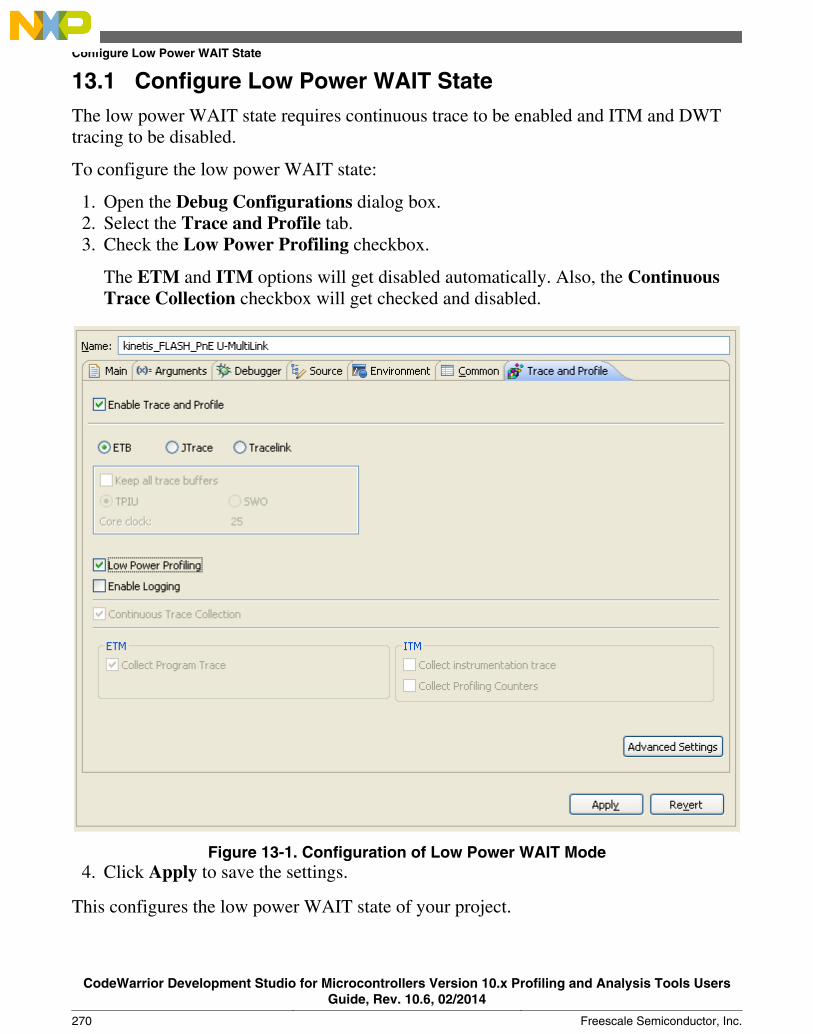
13.1 Configure Low Power WAIT StateThe low power WAIT state requires continuous trace to be enabled and ITM and DWTtracing to be disabled.
To configure the low power WAIT state:
1. Open the Debug Configurations dialog box.2. Select the Trace and Profile tab.3. Check the Low Power Profiling checkbox.
The ETM and ITM options will get disabled automatically. Also, the ContinuousTrace Collection checkbox will get checked and disabled.
Figure 13-1. Configuration of Low Power WAIT Mode4. Click Apply to save the settings.
This configures the low power WAIT state of your project.
Configure Low Power WAIT State
CodeWarrior Development Studio for Microcontrollers Version 10.x Profiling and Analysis Tools UsersGuide, Rev. 10.6, 02/2014
270 Freescale Semiconductor, Inc.
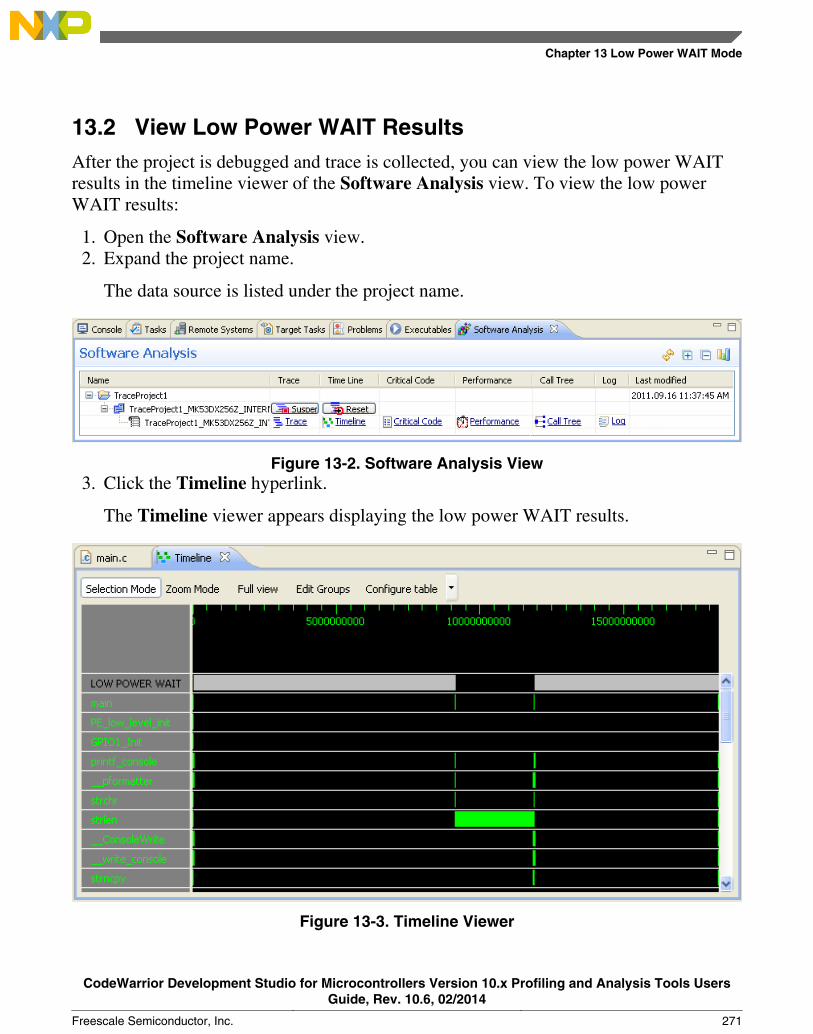
13.2 View Low Power WAIT ResultsAfter the project is debugged and trace is collected, you can view the low power WAITresults in the timeline viewer of the Software Analysis view. To view the low powerWAIT results:
1. Open the Software Analysis view.2. Expand the project name.
The data source is listed under the project name.
Figure 13-2. Software Analysis View3. Click the Timeline hyperlink.
The Timeline viewer appears displaying the low power WAIT results.
Figure 13-3. Timeline Viewer
Chapter 13 Low Power WAIT Mode
CodeWarrior Development Studio for Microcontrollers Version 10.x Profiling and Analysis Tools UsersGuide, Rev. 10.6, 02/2014
Freescale Semiconductor, Inc. 271

The list of functions in the left panel of the Timeline viewer displays LOW POWERWAIT at the first position. The corresponding gray-colored bars in the right panel showsfor how long the application was in WAIT mode. The bars appear twice, which indicatesthat the application entered the WAIT state twice.
View Low Power WAIT Results
CodeWarrior Development Studio for Microcontrollers Version 10.x Profiling and Analysis Tools UsersGuide, Rev. 10.6, 02/2014
272 Freescale Semiconductor, Inc.
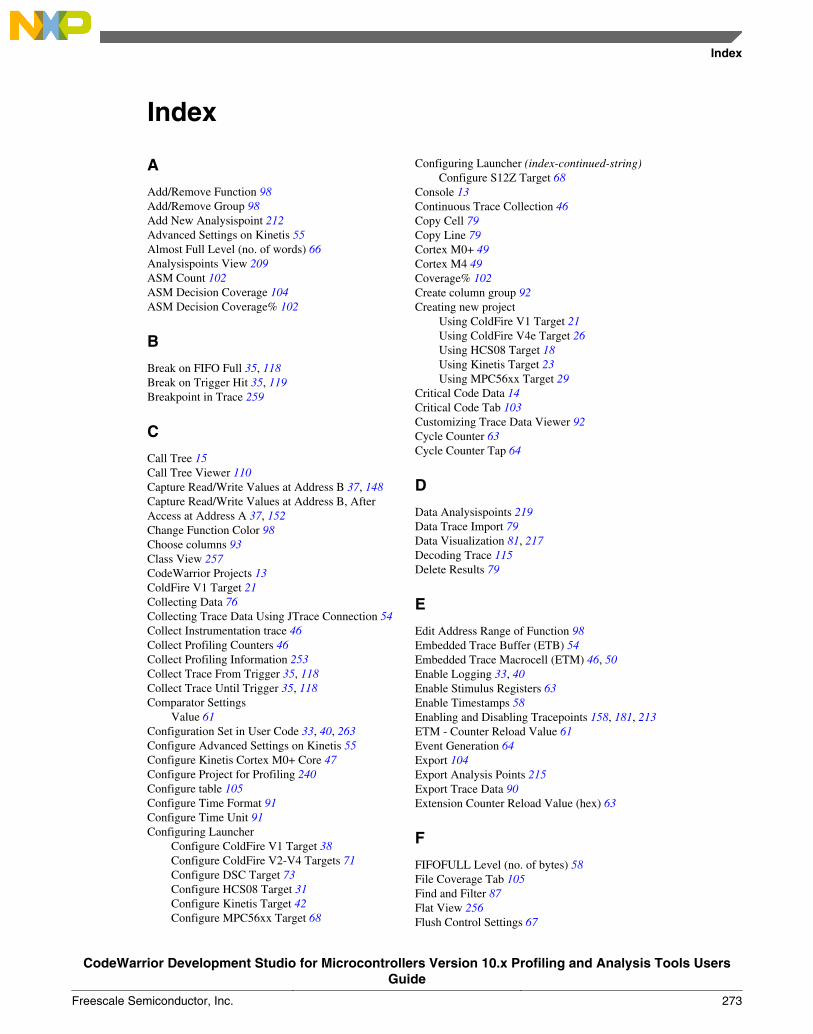
Index
A
Add/Remove Function 98Add/Remove Group 98Add New Analysispoint 212Advanced Settings on Kinetis 55Almost Full Level (no. of words) 66Analysispoints View 209ASM Count 102ASM Decision Coverage 104ASM Decision Coverage% 102
B
Break on FIFO Full 35, 118Break on Trigger Hit 35, 119Breakpoint in Trace 259
C
Call Tree 15Call Tree Viewer 110Capture Read/Write Values at Address B 37, 148Capture Read/Write Values at Address B, AfterAccess at Address A 37, 152Change Function Color 98Choose columns 93Class View 257CodeWarrior Projects 13ColdFire V1 Target 21Collecting Data 76Collecting Trace Data Using JTrace Connection 54Collect Instrumentation trace 46Collect Profiling Counters 46Collect Profiling Information 253Collect Trace From Trigger 35, 118Collect Trace Until Trigger 35, 118Comparator Settings
Value 61Configuration Set in User Code 33, 40, 263Configure Advanced Settings on Kinetis 55Configure Kinetis Cortex M0+ Core 47Configure Project for Profiling 240Configure table 105Configure Time Format 91Configure Time Unit 91Configuring Launcher
Configure ColdFire V1 Target 38Configure ColdFire V2-V4 Targets 71Configure DSC Target 73Configure HCS08 Target 31Configure Kinetis Target 42Configure MPC56xx Target 68
Configuring Launcher (index-continued-string)Configure S12Z Target 68
Console 13Continuous Trace Collection 46Copy Cell 79Copy Line 79Cortex M0+ 49Cortex M4 49Coverage% 102Create column group 92Creating new project
Using ColdFire V1 Target 21Using ColdFire V4e Target 26Using HCS08 Target 18Using Kinetis Target 23Using MPC56xx Target 29
Critical Code Data 14Critical Code Tab 103Customizing Trace Data Viewer 92Cycle Counter 63Cycle Counter Tap 64
D
Data Analysispoints 219Data Trace Import 79Data Visualization 81, 217Decoding Trace 115Delete Results 79
E
Edit Address Range of Function 98Embedded Trace Buffer (ETB) 54Embedded Trace Macrocell (ETM) 46, 50Enable Logging 33, 40Enable Stimulus Registers 63Enable Timestamps 58Enabling and Disabling Tracepoints 158, 181, 213ETM - Counter Reload Value 61Event Generation 64Export 104Export Analysis Points 215Export Trace Data 90Extension Counter Reload Value (hex) 63
F
FIFOFULL Level (no. of bytes) 58File Coverage Tab 105Find and Filter 87Flat View 256Flush Control Settings 67
Index
CodeWarrior Development Studio for Microcontrollers Version 10.x Profiling and Analysis Tools UsersGuide
Freescale Semiconductor, Inc. 273
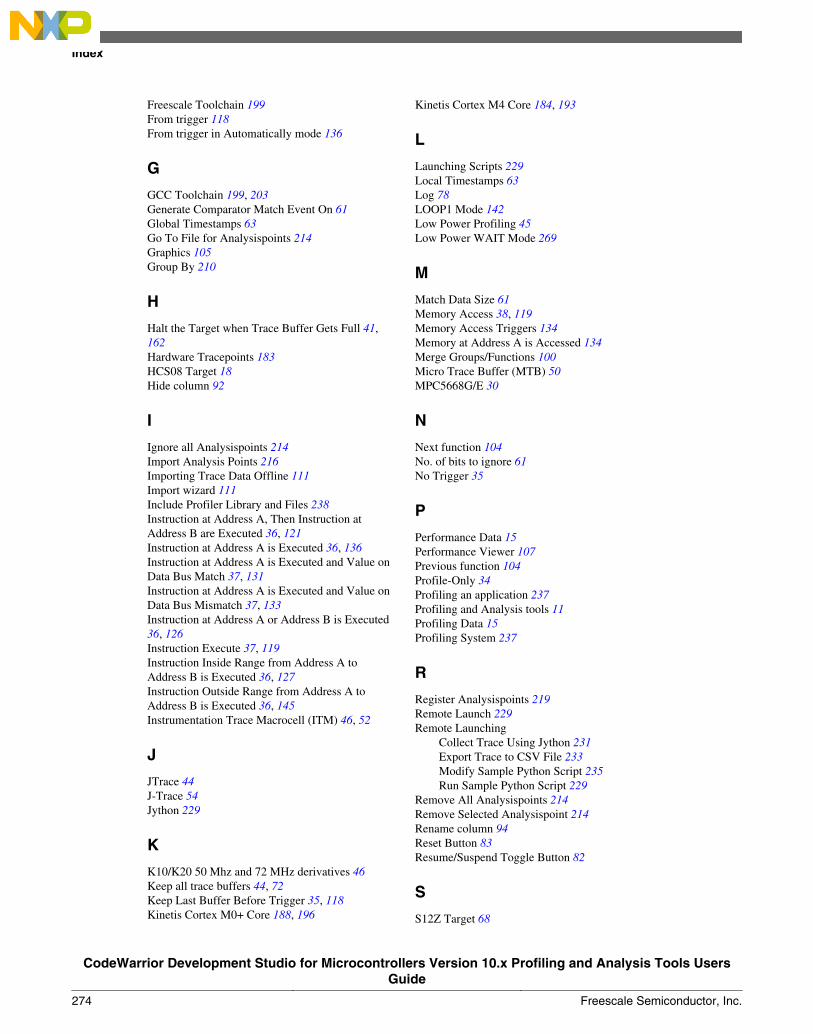
Freescale Toolchain 199From trigger 118From trigger in Automatically mode 136
G
GCC Toolchain 199, 203Generate Comparator Match Event On 61Global Timestamps 63Go To File for Analysispoints 214Graphics 105Group By 210
H
Halt the Target when Trace Buffer Gets Full 41,162Hardware Tracepoints 183HCS08 Target 18Hide column 92
I
Ignore all Analysispoints 214Import Analysis Points 216Importing Trace Data Offline 111Import wizard 111Include Profiler Library and Files 238Instruction at Address A, Then Instruction atAddress B are Executed 36, 121Instruction at Address A is Executed 36, 136Instruction at Address A is Executed and Value onData Bus Match 37, 131Instruction at Address A is Executed and Value onData Bus Mismatch 37, 133Instruction at Address A or Address B is Executed36, 126Instruction Execute 37, 119Instruction Inside Range from Address A toAddress B is Executed 36, 127Instruction Outside Range from Address A toAddress B is Executed 36, 145Instrumentation Trace Macrocell (ITM) 46, 52
J
JTrace 44J-Trace 54Jython 229
K
K10/K20 50 Mhz and 72 MHz derivatives 46Keep all trace buffers 44, 72Keep Last Buffer Before Trigger 35, 118Kinetis Cortex M0+ Core 188, 196
Kinetis Cortex M4 Core 184, 193
L
Launching Scripts 229Local Timestamps 63Log 78LOOP1 Mode 142Low Power Profiling 45Low Power WAIT Mode 269
M
Match Data Size 61Memory Access 38, 119Memory Access Triggers 134Memory at Address A is Accessed 134Merge Groups/Functions 100Micro Trace Buffer (MTB) 50MPC5668G/E 30
N
Next function 104No. of bits to ignore 61No Trigger 35
P
Performance Data 15Performance Viewer 107Previous function 104Profile-Only 34Profiling an application 237Profiling and Analysis tools 11Profiling Data 15Profiling System 237
R
Register Analysispoints 219Remote Launch 229Remote Launching
Collect Trace Using Jython 231Export Trace to CSV File 233Modify Sample Python Script 235Run Sample Python Script 229
Remove All Analysispoints 214Remove Selected Analysispoint 214Rename column 94Reset Button 83Resume/Suspend Toggle Button 82
S
S12Z Target 68
Index
CodeWarrior Development Studio for Microcontrollers Version 10.x Profiling and Analysis Tools UsersGuide
274 Freescale Semiconductor, Inc.
Save Results 79Search 104Select Default Working Set dialog box 212Select Trace Mode - ColdFire V1 41Set CPU Frequency 91Setting Data Analysispoints on Memory View 220Setting Data Analysispoints on Variables View 221Setting Hardware Tracepoints
From Source CodeKinetis Cortex M0+ Core 188Kinetis Cortex M4 Core 184
From Trace and Profile TabKinetis Cortex M0+ Core 196Kinetis Cortex M4 Core 193
Setting Register Analysispoints on Registers View221Setting Software Tracepoints 198Setting Trigger from Disassembly View 136Setting Trigger on Data and Memory 139Setting Triggers from Memory View 179Setting Triggers from Variables View 177Setting Triggers on Data and Memory 177Show code 105Show Full Paths 210Simple Profiler Data Viewer 13, 254, 255Software Analysis 13Software Analysis view 77Software Tracepoints 183Software Tracepoints Support dialog box 202, 207Stall Processor 58SWD 45SWO 45Synchronization 53Synchronization Packet Rate 64
T
Target 87Target PC Address
2 Bytes 413 Bytes 41
Time (CPU Cycles) 102Timeline 15, 94Timeline viewer
Edit Groups 97Full View 97Selection Mode 96Zoom Mode 96
Timeline ViewerConfigure Table 101
Timestamp 87Timestamp Event
A 60B 61Function 60Index 61
TPIU 45, 54
Trace All Branches 58Trace and Profile tab
ColdFire V1 40ColdFire V2-V4 72DSC 74HCS08 33Kinetis Cortex M4 core 44S12Z 70
Trace Buffer Size 47Trace Capture Device (TCD) 51Trace Data 14Trace data values
Read Data 42Write Data 42
Trace Data Viewer 86Trace Enable Event
A 60B 60Function 60Index 60
Trace Formatting SettingsContinuous Formatting 66Enable Formatting 66Stop on Flush Completion 66Stop on Trigger Event 66
Trace from Trigger A Onward 162, 163, 170Trace from Trigger A to Trigger B 162, 166, 173Trace from Trigger A to Trigger C 162Trace from Trigger B Onward 162Trace from Trigger B to Trigger A 162Trace from Trigger B to Trigger C 162Trace from Trigger C Onward 162, 177Trace from Trigger C to Trigger A 162Trace from Trigger C to Trigger B 162Trace is always enabled 162Tracelink 45Trace Mode Options - HCS08 34Trace Modes for ColdFire V1
Automatic (One-buffer) 41Automatic (One-Buffer) 170Continuous 41, 163Expert 41, 175Profile-Only 174Profile-Only Mode 41
Trace Modes for HCS08Collect Data Trace 34, 148Collect Program Trace
Automatically 34, 136Continuously 34, 121LOOP1 Mode 34
Expert 35, 156Profile-Only 155
Tracepoint 117Trace Port Interface Unit (TPIU) 54Trace Start/Stop Conditions
ColdFire V1 161HCS08 118
Trace Start/Stop Conditions - ColdFire V1 41
Index
CodeWarrior Development Studio for Microcontrollers Version 10.x Profiling and Analysis Tools UsersGuide
Freescale Semiconductor, Inc. 275
Trace Start/Stop Conditions - HCS08 35Trace Start/Stop Control
Start Resource 58Stop Resource 59
Tree View 256Trigger Control
A 59B 59Collect Trace about Trigger 59Collect Trace after Trigger 59Collect Trace before Trigger 59Function 59Index 59
Trigger Counter (no. of words) 67Trigger Settings 67Trigger Type 35
U
Ungroup columns 93Until trigger 119Until trigger in Automatically mode 136
V
Value to Compare on Data Bus 37Viewing Data
Call Tree 109Critical Code Data 101Performance Data 106Timeline 94Trace Data 85
Viewing Tracepoints 209View Profiling Results 254
W
Working Sets 211
Index
CodeWarrior Development Studio for Microcontrollers Version 10.x Profiling and Analysis Tools UsersGuide
276 Freescale Semiconductor, Inc.

How to Reach Us:
Home Page:freescale.com
Web Support:freescale.com/support
Information in this document is provided solely to enable system andsoftware implementers to use Freescale products. There are no expressor implied copyright licenses granted hereunder to design or fabricateany integrated circuits based on the information in this document.Freescale reserves the right to make changes without further notice toany products herein.
Freescale makes no warranty, representation, or guarantee regardingthe suitability of its products for any particular purpose, nor doesFreescale assume any liability arising out of the application or use ofany product or circuit, and specifically disclaims any and all liability,including without limitation consequential or incidental damages.“Typical” parameters that may be provided in Freescale data sheetsand/or specifications can and do vary in different applications, andactual performance may vary over time. All operating parameters,including “typicals,” must be validated for each customer application bycustomer's technical experts. Freescale does not convey any licenseunder its patent rights nor the rights of others. Freescale sells productspursuant to standard terms and conditions of sale, which can be foundat the following address: freescale.com/SalesTermsandConditions.
Freescale, the Freescale logo, CodeWarrior, ColdFire, ColdFire+,Kinetis, and Qorivva are trademarks of Freescale Semiconductor, Inc.,Reg. U.S. Pat. & Tm. Off. All other product or service names are theproperty of their respective owners. ARM and ARM Cortex-M0+ areregistered trademarks of ARM Limited.
© 2009–2014 Freescale Semiconductor, Inc.
Document Number CWMCUSWAUGRevision 10.6, 02/2014