Embed Size (px)
Citation preview

6ANALYSIS
8COUNTRY RANKING 12SECTOR RANKING
16EMPLOYMENT IN CEE
20CEE TOP 500 RANKINGpowered by InfoIcon 42ECONOMIC OUTLOOKby Grzegorz Sielewicz, Regional Economist CEE
COFACE CEE TOP 500RANKING
ALL OTHER COFACE PUBLICATIONS ARE AVAILABLE ONhttp://www.cofacecentraleurope.com/News-Publications
SEPTEMBER 2019
COFACE PUBLICATIONS
CONTENT
qui est w
The 11th edition of the CEE Top 500 – CEE region establishes itself as a role model for emerging markets.

COFACE PUBLICATIONS CEE TOP 500 COMPANIESRANKING
3
qui est w
I would like to welcome you to the CEE Top 500 ranking, our annual publication on the biggest companies in the Central and Eastern European region. The analysis has now been published for the eleventh year in a row and has established itself as a major source of information for businesses located in CEE or dealing with the region.
The CEE Top 500 study has always reflected the region’s economic development. And this year, the trend continues to be very positive. Compared to other emerging markets, CEE is often treated as a safe haven. The reasons are quite obvious. GDP growth rates increased by 4.6% and 4.3% in 2017 and 2018, which is the highest level since 2008. Growth was mainly driven by higher private consumption, increasing fixed asset investments and exports. The positive business environment led to a drop of the GDP-weighted average insolvencies by 4.2% in 2018 in contrast to the increase of proceedings in the previous year.
Especially for large companies, business conditions in 2018 were supportive in the CEE region, as confirmed by the CEE Top 500 ranking. The overall turnover increased by a solid 9.6% to 698 billion euros, with 394 (78.8%) of the listed businesses having recorded revenue growth. The improvement continued to be fueled by the oil & gas sector, the automotive and non-specialized trade.
But nevertheless, caution is advised. On the one hand, the economic development in Western Europe, the main trading partner of CEE countries, has started to slow down, thus weakening CEE exports. However, they still have remained positive, mainly due to the region’s price and quality competitiveness. On the other hand, low unemployment has triggered labor shortages, which have become a main barrier to companies in both daily operations and potential expansion. Growing wages have increased companies’ operational costs, reducing profits despite soaring revenues. For businesses trading with CEE, it is now even more important to monitor further progress in the region.
To effectively explore opportunities in the region, an ongoing analysis as well as market and economic expertise are critically important. With more than 70 years of experience and the knowledge of our analysts and economists, Coface has the competence to provide in-depth studies, analyses and country risk assessments. Today, Coface has the biggest geographical footprint both in Central and Eastern Europe and worldwide, and is helping companies in more than 200 countries to mitigate their risk.
We invite you to read our latest study and stay up to date on the Top 500 companies in Central and Eastern Europe.
Declan DalyCEO Coface Central & Eastern Europe
A WORD FROMDECLAN DALYCHIEF EXECUTIVE OFFICER CENTRAL & EASTERN EUROPE

CEE TOP 500 RANKING KEY FIGURES
95 companies minerals, chemicals,
petroleum, plastics & pharma
175 companiesfrom Poland - No. 1
EUR 698 billion turnover in 2018
68.599insolvency cases
EUR 1.4 billionaverage turnover
4.7% in Serbiahighest insolvency rate
0.05% in Poland lowest insolvency rate
209 companiesmoved up the ranking

COFACE PUBLICATIONS CEE TOP 500 COMPANIESRANKING
5
COFACEYOUR BUSINESS PARTNER IN CEE
93% client recommendationin trade credit insurance
145 million companies
worldwide available online
around 700employees in CEE
No. 2 positionfor company information
66 countriescovered online
30 yearsof experience in CEE
Info
rmat
ion
in C
EE
Co
face
in C
EE

COFACE CEE TOP 500ANALYSIS

COFACE PUBLICATIONS CEE TOP 500 COMPANIESRANKING
7
The Central and Eastern European region experienced continued favorable economic activity in 2018. Similar to 2017, GDP growth was also solid in 2018, with average growth rates in the region soaring to 4.6% and 4.3% respectively – the highest rates since 2008. Compared to other emerging markets, this region is often treated as a safe haven. The CEE economic acceleration was predominantly due to increasing internal demand, with households benefiting from favorable trends on the labor market, such as significantly shrinking unemployment rates over the last five years. The CEE recorded a lower unemployment rate than the EU at the end of 2018: while the EU’s average unemployment rate stood at 6.6%, CEE unemployment rates dropped even lower, with the Czech Republic (2.1%), Hungary (3.7%), Poland (3.8%) and Romania (4.0%) having the lowest levels in the region. In parallel with increasing employment, households also benefited from solid wage growth, which contributed to an increased propensity to spend. Finally, yet just as importantly, although activity in Western Europe – the main trading partner of CEE countries – has been slowing down, CEE exports have weakened but remained positive, in large part due to the region’s price and quality competitiveness.
Despite these positive developments, CEE companies have also experienced some trouble. Low unemployment has triggered labor shortages, which have become the main barrier to companies in both daily operations and potential expansion, as reported by an increasing number of businesses over recent years. Growing wages and a pressure for further hikes has increased companies’ operational costs, reducing profits despite soaring revenues. At the same time, increasing wages have not reduced household price sensitivity, and companies have been unable to transfer all cost increases to consumers. Margins are also constrained due to high levels of competition across various sectors.
A period of accelerated demand has affected the solvency of companies in the CEE region. GDP-weighted average insolvencies dropped by 4.2% in 2018, contrary to an increase in proceedings recorded in 2017. Dynamics, however, vary widely across the region and insolvent companies included mostly small and medium-sized enterprises that were unable to benefit even in a favorable macroeconomic environment.
The top remains almost the same
CEE – SOLID ECONOMIC ACTIVITY DESPITE INCREASING EXTERNAL RISKS1
Business conditions were supportive for companies in the CEE region, especially those large firms as confirmed by the CEE Top 500 ranking. Following a series of Country Assessment upgrades in 2017, Coface upgraded Croatia and Slovakia in 2018.
The results of the 2018 ranking of the region’s largest companies reveal that the majority of companies were taking advantage of the continued favorable economic environment. The CEE Top 500 outlines the economic situation at the 500 largest companies in Central and Eastern Europe measured by turnover. Overall turnover at the top 500 companies increased by a solid 9.6% to EUR 698 billion. While 394 (78.8%) of the listed businesses recorded revenue growth (versus 80% in 2017 and 63% in 2016), only 21.2% stagnated or faced a drop. Average turnover increased to EUR 1,396 million compared to last year’s EUR 1,274 million. However, the battle for the top spot is getting tougher. In our edition of the CEE Top 500 companies in 2010, the minimum revenue for a company to qualify for the ranking was EUR 354 million, increasing to EUR 479 million this year (+35.3%).
Aggregated net profits amounted to EUR 29,939 million (-1.6% compared to the previous year) and employment at the 500 largest companies averaged 2.4 million people (+0.4%).
Coface’s online platform InfoIcon is the basis of the financial data used for this study and also provides individual company credit assessments. The @rating score indicates
Analyses show that the favourable economic environment was beneficial for the region’s 500 largest businesses, which translated into higher revenues. However, various challenges caused net profits to decrease. Competition is getting more intense and a higher turnover is required to be classified in the ranking compared to previous years.

COFACE PUBLICATIONS CEE TOP 500 COMPANIESRANKING
8
the probability of default for the company within 12 months of the date the score was set with values from 0 (Insolvency/preliminary/debt regulation proceedings) to 10 (Excellent risk). The average score for all 500 listed companies reflects a very low risk with a value of 6.5. Only 1% has a score of 3 or less indicating a very high risk of default. The vast majority of players (76.4%) show a very sound financial basis (score of 6+). Lithuanian companies rank among the best with an average of 7.4, while Estonian representatives score lowest with 5.2.
The top 4 companies are well known from previous rankings. PKN Orlen remains unbeaten at the top with a turnover of 15%, i.e. high growth but lower than the 19.9% recorded in the previous year. Czech Skoda Auto (2nd), the multinational oil and gas company MOL Hungary (3rd) and retailer Jeronimo Polska (4th) defended their positions from last year, all with increases in revenue.
Automotive remains strong in the top 10 with Skoda Auto (2nd), Volkswagen Slovakia (5th) and Audi Hungaria (7th) as well-known representatives, demonstrating how crucial this sector has become in the CEE region. Compared to the previous year, Volkswagen Slovakia moved up two places in the ranking thanks to a robust increase of turnover of 37.5%. Audi Hungaria also recorded an increase in revenues, but just a slight 1.1%.
There is only one newcomer in the top 10: Czech Alpiq Energy SE (10th), an electricity trading company. In a previous ranking, it came very close to the top, reaching 11th place. Although the company’s turnover increased by a modest 1.4%, it managed to join a group of the largest companies in the CEE region. Otherwise, Eurocash, which operates franchise store chains across Poland, fell 3 positions and was unable to remain in the top 10 this time.
Alpiq Energy SE isn’t the only representative of utilities & public services in the top 10. Polish state-controlled PGNiG (6th) dropped one position this year, while PGE Polska moved from 10 to 9.
Let the stars shine - Top performers
Some companies are worth highlighting for having outperformed their competitors and proved more successful in 2018. Here are the stars of this year’s ranking:
Ford Romania (66) invested in plant capacity; it produces the EcoSport model and delivered almost 142,000 units last year. The figure is three times higher than in the previous year when the plant produced the B-Max model. Turnover exploded by 118.7% and net profits rose by 84.8% in 2018. As a result, Ford Romania moved up 115 places in the ranking. Another company related to the automotive sector with top results is Slovak Faurecia, which manufactures parts and accessories for motor vehicles. Its competitive production and demand from various car brands increased the company’s turnover by 49.6%, with net profits soaring by 174.2%.
The Polish Hermes Energy Group (205) operates in the energy sector and already recorded a high rate of revenue growth in our previous ranking when the company was a newcomer. Further growth in turnover was supported by business expansion and the acquisition of two energy companies. In 2018, turnover increased by 108.2% and Hermes Energy Group moved up 234 places.
Saksa Ltd. (234) is a major wholesale supplier of fuel and services to the fuel business in Bulgaria. The company cooperates with partners leading fuel station brands in Bulgaria and is also developing its retail division under the Cruise brand. Saksa’s turnover increased by 57.1% and net profits rose by 43.2% in 2018.
COFCO International Romania (252) is a subsidiary of the Chinese group COFCO International (which took over Nidera and its operations in Romania in 2016). It is a grain trader and therefore holds the leading position in the local trading market. Its turnover rose by 50.2% in 2018.
In 2018, economic activity in the CEE region continued the solid expansion that started in 2017. That was especially the case for Poland, Hungary and Latvia, which recorded GDP growth rates close to or even exceeding 5%. Nevertheless, a number of countries suffered from a weaker pace of growth, mostly in Romania, Estonia and Bulgaria. Despite this variety of results, economic growth in the CEE region remained solid. The region’s
Overall, 2018 was an advantageous year for CEE countries and the largest CEE companies. Local differences remain, however, with four countries dominating the ranking - but others are catching up.
average growth lowered slightly from 4.6% in 2017 to 4.3% in 2018. Growth was mainly driven by higher private consumption, increasing fixed asset investments as well as exports, which were less dynamic than before but still expanded despite the Eurozone slowdown.
COUNTRY RANKING2

4.
3.
1.
@rating score 2017 2018
Chart 1:Coface CEE Top 500:Number of Top 500 companies per country
71 71
56 61
15 14
10 10
17 20
43 37
67 60
175 175
19 21
6 7
7 11
Ø 6.8
Ø 5.9
Ø 5.6
Ø 6.7
Ø 7
Ø 6.9
Ø 6.2
Ø 6.1
Ø 7.4
Ø 6
Ø 5.2
14 13Ø 7.4
For assessments of individual companies visit our online
platform InfoIcon:
http://icon.cofacecentraleurope.com/
InfoIcon

COFACE PUBLICATIONS CEE TOP 500 COMPANIESRANKING
10
Concerning the above mentioned macroeconomic conditions, there were several countries that succeeded in getting more businesses into the ranking. Polish players once again dominate the CEE Top 500 (35.0% of all companies), undoubtedly benefiting from the highest GDP growth rate in the region, which reached 5.1% in 2018. GDP growth was slightly lower in Hungary (4.9%) and one percentage point lower in Romania (4.1%), which took positions 2 and 3 in the country ranking in terms of the number of companies. The top 3 are home to 61.4% of all companies, have the highest average turnover, which translates into the largest companies in CEE, and are therefore responsible for 64% of the total turnover in the ranking.
The vast majority of companies (73.4%) come from just four countries: Poland (35.0%), Hungary (14.2%), Romania (12.2%) and the Czech Republic (12.0%). Half of the countries were able to increase their share in the ranking. There were five more Romanian companies this time compared to last year and others catching up including Bulgaria (+3), Serbia (no change), Lithuania (+2), Estonia (+4) and Latvia (+1). Among the remaining six countries, the Czech Republic and Slovakia recorded the highest drop in the number of companies in the ranking, decreasing by 7 and 6 entities respectively.
And the winner is...
The number 1 in both the company ranking and the country ranking has been in Polish hands for years. The country is home to the largest businesses in the region (average turnover of EUR 1.1 billion) with an aggregated turnover growing from year to year. The success of the country’s top players is based on several factors: The corporate sector has benefited from an acceleration in economic activity, which was already strong in the previous year (GDP growth of 4.8% in 2017). Poland is the largest country in the region with the biggest number of inhabitants, i.e. a potential consumer base for companies. While household consumption and fixed asset investments grew, Polish companies were also active on foreign markets. In 2018, the country’s exports surged by 7% measured in euros.
Despite all this – 175 Polish companies is exactly the same number of entities recorded in the previous year – they were able to generate a higher turnover. Polish businesses earned over EUR 275.3 billion in 2018, making the country the undisputed winner in terms of both the number of companies and the turnover generated. Aggregated revenues rose by 9.1%, although rising costs and low margins caused net profits to decrease (-5.7%). The average Coface Company Assessment value is 6.2, which represents a good average.
Poland is the country in the ranking with the most diverse industrial structure. There is no single sector that is dominant within the top players, although minerals, chemicals, petroleum, plastics & pharma remains the largest when it comes to total number (17.7%) and turnover (26.0%). Coming second...
Hungary regained its second place. It is also home to the second largest number of companies in the ranking, i.e. 71. This is exactly the same number of companies from Hungary that were included in the previous ranking. In 2018, Hungarian companies generated a solid increase in turnover, but profits soared even higher, namely by 14.3%. The country’s largest businesses are also amongst the best-rated ones, with an average Coface @rating score of 7.0.
Investments in Hungary surged again in 2018 after a big increase in 2017, including capacity upgrades in manufacturing (e.g. automotive, IT). Businesses benefit from a corporate tax rate of 9%, the lowest rate in Europe. This measure mainly benefits mid-sized Hungarian and foreign-owned companies with more than
EUR 2 million in revenue. Effective tax rates for large foreign multinationals in Hungary, e.g. German car manufacturers, had already been heavily reduced through subsidies and tax concessions. Those trends clearly had an impact on the composition of the Hungarian top players: the automotive & transport industry plays a key role, rising to 25.4% of all Hungarian businesses in the ranking with well-known names (like Audi, Mercedes, Continental, Porsche,...) from just 16.1% in 2013 and 8.4% in 2009. Together they earned 24.4% of the aggregated revenue. The second most important sector in Hungary is electronics, information & telecommunications with 15 (21.1%) companies contributing a turnover of EUR 19.2 billion (18.5%). Oil & gas giants come third in terms of the number of businesses (11, 15.5%), but first in terms of revenue (25.9% or EUR 26.8 billion). MOL Hungary alone generates more than half of this (EUR 16.1 billion, +25.1%).
The third place goes to...
Finally, the third spot on the podium goes to Romania, which is home to 61 top players in CEE. The country’s share in the ranking rose the most, delivering five more companies than previously. However, an aggregated revenue of EUR 69.4 billion in 2018 is less than that of Czech companies, which are ranked 4th by number of companies. Nevertheless, turnover growth of Romanian companies was relatively high at 14.3% and net profits went up by 12.7%. On the other hand, Romanian players are still amongst the smaller ones in the ranking, with an average turnover of EUR 996 million. For example: although Latvian and Lithuanian businesses are less represented in the ranking, they earned on average EUR 1,046.1 million and EUR 1,052 million respectively. But Romanian players are catching up with an above-average increase in revenues (14.6% compared to the average of 12.3%).
The automotive & transport industry has been becoming more important for the Romanian economy and its top companies. It accounts for the biggest number of companies (13 or 21.3%). Further investments, increasing capacities and a strong demand for cars supported increasing turnover in the sector. This is due to the excellent sales dynamics of Dacia cars as well as increased production at Ford Romania, which is one of the biggest movers in the ranking overall. In the last ten years, Romania has nearly doubled its yearly production of vehicles.
And then there are...
The fourth most significant country is the Czech Republic. It is ranked 4th in terms of the number of companies, although according to aggregated turnover it would be ranked in 3rd place. Compared to the previous year, revenues of the Czech Republic’s largest companies increased by 5% and net profits soared by 15.5%. Czech businesses are very strong when it comes to turnover. Indeed, they lead the overall ranking in terms of average turnover, reaching EUR 1,505 million more than the EUR 1,442 million generated by Polish entities. However, the average Coface @rating score for the ranked businesses is 6.1, which is below the CEE average.
The automotive & transport industry was traditionally strong in the Czech Republic’s top companies included in the study. It accounts for a quarter of companies and 35% of Czech companies’ turnover. The country produced the highest number of vehicles among CEE countries: 1,345,000 passenger and commercial vehicles in 2018. The minerals, chemicals, petroleum, plastics & pharma sector is ranked second according to the number of companies and their turnover, reaching 18.3% and 17.3%, respectively.

COFACE PUBLICATIONS CEE TOP 500 COMPANIESRANKING
11R
AN
K
CO
UN
TR
Y
NO
. OF
LIS
TE
D
CO
MPA
NIE
S
TU
RN
OV
ER
IN
EU
R M
ILLI
ON
S
NE
T P
RO
FIT
IN
EU
R M
ILLI
ON
S
EM
PLO
YM
EN
T
CO
FAC
E
ASS
ESS
ME
NT
2018
PO
PU
LAT
ION
(IN
M
ILLI
ON
S)
GD
P P
ER
CA
PIT
A
(IN
EU
R)
GD
P G
RO
WT
H
(IN
%)
INF
LAT
ION
(I
N %
)
UN
EM
PLO
YM
EN
T
RA
TE
(IN
%)
LAB
OR
FO
RC
E
(IN
MIL
LIO
NS)
1 Poland 175 275,331 10,032 1,178,946 A3 38.0 12,900 5.1 1.2 3.9 16.1
2 Hungary 71 103,725 5,979 278,556 A3 9.8 13,500 4.9 2.9 3.7 4.4
3 Romania 61 69,461 3,197 231,410 A4 19.5 10,400 4.1 4.1 4.2 8.3
4 Czech Repulic 60 94,813 5,746 252,106 A2 10.6 19,600 3.0 2.0 2.2 5.1
5 Slovakia 37 53,115 2,138 112,319 A2 5.4 16,600 4.1 2.5 6.5 2.5
6 Lithuania 21 26,052 750 168,277 A3 2.8 16,100 3.5 2.5 6.2 1.3
7 Bulgaria 20 21,585 195 25,981 A4 7.1 7,800 3.1 2.6 5.2 3.1
8 Slovenia 14 18,296 398 31,238 A3 2.1 22,200 4.5 1.9 5.1 1.0
9 Croatia 13 11,099 597 33,215 A4 4.1 11,900* 2.6 1.6 8.4 1.6
10 Estonia 11 7,068 293 28,456 A2 1.3 19,500 3.9 3.4 5.4 0.6
11 Serbia 10 10,259 427 71,865 B 7.0 6,100 4.3 2.0 12.7 2.7
12 Latvia 7 7,435 187 17,870 A3 1.9 15,300 4.8 2.6 7.4 0.9
In 2018, the largest 500 companies outperformed the average GDP of the region. Revenues grew considerably by 9.6%.
Slovakia has climbed steadily up the ranking. Although its turnover increased by a solid 9.5% to EUR 53.1 billion, net profits dropped by 21.8%. Similar to its neighbour – the Czech Republic – automotive is strongly represented by the largest companies in the country. An even deeper reduction in total net profits than that in Slovakia was seen in three countries: Serbian businesses belong to this group (-31.5%) together with Latvia (-58.8%) and Bulgaria (-75.2%). Further down the ranking we find Lithuania in 6th place with 21 companies (+2) followed by Bulgaria (20 companies, +3), Slovenia (14, -1), Croatia (13, -1), Estonia (11, +1) Serbia (10, +3), and taking up the rear, Latvia (7, +1). Only 15% of the total CEE Top 500 turnover comes from these countries. However, the ranked Lithuanian and Croatian businesses have the strongest average @rating score of 7.4.The Bulgarian, Serbian, Croatian and Estonian businesses in the ranking are among the smallest in the region, with an average turnover of less than EUR 1 billion. Yet they represent the largest in their home nations. For a more detailed overview of the largest companies of these smaller economies, we recommend reading the ranking of the Coface Baltic Top 50 and Coface Adriatic/Balkan Top 50 companies including Macedonia and Montenegro, which can be found online at www.cofacecentraleurope.com/News-Publications.
Table 1:Coface CEE Top 500:Country Overview
*2017

COFACE PUBLICATIONS CEE TOP 500 COMPANIESRANKING
12
This year’s increase in aggregated turnover was driven by all industries. The chief contributors in absolute figures were energy, automotive as well as trade, which were also the most numerous in the sector ranking. However, net profits developed positively only for some sectors, with rises of between 4.6% (wood & furniture) and 41.9% (non-specialized trade). The highest overall gains were made by minerals, chemicals, petroleum, plastics & pharma (EUR 9.0 billion). Meanwhile, the construction sector was again the one that struggled the most, with a net loss of -146.0%, despite revenues increasing by 10.6%. The six construction companies (exactly the same number as in the previous ranking) were also rated the lowest by Coface, with an average @rating score of 6.0.
Pole postion for Oil & Gas
The minerals, chemicals, petroleum, plastics and pharma sector has traditionally been the largest in the CEE Top 500 ranking, but was displaced from first place in the previous ranking by the automotive and transport sector (in terms of both total number of companies and turnover). This time, it is back to number one. In the first three quarters of 2018, it benefited from increasing oil prices. Rising tensions and concerns over world trade caused oil prices to decrease in the last months of 2018. However, supply cuts by OPEC and its allies kept prices above the lows recorded in 2016. Moreover, CEE companies in the sector mostly do business in the downstream segment, i.e. the refining and processing of oil and gas. They were therefore able to adapt their refining margins and did not suffer much from the decline in the price of black gold.
Consequently, oil and gas companies accelerated their revenues (+14.5%) in 2018, once again leaving the sector with the highest average turnover (EUR 1.7 billion) and top of the ranking by turnover (EUR 174.7 billion). However, net profits dropped by 6.4% to EUR 9.0 billion in 2018. Despite that, the number of companies in the Top 500 increased over the year to 95 (a share of 19.0%), compared to 91 (18.2%) in 2017 and 92 (18.4%) in 2016, but lower than 111 (22.2%) in 2015. It was also the industry with the most companies moving up (43 or 45.3%) and five new entries (5.3%). However, 40 businesses also had to give way (42.1%) to competitors from
Oil & Gas made its comeback as the leading sector of the top 500.
SECTOR RANKING3
other industries. The average @rating score is also slightly higher than the average: 6.6.
A u t o m o t i v e & t r a n s p o r t
sector takes second p lace
Automotive & transport lost its leader position of last year. 93 companies (18.3%) gives the sector second place, although it recorded the largest decrease in the number of businesses, which dropped by eight companies in a single year. Despite that, revenues of automotive and transport companies increased (+7.6%), while net profits slumped (-11.7%). The weaker results of the automotive and transport sector compared to the previous year reflect the global downturn of the sector. It is suffering from the cyclical slowdown, increased protectionism and structural industrial changes, including investments into innovations and changes in consumption behaviour. The sector’s deterioration is having knock-on effects on Western Europe countries, such as Germany, where automotive production has been significantly contracting. This poses a direct risk for CEE companies, as Germany is the main trading destination for most CEE countries, and the automotive industry has become a pillar of exports. On the other hand, CEE countries and their automotive sector still offer attractive labour cost levels, especially when compared to Western Europe. This, coupled with the high quality of labor, is boosting the region’s competitiveness
The three key sectors represented by the largest companies in the region continue to account for almost 60% of the revenue generated. The traditional backbone of the top 500 - the regional oil and gas giants - are again the leading sector.

COFACE PUBLICATIONS CEE TOP 500 COMPANIESRANKING
13
Chart 2: Coface CEE Top 500:Turnover per sector in EUR billions
2017 2018
MINERALS, CHEMICALS, PETROLEUM,
PLASTICS & PHARMA
OTHERS
AUTOMOTIVE & TRANSPORT
NON-SPECIALIZED TRADE
UTILITIES & PUBLIC SERVICES
ELECTRONICS AND INFORMATION &
TELECOMMUNICATIONS
AGRICULTURE, MEAT, AGRI-FOOD & WINES
METALS
MECHANICS & PRECISION
CONSTRUCTION
WOOD & FURNITURE
PAPER, PACKAGING & PRINTING
TEXTILE, LEATHER & CLOTHING
153 175
94101
8390
6971
2426
67
55
45
33
56
129 139
4247
2024

COFACE PUBLICATIONS CEE TOP 500 COMPANIESRANKING
14
and, combined with a sizeable stock of foreign direct investments in the region in recent years, is allowing manufacturing to keep on growing. It is likely that the current global slowdown and the ongoing uncertainties will be less severe for CEE countries than other regions and the region will remain a location for competitive production. Despite the industry losing its leading position among the biggest companies in CEE, it is still the dominant one in the five countries included in this ranking with a share of 20% and even more of all top companies: Hungary (25.4%), Czech Republic (25.0%), Slovakia (24.3%), Romania (21.3%) and Serbia (20%). In the Czech Republic and Slovakia, the total share of the countries’ turnover demonstrated even stronger dominance (35.1% and 44.8% respectively). The average @rating score is highest for companies in Slovenia (8.0) and Hungary (6.9) and lowest in Poland (5.8), leaving the industry with an average value of 6.5.
Non-specialized tradeIn 71 companies, the non-specialized trade sector receives third place. That is exactly the same rank and number of companies as
in the previous ranking. Poland – the biggest consumer market in the CEE region – is home to the biggest share (36.6%) and also the largest players: retailer Jeronimo Martins Polska and Eurocash. Like last year, the main driving force of CEE growth was household consumption, which accelerated further in 2018 thanks to decreasing unemployment and growing wages. This positive impact of solid demand is dwarfed by the difficulties experienced by this sector: increasing wages of employees and labour shortages paired with a still price-sensitive client base and high competition are exerting pressure on margins. Nevertheless, turnover of the largest businesses in the industry rose to EUR 101.1 billion (+7.7%) and large companies’ bargaining power and adaptation to rising costs enabled them to also record higher net profits (+41.9%). The average @rating score is 6.6, with the weakest companies being based in Slovenia and Estonia and the strongest ones in Croatia, Lithuania and Hungary.
Further down the sector ranking
Similar to the non-specialized trade sector, electronics, information & telecommunications profited from the rise in household consumption. Accelerating consumer spending was recorded in both durable and non-durable goods. Moreover, difficulties filling vacancies encouraged higher automation in companies, which supported higher usage of IT services. With 65 companies (-1 compared to the previous ranking), it remains the fourth largest sector. Net profits decreased slightly by 0.4%, indicating greater pressure on margins than previously. The Coface average @rating score amounted to 6.8. Although the industry’s revenues increased by 2.1% to EUR 70.8 billion in 2018, utilities & public services held on to fourth place in terms of turnover generated (EUR 90.1 billion; +8.9%). Utilities & public services reported the biggest increase in companies represented (+7), with 13 new entries. It remains a very strong industry in terms of turnover. The average increased again compared to last year from EUR 1,427 to EUR 1,553 million, i.e. by 8.9%. 2018 was a year of increasing fixed asset investments in a number of countries, mostly in the public sector. The largest companies in this sector can be found in Poland, the Czech Republic and Bulgaria. The industry held the highest shares in Croatia (30.8%) and Serbia (20.0%), where it dominates the largest players on the local market. As the growth of fixed asset investments was less dynamic than in 2017, utilities and public services companies were unable to generate higher net profits again, with the latter dropping by 15.9%.
The major industries covered so far represent above 82% of all ranked companies and 82.5% of the aggregated revenues, highlighting their importance in the region. Nevertheless, the smaller sectors also underwent some very interesting developments in 2018:
The rising turnover for CEE Top 500 has been driven by all sectors but most of them recorded lower profits.
Low Risk Medium High Risk Very High
Find more regions on:www.cofacecentraleurope.com/Economic-analysis
13 MAJOR SECTORS WORLDWIDECoface assessments are based on 70 yearsof Coface expertise. Financial data published by listed companies from 6 geographical regions 5 financial indicators taken into account:turnover, profitability, the net debt ratio, cashflow,and claims observed by our risk managers
COFACE ASSESSMENTS FOR CEE

COFACE PUBLICATIONS CEE TOP 500 COMPANIESRANKING
15
Chart 3:Coface CEE Top 500:Number of Top 500 companies per sector
AUTOMOTIVE & TRANSPORT
MINERALS, CHEMICALS, PETROLEUM, PLASTICS & PHARMA
NON-SPECIALIZED TRADE
ELECTRONICS, INFORMATION & TELECOMMUNICATIONS
TEXTILES, LEATHER & CLOTHING
PAPER, PACKAGING & PRINTINGCONSTRUCTION
MECHANICS & PRECISIONMETALS
OTHERS
AGRICULTURE, MEAT, AGRI-FOOD & WINES
UTILITIES & PUBLIC SERVICES
65
2
95
93
71
58
48
23
217
6 6
19%
18.6%
14.2%
13%
11.6%
9.6%
4.6%
4.2%1.4%
1.2%
WOOD & FURNITURE
51%
1.2%
0.4%
Number of Top 500 companies
The 6th ranked sector agriculture, meat, agri-food & wines contributed 48 businesses but only 6.7% of total turnover (+11.2%). However, the sector’s share in the ranking rose the most by delivering five more companies than in the previous year. Furthermore, the sector recorded a high increase in net profits of 39%. Poland and Romania are home to the sector’s largest companies.
The metals sector is more widely represented this time with an additional four more companies compared to the previous year. With an increase of 9.1%, revenues of 21 companies listed in the ranking rose to EUR 25.9 billion. Turnover growth in the smallest sector (two companies) of textiles, leather & clothing exceeded the average
and soared by +13.8% in 2018, benefiting from higher consumer spending, although net profits fell by 1.9%.
The best rated industries of the CEE Top 500 are very small ones:Wood & furniture and paper, packaging & printing have only five and six representatives, respectively, in the ranking, but these companies provide a very sound financial basis and an average @rating score of 7.3 and 7.2 respectively. Both industries improved turnover with double-digit dynamics, and net profits were also higher compared to the previous year: +22.0% for paper, packaging & printing and +4.6% for mechanics & precision.

COFACE PUBLICATIONS CEE TOP 500 COMPANIESRANKING
16
The labour market in CEE continued its improvement in 2018. Unemployment reached record-low levels in many countries. After an already very low 2.9% in 2017, the Czech Republic again reported the lowest unemployment rate both in the region and in the entire European Union with 2.2%. Hungary came closest to this with 3.7% in 2018, followed by Poland and Romania (3.9% and 4.2% respectively). The latter two are also the countries that contributed the largest workforce in the region with 16 and 8 million people respectively. Unemployment remained below the EU average (6.8%) in nine out of twelve countries in 2018. Latvia (7.4%) exceeded it slightly.
EMPLOYMENT AND THE LABOR MARKET IN CENTRAL AND EASTERN EUROPE4
Once again, it was the countries in South-Eastern Europe where unemployment reached the highest levels in the region. Serbia and Croatia had very high unemployment rates in the past which have fallen significantly over the last few years. The Croatian and Serbian labor markets improved further with the biggest decrease in Croatia (-2.6 percentage points) compared to 2017. In 2013, Croatia hit 17.4% and continuously reduced this to 8.4% in 2018. Its neighbor Serbia faced an incredible 25% in 2012 and is now down at 12.7% (-0.8 percentage points).
The largest companies have been very important employers in the region in the past. The labour market in CEE is getting tighter and it is has become more difficult to hire qualified staff. Total staff numbers increased just slightly by 0.4% in 2018.

COFACE PUBLICATIONS CEE TOP 500 COMPANIESRANKING
17
Chart 4: Coface CEE Top 500:Number of employees in the Top 500 companies by country compared with the national labor force
2017 2018
LITHUANIA
POLAND
HUNGARY
SLOVAKIA
CZECH REP.
ESTONIA
SLOVENIA
CROATIA
ROMANIA
SERBIA
LATVIA
BULGARIA
11.2%12.8%
2.1%2.1%
0.9%0.9%
2.1%2.1%
2.7%2.7%
2.7%2.8%
3.4%3.3%
4.4%4.5%
4.6%4.6%
4.7%4.9%
6.2%6.4%
7.6%7.3%

COFACE PUBLICATIONS CEE TOP 500 COMPANIESRANKING
18
The positive overall development of the labour market in CEE led to higher wages and improving consumer confidence, which in turn made household consumption a very important pillar of the economic expansion. However, this also has a drawback: Low unemployment is triggering significant labour shortages, which are reported by a rising number of companies as a barrier to their business operations in many CEE countries. It is getting more difficult to hire qualified staff. Increasing wages are also putting pressure on some of the companies; this was partly offset by an influx of foreign workers (e.g. Ukrainians in the various Polish industries).
The Top 500 as employers The largest companies in CEE increased staff figures by 0.4% to 2.4 million in 2018. Or to put it differently: 5.1% of the total CEE labor force works for one of them, which is slightly more than in 2017 (4.8%) and further proof of how important these players are for the labour market in CEE.
Lithuania remains at the top of the list when it comes to the total percentage of the labor force employed by the largest companies in the country (12.8%), followed by Poland (7.3%) and Hungary (6.4%). A decline in employment at the largest companies was reported in five countries: Croatia, Slovenia (both -0.7 percentage points), Estonia (-0.8 percentage points), Latvia (-2.0 percentage points) and Poland (-3.5 percentage points). In all other countries, this year’s top players further highlighted their position as important employers in the region, with the highest increases in Lithuania (+16.3 percentage points) and the Czech Republic (+4.7 percentage points) compared to last year’s 500 largest companies.
In absolute figures, Poland is home to both the largest population and consequently the largest workforce in the region. However, almost 49% of all Top 500 employees work for Polish companies, whereas only 35% of all companies are Polish. Hungary comes second and lags far behind with only 11.5% of all Top 500 staff, followed by the Czech Republic (10.4%) and Romania (9.5%). The largest employers in the region are consequently also Polish companies: retailer Jeronimo Martins Polska (ranked 4th, 66,300 people), Poczta Polska (ranked 111th, 80,800) as well as Lithuanian Vilniaus Prekyba UAB (ranked 21st, 43,900). The overall 0.4% increase in staff in CEE was driven by almost all countries and industries in the ranking. The countries with the highest headcount expanded even further, with Poland (+6.0%) and Hungary (+5.0%) reporting a higher than average rise. Only in three countries did the total number of employees fall: Lithuanian top players kept their base almost the same (-0.04%), while the top players in the smaller countries of Bulgaria and Latvia both released 1.7% of their staff.
Employment by industry
One of the reasons for the high proportion of employees at Polish players is the large share of Polish retailers listed in the final Top 500 ranking. Retail is highly staff-intensive. The non-specialized trade sector hired even more people (+2.2%) and employed a total of 0.6 million (23.6%) in 2018, making it the largest industry within the ranking in terms of employees. Automotive & transport had the second-largest staff base within the CEE Top 500 ranking (17.5%) and the industry was an active recruiter in 2018 with a rise of 4.3%. The top 5 largest industries employed over 80% of the total Top 500 staff in 2018.
However, the industries with the highest average turnover are ranked only fourth and second in terms of headcount. The minerals, chemicals, petroleum, plastics & pharma sector employed 13.5% of total Top 500 staff while automotive and transport provides employment for (17.5%). While the latter recruited another 18,000 people (+4.3%), the former decreased its workforce by 4.7% in 2018.
Only three sectors showed a decrease in their staff base last year. Apart from the minerals, chemicals, petroleum, plastics & pharma sector, lower employment was recorded by the agri-food (-3.2%) and textiles (-0.5%) sectors. In contrast, the paper, packaging and printing (+7.8%) as well as metals (+5.9%) and mechanics and precision (+5.1%) sectors led staffing requirements in 2018.
Recruitment became more difficult with rising labour shortages – employment rose by a slight 0.4%.

COFACE PUBLICATIONS CEE TOP 500 COMPANIESRANKING
19
CHANGE IN TURNOVER %
CHANGE IN TURNOVER %
–
+
Chart 5: Coface CEE Top 500:Change in turnover and employment per sector
Circle size = % of total CEE Top 500 employment (importance as employer)
WOOD & FURNITURE
TEXTILES, LEATHER & CLOTHING
CONSTRUCTION
PAPER, PACKAGING & PRINTING
AGRICULTURE, MEAT, AGRI-FOOD & WINES
METALS
10 8 7 6 5 4 3 2 19
5
4
3
2
1
10 11 1287654321 9
NON-SPECIALIZED TRADE
AUTOMOTIVE & TRANSPORT
CH
AN
GE
IN
EM
PLO
YM
EN
T % C
HA
NG
E IN
E
MP
LOY
ME
NT
%
+–
11
12
13
14
15
16
8
7
6
5
4
3
2
1
9
10
MINERALS, CHEMICALS, PETROLEUM, PLASTICS
& PHARMA
Figures for some sectors are not shown in the diagram as they are off-scale.
Others:1.9% of change in employment,+19.3% of change in turnover, 4.7% of total CEE top 500 employment
Mechanics & precision: 5.1% of change in emlpyment, +6.2% of change in turnover, 1.4% of total CEE top 500 employment
AUTOMOTIVE & TRANSPORT
UTILITIES & PUBLIC SERVICES
ELECTRONICS, INFORMATION & TELECOMMUNICATION

COFACE CEE TOP 500THE RANKING

COFACE PUBLICATIONS CEE TOP 500 COMPANIESRANKING
21
InfoIcon
METHODOLOGY
The CEE Top 500 is a joint project by the Coface offices in Central Europe. This ranking covers the largest companies in the region – based on the turnover for the 2018 calendar year – and was prepared in 2018 for the eleventh time. The study includes the following countries:
Bulgaria • Croatia • Czech Republic • Estonia • Hungary • Latvia • Lithuania • Poland • Romania • Serbia • Slovakia • Slovenia
The largest companies in each of the above countries (turnover ≥ EUR 300 millions) were identified, excluding financial service providers such as banks, insurance companies, leasing firms and brokers. In addition to revenues, the CEE Top 500 study includes other key corporate indicators, e.g. net profits, the number of employees and the respective changes in relation to the previous year.
Turnover and profit were converted into EUR based on the exchange rate at the end of 2018. The data were taken from our Coface InfoIcon database and supplemented with external information as required.
The ranking does not include companies that refused to provide financial results by the time the CEE Top 500 list was finalised.
The annual Coface CEE Top 500 Ranking is based on financial results from InfoIcon – the largest single database on company information in CEE.

COFACE PUBLICATIONS CEE TOP 500 COMPANIESRANKING
22
Daniel ObajtekPresident of the Management BoardPKN ORLEN
We are determined to fully leverage the potential of PKN ORLEN’s business, with knock-on benefits strengthening the entire economy of Poland. This is why we are making business decisions that will put the Company on track for growth over decades to come. The priority is to quickly follow through with the acquisition of the LOTOS Group and further diversify oil supply sources, enhancing the country’s energy security. The Company’s robust financial condition will help sustain the momentum in our strategic investment projects, including Petrochemicals Development, capacity addition at ANWIL, construction of an eco-friendly glycol unit at ORLEN Południe as well as business expansion into foreign markets.
1ST PLACE
* consolidated, ** estimated, *** group data, n.a. not available, 1 Turnover 2017 taken as estimate,
PO
SITI
ON
20
18
CH
AN
GE
IN
PO
SITI
ON
PO
SITI
ON
20
17
CO
UN
TRY
COMPANY NAME MAIN SECTOR TUR
NO
VE
R IN
E
UR
MIL
LIO
NS
2017
TUR
NO
VE
R IN
E
UR
MIL
LIO
NS
2018
CH
AN
GE
IN
TUR
NO
VE
R
NE
T P
RO
FIT
IN
EU
R M
ILLI
ON
S 20
17
NE
T P
RO
FIT
IN
EU
R M
ILLI
ON
S 20
18
CH
AN
GE
IN
NE
T P
RO
FIT
EM
PLO
YM
EN
T
2017
EM
PLO
YM
EN
T
2018
CH
AN
GE
IN
EM
PLO
YM
EN
T
1 - 1 PL POLSKI KONCERN NAFTOWY ORLEN S.A.*
Minerals, chemicals, petro-leum, plastics & pharma 22,172 25,507 15.0% 1,667.7 1,302.9 -21.9% 20,262 21,282 5.0%
2 - 2 CZ ŠKODA AUTO A.S. Automotive & transport 15,837 16,199 2.3% 1,237.8 1,017.8 -17.8% 32,985 35,355 7.2%
3 - 3 HU MOL MAGYAR OLAJ- ÉS GÁZIPARI NYRT.*
Minerals, chemicals, petro-leum, plastics & pharma 12,868 16,103 25.1% 985.8 952.3 -3.4% 5,372 4,889 -9.0%
4 - 4 PL JERONIMO MARTINS POLSKA S.A. Non-specialized trade 11,199 11,866 6.0% 400.3 462.8 15.6% 61,535 66,292 7.7%
5 7 SK VOLKSWAGEN SLOVAKIA, A.S. Automotive & transport 7,549 10,380 37.5% 403.9 191.9 -52.5% 13,964 15,189 8.8%
6 5 PL POLSKIE GÓRNICTWO NAFTOWE I GAZOWNICTWO S.A.* Utilities and public services 8,337 9,587 15.0% 679.1 746.1 9.9% 24,694 24,763 >1.000
7 6 HU AUDI HUNGARIA ZRT. Automotive & transport 7,299 7,377 1.1% 352.6 425.2 20.6% 9,318 13,393 43.7%
8 - 8 PL GRUPA LOTOS S.A.* Minerals, chemicals, petro-leum, plastics & pharma 5,623 7,003 24.5% 388.7 369.1 -5.0% 4,897 5,105 4.2%
9 10 PL PGE POLSKA GRUPA ENERGETYCZNA S.A.* Utilities & public services 5,371 6,032 12.3% 620.1 351.3 -43.3% 41,231 41,442 0.5%
10 11 CZ ALPIQ ENERGY SE Utilities & public services 5,413 5,489 1.4% 3.8 -19.5 -617.2% 149 98 -34.2%
11 17 HU MVM MAGYAR VILLAMOS MŰVEK ZRT.* Others 4,147 5,355 29.1% 12.2 68.1 457.8% 9,294 10,859 16.8%
12 9 PL EUROCASH S.A.* Non-specialized trade 5,411 5,309 -1.9% -6.9 26.0 n.a. 17,664 21,873 23.8%
13 14 RO AUTOMOBILE-DACIA SA Automotive & transport 4,963 5,302 6.8% 115.6 161.3 39.6% 14,261 14,723 3.2%
14 13 SK KIA MOTORS SLOVAKIA S.R.O. Automotive & transport 5,185 5,186 0.0% 209.9 240.7 14.7% 3,755 3,787 0.9%
15 12 CZ HYUNDAI MOTOR MANUFACTURING CZECH S.R.O. Automotive & transport 5,313 5,025 -5.4% 260.2 347.1 33.4% 2,563 2,552 -0.4%
16 - 16 CZ UNIPETROL RPA, S.R.O. Minerals, chemicals, petro-leum, plastics & pharma 4,443 4,778 7.5% 358.8 340.7 -5.1% 410 416 1.5%
17 15 PL KGHM POLSKA MIEDŹ S.A.* Minerals, chemicals, petro-leum, plastics & pharma 4,733 4,772 0.8% 354.6 385.5 8.7% 33,366 33,568 0.6%
18 20 LT ORLEN LIETUVA AB* Minerals, chemicals, petro-leum, plastics & pharma 4,006 4,706 17.5% 211.5 23.8 -88.8% 1,597 2,253 41.1%
19 - 19 CZ RWE SUPPLY & TRADING CZ, A.S. Utilities & public services 4,067 4,506 10.8% 63.7 64.8 1.6% 15 15 0.0%
20 24 SI PETROL D.D. Minerals, chemicals, petro-leum, plastics & pharma 3,791 4,365 15.2% 64.3 100.6 56.5% 1,525 1,525 0.0%

COFACE PUBLICATIONS CEE TOP 500 COMPANIESRANKING
23
Coface InfoIconTHE ONLINE MARKETPLACE FOR BUSINESS INFORMATIONGet instant information on over 145 million companies worldwide whenever and wherever you want with InfoIcon - our online application for business information and debt collection.
Profit from:• The largest single database in CEE• Online information on companies
in more than 64 countries• An easy ordering process• Secure online payment• Immediate delivery of reports
For more information visit:https://icon.cofacecentraleurope.com
* consolidated, ** estimated, *** group data, n.a. not available. P
OSI
TIO
N 2
018
CH
AN
GE
IN
PO
SITI
ON
PO
SITI
ON
20
17
CO
UN
TRY
COMPANY NAME MAIN SECTOR TUR
NO
VE
R IN
E
UR
MIL
LIO
NS
2017
TUR
NO
VE
R IN
E
UR
MIL
LIO
NS
2018
CH
AN
GE
IN
TUR
NO
VE
R
NE
T P
RO
FIT
IN
EU
R M
ILLI
ON
S 20
17
NE
T P
RO
FIT
IN
EU
R M
ILLI
ON
S 20
18
CH
AN
GE
IN
NE
T P
RO
FIT
EM
PLO
YM
EN
T
2017
EM
PLO
YM
EN
T
2018
CH
AN
GE
IN
EM
PLO
YM
EN
T
21 30 LT VILNIAUS PREKYBA UAB* Others 3,283 4,241 29.2% 173.2 227.6 31.4% 34,798 43,888 26.1%
22 23 HU ROBERT BOSCH ELEKTRONIKA GYÁRTÓ KFT.**
Electronics, information & telecommunications 3,740 4,228 13.1% 72.7 86.8 19.5% 13,432 14,160 5.4%
23 18 PL TAURON POLSKA ENERGIA S.A.* Utilities & public services 4,049 4,213 4.1% 321.5 48.1 -85.0% 25,020 25,622 2.4%
24 22 PL VOLKSWAGEN POZNAŃ SP. Z O.O. Automotive & transport 3,758 4,146 10.3% 104.9 91.4 -12.9% 10,374 11,765 13.4%
25 21 PL ARCELORMITTAL POLAND S.A.* Metals 3,753 4,033 7.5% 81.2 129.4 59.4% 13,065 12,584 -3.7%
26 31 RO OMV PETROM MARKETING SRL Minerals, chemicals, petro-leum, plastics & pharma 3,230 3,832 18.6% 68.7 89.8 30.7% 210 219 4.3%
27 32 RO OMV PETROM SA Minerals, chemicals, petro-leum, plastics & pharma 3,166 3,821 20.7% 514.6 831.9 61.7% 13,322 12,498 -6.2%
28 27 SK SLOVNAFT, A.S. Minerals, chemicals, petro-leum, plastics & pharma 3,417 3,798 11.1% 172.3 106.2 -38.4% 2,389 2,567 7.5%
29 28 PL LIDL SP. Z O.O. SP.K. Non-specialized trade 3,311 3,731 12.7% 116.2 164.7 41.7% 13,698 15,126 10.4%
30 25 HU MERCEDES-BENZ MANUFACTUR-ING HUNGARY KFT. Automotive & transport 3,436 3,561 3.7% 74.4 86.6 16.3% 3,648 4,281 17.4%
31 29 BG BULGARIAN ENERGY HOLDING JSC* Utilities & public services 3,287 3,542 7.8% 60.8 -133.5 -319.6% 87 86 -1.1%
32 37 LT MAXIMA GRUPE UAB* Non-specialized trade 2,826 3,451 22.1% 74.9 116.7 55.9% 31,000 40,300 30.0%
33 - 33 PL VOLKSWAGEN GROUP POLSKA SP. Z O.O. Automotive & transport 3,058 3,353 9.6% 26.8 26.8 0.0% 537 604 12.5%
34 42 PL BP EUROPA SE SPÓŁKA EUROPE-JSKA ODDZIAŁ W POLSCE
Minerals, chemicals, petro-leum, plastics & pharma 2,560 3,184 24.4% 93.0 98.9 6.4% 310 307 -1.0%
35 26 PL FCA POLAND S.A. Automotive & transport 3,344 3,098 -7.4% 72.2 61.1 -15.4% 2,943 2,615 -11.1%
36 34 CZ ČEZ, A. S. Utilities & public services 3,003 3,070 2.2% 198.5 924.3 365.7% 29,837 31,385 5.2%
37 51 RO ROMPETROL RAFINARE SA Minerals, chemicals, petro-leum, plastics & pharma 2,400 3,027 26.1% 89.7 -49.4 -155.0% 1,061 1,126 6.1%
38 35 BG LUKOIL NEFTOHIM BURGAS JSC Minerals, chemicals, petro-leum, plastics & pharma 2,863 3,007 5.0% 155.4 -130.0 -183.7% 1,397 1,346 -3.7%
39 - 39 PL ENEA S.A.* Utilities & public services 2,652 2,946 11.1% 270.8 167.2 -38.3% 15,514 16,185 4.3%

COFACE PUBLICATIONS CEE TOP 500 COMPANIESRANKING
24
Maciej Łukowski Chief Commercial Officer, Member of the Management Board Jeronimo Martins Polska S.A.
By challenging competitive environment and despite many changes in the Polish market, Biedronka recorded many achievements in 2018. Focusing on consumer needs resulted in a sales increase of 5.8% to the level of 49,82 billion PLN and further growth in market share. The investments reached a value of 1.6 billion PLN. We opened 122 stores, bringing the number of locations to 2,900. We also refurbished 230 stores. We further developed our assortment and offered our customers over 550 new Private Brand products, many of which were certified products. In 2018, we celebrated 100 years of Poland regaining independence. On this occasion, as part of our corporate responsibility-related initiatives, we launched a program together with Caritas Polska that supports the elderly in need. We invested over 10 million PLN in this program only.
4TH PLACE
PO
SITI
ON
20
18
CH
AN
GE
IN
PO
SITI
ON
PO
SITI
ON
20
17
CO
UN
TRY
COMPANY NAME MAIN SECTOR TUR
NO
VE
R IN
E
UR
MIL
LIO
NS
2017
TUR
NO
VE
R IN
E
UR
MIL
LIO
NS
2018
CH
AN
GE
IN
TUR
NO
VE
R
NE
T P
RO
FIT
IN
EU
R M
ILLI
ON
S 20
17
NE
T P
RO
FIT
IN
EU
R M
ILLI
ON
S 20
18
CH
AN
GE
IN
NE
T P
RO
FIT
EM
PLO
YM
EN
T
2017
EM
PLO
YM
EN
T
2018
CH
AN
GE
IN
EM
PLO
YM
EN
T
40 50 HR INA D.D. Minerals, chemicals, petro-leum, plastics & pharma 2,371 2,842 19.9% 229.3 182.5 -20.4% 4,292 4,138 -3.6%
41 - 41 SK PCA SLOVAKIA, S.R.O. Automotive & transport 2,703 2,792 3.3% 46.2 37.3 -19.3% 3,227 3,766 16.7%
42 53 PLPRZEDSIĘBIORSTWO PRODUKCYJNO-HANDLOWO-USŁUGOWE SPECJAŁ SP. Z O.O.*
Agriculture, meat, agro food and wines 2,256 2,739 21.4% 3.8 6.2 61.9% 3,819 3,903 2.2%
43 36 PL TESCO (POLSKA) SP. Z O.O. Agriculture, meat, agro food and wines 2,766 2,720 -1.7% -204.3 -94.6 n.a. 25,000 23,884 -4.5%
44 489 SK U. S. STEEL KOŠICE, S.R.O. Metals 2,612 2,712 3.8% 449.9 126.8 -71.8% 10,059 9,960 -1.0%
45 136 CZ MND A.S. Minerals, chemicals, petro-leum, plastics & pharma 1,292 2,687 108.0% -4.5 -5.7 26.2% 370 884 138.9%
46 40 PL ORANGE POLSKA S.A.* Electronics, information & telecommunications 2,646 2,581 -2.5% -14.0 2.3 -n.a. 14,928 13,545 -9.3%
47 87 HU WIZZ AIR HUNGARY ZRT. Automotive & transport 2,102 2,550 21.3% 279.3 261.3 -6.4% 2,282 3,746 64.2%
48 43 BG AURUBIS BULGARIA JSC* Metals 2,566 2,528 -1.5% 201.2 103.5 -48.6% 858 879 2.4%
49 56 CZ MORAVIA STEEL A.S. Metals 2,246 2,513 11.9% 106.4 107.8 1.3% 306 325 6.2%
50 48 PL AUCHAN POLSKA SP. Z O.O. Non-specialized trade 2,374 2,491 4.9% 26.5 n.a. n.a. 15,570 n.a. n.a.
51 52 PL CYFROWY POLSAT S.A.* Electronics, information & telecommunications 2,285 2,485 8.7% 219.8 189.7 -13.7% 4,802 6,086 26.7%
52 46 PL PHILIP MORRIS POLSKA DISTRIBU-TION SP. Z O.O.
Agriculture, meat, agro food and wines 2,401 2,456 2.3% 172.1 184.0 6.9% 629 646 2.7%
53 61 SK SLOVENSKÉ ELEKTRÁRNE, A.S. Utilities & public services 2,183 2,426 11.1% 126.9 25.3 -80.1% 3,684 3,636 -1.3%
54 45 PL ENERGA S.A. * Utilities & public services 2,449 2,403 -1.9% 183.4 173.0 -5.7% 8,820 9,456 7.2%
55 47 SI GEN-I D.O.O. Utilities & public services 2,456 2,375 -3.3% 13.5 13.0 -4.2% 308 228 -26.0%
56 63 PL POLSKIE SIECI ELEKTROENER-GETYCZNE S.A. Utilities & public services 2,066 2,348 13.6% 123.4 113.9 -7.7% 2,089 2,318 11.0%
57 75 RO ROMPETROL DOWNSTREAM SRL Minerals, chemicals, petro-leum, plastics & pharma 1,903 2,344 23.2% 36.1 16.3 -55.0% 561 420 -25.1%
58 49 PL KAUFLAND POLSKA MARKETY SP. Z O.O. SP.K. Non-specialized trade 2,359 2,343 -0.7% 40.2 47.5 18.3% 17,020 15,601 -8.3%
59 62 RO KAUFLAND ROMANIA SCS Non-specialized trade 2,163 2,335 8.0% 143.7 169.1 17.7% 13,519 12,374 -8.5%

COFACE PUBLICATIONS CEE TOP 500 COMPANIESRANKING
25
While it may look like we are complaining without any grounds since our top companies are still doing pretty well, we do see plenty of clouds on the horizon. The German automotive sector and its respective Austrian & CEE value chain have been severely affected over the last months and we don´t expect a swift recovery in the near future.
Michael TAWROWSKY Country Manager Coface Austria
* consolidated, ** estimated, *** group data, n.a. not available, 1 Turnover 2018 taken as estimate.P
OSI
TIO
N 2
018
CH
AN
GE
IN
PO
SITI
ON
PO
SITI
ON
20
17
CO
UN
TRY
COMPANY NAME MAIN SECTOR TUR
NO
VE
R IN
E
UR
MIL
LIO
NS
2017
TUR
NO
VE
R IN
E
UR
MIL
LIO
NS
2018
CH
AN
GE
IN
TUR
NO
VE
R
NE
T P
RO
FIT
IN
EU
R M
ILLI
ON
S 20
17
NE
T P
RO
FIT
IN
EU
R M
ILLI
ON
S 20
18
CH
AN
GE
IN
NE
T P
RO
FIT
EM
PLO
YM
EN
T
2017
EM
PLO
YM
EN
T
2018
CH
AN
GE
IN
EM
PLO
YM
EN
T
60 54 PL GRUPA AZOTY S.A. * Minerals, chemicals, petro-leum, plastics & pharma 2,236 2,325 4.0% 113.7 1.8 -98.4% 14,373 15,470 7.6%
61 94 HU MAGYAR FÖLDGÁZKERESKEDŐ ZRT. Utilities & public services 1,625 2,318 42.6% 4.2 10.6 151.6% 105 96 -8.6%
62 77 CZ ČEPRO, A.S. Minerals, chemicals, petro-leum, plastics & pharma 1,873 2,285 22.0% 35.9 40.4 12.5% 757 757 0.0%
63 57 PL PELION S.A. * Non-specialized trade 2,194 2,282 4.0% 17.3 21.8 25.8% 9,629 9,769 1.5%
64 - 64 PL JASTRZĘBSKA SPÓŁKA WĘGLOWA S.A. *
Minerals, chemicals, petro-leum, plastics & pharma 2,064 2,281 10.5% 591.3 409.4 -30.8% 26,465 28,268 6.8%
65 67 PL PAŃSTWOWE GOSPODARSTWO LEŚNE LASY PAŃSTWOWE Wood & furniture 1,991 2,277 14.3% 101.2 124.9 23.4% 26,189 26,414 0.9%
66 181 RO FORD ROMANIA SA Automotive & transport 1,035 2,263 118.7% 20.5 37.8 84.8% 3,201 4,449 39.0%
67 60 CZ KAUFLAND ČESKÁ REPUBLIKA V.O.S. Non-specialized trade 2,218 2,243 1.1% 76.7 119.7 56.0% 12,198 11,384 -6.7%
68 74 HUFLEXTRONICS INTERNATIONAL TERMELŐ ÉS SZOLGÁLTATÓ VÁMSZABADTERÜLETI KFT. 1
Electronics, information & telecommunications 2,235 2,235 0.0% -12.8 n.a. n.a. 6,972 6,972 0.0%
69 55 HU GE INFRASTRUCTURE HUNGARY HOLDING KFT.1 Mechanics & precision 2,221 2,221 0.0% 301.0 n.a. n.a. 11,310 11,310 0.0%
70 65 RS JP EPS BEOGRAD Utilities & public services 2,111 2,214 4.9% 28.7 13.4 -53.2% 26,485 25,761 -2.7%
71 80 RS NIS A.D. NOVI SAD Minerals, chemicals, petro-leum, plastics & pharma 1,823 2,183 19.8% 235.1 220.5 -6.2% 4,058 4,099 1.0%
72 71 PL POLSKA GRUPA GÓRNICZA S.A.* Minerals, chemicals, petro-leum, plastics & pharma 1,915 2,180 13.8% 21.3 115.1 439.8% 43,493 42,080 -3.2%
73 58 CZ CONTINENTAL BARUM S.R.O. Automotive & transport 2,224 2,169 -2.5% 139.7 118.0 -15.5% 4,074 4,222 3.6%
74 78 PL ASSECO POLAND S.A. * Electronics, information & telecommunications 1,820 2,169 19.1% 143.4 138.0 -3.7% 24,053 24,302 1.0%
75 59 HU SAMSUNG ELECTRONICS MAGYAR ZRT.
Electronics, information & telecommunications 2,164 2,056 -5.0% 348.0 68.4 -80.4% 1,762 1,647 -6.5%
76 - 76 RO BRITISH AMERICAN TOBACCO (ROMANIA) TRADING SRL
Agriculture, meat, agro food and wines 1,902 2,045 7.5% 65.5 33.3 -49.1% 679 816 20.2%
77 89 CZ LIDL ČESKÁ REPUBLIKA V.O.S. Non-specialized trade 1,701 2,033 19.6% 195.5 159.6 -18.4% 6,375 6,267 -1.7%
78 66 HU MAGYAR SUZUKI ZRT. Automotive & transport 2,031 1,953 -3.8% 83.1 77.5 -6.8% 2,819 2,688 -4.6%
79 NEW LV URALKALI TRADING SIA Minerals, chemicals, petro-leum, plastics & pharma 2,055 1,944 -5.4% 18.0 16.5 -8.1% 39 51 30.8%
80 68 HU TESCO-GLOBAL ÁRUHÁZAK ZRT. Non-specialized trade 1,942 1,938 -0.2% 54.5 99.0 81.7% 16,067 15,153 -5.7%
81 79 PL ROSSMANN SUPERMARKETY DROGERYJNE POLSKA SP. Z O.O.
Minerals, chemicals, petro-leum, plastics & pharma 1,792 1,929 7.6% 199.7 214.7 7.5% 14,301 15,247 6.6%

COFACE PUBLICATIONS CEE TOP 500 COMPANIESRANKING
26P
OSI
TIO
N 2
018
CH
AN
GE
IN
PO
SITI
ON
PO
SITI
ON
20
17
CO
UN
TRY
COMPANY NAME MAIN SECTOR TUR
NO
VE
R IN
E
UR
MIL
LIO
NS
2017
TUR
NO
VE
R IN
E
UR
MIL
LIO
NS
2018
CH
AN
GE
IN
TUR
NO
VE
R
NE
T P
RO
FIT
IN
EU
R M
ILLI
ON
S 20
17
NE
T P
RO
FIT
IN
EU
R M
ILLI
ON
S 20
18
CH
AN
GE
IN
NE
T P
RO
FIT
EM
PLO
YM
EN
T
2017
EM
PLO
YM
EN
T
2018
CH
AN
GE
IN
EM
PLO
YM
EN
T
82 70 PL AB S.A. * Non-specialized trade 1,925 1,915 -0.5% 15.8 14.2 -10.2% 1,004 1,178 17.3%
83 69 PL LG ELECTRONICS MŁAWA SP. Z O.O.
Electronics, information & telecommunications 1,960 1,881 -4.1% 6.3 34.5 450.1% 1,870 1,580 -15.5%
84 93 PL LPP S.A. * Textiles, leather and clothing 1,634 1,871 14.5% 102.5 117.5 14.6% 25,635 25,181 -1.8%
85 82 CZ MOL ČESKÁ REPUBLIKA, S.R.O. Minerals, chemicals, petro-leum, plastics & pharma 1,797 1,866 3.8% 19.2 21.6 12.6% 220 225 2.3%
86 85 HU ORSZÁGOS DOHÁNYBOLTELLÁTÓ KFT.
Agriculture, meat, agro food and wines 1,691 1,864 10.2% 11.3 14.4 28.2% 738 690 -6.5%
87 97 PL INTER CARS S.A. * Automotive & transport 1,606 1,847 15.0% 50.3 51.9 3.1% 3,097 3,391 9.5%
88 81 PL CARREFOUR POLSKA SP. Z O.O. Non-specialized trade 1,763 1,845 4.7% 0.5 14 >1,000 14,474 12,419 -14.2%
89 83 CZ ČEZ DISTRIBUCE, A. S. Utilities & public services 1,781 1,836 3.1% 248.6 298.1 19.9% 2,759 4,509 63.4%
90 84 PL NEUCA S.A. * Minerals, chemicals, petro-leum, plastics & pharma 1,740 1,803 3.6% 21.9 22.8 4.5% 4,056 3,861 -4.8%
91 112 PL MERCEDES-BENZ POLSKA SP. Z O.O. * Automotive & transport 1,475 1,800 22.1% 24.5 28.7 17.1% 643 687 6.8%
92 98 SI REVOZ D.D. Automotive & transport 1,599 1,783 11.5% 34.8 33.6 -3.3% 2,701 2,321 -14.1%
93 86 CZ TESCO STORES ČR A.S. Non-specialized trade 1,727 1,766 2.3% -42.6 49.7 n.a. 11,210 10,633 -5.1%
94 44 SK SAMSUNG ELECTRONICS SLOVA-KIA S.R.O.
Electronics, information & telecommunications 2,536 1,760 -30.6% 79.5 62.5 -21.4% 1,861 1,697 -8.8%
95 92 HU BORSODCHEM ZRT. Minerals, chemicals, petro-leum, plastics & pharma 1,628 1,758 8.0% 395.4 443.9 12.2% 2,536 2,809 10.8%
96 195 PL KOMPANIA PIWOWARSKA S.A. Agriculture, meat, agro food and wines 966 1,738 79.9% 65.2 191.0 193.1% n.a. 2,711 n.a.
97 91 PL GRUPA MUSZKIETERÓW * Non-specialized trade 1,651 1,734 5.1% n.a. n.a. n.a. 13,700 13,300 -2.9%
98 107 PL BUDIMEX S.A. * Construction 1,481 1,718 16.0% 108.0 71.0 -34.2% 6,539 6,906 5.6%
99 131 BG LUKOIL-BULGARIA LTD Minerals, chemicals, petro-leum, plastics & pharma 1,361 1,703 25.2% -3.1 0.5 n.a. 2,733 2,717 -0.6%
100 116 PL CAN-PACK S.A. * Paper, packaging and printing 1,434 1,699 18.4% 118.9 107.2 -9.9% 6,032 6,736 11.7%
101 127 RO LIDL DISCOUNT SRL Non-specialized trade 1,396 1,670 19.6% 75.6 88.4 16.9% 4,815 5,481 13.8%
102 106 LT MAXIMA LT UAB Non-specialized trade 1,547 1,638 5.9% 54.1 106.5 96.8% 15,536 14,659 -5.6%
103 90 PL SYNTHOS S.A. * Minerals, chemicals, petro-leum, plastics & pharma 1,663 1,634 -1.8% 135.3 113.5 -16.2% 2,975 n.a. n.a.
Dr. Oliver Grünberg Chairman and Member of the Board of Management Volkswagen Slovakia
The year 2018 was marked by the launch of new products at Volkswagen Slovakia, which we successfully brought to the finish. At the same time, we again defended our position as the largest car producer. Since its inception, we have invested over EUR 4.5 billion in Slovakia and major investments have been made in recent years concerning the production and expansion of the plant. Following its start-up years, the company is currently focusing on serial production and an increase in productivity. In order to continue to enjoy success in the future, we need to set bold targets for efficiency gains and work on them continually.
5TH PLACE

COFACE PUBLICATIONS CEE TOP 500 COMPANIESRANKING
27
Despite the size of the Baltic economy, we’ve continued seeing three important EU countries with constant GDP growth in the recent years. This statement could be verified by an additional 6 companies making it into the TOP 500 list this year. The biggest growth lies within energy, transport and chemical sectors, leading the business performance in the region.
Mantvydas ŠtareikaCountry Manager Coface Baltics filialas
* consolidated, ** estimated, *** group data, n.a. not available.P
OSI
TIO
N 2
018
CH
AN
GE
IN
PO
SITI
ON
PO
SITI
ON
20
17
CO
UN
TRY
COMPANY NAME MAIN SECTOR TUR
NO
VE
R IN
E
UR
MIL
LIO
NS
2017
TUR
NO
VE
R IN
E
UR
MIL
LIO
NS
2018
CH
AN
GE
IN
TUR
NO
VE
R
NE
T P
RO
FIT
IN
EU
R M
ILLI
ON
S 20
17
NE
T P
RO
FIT
IN
EU
R M
ILLI
ON
S 20
18
CH
AN
GE
IN
NE
T P
RO
FIT
EM
PLO
YM
EN
T
2017
EM
PLO
YM
EN
T
2018
CH
AN
GE
IN
EM
PLO
YM
EN
T
104 - 104 HU SPAR MAGYARORSZÁG KERESKE-DELMI KFT. Non-specialized trade 1,488 1,631 9.6% 60.5 61.9 2.4% 13,247 13,458 1.6%
105 101 BG NATSIONALNA ELEKTRICHESKA KOMPANIA JSC Utilities & public services 1,584 1,627 2.7% 3.5 -37.7 >-1,000 1,397 2,073 48.4%
106 88 PL ŻABKA POLSKA SP. Z O.O. * Non-specialized trade 1,004 1,605 59.9% -50.1 -35.1 n.a. 1,221 1,425 16.7%
107 NEW PL EURO NET SP. Z O.O. Electronics, information & telecommunications 1,402 1,597 13.9% 28.6 28.5 -0.2% 6,132 6,308 2.9%
108 100 PL PLAY COMMUNICATIONS S.A. * Electronics, information & telecommunications 1,551 1,590 2.5% 90.1 173.1 92.2% 2,600 2,662 2.4%
109 95 PL SIGNIFY POLAND SP. Z O.O. Electronics, information & telecommunications 1,612 1,576 -2.2% 9.6 24.9 158.4% 3,358 4,229 25.9%
110 126 CZ TŘINECKÉ ŽELEZÁRNY, A. S. Metals 1,394 1,574 12.9% 55.4 129.6 134.1% 7,034 7,126 1.3%
111 110 PL POCZTA POLSKA S.A. * Electronics, information & telecommunications 1,475 1,573 6.7% -8.3 -15.7 n.a. 79,341 80,763 1.8%
112 111 PL CASTORAMA POLSKA SP. Z O.O. Non-specialized trade 1,475 1,569 6.4% 87.8 96.4 9.9% 11,435 11,877 3.9%
113 119 RO CARREFOUR ROMANIA SA Non-specialized trade 1,447 1,569 8.4% 45.0 56.1 24.8% 9,939 9,997 0.6%
114 102 RO STAR ASSEMBLY SRL Mechanics and precision 1,571 1,550 -1.3% 52.8 56.7 7.5% 1,811 1,854 2.4%
115 132 RO DEDEMAN SRL Non-specialized trade 1,358 1,549 14.1% 190.7 217.2 13.9% 9,818 10,413 6.1%
116 109 HU MAGYAR TELEKOM TÁVKÖZLÉSI NYRT.
Electronics, information & telecommunications 1,469 1,537 4.6% 130.4 117.3 -10.0% 6,287 6,931 10.2%
117 125 HU SZERENCSEJÁTÉK ZRT.* Others 1,360 1,530 12.5% 58.4 67.2 15.0% 1,731 1,776 2.6%
118 114 SK SLOVENSKÝ PLYNÁRENSKÝ PRIE-MYSEL, A.S.
Minerals, chemicals, petro-leum, plastics & pharma 1,509 1,526 1.1% 318.5 313.6 -1.5% 721 681 -5.5%
119 96 SI HOLDING SLOVENSKE ELEKTRARNE D.O.O. Utilities & public services 1,659 1,519 -8.4% 19.7 9.5 -51.9% 167 174 4.2%
120 99 PL MAKRO CASH AND CARRY POLSKA S.A. Non-specialized trade 1,551 1,514 -2.4% -0.1 3.6 >-1,000 5,509 5,200 -5.6%
121 103 PL SAMSUNG ELECTRONICS POLSKA SP. Z O.O. Non-specialized trade 1,512 1,498 -0.9% 32.6 33.1 1.3% 1,772 1,809 2.1%
122 124 LV ELKO GRUPA AS* Electronics, information & telecommunications 1,409 1,497 6.3% 12.2 7.9 -35.3% 900 1,000 11.1%
123 105 PL T-MOBILE POLSKA S.A. Electronics, information & telecommunications 1,487 1,482 -0.3% 8.7 -2.5 -128.8% 4,500 4,500 0.0%
124 123 SK MOBIS SLOVAKIA S.R.O. Automotive & transport 1,422 1,480 4.1% 43.0 45.4 5.6% 1,992 2,047 2.8%
125 NEW CZ TOYOTA PEUGEOT CITROËN AUTOMOBILE CZECH, S.R.O. Automotive & transport 1,416 1,474 4.1% 9.9 11.4 14.9% 2,248 2,185 -2.8%

COFACE PUBLICATIONS CEE TOP 500 COMPANIESRANKING
28P
OSI
TIO
N 2
018
CH
AN
GE
IN
PO
SITI
ON
PO
SITI
ON
20
17
CO
UN
TRY
COMPANY NAME MAIN SECTOR TUR
NO
VE
R IN
E
UR
MIL
LIO
NS
2017
TUR
NO
VE
R IN
E
UR
MIL
LIO
NS
2018
CH
AN
GE
IN
TUR
NO
VE
R
NE
T P
RO
FIT
IN
EU
R M
ILLI
ON
S 20
17
NE
T P
RO
FIT
IN
EU
R M
ILLI
ON
S 20
18
CH
AN
GE
IN
NE
T P
RO
FIT
EM
PLO
YM
EN
T
2017
EM
PLO
YM
EN
T
2018
CH
AN
GE
IN
EM
PLO
YM
EN
T
126 113 PL VOLKSWAGEN MOTOR POLSKA SP. Z O.O. Automotive & transport 1,474 1,465 -0.6% 41.4 38.7 -6.7% 1,263 1,253 -0.8%
127 130 PL ANIMEX FOODS SP. Z O.O. SP.K. Agriculture, meat, agro food and wines 1,324 1,452 9.6% 26.4 46.0 74.2% 8,032 7,822 -2.6%
128 148 RO MOL ROMANIA PETROLEUM PRODUCTS SRL
Minerals, chemicals, petro-leum, plastics & pharma 1,173 1,441 22.9% 39.3 54.6 38.9% 228 246 7.9%
129 154 PL POLSKIE LINIE LOTNICZE LOT S.A. Automotive & transport 1,116 1,439 29.0% 82.4 48.6 -41.0% 1,687 n.a. n.a.
130 118 SK TESCO STORES SR, A.S. Non-specialized trade 1,451 1,434 -1.2% 32.0 94 193.8% 10,179 9,207 -9.5%
131 NEW PL JTI POLSKA SP. Z O.O. Agriculture, meat, agro food and wines 1,254 1,425 13.7% 23.5 23.5 0.0% 1,320 2,076 57.3%
132 128 PL BRITISH AMERICAN TOBACCO POLSKA TRADING SP. Z O.O.
Agriculture, meat, agro food and wines 1,342 1,420 5.8% 8.1 9.7 19.1% 878 947 7.9%
133 115 PL BORYSZEW S.A. * Minerals, chemicals, petro-leum, plastics & pharma 1,463 1,418 -3.0% 46.9 33.6 -28.3% 10,135 9,520 -6.1%
134 - 134 CZ GECO, A.S. Agriculture, meat, agro food and wines 1,334 1,418 6.3% 14.4 18.4 27.6% 1,708 1,784 4.4%
135 133 PL BSH SPRZĘT GOSPODARSTWA DOMOWEGO SP. Z O.O.
Electronics, information & telecommunications 1,316 1,411 7.3% 36.8 52.7 43.4% 3,821 5,030 31.6%
136 120 PL FARMACOL S.A. * Minerals, chemicals, petro-leum, plastics & pharma 1,403 1,395 -0.6% 17.5 11.6 -33.5% 2,915 3,089 6.0%
137 122 HU RICHTER GEDEON VEGYÉSZETI GYÁR NYRT.*
Minerals, chemicals, petro-leum, plastics & pharma 1,384 1,388 0.3% 31.4 112.8 259.4% 12,172 12,696 4.3%
138 167 HU LIDL MAGYARORSZÁG KERESKEDELMI BT. Non-specialized trade 1,057 1,387 31.2% 53.3 82.6 54.8% 4,217 4,782 13.4%
139 138 SK OKTE, A.S. Non-specialized trade 1,274 1,387 8.9% 0.6 0.8 33.6% 33 35 6.1%
140 129 PL PKP POLSKIE LINIE KOLEJOWE S.A.* Automotive & transport 1,340 1,386 3.5% 6.1 -28.7 -573.2% 41,109 40,475 -1.5%
141 108 HU NKM FÖLDGÁZSZOLGÁLTATÓ ZRT. Utilities & public services 1,473 1,384 -6.0% 23.0 21.6 -6.1% 1,349 1,248 -7.5%
142 117 HU HARMAN BECKER GÉPKOC-SIRENDSZER GYÁRTÓ KFT.
Electronics, information & telecommunications 1,334 1,366 2.4% 74.2 220.9 197.8% 2,515 2,525 0.4%
143 166 PL DINO POLSKA S.A. * Non-specialized trade 1,050 1,357 29.3% 49.7 71.5 44.0% 13,129 16,530 25.9%
144 151 PL CEDROB S.A. * Agriculture, meat, agro food and wines 1,125 1,323 17.7% 41.0 60.8 48.6% 5,749 5,227 -9.1%
145 164 RO ENGIE ROMANIA S.A. Utilities & public services 1,087 1,301 19.7% 72.3 97.8 35.2% 618 655 6.0%
146 143 PL IMPERIAL TOBACCO POLSKA S.A. Agriculture, meat, agro food and wines 1,205 1,292 7.2% 22.4 41.6 85.4% 1,005 1,132 12.6%
147 204 PL SHELL POLSKA SP. Z O.O. Minerals, chemicals, petro-leum, plastics & pharma 1,085 1,283 18.2% 20.4 28.2 38.2% 2,682 3,237 20.7%
148 141 SI KRKA, TOVARNA ZDRAVIL, D.D. Minerals, chemicals, petro-leum, plastics & pharma 1,259 1,280 1.6% 153.7 163.3 6.2% 5,002 5,020 0.4%
Henryk Baranowski President of the Management Board PGE POLSKIEJ GRUPY ENERGETYCZNEJ
The overarching objective of the PGE Group is to play a key role in ensuring the country’s energy security. As the Polish leader in electricity and heat generation, PGE also wants to initiate change in the entire sector. The list of the Group’s key projects includes investments in new gas-fired units, onshore and offshore wind farms, photovoltaics and electromobility. PGE is also interested in activities in line with the concept of a circular economy.
9TH PLACE

COFACE PUBLICATIONS CEE TOP 500 COMPANIESRANKING
29
Hungarian companies both benefit from and contribute to the supportive economic activities of the region and the business climate could remain optimistic considering that our country’s largest businesses are among the best-rated ones, with an average Coface @rating score of 7.0. However, this situation is as fragile as the economic environment. The automotive & transport industry plays a key role for all Hungarian businesses and considering the slowdown at our major export markets and the negative trends of the automotive industry overall – it is time to prepare for some tense periods to come.
Valentin POKA Country Manager Coface Hungary
* consolidated, ** estimated, *** group data, n.a. not available.P
OSI
TIO
N 2
018
CH
AN
GE
IN
PO
SITI
ON
PO
SITI
ON
20
17
CO
UN
TRY
COMPANY NAME MAIN SECTOR TUR
NO
VE
R IN
E
UR
MIL
LIO
NS
2017
TUR
NO
VE
R IN
E
UR
MIL
LIO
NS
2018
CH
AN
GE
IN
TUR
NO
VE
R
NE
T P
RO
FIT
IN
EU
R M
ILLI
ON
S 20
17
NE
T P
RO
FIT
IN
EU
R M
ILLI
ON
S 20
18
CH
AN
GE
IN
NE
T P
RO
FIT
EM
PLO
YM
EN
T
2017
EM
PLO
YM
EN
T
2018
CH
AN
GE
IN
EM
PLO
YM
EN
T
149 - 149 PL POLSKA GRUPA ZBROJENIOWA S.A. *
Minerals, chemicals, petro-leum, plastics & pharma 1,158 1,279 10.4% -26 8.7 n.a. 17,500 n.a. n.a.
150 73 PL OPEL MANUFACTURING POLAND SP. Z O.O. Automotive & transport 1,891 1,278 -32.4% 48.1 16.0 -66.8% 3,716 2,853 -23.2%
151 137 HU CONTINENTAL AUTOMOTIVE HUNGARY KFT.**
Electronics, information & telecommunications 1,243 1,271 2.3% -12.7 -105.3 727.7% 6,317 6,814 7.9%
152 187 RO PROFI ROM FOOD SRL Non-specialized trade 1,014 1,270 25.2% 28.1 -19.4 -169.2% 11,662 13,578 16.4%
153 NEW CZ LIBERTY OSTRAVA A.S. Metals 1,058 1,269 20.0% 123.5 153.7 24.5% n.a. 4,000 n.a.
154 237 PL WĘGLOKOKS S.A. * Minerals, chemicals, petro-leum, plastics & pharma 816 1,256 53.8% 44.5 n.a. n.a. 5,823 n.a. n.a.
155 174 HU OMV HUNGÁRIA ÁSVÁNYOLAJ KFT.
Minerals, chemicals, petro-leum, plastics & pharma 1,025 1,239 20.8% 33.3 21.0 -36.8% 51 53 3.9%
156 142 PL POLSKA GRUPA FARMACEUTYC-ZNA S.A. *
Minerals, chemicals, petro-leum, plastics & pharma 1,215 1,232 1.4% 5.2 2.9 -45.1% 2,214 2,245 1.4%
157 152 RO ORANGE ROMANIA SA Electronics, information & telecommunications 1,150 1,232 7.1% 68.5 41.2 -39.8% 2,361 2,366 0.2%
158 139 CZ INNOGY ENERGIE, S.R.O. Utilities & public services 1,254 1,232 -1.8% 126.1 105.0 -16.7% 237 251 5.9%
159 176 RO MEGA IMAGE SRL Non-specialized trade 1,053 1,229 16.7% 43.3 54.5 26.0% 9,313 9,741 4.6%
160 172 LT LIETUVOS ENERGIJA UAB* Utilities & public services 1,064 1,216 14.3% 93.5 6.5 -93.1% 4,513 3,813 -15.5%
161 156 PL LEROY-MERLIN POLSKA SP. Z O.O. Non-specialized trade 1,100 1,214 10.3% 37.6 50.1 33.2% 10,033 10,406 3.7%
162 159 PL PKP CARGO S.A. * Automotive & transport 1,091 1,205 10.4% 19.0 42.8 125.2% 23,253 23,425 0.7%
163 144 SI POSLOVNI SISTEM MERCATOR D.D. Non-specialized trade 1,206 1,200 -0.5% -203.7 -10.9 n.a. 8,264 8,576 3.8%
164 150 SK FOXCONN SLOVAKIA, SPOL. S R.O. Electronics, information & telecommunications 1,170 1,199 2.5% 9.6 8.7 -9.8% 1,184 1,440 21.6%
165 168 PL ELECTROLUX POLAND SP. Z O.O. Electronics, information & telecommunications 1,087 1,198 10.2% 22.0 23.0 4.7% 5,301 5,589 5.4%
166 121 CZ EZPADA S.R.O. Utilities & public services 1,425 1,190 -16.5% -5.7 1.2 n.a. 54 43 -20.4%
167 161 PL TOTALIZATOR SPORTOWY SP. Z O.O. * Others 1,085 1,188 9.4% 70.3 54.6 -22.4% 1,348 1,605 19.1%
168 295 HU E.ON ENERGIAKERESKEDELMI KFT. Utilities & public services 661 1,174 77.5% 12.4 -10.9 -187.6% 241 258 7.1%
169 163 PL IKEA INDUSTRY POLAND SP. Z O.O. Wood & furniture 1,069 1,169 9.4% 32.5 14.7 -54.9% 10,183 10,737 5.4%

COFACE PUBLICATIONS CEE TOP 500 COMPANIESRANKING
30P
OSI
TIO
N 2
018
CH
AN
GE
IN
PO
SITI
ON
PO
SITI
ON
20
17
CO
UN
TRY
COMPANY NAME MAIN SECTOR TUR
NO
VE
R IN
E
UR
MIL
LIO
NS
2017
TUR
NO
VE
R IN
E
UR
MIL
LIO
NS
2018
CH
AN
GE
IN
TUR
NO
VE
R
NE
T P
RO
FIT
IN
EU
R M
ILLI
ON
S 20
17
NE
T P
RO
FIT
IN
EU
R M
ILLI
ON
S 20
18
CH
AN
GE
IN
NE
T P
RO
FIT
EM
PLO
YM
EN
T
2017
EM
PLO
YM
EN
T
2018
CH
AN
GE
IN
EM
PLO
YM
EN
T
170 169 HU JABIL CIRCUIT MAGYARORSZÁG SZERZŐDÉSES GYÁRTÓ KFT.**
Electronics, information & telecommunications 1,040 1,168 12.4% 8.4 6.6 -21.3% 3,692 3,274 -11.3%
171 206 HU PANRUSGÁZ GÁZKERESKEDELMI ZRT.
Minerals, chemicals, petro-leum, plastics & pharma 912 1,162 27.4% 1.2 2.7 114.6% 8 8 0.0%
172 185 HR HRVATSKA ELEKTROPRIVREDA D.D. Utilities & public services 1,031 1,162 12.7% 49.1 47.8 -2.8% 451 441 -2.2%
173 160 RO AUCHAN ROMÂNIA SA Non-specialized trade 1,120 1,159 3.5% 16.1 7.5 -53.3% 9,290 10,123 9.0%
174 147 CZ O2 CZECH REPUBLIC A.S. Electronics, information & telecommunications 1,181 1,156 -2.1% 210.6 204.9 -2.7% 5,381 5,275 -2.0%
175 146 PL MICHELIN POLSKA S.A. Automotive & transport 1,160 1,152 -0.6% 77.0 40.3 -47.7% 4,772 4,857 1.8%
176 180 SK LIDL SLOVENSKÁ REPUBLIKA, V.O.S. Non-specialized trade 1,044 1,150 10.2% 97.2 110.6 13.8% 4,024 4,427 10.0%
177 158 PL GRUPA SAINT-GOBAIN POLSKA * Minerals, chemicals, petro-leum, plastics & pharma 1,104 1,147 3.9% 103.0 65.6 -36.3% 6,918 7,106 2.7%
178 202 PL MAN TRUCKS SP. Z O.O. Automotive & transport 928 1,142 23.0% 9.8 21.1 115.0% 474 492 3.8%
179 NEW PL CEDC INTERNATIONAL SP. Z O.O. Agriculture, meat, agro food and wines 1,093 1,142 4.4% 21.7 27.0 24.7% 1,128 1,158 2.7%
180 188 RO METRO CASH & CARRY ROMANIA SRL Non-specialized trade 1,014 1,137 12.1% 24.9 19.0 -23.7% 3,908 3,679 -5.9%
181 175 PL MASPEX-GMW SP. Z O.O. SP.K. * Agriculture, meat, agro food and wines 1,029 1,108 7.7% n.a. n.a. n.a. 7,191 7,587 5.5%
182 171 HU PORSCHE HUNGARIA KERESKE-DELMI KFT. Automotive & transport 1,032 1,104 6.9% 9.2 6.8 -25.5% 270 283 4.8%
183 191 PL CCC S.A. * Textiles, leather and clothing 975 1,099 12.7% 70 52.0 -26.1% 8,249 8,517 3.2%
184 194 SI LEK FARMACEVTSKA DRUŽBA D.D.
Minerals, chemicals, petro-leum, plastics & pharma 999 1,098 9.9% 83.2 116.7 40.3% 3,793 3,569 -5.9%
185 NEW PL TOYOTA MOTOR POLAND COM-PANY LIMITED SP. Z O.O. Automotive & transport 927 1,096 18.3% 2.0 0.1 -92.9% 101 102 1.0%
186 184 HR PRVO PLINARSKO DRUŠTVO D.O.O. Utilities & public services 1,028 1,096 6.6% 34.2 15.1 -55.9% 17 21 23.5%
187 192 RO ARCELORMITTAL GALAŢI SA Metals 1,000 1,094 9.5% -32.8 40.7 n.a. 5,682 5,183 -8.8%
188 189 SK CONTINENTAL MATADOR RUB-BER, S.R.O. Automotive & transport 1,008 1,089 8.1% 175.3 156.8 -10.5% 3,076 3,243 5.4%
189 173 PL SPÓŁDZIELNIA MLECZARSKA MLEKOVITA
Agriculture, meat, agro food and wines 1,028 1,086 5.7% 22.1 3.0 -86.6% 3,111 3,433 10.4%
190 177 PL CIRCLE K POLSKA SP. Z O.O. Minerals, chemicals, petro-leum, plastics & pharma 1,022 1,078 5.5% 10.8 11.4 6.0% 2,114 2,172 2.7%
191 252 PL WHIRLPOOL COMPANY POLSKA SP. Z O.O.
Electronics, information & telecommunications 1,072 1,075 0.3% -83.8 15.9 n.a. 5,052 5,012 -0.8%
Mercedes-Benz Manufacturing Hungary Kft.’s success story continued uninterruptedly throughout 2018 with the company consolidating both its market and financial position as one of Hungary’s leading companies.That could not have been achieved without the relentless efforts of our 4700 employees. Our high-quality products and innovative solutions combined with the incredible spirit of our people are the engine behind our continuous growth. By equipping our new generation compact cars with the newest digital technology based on industry 4.0, we offer state-of-the-art vehicles to our customers in modern design and fitted with smart technology.
30TH PLACE
Christian Wolff CEOMERCEDES-BENZ MANUFACTURING HUNGARY KFT.

COFACE PUBLICATIONS CEE TOP 500 COMPANIESRANKING
31
Companies operating in Poland benefited from a favourable economic environment with 2018 GDP growth reaching the highest level among CEE countries. The list of the 500 biggest companies in the region was again dominated by Polish companies with 80% of them generating a higher turnover compared to previous years.
Jarosław Jaworski Country Manager Coface Poland
* consolidated, ** estimated, *** group data, n.a. not available.P
OSI
TIO
N 2
018
CH
AN
GE
IN
PO
SITI
ON
PO
SITI
ON
20
17
CO
UN
TRY
COMPANY NAME MAIN SECTOR TUR
NO
VE
R IN
E
UR
MIL
LIO
NS
2017
TUR
NO
VE
R IN
E
UR
MIL
LIO
NS
2018
CH
AN
GE
IN
TUR
NO
VE
R
NE
T P
RO
FIT
IN
EU
R M
ILLI
ON
S 20
17
NE
T P
RO
FIT
IN
EU
R M
ILLI
ON
S 20
18
CH
AN
GE
IN
NE
T P
RO
FIT
EM
PLO
YM
EN
T
2017
EM
PLO
YM
EN
T
2018
CH
AN
GE
IN
EM
PLO
YM
EN
T
192 209 HU HUNGAROPHARMA GYÓGYSZER-KERESKEDELMI ZRT.*
Minerals, chemicals, petro-leum, plastics & pharma 899 1,073 19.4% 14.7 13.8 -6.1% 836 938 12.2%
193 - 193 SK KAUFLAND SLOVENSKÁ REPU-BLIKA V.O.S. Non-specialized trade 1,001 1,070 6.9% 45.3 49.5 9.3% 6,103 5,992 -1.8%
194 203 HUAUCHAN MAGYARORSZÁG KERESKEDELMI ÉS SZOLGÁLTATÓ KFT.
Non-specialized trade 964 1,069 10.9% 11.9 26.8 126.3% 6,065 6,346 4.6%
195 196 RO SOCIETATEA NATIONALA DE GAZE NATURALE " ROMGAZ " SA
Minerals, chemicals, petro-leum, plastics & pharma 983 1,065 8.3% 397.7 291.7 -26.6% 6,046 5,604 -7.3%
196 217 CZ SIEMENS, S.R.O. Electronics, information & telecommunications 904 1,063 17.6% 36.0 33.9 -6.0% 7,551 8,497 12.5%
197 179 HU CHINOIN GYÓGYSZER- ÉS VEGYÉ-SZETI TERMÉKEK GYÁRA ZRT.*
Minerals, chemicals, petro-leum, plastics & pharma 1,010 1,063 5.2% 115.9 122.9 6.0% 1,689 1,716 1.6%
198 190 PL PFLEIDERER GROUP S.A. * Wood & furniture 976 1,062 8.8% 16.6 5.9 -64.5% 3,521 3,735 6.1%
199 NEW PL PEPCO POLAND SP. Z O.O. Non-specialized trade 971 1,062 9.3% 91.0 108.0 18.7% 7,207 8,466 17.5%
200 178 CZ T-MOBILE CZECH REPUBLIC A.S. Electronics, information & telecommunications 1,042 1,049 0.7% 170.6 217.5 27.5% 3,414 3,499 2.5%
201 162 PL ABC DATA S.A. * Electronics, information & telecommunications 1,078 1,039 -3.6% 5.9 -16.1 -373.3% 589 634 7.6%
202 183 PL MEDIA MARKT SATURN W POLSCE *
Electronics, information & telecommunications 1,033 1,037 0.4% n.a. n.a. n.a. 5,097 4,500 -11.7%
203 205 LT SANITEX UAB* Agriculture, meat, agro food and wines 945 1,026 8.6% 8.7 20.4 134.0% 3,757 3,955 5.3%
204 216 PL RENAULT POLSKA SP. Z O.O. Automotive & transport 887 1,013 14.2% 8.6 8.6 0.3% 146 165 13.0%
205 439 PL HERMES ENERGY GROUP S.A. Utilities and public services 486 1,012 108.2% 7.4 11.5 54.8% n.a. n.a. n.a.
206 153 CZ PORSCHE ČESKÁ REPUBLIKA S.R.O. Automotive & transport 1,141 1,009 -11.6% 19.6 15.6 -20.4% 160 165 3.1%
207 197 HU PCE PARAGON SOLUTIONS KFT. Electronics, information & telecommunications 948 992 4.7% 47.6 -12.4 -126.0% 542 138 -74.5%
208 NEW HU ISD DUNAFERR ZRT.* Metals 992 992 0.0% 56.3 n.a. n.a. 3,451 3,451 0.0%
209 218 RO SAMSUNG ELECTRONICS ROMA-NIA SRL
Electronics, information & telecommunications 906 981 8.2% 13.5 19.2 42.9% 190 208 9.5%
210 224 HU SHELL HUNGARY KERESKEDELMI ZRT.
Minerals, chemicals, petro-leum, plastics & pharma 850 976 14.9% 19.9 17.0 -14.6% 120 106 -11.7%
211 207 CZ METALIMEX A. S. Metals 924 970 4.9% 9.9 12.8 29.2% 121 124 2.5%
212 227 PL IKEA RETAIL SP. Z O.O. * Non-specialized trade 871 969 11.3% -65.4 16.0 n.a. 2,391 4,536 89.7%

COFACE PUBLICATIONS CEE TOP 500 COMPANIESRANKING
32P
OSI
TIO
N 2
018
CH
AN
GE
IN
PO
SITI
ON
PO
SITI
ON
20
17
CO
UN
TRY
COMPANY NAME MAIN SECTOR TUR
NO
VE
R IN
E
UR
MIL
LIO
NS
2017
TUR
NO
VE
R IN
E
UR
MIL
LIO
NS
2018
CH
AN
GE
IN
TUR
NO
VE
R
NE
T P
RO
FIT
IN
EU
R M
ILLI
ON
S 20
17
NE
T P
RO
FIT
IN
EU
R M
ILLI
ON
S 20
18
CH
AN
GE
IN
NE
T P
RO
FIT
EM
PLO
YM
EN
T
2017
EM
PLO
YM
EN
T
2018
CH
AN
GE
IN
EM
PLO
YM
EN
T
213 233 HU PHOENIX PHARMA GYÓGYSZER-KERESKEDELMI ZRT.
Minerals, chemicals, petro-leum, plastics & pharma 824 964 16.9% 18.5 20.3 9.7% 582 602 3.4%
214 199 EE TALLINK GRUPP AS* Automotive & transport 967 950 -1.8% 46.5 40.0 -13.9% 7,406 7,430 0.3%
215 222 HU KITE MEZŐGAZDASÁGI SZOLGÁL-TATÓ ÉS KERESKEDELMI ZRT.* Mechanics & precision 861 949 10.3% 13.3 14.7 10.3% 1,169 1,241 6.2%
216 201 PL SPÓŁDZIELNIA MLECZARSKA MLEKPOL W GRAJEWIE
Agriculture, meat, agro food and wines 935 941 0.6% 11.2 6.6 -41.4% 2,474 2,622 6.0%
217 231 PL BASF POLSKA SP. Z O.O. * Non-specialized trade 839 931 10.9% n.a. n.a. n.a. 766 847 10.6%
218 264 PL MONDI ŚWIECIE S.A. Paper, packaging and printing 743 930 25.2% 159.0 301.1 89.3% 1,119 1,139 1.8%
219 230 CZ ČESKÉ DRÁHY, A.S. Automotive & transport 860 929 8.1% 55.3 17.8 -67.9% 23,542 23,374 -0.7%
220 208 CZ BOSCH DIESEL S.R.O. Automotive & transport 923 921 -0.2% 19.9 19.4 -2.3% 4,007 4,011 0.1%
221 238 PL STALPRODUKT S.A. * Minerals, chemicals, petro-leum, plastics & pharma 814 920 13.0% 64.0 66.2 3.3% 6,083 6,489 6.7%
222 290 RO
SOCIETATEA DE PRODUCERE A ENERGIEI ELECTRICE IN HIDRO-CENTRALE " HIDROELECTRICA" S.A.
Utilities & public services 698 914 31.0% 291.6 415.8 42.6% 3,279 3,305 0.8%
223 214 CZ PHOENIX LÉKÁRENSKÝ VELKOOB-CHOD, S.R.O.
Minerals, chemicals, petro-leum, plastics & pharma 938 911 -2.8% 11.6 10.7 -7.3% 726 742 2.2%
224 323 SK SAS AUTOMOTIVE S.R.O. Automotive & transport 644 910 41.3% 4.4 9.6 118.4% 573 548 -4.4%
225 - 225 PL SOKOŁÓW S.A. * Agriculture, meat, agro food and wines 853 909 6.6% 26.2 27.2 3.5% 6,876 8,006 16.4%
226 287 RO DANTE INTERNATIONAL SA Electronics, information & telecommunications 710 908 28.0% -23.9 -9.6 n.a. 1,990 2,720 36.7%
227 300 LT ME INVESTICIJA UAB* Automotive & transport 677 903 33.4% 85.7 64.3 -24.9% 8,086.0 11,780 45.7%
228 243 RO ELECTRICA FURNIZARE SA Utilities & public services 833 897 7.7% 0.3 30.2 >1,000 996 928 -6.8%
229 221 CZ GLOBUS ČR, K.S. Non-specialized trade 888 896 1.0% 14.5 15.6 7.3% 5,431 5,340 -1.7%
230 234 CZ IVECO CZECH REPUBLIC, A. S. Automotive & transport 843 896 6.2% 85.0 81.2 -4.5% 2,280 2,598 13.9%
231 228 LV RIMI LATVIA SIA Non-specialized trade 870 894 2.7% 40.8 45.3 10.9% 5,748 5,717 -0.5%
232 313 RS HBIS GROUP SERBIA IRON & STEEL D.O.O. BEOGRAD Metals 660 889 34.6% 0.0 0.2 892.8% 5,005 4,908 -1.9%
233 229 PL TELE-FONIKA KABLE S.A. * Electronics, information & telecommunications 845 886 4.9% 6.6 14.4 118.2% 3,094 2,994 -3.2%
234 226 LV URALCHEM TRADING SIA Minerals, chemicals, petro-leum, plastics & pharma 872 885 1.6% 35.7 16.3 -54.4% 44 49 11.4%
Marco Hößl CEO Kaufland Romania
When you stop wanting to grow, you stop being good. At Kaufland, we never stop thinking that we can become even better. 2018 was the year in which we grew both in the big charts and in the preferences of our consumers. We have innovated, we have created sustainable solutions for the communities in which we operate and we plan to continue in the same direction. I truly believe that civic initiatives are really changing the world, and business today must be a game of generosity beyond numbers.
59TH PLACE

COFACE PUBLICATIONS CEE TOP 500 COMPANIESRANKING
33* consolidated, ** estimated, *** group data, n.a. not available.
PO
SITI
ON
20
18
CH
AN
GE
IN
PO
SITI
ON
PO
SITI
ON
20
17
CO
UN
TRY
COMPANY NAME MAIN SECTOR TUR
NO
VE
R IN
E
UR
MIL
LIO
NS
2017
TUR
NO
VE
R IN
E
UR
MIL
LIO
NS
2018
CH
AN
GE
IN
TUR
NO
VE
R
NE
T P
RO
FIT
IN
EU
R M
ILLI
ON
S 20
17
NE
T P
RO
FIT
IN
EU
R M
ILLI
ON
S 20
18
CH
AN
GE
IN
NE
T P
RO
FIT
EM
PLO
YM
EN
T
2017
EM
PLO
YM
EN
T
2018
CH
AN
GE
IN
EM
PLO
YM
EN
T
235 212 LV LATVENERGO AS* Utilities & public services 926 878 -5.1% 322.0 76.0 -76.4% 4,075 3,617 -11.2%
236 NEW PL TPV DISPLAYS POLSKA SP. Z O.O. Electronics, information & telecommunications 812 878 8.1% 4.3 5.5 28.2% 1,465 1,481 1.1%
237 314 RO RENAULT COMMERCIAL ROUMA-NIE SRL Automotive & transport 658 877 33.3% 10.4 16.1 55.0% 171 177 3.5%
238 270 EE EESTI ENERGIA AS* Utilities & public services 754 875 16.1% 100.8 106.2 5.4% 5,708 5,678 -0.5%
239 219 CZ AT COMPUTERS A.S. Electronics, information & telecommunications 893 875 -2.0% 8.5 7.9 -7.2% 301 300 -0.3%
240 - 240 HU NEMZETI ÚTDÍJFIZETÉSI SZOL-GÁLTATÓ ZRT.* Automotive & transport 809 870 7.6% 2.7 2.6 -3.9% 729 753 3.3%
241 395 BG SAKSA LTD Minerals, chemicals, petro-leum, plastics & pharma 553 869 57.1% 5.7 8.1 43.2% 323 380 17.6%
242 376 SK FAURECIA AUTOMOTIVE SLOVA-KIA S.R.O. Automotive & transport 577 864 49.6% -6.9 -18.8 n.a. 2,337 2,696 15.4%
243 241 PL VOLVO POLSKA SP. Z O.O. Automotive & transport 807 863 6.9% 7.0 9.9 40.9% 3,245 3,514 8.3%
244 220 PL TRW POLSKA SP. Z O.O. Automotive & transport 872 862 -1.2% 19.3 -4.4 -123.0% 4,838 5,258 8.7%
245 236 RO AUTOLIV ROMANIA SRL Automotive & transport 841 858 2.0% 24.2 34.4 41.8% 9,758 9,403 -3.6%
246 253 PL NESTLE POLSKA S.A. Agriculture, meat, agro food and wines 769 855 11.3% 52.2 67.1 28.5% 4,142 4,399 6.2%
247 232 PL CIECH S.A. * Minerals, chemicals, petro-leum, plastics & pharma 832 854 2.6% 91.6 42.7 -53.4% 3,876 3,871 -0.1%
248 - 248 PL MORPOL S.A. Agriculture, meat, agro food and wines 721 852 18.1% -21.7 9.5 n.a. 3,473 3,569 2.8%
249 251 RS DELHAIZE SERBIA DOO BEOGRAD Non-specialized trade 798 847 6.1% 36.1 22.6 -37.5% 10,686 12,629 18.2%
250 235 SI GORENJE GOSPODINJSKI APA-RATI, D.D.
Electronics, information & telecommunications 844 842 -0.2% 0.5 -126.8 >-1,000 4,391 4,429 0.0%
251 259 SK ZSE ENERGIA, A.S. Utilities & public services 781 839 7.4% 9.8 14.8 51.6% 204 261 27.9%
252 393 RO COFCO INTERNATIONAL ROMA-NIA SRL
Agriculture, meat, agro food and wines 557 837 50.2% 2.4 0.9 -64.9% 67 75 11.9%
253 263 CZ METROSTAV A.S. Construction 761 836 9.9% 15.3 14.1 -7.6% 2,931 2,964 1.1%
254 273 PL ANWIM S.A. Minerals, chemicals, petro-leum, plastics & pharma 719 836 16.2% 2.3 5.4 130.7% 230 242 5.2%
255 242 RO MEDIPLUS EXIM SRL Minerals, chemicals, petro-leum, plastics & pharma 834 833 -0.1% 10.2 13.0 27.6% 1,002 1,021 1.9%
In 2019, the Russian economy has seen robust trade and budget balance surpluses against a backdrop of higher hydrocarbon prices. The market turbulence caused by a VAT hike and pension reform mostly subsided over the year with household consumption remaining the key growth driver despite relatively high inflationary expectations.
Vassiliy CHEKULAEV Country Manager Coface Russia

COFACE PUBLICATIONS CEE TOP 500 COMPANIESRANKING
34P
OSI
TIO
N 2
018
CH
AN
GE
IN
PO
SITI
ON
PO
SITI
ON
20
17
CO
UN
TRY
COMPANY NAME MAIN SECTOR TUR
NO
VE
R IN
E
UR
MIL
LIO
NS
2017
TUR
NO
VE
R IN
E
UR
MIL
LIO
NS
2018
CH
AN
GE
IN
TUR
NO
VE
R
NE
T P
RO
FIT
IN
EU
R M
ILLI
ON
S 20
17
NE
T P
RO
FIT
IN
EU
R M
ILLI
ON
S 20
18
CH
AN
GE
IN
NE
T P
RO
FIT
EM
PLO
YM
EN
T
2017
EM
PLO
YM
EN
T
2018
CH
AN
GE
IN
EM
PLO
YM
EN
T
256 246 CZ ROBERT BOSCH, SPOL. S R.O. Automotive & transport 807 832 3.1% 19.4 15.5 -20.0% 3,764 3,731 -0.9%
257 298 BG ADVANCE PROPERTIES LTD* Others 660 831 25.9% 95.3 84.4 -11.4% 52 46 -11.5%
258 256 EE NG KAPITAL OU* Others 783 822 5.0% 30.7 31.2 1.7% 4,888 4,959 1.5%
259 198 RO VODAFONE ROMANIA SA Electronics, information & telecommunications 975 818 -16.1% 15.1 38.1 152.2% 2,508 2,340 -6.7%
260 239 HR HRVATSKI TELEKOM D.D. Electronics, information & telecommunications 819 813 -0.7% 113.5 133.6 17.8% 3,709 4,216 13.7%
261 278 SK OMV SLOVENSKO, S.R.O. Minerals, chemicals, petro-leum, plastics & pharma 727 808 11.2% 12.3 14.6 18.9% 176 168 -4.5%
262 223 BG KAUFLAND BULGARIA EOOD & CO* Non-specialized trade 764 807 5.6% 39.5 37.1 -6.0% 7,297 6,358 -12.9%
263 247 HU LUK SAVARIA KUPLUNGGYÁRTÓ KFT. Automotive & transport 780 806 3.3% 44.6 45.2 1.4% 3,315 3,485 5.1%
264 344 SI OMV SLOVENIJA D.O.O. Minerals, chemicals, petro-leum, plastics & pharma 622 803 29.1% 21.8 24.0 9.8% 69 74 7.2%
265 NEW PL MARS POLSKA SP. Z O.O. Agriculture, meat, agro food and wines 296 802 171.3% -18.4 35.2 n.a. 2,519 2,718 7.9%
266 310 PL POLENERGIA S.A. * Utilities & public services 642 802 24.8% -20.4 0.8 n.a. 202 195 -3.5%
267 271 SI IMPOL D.O.O. Metals 752 801 6.5% 19.6 18.8 -4.1% 40 41 2.5%
268 257 RO SELGROS CASH & CARRY SRL Non-specialized trade 782 798 2.1% 10.5 15.7 49.8% 4,341 4,442 2.3%
269 186 RO E.ON ENERGIE ROMÂNIA SA Utilities & public services 1,015 796 -21.6% 15.5 14.2 -8.7% 182 175 -3.8%
270 250 CZ PCA LOGISTIKA CZ, S.R.O. Automotive & transport 790 794 0.5% 1.3 1.3 0.3% n.a. n.a. n.a.
271 262 PL NETTO SP. Z O.O. Agriculture, meat, agro food and wines 751 787 4.7% 17.0 19.9 17.4% 5,430 5,587 2.9%
272 283 PL UNIMOT S.A. * Minerals, chemicals, petro-leum, plastics & pharma 700 784 12.0% 4.5 -0.7 -116.1% 152 152 0.0%
273 258 LT ACHEMOS GRUPE KONCERNAS UAB* Others 781 783 0.3% 29.7 -16.5 -155.6% 4,700 4,800 2.1%
274 331 RO AMEROPA GRAINS SA Agriculture, meat, agro food and wines 635 783 23.3% 6.0 7.1 18.7% 303 340 12.2%
275 NEW HU UNIPER HUNGARY ENERGETIKAI KFT. Utilities & public services 108 781 621.8% 2.3 17.6 660.0% 30 31 3.3%
276 281 LV MAXIMA LATVIJA SIA Non-specialized trade 730 777 6.4% 23.2 21.9 -5.6% 7,424 7,427 0.0%
277 383 RO FILDAS TRADING SRL Minerals, chemicals, petro-leum, plastics & pharma 571 775 35.8% 22.2 23.4 5.7% 895 1,002 12.0%
278 412 PL GRUPA ŻYWIEC S.A. * Agriculture, meat, agro food and wines 519 773 48.9% 60.1 75.4 25.4% 2,020 2,020 0.0%
279 275 HU ARCONIC-KÖFÉM SZÉKESFEHÉR-VÁRI KÖNNYŰFÉMMŰ KFT. Metals 709 772 8.9% 111.0 98.8 -10.9% 1,972 2,117 0.0%
280 200 PL GLENCORE POLSKA SP. Z O.O. Non-specialized trade 937 771 -17.8% 1.4 11.6 733.8% 98 99 1.0%
281 NEW CZ ČESKÁ TELEKOMUNIKAČNÍ INFRASTRUKTURA A.S.
Electronics, information & telecommunications 815 770 -5.5% 105.9 99.0 -6.5% n.a. n.a. n.a.
282 249 PL IMPEXMETAL S.A. * Metals 780 767 -1.6% 14.7 43.2 193.9% 2,187 2,171 -0.7%
283 260 PL STRABAG SP. Z O.O. * Construction 703 767 9.0% 5.8 7.0 19.3% 3,064 3,625 18.3%
284 343 RO ADM ROMANIA TRADING SRL Agriculture, meat, agro food and wines 622 764 22.8% 3.4 -4.5 -232.5% 67 68 1.5%
285 390 LT GIRTEKA LOGISTICS UAB Automotive & transport 561 764 36.1% 11.6 19.1 64.0% 484 630 30.2%
286 289 RO ALTEX ROMANIA SRL Electronics, information & telecommunications 704 762 8.2% 10.4 13.6 30.5% 2,995 3,112 3.9%

COFACE PUBLICATIONS CEE TOP 500 COMPANIESRANKING
35* consolidated, ** estimated, *** group data, n.a. not available.
PO
SITI
ON
20
18
CH
AN
GE
IN
PO
SITI
ON
PO
SITI
ON
20
17
CO
UN
TRY
COMPANY NAME MAIN SECTOR TUR
NO
VE
R IN
E
UR
MIL
LIO
NS
2017
TUR
NO
VE
R IN
E
UR
MIL
LIO
NS
2018
CH
AN
GE
IN
TUR
NO
VE
R
NE
T P
RO
FIT
IN
EU
R M
ILLI
ON
S 20
17
NE
T P
RO
FIT
IN
EU
R M
ILLI
ON
S 20
18
CH
AN
GE
IN
NE
T P
RO
FIT
EM
PLO
YM
EN
T
2017
EM
PLO
YM
EN
T
2018
CH
AN
GE
IN
EM
PLO
YM
EN
T
287 272 HU MICHELIN HUNGÁRIA ABRONCS-GYÁRTÓ KFT. Automotive & transport 722 756 4.7% 37.3 34.1 -8.6% 1,244 1,188 -4.5%
288 261 HU DENSO GYÁRTÓ MAGYARORSZÁG KFT. Automotive & transport 755 755 0.0% 15.8 0.0 -100.0% 4,270 4,270 0.0%
289 274 PL TRANSGOURMET POLSKA SP. Z O.O. Non-specialized trade 717 755 5.2% 13.5 9.1 -32.2% 4,287 4,346 1.4%
290 277 CZ DOPRAVNÍ PODNIK HL. M. PRAHY, AKCIOVÁ SPOLEČNOST Automotive & transport 723 753 4.2% 73.9 59.4 -19.6% 10,994 10,984 -0.1%
291 280 HU OPEL SOUTHEAST EUROPE AUTÓ-FORGALMAZÓ KFT. Automotive & transport 700 752 7.4% 0.3 10.5 >1,000 236 197 -16.5%
292 349 PL CMC POLAND SP. Z O.O. Metals 597 746 25.0% 29.7 61.5 107.2% 1,838 1,937 5.4%
293 296 HU PENNY-MARKET KERESKEDELMI KFT. Non-specialized trade 660 745 12.8% 5.2 7.6 47.1% 3,804 3,737 -1.8%
294 267 PL SAMSUNG ELECTRONICS POLAND MANUFACTURING SP. Z O.O.
Electronics, information & telecommunications 735 742 1.0% 24.6 19.2 -21.9% 2,619 2,537 -3.1%
295 327 PL CELSA HUTA OSTROWIEC SP. Z O.O. Metals 622 741 19.1% 28.3 27.4 -3.3% 1,654 1,579 -4.5%
296 325 RO REWE (ROMANIA) SRL Non-specialized trade 643 741 15.2% 4.1 7.7 88.3% 4,190 4,174 -0.4%
297 288 PL ARCTIC PAPER S.A. * Paper, packaging and printing 687 734 7.0% 15.1 13.0 -14.2% 1,739 1,726 -0.7%
298 279 SK TESCO INTERNATIONAL CLO-THING BRAND S.R.O. Non-specialized trade 727 733 0.8% 7.2 0.0 -99.4% n.a. n.a. n.a.
299 337 LT KESKO SENUKAI LITHUANIA UAB* Construction 632 732 15.8% 9.9 0.0 -100.0% 7,541 7,359 -2.4%
300 301 HU WABERER 'S INTERNATIONAL NYRT.* Automotive & transport 652 732 12.3% 17.8 -20.9 -217.7% 7,265 8,077 11.2%
301 335 PL AUTO-HANDEL-CENTRUM KRO-TOSKI, CICHY SP.J. * Automotive & transport 615 730 18.7% 8.4 8.5 0.9% 937 1,073 14.5%
302 417 PL ITAKA HOLDINGS SP. Z O.O.* Others 621 728 17.2% 4.9 n.a. n.a. 695 680 -2.2%
303 244 PL ZAKŁADY FARMACEUTYCZNE POLPHARMA S.A. *
Minerals, chemicals, petro-leum, plastics & pharma 794 727 -8.5% -24.9 99.7 n.a. 5,967 6,250 4.7%
304 353 SK STREDOSLOVENSKÁ ENERGETIKA HOLDING, A.S. Utilities & public services 611 727 18.9% 6.4 9.0 40.3% 295 293 -0.7%
305 382 HUMAVIR MAGYAR VILLAMOSENER-GIA-IPARI ÁTVITELI RENDSZE-RIRÁNYÍTÓ ZRT.
Utilities & public services 553 725 31.1% 26.8 28.6 6.5% 641 647 0.9%
306 211 RS FCA SRBIJA D.O.O. KRAGUJEVAC Automotive & transport 929 724 -22.1% 18.0 12.8 -28.9% 2,364 2,280 -3.6%
307 282 RS TELEKOM SRBIJA A.D., BEOGRAD Electronics, information & telecommunications 724 723 -0.2% 123.1 0.1 -99.9% 7,919 7,777 -1.8%
308 311 PL FORD POLSKA SP. Z O.O. Automotive & transport 642 715 11.4% 1.7 -0.1 -103.2% 74 70 -5.4%
309 421 HR CRODUX DERIVATI DVA D.O.O. Minerals, chemicals, petro-leum, plastics & pharma 526 715 35.9% 12.3 15.5 26.3% 961 1,120 16.5%
310 286 RO OMV PETROM GAS SRL Minerals, chemicals, petro-leum, plastics & pharma 711 713 0.3% 11.8 13.4 13.5% 51 49 -3.9%
311 302 PL ONICO S.A. * Minerals, chemicals, petro-leum, plastics & pharma 654 711 8.6% 2.5 4.9 97.7% 58 84 44.8%
312 276 HU EATON ENTERPRISES (HUNGARY) KFT.
Electronics, information & telecommunications 706 711 0.6% 657.3 701.6 6.7% 272 447 64.3%
313 308 CZ HELLA AUTOTECHNIK NOVA, S.R.O.
Electronics, information & telecommunications 657 709 8.0% 26.4 22.7 -14.1% 2,578 3,022 17.2%
314 299 CZ ALLIANCE HEALTHCARE S.R.O. Minerals, chemicals, petro-leum, plastics & pharma 673 706 5.0% 9.8 10.0 2.7% 408 413 1.2%
315 269 RS MERCATOR-S DOO NOVI SAD Non-specialized trade 756 703 -7.0% -58.0 -14.1 n.a. 8,345 8,124 -2.6%
316 170 PL UNILEVER POLSKA SP. Z O.O. Agriculture, meat, agro food and wines 715 702 -1.8% 6.2 14.0 127.2% 749 702 -6.3%
317 245 EE ERICSSON EESTI AS Electronics, information & telecommunications 815 702 -13.9% 3.8 3.4 -12.0% 1,547 1,495 -3.4%

COFACE PUBLICATIONS CEE TOP 500 COMPANIESRANKING
36P
OSI
TIO
N 2
018
CH
AN
GE
IN
PO
SITI
ON
PO
SITI
ON
20
17
CO
UN
TRY
COMPANY NAME MAIN SECTOR TUR
NO
VE
R IN
E
UR
MIL
LIO
NS
2017
TUR
NO
VE
R IN
E
UR
MIL
LIO
NS
2018
CH
AN
GE
IN
TUR
NO
VE
R
NE
T P
RO
FIT
IN
EU
R M
ILLI
ON
S 20
17
NE
T P
RO
FIT
IN
EU
R M
ILLI
ON
S 20
18
CH
AN
GE
IN
NE
T P
RO
FIT
EM
PLO
YM
EN
T
2017
EM
PLO
YM
EN
T
2018
CH
AN
GE
IN
EM
PLO
YM
EN
T
318 333 RO FARMEXPERT D.C.I. SRL Minerals, chemicals, petro-leum, plastics & pharma 634 700 10.4% 19.2 18.1 -5.8% 959 942 -1.8%
319 210 PL SKANSKA S.A. Construction 902 699 -22.5% -131.1 -94.6 n.a. 5,456 4,689 -14.1%
320 336 PL GRUPA KĘTY S.A. * Metals 614 696 13.3% 55.0 62.4 13.5% 4,858 5,146 5.9%
321 294 SK SLOVAK TELEKOM, A.S. Electronics, information & telecommunications 684 696 1.7% 66.2 106.3 60.5% 3,015 2,999 -0.5%
322 254 HU ELECTROLUX LEHEL HŰTŐGÉPGYÁR KFT.
Electronics, information & telecommunications 759 690 -9.1% 5.6 7.2 26.9% 3,052 2,964 -2.9%
323 321 PL PKP ENERGETYKA S.A. Utilities & public services 626 688 10.0% 39.2 40.3 3.0% 4,887 3,832 -21.6%
324 309 PL ABB SP. Z O.O. Electronics, information & telecommunications 643 688 7.1% -6.0 -16.8 n.a. 3,236 3,414 5.5%
325 367 RO HELLA ROMÂNIA SRL Automotive & transport 587 687 17.1% 30.4 41.0 34.9% 3,684 4,145 12.5%
326 338 CZ TANK ONO, S.R.O. Minerals, chemicals, petro-leum, plastics & pharma 624 686 10.0% 3.5 2.0 -42.4% 443 450 1.6%
327 345 HR LIDL HRVATSKA D.O.O. K.D. Non-specialized trade 626 686 9.5% 35.4 38.0 7.4% 2,055 2,060 0.2%
328 405 LT VIADA LT UAB* Minerals, chemicals, petro-leum, plastics & pharma 541 685 26.5% 4.8 5.0 3.3% 1,529 2,599 70.0%
329 NEW LT EUROAPOTHECA UAB* Minerals, chemicals, petro-leum, plastics & pharma 367 683 86.0% 19.1 17.8 -7.0% 3,037 3,867 27.3%
330 360 PL THYSSENKRUPP ENERGOSTAL S.A. Metals 583 682 16.9% 16.4 15.8 -3.7% 1,003 1,067 6.4%
331 307 SI TELEKOM SLOVENIJE, D.D. Electronics, information & telecommunications 663 681 2.8% 1.7 34.0 >1,000 2,196 2,338 6.5%
332 317 EE TALLINNA KAUBAMAJA GRUPP AS* Others 651 681 4.6% 29.8 30.4 2.0% 4,182 4,283 2.4%
333 332 PL AMICA S.A. * Electronics, information & telecommunications 617 681 10.3% 35.1 26.6 -24.2% 3,120 3,020 -3.2%
334 341 RO PORSCHE ROMANIA SRL Automotive & transport 623 677 8.8% 23.0 33.0 43.3% 144 144 0.0%
335 305 PL GRUPA E.LECLERC * Non-specialized trade 651 677 3.9% n.a. n.a. n.a. 5,000 5,000 0.0%
336 291 CZ ČESKÁ POŠTA, S.P. Electronics, information & telecommunications 690 676 -2.0% 3.0 -8.2 -371.8% 29,638 29,016 -2.1%
337 312 HU MAGYAR POSTA ZRT.* Electronics, information & telecommunications 638 675 5.9% 1.5 -7.6 -591.1% 31,916 31,843 -0.2%
338 359 CZ ADIENT CZECH REPUBLIC K.S. Automotive & transport 597 671 12.5% 0.0 0.0 23.8% 4,073 4,236 4.0%
339 293 CZ OMV ČESKÁ REPUBLIKA, S.R.O. Minerals, chemicals, petro-leum, plastics & pharma 682 670 -1.9% 21.8 22.8 4.7% 38 46 21.1%
340 285 HU HANKOOK TIRE MAGYARORSZÁG GYÁRTÓ ÉS KERESKEDELMI KFT. Automotive & transport 691 669 -3.1% 140.9 156.0 10.7% 3,143 2,957 -5.9%
341 265 HU BUDAPESTI ELEKTROMOS MŰVEK NYRT.* Utilities & public services 652 668 2.5% 61.4 46.5 -24.2% 1,673 1,650 -1.4%
342 377 BG BULGARGAZ JSC Utilities & public services 576 667 15.7% 4.8 -16.4 -437.8% 60 58 -3.3%
343 358 PL STOKROTKA SP. Z O.O. Non-specialized trade 589 664 12.7% 4.6 -4.3 -192.3% 8,206 8,743 6.5%
344 315 RS NELT CO. DOO DOBANOVCI. Agriculture, meat, agro food and wines 657 662 0.8% 11.3 4.5 -59.7% 1,825 1,828 0.2%
345 386 RS
PREDUZEĆE ZA PROIZVODNJU GUMA TIGAR TYRES, DRUŠTVO SA OGRANIČENOM ODGOVORNOŠĆU PIROT
Automotive & transport 570 661 15.9% 87.2 40.9 -53.2% 3,364 3,388 0.7%
346 316 HU BORGWARNER OROSZLÁNY KFT.** Automotive & transport 633 661 4.4% 76.0 65.7 -13.6% 1,443 1,684 16.7%
347 397 RO MICHELIN ROMANIA S.A. Automotive & transport 550 660 20.0% 11.0 21.2 93.1% 3,282 3,874 18.0%
348 329 PL PKP INTERCITY S.A.* Automotive & transport 626 658 5.0% 72.4 39.2 -45.8% 8,264 8,605 4.1%

COFACE PUBLICATIONS CEE TOP 500 COMPANIESRANKING
37* consolidated, ** estimated, *** group data, n.a. not available.
PO
SITI
ON
20
18
CH
AN
GE
IN
PO
SITI
ON
PO
SITI
ON
20
17
CO
UN
TRY
COMPANY NAME MAIN SECTOR TUR
NO
VE
R IN
E
UR
MIL
LIO
NS
2017
TUR
NO
VE
R IN
E
UR
MIL
LIO
NS
2018
CH
AN
GE
IN
TUR
NO
VE
R
NE
T P
RO
FIT
IN
EU
R M
ILLI
ON
S 20
17
NE
T P
RO
FIT
IN
EU
R M
ILLI
ON
S 20
18
CH
AN
GE
IN
NE
T P
RO
FIT
EM
PLO
YM
EN
T
2017
EM
PLO
YM
EN
T
2018
CH
AN
GE
IN
EM
PLO
YM
EN
T
349 304 RO CONTINENTAL AUTOMOTIVE PRODUCTS SRL Automotive & transport 671 655 -2.5% 149.6 124.7 -16.6% 2,423 2,501 3.2%
350 297 PL OKTAN ENERGY & V/L SERVICE SP. Z O.O.
Minerals, chemicals, petro-leum, plastics & pharma 662 654 -1.1% 4.5 6.4 43.2% 18 20 11.1%
351 362 RS JAVNO PREDUZEĆE SRBIJAGAS NOVI SAD Utilities & public services 597 653 9.3% 141.5 125.8 -11.1% 1,101 1,071 -2.7%
352 326 LT PALINK UAB Non-specialized trade 643 649 1.0% 9.9 22.2 125.2% 6,916 6,626 -4.2%
353 400 HUALDI MAGYARORSZÁG ÉLELMIS-ZER ÉLELMISZER KERESKEDELMI BT.
Non-specialized trade 531 649 22.4% 7.2 16.1 123.8% 2,942 3,124 6.2%
354 356 SK SCHAEFFLER KYSUCE, SPOL. S R.O. Mechanics and precision 608 649 6.7% 16.6 13.9 -15.9% 5,051 5,095 0.9%
355 445 RO ROBERT BOSCH SRL Automotive & transport 490 644 31.3% 17.9 26.5 47.9% 2,491 3,287 32.0%
356 328 PLTORUŃSKIE ZAKŁADY MATERIAŁÓW OPATRUNKOWYCH S.A. *
Non-specialized trade 622 642 3.2% 76.8 77.3 0.6% 6,838 7,815 14.3%
357 369 CZ PLZEŇSKÝ PRAZDROJ, A. S. Agriculture, meat, agro food and wines 579 642 10.9% 150.3 173.2 15.2% 1,994 1,977 -0.9%
358 354 PL GRUPA RABEN * Automotive & transport 594 638 7.5% 40.5 54.5 34.6% 5,151 5,226 1.5%
359 324 CZ SYNTHOS KRALUPY A.S. Minerals, chemicals, petro-leum, plastics & pharma 638 637 -0.1% 56.9 67.6 18.7% 695 700 0.7%
360 NEW PL PORR S.A. Construction 392 636 62.4% 1.3 -1.7 -233.6% 1,881 2,295 22.0%
361 320 LT LINAS AGRO GROUP AB* Agriculture, meat, agro food & wines 645 634 -1.6% 8.4 9.5 12.5% 2,217 2,199 -0.8%
362 380 SK GGT A. S. Agriculture, meat, agro food & wines 573 632 10.4% 0.9 0.9 -0.5% 198 217 9.6%
363 365 PL OPEL POLAND SP. Z O.O. Automotive & transport 574 632 10.1% 2.1 5.4 150.9% 92 81 -12.0%
364 357 LT MG BALTIC KONCERNAS UAB* Others 607 632 4.0% 22.7 19.4 -14.5% 3,866 3,981 3.0%
365 NEW PL GRUPA PSB HANDEL S.A. Non-specialized trade 387 631 63.1% 4.7 5.8 22.8% 513 550 7.2%
366 340 HR PETROL D.O.O. Minerals, chemicals, petro-leum, plastics & pharma 629 628 -0.3% 8.2 12.0 45.7% 880 907 3.1%
367 403 BG EXPRESS LOGISTIC AND DISTRI-BUTION LTD
Agriculture, meat, agro food and wines 546 627 14.7% -5.2 1.4 n.a. 919 887 -3.5%
368 355 PL ZAKŁADY TŁUSZCZOWE KRUSZWICA S.A. *
Agriculture, meat, agro food and wines 596 624 4.7% 9.6 23.2 141.7% 867 840 -3.1%
369 342 PL HUTCHINSON POLAND SP. Z O.O. Minerals, chemicals, petro-leum, plastics & pharma 605 623 2.9% 63.9 48.4 -24.2% 6,893 7,075 2.6%
370 384 PLZJEDNOCZONE PRZEDSIĘBIORSTWA ROZRYW-KOWE S.A. *
Others 554 616 11.1% 20.7 9.6 -53.7% 2,540 2,756 8.5%
371 306 CZ EBERSPÄCHER SPOL. S R.O. Automotive & transport 663 616 -7.2% 15.8 11.7 -26.4% 848 714 -15.8%
372 215 HU TEVA GYÓGYSZERGYÁR ZRT.* Minerals, chemicals, petro-leum, plastics & pharma 886 613 -30.8% -28.6 409.2 >-1,000 2,632 2,036 -22.6%
373 346 CZ PRAŽSKÁ ENERGETIKA, A.S. Utilities & public services 615 609 -1.0% 86.0 90.8 5.6% 1,449 1,005 -30.6%
374 404 BG ASTRA BIOPLANT Minerals, chemicals, petro-leum, plastics & pharma 543 609 12.3% 1.0 6.6 551.0% 135 150 11.1%
375 339 RO SOCIETATEA COMPLEXUL ENER-GETIC OLTENIA S.A. Utilities & public services 628 609 -3.0% 38.8 -243.1 -726.8% 13,704 13,109 -4.3%
376 422 BG SOPHARMA JSC* Minerals, chemicals, petro-leum, plastics & pharma 523 609 16.3% 23.4 15.7 -33.1% 1,991 2,316 16.3%
377 398 PL JYSK SP. Z O.O. Non-specialized trade 534 608 13.9% 24.8 27.6 11.1% 2,082 2,267 8.9%
378 401 SK BILLA S.R.O. Non-specialized trade 548 607 10.8% 6.7 6.2 -7.0% 4,337 4,135 -4.7%
379 446 RO CARGILL AGRICULTURA SRL Agriculture, meat, agro food and wines 490 605 23.5% 2.2 -3.8 -273.0% 159 145 -8.8%

COFACE PUBLICATIONS CEE TOP 500 COMPANIESRANKING
38P
OSI
TIO
N 2
018
CH
AN
GE
IN
PO
SITI
ON
PO
SITI
ON
20
17
CO
UN
TRY
COMPANY NAME MAIN SECTOR TUR
NO
VE
R IN
E
UR
MIL
LIO
NS
2017
TUR
NO
VE
R IN
E
UR
MIL
LIO
NS
2018
CH
AN
GE
IN
TUR
NO
VE
R
NE
T P
RO
FIT
IN
EU
R M
ILLI
ON
S 20
17
NE
T P
RO
FIT
IN
EU
R M
ILLI
ON
S 20
18
CH
AN
GE
IN
NE
T P
RO
FIT
EM
PLO
YM
EN
T
2017
EM
PLO
YM
EN
T
2018
CH
AN
GE
IN
EM
PLO
YM
EN
T
380 351 LT ENERGIJOS SKIRSTYMO OPERA-TORIUS AB Utilities & public services 611 604 -1.2% 77.6 15.7 -79.8% 2,503 2,454 -2.0%
381 388 PL GRUPA MASPEX SP. Z O.O. SP.K. Others 548 602 9.8% 10.0 7.9 -21.2% 273 323 18.3%
382 NEW CZ SILMET PŘÍBRAM A.S. Minerals, chemicals, petro-leum, plastics & pharma 462 595 28.8% 0.3 3.0 937.0% 43 50 16.3%
383 NEW PL SUPERHOBBY MARKET BUDOWLANY SP. Z O.O. Non-specialized trade 554 595 7.4% 26.1 13.1 -49.8% 4,602 5,339 16.0%
384 350 HU APTIV SERVICES HUNGARY KFT. Electronics, information & telecommunications 591 593 0.3% -82.2 -1.1 n.a. 2,156 1,833 -15.0%
385 430 LT SPECTATOR UAB* Others 510 593 16.2% 14.7 7.8 -47.3% 776 796 2.6%
386 NEW HUNISSAN SALES CENTRAL & EAS-TERN EUROPE KERESKEDELMI KFT.
Automotive & transport 586 586 0.0% -2.7 0.0 n.a. 121 121 0.0%
387 396 HU SE-CEE SCHNEIDER ELECTRIC KÖZÉP-KELET EURÓPAI KFT. Automotive & transport 533 585 9.8% 18.1 13.2 -27.2% 293 306 4.4%
388 392 SK CONTINENTAL MATADOR TRUCK TIRES S.R.O. Automotive & transport 559 585 4.6% 61.5 70.6 14.9% 1,459 1,543 5.8%
389 361 PL NGK CERAMICS POLSKA SP. Z O.O. Minerals, chemicals, petro-leum, plastics & pharma 582 578 -0.7% 94.0 43.2 -54.1% 4,096 4,200 2.5%
390 NEW HU VIDEOTON HOLDING ZRT. * Others 533 577 8.4% 42.2 60.9 44.3% 8,769 9,208 5.0%
391 370 PL INTERNATIONAL PAPER-KWIDZYN SP. Z O.O. Paper, packaging and printing 566 577 2.0% 104.4 63.6 -39.1% 1,635 1,845 12.8%
392 319 ROCOMPANIA NATIONALA DE TRANSPORT AL ENERGIEI ELEC-TRICE "TRANSELECTRICA" SA
Utilities & public services 647 574 -11.1% 6.1 17.4 187.6% 2,063 2,102 1.9%
393 NEW BG DAPHNA GROUP LTD* Non-specialized trade 530 574 8.3% 6.4 4.4 -31.4% 10 10 0.0%
394 458 BG AEC KOZLODUI JSC* Utilities & public services 478 573 20.0% 60.5 83.6 38.2% 3,721 3,709 -0.3%
395 213 PL FLEXTRONICS INTERNATIONAL POLAND SP. Z O.O.
Electronics, information & telecommunications 893 572 -36.0% 36.4 -13.1 -135.9% 3,305 3,322 0.5%
396 442 HU NI HUNGARY SOFTWARE ÉS HARDWARE GYÁRTÓ KFT.
Electronics, information & telecommunications 483 570 18.1% 48.9 60.8 24.3% 1,308 1,456 11.3%
397 330 PL WORK SERVICE S.A. * Others 618 569 -8.0% -20.0 1.9 n.a. 26,994 n.a. n.a.
398 378 HU ELMŰ-ÉMÁSZ ENERGIASZOLGÁL-TATÓ ZRT. Utilities & public services 556 568 2.2% 0.1 0.7 762.8% 3 n.a. n.a.
399 372 CZ GASNET, S.R.O. Utilities & public services 576 567 -1.5% 181.9 177.6 -2.4% 160 147 -8.1%
400 532 EE MANOIR ENERGY OU Minerals, chemicals, petro-leum, plastics & pharma 423 567 34.0% 3.9 5.4 36.5% 6 6 0.0%
401 423 HU PHILIP MORRIS MAGYARORSZÁG CIGARETTA KERESKEDELMI KFT.
Agriculture, meat, agro food and wines 505 566 12.2% 3.3 3.3 0.3% 149 147 -1.3%
402 NEW RO TELEKOM ROMANIA COMMUNICA-TIONS S.A.
Electronics, information & telecommunications 582 565 -2.9% -203.0 -26.4 n.a. 4,733 4,404 -7.0%
403 366 RO TAKATA ROMANIA SRL Automotive & transport 590 563 -4.5% 10.3 10.6 3.0% 4,830 4,906 1.6%
404 477 CZ STAVEBNINY DEK A.S. Non-specialized trade 458 561 22.6% 7.3 8.1 10.3% 1,294 1,586 22.6%
405 255 CZ ČEPS, A.S. Utilities & public services 777 561 -27.8% 90.5 91.0 0.6% 703 724 3.0%
406 410 CZ ARMEX OIL, S.R.O. Minerals, chemicals, petro-leum, plastics & pharma 532 561 5.5% 6.6 3.5 -47.4% 46 50 8.7%
407 478 LV ORLEN LATVIJA SIA Minerals, chemicals, petro-leum, plastics & pharma 461 560 21.5% 2.3 3.4 44.6% 9 9 0.0%
408 413 RO ALRO SA Metals 532 560 5.3% 68.1 48.5 -28.9% 2,501 2,549 1.9%
409 416 PL ROBERT BOSCH SP. Z O.O. Automotive & transport 513 558 8.8% 13.9 15.9 14.2% 1,460 1,622 11.1%
410 507 RO OSCAR DOWNSTREAM SRL Minerals, chemicals, petro-leum, plastics & pharma 439 558 27.0% 15.9 12.6 -20.9% 424 428 0.9%

COFACE PUBLICATIONS CEE TOP 500 COMPANIESRANKING
39* consolidated, ** estimated, *** group data, n.a. not available.
PO
SITI
ON
20
18
CH
AN
GE
IN
PO
SITI
ON
PO
SITI
ON
20
17
CO
UN
TRY
COMPANY NAME MAIN SECTOR TUR
NO
VE
R IN
E
UR
MIL
LIO
NS
2017
TUR
NO
VE
R IN
E
UR
MIL
LIO
NS
2018
CH
AN
GE
IN
TUR
NO
VE
R
NE
T P
RO
FIT
IN
EU
R M
ILLI
ON
S 20
17
NE
T P
RO
FIT
IN
EU
R M
ILLI
ON
S 20
18
CH
AN
GE
IN
NE
T P
RO
FIT
EM
PLO
YM
EN
T
2017
EM
PLO
YM
EN
T
2018
CH
AN
GE
IN
EM
PLO
YM
EN
T
411 434 HR SPAR HRVATSKA D.O.O. Non-specialized trade 454 557 22.8% -14.0 -5.5 n.a. 3,746 3,637 -2.9%
412 399 PLOPERATOR GAZOCIĄGÓW PRZESYŁOWYCH GAZ-SYSTEM S.A. *
Automotive & transport 533 551 3.4% 114.5 120.0 4.8% 2,845 2,975 4.6%
413 472 SK N I K É , SPOL. S R.O. Others 467 551 17.9% 10.1 10.0 -1.2% 900 921 2.3%
414 402 CZ VODAFONE CZECH REPUBLIC A.S. Electronics, information & telecommunications 542 550 1.5% 29.0 43.7 51.0% 1,656 1,531 -7.5%
415 394 SK ORANGE SLOVENSKO, A.S. Electronics, information & telecommunications 555 550 -0.9% 92.2 74.3 -19.4% 1,122 1,147 2.2%
416 303 HU LEAR CORPORATION HUNGARY AUTÓIPARI GYÁRTÓ KFT. Automotive & transport 650 549 -15.5% -0.6 -14.3 >1,000 3,322 2,637 -20.6%
417 375 PL ANWIL S.A. Minerals, chemicals, petro-leum, plastics & pharma 561 545 -2.8% 75.7 48.7 -35.7% 1,260 1,318 4.6%
418 322 HU MET MAGYARORSZÁG ENERGIAKERESKEDŐ ZRT. Utilities & public services 623 545 -12.5% 0.9 0.3 -70.6% 78 80 2.6%
419 415 HU ELMŰ-ÉMÁSZ ENERGIAKERESKEDŐ KFT. Utilities & public services 511 545 6.6% 5.3 2.0 -62.0% 259 251 -3.1%
420 459 RO COCA-COLA HBC ROMANIA SRL Agriculture, meat, agro food and wines 476 543 14.0% 72.4 71.4 -1.4% 1,476 1,410 -4.5%
421 433 SK IKEA COMPONENTS S.R.O. Non-specialized trade 507 542 6.9% 9.4 7.9 -16.6% 785 868 10.6%
422 364 HR PLIVA HRVATSKA D.O.O. Minerals, chemicals, petro-leum, plastics & pharma 585 542 -7.5% 69.8 15.3 -78.0% 2,218 2,217 0.0%
423 551 LT NEO GROUP UAB Minerals, chemicals, petro-leum, plastics & pharma 406 541 33.3% 14.5 31.6 117.4% 179 207 15.6%
424 504 PL CARGOTEC POLAND SP. Z O.O. Metals 436 541 24.2% 16.7 17.7 5.6% 1,186 1,483 25.0%
425 371 HR HEP-ODS D.O.O. Utilities & public services 583 538 -7.8% 91.7 72.1 -21.3% 7,454 6,476 -13.1%
426 428 RO PHILIP MORRIS TRADING SRL Agriculture, meat, agro food & wines 510 538 5.5% 30.1 35.0 16.1% 233 237 1.7%
427 368 PL ZESPÓŁ ELEKTROWNI PĄTNÓW-ADAMÓW-KONIN S.A. * Utilities & public services 568 536 -5.7% 42.7 -107.8 -352.6% 5,946 5,209 -12.4%
428 448 HU VODAFONE MAGYARORSZÁG MOBIL TÁVKÖZLÉSI ZRT.
Electronics, information & telecommunications 536 536 0.0% 46.4 0.0 -100.0% 1,920 1,920 0.0%
429 444 PL COCA-COLA HBC POLSKA SP. Z O.O.
Agriculture, meat, agro food & wines 480 535 11.5% 25.4 32.8 28.8% 1,860 1,798 -3.3%
430 456 SI RENAULT NISSAN SLOVENIJA, D.O.O. Automotive & transport 479 535 11.8% 4.8 8.4 74.2% 110 111 0.9%
431 480 RO ENEL ENERGIE MUNTENIA SA Utilities & public services 458 534 16.7% -16.9 -1.5 n.a. 223 233 4.5%
432 373 PL TOYOTA MOTOR MANUFACTURING POLAND SP. Z O.O. Automotive & transport 563 533 -5.3% 9.7 -0.3 -102.8% 1,897 1,876 -1.1%
433 426 SI PORSCHE SLOVENIJA D.O.O. Automotive & transport 515 533 3.4% 11.7 12.4 6.7% 107 106 -0.9%
434 424 SK MONDI SCP, A.S. Paper, packaging & printing 517 533 3.1% 72.3 87.7 21.4% 1,042 1,129 8.3%
435 NEW LT VG HOLDING UAB* Others 489 531 8.7% 21.2 22.8 7.5% 6,128 6,440 5.1%
436 NEW PL MAN TRUCK & BUS POLSKA SP. Z O.O. Automotive & transport 446 531 18.9% 12.6 -4.0 -131.5% 359 395 10.0%
437 429 HU TELENOR MAGYARORSZÁG ZRT. Electronics, information & telecommunications 494 530 7.4% 82.3 98.0 19.1% 1,168 980 -16.1%
438 432 HR HEP PROIZVODNJA D.O.O. Utilities & public services 470 529 12.6% 68.7 58.1 -15.4% 1,935 1,909 -1.3%
439 542 EE ENEFIT ENERGIATOOTMINE AS Utilities & public services 415 529 27.3% 2.3 57.0 >1,000 916 921 0.5%
440 NEW PL WIPASZ S.A. Agriculture, meat, agro food & wines 527 528 0.2% 15.3 15.2 -0.9% 1,390 1,474 0.0%
441 455 PL SOLARIS BUS & COACH S.A.* Automotive & transport 489 527 7.8% -3.4 -74.0 >1,000 2,260 2,353 4.1%

COFACE PUBLICATIONS CEE TOP 500 COMPANIESRANKING
40P
OSI
TIO
N 2
018
CH
AN
GE
IN
PO
SITI
ON
PO
SITI
ON
20
17
CO
UN
TRY
COMPANY NAME MAIN SECTOR TUR
NO
VE
R IN
E
UR
MIL
LIO
NS
2017
TUR
NO
VE
R IN
E
UR
MIL
LIO
NS
2018
CH
AN
GE
IN
TUR
NO
VE
R
NE
T P
RO
FIT
IN
EU
R M
ILLI
ON
S 20
17
NE
T P
RO
FIT
IN
EU
R M
ILLI
ON
S 20
18
CH
AN
GE
IN
NE
T P
RO
FIT
EM
PLO
YM
EN
T
2017
EM
PLO
YM
EN
T
2018
CH
AN
GE
IN
EM
PLO
YM
EN
T
442 528 BG SOFIA MED JSC Metals 434 526 21.1% 9.2 6.5 -28.8% 597 633 6.0%
443 389 SK PHOENIX ZDRAVOTNÍCKE ZÁSO-BOVANIE, A.S.
Minerals, chemicals, petro-leum, plastics & pharma 562 524 -6.8% 5.4 4.7 -13.0% 449 436 -2.9%
444 713 LT KAUNO GRŪDAI AB* Agriculture, meat, agro food & wines 467 524 12.1% 6.8 7.6 12.9% 774 751 -3.0%
445 420 HUVALEO AUTO-ELECTRIC MAGYA-RORSZÁG GÉPJÁRMŰALKATRÉSZ-GYÁRTÓ KFT.
Automotive & transport 508 523 2.9% 10.3 -6.8 -166.2% 1,968 2,051 4.2%
446 NEW PL TUI POLAND SP. Z O.O. Others 327 522 59.5% -0.3 2.7 n.a. 113 111 -1.8%
447 452 RO PIRELLI TYRES ROMANIA SRL Automotive & transport 484 521 7.8% 16.8 19.5 16.0% 3,053 3,569 16.9%
448 431 CZ FERONA, A.S. Metals 504 520 3.1% 11.3 8.2 -28.0% 947 928 -2.0%
449 NEW PL FAMUR S.A.* Mechanics and precision 339 518 52.7% 13.2 51.0 286.3% 4,331 5,164 19.2%
450 NEW BG HUVEPROJECT JSC* Minerals, chemicals, petro-leum, plastics & pharma 435 517 19.0% 79.3 84.1 6.0% 18 25 38.9%
451 476 HUSYNOPSYS GLOBAL LICENCIA SZOLGÁLTATÓ ÉS KERESKEDELMI KFT.
Others 448 516 15.2% 61.0 661.6 984.6% 14 13 -7.1%
452 435 PL SWISS KRONO SP. Z O.O. Wood & furniture 490 515 5.3% 50.4 82.1 62.9% 1,061 1,092 2.9%
453 454 LT VICIUNU GRUPE UAB* Agriculture, meat, agro food & wines 481 515 7.1% 19.2 22.3 -100.0% 4,698 4,920 4.7%
454 407 PL AVON OPERATIONS POLSKA SP. Z O.O.
Minerals, chemicals, petro-leum, plastics & pharma 524 514 -1.8% 44.6 39.7 -10.9% 1,296 1,285 -0.8%
455 381 PL BAYER SP. Z O.O. Minerals, chemicals, petro-leum, plastics & pharma 556 513 -7.8% 23.3 19.5 -16.5% 982 1,167 18.8%
456 525 PL TELEWIZJA POLSKA S.A. Paper, packaging & printing 413 513 24.1% 0.1 0.8 519.5% 2,657 2,761 3.9%
457 517 RO ENEL ENERGIE SA Utilities & public services 431 513 19.0% -19.2 -9.7 n.a. 220 226 2.7%
458 385 HR PLODINE D.D. Non-specialized trade 509 511 0.3% 14.9 16.0 7.1% 3,582 3,629 1.3%
459 505 PL HAVI LOGISTICS SP. Z O.O. Automotive & transport 430 507 18.0% 0.9 0.9 -0.9% 365 405 11.0%
460 699 BG INDEPENDENT BULGARIAN ENERGY EXCHANGE JSC Utilities & public services 317 507 59.8% 0.8 2.0 141.2% 18 24 33.3%
461 - 461 SKUNIPHARMA - 1. SLOVENSKÁ LEKÁRNICKÁ AKCIOVÁ SPOLOČNOSŤ
Minerals, chemicals, petro-leum, plastics & pharma 475 507 6.7% 2.6 2.3 -12.3% 719 723 0.6%
462 NEW CZ HP TRONIC ZLÍN, SPOL. S R.O. Electronics, information & telecommunications 302 505 67.3% 1.3 -3.2 -349.7% 1,017 2,400 136.0%
463 406 PL IMPEL S.A. * Others 525 505 -3.7% 3.2 3.8 18.6% 15,758 14,925 -5.3%
464 437 SK ZÁPADOSLOVENSKÁ DISTRIBUČNÁ, A.S. Utilities & public services 502 504 0.3% 64.5 65.1 0.8% 1,292 1,423 10.1%
465 NEW CZ ADIENT BOR S.R.O. Automotive & transport 429 501 16.8% -43.4 -14.3 n.a. 496 886 78.6%
466 497 RO MERCEDES-BENZ ROMANIA SRL Automotive & transport 446 501 12.4% 6.3 6.0 -4.8% 239 266 11.3%
467 436 HU GLENCORE AGRICULTURE HUN-GARY KFT.
Agriculture, meat, agro food & wines 486 501 3.1% -9.0 -10.0 n.a. 90 93 3.3%
468 471 CZ VARROC LIGHTING SYSTEMS, S.R.O.
Electronics, information & telecommunications 464 500 7.9% 32.8 23.3 -29.1% 2,617 2,828 8.1%
469 530 PL GOBARTO S.A. Agriculture, meat, agro food & wines 411 499 21.4% 7.2 4.1 -42.7% 2,804 2,319 -17.3%
470 334 CZ AUTOMOTIVE LIGHTING S.R.O. Automotive & transport 628 499 -20.5% 58.5 25.7 -56.1% 2,157 2,014 -6.6%
471 510 PL BREMBO POLAND SP. Z O.O. Automotive & transport 424 499 17.7% 91.2 74.8 -18.0% 1,855 2,074 11.8%
472 292 PL KRAJOWA SPÓŁKA CUKROWA S.A. *
Agriculture, meat, agro food and wines 672 498 -25.9% 87.3 7.9 -91.0% 2,324 2,399 3.2%

COFACE PUBLICATIONS CEE TOP 500 COMPANIESRANKING
41* consolidated, ** estimated, *** group data, n.a. not available.
PO
SITI
ON
20
18
CH
AN
GE
IN
PO
SITI
ON
PO
SITI
ON
20
17
CO
UN
TRY
COMPANY NAME MAIN SECTOR TUR
NO
VE
R IN
E
UR
MIL
LIO
NS
2017
TUR
NO
VE
R IN
E
UR
MIL
LIO
NS
2018
CH
AN
GE
IN
TUR
NO
VE
R
NE
T P
RO
FIT
IN
EU
R M
ILLI
ON
S 20
17
NE
T P
RO
FIT
IN
EU
R M
ILLI
ON
S 20
18
CH
AN
GE
IN
NE
T P
RO
FIT
EM
PLO
YM
EN
T
2017
EM
PLO
YM
EN
T
2018
CH
AN
GE
IN
EM
PLO
YM
EN
T
473 460 RO ARCTIC SA Electronics, information & telecommunications 475 498 4.7% 15.9 15.6 -1.7% 2,822 3,034 7.5%
474 481 CZ PHILIP MORRIS ČR A.S. Agriculture, meat, agro food & wines 454 496 9.4% 137.3 146.8 7.0% 1,226 1,218 -0.7%
475 NEW RO BLUE AIR AVIATION S.A. Automotive & transport 412 496 20.5% -32.1 -31.2 n.a. 1,240 1,121 -9.6%
476 473 SK ŽELEZNICE SLOVENSKEJ REPU-BLIKY Automotive & transport 466 496 6.3% 0.1 0.2 68.6% 13,781 13,665 -0.8%
477 379 PL PT DYSTRYBUCJA S.A.* Agriculture, meat, agro food & wines 556 494 -11.2% -0.5 -0.8 n.a. 531 495 -6.8%
478 438 HU METRO KERESKEDELMI KFT. Agriculture, meat, agro food & wines 484 494 2.0% -19.0 2.9 n.a. 2,530 2,400 -5.1%
479 575 SK FORTUNA SK, A.S. Others 391 494 26.5% 10.2 9.9 -2.8% 550 546 -0.7%
480 499 PL SCANIA POLSKA S.A. Automotive & transport 432 494 14.2% 22.7 29.4 29.4% 685 698 1.9%
481 475 BG BULGARIAN TELECOMMUNICA-TIONS COMPANY JSC*
Electronics, information & telecommunications 464 494 6.4% 36.4 65.3 79.6% 1,584 1,524 -3.8%
482 NEW EE BALTIC SEA BUNKERING OU* Others 186 493 165.4% 5.3 5.1 -4.6% 95 91 -4.2%
483 453 SK SCHAEFFLER SKALICA, SPOL. S R.O. Mechanics & precision 482 493 2.2% 7.7 10.6 36.6% 4,866 4,977 2.3%
484 535 RO REGIA NATIONALA A PADURILOR ROMSILVA RA Wood & furniture 421 492 17.0% 53.4 38.2 -28.4% 16,246 16,485 1.5%
485 427 CZ SAMSUNG ELECTRONICS CZECH AND SLOVAK, S.R.O.
Electronics, information & telecommunications 510 490 -3.9% 11.4 9.8 -13.5% 167 145 -13.2%
486 419 HU EGIS GYÓGYSZERGYÁR ZRT.* Minerals, chemicals, petro-leum, plastics & pharma 484 490 1.3% 74.9 53.1 -29.1% 4,364 4,398 0.8%
487 NEW EE NT BUNKERING AS Minerals, chemicals, petro-leum, plastics & pharma 181 488 169.7% 4.1 4.6 12.4% 18 20 11.1%
488 NEW PL ANIMEX K4 SP. Z O.O. Agriculture, meat, agro food & wines 562 487 -13.2% 1.3 1.1 -14.0% 8,600 n.a. n.a.
489 545 PL HURTAP S.A. Minerals, chemicals, petro-leum, plastics & pharma 479 487 1.5% 2.7 2.5 -5.7% 776 719 -7.3%
490 465 SK ESET, SPOL. S R.O. Electronics, information & telecommunications 470 485 3.3% 65.5 68.1 4.0% 797 855 7.3%
491 662 BG LITEX JSC* Minerals, chemicals, petro-leum, plastics & pharma 339 485 43.1% 0.8 -5.6 -785.1% 39 22 -43.6%
492 521 PL COGNOR HOLDING S.A.* Others 416 484 16.4% 11.6 16.8 44.4% 2,059 2,074 0.7%
493 520 BG LIDL BULGARIA EOOD END KO COMMONDITE Non-specialized trade 430 483 12.3% 9.2 15.0 63.9% 2,346 2,738 16.7%
494 474 EE MAXIMA EESTI OU Non-specialized trade 464 482 3.8% 8.2 7.4 -9.8% 3,912 3,559 -9.0%
495 450 SI ENGROTUŠ PODJETJE ZA TRGO-VINO, D.O.O. Non-specialized trade 487 482 -1.0% 6.0 1.7 -72.2% 2,779 2,726 -1.9%
496 447 HU MÁV MAGYAR ÁLLAMVASUTAK ZRT. Automotive & transport 473 482 1.8% 24.3 33.6 38.0% 18,194 18,118 -0.4%
497 589 RO BOSCH AUTOMOTIVE S.R.L. Mechanics & precision 380 481 26.7% 16.2 28.2 73.8% 2,718 3,209 18.1%
498 451 HR KAUFLAND HRVATSKA K.D. Non-specialized trade 482 481 -0.2% -6.2 -3.5 n.a. 2,141 2,444 14.2%
499 586 PL WIELTON S.A. * Automotive & transport 371 481 29.5% 19.4 16.5 -14.9% 2,288 2,788 21.9%
500 605 EE ORLEN EESTI OU Minerals, chemicals, petro-leum, plastics & pharma 371 479 29.1% 1.8 2.3 28.0% 14 14 0.0%

COFACE CEE ECONOMIC OUTLOOK

COFACE PUBLICATIONS CEE TOP 500 COMPANIESRANKING
43
GRZEGORZ SIELEWICZECONOMISTCENTRAL & EASTERN EUROPE
Country risk
Assessments and studies available at http://www.cofacecentraleurope.com/Economic-analysis
Very low
Low
Satisfactory
Reasonable
Fairly High
High
Very High
Extreme
A1
A2
A4
C
D
E
A3
B
Business climate
Very satisfactory
Stable
Safe
Acceptable
Unstable
Difficult
Very Difficult
Extremely difficult
A1
A2
A4
C
D
E
A3
B
Country Risk Assessment
The Country Risk Assessment provides an insight into the average payment incident level presented by companies in a country in connection with their short-term trading transactions. More specifically, this assessment measures the way in which company payment behaviour is influenced by a country’s economic, financial, and political perspectives, as well as by the business climate. It is based on three pillars: macroeconomic, financial and political analysis, business climate assessment by Coface’s entities across the world, and Coface’s payment behaviour experience as recorded in its worldwide database.
Business climate assessment
This makes it possible to see whether company accounts are available and reliable, whether the legal system ensures fair and effective protection of creditors, whether the country’s institutions provide a favourable framework for B2B transactions and whether the domestic market is easy to access. The assessments are based on data from international organisations, but also, and primarily, on the experience of Coface’s entities across the world.
Each quarter, 160 country evaluations are made available to our clients on an open access basis.

COFACE PUBLICATIONS CEE TOP 500 COMPANIESRANKING
44
After a slight slowdown in GDP growth to 3.2%, Bulgarian growth is expected to stabilise at 3.3% in 2019. As in the past, domestic demand remains the leading driver of growth – even if increasing less vigorously than in 2018. It is currently benefiting from the high level of household confidence and rising wages in both the public and private sectors, against a backdrop of skill shortages. The historically low unemployment rate (4.8% in December 2018 and dropping further in 2019) and the 10% increase in the minimum wage in 2019 are also having a positive impact.
Despite their low absorption rate, European Structural Funds, together with increased capacity utilisation, will stimulate investment (19% of GDP in 2018). In addition, consolidation of the banking sector – which began in the wake of the 2014 banking crisis – will continue with a reduction in non-performing loans and an increase in credit. The textile sector (10% of exports) will continue to expand, supported by the competitiveness of the Bulgarian workforce.
However, exports could suffer from more muted growth in some European Union countries (65% of exports) and Turkey (8%). After increasing in 2018, partly due to higher energy and fuel prices, inflation is expected to hold steady in 2019, again supported by household consumption.
Table 2: Coface Bulgarian Top 10Turnover and net profit in EUR millions
* consolidated, ** estimated, n.a. not available.
Domestic demand will remain the leading growth driver.
+3.3%
BULGARIA
A4
COFACE ASSESSMENTJUNE 2019
COUNTRY RISK
A3BUSINESS CLIMATE
COFACE 2019GDP FORECAST
RA
NK
RA
NK
TO
P 5
00
COMPANY NAME MAIN SECTOR TUR
NO
VE
R IN
E
UR
MIL
LIO
NS
2017
TUR
NO
VE
R IN
E
UR
MIL
LIO
NS
2018
CH
AN
GE
IN
TUR
NO
VE
R
NE
T P
RO
FIT
IN
EU
R M
ILLI
ON
S 20
17
NE
T P
RO
FIT
IN
EU
R M
ILLI
ON
S 20
18
CH
AN
GE
IN
NE
T P
RO
FIT
EM
PLO
YM
EN
T
2017
EM
PLO
YM
EN
T
2018
CH
AN
GE
IN
EM
PLO
YM
EN
T
1 31 BULGARIAN ENERGY HOLDING JSC* Utilities & public services 3,287 3,542 7.8% 60.8 -133.5 -319.6% 87 86 -1.1%
2 38 LUKOIL NEFTOHIM BURGAS JSC Minerals, chemicals, petroleum, plas-tics & pharma 2,863 3,007 5.0% 155.4 -130.0 -183.7% 1,397 1,346 -3.7%
3 48 AURUBIS BULGARIA JSC* Metals 2,566 2,528 -1.5% 201.2 103.5 -48.6% 858 879 2.4%
4 99 LUKOIL-BULGARIA LTD Minerals, chemicals, petroleum, plas-tics & pharma 1,361 1,703 25.2% -3.1 0.5 n.a. 2,733 2,717 -0.6%
5 105 NATSIONALNA ELEKTRICHESKA KOMPANIA JSC Utilities & public services 1,584 1,627 2.7% 3.5 -37.7 >-1000 1,397 2,073 48.4%
6 241 SAKSA LTD Minerals, chemicals, petroleum, plas-tics & pharma 553 869 57.1% 5.7 8.1 43.2% 323 380 17.6%
7 257 ADVANCE PROPERTIES LTD* Others 660 831 25.9% 95.3 84.4 -11.4% 52 46 -11.5%
8 262 KAUFLAND BULGARIA EOOD & CO* Non-specialized trade 764 807 5.6% 39.5 37.1 -6.0% 7,297 6,358 -12.9%
9 342 BULGARGAZ JSC Utilities & public services 576 667 15.7% 4.8 -16.4 -437.8% 60 58 -3.3%
10 367 EXPRESS LOGISTIC AND DISTRIBUTION LTD Agriculture, meat, agro food & wines 546 627 14.7% -5.2 1.4 n.a. 919 887 -3.5%

COFACE PUBLICATIONS CEE TOP 500 COMPANIESRANKING
45
The economy is expected to record a fifth consecutive strong year in 2019, driven by domestic demand.
Owing to the labour shortage, household consumption (58% of GDP) will continue to benefit from wage growth, the impact of tourism (25% of GDP, one in ten jobs), expatriate remittances, and the VAT reduction from 25% to 13% on food products on January 1.
In addition, inflation is expected to remain low, with energy prices levelling off and the pending arrival of a discounter in the food retail sector. When combined with the stability of the kuna, this should allow the central bank to maintain an accommodative policy. Investors, meanwhile, will be heartened by the resolution of the Agrokor case and credit growth, particularly for SMEs. Work on the Peljesac bridge – which will broaden Bosnia’s maritime access to provide a road connection between the North and South of the Croatian coastline – resumed in the summer of 2018.
Implementation of European funds is also set to increase, benefiting construction. Exports will get a boost from market share gains in the EU, particularly in the oil, food, medical, lingerie, and control instruments segments. Tourism revenue should remain on a positive trend, although competition from Turkey, Egypt and Tunisia may cast a shadow. However, as imports will be simultaneously boosted by domestic demand, the contribution of trade to growth should remain slightly negative.
Table 3: Coface Croatia Top 10Turnover and net profit in EUR millions
* consolidated, ** estimated, n.a. not available.
Activity supported by domestic demand.
+2.5%
CROATIA
COFACE ASSESSMENTJUNE 2019
A3BUSINESS CLIMATE
COFACE 2019GDP FORECAST
RA
NK
RA
NK
TO
P 5
00
COMPANY NAME MAIN SECTOR TUR
NO
VE
R IN
E
UR
MIL
LIO
NS
2017
TUR
NO
VE
R IN
E
UR
MIL
LIO
NS
2018
CH
AN
GE
IN
TUR
NO
VE
R
NE
T P
RO
FIT
IN
EU
R M
ILLI
ON
S 20
17
NE
T P
RO
FIT
IN
EU
R M
ILLI
ON
S 20
18
CH
AN
GE
IN
NE
T P
RO
FIT
EM
PLO
YM
EN
T
2017
EM
PLO
YM
EN
T
2018
CH
AN
GE
IN
EM
PLO
YM
EN
T
1 40 INA D.D. Minerals, chemicals, petroleum, plas-tics & pharma 2,371 2,842 19.9% 229.3 182.5 -20.4% 4,292 4,138 -3.6%
2 172 HRVATSKA ELEKTROPRIVREDA D.D. Utilities & public services 1,031 1,162 12.7% 49.1 47.8 -2.8% 451 441 -2.2%
3 186 PRVO PLINARSKO DRUŠTVO D.O.O. Utilities & public services 1,028 1,096 6.6% 34.2 15.1 -55.9% 17 21 23.5%
4 260 HRVATSKI TELEKOM D.D. Electronics, information & telecom-munications 819 813 -0.7% 113.5 133.6 17.8% 3,709 4,216 13.7%
5 309 CRODUX DERIVATI DVA D.O.O. Minerals, chemicals, petroleum, plas-tics & pharma 526 715 35.9% 12.3 15.5 26.3% 961 1,120 16.5%
6 327 LIDL HRVATSKA D.O.O. K.D. Non-specialized trade 626 686 9.5% 35.4 38.0 7.4% 2,055 2,060 0.2%
7 366 PETROL D.O.O. Minerals, chemicals, petroleum, plas-tics & pharma 629 628 -0.3% 8.2 12.0 45.7% 880 907 3.1%
8 411 SPAR HRVATSKA D.O.O. Non-specialized trade 454 557 22.8% -14.0 -5.5 n.a. 3,746 3,637 -2.9%
9 422 PLIVA HRVATSKA D.O.O. Minerals, chemicals, petroleum, plas-tics & pharma 585 542 -7.5% 69.8 15.3 -78.0% 2,218 2,217 0.0%
10 425 HEP-ODS D.O.O. Utilities & public services 583 538 -7.8% 91.7 72.1 -21.3% 7,454 6,476 -13.1%
A4COUNTRY RISK

COFACE PUBLICATIONS CEE TOP 500 COMPANIESRANKING
46R
AN
K
RA
NK
TO
P 5
00
COMPANY NAME MAIN SECTOR TUR
NO
VE
R IN
E
UR
MIL
LIO
NS
2017
TUR
NO
VE
R IN
E
UR
MIL
LIO
NS
2018
CH
AN
GE
IN
TUR
NO
VE
R
NE
T P
RO
FIT
IN
EU
R M
ILLI
ON
S 20
17
NE
T P
RO
FIT
IN
EU
R M
ILLI
ON
S 20
18
CH
AN
GE
IN
NE
T P
RO
FIT
EM
PLO
YM
EN
T
2017
EM
PLO
YM
EN
T
2018
CH
AN
GE
IN
EM
PLO
YM
EN
T
1 2 ŠKODA AUTO A.S. Automotive & transport 15,837 16,199 2.3% 1,237.8 1,017.8 -17.8% 32,985 35,355 7.2%
2 10 ALPIQ ENERGY SE Utilities & public services 5,413 5,489 1.4% 3.8 -19.5 -617.2% 149 98 -34.2%
3 15 HYUNDAI MOTOR MANUFACTURING CZECH S.R.O. Automotive & transport 5,313 5,025 -5.4% 260.2 347.1 33.4% 2,563 2,552 -0.4%
4 16 UNIPETROL RPA, S.R.O. Minerals, chemicals, petroleum, plas-tics & pharma 4,443 4,778 7.5% 358.8 340.7 -5.1% 410 416 1.5%
5 19 RWE SUPPLY & TRADING CZ, A.S. Utilities & public services 4,067 4,506 10.8% 63.7 64.8 1.6% 15 15 0.0%
6 36 ČEZ, A. S. Utilities & public services 3,003 3,070 2.2% 198.5 924.3 365.7% 29,837 31,385 5.2%
7 45 MND A.S. Minerals, chemicals, petroleum, plas-tics & pharma 1,292 2,687 108.0% -4.5 -5.7 n.a. 370 884 138.9%
8 49 MORAVIA STEEL A.S. Metals 2,246 2,513 11.9% 106.4 107.8 1.3% 306 325 6.2%
9 62 ČEPRO, A.S. Minerals, chemicals, petroleum, plas-tics & pharma 1,873 2,285 22.0% 35.9 40.4 12.5% 757 757 0.0%
10 67 KAUFLAND ČESKÁ REPUBLIKA V.O.S. Non-specialized trade 2,218 2,243 1.1% 76.7 119.7 56.0% 12,198 11,384 -6.7%
In 2018, the growth rate of the Czech economy slowed to 2.9% from 4.4% in 2017. However, the fair level of expansion is expected to continue.
As in previous years, economic activity is strongly supported by growing household consumption, which benefits from increased consumer confidence, thanks to growing wages and decreasing unemployment. The jobless rate remains at the lowest level in the EU, at just 2.1% in December 2018. While the situation on the labor market is positive for households, companies have a range of concerns: the talent pool is limited and the number of job vacancies has soared to the highest level in the EU. Faced with rising labor costs, further strong wage pressures and higher input prices, companies’ profitability has barely increased. The Czech labor market will remain challenging for businesses in the coming years, especially as the supply of labor will suffer from an ageing population.
Private investment is continuing its recovery and remains the second-most important contributor to growth because of the high capacity utilisation ratio and the surge in public investments supported by EU funds. Despite this, investments are likely to be less robust in 2019 than in 2018, mostly due to moderating public investment. As a small and open economy, the Czech Republic is highly dependent on the external sector. The automotive sector – which accounts for 28% of industrial production, 20% of exports of goods and 10% of GDP – is expected to grow but also face more risks than in recent years. Western European demand is crucial in this regard, but the inclusion of Czech companies in global production chains (not only in the automotive sector) makes them vulnerable to weaker global trade dynamics.
Table 4: Coface Czech Top 10Turnover and net profit in EUR millions
* consolidated, ** estimated, *** group data, n.a. not available.
Dynamic economic activity.
+2.5%
CZECH REPUBLIC
A2
COFACE ASSESSMENTJUNE 2019
COUNTRY RISK
A2BUSINESS CLIMATE
COFACE 2018GDP FORECAST

COFACE PUBLICATIONS CEE TOP 500 COMPANIESRANKING
47
The lively investment (24% of GDP in 2018) will continue to contribute to growth in 2019. Private investment will be supported by sustained business confidence and the high capacity utilization rate. In addition, companies enjoy a tax exemption on reinvested profits.
Public investment, boosted by European funds, will benefit the development of infrastructure, particularly in transport and education. However, growth is expected to slow in 2019. Private consumption – the traditional driver of growth – should continue to expand, but its contribution will be limited by a smaller increase in the employment rate. Wage growth, fuelled by the shortage of skilled labour as a result of emigration and population decline, is also expected to be lower. Nevertheless, slower inflation will boost household demand.
The industrial sector will remain concentrated around telephony, furniture and the automotive sector. With nearly 70% of industrial production being exported, the sector will benefit from its good level of competitiveness. However, cooler European growth could impact external demand, which is largely driven by neighbouring countries. This would have a severe effect on the country's economy, with industry generating 24% of GDP. At the same time, rail and road transport are benefiting now that the transit of capital goods to Russia has resumed. In addition, a transport cooperation agreement was signed in December 2017 to improve the train line between the two countries.
Table 5: Coface Estonian Top 10Turnover and net profit in EUR millions
* consolidated, ** estimated, n.a. not available.
Growth driven by domestic demand.
+2.9%
ESTONIA
A2
COFACE ASSESSMENTJUNE 2019
COUNTRY RISK
A1BUSINESS CLIMATE
COFACE 2019GDP FORECAST
RA
NK
RA
NK
TO
P 5
00
COMPANY NAME MAIN SECTOR TUR
NO
VE
R IN
E
UR
MIL
LIO
NS
2017
TUR
NO
VE
R IN
E
UR
MIL
LIO
NS
2018
CH
AN
GE
IN
TUR
NO
VE
R
NE
T P
RO
FIT
IN
EU
R M
ILLI
ON
S 20
17
NE
T P
RO
FIT
IN
EU
R M
ILLI
ON
S 20
18
CH
AN
GE
IN
NE
T P
RO
FIT
EM
PLO
YM
EN
T
2017
EM
PLO
YM
EN
T
2018
CH
AN
GE
IN
EM
PLO
YM
EN
T
1 214 TALLINK GRUPP AS* Automotive & transport 967 950 -1.8% 46.5 40.0 -13.9% 7,406 7,430 0.3%
2 238 EESTI ENERGIA AS* Utilities & public services 754 875 16.1% 100.8 106.2 5.4% 5,708 5,678 -0.5%
3 258 NG KAPITAL OU* Others 783 822 5.0% 30.7 31.2 1.7% 4,888 4,959 1.5%
4 317 ERICSSON EESTI AS Electronics, information & telecom-munications 815 702 -13.9% 3.8 3.4 -12.0% 1,547 1,495 -3.4%
5 332 TALLINNA KAUBAMAJA GRUPP AS* Financial services 651 681 4.6% 29.8 30.4 2.0% 4,182 4,283 2.4%
6 400 MANOIR ENERGY OU Minerals, chemicals, petroleum, plas-tics & pharma 423 567 34.0% 3.9 5.4 36.5% 6 6 0.0%
7 439 ENEFIT ENERGIATOOTMINE AS Utilities & public services 415 529 27.3% 2.3 57.0 >1000 916 921 0.5%
8 482 BALTIC SEA BUNKERING OU* Others 186 493 165.4% 5.3 5.1 -4.6% 95 91 -4.2%
9 487 NT BUNKERING AS Minerals, chemicals, petroleum, pla-stics & pharma 181 488 169.7% 4.1 4.6 12.4% 18 20 11.1%
10 494 MAXIMA EESTI OU Non-specialized trade 464 482 3.8% 8.2 7.4 -9.8% 3,912 3,559 -9.0%

COFACE PUBLICATIONS CEE TOP 500 COMPANIESRANKING
48R
AN
K
RA
NK
TO
P 5
00
COMPANY NAME MAIN SECTOR TUR
NO
VE
R IN
E
UR
MIL
LIO
NS
2017
TUR
NO
VE
R IN
E
UR
MIL
LIO
NS
2018
CH
AN
GE
IN
TUR
NO
VE
R
NE
T P
RO
FIT
IN
EU
R M
ILLI
ON
S 20
17
NE
T P
RO
FIT
IN
EU
R M
ILLI
ON
S 20
18
CH
AN
GE
IN
NE
T P
RO
FIT
EM
PLO
YM
EN
T
2017
EM
PLO
YM
EN
T
2018
CH
AN
GE
IN
EM
PLO
YM
EN
T
1 3 MOL MAGYAR OLAJ- ÉS GÁZIPARI NYRT.*
Minerals, chemicals, petroleum, plastics & pharma 12,868 16,103 25.1% 985.8 952.3 -3.4% 5,372 4,889 -9.0%
2 7 AUDI HUNGARIA ZRT. Automotive & transport 7,299 7,377 1.1% 352.6 425.2 20.6% 9,318 13,393 43.7%
3 11 MVM MAGYAR VILLAMOS MŰVEK ZRT.* Utilities & public services 4,147 5,355 29.1% 12.2 68.1 457.8% 9,294 10,859 16.8%
4 22 ROBERT BOSCH ELEKTRONIKA GYÁRTÓ KFT.**
Electronics, information & telecommunications 3,740 4,228 13.1% 72.7 86.8 >1.000 13,432 14,160 5.4%
5 30 MERCEDES-BENZ MANUFACTURING HUNGARY KFT. Automotive & transport 3,436 3,561 3.7% 74.4 86.6 16.3% 3,648 4,281 17.4%
6 47 WIZZ AIR HUNGARY ZRT. Automotive & transport 2,102 2,550 21.3% 279.3 261.3 -6.4% 2,282 3,746 64.2%
7 61 MAGYAR FÖLDGÁZKERESKEDŐ ZRT. Utilities & public services 1,625 2,318 42.6% 4.2 10.6 151.6% 105 96 -8.6%
8 68 FLEXTRONICS INTERNATIONAL KFT. Electronics, information & telecom-munications 2,235 2,235 0.0% -12.8 n.a. n.a. 6,972 6,972 0.0%
9 69 GE INFRASTRUCTURE HUNGARY HOLDING KFT.* Mechanics and precision 2,221 2,221 0.0% 301.0 n.a. n.a. 11,310 11,310 0.0%
10 75 SAMSUNG ELECTRONICS MAGYAR ZRT.
Electronics, information & telecom-munications 2,164 2,056 -5.0% 348.0 68.4 -80.4% 1,762 1,647 -6.5%
Growth is expected to slow slightly in 2019 after solid expansion in both 2017 and 2018. Domestic demand remains the main driving force of the economy with household consumption increasing as a result of rising employment and wage growth (including significant wage increases in the public sector).
The unemployment rate reached 3.7% in December 2018 – one of the lowest levels in the EU and well below its average of 6.6%. A further slight decrease in unemployment is expected, although a lack of available labour will reduce employment growth. Labour shortages have become a significant obstacle for companies, limiting their capacity to expand and driving wages higher. Despite what households perceive as being a good situation on the labour market, private consumption will accelerate at a slower rate, as the large public sector wage increase will fade and a further increase is unlikely. Economic growth has also benefited from rebounding investments, thanks notably to a surge in public projects. Faced with high capacity utilization, the private sector will likely be willing to make investments. Within this context, the FDI inflow and EU structural funds are strong drivers of investment. On the other hand, SME investments are rather lackluster, in large part due to labour shortages and the uncertainty of continuing solid demand. Since 2017, companies in Hungary have benefited from a 9% corporate tax rate – the lowest in Europe. Hungary’s main exports are machinery products, vehicles and pharmaceuticals.
Table 6: Coface Hungarian Top 10Turnover and net profit in EUR millions
* consolidated, ** estimated, *** group data, n.a. not available.
Investment and consumption drive growth.
+4.0%
HUNGARY
A3
COFACE ASSESSMENTJUNE 2019
COUNTRY RISK
A3BUSINESS CLIMATE
COFACE 2019GDP FORECAST

COFACE PUBLICATIONS CEE TOP 500 COMPANIESRANKING
49
Despite the continued deceleration that began in 2018, growth is expected to remain at a good level in 2019. Private consumption is the main driver of Latvian activity. It increased by 3.2% in 2018, and an increase in real wages, coupled with a further decline in unemployment, should help to maintain this momentum.
However, the chronic decline in labor force participation rates is expected to continue due to the significant emigration of skilled youth and the decline in the working-age population, but could be offset to some extent by an increase in the retirement age, which is to be raised by three months each year to reach age 65 in 2025. Public consumption and investment will remain brisk, supported by EU structural and investment funds between 2014-2020 in an amount of 4.51 billion (15% of GDP), including 1 billion for infrastructure construction and rural development, and 140 million to develop maritime activity. Private investment will remain constrained by concerns about Russia and could also be affected by recent controversies over the fragility of the financial system (central bank governor Ilmars Rimsevics has been accused of corruption, while ABLV, the country’s third largest bank, has been accused of money laundering and facilitating illegal financial transactions towards North Korea, and is now reported to be in bankruptcy).
Exports of timber (16% of total exports), equipment and tooling (15%), and food products (11%) to the other Baltic countries, Poland, and Germany – the main trading partners – are set to continue, while those to Russia may continue to suffer from Russian counter-sanctions. Inflation is expected to remain under control.
Table 7: Coface Latvian Top 10Turnover and net profit in EUR millions
* consolidated, ** estimated, n.a. not available.
Growth driven by domestic demand.
+3.1%
LATVIA
A3
COFACE ASSESSMENTJUNE 2019
COUNTRY RISK
A2BUSINESS CLIMATE
COFACE 2019GDP FORECAST
RA
NK
RA
NK
TO
P 5
00
COMPANY NAME MAIN SECTOR TUR
NO
VE
R IN
E
UR
MIL
LIO
NS
2017
TUR
NO
VE
R IN
E
UR
MIL
LIO
NS
2018
CH
AN
GE
IN
TUR
NO
VE
R
NE
T P
RO
FIT
IN
EU
R M
ILLI
ON
S 20
17
NE
T P
RO
FIT
IN
EU
R M
ILLI
ON
S 20
18
CH
AN
GE
IN
NE
T P
RO
FIT
EM
PLO
YM
EN
T
2017
EM
PLO
YM
EN
T
2018
CH
AN
GE
IN
EM
PLO
YM
EN
T
1 79 URALKALI TRADING SIA Minerals, chemicals, petroleum, plastics & pharma 2,055 1,944 -5.4% 18.0 16.5 -8.1% 39 51 30.8%
2 122 ELKO GRUPA AS* Electronics, information & telecommunications 1,409 1,497 6.3% 12.2 7.9 -35.3% 900 1,000 11.1%
3 231 RIMI LATVIA SIA Non-specialized trade 870 894 2.7% 40.8 45.3 n.a. 5,748 5,717 -0.5%
4 234 URALCHEM TRADING SIA Minerals, chemicals, petroleum, plas-tics & pharma 872 885 1.6% 35.7 16.3 -54.4% 44 49 11.4%
5 235 LATVENERGO AS* Utilities & public services 926 878 -5.1% 322.0 76.0 -76.4% 4,075 3,617 -11.2%
6 276 MAXIMA LATVIJA SIA Non-specialized trade 730 777 6.4% 23.2 21.9 -5.6% 7,424 7,427 0.0%
7 407 ORLEN LATVIJA SIA Minerals, chemicals, petroleum, plas-tics & pharma 461 560 21.5% 2.3 3.4 44.6% 9 9 0.0%
8 - AIR BALTIC CORPORATION AS* Automotive & transport 343 402 17.1% 4 2.96 -22.0% 1,369 1,514 10.6%
9 - CIRCLE K LATVIA SIA Minerals, chemicals, petroleum, plas-tics & pharma 368 387 5.2% 21 21.35 1.6% 763 819 7.3%
10 - LATVIJAS DZELZCELS AS* Automotive & transport 319 365 14.6% 31 14.41 -53.8% 11,189 10,400 -7.1%

COFACE PUBLICATIONS CEE TOP 500 COMPANIESRANKING
50
The renewed strength of the economy in 2017/18 is expected to fade in 2019 as growth starts moving towards its potential level. Reduced pressure on the labor market (thanks to a slight increase in immigration and a fall in employment) and low productivity growth, in the absence of structural reforms, should moderate wage growth and, therefore, private consumption, which is the main contributor to growth (two thirds of GDP).
Tax reforms aimed at introducing a progressive taxation system are expected to favour the poorest households, which, thanks to their higher marginal propensity to consume, should mitigate the deceleration in consumption. The level of wages, particularly the minimum wage, will nevertheless remain quite high relative to productivity, which will negatively impact the competitiveness of companies, impeding export performance. Rising international trade tensions could also have an adverse effect on exports (80% of GDP), causing trade to make a negative contribution to trade. Investment (almost 20% of GDP), which has grown briskly in recent years thanks to businesses and easy access to credit, is therefore also expected to slow down.
Lower business confidence, difficulties in finding skilled workers, the large informal component of some sectors and the prospect of moderate growth, in the context of international tensions, are all factors that may also explain this deceleration, which should nevertheless be mitigated by better use of EU funds directed towards construction and civil engineering.
Table 8: Coface Lithuanian Top 10Turnover and net profit in EUR millions
* consolidated, ** estimated, n.a. not available.
Growth slows towards potential.
+3.0%
LITHUANIA
A3
COFACE ASSESSMENTJUNE 2019
COUNTRY RISK
A2BUSINESS CLIMATE
COFACE 2019GDP FORECAST
RA
NK
RA
NK
TO
P 5
00
COMPANY NAME MAIN SECTOR TUR
NO
VE
R IN
E
UR
MIL
LIO
NS
2017
TUR
NO
VE
R IN
E
UR
MIL
LIO
NS
2018
CH
AN
GE
IN
TUR
NO
VE
R
NE
T P
RO
FIT
IN
EU
R M
ILLI
ON
S 20
17
NE
T P
RO
FIT
IN
EU
R M
ILLI
ON
S 20
18
CH
AN
GE
IN
NE
T P
RO
FIT
EM
PLO
YM
EN
T
2017
EM
PLO
YM
EN
T
2018
CH
AN
GE
IN
EM
PLO
YM
EN
T
1 18 ORLEN LIETUVA AB* Minerals, chemicals, petroleum, plas-tics & pharma 4,006 4,706 17.5% 211.5 23.8 -88.8% 1,597 2,253 41.1%
2 21 VILNIAUS PREKYBA UAB* Others 3,283 4,241 29.2% 173.2 227.6 31.4% 34,798 43,888 26.1%
3 32 MAXIMA GRUPE UAB* Non-specialized trade 2,826 3,451 22.1% 74.9 116.7 55.9% 31,000 40,300 30.0%
4 102 MAXIMA LT UAB Non-specialized trade 1,547 1,638 5.9% 54.1 106.5 96.8% 15,536 14,659 -5.6%
5 160 LIETUVOS ENERGIJA UAB* Utilities & public services 1,064 1,216 14.3% 93.5 6.5 -93.1% 4,513 3,813 -15.5%
6 203 SANITEX UAB* Agriculture, meat, agro food & wines 945 1,026 8.6% 8.7 20.4 134.0% 3,757 3,955 5.3%
7 227 ME INVESTICIJA UAB* Automotive & transport 677 903 33.4% 85.7 64.3 -24.9% 8,086 11,780 45.7%
8 273 ACHEMOS GRUPE KONCERNAS UAB* Others 781 783 0.3% 29.7 -16.5 -155.6% 4,700 4,800 2.1%
9 285 GIRTEKA LOGISTICS UAB Automotive & transport 561 764 36.1% 11.6 19.1 64.0% 484 630 30.2%
10 299 KESKO SENUKAI LITHUANIA UAB* Construction 632 732 15.8% 9.9 0.0 -100% 7,541 7,359 -2.4%

COFACE PUBLICATIONS CEE TOP 500 COMPANIESRANKING
51
In 2019, Poland is expected to experience a slight slowdown in economic growth after two years of accelerating activity, with GDP growth rates reaching their highest levels since 2011. Household consumption remains the main growth driver, thanks to the buoyant labour market. The unemployment rate is the lowest in 28 years, wages are set to keep growing at fair rates, the central bank’s rate is at its lowest point in history and consumer sentiment indicators remain high. Moreover, a rebound of fixed asset investments brings additional support for growth. Investments are still supported by an inflow of EU funds, which have enhanced investments by at least 2 percentage points. Nevertheless, growth in domestic activity will stabilize and the trade balance is likely to be negative in light of the weaker economic expansion of the eurozone (the main trading partner) – exports represent over 50% of GDP. This will lead to the Polish economy being less robust in 2019.
Although the labour market situation is beneficial for households, companies have perceived it as a constraint. Labor shortages have become a drag on current business activity and its further expansion, and have been reported by an increasing number of companies across all sectors. A lack of workforce is especially evident in the manufacturing, construction and transport sectors. In addition, the insolvency law enacted in 2016 has favoured the increase in business restructuring proceedings, which have accelerated since then.
Table 9: Coface Polish Top 10Turnover and net profit in EUR millions
* consolidated, ** estimated, n.a. not available.
Extended recovery fades.
+4.3%
POLAND
A3
COFACE ASSESSMENTJUNE 2019
COUNTRY RISK
A2BUSINESS CLIMATE
COFACE 2019GDP FORECAST
RA
NK
RA
NK
TO
P 5
00
COMPANY NAME MAIN SECTOR TUR
NO
VE
R IN
E
UR
MIL
LIO
NS
2017
TUR
NO
VE
R IN
E
UR
MIL
LIO
NS
2018
CH
AN
GE
IN
TUR
NO
VE
R
NE
T P
RO
FIT
IN
EU
R M
ILLI
ON
S 20
17
NE
T P
RO
FIT
IN
EU
R M
ILLI
ON
S 20
18
CH
AN
GE
IN
NE
T P
RO
FIT
EM
PLO
YM
EN
T
2017
EM
PLO
YM
EN
T
2018
CH
AN
GE
IN
EM
PLO
YM
EN
T
1 1 POLSKI KONCERN NAFTOWY ORLEN S.A.*
Minerals, chemicals, petroleum, plas-tics & pharma 22,172 25,507 15.0% 1,667.7 1,302.9 -21.9% 20,262 21,282 5.0%
2 4 JERONIMO MARTINS POLSKA S.A. Non-specialized trade 11,199 11,866 6.0% 400.3 462.8 15.6% 61,535 66,292 7.7%
3 6 POLSKIE GÓRNICTWO NAFTOWE I GAZOWNICTWO S.A.* Utilities & public services 8,337 9,587 >1.000 679.1 746.1 >1.000 24,694 24,763 >1.000
4 8 GRUPA LOTOS S.A.* Minerals, chemicals, petroleum, plas-tics & pharma 5,623 7,003 24.5% 388.7 369.1 -5.0% 4,897 5,105 4.2%
5 9 PGE POLSKA GRUPA ENERGETYC-ZNA S.A.* Utilities & public services 5,371 6,032 12.3% 620.1 351.3 -43.3% 41,231 41,442 0.5%
6 12 EUROCASH S.A.* Non-specialized trade 5,411 5,309 -1.9% -6.9 26.0 n.a. 17,664 21,873 23.8%
7 17 KGHM POLSKA MIEDŹ S.A.* Minerals, chemicals, petroleum, plas-tics & pharma 4,733 4,772 0.8% 354.6 385.5 8.7% 33,366 33,568 0.6%
8 23 TAURON POLSKA ENERGIA S.A.* Utilities & public services 4,049 4,213 4.1% 321.5 48.1 -85.0% 25,020 25,622 2.4%
9 24 VOLKSWAGEN POZNAŃ SP. Z O.O. Automotive & transport 3,758 4,146 10.3% 104.9 91.4 -12.9% 10,374 11,765 13.4%
10 25 ARCELORMITTAL POLAND S.A.* Metals 3,753 4,033 7.5% 81.2 129.4 59.4% 13,065 12,584 -3.7%

COFACE PUBLICATIONS CEE TOP 500 COMPANIESRANKING
52
The economic boom of 2017 began to fade just a year later in 2018. Private consumption is unlikely to accelerate again in 2019, although its solid level and substantial share in the economy (63% of GDP) will make it keep its position as the main growth driver. The ongoing improvement in the labor market, with the unemployment rate dropping to 4.0% in December 2018, and further growth in wages (with the minimum wage increasing by almost 8% from 2019) will continue to support household spending. Wages are being driven by the increasing scarcity of labour, which is a result of emigration and an ageing population, despite the financial incentives being used to encourage mobility among the unemployed and reduce long-term unemployment. At the same time, accelerated inflation has already halved the growth of real wages in 2018 compared to the previous year. Previously, household consumption was elevated by implemented fiscal stimulus measures, including tax cuts, minimum wage increases and public sector wage hikes. However, these tax cuts have faded away and contributed to higher consumer prices, accompanied by inflationary pressure caused by excess demand. Labor shortages remain a concern for companies and trigger further increases in remuneration. Moreover, labor cost increases have been well ahead of productivity growth. The pressure coming from growing wages has been partially relieved by the transfer of social security contributions from employers to employees. Cars (Dacia and Ford) and tyres, together with wood, fertilizers, metals, medicines, machines and clothing remain important for Romanian exports.
Table 10: Coface Romanian Top 10Turnover and net profit in EUR millions
* consolidated, ** estimated, n.a. not available.
Solid but less vigorous demand.
+3.4%
ROMANIA
A4
COFACE ASSESSMENTJUNE 2019
COUNTRY RISK
A3BUSINESS CLIMATE
COFACE 2019GDP FORECAST
RA
NK
RA
NK
TO
P 5
00
COMPANY NAME MAIN SECTOR TUR
NO
VE
R IN
E
UR
MIL
LIO
NS
2017
TUR
NO
VE
R IN
E
UR
MIL
LIO
NS
2018
CH
AN
GE
IN
TUR
NO
VE
R
NE
T P
RO
FIT
IN
EU
R M
ILLI
ON
S 20
17
NE
T P
RO
FIT
IN
EU
R M
ILLI
ON
S 20
18
CH
AN
GE
IN
NE
T P
RO
FIT
EM
PLO
YM
EN
T
2017
EM
PLO
YM
EN
T
2018
CH
AN
GE
IN
EM
PLO
YM
EN
T
1 13 AUTOMOBILE-DACIA SA Automotive & transport 4,963 5,302 6.8% 115.6 161.3 39.6% 14,261 14,723 3.2%
2 26 OMV PETROM MARKETING SRL Minerals, chemicals, petroleum, plas-tics & pharma 3,230 3,832 18.6% 68.7 89.8 30.7% 210 219 4.3%
3 27 OMV PETROM SA Minerals, chemicals, petroleum, plas-tics & pharma 3,166 3,821 20.7% 514.6 831.9 61.7% 13,322 12,498 -6.2%
4 37 ROMPETROL RAFINARE SA Minerals, chemicals, petroleum, plas-tics & pharma 2,400 3,027 26.1% 89.7 -49.4 -155.0% 1,061 1,126 6.1%
5 57 ROMPETROL DOWNSTREAM SRL Minerals, chemicals, petroleum, plas-tics & pharma 1,903 2,344 23.2% 36.1 16.3 -55.0% 561 420 -25.1%
6 59 KAUFLAND ROMANIA SCS Non-specialized trade 2,163 2,335 8.0% 143.7 169.1 17.7% 13,519 12,374 -8.5%
7 66 FORD ROMANIA SA Automotive & transport 1,035 2,263 118.7% 20.5 37.8 84.8% 3,201 4,449 39.0%
8 76 BRITISH AMERICAN TOBACCO (ROMANIA) TRADING SRL
Agriculture, meat, agro food and wines 1,902 2,045 7.5% 65.5 33.3 -49.1% 679 816 20.2%
9 101 LIDL DISCOUNT SRL Non-specialized trade 1,396 1,670 19.6% 75.6 88.4 16.9% 4,815 5,481 13.8%
10 113 CARREFOUR ROMANIA SA Non-specialized trade 1,447 1,569 8.4% 45.0 56.1 24.8% 9,939 9,997 0.6%

COFACE PUBLICATIONS CEE TOP 500 COMPANIESRANKING
53
Russia has consolidated its recovery from the 2015/16 recession, yet growth seems timid when compared to the rise in hydrocarbon prices. However, the expansion reflects the country’s economic capacity and the authorities’ desire to separate growth from oil and gas wealth. Household consumption (50% of GDP) will remain the key growth driver. Its rate of increase will be slow, echoing that of the economy. Households faced a hike in the VAT rate from 18% to 20% on January 1, 2019. However, unless food and energy prices or the ruble go off track, inflation should remain under the control of the central bank. With wage growth outpacing productivity growth and in view of the expectations for inflation, the central bank will proceed with caution. At the same time, pay rises in the public sector (28% of jobs) will be reined in, pensions will also get a smaller increase and employment should increase slightly now that the retirement age has been pushed back by six months. Private investment, particularly foreign investment, will not be vibrant given the backdrop of sanctions and geopolitical tension. Given the size of the public sector (33% of GDP, 38% of reported value added with 32,500 companies), its investment is very important.
President Vladimir Putin has pledged to increase spending on infrastructure, health and education to 1.1% of GDP per year by 2021. Companies, both public and private, are strongly encouraged to participate. Non-oil exports – especially minerals, timber, grains and oilseeds, basic and intermediate industrial products and transport equipment – are expected to grow less than imports, maintaining a slightly negative trade contribution to growth.
Table 11: Coface Russian Top 10Turnover and net profit in EUR millions
* consolidated, ** estimated, n.a. not available.
Timid growth.
+1.4%
RUSSIA
B
COFACE ASSESSMENTJUNE 2019
COUNTRY RISK
COFACE 2019GDP FORECAST
RA
NK
COMPANY NAME MAIN SECTOR TUR
NO
VE
R IN
E
UR
MIL
LIO
NS
2017
TUR
NO
VE
R IN
E
UR
MIL
LIO
NS
2018
CH
AN
GE
IN
TUR
NO
VE
R
NE
T P
RO
FIT
IN
EU
R M
ILLI
ON
S 20
17
NE
T P
RO
FIT
IN
EU
R M
ILLI
ON
S 20
18
CH
AN
GE
IN
NE
T P
RO
FIT
EM
PLO
YM
EN
T
2017
EM
PLO
YM
EN
T
2018
CH
AN
GE
IN
EM
PLO
YM
EN
T
1 OJSC ROSNEFT OIL COMPANY* Minerals, chemicals, petroleum, plastics & pharma 75,443 103,662 37.4% 3,726 8,166 119.2% 295,800 318,000 7.5%
2 PJSC GAZPROM* Minerals, chemicals, petroleum, plastics & pharma 82,119 103,488 26.0% 9,675 19,239 98.9% 463,000 462,000 -0.2%
3 PJSC LUKOIL* Minerals, chemicals, petroleum, plastics & pharma 68,684 101,119 47.2% 5,274 7,816 48.2% 103,500 102,500 -1.0%
4 OJSC RUSSIAN RAILWAYS* Automotive & transport 28,247 30,362 7.5% 1,753 445 -74.6% 725,000 735,000 1.4%
5 STATE CORPORATION "ROSTEC"* Mechanics & precision 19,933 20,637 3.5% 1,518 1,611 6.2% 512,000 450,000 -12.1%
6 OJSC “SURGUTNEFTEGAS”* Minerals, chemicals, petroleum, plastics & pharma 14,740 19,579 32.8% 2,443 10,700 338.1% 116,000 112,809 -2.8%
7 X5 RETAIL GROUP* Non-specialized trade 16,245 19,190 18.1% 394 359 -8.6% 250,874 270,000 7.6%
8 PJSC "MAGNIT"* Non-specialized trade 14,342 15,566 8.5% 446 426 -4.4% 276,290 297,746 7.8%
9 PJSC ROSSETI* Utilities & public services 11,897 12,855 8.1% 1,720 1,568 -8.8% 215,000 217,000 0.9%
10 PAO "TRANSNEFT" Minerals, chemicals, petroleum, plastics & pharma 11,094 12,331 11.2% 2,406 2,836 17.9% 114,300 115,100 0.7%
BBUSINESS CLIMATE

COFACE PUBLICATIONS CEE TOP 500 COMPANIESRANKING
54
Growth is expected to remain strong in 2019.
Domestic demand will benefit from further fiscal easing. Inflation will also remain contained. Wage pressures related to the growing shortage of skilled labor will be offset by the stabilization of oil prices, good 2018 harvests (especially maize) and increased competition from the pending arrival of a new food retail discounter. These factors, combined with the dinar’s resistance, a significant point given the economy’s strong euroization, should allow the central bank to maintain its accommodative policy.
Household consumption (77% of GDP) will remain the strongest contributor to growth, boosted by a further increase in wages and pensions against the background of an 8.6% increase in the minimum wage on January 1, 2019. This comes after real wages stagnated between 2008 and 2017. In addition, while the doubtful loan ratio is declining rapidly, reaching 7% at the end of 2018, consumer credit should continue to recover and benefit from falling rates (average of 6%). Expatriate remittances should remain on a positive trajectory, as should tourism, the benefits of which are spreading throughout the population. Investment (20% of GDP) is also expected to stay on track due to lower taxes and higher corporate profits, strong FDI and public construction.
Exports (54% of GDP) are benefiting from market share gains in the EU, increased manufacturing capacity, particularly in ICT, and agricultural production. Export growth is set to exceed that of imports, reducing the negative contribution of trade to growth.
Table 12: Coface Serbian Top 10Turnover and net profit in EUR millions
* consolidated, ** estimated, n.a. not available.
Growth still supported by domestic demand.
+3.5%
SERBIA
B
COFACE ASSESSMENTJUNE 2019
COUNTRY RISK
BUSINESS CLIMATE
COFACE 2019GDP FORECAST
RA
NK
RA
NK
TO
P 5
00
COMPANY NAME MAIN SECTOR TUR
NO
VE
R IN
E
UR
MIL
LIO
NS
2017
TUR
NO
VE
R IN
E
UR
MIL
LIO
NS
2018
CH
AN
GE
IN
TUR
NO
VE
R
NE
T P
RO
FIT
IN
EU
R M
ILLI
ON
S 20
17
NE
T P
RO
FIT
IN
EU
R M
ILLI
ON
S 20
18
CH
AN
GE
IN
NE
T P
RO
FIT
EM
PLO
YM
EN
T
2017
EM
PLO
YM
EN
T
2018
CH
AN
GE
IN
EM
PLO
YM
EN
T
1 70 JP EPS BEOGRAD Utilities & public services 2,111 2,214 4.9% 28.7 13.4 -53.2% 26,485 25,761 -2.7%
2 71 NIS A.D. NOVI SAD Minerals, chemicals, petroleum, plas-tics & pharma 1,823 2,183 19.8% 235.1 220.5 -6.2% 4,058 4,099 1.0%
3 232 HBIS GROUP SERBIA IRON & STEEL D.O.O. BEOGRAD Metals 660 889 34.6% 0.0 0.2 892.8% 5,005 4,908 -1.9%
4 249 DELHAIZE SERBIA DOO BEOGRAD Non-specialized trade 798 847 6.1% 36.1 22.6 -37.5% 10,686 12,629 18.2%
5 306 FCA SRBIJA D.O.O. KRAGUJEVAC Automotive & transport 929 724 -22.1% 18.0 12.8 -28.9% 2,364 2,280 -3.6%
6 307 TELEKOM SRBIJA A.D., BEOGRAD Electronics, information & telecom-munications 724 723 -0.2% 123.1 0.1 -99.9% 7,919 7,777 -1.8%
7 315 MERCATOR-S DOO NOVI SAD Non-specialized trade 756 703 -7.0% -58.0 -14.1 n.a. 8,345 8,124 -2.6%
8 344 NELT CO. DOO DOBANOVCI Agriculture, meat, agro food and wines 657 662 0.8% 11.3 4.5 -59.7% 1,825 1,828 0.2%
9 345 TIGAR TYRES Automotive & transport 570 661 15.9% 87.2 40.9 -53.2% 3,364 3,388 0.7%
10 351 JAVNO PREDUZEĆE SRBIJAGAS NOVI SAD Utilities and public services 597 653 9.3% 141.5 125.8 -11.1% 1,101 1,071 -2.7%
A4BUSINESS CLIMATE

COFACE PUBLICATIONS CEE TOP 500 COMPANIESRANKING
55
Growth is thought to have peaked in 2018. Household consumption remains the main driving force of the economy thanks to solid real wage increases and growing employment. At the end of 2018, the unemployment rate dropped to 5.9% – a record low for Slovakia – and has dropped further in the course of 2019.
Despite improvements in this regard, especially when compared with much higher unemployment in 2013, there are still strong regional differences between the East and the West of Slovakia: the latter (including the capital city of Bratislava) enjoys a strong concentration of foreign and domestic companies that significantly lowers unemployment. Despite those regional differences, labor shortages have been increasing sharply in Slovakia, especially in manufacturing.
A lack of adequate labour force has been pushing wages up over recent years. The minimum wage rose by 40 to 520 in January 2019, while state salaries went up by 10% in January 2019, and will do so again in January 2020. In addition to household consumption, GDP growth remains enhanced by fixed asset investments with the construction of the Jaguar Land Rover plant strongly contributing to the increase. The factory started operations in October 2018 and plans to increase the number of employees to 2,800 and the annual number of cars produced to 300,000. As a result, the plant has reaffirmed the automotive sector as the main manufacturing industry in Slovakia. Public sector investment projects have also accelerated – although the Bratislava ring road has been delayed and it is probable that the deadline for its completion in 2020 will not be met.
Table 13: Coface Slovakian Top 10Turnover and net profit in EUR millions
* consolidated, ** estimated, n.a. not available.
Growth strengthens further.
+3.7%
SLOVAKIA
COFACE ASSESSMENTJUNE 2019
A2BUSINESS CLIMATE
COFACE 2019GDP FORECAST
RA
NK
RA
NK
TO
P 5
00
COMPANY NAME MAIN SECTOR TUR
NO
VE
R IN
E
UR
MIL
LIO
NS
2017
TUR
NO
VE
R IN
E
UR
MIL
LIO
NS
2018
CH
AN
GE
IN
TUR
NO
VE
R
NE
T P
RO
FIT
IN
EU
R M
ILLI
ON
S 20
17
NE
T P
RO
FIT
IN
EU
R M
ILLI
ON
S 20
18
CH
AN
GE
IN
NE
T P
RO
FIT
EM
PLO
YM
EN
T
2017
EM
PLO
YM
EN
T
2018
CH
AN
GE
IN
EM
PLO
YM
EN
T
1 5 VOLKSWAGEN SLOVAKIA, A.S. Automotive & transport 7,549 10,380 37.5% 403.9 191.9 -52.5% 13,964 15,189 8.8%
2 14 KIA MOTORS SLOVAKIA S.R.O. Automotive & transport 5,185 5,186 0.0% 209.9 240.7 14.7% 3,755 3,787 0.9%
3 28 SLOVNAFT, A.S. Minerals, chemicals, petroleum, plas-tics & pharma 3,417 3,798 11.1% 172.3 106.2 -38.4% 2,389 2,567 7.5%
4 41 PCA SLOVAKIA, S.R.O. Automotive & transport 2,703 2,792 3.3% 46.2 37.3 -19.3% 3,227 3,766 16.7%
5 44 U. S. STEEL KOŠICE, S.R.O. Metals 2,612 2,712 3.8% 449.9 126.8 -71.8% 10,059 9,960 -1.0%
6 53 SLOVENSKÉ ELEKTRÁRNE, A.S. Utilities and public services 2,183 2,426 11.1% 126.9 25.3 -80.1% 3,684 3,636 -1.3%
7 94 SAMSUNG ELECTRONICS SLOVAKIA S.R.O.
Electronics, information & telecom-munications 2,536 1,760 -30.6% 79.5 62.5 -21.4% 1,861 1,697 -8.8%
8 118 SLOVENSKÝ PLYNÁRENSKÝ PRIE-MYSEL, A.S.
Minerals, chemicals, petroleum, plas-tics & pharma 1,509 1,526 1.1% 318.5 313.6 -1.5% 721 681 -5.5%
9 124 MOBIS SLOVAKIA S.R.O. Automotive & transport 1,422 1,480 4.1% 43.0 45.4 5.6% 1,992 2,047 2.8%
10 130 TESCO STORES SR, A.S. Non-specialized trade 1,451 1,434 -1.2% 32.0 94 193.8% 10,179 9,207 -9.5%
A2COUNTRY RISK
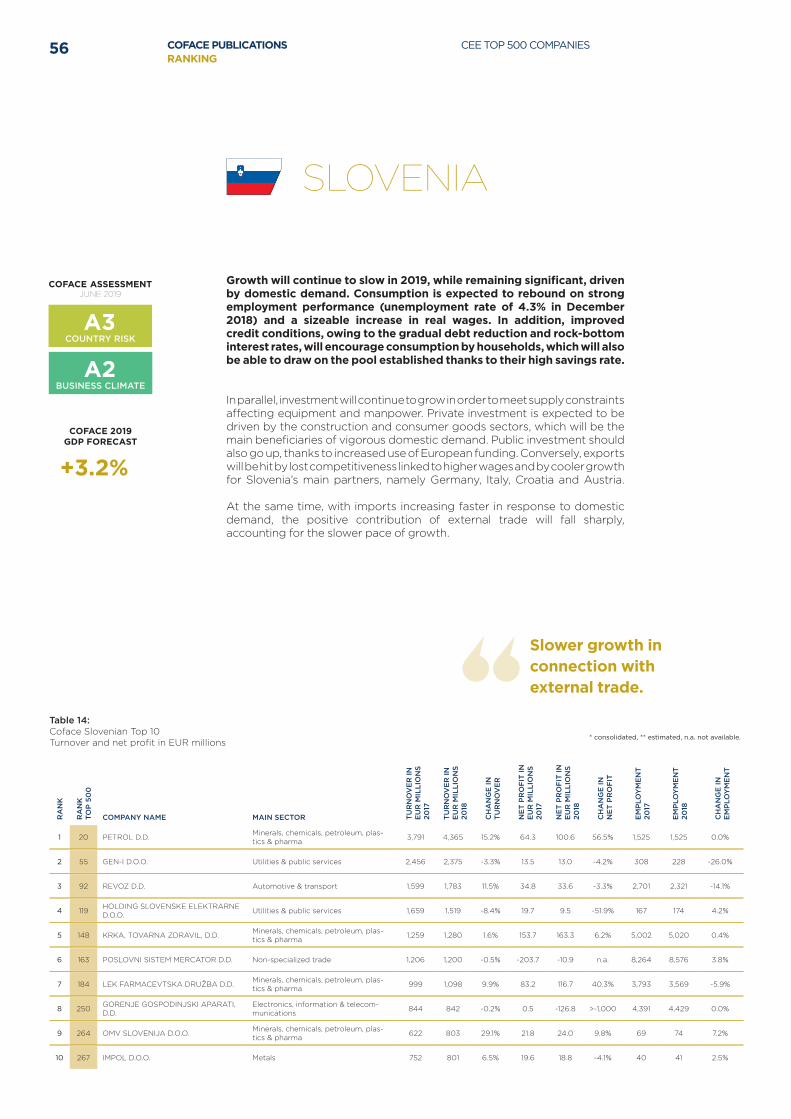
COFACE PUBLICATIONS CEE TOP 500 COMPANIESRANKING
56
Growth will continue to slow in 2019, while remaining significant, driven by domestic demand. Consumption is expected to rebound on strong employment performance (unemployment rate of 4.3% in December 2018) and a sizeable increase in real wages. In addition, improved credit conditions, owing to the gradual debt reduction and rock-bottom interest rates, will encourage consumption by households, which will also be able to draw on the pool established thanks to their high savings rate.
In parallel, investment will continue to grow in order to meet supply constraints affecting equipment and manpower. Private investment is expected to be driven by the construction and consumer goods sectors, which will be the main beneficiaries of vigorous domestic demand. Public investment should also go up, thanks to increased use of European funding. Conversely, exports will be hit by lost competitiveness linked to higher wages and by cooler growth for Slovenia’s main partners, namely Germany, Italy, Croatia and Austria.
At the same time, with imports increasing faster in response to domestic demand, the positive contribution of external trade will fall sharply, accounting for the slower pace of growth.
Table 14: Coface Slovenian Top 10Turnover and net profit in EUR millions
* consolidated, ** estimated, n.a. not available.
Slower growth in connection with external trade.
+3.2%
SLOVENIA
A3
COFACE ASSESSMENTJUNE 2019
COUNTRY RISK
A2BUSINESS CLIMATE
COFACE 2019GDP FORECAST
RA
NK
RA
NK
TO
P 5
00
COMPANY NAME MAIN SECTOR TUR
NO
VE
R IN
E
UR
MIL
LIO
NS
2017
TUR
NO
VE
R IN
E
UR
MIL
LIO
NS
2018
CH
AN
GE
IN
TUR
NO
VE
R
NE
T P
RO
FIT
IN
EU
R M
ILLI
ON
S 20
17
NE
T P
RO
FIT
IN
EU
R M
ILLI
ON
S 20
18
CH
AN
GE
IN
NE
T P
RO
FIT
EM
PLO
YM
EN
T
2017
EM
PLO
YM
EN
T
2018
CH
AN
GE
IN
EM
PLO
YM
EN
T
1 20 PETROL D.D. Minerals, chemicals, petroleum, plas-tics & pharma 3,791 4,365 15.2% 64.3 100.6 56.5% 1,525 1,525 0.0%
2 55 GEN-I D.O.O. Utilities & public services 2,456 2,375 -3.3% 13.5 13.0 -4.2% 308 228 -26.0%
3 92 REVOZ D.D. Automotive & transport 1,599 1,783 11.5% 34.8 33.6 -3.3% 2,701 2,321 -14.1%
4 119 HOLDING SLOVENSKE ELEKTRARNE D.O.O. Utilities & public services 1,659 1,519 -8.4% 19.7 9.5 -51.9% 167 174 4.2%
5 148 KRKA, TOVARNA ZDRAVIL, D.D. Minerals, chemicals, petroleum, plas-tics & pharma 1,259 1,280 1.6% 153.7 163.3 6.2% 5,002 5,020 0.4%
6 163 POSLOVNI SISTEM MERCATOR D.D. Non-specialized trade 1,206 1,200 -0.5% -203.7 -10.9 n.a. 8,264 8,576 3.8%
7 184 LEK FARMACEVTSKA DRUŽBA D.D. Minerals, chemicals, petroleum, plas-tics & pharma 999 1,098 9.9% 83.2 116.7 40.3% 3,793 3,569 -5.9%
8 250 GORENJE GOSPODINJSKI APARATI, D.D.
Electronics, information & telecom-munications 844 842 -0.2% 0.5 -126.8 >-1,000 4,391 4,429 0.0%
9 264 OMV SLOVENIJA D.O.O. Minerals, chemicals, petroleum, plas-tics & pharma 622 803 29.1% 21.8 24.0 9.8% 69 74 7.2%
10 267 IMPOL D.O.O. Metals 752 801 6.5% 19.6 18.8 -4.1% 40 41 2.5%
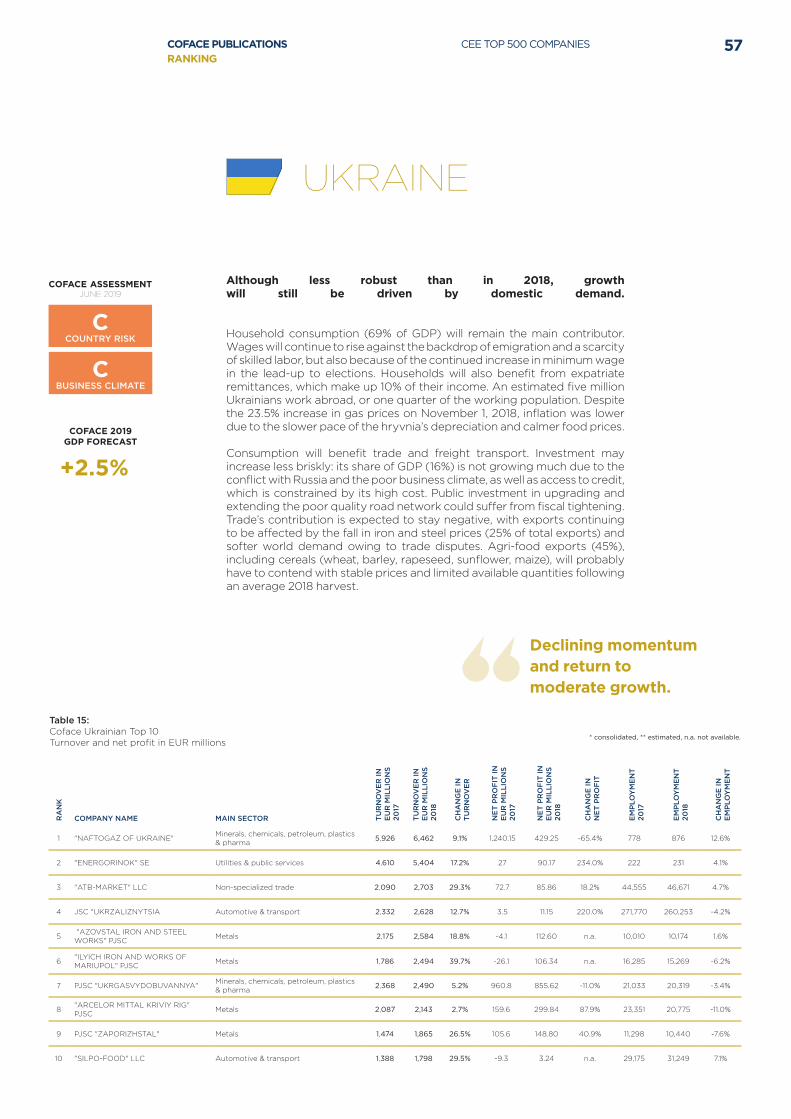
COFACE PUBLICATIONS CEE TOP 500 COMPANIESRANKING
57
Although less robust than in 2018, growth will still be driven by domestic demand.
Household consumption (69% of GDP) will remain the main contributor. Wages will continue to rise against the backdrop of emigration and a scarcity of skilled labor, but also because of the continued increase in minimum wage in the lead-up to elections. Households will also benefit from expatriate remittances, which make up 10% of their income. An estimated five million Ukrainians work abroad, or one quarter of the working population. Despite the 23.5% increase in gas prices on November 1, 2018, inflation was lower due to the slower pace of the hryvnia’s depreciation and calmer food prices.
Consumption will benefit trade and freight transport. Investment may increase less briskly: its share of GDP (16%) is not growing much due to the conflict with Russia and the poor business climate, as well as access to credit, which is constrained by its high cost. Public investment in upgrading and extending the poor quality road network could suffer from fiscal tightening. Trade’s contribution is expected to stay negative, with exports continuing to be affected by the fall in iron and steel prices (25% of total exports) and softer world demand owing to trade disputes. Agri-food exports (45%), including cereals (wheat, barley, rapeseed, sunflower, maize), will probably have to contend with stable prices and limited available quantities following an average 2018 harvest.
Table 15: Coface Ukrainian Top 10Turnover and net profit in EUR millions
* consolidated, ** estimated, n.a. not available.
Declining momentum and return to moderate growth.
+2.5%
UKRAINE
C
COFACE ASSESSMENTJUNE 2019
COUNTRY RISK
CBUSINESS CLIMATE
COFACE 2019GDP FORECAST
RA
NK
COMPANY NAME MAIN SECTOR TUR
NO
VE
R IN
E
UR
MIL
LIO
NS
2017
TUR
NO
VE
R IN
E
UR
MIL
LIO
NS
2018
CH
AN
GE
IN
TUR
NO
VE
R
NE
T P
RO
FIT
IN
EU
R M
ILLI
ON
S 20
17
NE
T P
RO
FIT
IN
EU
R M
ILLI
ON
S 20
18
CH
AN
GE
IN
NE
T P
RO
FIT
EM
PLO
YM
EN
T
2017
EM
PLO
YM
EN
T
2018
CH
AN
GE
IN
EM
PLO
YM
EN
T
1 "NAFTOGAZ OF UKRAINE" Minerals, chemicals, petroleum, plastics & pharma 5,926 6,462 9.1% 1,240.15 429.25 -65.4% 778 876 12.6%
2 "ENERGORINOK" SE Utilities & public services 4,610 5,404 17.2% 27 90.17 234.0% 222 231 4.1%
3 "ATB-MARKET" LLC Non-specialized trade 2,090 2,703 29.3% 72.7 85.86 18.2% 44,555 46,671 4.7%
4 JSC "UKRZALIZNYTSIA Automotive & transport 2,332 2,628 12.7% 3.5 11.15 220.0% 271,770 260,253 -4.2%
5 "AZOVSTAL IRON AND STEEL WORKS" PJSC Metals 2,175 2,584 18.8% -4.1 112.60 n.a. 10,010 10,174 1.6%
6 "ILYICH IRON AND WORKS OF MARIUPOL" PJSC Metals 1,786 2,494 39.7% -26.1 106.34 n.a. 16,285 15,269 -6.2%
7 PJSC "UKRGASVYDOBUVANNYA" Minerals, chemicals, petroleum, plastics & pharma 2,368 2,490 5.2% 960.8 855.62 -11.0% 21,033 20,319 -3.4%
8 "ARCELOR MITTAL KRIVIY RIG" PJSC Metals 2,087 2,143 2.7% 159.6 299.84 87.9% 23,351 20,775 -11.0%
9 PJSC "ZAPORIZHSTAL" Metals 1,474 1,865 26.5% 105.6 148.80 40.9% 11,298 10,440 -7.6%
10 "SILPO-FOOD" LLC Automotive & transport 1,388 1,798 29.5% -9.3 3.24 n.a. 29,175 31,249 7.1%

COFACE IN CEE CONTACTS
Austria
Marxergasse 4c1030 Vienna
T. +43/1/515 54-0www.coface.at
Adriatic
Avenija Dubrovnik 46/III10000 Zagreb
T. +385/1/469 75 00www.coface.hr
Baltics
A. Tumeno str. 401109 Vilnius
T. +370/5/279 17 27www.coface.lt
Bulgaria
42, Peter Parchevich str.1000 Sofia
T. +359/2/821 37 35www.coface.bg
Czech Republic
nám. I.P. Pavlova 5120 00 Prague
T. +420/2/460 85 411www.coface.cz
Hungary
Váci út 45. H/7. 1134 Budapest
T. +36/1/299 20 70www.coface.hu
Poland
Al. Jerozolimskie 142 A 02-305 Warszawa
T. +48/22/465 00 00www.coface.pl
Romania
Cladirea Globalworth PlazaSoseaua Pipera 42 - Et. 6
020112 - Sector 2T. +40/21/231 60 20
www.coface.ro
Russia
2nd Brestskaya St., 8Panorama Business Centre
125047 MoscowT. +7/495/785 57 10
www.coface.ru
Serbia
Bulevar Oslobodjenja 11111000 Belgrade
T. +81/11/397 60 51www.coface.rs
Slovakia
Soltésovej 14811 08 Bratislava 1
T. +421/2/72 01 644www.coface.sk
Slovenia
Davčna ulica 11000 Ljubljana
T. +386/1/2005 836 www.coface.si
Central Europe
Marxergasse 4c1030 Vienna
T. +43/1/515 54-0www.cofacecentraleurope.com

COFACE PUBLICATIONS CEE TOP 500 COMPANIESRANKING
59
COFACE - FOR TRADEBUILDING BUSINESS
TOGETHER IN CEE
Over 70 years of experience and the most finely meshed international network have made Coface a reference in credit insurance, risk management and the global economy.
Our experts work to the beat of the world economy, supporting 50,000 clients worldwide in building prosperous, growing and successful businesses. Our services and solutions protect and help companies take the credit decisions necessary to improve their ability to sell on both their domestic and export markets.
With the ambition to become the most agile global trade credit insurance partner in the industry, underpinned by our values – Client Focus, Expertise, Collaboration, Courage & Accountability – we believe in trade as a force for good in the world. In 2018, Coface employed ~4,100 people in 100 countries and registered turnover of EUR 1.4 billion.
Our offer focuses primarily on credit insurance services, our historical core business line, and in some countries extends to factoring, corporate information, debt recovery, bonds and insurance for one-off complex operations (Single Risk).
Coface is listed on the French stock exchange (Euronext, Paris). The company has a solid financial base and excellent solvency levels. Fitch and Moody’s ratings for Coface are AA- and A2 respectively, with a stable outlook in both cases.

COFACE CENTRAL EUROPE HOLDING GmbHMarxergasse 4c1030 ViennaAustria
www.cofacecentraleurope.com
DISCLAIMERThis document reflects the opinion of Coface Central Europe on the date of publication and is subject to the available information, and may be modified at any time. The information, analyses and opinions presented are drawn from multiple sources that were judged reliable and credible. However, Coface does not guarantee the accuracy, completeness or representativeness of the data contained in this document. The information, analyses and opinions are provided for information only and should be used in conjunction with other information the reader might already possess. Coface is not bound by an obligation of results but by an obligation of diligence and shall not be held responsible for any losses incurred by the reader arising from the use of the information, analyses and opinions contained in this document. This document, and likewise, the analyses and opinions which are expressed are the sole property of Coface. The reader may consult or reproduce them for internal use only and subject to mentioning Coface as the source; the data may not be altered or modified in any way. The information may not be used, extracted or reproduced for public or commercial purposes without prior permission from Coface. The reader is asked to refer to the legal notices on the Coface website.
Publisher: Coface Central Europe Holding GmbH, Marxergasse 4C, 1030 ViennaContact: www.cofacecentraleurope.com, [email protected]
© C
OFA
CE
082
019
- P
hoto
: Cof
ace,
Fot
olia
, Shu
tter
stoc
k, P
ixab
ay