Embed Size (px)
Citation preview
Cognitive Skills and Technology Diffusion:
An Empirical Test
Garett Jones*
Department of Economics
and
Center for Study of Public Choice
George Mason University
October 2011
[Forthcoming, Economic Systems]
Abstract
Cognitive skills are robustly associated with good national economic performance. How
much of this is due to high-skill countries doing a better job of absorbing total factor
productivity from the world's technology leader? Following Benhabib and Spiegel
(Handbook of Economic Growth 2005) who estimated the Nelson-Phelps technology
diffusion model, I use the database of IQ tests assembled by Lynn and Vanhanen (2002,
2006) and find a robust relationship between national average IQ and total factor
productivity growth. Controlling for IQ, years of education is of modest statistical
significance. If IQ gaps between countries persist and model parameters remain stable,
TFP levels are forecasted to sharply diverge, creating a ―twin peaks‖ result. After
controlling for IQ, few other growth variables are statistically significant.
___________________ *Garett Jones, Department of Economics and Center for Study of Public Choice, George Mason University.
E-mail: [email protected]. I thank participants at the UC San Diego Macroeconomics Brown Bag
and the 2008 American Economic Association meetings for helpful comments. All remaining errors are my
own.
1
Recent economic research, including Hanushek and Woessmann (2007), Jones
and Schneider (2006), Weede and Kampf (2002) and Ram (2006) has shown that
cognitive skill scores are robustly associated with good economic performance. They
invariably find that cognitive skill scores have vastly more predictive power than
traditional schooling measures.
The question of whether intelligence tests and other standardized tests are robust
predictors of economic success has apparently been settled. The present paper turns to
the question of why this is so. Herein, I focus on the following questions: How do
differences in cognitive skills influence differences in productivity across countries? Is
there a cognitive skill cutoff below which countries will fail to even conditionally
converge? And after one accounts for differences in average cognitive skill in a country,
which other conventional growth variables are reliable predictors of long-run productivity
growth?
Since, following Benhabib and Spiegel (1994, 2005) estimated total factor
productivity (TFP) is my productivity proxy, one should interpret ―productivity
differences‖ as including differences in managerial methods, political systems, and
productivity-enhancing cultural norms that makes one country more productive than
another–thus, TFP includes more than just menus of manufacturing processes. Potrafke
(2011) provides cross-country evidence that cognitive skills are robust predictors of
lower national corruption, and Burks et al. (2009) and Jones (2008, 2011) provide
experimental evidence that intelligence is a predictor of cooperative, pro-social behavior;
2
these correlates may explain some portion of the documented relationship document
between cognitive skills and national productivity.
Benhabib and Spiegel (1994, 2005) estimated the technology diffusion model of
Barro and Sala-i-Martin (1997); Benhabib and Spiegel used years of education as their
measure of human capital, and found a modestly robust relationship that weakened
considerably when additional control variables were added.
Instead, I use the database of national average IQ estimates assembled by Lynn
and Vanhanen (2006) and psychometrically validated in Rindermann (2007 a,b), and
invariably find a robust relationship between national average IQ and the conditional rate
of total factor productivity growth over the 1960-1995 period. In a horse race between
IQ and education, national average IQ easily wins under all specifications. The results
also hold even if only pre-1970 IQ scores are used.
One reason to use IQ tests rather than the international math and science test
scores employed by Hanushek and Kimko (2000) and Barro and Lee (1996) is that IQ
tests are much more widely available. For instance, Hanushek and Kimko have data from
31 countries, Barro and Lee from 23. By contrast, we have IQ scores from well over 100
countries, although limitations on other data shrink the sample considerably below 100.
Further, the psychological profession has worked to make IQ scores comparable across
time and space–indeed, a substantial number of the Lynn and Vanhanen observations
come from country-wide ―standardization samples‖ that are created when an IQ test is
revised. As Jones and Schneider (2010) demonstrate, the positive relationship between
IQ and year 2000 output per worker holds whether one uses verbal or visual IQ tests,
whether one uses ―culture reduced‖ or traditional IQ tests, and whether one uses pre -
3
1980, pre-1970, or pre-1960 IQ tests. Arthur Jensen's 1998 book The g Factor, provides
the best overview of the IQ literature; Ian Deary’s Intelligence: A Very Short Introduction
(2001) provides a more accessible overview written by another prominent intelligence
researcher. Hanushek and Woessmann (2010) provide a brief review of the literature on
national IQ and economic growth.
Where these nation-level differences in reasoning skill come from is a matter of
ongoing research in a variety of disciplines; for economists, the main lesson is that these
differences appear to be quantitatively significant correlates of TFP. In the conclusion, I
point to some literature that might begin to provide a micro-level explanation for this
macroeconomic result.
Data
The primary data come from three sources: Benhabib and Spiegel (2005), Lynn
and Vanhanen (2006), and Barro and Lee (1996); in additional robustness tests data from
Sala-i-Martin, Doppelhofer, and Miller (2004, henceforth SDM) are used.
Lynn/Vanahanen and Barro/Lee provide the IQ and the education level data, respectively.
Total factor productivity (TFP) data come from Benhabib and Spiegel; I use it since it is
the benchmark dataset in this literature. The TFP estimates start with output per person
in a given country, and then remove the element of output per person that is explained by
differences in capital per person: What is left is, of course, the Solow residual, or total
factor productivity. I will occasionally refer to this value simply as ―productivity‖; since
I never need to distinguish between output per worker and TFP in this paper, this slight
4
abuse of the language should come at little cost. Figure 1 illustrates the relationship
between national average IQ and log GDP in 1995.
The two education measures I use are the average years of schooling in the year
1960 along with the average years of schooling averaged across the years 1960 to 1995;
both are used in Benhabib and Spiegel (2005). The latter is more likely to reflect
endogeneity running from growth to education, but I still use it since most of the IQ tests
likewise come from the post-1960 period. Thus, this helps keep the horse race fair.
For the robustness tests run below, I also use controls from Sala-i-Martin,
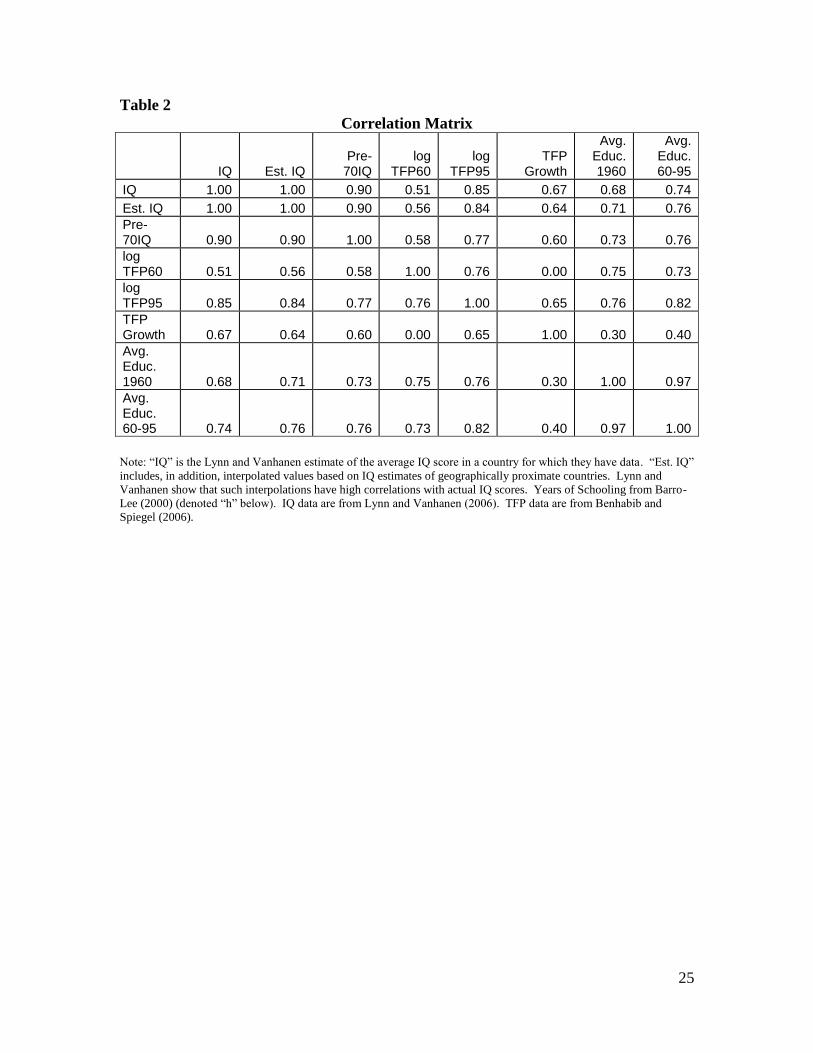
Doppelhofer, and Miller (2004). Table 1 provides summary statistics, and Table 2 a
correlation matrix–note that as is so common in the growth literature, many ostensibly
causal variables correlate greater than 0.7 with ostensible outcome variables.
Lynn and Vanhanen’s data can be briefly summarized: The authors, a
psychologist (Lynn) and a political scientist with a background in cross-country
databases (Vanhanen) collected data from hundreds of published intelligence studies
given in 113 countries over the last century to create estimates of national average IQ for
each country. As noted in the previous literature (inter alia, Jensen (1998), Lynn and
Vanhanen (2002, 2006), Jones and Schneider (2010)), the differences across countries are
roughly the same whether one uses traditional IQ tests, non-verbal tests, or culture-
reduced tests.1 Thus, the national average IQ estimates appear similar regardless of what
1 Wicherts et al. (2009, 2010a,b) have presented some evidence that Lynn and Vanhanen’s scores from sub-
Saharan Africa are lower than the true values, although they also state ―[t]here can be little doubt that
Africans average lower IQs than do westerners‖(Wicherts et al., 2010a, 17). While this debate has not been
settled in the academic literature, the outcome is unlikely to weaken the results presented here: In all prior
statistical work that Winsorizes the lowest national average IQ estimates to higher values, national IQ is a
weakly more reliable predictor of economic performance after Winsorizing the lowest scores. In results not
reported, I rerun every regression here with an additional dummy variable for sub-Saharan Africa: As the
results in Table 8 and in section IV below would suggest, inclusion of this dummy has no influence on the
final results.
5
kind of IQ test is used. All estimates used here have been adjusted by Lynn and
Vanhanen for the Flynn Effect, the well-known positive time trend in IQ: They use 1979
as their benchmark year, adjusting older scores on conventional tests upward by 2 IQ
points per decade and more recent scores downward by 2 IQ points per decade. For the
Ravens Matrices (a visual pattern-completion test, which has seen larger gains over time)
they use 3 IQ points as the decade-level adjustment. Since IQ scores from both rich and
poor countries exist from both decades before and decades after the 1979 benchmark, the
degree of adjustment may matter little for the results; Jones and Schneider (2010) ran
their IQ-productivity calibrations with both Flynn-adjusted and Flynn-unadjusted
measures, with no substantial influence on the results.
I use three IQ measures: Lynn and Vanhanen’s actual IQ data for 113 countries,
an expanded database of that adds interpolated data for the rest of the world
(interpolations created by Lynn and Vanhanen based on demographic comparisons with
neighboring countries), and a smaller database of countries that uses only pre-1970
scores. Since there is only an imperfect overlap between the Benhabib/Spiegel data and
the Lynn/Vanhanen data, sample sizes fall dramatically, leading to effective samples
sizes of 68, 84, and 25, respectively.
Model
The Nelson-Phelps (1966) model of technology diffusion has been widely used in
the technology diffusion literature. As augmented by Barro and Sala-i-Martin (1997), it
can suggest not only whether the data favor conditional TFP convergence in levels, but
6
even more importantly, whether the data favor conditional TFP convergence in growth
rates. For instance, using the Nelson-Phelps model, Benhabib and Spiegel found that
countries with low-enough levels of education were unlikely to ever catch up to the TFP
growth rates of the richest countries.
The Nelson-Phelps model shows how a mathematical formalization of a verbal
theory can yield greater insights. In Gerschenkron’s (1962) foundational essay
―Economic Backwardness in Historical Perspective‖ he discusses what it takes to turn
backwardness into an advantage. Gerschenkron notes:
Industrialization always seemed the more promising the greater the backlog of
technological innovations which the backward country could take over from the
more advanced country. Borrowed technology, so much and so rightly stressed
by Veblen, was one of the primary factors assuring a high speed of development
in a backward country….(p. 87).
The Nelson-Phelps model formalizes this idea by claiming that human capital
yields new ideas through two channels: First, through inventing ideas in ones own
country, and second, through adapting ideas from countries at the economic frontier. At
the most informal mathematical level, one can write:
%ΔAi = α*hi +β*hi*(distance from frontier) + γ
Here, Ai ≡ TFP in country i; hi ≡ human capital in country i, α≡ how productive a country
is at producing its own ideas with one unit of human capital, β≡ how productive a country

7
is at adopting the ideas of the economic frontier. Of course, α and β are both strictly
positive, while the constant, γ, is a stand-in for omitted variables. The constant can be
either positive or negative, depending in part on the units in which hi is measured. The
Gerschenkron assumption is that countries that are far from the frontier will find it easy
to adapt ideas from the frontier–a ―bills on the sidewalk‖ story, since countries that have
used few of the world’s best ideas (technological, political, cultural, and managerial) will
certainly find some useful ideas in the frontier economies.
There are a variety of ways to mathematize ―distance from the frontier,‖ the value
that Gerschenkron described as ―backwardness.‖ The form of the mathematization
matters profoundly. Nelson and Phelps discuss two. The first is outwardly similar to a
conventional growth regression specification, but has quite different implications:
%ΔAi = αhi +βhi(1- A
A
i
leader
) + γ (1)
In this formalization, low-growth TFP traps are quite possible, since as Ai 0, %ΔAi
αhi + βhi + γ. If this number is less than the growth rate of TFP on the frontier, then
country i will always grow (for hi>0), but will constantly fall behind the frontier. In an
abuse of language, I refer to such a situation as a poverty trap. A country in such a
situation might become incredibly wealthy, but it will constantly be falling ever-farther
behind the living standards of the frontier country.
But another mathematization is possible. If the ―distance to the frontier‖ term is
represented as below, then poverty traps are quite impossible:
%ΔAi = αhi +βhi(A
A
leader
i
-1) + γ (2)
8
In this case, as Ai 0, %Δ Ai +∞. That means that as TFP goes to zero, the marginal
productivity of searching for frontier ideas becomes infinite, regardless of how low the
country’s level of human capital goes.
Benhabib and Spiegel found that when human capital was measured by the log (or
level) of formal education, OLS regressions preferred specification (1), the poverty-trap
specification. They further listed the countries that within sample were forecasted to
grow slower than the frontier country, and used the accuracy of such within-sample
forecasts as an informal specification check–and they boldly used year 2000 human
capital levels to make out-of-sample forecasts of future TFP growth. I do the same
below, using national average IQ estimates instead of education measures.
In theoretical and empirical work on the link between TFP diffusion and human
capital, there is no uniform preference for logs versus levels for either human capital or
TFP, and microfounded theories exist with both log and level specifications. For
instance, Benhabib and Spiegel and the models they draw upon imply that the level of
TFP is the correct form of technology; Wolff (2000) uses a microfounded model where
the log of TFP is the correct functional form with which to interact human capital. Wolff
then uses the log of TFP in an empirical specification of the model. Sala-i-Martin (1997)
uses a functional form similar to Wolff’s in his ―two million regressions‖ economic
growth paper: the level of human capital is interacted with starting log GDP per person.
Since both theory and empirical work have come to no consensus on the issue, I report
key results in two classes of specifications: The level of TFP interacted with the log of
human capital (based on Benhabib and Spiegel’s microfounded approach), and the log of
9
TFP interacted with the level of human capital (based on Wolff’s microfounded
approach).
One can interpret these two sets of specifications as an initial case where
diminishing returns to human capital are relatively important in slowing the rate of
convergence and a second case where diminishing returns to TFP are relatively important
in slowing the rate of convergence. Results are little-changed across the two sets of
specifications.
Empirical Results
I. IQ versus education as predictors of TFP growth
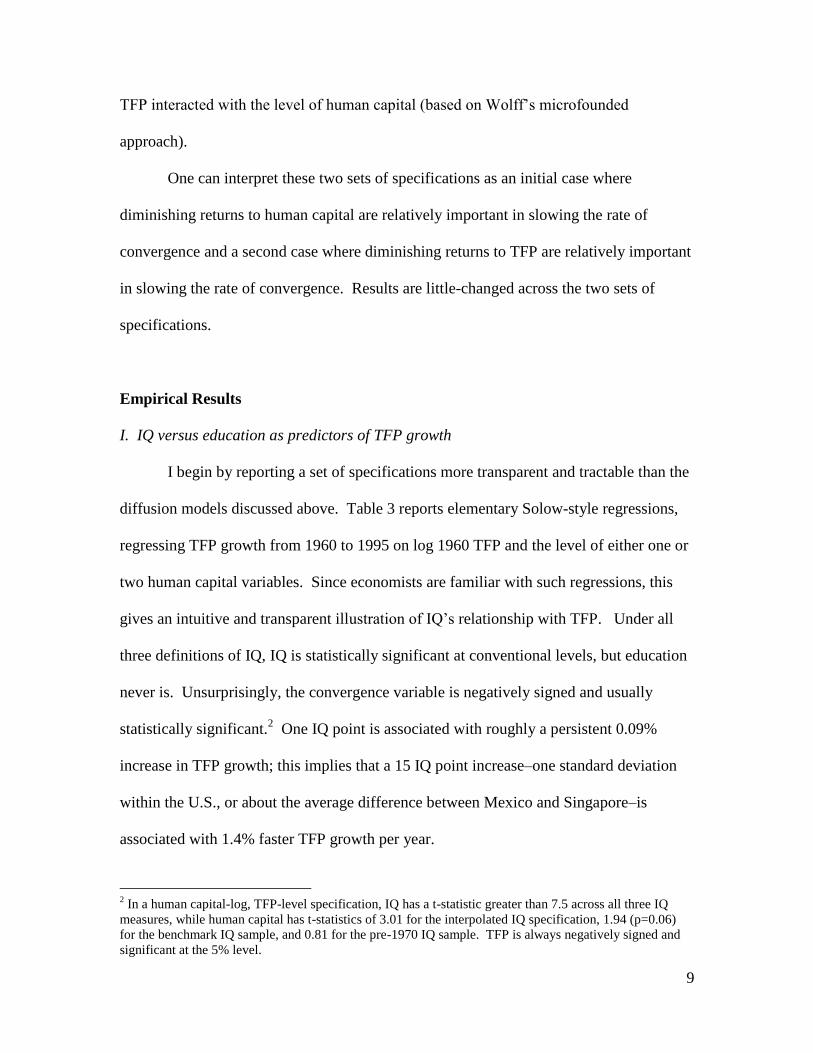
I begin by reporting a set of specifications more transparent and tractable than the
diffusion models discussed above. Table 3 reports elementary Solow-style regressions,
regressing TFP growth from 1960 to 1995 on log 1960 TFP and the level of either one or
two human capital variables. Since economists are familiar with such regressions, this
gives an intuitive and transparent illustration of IQ’s relationship with TFP. Under all
three definitions of IQ, IQ is statistically significant at conventional levels, but education
never is. Unsurprisingly, the convergence variable is negatively signed and usually
statistically significant.2 One IQ point is associated with roughly a persistent 0.09%
increase in TFP growth; this implies that a 15 IQ point increase–one standard deviation
within the U.S., or about the average difference between Mexico and Singapore–is
associated with 1.4% faster TFP growth per year.
2 In a human capital-log, TFP-level specification, IQ has a t-statistic greater than 7.5 across all three IQ
measures, while human capital has t-statistics of 3.01 for the interpolated IQ specification, 1.94 (p=0.06)
for the benchmark IQ sample, and 0.81 for the pre-1970 IQ sample. TFP is always negatively signed and
significant at the 5% level.

10
One can interpret this as a steady-state relationship by dividing the IQ coefficient
by the speed of convergence. Thus, 0.094/1.27 = 0.074; this implies that one IQ point is
associated with 7.4% higher steady state total factor productivity, so a difference of 15 IQ
points is associated with 3 times more productivity in steady state (since e15*0.074
=3).3
II. Testing for Poverty Traps
With this basic evidence in hand, I turn to testing the TFP growth convergence
hypothesis. The empirical question is straightforward: Does OLS prefer a negative sign
on the level of TFP (poverty trap) or a positive sign on the inverse of TFP (no trap)?4
Benhabib and Spiegel showed quite clearly that there was little evidence for the no-trap
hypothesis, with some statistically-insignificant evidence for the low-education/poverty-
trap hypothesis.
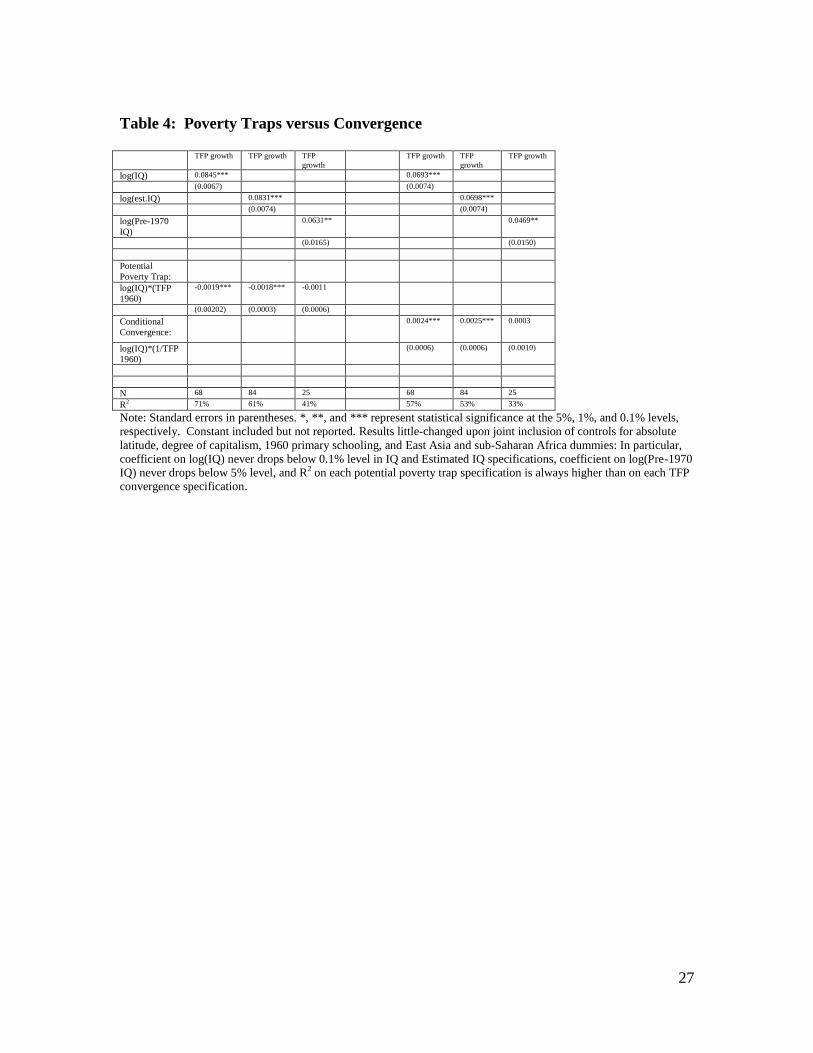
I estimate equations (1) and (2) by OLS and compare these non-nested
specifications for goodness of fit (Table 4). Since these regressions have identical
numbers of parameters, standard information criteria methods will give the same results
as the simpler method of comparing R2 across specifications. In the benchmark case, the
potential poverty trap specification has an R2 of 71%, while the unconditional
convergence (inverse TFP) specification has an R2
of 57%. Including additional controls
for geography, institutions, and primary education from Sala-i-Martin, Doppelhofer, and
3 As Jones and Schneider (2006) show, IQ almost always retains its statistical significance in growth
regressions when additional controls are added. For example, it was significant at the 1% level in all 455
growth regressions that controlled for various combinations of Sala-i-Martin, Doppelhofer, and Miller’s
(2004, henceforth SDM) robust growth variables. Thus, I avoid reporting results with additional controls
here, with this illustrative exception: When additionally controlling for SDM’s degree of capitalism,
absolute latitude, primary schooling in 1960, and East Asia controls, the t-statistic for IQ is 6.2. In steady
state, IQ point is associated with 4% higher TFP. 4 In a cross-sectional specification such as this one, there is no need to model the TFP of the frontier
country.
11
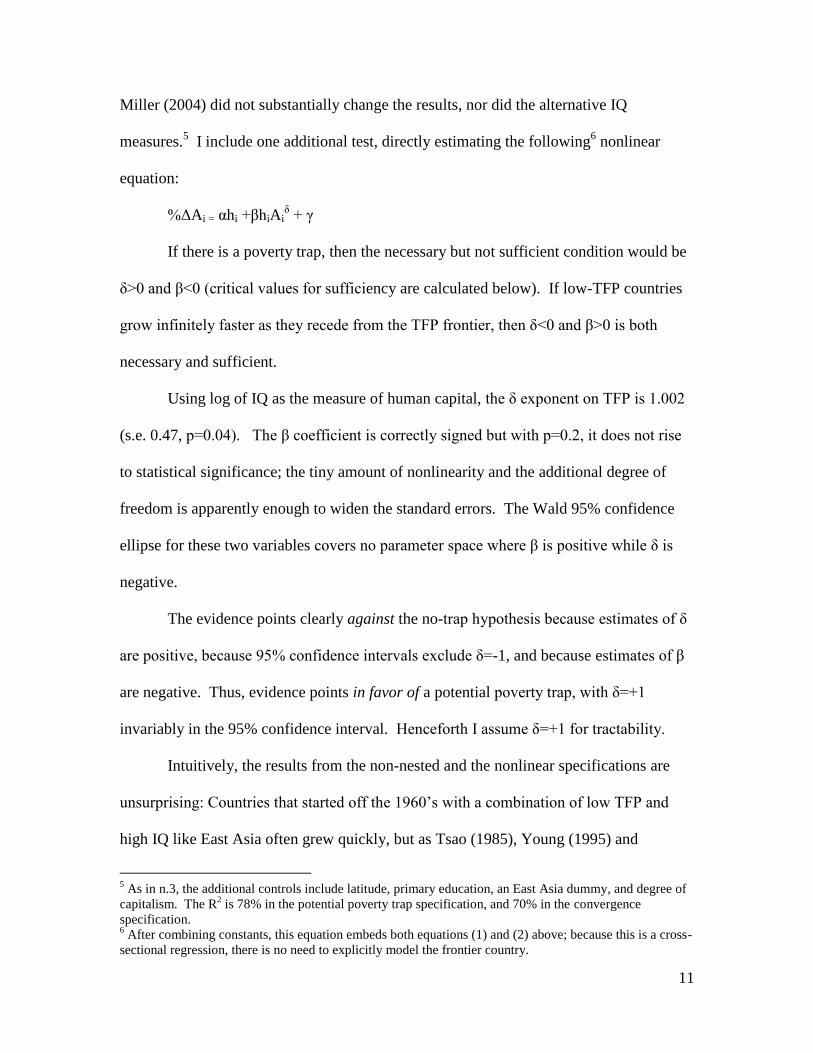
Miller (2004) did not substantially change the results, nor did the alternative IQ
measures.5 I include one additional test, directly estimating the following
6 nonlinear
equation:
%ΔAi = αhi +βhiAiδ + γ
If there is a poverty trap, then the necessary but not sufficient condition would be
δ>0 and β<0 (critical values for sufficiency are calculated below). If low-TFP countries
grow infinitely faster as they recede from the TFP frontier, then δ<0 and β>0 is both
necessary and sufficient.
Using log of IQ as the measure of human capital, the δ exponent on TFP is 1.002
(s.e. 0.47, p=0.04). The β coefficient is correctly signed but with p=0.2, it does not rise
to statistical significance; the tiny amount of nonlinearity and the additional degree of
freedom is apparently enough to widen the standard errors. The Wald 95% confidence
ellipse for these two variables covers no parameter space where β is positive while δ is
negative.
The evidence points clearly against the no-trap hypothesis because estimates of δ
are positive, because 95% confidence intervals exclude δ=-1, and because estimates of β
are negative. Thus, evidence points in favor of a potential poverty trap, with δ=+1
invariably in the 95% confidence interval. Henceforth I assume δ=+1 for tractability.
Intuitively, the results from the non-nested and the nonlinear specifications are
unsurprising: Countries that started off the 1960’s with a combination of low TFP and
high IQ like East Asia often grew quickly, but as Tsao (1985), Young (1995) and
5 As in n.3, the additional controls include latitude, primary education, an East Asia dummy, and degree of
capitalism. The R2 is 78% in the potential poverty trap specification, and 70% in the convergence
specification. 6 After combining constants, this equation embeds both equations (1) and (2) above; because this is a cross-
sectional regression, there is no need to explicitly model the frontier country.

12
Krugman (1994) have all noted, East Asian TFP growth over this period was largely
unremarkable–the East Asian experience fails to support the idea that asympototically
low TFP causes infinite TFP growth.
III. Forecasting poverty traps.
If one takes the poverty-trap model of (1) as the empirical framework, then what
is the critical value? What is the level of national average IQ at which TFP growth is
predicted to be forever slower than that of the frontier country? After all, if that IQ level
is well below the observed values, then the possibility of a poverty trap is a mere
curiosum. As noted above, Benhabib and Spiegel calculated the critical value for
education, and I do the same for IQ. I take the U.S. to be the frontier country, and its
TFP grew at an annual rate of 1.5% (N.B. remaining economic growth arose from capital
growth and population growth). Quantitatively, one wants to know when (collapsing the
unity term into α):
αIQi +βIQi + γ < frontier TFP growth = 1.5%
Note that β is the negative of the estimated interaction coefficient.7 Using log IQ and the
coefficients from the first column of Table 4 (and the omitted constant from that
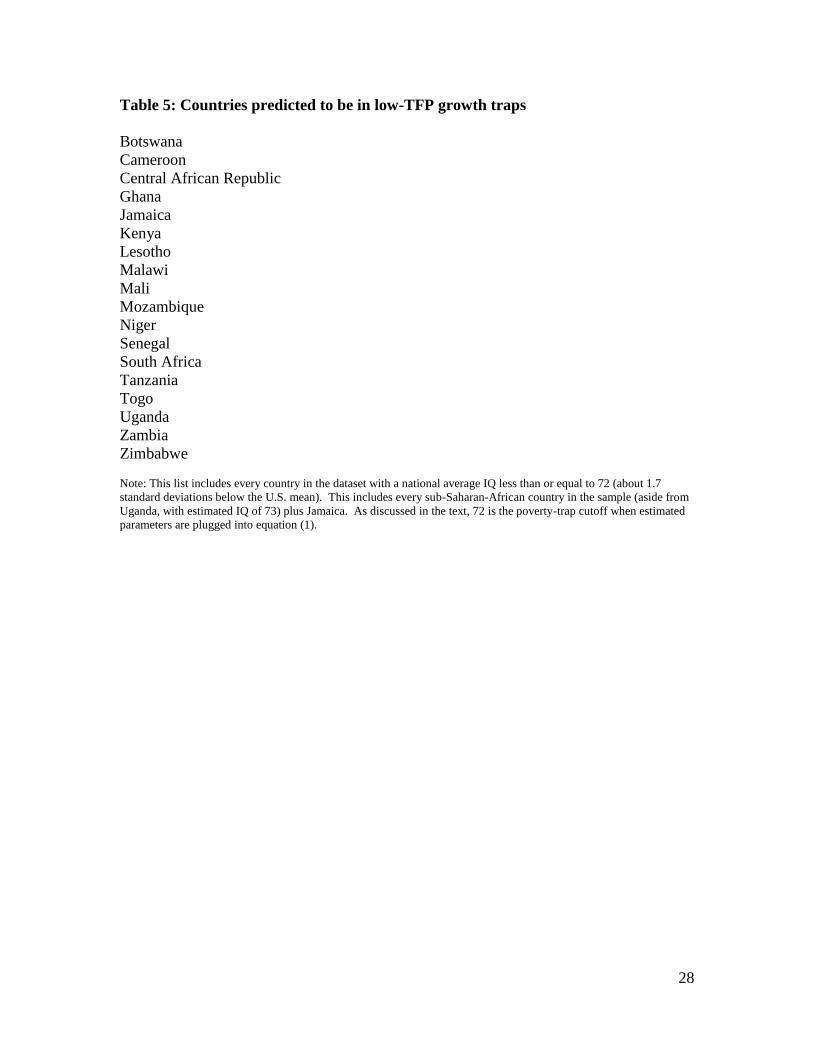
regression), the critical value is 81. When run in the level of IQ, the critical value is 72.8
Under the 72 cutoff, the complete list includes every sub-Saharan African country in this
dataset (with the exception of Uganda, estimated national average IQ of 73) plus Jamaica.
These countries are predicted to constantly fall behind the frontier in steady-state; I report
7 Following Benhabib and Spiegel (2005), we omit other controls in calculating the poverty-trap cutoff; the
question of which values to include for the other controls in estimating the cutoff would admit numerous ad
hoc judgments. Instead, this estimate is best interpreted as a forecasting exercise: Knowing only a
country’s average IQ, would one predict conditional technological convergence or divergence? 8 Coefficients from the first column of Table 7 are used, again including the constant.
13
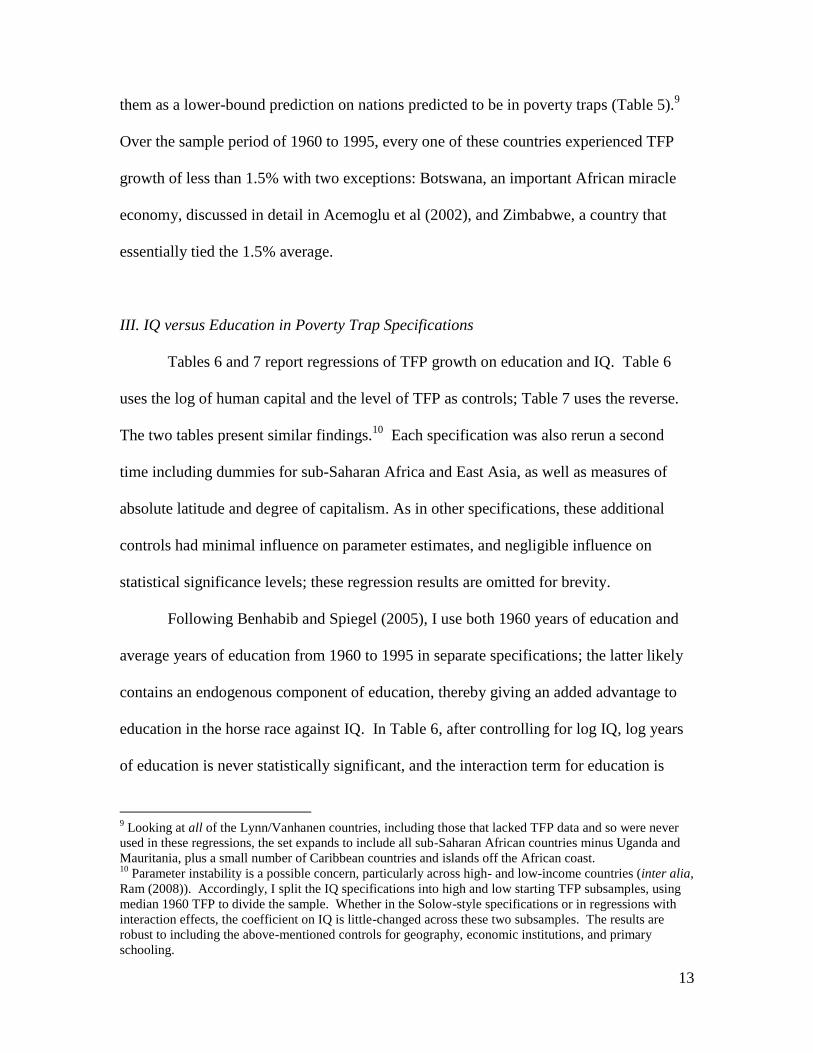
them as a lower-bound prediction on nations predicted to be in poverty traps (Table 5).9
Over the sample period of 1960 to 1995, every one of these countries experienced TFP
growth of less than 1.5% with two exceptions: Botswana, an important African miracle
economy, discussed in detail in Acemoglu et al (2002), and Zimbabwe, a country that
essentially tied the 1.5% average.
III. IQ versus Education in Poverty Trap Specifications
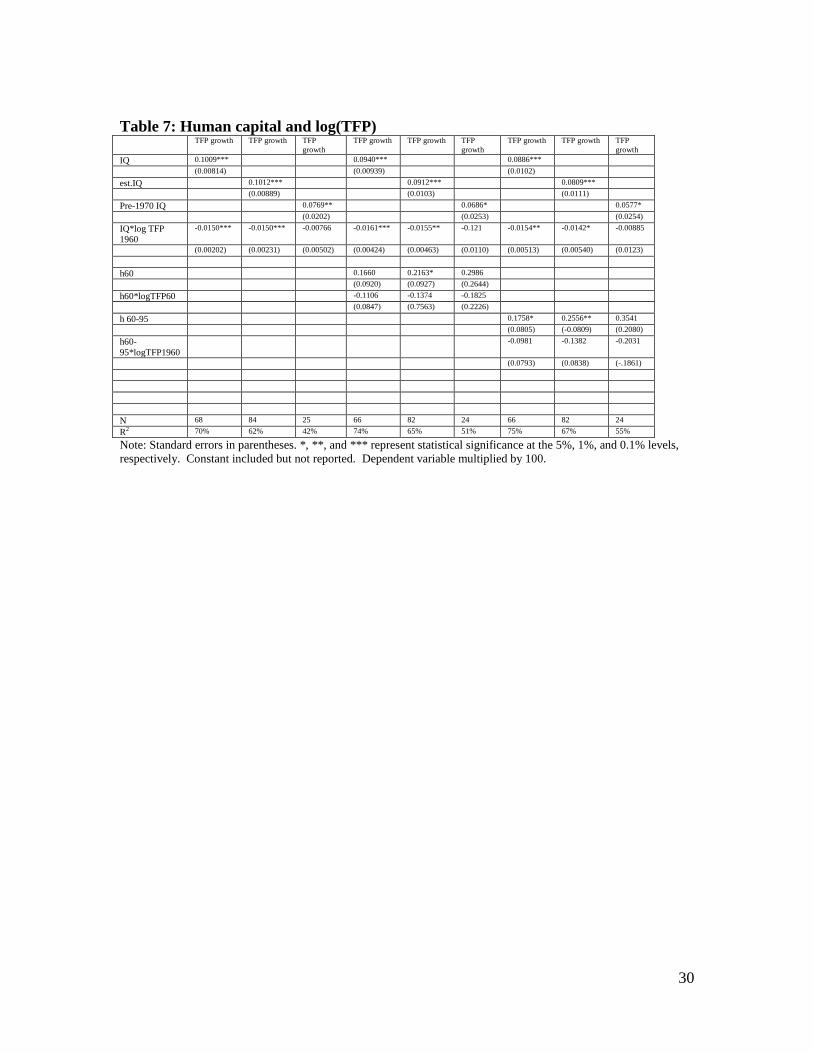
Tables 6 and 7 report regressions of TFP growth on education and IQ. Table 6
uses the log of human capital and the level of TFP as controls; Table 7 uses the reverse.
The two tables present similar findings.10
Each specification was also rerun a second
time including dummies for sub-Saharan Africa and East Asia, as well as measures of
absolute latitude and degree of capitalism. As in other specifications, these additional
controls had minimal influence on parameter estimates, and negligible influence on
statistical significance levels; these regression results are omitted for brevity.
Following Benhabib and Spiegel (2005), I use both 1960 years of education and
average years of education from 1960 to 1995 in separate specifications; the latter likely
contains an endogenous component of education, thereby giving an added advantage to
education in the horse race against IQ. In Table 6, after controlling for log IQ, log years
of education is never statistically significant, and the interaction term for education is
9 Looking at all of the Lynn/Vanhanen countries, including those that lacked TFP data and so were never
used in these regressions, the set expands to include all sub-Saharan African countries minus Uganda and
Mauritania, plus a small number of Caribbean countries and islands off the African coast. 10
Parameter instability is a possible concern, particularly across high- and low-income countries (inter alia,
Ram (2008)). Accordingly, I split the IQ specifications into high and low starting TFP subsamples, using
median 1960 TFP to divide the sample. Whether in the Solow-style specifications or in regressions with
interaction effects, the coefficient on IQ is little-changed across these two subsamples. The results are
robust to including the above-mentioned controls for geography, economic institutions, and primary
schooling.
14
always anomalously signed. In Table 6, years of education is statistically significant in
half the specifications, but never at the 0.1% level; interaction terms for education are
never significant. Both education terms—level and interaction with TFP--are always
correctly signed, even when statistically insignificant.
In both tables, IQ and its interaction term are dramatically more statistically
significant than the education terms in each specification, whether using the 1960
education level or the 1960-1995 average education measure. The IQ level effect is
usually significant at the 0.1% level, while the education level effect is never significant
at that level. The interaction effects provide a similar pattern at lower levels of statistical
significance.
These horse-race results provide no support for the hypothesis that the quantity of
education is more important than the level of IQ in producing and adopting TFP, but
instead support the hypothesis that IQ, even pre-1970 IQ, is a reliable predictor of total
factor productivity growth.
IV. Other controls
Jones and Schneider (2006) (summarized in Hanushek and Woessman (2010)) ran
thousands of regressions that demonstrated the robustness of national average IQ in
predicting economic growth; for instance, in 455 cross-country growth regressions using
combinations of growth variables found robust in SDM (2004), Lynn and Vanhanen’s IQ
estimate was significant at the 1% level in every regression. In the interest of brevity, I
run a shorter set of tests, always using the data of Sala-i-Martin et al. (2004) for
additional controls: I begin by running two tests that replicate Benhabib and Spiegel’s
15
own robustness test (Table 8); one specification uses logs of human capital and levels of
TFP, and the second uses the reverse. The final set of tests uses all 67 of SDM’s growth
variables; these tests will illustrate which of SDM’s growth variables are statistically
significant predictors of productivity growth once one controls for national average IQ.
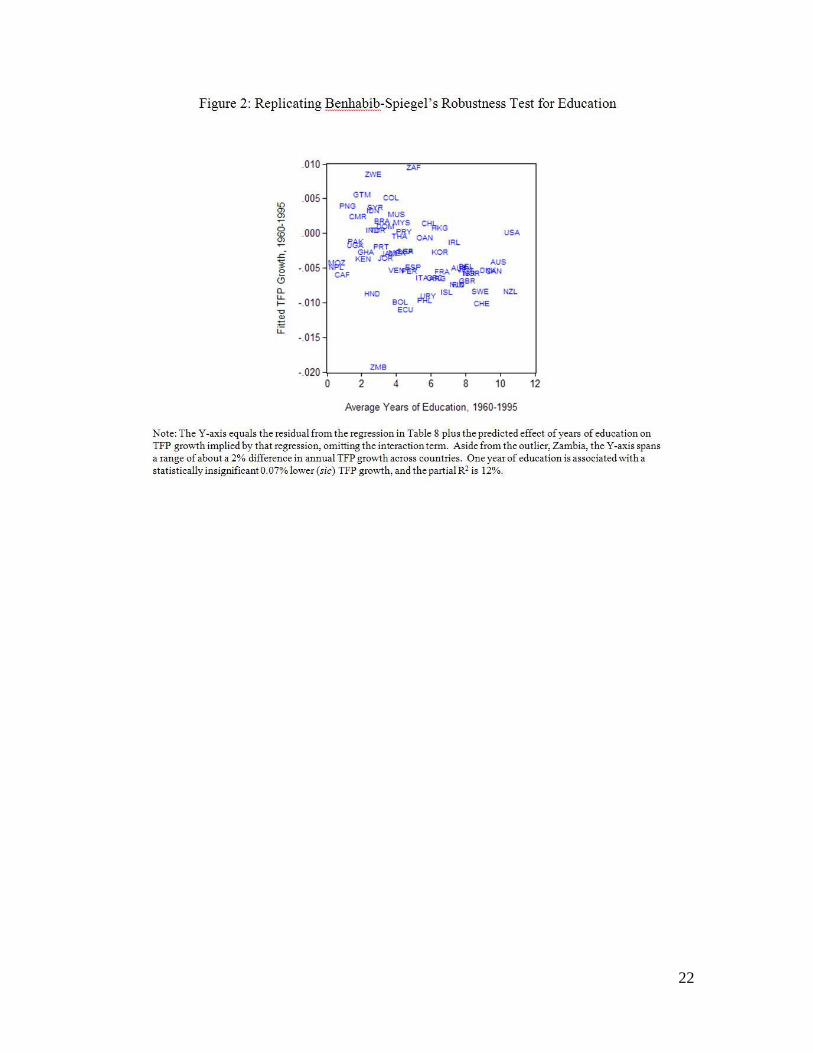
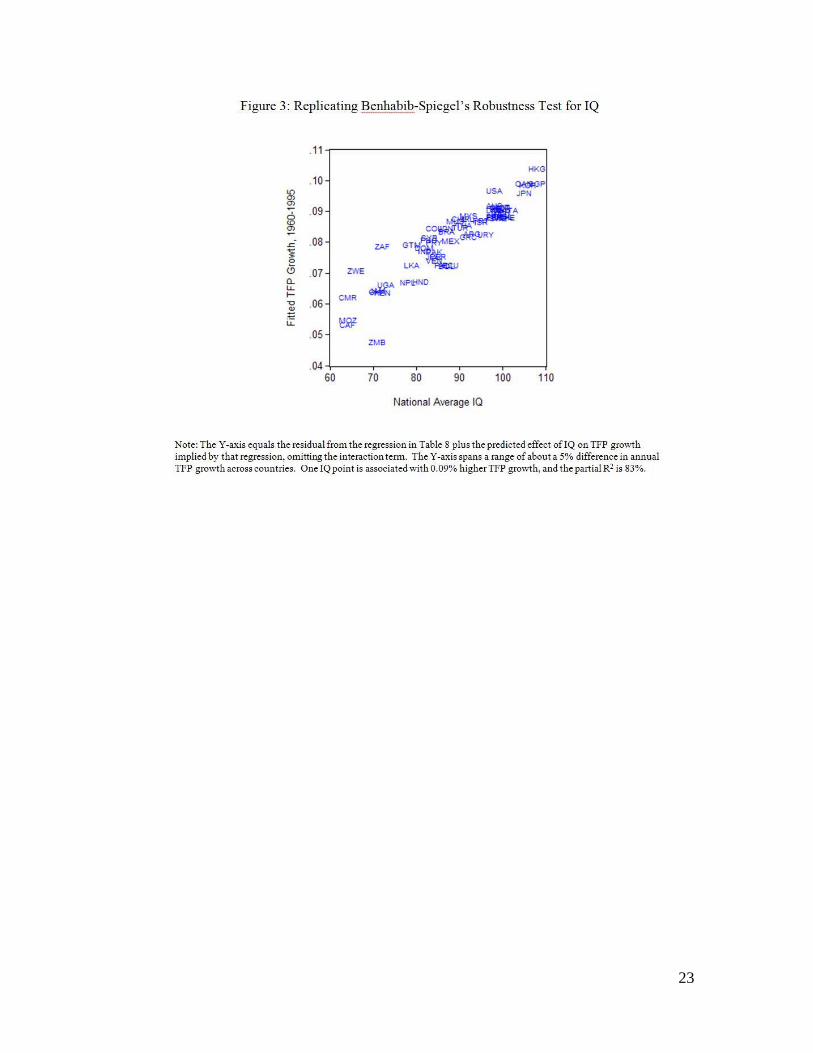
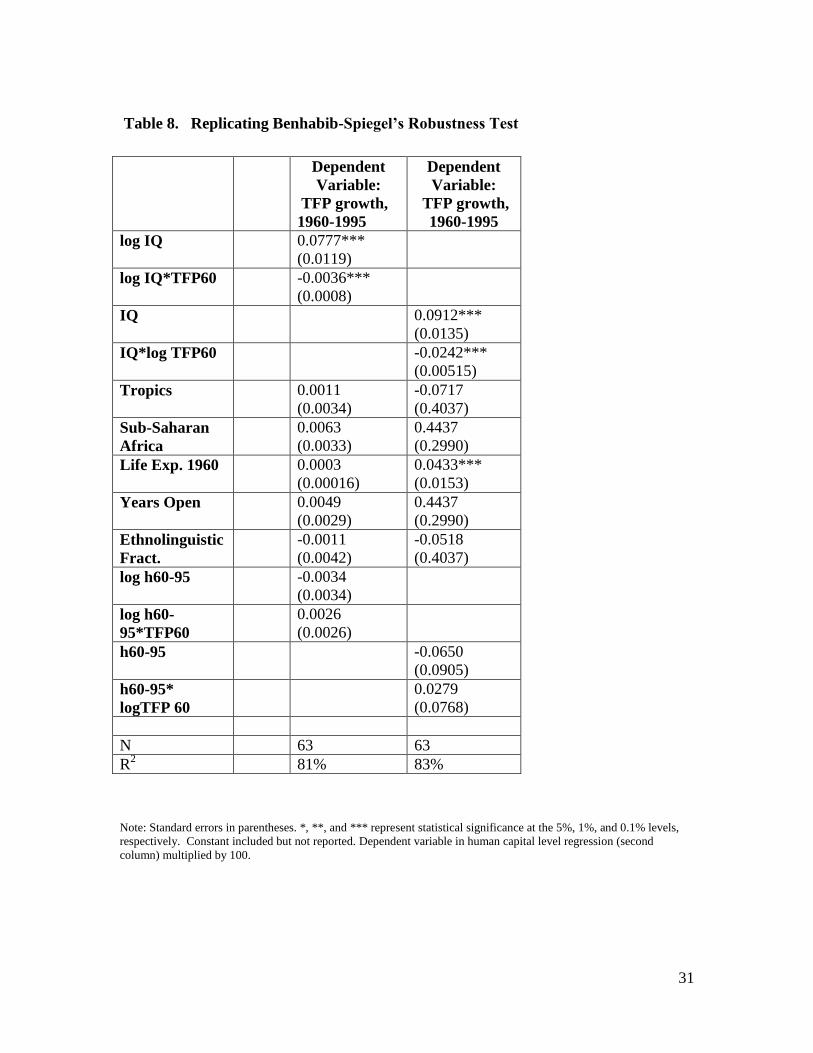
In the replication of Benhabib and Spiegel’s main result (Figures 2 and 3 and
Table 8), I use Tropics, a Sub-Saharan Africa dummy, Year 1960 Life Expectancy, Years
Open to Trade, and Ethnolinguistic Fractionalization, all of which appear to be close
proxies for Benhabib and Spiegel’s original control variables. Of these additional
controls, only Life Expectancy is statistically significant at conventional levels (and then
only in the IQ level regression) and only it and Years Open are ―correctly‖ signed.
Indeed, education is anomalously signed, though statistically insignificant. The signs,
significance, and magnitude of the IQ coefficients, by contrast, are similar to those from
the previous regressions. The partial residual plots (Figures 2 and 3), created in levels of
human capital for ease of interpretation, demonstrate the greater explanatory power of
national average IQ when compared to years of education.11
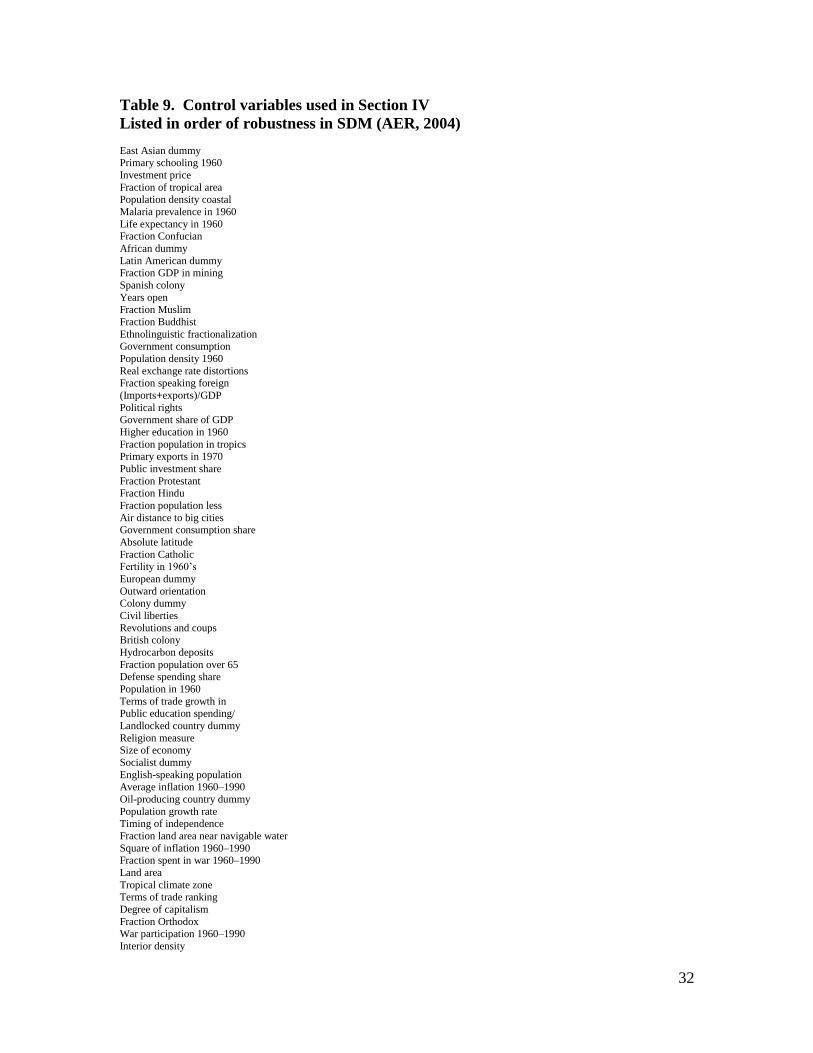
I now turn to the final set of regressions: For each of the two human capital
specifications (log/level and level/log), I run 22 TFP growth regressions that employ all
66 growth regressors included in SDM (2004) (omitting only log 1960 GDP per capita).
I add three of these SDM controls at a time in alphabetical order for five control variables
total per specification: IQ, IQ interacted with TFP, and the three rotating controls; a
constant is also included). These 66 controls (listed in Table 9) include multiple
measures of institutional quality, of geography, of language usage, religion, disease
11
The partial residuals of log human capital have a similar relationship to that of the level of human capital:
log IQ has a correlation of +0.91 with the log specification’s partial (non-IQ) residuals, while log years of
education has a correlation of -0.36 (sic) with the same model’s partial (non-education) residuals.
16
correlates, and many other widely-discussed possible drivers of economic growth—no
major area is omitted, and no major area includes only one measure. In the results
reported below, I use the actual IQ score (omitting interpolated values). This yields a
typical sample size of 65 across specifications. Using the larger ―estimated IQ‖ dataset
had no substantial impact on these results.
The results can be summarized quite briefly: In the 22 specifications that use
combinations of the SDM (2004) variables, national average IQ is always statistically
significant with a t-statistic always greater than 5. Again, given the Jones and Schneider
(2006) result, this is unsurprising. What may be surprising is that only the following non-
IQ variables are ever statistically significant in and of themselves. The sign of the
coefficient and the category of significance (5%, 1% or 0.1%) are reported. Variables
significant in both the level and the log specifications are denoted by an asterisk:
IQ level specifications:
Degree of Capitalism (+) 5%
*Former British colony (+) 5%
*Former Spanish colony (–) 5%
*Fraction English Speaking (+) 5%
*Inflation, 1960-1990 (–) 5%
*Life expectancy 1960(+) 5%
*Primary schooling in 1960 (+) 0.1%
Revolutions and Coups (–) 5%
* Years open to trade (+) 5%
log(IQ) specifications:
Confucianism (+) 5%
Fertility in 1960’s (–) 5%
*Former British colony (+) 5%
*Former Spanish colony (–) 1%
*Fraction English Speaking (+) 1%
Government consumption share, 1961 (–) 5%
*Inflation, 1960-1990 (–) 0.1%
*Life expectancy 1960 (+) 5%
Openness to trade [(Ex+Im)/Y] (+) 5%
Primary exports as % of total exports (–) 5%
17
*Primary schooling in 1960 (+) 0.1%
Revolution/Coup dummy (–) 5%
*Years open to trade (+) 5%
The only coefficient significant at the 0.1% level in both specifications is primary
schooling; this is consistent with the results of Jones and Schneider (2006) who found
that primary schooling was significant in more specifications than any other human
capital measure other than national IQ. It is also consistent with the findings of Glaeser et
al. (2004) who report that ―human capital is a more basic source of growth than are
institutions‖ (p. 271). And between the two classes of specifications, only 15 of the 66
growth variables—23%—are ever statistically significant. Notably, no geography
measure is ever statistically significant in these specifications that control for national
average IQ.
Running the same 22 specifications on years of education twice over (once for the
level of education and the interacted log of TFP, and again for the log of education and
the interacted level of TFP) one sees that when IQ is omitted, other growth variables
appear more robust: Across these 44 specifications that omit IQ, 24 of the 66 variables
are significant at the 5% level at least once, 22 variables are significant in both
regressions, and five are significant at the 0.1% level in both regressions (Confucianism,
Coastal density, East Asia, Life expectancy, and Years open to trade). Controlling for IQ
reduces the statistical significance of other widely-used growth regressors when
compared to specifications that control for education.
18
Conclusion
If national average IQ estimates are indeed ―biased,‖ they appear to be biased in
favor of productivity growth. Thus, it would be most useful for economists and
psychologists to determine just why these highly abstract tests designed by psychologists
are such useful predictors of a crucial variable measured by economists. As part of such
an agenda, researchers might take up James Flynn’s (2007) call to write the ―cognitive
history of the 20th
century,‖ delving into how the human mind has adapted itself to–and
how it helped to create–a high-technology, organizationally-driven society.
At the same time, economists could tap into the literature on the sources of group
IQ differences in order to assess how much of these differences are due to physical
environment, social environment, and genetics. This issue has been debated in a
scholarly exchange available online in the June 2005 issue of the Journal of Psychology,
Public Policy, and Law, an American Psychological Association journal.
And of course, the most important question for economists is how IQ differences,
which appear to have a modest impact on wages (Jones and Schneider (2010), Cawley et
al. (1996), Zax and Rees (2002)), are such important predictors of total factor
productivity growth. If high-average-IQ workers are good at adopting frontier
technology, then why isn’t the wage premium for IQ greater than a mere 1% per IQ point,
less than 1/7th
of the implied steady-state relationship between IQ and aggregate
productivity?
One possibility is that high-IQ citizens are better at discerning good economic
policies: Caplan and Miller (2010) show that citizens who perform better at a simple IQ
test are more likely to agree with economists one a wide variety of economic issues, even

19
after controlling for education. Since some economic ideas appear to involve high levels
of abstraction, high intelligence may be quite useful for understanding the benefits of the
division of labor, of comparative advantage, of flexible prices, and of delegating
economic policymaking power in order to solve time consistency problems. Thus
intelligent citizens may support high-productivity economic policies.
Another possibility noted in the introduction is that high-IQ citizens are better at
building good political institutions. Jones (2008) provides evidence for this, showing that
students at high-SAT schools are more likely to cooperate in a repeated prisoner’s
dilemma, with 100 SAT points associated with 5% to 8% more cooperation. Likewise,
Putterman et al. (2010) has found that high IQ predicts more generous contributions in a
repeated public goods game, and Burks et al. (2009) found that IQ predicted both trust
and trustworthiness in a sequential prisoner’s dilemma game run on truck driving school
students. To the extent that political problem-solving–whether among neighbors, among
businesses on the same street, or among members of a party coalition–depends on the
ability to cooperate in a dynamic environment, then high national average IQ may be
crucial for building the political foundations for productivity growth.
Finally, in a recent paper in Psychological Science, Rindermann (2011) has found
that in path analysis models, the estimated cognitive skills of the top 5% of a nation’s
population are better predictors of scientific achievement and good economic institutions
than the mean cognitive skill of the population. Since the mean score and the top 5%
score correlate +0.97 across countries, economists would be well-advised to bring their
econometric tools to bear on the important question of whether mean scores are more or
less important than extreme scores.
20
Miller’s Managerial Dilemmas (1992) provides an exceptionally clear argument
for the centrality of repeated prisoner’s dilemmas in any explanation of economic
productivity. If the results presented here are as robust as they appear, then some fraction
of cross-country productivity differences may be explained by a short causal chain
running from low IQ causing low cooperation in the public and private sectors which in
turn causes low aggregate productivity. Quantifying the relative strength of this and
other channels running from cognitive ability to aggregate productivity is a question for
future work.

21
22
23
24
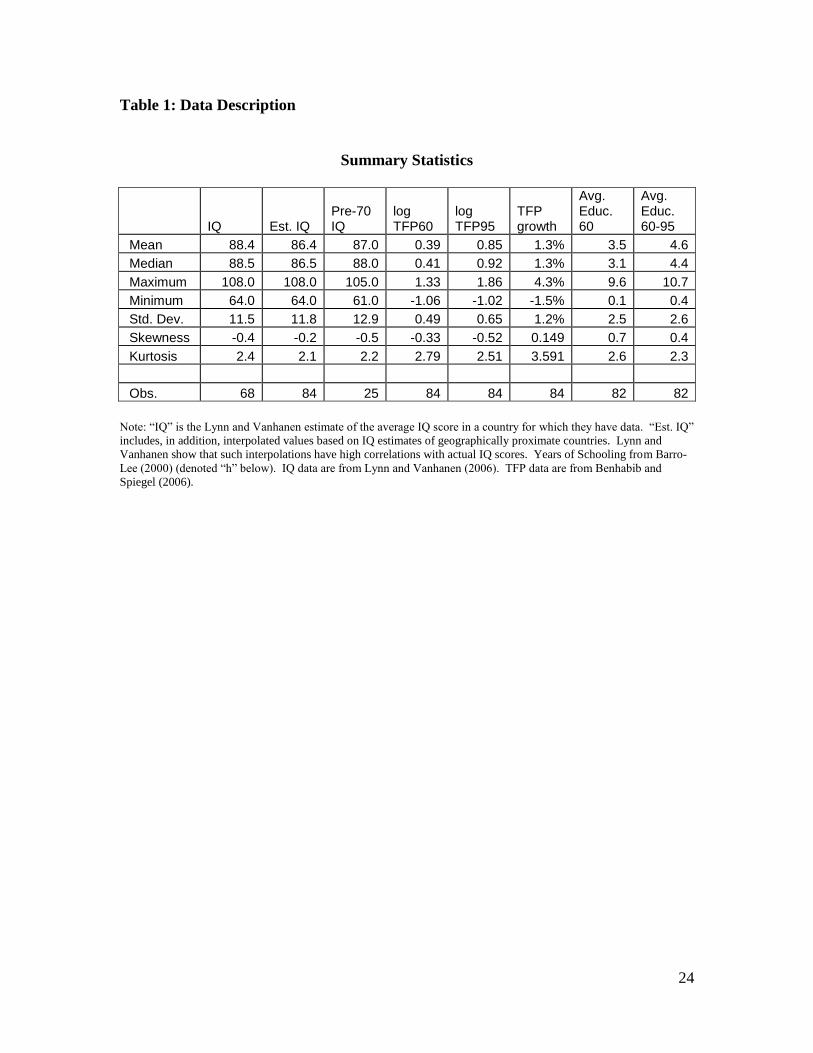
Table 1: Data Description
Summary Statistics
IQ Est. IQ Pre-70 IQ
log TFP60
log TFP95
TFP growth
Avg. Educ. 60
Avg. Educ. 60-95
Mean 88.4 86.4 87.0 0.39 0.85 1.3% 3.5 4.6
Median 88.5 86.5 88.0 0.41 0.92 1.3% 3.1 4.4
Maximum 108.0 108.0 105.0 1.33 1.86 4.3% 9.6 10.7
Minimum 64.0 64.0 61.0 -1.06 -1.02 -1.5% 0.1 0.4
Std. Dev. 11.5 11.8 12.9 0.49 0.65 1.2% 2.5 2.6
Skewness -0.4 -0.2 -0.5 -0.33 -0.52 0.149 0.7 0.4
Kurtosis 2.4 2.1 2.2 2.79 2.51 3.591 2.6 2.3
Obs. 68 84 25 84 84 84 82 82
Note: ―IQ‖ is the Lynn and Vanhanen estimate of the average IQ score in a country for which they have data. ―Est. IQ‖
includes, in addition, interpolated values based on IQ estimates of geographically proximate countries. Lynn and
Vanhanen show that such interpolations have high correlations with actual IQ scores. Years of Schooling from Barro-
Lee (2000) (denoted ―h‖ below). IQ data are from Lynn and Vanhanen (2006). TFP data are from Benhabib and
Spiegel (2006).
25
Table 2
Correlation Matrix
IQ Est. IQ Pre-
70IQ log
TFP60 log
TFP95 TFP
Growth
Avg. Educ. 1960
Avg. Educ. 60-95
IQ 1.00 1.00 0.90 0.51 0.85 0.67 0.68 0.74
Est. IQ 1.00 1.00 0.90 0.56 0.84 0.64 0.71 0.76
Pre-70IQ 0.90 0.90 1.00 0.58 0.77 0.60 0.73 0.76
log TFP60 0.51 0.56 0.58 1.00 0.76 0.00 0.75 0.73
log TFP95 0.85 0.84 0.77 0.76 1.00 0.65 0.76 0.82
TFP Growth 0.67 0.64 0.60 0.00 0.65 1.00 0.30 0.40
Avg. Educ. 1960 0.68 0.71 0.73 0.75 0.76 0.30 1.00 0.97
Avg. Educ. 60-95 0.74 0.76 0.76 0.73 0.82 0.40 0.97 1.00
Note: ―IQ‖ is the Lynn and Vanhanen estimate of the average IQ score in a country for which they have data. ―Est. IQ‖
includes, in addition, interpolated values based on IQ estimates of geographically proximate countries. Lynn and
Vanhanen show that such interpolations have high correlations with actual IQ scores. Years of Schooling from Barro-
Lee (2000) (denoted ―h‖ below). IQ data are from Lynn and Vanhanen (2006). TFP data are from Benhabib and
Spiegel (2006).

26
Table 3: Solovian Convergence Results Dependent Variable TFP growth TFP growth TFP growth TFP growth TFP growth TFP growth
IQ 0.0944*** 0.0937***
(0.01884) (0.00918)
est.IQ 0.0956*** 0.0926***
(0.0863) (0.0100)
Pre-1970 IQ 0.0737*** 0.0749**
(0.0192) (0.0219)
h 1960 0.0335 0.0645 0.101
(0.0578) (0.0594) (0.1414)
log TFP 1960 -1.2743*** -1.271*** -0.654 -1.636*** -1.6392*** -1.58
(0.1884) (0.2056) (0.4408) 0.2767 0.2710 (0.1414)
N 68 84 25 66 82 24
R2 68% 60% 42% 71% 63% 50%
Note: Standard errors in parentheses. *, **, and *** represent statistical significance at the 5%, 1%, and 0.1% levels,
respectively. Constant included but not reported. Dependent variable multiplied by 100: 1 IQ point associated with
~0.09% faster TFP growth.
27
Table 4: Poverty Traps versus Convergence
TFP growth TFP growth TFP
growth
TFP growth TFP
growth
TFP growth
log(IQ) 0.0845*** 0.0693***
(0.0067) (0.0074)
log(est.IQ) 0.0831*** 0.0698***
(0.0074) (0.0074)
log(Pre-1970
IQ)
0.0631** 0.0469**
(0.0165) (0.0150)
Potential
Poverty Trap:
log(IQ)*(TFP
1960)
-0.0019*** -0.0018*** -0.0011
(0.00202) (0.0003) (0.0006)
Conditional
Convergence:
0.0024*** 0.0025*** 0.0003
log(IQ)*(1/TFP
1960)
(0.0006) (0.0006) (0.0010)
N 68 84 25 68 84 25
R2 71% 61% 41% 57% 53% 33%
Note: Standard errors in parentheses. *, **, and *** represent statistical significance at the 5%, 1%, and 0.1% levels,
respectively. Constant included but not reported. Results little-changed upon joint inclusion of controls for absolute
latitude, degree of capitalism, 1960 primary schooling, and East Asia and sub-Saharan Africa dummies: In particular,
coefficient on log(IQ) never drops below 0.1% level in IQ and Estimated IQ specifications, coefficient on log(Pre-1970
IQ) never drops below 5% level, and R2 on each potential poverty trap specification is always higher than on each TFP
convergence specification.
28
Table 5: Countries predicted to be in low-TFP growth traps
Botswana
Cameroon
Central African Republic
Ghana
Jamaica
Kenya
Lesotho
Malawi
Mali
Mozambique
Niger
Senegal
South Africa
Tanzania
Togo
Uganda
Zambia
Zimbabwe
Note: This list includes every country in the dataset with a national average IQ less than or equal to 72 (about 1.7
standard deviations below the U.S. mean). This includes every sub-Saharan-African country in the sample (aside from
Uganda, with estimated IQ of 73) plus Jamaica. As discussed in the text, 72 is the poverty-trap cutoff when estimated
parameters are plugged into equation (1).

29
Table 6: log(Human capital) and TFP TFP growth TFP growth TFP
growth
TFP growth TFP growth TFP
growth
TFP growth TFP growth TFP
growth
log(IQ) 0.0845*** 0.0760*** 0.0731***
(0.0067) (0.0077) (0.0083)
log(est.IQ) 0.0831*** 0.0706*** 0.0651***
(0.0074) (0.0083) (0.0087)
log(Pre-1970
IQ)
0.0631** 0.0544** 0.0483*
(0.0165) (0.0180) (0.0188)
log(IQ)*TFP60 -0.0019*** -0.0018*** -0.0011 -0.0028*** -0.0030*** -0.0031 -0.0031*** -0.0033*** -0.0034
(0.00202) (0.0003) (0.0006) (0.0006) (0.0006) (0.0016) (0.0009) (0.0009) (0.0021)
log(h60) 0.0007 0.0015 0.0005
(0.0021) (0.0021) (0.0042)
log(h60)*
TFP60
0.0016 0.0020 0.0030
(0.0014) (0.0015) (0.0034)
log(h60-95) 0.0019 0.0034 0.0040
(0.0033) (0.0030) (0.0068)
log(h60-95)*
TFP1960
0.0020 0.0024 0.0032
(0.0020) (0.0020) (0.0045)
N 68 84 25 66 82 24 66 82 24
R2 71% 61% 41% 73% 65% 50% 74% 67% 52%
Note: Standard errors in parentheses. *, **, and *** represent statistical significance at the 5%, 1%, and 0.1% levels,
respectively. Constant included but not reported. Additional joint inclusion of controls for sub-Saharan Africa, East
Asia, absolute latitude, and degree of capitalism had minimal influence on these estimates.
30
Table 7: Human capital and log(TFP) TFP growth TFP growth TFP
growth
TFP growth TFP growth TFP
growth
TFP growth TFP growth TFP
growth
IQ 0.1009*** 0.0940*** 0.0886***
(0.00814) (0.00939) (0.0102)
est.IQ 0.1012*** 0.0912*** 0.0809***
(0.00889) (0.0103) (0.0111)
Pre-1970 IQ 0.0769** 0.0686* 0.0577*
(0.0202) (0.0253) (0.0254)
IQ*log TFP
1960
-0.0150*** -0.0150*** -0.00766 -0.0161*** -0.0155** -0.121 -0.0154** -0.0142* -0.00885
(0.00202) (0.00231) (0.00502) (0.00424) (0.00463) (0.0110) (0.00513) (0.00540) (0.0123)
h60 0.1660 0.2163* 0.2986
(0.0920) (0.0927) (0.2644)
h60*logTFP60 -0.1106 -0.1374 -0.1825
(0.0847) (0.7563) (0.2226)
h 60-95 0.1758* 0.2556** 0.3541
(0.0805) (-0.0809) (0.2080)
h60-
95*logTFP1960
-0.0981 -0.1382 -0.2031
(0.0793) (0.0838) (-.1861)
N 68 84 25 66 82 24 66 82 24
R2 70% 62% 42% 74% 65% 51% 75% 67% 55%
Note: Standard errors in parentheses. *, **, and *** represent statistical significance at the 5%, 1%, and 0.1% levels,
respectively. Constant included but not reported. Dependent variable multiplied by 100.
31
Table 8. Replicating Benhabib-Spiegel’s Robustness Test
Note: Standard errors in parentheses. *, **, and *** represent statistical significance at the 5%, 1%, and 0.1% levels,
respectively. Constant included but not reported. Dependent variable in human capital level regression (second
column) multiplied by 100.
Dependent
Variable:
TFP growth,
1960-1995
Dependent
Variable:
TFP growth,
1960-1995
log IQ 0.0777***
(0.0119)
log IQ*TFP60 -0.0036***
(0.0008)
IQ 0.0912***
(0.0135)
IQ*log TFP60 -0.0242***
(0.00515)
Tropics 0.0011
(0.0034)
-0.0717
(0.4037)
Sub-Saharan
Africa
0.0063
(0.0033)
0.4437
(0.2990)
Life Exp. 1960 0.0003
(0.00016)
0.0433***
(0.0153)
Years Open 0.0049
(0.0029)
0.4437
(0.2990)
Ethnolinguistic
Fract.
-0.0011
(0.0042)
-0.0518
(0.4037)
log h60-95 -0.0034
(0.0034)
log h60-
95*TFP60
0.0026
(0.0026)
h60-95 -0.0650
(0.0905)
h60-95*
logTFP 60
0.0279
(0.0768)
N 63 63
R2
81% 83%
32
Table 9. Control variables used in Section IV
Listed in order of robustness in SDM (AER, 2004)
East Asian dummy Primary schooling 1960
Investment price
Fraction of tropical area Population density coastal
Malaria prevalence in 1960
Life expectancy in 1960 Fraction Confucian
African dummy
Latin American dummy Fraction GDP in mining
Spanish colony
Years open Fraction Muslim
Fraction Buddhist
Ethnolinguistic fractionalization Government consumption
Population density 1960
Real exchange rate distortions Fraction speaking foreign
(Imports+exports)/GDP
Political rights Government share of GDP
Higher education in 1960
Fraction population in tropics Primary exports in 1970
Public investment share
Fraction Protestant Fraction Hindu
Fraction population less
Air distance to big cities Government consumption share
Absolute latitude
Fraction Catholic
Fertility in 1960’s
European dummy
Outward orientation Colony dummy
Civil liberties
Revolutions and coups British colony
Hydrocarbon deposits
Fraction population over 65 Defense spending share
Population in 1960
Terms of trade growth in Public education spending/
Landlocked country dummy
Religion measure Size of economy
Socialist dummy
English-speaking population
Average inflation 1960–1990
Oil-producing country dummy
Population growth rate Timing of independence
Fraction land area near navigable water
Square of inflation 1960–1990 Fraction spent in war 1960–1990
Land area
Tropical climate zone Terms of trade ranking
Degree of capitalism
Fraction Orthodox War participation 1960–1990
Interior density
33
Bibliography
Acemoglu, Daron; Johnson, Simon, and Robinson, James A, (2002). ―An African
Success Story: Botswana,‖ CEPR Discussion Papers 3219.
Barro, Robert J & Lee, Jong Wha, (1996). ―International Measures of Schooling Years
and Schooling Quality,‖ American Economic Review. vol. 86(2), pages 218-23.
Barro, Robert J & Sala-i-Martin, Xavier, (1997). ―Technological Diffusion, Convergence,
and Growth,‖ Journal of Economic Growth, vol. 2(1), pages 1-26, March.
Benhabib, Jess & Spiegel, Mark M., (1994), ―The role of human capital in economic
development evidence from aggregate cross-country data,‖ Journal of Monetary
Economics, vol. 34(2), pages 143-173, October.
Benhabib, Jess & Spiegel, Mark M., (2005). ―Human Capital and Technology
Diffusion,‖ volume 1, chapter 13, pages 935-966 in Phillipe Aghion and Steven
Durlauf, eds., Handbook of Economic Growth, New York: Elsevier.
Burks, Stephen, Jeffrey Carpenter, Lorenz Goette and Aldo Rustichini., (2009).
―Cognitive Skills Explain Economic Preferences, Strategic Behavior and Job
Attachment,‖ Proceedings of the National Academy of Sciences, May 12;
106(19): 7745-7750.
Caplan, Bryan and Miller, Stephen C. (2010), ―Economic Beliefs, Intelligence, and
Ability Bias: Evidence from the General Social Survey,‖ Intelligence.
Cawley, John; Conneely, Karen; Heckman, James, and Vytlacil, Edward, (1996).
―Cognitive Ability, Wages, and Meritocracy,‖ NBER Working Papers 5645.
Deary, Ian, (2001) Intelligence: A very short introduction. NY: Oxford University Press.
Dickerson, Richard E., (2006). ―Exponential correlation of IQ and the wealth of nations,‖
Intelligence, Volume 34, Issue 3, May-June 2006, Pages 291-295.
Flynn, James, (2007). What is Intelligence? Beyond the Flynn Effect. Princeton
University Press.
Gerschenkron, Alexander, (1962). ―Economic Backwardness in Historical Perspective‖ c.
4, pps. 85-104. in Development: Critical Concepts in the Social Sciences, Stuart
Corbridge, ed., Routledge, 2000.
Glaeser, Edward L., Rafael La Porta, Florencio Lopez-de-Silanes and Andrei Shleifer
(2004). "Do Institutions Cause Growth?" Journal of Economic Growth, 2004,
9(3), pages 271-303.
34
Hanushek, E. & Kimko, D., (2000). ―Schooling, Labor Force Quality, and the
Growth of Nations,‖ American Economic Review, 90, 1184-1208.
Hanushek, Eric and Woessmann, Ludger, (2007). ―The Role of School Improvement in
Economic Development,‖ NBER Working Paper No. 12832.
Hanushek, Eric and Woessmann, Ludger, (2010). ―The economics of international
differences in educational achievement,‖ NBER Working Paper No. 15949.
Jensen, A. R. (1998). The g-factor: The science of mental ability. Westport, CT: Praeger.
Jones, Garett (2011). ―National IQ and national productivity: The hive mind across
Asia.‖ Asian Development Review 28, 58-71.
Jones, Garett, (2008). ―Are Smarter Groups More Cooperative? Evidence from Prisoner’s
Dilemma Experiments, 1959-2003.‖ Journal of Economic Behavior and
Organization, 68:3, pps. 489-497.
Jones, Garett and Schneider, W. Joel, (2010). ―IQ in the Production Function: Evidence
from Immigrant Earnings,‖ Economic Inquiry, 48:3, 743-755.
Jones. Garett and Schneider, W. Joel, (2006). ―Intelligence, Human Capital, and
Economic Growth: A Bayesian Averaging of Classical Estimates (BACE)
Approach,‖ Journal of Economic Growth, vol. 11(1), pages 71-93.
Krugman, Paul, (1994). ―The Myth of Asia’s Miracle,‖ Foreign Affairs. Nov/Dec 1994.
Lynn, Richard and Tatu Vanhanen, (2002). IQ and the Wealth of Nations. Westport, CT:
Praeger Publishers.
Lynn, Richard and Tatu Vanhanen, (2006). IQ and Global Inequality. Augusta, GA:
Washington Summit Publishers.
Miller, Gary, (1992) Managerial Dilemmas, Cambridge University Press.
Putterman, Louis, Jean-Robert Tyran, and Kenju Kamei, (2010). ―Public Goods and
Voting on Formal Sanction Schemes: An Experiment,‖ working paper, Brown
University.
Sala-i-Martin, Xavier; Doppelhofer, Gernot, and Miller, Ronald, (2004). ―Determinants
of Long-Run Growth: a Bayesian Averaging of Classical Estimates (BACE)
approach,‖ American Economic Review, 94(4), 813-835.
35
Nelson, Richard R. and Phelps, Edmund S., (1966). ―Investment in Humans,
Technological Diffusion, and Economic Growth‖ American Economic Review, v
56(1) pps. 69-75.
Potrafke, Niklas (forthcoming). ―Intelligence and Corruption,‖ Economics Letters.
Ram, Rati, (2007). ―IQ and economic growth: Further augmentation of Mankiw-Romer-
Weil model,‖ Economics Letters, vol. 94(1), pages 7-11, January.
Ram, Rati, (2008). ―Parametric variability in cross-country growth regressions: An
application of quantile-regression methodology,‖ Economics Letters, 99(2), pages
387-389.
Rindermann, Heiner, (2007a). ―The g-factor of international cognitive ability
comparisons: the homogeneity of results in PISA, TIMSS, PIRLS and IQ-tests
across nations,‖ European Journal of Personality, 21(5), pages 667-706.
Rindermann, H. (2007b). ―The big g-factor of national cognitive ability.‖ European
Journal of Personality, 21(5), pages 767–787.
Rindermann, H. (2011). ―Cognitive Capitalism: The effect of cognitive ability on wealth,
as mediated through scientific achievement and economic freedom,‖
Psychological Science, 22(6), pages 754-763.
Sala-i-Martin, Xavier, (1997). ―I Just Ran Two Million Regressions,‖ American
Economic Review, vol. 87(2), pages 178-83, May.
Tsao, Yuan, (1985). ―Growth without Productivity: Singapore Manufacturing in the
1970s,‖ Journal of Development Economics, vol. 19(1-2), pages 25-38.
Weede, Erich and Kampf, Sebastian, (2002). ―The Impact of Intelligence and
Institutional Improvements on Economic Growth,‖ Kyklos, vol. 55(3), pages 361-
80.
Wicherts, J.M., C.V. Dolan, J.S. Carlson, and H.L.J. van der Maas (2009). ―Raven's test
performance of sub-Saharan Africans: Average performance, psychometric
properties, and the Flynn Effect,‖ Learning and Individual Differences, In Press,
Corrected Proof.
Wicherts, J.M., C.V. Dolan, J.S. Carlson, and H.L.J. van der Maas (2010a). ―A
systematic literature review of the average IQ of sub-Saharan Africans,‖
Intelligence, (38)1, p1-20.

36
Wicherts, J.M., C.V. Dolan, J.S. Carlson, and H.L.J. van der Maas (2010b). ―Another
failure to replicate Lynn's estimate of the average IQ of sub-Saharan Africans,‖
Learning and Individual Differences, (20)3, p155-157.
Wolff, Edward, (2000). ―Human capital investment and economic growth: exploring the
cross-country evidence,‖ Structural Change and Economic Dynamics, vol. 11(4),
pages 433-472.
Young, Alwyn, (1995). ―The Tyranny of Numbers: Confronting the Statistical Realities
of the East Asian Growth Experience,‖ Quarterly Journal of Economics. vol.
110(3), pages 641-80, August.
Zax, J. S. & Rees, D. I., (2002). ―IQ, Academic Performance, Environment, and
Earnings,‖ Review of Economics and Statistics, 84, 4, 600-616.


![The Language of Programming: A Cognitive Perspectiveweb.mit.edu/evlab/assets/papers/Fedorenko_et_al_2019... · 2019. 6. 21. · overall cognitive load [3]. Thus, empirical research](https://img.pdfslide.net/doc/110x75/60a1d53c2cde624356238353/the-language-of-programming-a-cognitive-2019-6-21-overall-cognitive-load-3.jpg)