Embed Size (px)
Citation preview
COGNIZANT4TH QUARTER 2017
CHARGING TOWARDS AN ELECTRIFIED FUTURE | CONTINENTAL — BOARD THE POWERTRAIN INTO THE FUTURE GLENCORE — BETTING ON A SUSTAINABLE FUTURE | FIDUCIARY LESSONS TO BE LEARNED FROM THE PASSING OF HUGH HEFNER
SELLING THE DREAM — HOW CAR ADVERTISING HAS EVOLVED
2
TABLEOF
CONTENTS
INTRODUCTION 3
CHARGING TOWARDS AN ELECTRIFIED FUTURE 5
CONTINENTAL – BOARD THE POWERTRAIN INTO THE FUTURE 12
GLENCORE – BETTING ON A SUSTAINABLE FUTURE 17
FIDUCIARY LESSONS TO BE LEARNED FROM THE PASSING OF HUGH HEFNER 23
SELLING THE DREAM – HOW CAR ADVERTISING HAS EVOLVED 24
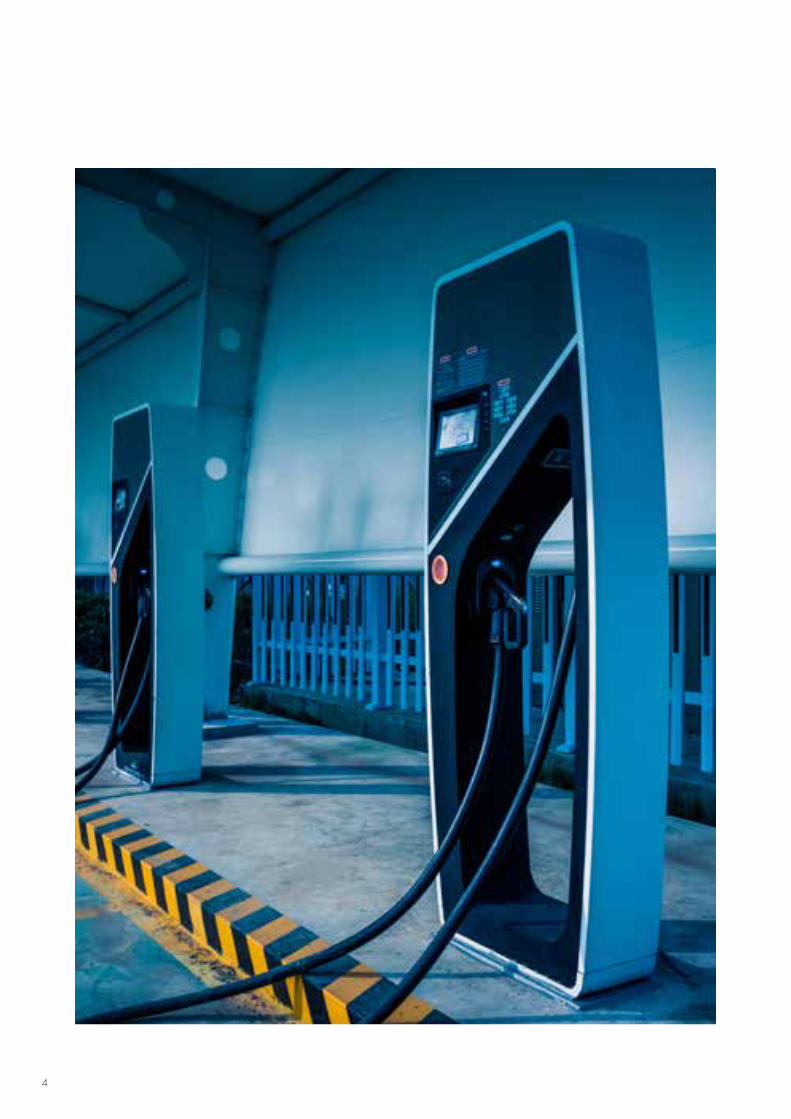
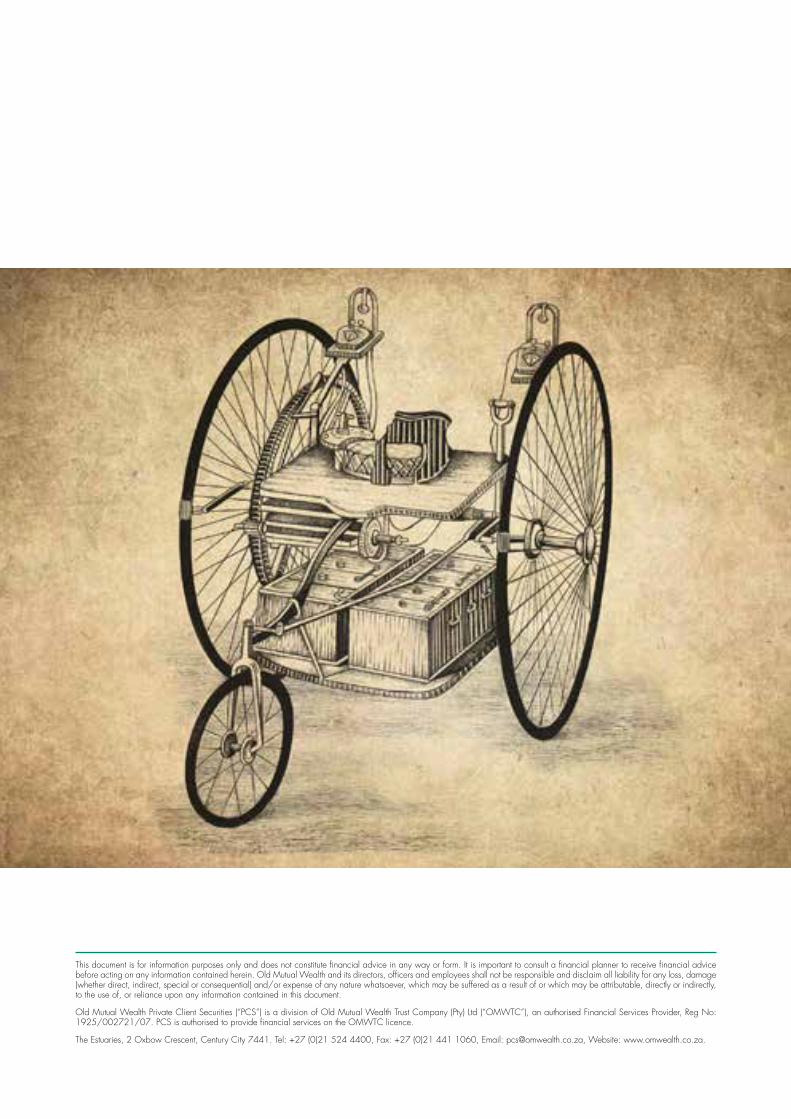
COVER IMAGE – THE WORLD'S FIRST ELECTRIC CARDecreasing our dependence on fossil fuel has become a priority in recent years, and as a result electric cars are becoming far more mainstream than ever before. But electric cars aren’t exactly a new idea – the one on the cover dates back to 1881. This odd-looking vehicle was the world’s very first electric car. It was built from a modified Starley tricycle by English scientists William Ayrton and John Perry as a sort of rolling billboard that would advertise the duo’s electric inventions. It had a top speed of nearly 15 km/h and a range of around 40 km.
3
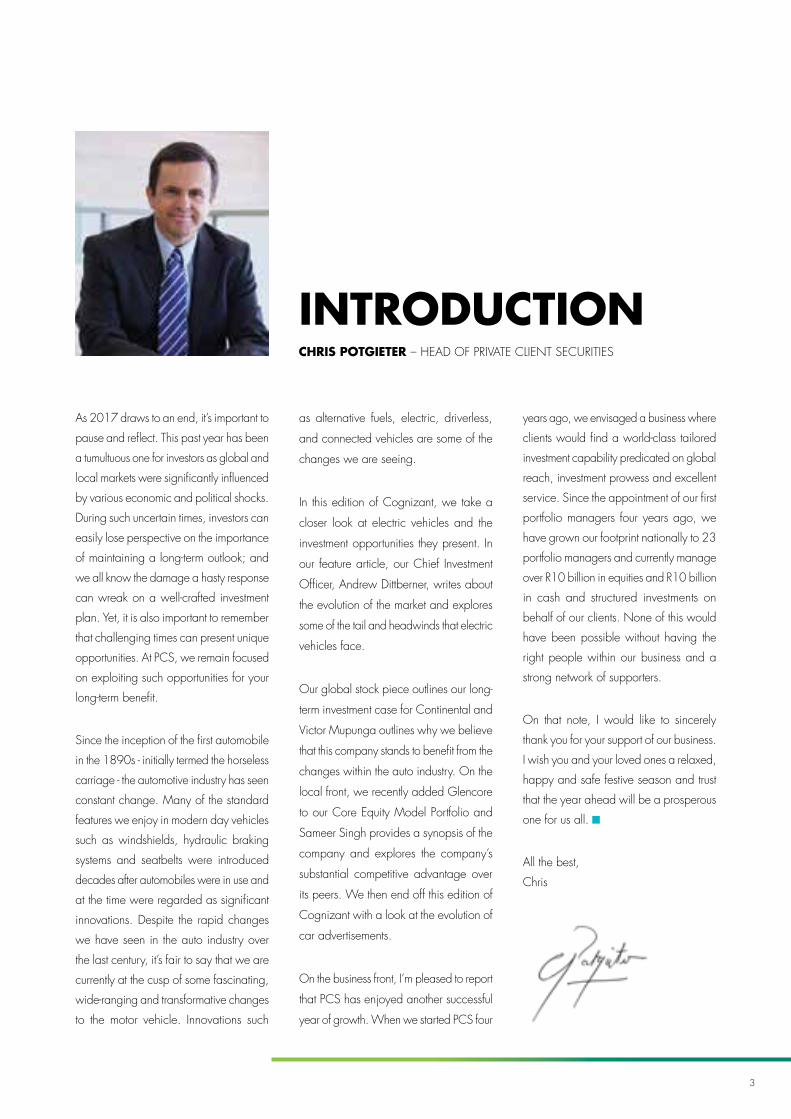
INTRODUCTION CHRIS POTGIETER – HEAD OF PRIVATE CLIENT SECURITIES
As 2017 draws to an end, it’s important to
pause and reflect. This past year has been
a tumultuous one for investors as global and
local markets were significantly influenced
by various economic and political shocks.
During such uncertain times, investors can
easily lose perspective on the importance
of maintaining a long-term outlook; and
we all know the damage a hasty response
can wreak on a well-crafted investment
plan. Yet, it is also important to remember
that challenging times can present unique
opportunities. At PCS, we remain focused
on exploiting such opportunities for your
long-term benefit.
Since the inception of the first automobile
in the 1890s - initially termed the horseless
carriage - the automotive industry has seen
constant change. Many of the standard
features we enjoy in modern day vehicles
such as windshields, hydraulic braking
systems and seatbelts were introduced
decades after automobiles were in use and
at the time were regarded as significant
innovations. Despite the rapid changes
we have seen in the auto industry over
the last century, it’s fair to say that we are
currently at the cusp of some fascinating,
wide-ranging and transformative changes
to the motor vehicle. Innovations such
as alternative fuels, electric, driverless,
and connected vehicles are some of the
changes we are seeing.
In this edition of Cognizant, we take a
closer look at electric vehicles and the
investment opportunities they present. In
our feature article, our Chief Investment
Officer, Andrew Dittberner, writes about
the evolution of the market and explores
some of the tail and headwinds that electric
vehicles face.
Our global stock piece outlines our long-
term investment case for Continental and
Victor Mupunga outlines why we believe
that this company stands to benefit from the
changes within the auto industry. On the
local front, we recently added Glencore
to our Core Equity Model Portfolio and
Sameer Singh provides a synopsis of the
company and explores the company’s
substantial competitive advantage over
its peers. We then end off this edition of
Cognizant with a look at the evolution of
car advertisements.
On the business front, I’m pleased to report
that PCS has enjoyed another successful
year of growth. When we started PCS four
years ago, we envisaged a business where
clients would find a world-class tailored
investment capability predicated on global
reach, investment prowess and excellent
service. Since the appointment of our first
portfolio managers four years ago, we
have grown our footprint nationally to 23
portfolio managers and currently manage
over R10 billion in equities and R10 billion
in cash and structured investments on
behalf of our clients. None of this would
have been possible without having the
right people within our business and a
strong network of supporters.
On that note, I would like to sincerely
thank you for your support of our business.
I wish you and your loved ones a relaxed,
happy and safe festive season and trust
that the year ahead will be a prosperous
one for us all.
All the best,
Chris
4
5
CHARGING TOWARDS AN ELECTRIFIED FUTURE
ANDREW DITTBERNER – CHIEF INVESTMENT OFFICER
The automotive industry is in the midst of a major transition. Due to a fundamental shift in the way vehicle ownership is viewed, coupled with disruptive technology and the desire to clean up our act in order to clean up the environment, vehicle manufacturers are currently facing unprecedented challenges. Globally, and particularly in South Africa, owning an expensive German-engineered, petrol-guzzling vehicle has been seen as a status symbol. However, the advent of autonomous vehicles, ride-hailing and ride-sharing has changed this image somewhat. But just as the internal combustion engine (ICE) displaced horses as the means to propel vehicles in the late 1800s, the electric engine is set to be the largest disruptor in the automotive market 120 years later.
6
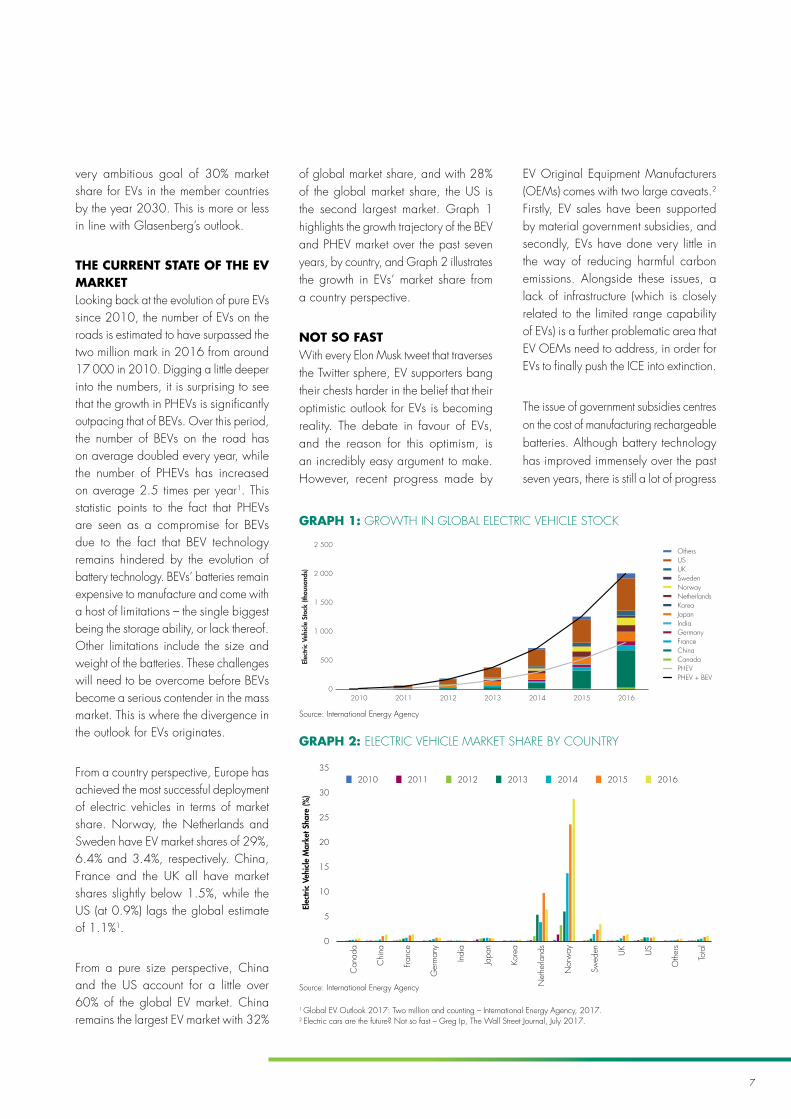
The onset of electric vehicles (EVs) has not happened overnight. Although their origins can be traced back long before the ICE, it was only in the 1960s (following the need for alternative-fuelled vehicles to reduce exhaust emissions from ICEs and to reduce the dependency on imported foreign crude oil) that ICE alternatives came back into vogue. The alternative to the ICE is the EV, which includes both pure EVs that rely on battery technology only, as well as hybrids, which make use of a combination of ICE and EV powertrains.
While hybrid vehicles have quietly been making their mark since the late 1990s, little headway had been made in the mainstream market with regard to pure EVs. It took Elon Musk’s purchase of Tesla stock, and his subsequent rise to top management in 2008, to put pure EVs squarely back onto the global map. Today, the various technologies that power engines can be divided into two separate categories – the well-established powertrains that require evolution in order to remain current; and the new up and
Powertrain Technology Abbreviation Description
Evolutionary
Internal Combustion Engine ICE
ICEs are engines which are typically powered by fossil fuel based products like petrol or diesel. Given the reliance on fossil fuels and the harmful emissions, ICEs use as the predominant powertrain technology is coming under pressure from electric vehicles. The origins of the ICE can be traced back to the mid–1800s.
Plug-In Hybrid Electric Vehicle PHEV
PHEVs are hybrid electric vehicles which combine an ICE with an electric motor and a rechargeable battery. The predominant powertrain technology is electric; however, the ICE works as a back-up when the battery is depleted. The battery is recharged through plugging it into an external power source.
Full Hybrid Electric Vehicles FHEV
FHEVs are hybrid electric vehicles that have the ability to combine the electric motor and the ICE to power the vehicle. The ICE also functions as an onboard generator by applying power to the rechargeable battery. The battery can also be recharged during braking through the conversion of energy into electricity.
Revolutionary
Battery Electric Vehicle BEVBEVs are vehicles that utilise energy stored in rechargeable batteries, and only make use of electric powertrain technology. The batteries are charged by plugging the vehicle into an external power source.
Fuel Cell Electric vehicle FCEVFCEVs are vehicles that use hydrogen gas to power the electric motor, as opposed to rechargeable batteries.
TABLE 1: THE VARIOUS POWERTRAIN TECHNOLOGIES
coming powertrain technologies that can only be described as revolutionary. These are outlined in the table below.
From the table, it is clear that the term ‘Electric Vehicle’ is used very loosely to refer to any vehicle that makes use of an electric engine, in some form or another. It is estimated that only one in twenty EVs make use of pure electrification for propulsion. For the purpose of this article, pure EVs include both Battery Electric Vehicles (BEVs) and Plug-In Hybrid Electric Vehicles (PHEVs).
ELECTRIC CARS ARE COMING, BUT WHEN?The outlook for EVs (as with the outlook for capital markets, geopolitics and populism) is extremely uncertain. Whether it is the opinion of the public or that of the experts, the division of opinions around the evolution of EVs and the pace of their adoption is clearly evident. Glencore CEO, Ivan Glasenberg, recently announced at the company’s interim results presentation that EVs would constitute
30% of global vehicle sales by 2030. Global research firm, UBS, is slightly less optimistic and predicts that EVs will make up 14% of global vehicle sales by 2025. To put these numbers into perspective, EVs currently make up only 1.1% of global vehicle sales.
What is not uncertain, however, is that EVs are coming and ICEs’ days are numbered - it just remains a question of when. This is evidenced by the growing list of countries that have committed to go electric -only by a specified date. These dates typically range from 2040 to 2050 and the list currently includes India, France, the UK and Norway. Further to this, the Electric Vehicle Initiative was established in 2009 with the purpose of bringing together representatives from member governments and partners bi-annually to share knowledge on policies and programmes that support EV development. Ten countries are currently members of this initiative, representing the vast majority of the global EV market. This initiative recently launched the EV30@30 campaign, which set the
7
1 Global EV Outlook 2017: Two million and counting – International Energy Agency, 2017.2 Electric cars are the future? Not so fast – Greg Ip, The Wall Street Journal, July 2017.
Source: International Energy Agency
Source: International Energy Agency
0
500
1 000
1 500
2 000
2 500
2010 2011 2012 2013 2014 2015 2016
Elec
tric
Veh
icle
Sto
ck (t
hous
ands
)
OthersUSUKSwedenNorwayNetherlandsKoreaJapanIndiaGermanyFranceChinaCanadaPHEVPHEV + BEV
0
5
10
15
20
25
30
35
Can
ada
Chi
na
Fran
ce
Ger
man
y
Indi
a
Japa
n
Kore
a
Net
herla
nds
Nor
way
Swed
en UK US
Oth
ers
Tota
l
Elec
tric
Veh
icle
Mar
ket S
hare
(%)
2010 2011 2012 2013 2014 2015 2016
GRAPH 2: ELECTRIC VEHICLE MARKET SHARE BY COUNTRY
GRAPH 1: GROWTH IN GLOBAL ELECTRIC VEHICLE STOCK
very ambitious goal of 30% market share for EVs in the member countries by the year 2030. This is more or less in line with Glasenberg’s outlook.
THE CURRENT STATE OF THE EV MARKETLooking back at the evolution of pure EVs since 2010, the number of EVs on the roads is estimated to have surpassed the two million mark in 2016 from around 17 000 in 2010. Digging a little deeper into the numbers, it is surprising to see that the growth in PHEVs is significantly outpacing that of BEVs. Over this period, the number of BEVs on the road has on average doubled every year, while the number of PHEVs has increased on average 2.5 times per year1. This statistic points to the fact that PHEVs are seen as a compromise for BEVs due to the fact that BEV technology remains hindered by the evolution of battery technology. BEVs’ batteries remain expensive to manufacture and come with a host of limitations – the single biggest being the storage ability, or lack thereof. Other limitations include the size and weight of the batteries. These challenges will need to be overcome before BEVs become a serious contender in the mass market. This is where the divergence in the outlook for EVs originates.
From a country perspective, Europe has achieved the most successful deployment of electric vehicles in terms of market share. Norway, the Netherlands and Sweden have EV market shares of 29%, 6.4% and 3.4%, respectively. China, France and the UK all have market shares slightly below 1.5%, while the US (at 0.9%) lags the global estimate of 1.1%1.
From a pure size perspective, China and the US account for a little over 60% of the global EV market. China remains the largest EV market with 32%
of global market share, and with 28% of the global market share, the US is the second largest market. Graph 1 highlights the growth trajectory of the BEV and PHEV market over the past seven years, by country, and Graph 2 illustrates the growth in EVs’ market share from a country perspective.
NOT SO FASTWith every Elon Musk tweet that traverses the Twitter sphere, EV supporters bang their chests harder in the belief that their optimistic outlook for EVs is becoming reality. The debate in favour of EVs, and the reason for this optimism, is an incredibly easy argument to make. However, recent progress made by
EV Original Equipment Manufacturers (OEMs) comes with two large caveats.2 Firstly, EV sales have been supported by material government subsidies, and secondly, EVs have done very little in the way of reducing harmful carbon emissions. Alongside these issues, a lack of infrastructure (which is closely related to the limited range capability of EVs) is a further problematic area that EV OEMs need to address, in order for EVs to finally push the ICE into extinction.
The issue of government subsidies centres on the cost of manufacturing rechargeable batteries. Although battery technology has improved immensely over the past seven years, there is still a lot of progress
8
CHARGING TOWARDS AN ELECTRIFIED FUTURE
Source: Thomas Covert, Michael Greenstone and Christopher R. Knittel, The Wall Street Journal
0
100
200
300
400
500
600
700
0 50 100 150 200 250 300 350 400 450
Cost of batteries in 2020(US$ per kilowatt-hour)
Oil
pric
e in
202
0(U
S$ p
er b
arre
l)
EVs are cheaper than ICEs
ICEs are cheaper than EVs
Latest oil price & estimated cost perkilowatt-hour of a battery
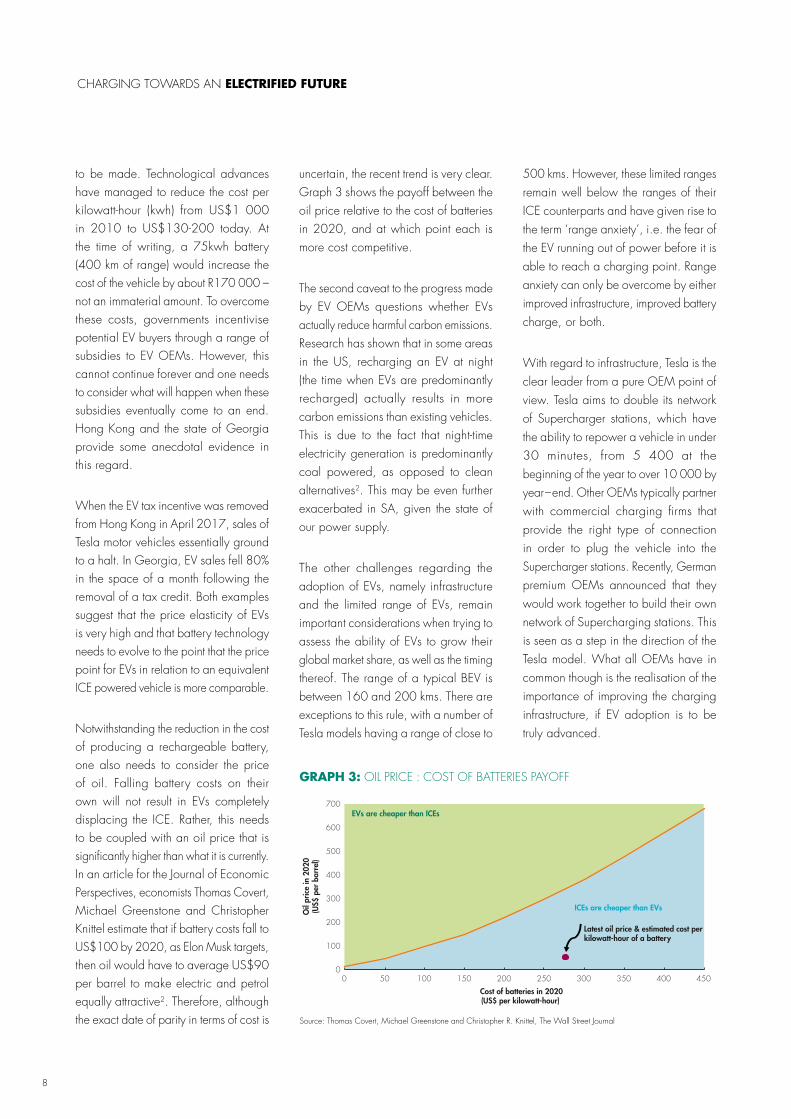
GRAPH 3: OIL PRICE : COST OF BATTERIES PAYOFF
to be made. Technological advances have managed to reduce the cost per kilowatt-hour (kwh) from US$1 000 in 2010 to US$130-200 today. At the time of writing, a 75kwh battery (400 km of range) would increase the cost of the vehicle by about R170 000 – not an immaterial amount. To overcome these costs, governments incentivise potential EV buyers through a range of subsidies to EV OEMs. However, this cannot continue forever and one needs to consider what will happen when these subsidies eventually come to an end. Hong Kong and the state of Georgia provide some anecdotal evidence in this regard.
When the EV tax incentive was removed from Hong Kong in April 2017, sales of Tesla motor vehicles essentially ground to a halt. In Georgia, EV sales fell 80% in the space of a month following the removal of a tax credit. Both examples suggest that the price elasticity of EVs is very high and that battery technology needs to evolve to the point that the price point for EVs in relation to an equivalent ICE powered vehicle is more comparable.
Notwithstanding the reduction in the cost of producing a rechargeable battery, one also needs to consider the price of oil. Falling battery costs on their own will not result in EVs completely displacing the ICE. Rather, this needs to be coupled with an oil price that is significantly higher than what it is currently. In an article for the Journal of Economic Perspectives, economists Thomas Covert, Michael Greenstone and Christopher Knittel estimate that if battery costs fall to US$100 by 2020, as Elon Musk targets, then oil would have to average US$90 per barrel to make electric and petrol equally attractive2. Therefore, although the exact date of parity in terms of cost is
uncertain, the recent trend is very clear. Graph 3 shows the payoff between the oil price relative to the cost of batteries in 2020, and at which point each is more cost competitive.
The second caveat to the progress made by EV OEMs questions whether EVs actually reduce harmful carbon emissions. Research has shown that in some areas in the US, recharging an EV at night (the time when EVs are predominantly recharged) actually results in more carbon emissions than existing vehicles. This is due to the fact that night-time electricity generation is predominantly coal powered, as opposed to clean alternatives2. This may be even further exacerbated in SA, given the state of our power supply.
The other challenges regarding the adoption of EVs, namely infrastructure and the limited range of EVs, remain important considerations when trying to assess the ability of EVs to grow their global market share, as well as the timing thereof. The range of a typical BEV is between 160 and 200 kms. There are exceptions to this rule, with a number of Tesla models having a range of close to
500 kms. However, these limited ranges remain well below the ranges of their ICE counterparts and have given rise to the term ‘range anxiety’, i.e. the fear of the EV running out of power before it is able to reach a charging point. Range anxiety can only be overcome by either improved infrastructure, improved battery charge, or both.
With regard to infrastructure, Tesla is the clear leader from a pure OEM point of view. Tesla aims to double its network of Supercharger stations, which have the ability to repower a vehicle in under 30 minutes, from 5 400 at the beginning of the year to over 10 000 by year–end. Other OEMs typically partner with commercial charging firms that provide the right type of connection in order to plug the vehicle into the Supercharger stations. Recently, German premium OEMs announced that they would work together to build their own network of Supercharging stations. This is seen as a step in the direction of the Tesla model. What all OEMs have in common though is the realisation of the importance of improving the charging infrastructure, if EV adoption is to be truly advanced.
9
Improving the length of time it takes to recharge a vehicle, as well as improving the battery charge in order to extend EVs’ range, are the final obstacles that need to be overcome in order for mass adoption of the EV. Both issues need to be tackled from a battery technology point of view, which goes back to the cost of producing the battery relative to the cost of using a fossil fuel based alternative. As a result, in its current form, the pure BEV is largely seen as a second vehicle reserved for the affluent, particularly when it comes to the upper-end Tesla.
SO WHAT’S THE ALTERNATIVE? In a survey of nearly 1 000 senior executives from the world’s leading automotive companies, the setting up of a user-friendly charging infrastructure was identified as the key issue. This resulted in 62% of the executives anticipating that BEVs will fail, as hard as that is to believe. In contrast, 78% believe Fuel Cell Electric Vehicles (FCEVs) will provide the golden bullet for the issues hampering BEVs3.
FCEVs are viewed as having the ability
to solve both the recharging and the
infrastructure issues that pure EVs face
today. The refuelling process could
potentially be done as quickly as
traditional refuelling, but just at hydrogen
stations which would replace today’s
petrol stations. However, this technology
remains in its infancy and would need to
overcome a number of its own obstacles.
These include the cooling of hydrogen
and the safe storage of it in a vehicle3.
KEY MARKET PLAYERS Tesla is synonymous with the EV market
and since its vehicles are typically quite
expensive, they are seen as more of a
second vehicle option (predominantly
used on weekends) for the affluent
market. But while Tesla most definitely
has the first mover advantage (along
with a leader who has successfully
positioned the brand), there are many
EV manufacturers that despite making
headway remain overlooked.
Other OEMs that have moved into the EV market include German luxury manufacturers BMW and Mercedes-Benz, as well as Toyota, Ford, Volkswagen, Mitsubishi, Chevrolet, Fiat, Citroen and Kia. The one thing that these OEMs have in common is that they have identified the threat of the EV and can use their deep pockets, engineering experience and massive distribution networks to challenge the incumbents. One such incumbent that is yet to get a mention is the true pioneer in the EV field, the Renault-Nissan Alliance. While Tesla may hog the media limelight, the Alliance holds the prize for the largest number of EVs sold4. In the first quarter of 2017, the Renault-Nissan Alliance sold nearly 37 000 EVs, with the Nissan Leaf maintaining the top spot for the world’s best-selling EV. Over the same period, Tesla managed to sell 25 000 EVs.
Another lesser-known player in the field is Chinese company BYD. Nine years ago, in the midst of the Global Financial Crisis, Warren Buffett took a bet on
3 Global Automotive Executive Survey – KPMG, 2017.4 Who is the world’s leading EV market? It’s not Tesla – Bertel Schmitt, Forbes, May 2017.
10
CHARGING TOWARDS AN ELECTRIFIED FUTURE
3 Global Automotive Executive Survey – KPMG, 2017.4 Who is the world’s leading EV market? It’s not Tesla – Bertel Schmitt, Forbes, May 2017.
the then struggling cellphone battery maker based in Shenzhen. Today, BYD is a leading EV manufacturer in China, selling more battery-only and hybrid EVs in China than anyone else. It is interesting to note that BYD is not betting the house on the EV market. The company derives only 20% of vehicle sales from EVs, with the rest coming from traditional fuel cars. Furthermore, vehicle sales account for only 55% of BYD's revenue as 38% stems from cellphone components.
THE INVESTMENT OPPORTUNITYPhasing out petrol-guzzling vehicles in favour of EVs has definitely begun to speed up over the last few years, as evidenced by a number of OEM manufacturers committing to phase out petrol/diesel-only vehicles by a specified
date. However, investors should treat the transition as a longer-term, global megatrend, as opposed to an overnight transition. Abandoning the ICE in favour of EVs will happen, but overcoming the shortcomings may result in the EV market attaining its goal over a much longer timeframe than originally anticipated. Opinions on this timing remain divided.
Much like trying to estimate exactly when EVs will overcome their shortcomings, estimating what the global EV total will be in 20 years is an equally inexact science. But what we do know is that a number of trends (urbanisation and industrialisation in emerging economies, changing demographics and consumer preferences, disruptive technologies, etc.) point to a rapidly growing global
vehicle pool. With the current global vehicle pool sitting at a little over one billion vehicles, estimates suggest that this number could double by 2035. Given this rapid growth, from an investment perspective, companies that are geared towards the automotive industry stand a good chance of benefiting from this trend.
At PCS, we invest in a number of such companies on behalf of our clients. A few examples include Glencore, Anglo American Platinum, Alphabet (Google) and Continental. Glencore is a large producer of copper, nickel and cobalt, all of which are critical elements in the manufacturing of EVs. Anglo American Platinum is the world’s largest primary producer of platinum.

11
While there are questions around the
relevance of platinum with the onset of
EVs, the mass adoption of EVs is still
many years, if not decades, away. As
a result, platinum and its derivatives
will remain critical in reducing carbon
emissions through their use in catalytic
converters as the global vehicle pool
grows. Alphabet is investing large
amounts of capital in the autonomous
vehicle market. And while Continental
is best known as a tyre producer,
it also produces technologically enhancing
products ranging from electric mobility
and automated driving components
to vehicle infotainment systems.
It would be remiss to talk about investment
opportunities without mentioning Tesla.
Today, Tesla is the world’s fourth largest
vehicle manufacturer as measured by
market capitalisation. Yet it is incredibly
tricky to match the company’s success from
a share price perspective with that of its
underlying fundamentals. In 2016, Tesla
sold only 76 230 vehicles and given its
inconsistent history of achieving sales
targets, along with a bottom line that is
perpetually in the red, Tesla is considered
a concept stock, i.e. a stock that is
invested in based on the concept rather
than the underlying fundamentals. This
is not to say that Tesla is not a valuable
company, it most definitely is and has
the potential to become more valuable
in time. The company clearly has superb
assets in the form of its infrastructure
and proprietary intellectual property
(battery technology). However, from
an investment and a risk management
perspective, we are more circumspect
when investing in such shares.
On the domestic front, the Pietermaritzburg-based aluminium manufacturing business Hulamin, is a small cap stock that plays a critical role in the production of Tesla motor vehicles. In 2010, before the world knew who Elon Musk was, the then little-known entrepreneur was trying to source speciality vehicle components for Tesla motor vehicles. Through the search Hulamin was approached to build one such component – the battery box base plate. Despite not being a game changer at the time, Hulamin agreed to produce the component and to this day, Hulamin remains the sole supplier of the component to Tesla. The only difference is that the outlook for Tesla has changed significantly. Hulamin remains in the small cap space, and as such sits outside of our investable universe. However, it is great to know that, alongside Elon Musk, another proudly South African component goes into making Tesla possible.
12
CONTINENTAL – BOARD THE POWERTRAIN INTO THE FUTURE
VICTOR MUPUNGA – RESEARCH ANALYST
Despite the rapid changes we have seen in the automotive industry over the last century, it’s fair to say that we are currently at the cusp of some fascinating, wide-ranging and transformative changes to the motor vehicle. Innovations such as alternative fuels, electric, driverless and connected vehicles are some of the changes we are seeing. In any industry that undergoes material change, there are winners and losers and we believe that Continental stands to benefit from the changes within the automotive industry.
13
GRAPH 1: CONTINENTAL’S OPERATING SEGMENT MARGINS
-40.0%
-30.0%
-20.0%
-10.0%
0.0%
10.0%
20.0%
30.0%
2007 2008 2009 2010 2011 2012 2013 2014 2015 2016
Chassis & Safety Powertrain Interior ContiTech Tyres
Source: Company reports
Continental’s history dates back to the 1870s when the company produced rubber products and tyres for carriages and bicycles. Since the group’s inception, acquiring rivals and being early to market with new products (such as tubeless tyres) have seen the group grow to become the world’s fourth largest tyre supplier. The diversification from being a pure tyre manufacturer occurred in 1995 when Continental established its Automotive division, selling various auto components. Subsequently, the automotive division’s product range and significance to Continental have grown extensively and it is now the second largest supplier of components to vehicle manufacturers across the world. The table on the next page details Continental’s two main divisions (Automotive and Rubber) and their five operating segments and some elements of their product offering.
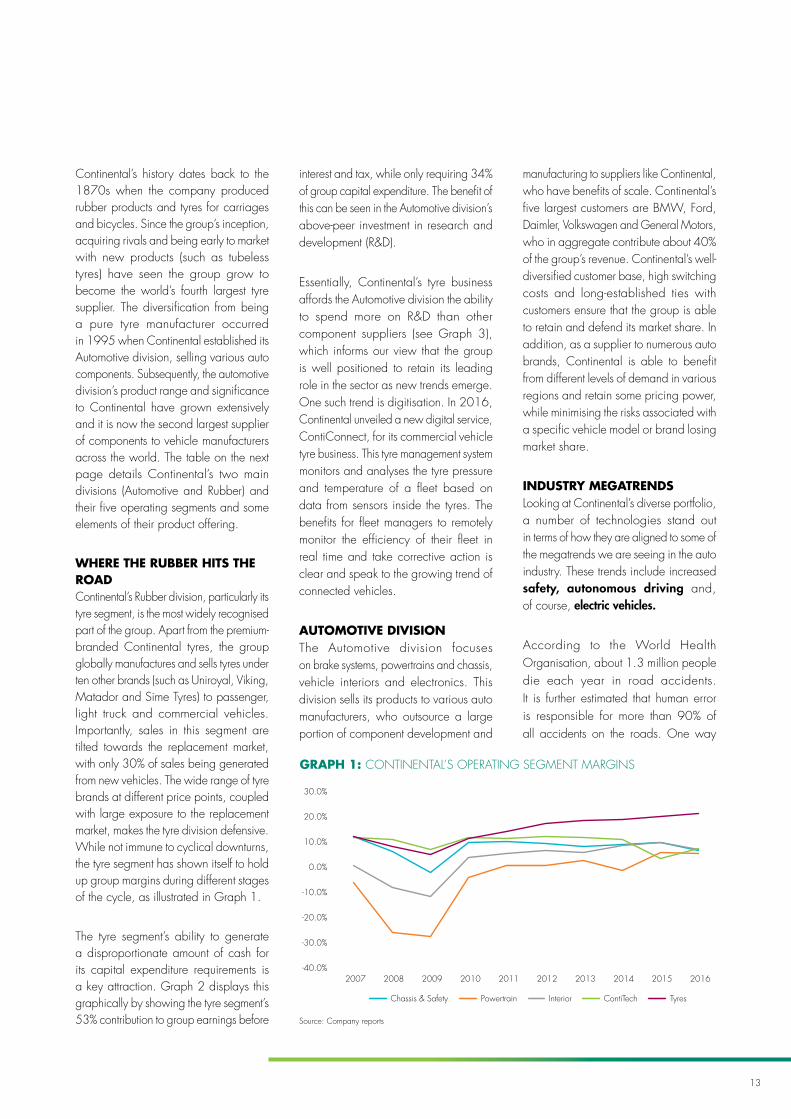
WHERE THE RUBBER HITS THE ROAD Continental’s Rubber division, particularly its tyre segment, is the most widely recognised part of the group. Apart from the premium-branded Continental tyres, the group globally manufactures and sells tyres under ten other brands (such as Uniroyal, Viking, Matador and Sime Tyres) to passenger, light truck and commercial vehicles. Importantly, sales in this segment are tilted towards the replacement market, with only 30% of sales being generated from new vehicles. The wide range of tyre brands at different price points, coupled with large exposure to the replacement market, makes the tyre division defensive. While not immune to cyclical downturns, the tyre segment has shown itself to hold up group margins during different stages of the cycle, as illustrated in Graph 1.
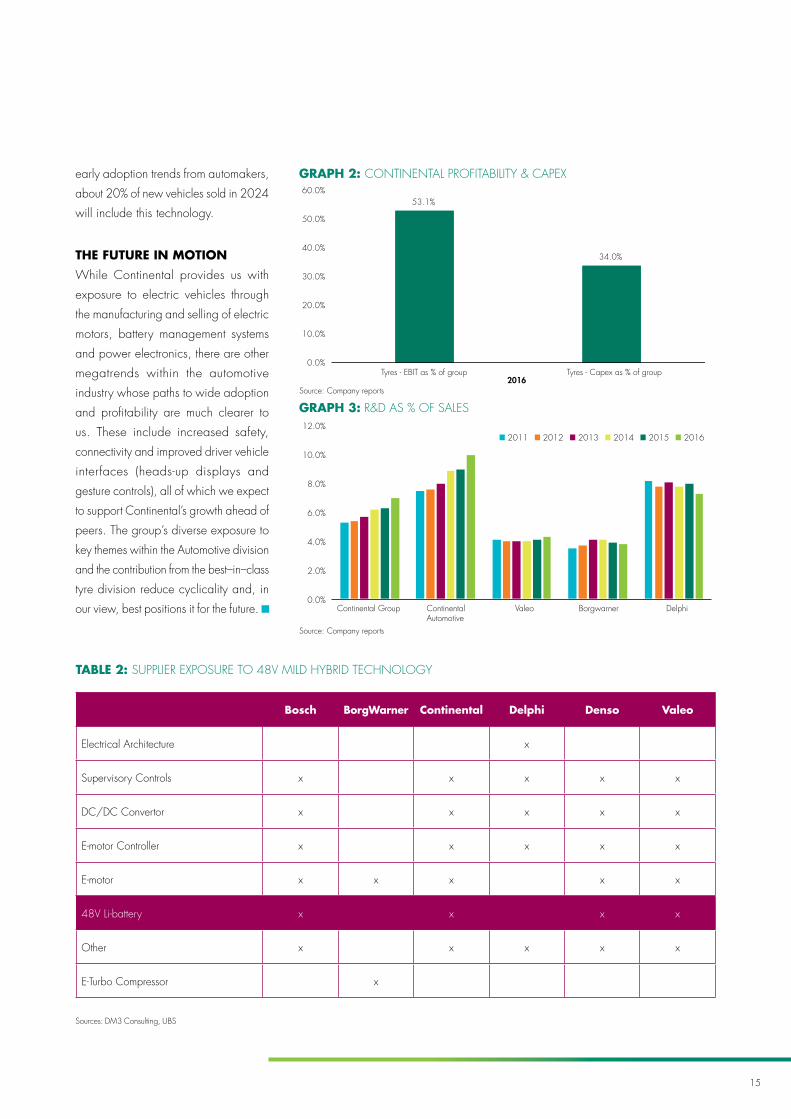
The tyre segment’s ability to generate a disproportionate amount of cash for its capital expenditure requirements is a key attraction. Graph 2 displays this graphically by showing the tyre segment’s 53% contribution to group earnings before
interest and tax, while only requiring 34% of group capital expenditure. The benefit of this can be seen in the Automotive division’s above-peer investment in research and development (R&D).
Essentially, Continental’s tyre business affords the Automotive division the ability to spend more on R&D than other component suppliers (see Graph 3), which informs our view that the group is well positioned to retain its leading role in the sector as new trends emerge. One such trend is digitisation. In 2016, Continental unveiled a new digital service, ContiConnect, for its commercial vehicle tyre business. This tyre management system monitors and analyses the tyre pressure and temperature of a fleet based on data from sensors inside the tyres. The benefits for fleet managers to remotely monitor the efficiency of their fleet in real time and take corrective action is clear and speak to the growing trend of connected vehicles.
AUTOMOTIVE DIVISIONThe Automotive division focuses on brake systems, powertrains and chassis, vehicle interiors and electronics. This division sells its products to various auto manufacturers, who outsource a large portion of component development and
manufacturing to suppliers like Continental, who have benefits of scale. Continental’s five largest customers are BMW, Ford, Daimler, Volkswagen and General Motors, who in aggregate contribute about 40% of the group’s revenue. Continental’s well-diversified customer base, high switching costs and long-established ties with customers ensure that the group is able to retain and defend its market share. In addition, as a supplier to numerous auto brands, Continental is able to benefit from different levels of demand in various regions and retain some pricing power, while minimising the risks associated with a specific vehicle model or brand losing market share.
INDUSTRY MEGATRENDSLooking at Continental’s diverse portfolio, a number of technologies stand out in terms of how they are aligned to some of the megatrends we are seeing in the auto industry. These trends include increased safety, autonomous driving and, of course, electric vehicles.
According to the World Health Organisation, about 1.3 million people die each year in road accidents. It is further estimated that human error is responsible for more than 90% of all accidents on the roads. One way

14
CONTINENTAL – BOARD THE POWERTRAIN INTO THE FUTURE
TABLE 1: CONTINENTAL'S VARIOUS SEGMENTS
Source: Company reports
FY2016 AUTOMOTIVE DIVISION RUBBER DIVISION
Segments Chassis & Safety Powertrain Interior Tyres ContiTech
% of sales 22.0% 18.0% 20.0% 26.0% 14.0%
Segment EBIT margin
6.6% 5.5% 7.8% 21.7% 9.7%
Product range examples
Advanced driver assistance systems
Diesel & petrol injection systems
Instrumentation & display solutions
Original & replacement tyres
Conveyor belts
Electronic brake systems
Electric motorsHuman machine
interfacesSummer & winter
tyresIndustrial & automotive
hoses
Airbag electronics
Battery management systems
Infotainment systemsHigh performance
tyresAutomotive interior
trim
Suspension systemTransmission control
unitsDevice connectivity
& telematicsAir springs for railways,
trucks & buses
to reduce road fatalities is to increase advanced driver assistance technology in vehicles, perhaps to the point of fully automated driving. In 2016, global sales of vehicle sensors, radars, LIDARS (i.e. light detection and ranging), cameras and software technology for assisting drivers exceeded US$16 billion. According to some estimates, this figure is expected to rise to US$66 billion over the next decade. Continental is well positioned for this opportunity by offering products ranging from radars for adaptive cruise control and sensors for blind spot detection to more complex technology, such as lane keep assistance and automated parking. As premium vehicles adopt more advanced technology like valet parking and traffic jam assist, and mass market models implement more elementary collision avoidance technology, growth for leading auto suppliers will be supported. Continental has the second most extensive range of advanced driver assistance systems in the industry (Valeo is first) and management is aiming to
double sales in this market to around US$2.3 billion by 2020.
THE ELECTRIC AVENUEWith the ever-increasing requirements for emission reductions, electric vehicles have gained traction over the last few years. Recent announcements from car manufacturers across the globe stating how soon they plan to roll out various models of electric vehicles have given an indication of the capital and focus being directed towards this technology. Despite this, the widespread adoption of electric vehicles and its timing remains uncertain, as discussed in the previous article on electric vehicles. What most observers seem to agree on, including ourselves, is that hybrids will be a big part of the solution to reducing emissions.
While vehicle component suppliers are investing in full electric vehicle solutions, their greatest focus has been on mild hybrids due to their favourable cost-to-
benefit ratio. The leading technology within this space is the 48V mild hybrid, which is essentially an internal combustion engine equipped with an electric motor and an additional lithium-ion battery that allows the engine to shut off and disconnect from the transmission during certain driving conditions. The financial attraction of the 48V mild hybrid is that it requires smaller batteries, reduces emissions by up to 20% at a cost that is approximately 40% less than full hybrids. From a compatibility perspective, it can be fitted with any engine type (petrol or diesel) and transmission (manual or automatic), which makes it appealing for vehicle makers. Continental is one of the leading suppliers that are best positioned to benefit from this trend, and the group’s ability to integrate the system into the architecture of any engine type and transmission is a competitive advantage. UBS Research estimates that over the next decade, 48V mild hybrid will be the fastest growing solution within vehicle powertrains and judging from
15
Bosch BorgWarner Continental Delphi Denso Valeo
Electrical Architecture x
Supervisory Controls x x x x x
DC/DC Convertor x x x x x
E-motor Controller x x x x x
E-motor x x x x x
48V Li-battery x x x x
Other x x x x x
E-Turbo Compressor x
TABLE 2: SUPPLIER EXPOSURE TO 48V MILD HYBRID TECHNOLOGY
Sources: DM3 Consulting, UBS
0.0%
2.0%
4.0%
6.0%
8.0%
10.0%
12.0%
Continental Group ContinentalAutomotive
Valeo Borgwarner Delphi
2011 2012 2013 2014 2015 2016
53.1%
34.0%
0.0%
10.0%
20.0%
30.0%
40.0%
50.0%
60.0%
Tyres - EBIT as % of group Tyres - Capex as % of group2016
Source: Company reports
Source: Company reports
GRAPH 2: CONTINENTAL PROFITABILITY & CAPEX
GRAPH 3: R&D AS % OF SALES
early adoption trends from automakers,
about 20% of new vehicles sold in 2024
will include this technology.
THE FUTURE IN MOTION
While Continental provides us with
exposure to electric vehicles through
the manufacturing and selling of electric
motors, battery management systems
and power electronics, there are other
megatrends within the automotive
industry whose paths to wide adoption
and profitability are much clearer to
us. These include increased safety,
connectivity and improved driver vehicle
interfaces (heads-up displays and
gesture controls), all of which we expect
to support Continental’s growth ahead of
peers. The group’s diverse exposure to
key themes within the Automotive division
and the contribution from the best–in–class
tyre division reduce cyclicality and, in
our view, best positions it for the future.

16
17
GLENCORE – BETTING ON A SUSTAINABLE FUTURE
SAMEER SINGH – RESEARCH ANALYST
Glencore, the mining and trading company formerly known as Marc Rich & Co. AG, is fairly young as far as mining companies go. Established in 1974 by notorious businessman and deal-maker Marc Rich, the company maintains roots in the trading of ferrous and non-ferrous metals and minerals as well as crude oil.
18
Over the course of almost 45 years,
Glencore has grown to become the
world’s third largest commodity miner and
second largest commodities trader. With
operations spanning over 50 countries
and 155 000 employees, this is a
company that has geographic reach
and, importantly, for a large diversified
miner, significant scale and scope. It is this
combination of scale and scope that has
allowed Glencore to carve out meaningful
exposures to a mix of mid- and late-cycle
commodities, i.e. commodities where
demand is expected to peak as economies
evolve from low-income economies
to mid- to high-income economies1.
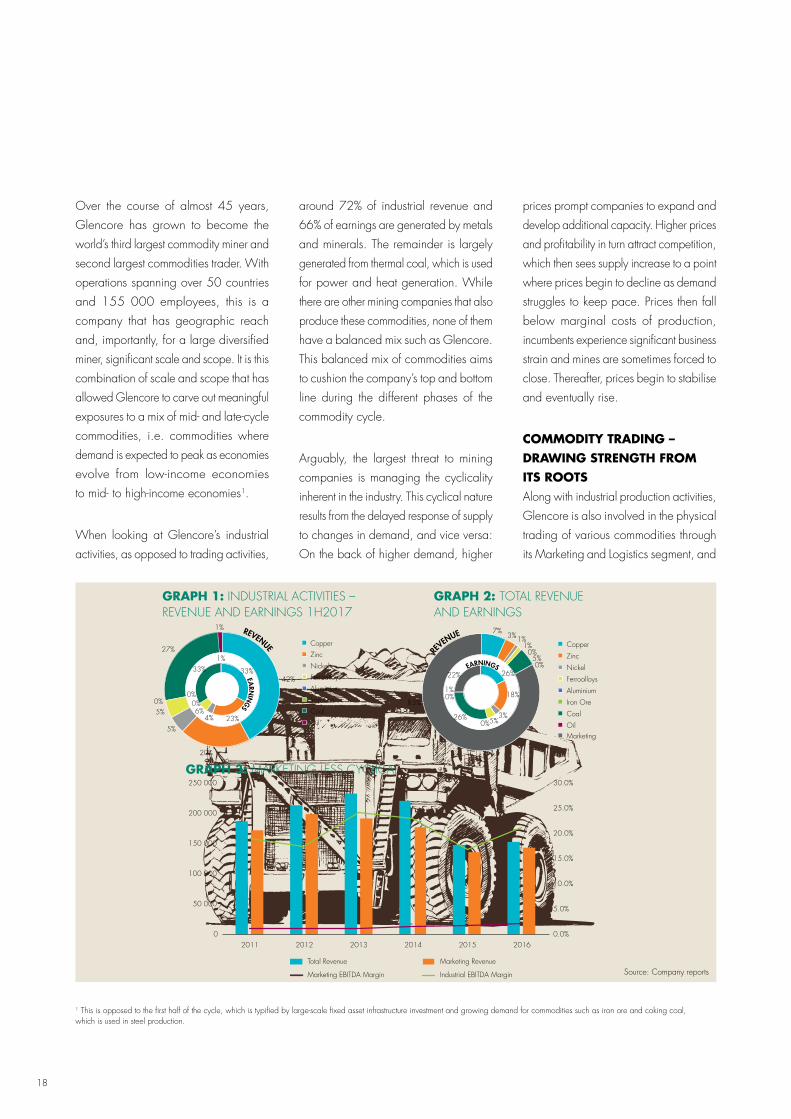
When looking at Glencore’s industrial
activities, as opposed to trading activities,
around 72% of industrial revenue and
66% of earnings are generated by metals
and minerals. The remainder is largely
generated from thermal coal, which is used
for power and heat generation. While
there are other mining companies that also
produce these commodities, none of them
have a balanced mix such as Glencore.
This balanced mix of commodities aims
to cushion the company’s top and bottom
line during the different phases of the
commodity cycle.
Arguably, the largest threat to mining
companies is managing the cyclicality
inherent in the industry. This cyclical nature
results from the delayed response of supply
to changes in demand, and vice versa:
On the back of higher demand, higher
prices prompt companies to expand and
develop additional capacity. Higher prices
and profitability in turn attract competition,
which then sees supply increase to a point
where prices begin to decline as demand
struggles to keep pace. Prices then fall
below marginal costs of production,
incumbents experience significant business
strain and mines are sometimes forced to
close. Thereafter, prices begin to stabilise
and eventually rise.
COMMODITY TRADING – DRAWING STRENGTH FROM ITS ROOTS Along with industrial production activities,
Glencore is also involved in the physical
trading of various commodities through
its Marketing and Logistics segment, and
Copper
Zinc
Nickel
Ferroalloys
Aluminium
Iron Ore
Coal
Oil
Copper
Zinc
Nickel
Ferroalloys
Aluminium
Iron Ore
Coal
Oil
42%
20%
5%
0%
27%
1%
26%
18%
3%5%0%
0%
26%
1%
22%
7%3%1%
1%0%
5%0%
83%
Marketing
5%
33%
23%4%6%
0%0%
33%1%
Copper
Zinc
Nickel
Ferroalloys
Aluminium
Iron Ore
Coal
Oil
Copper
Zinc
Nickel
Ferroalloys
Aluminium
Iron Ore
Coal
Oil
42%
20%
5%
0%
27%
1%
26%
18%
3%5%0%
0%
26%
1%
22%
7%3%1%
1%0%
5%0%
83%
Marketing
5%
33%
23%4%6%
0%0%
33%1%
GRAPH 1: INDUSTRIAL ACTIVITIES – REVENUE AND EARNINGS 1H2017
GRAPH 2: TOTAL REVENUE AND EARNINGS
0.0%
5.0%
10.0%
15.0%
20.0%
25.0%
30.0%
0
50 000
100 000
150 000
200 000
250 000
2011 2012 2013 2014 2015 2016
Total Revenue Marketing Revenue
Marketing EBITDA Margin Industrial EBITDA Margin
GRAPH 3: MARKETING LESS CYCLICAL
1 This is opposed to the first half of the cycle, which is typified by large-scale fixed asset infrastructure investment and growing demand for commodities such as iron ore and coking coal, which is used in steel production.
REVENUE
RE
VENUE
EARN
INGS
EARNINGS
Source: Company reports
19
0.0
0.1
0.2
0.3
0.4
0.5
0.6
0.7
0.8
0.9
1.0
GLEN Peer 1 Peer 2 Peer 3 Peer 4
Early cycle Mid cycle Late cycle
Cop
per,
Zinc
, Nic
kel,
Alu
min
ium
, Le
ad
Iron
Ore
, Cok
ing
coal
,M
anga
nese
Cob
alt,
Oil/
Gas
, PG
Ms,
Dia
mon
ds,
Ther
mal
Coa
l,A
gric
ultu
ral p
rodu
cts
Com
mod
ities
wei
ghte
d by
con
tribu
tion
to 2
018F
EBI
TDA
0
20
40
60
80
100
0 5 10 15 20 25 30 35 40 45 50
Early cycle Mid cycle Late cycle
$US GDP per capita (2010)
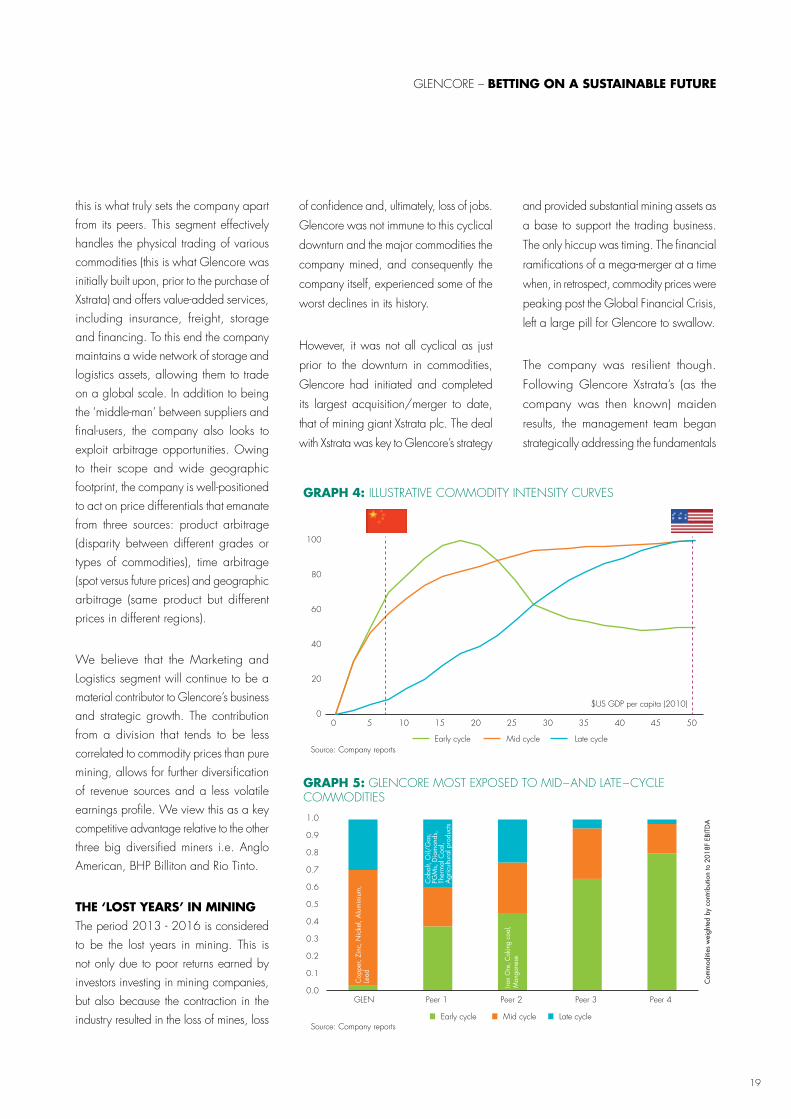
GRAPH 4: ILLUSTRATIVE COMMODITY INTENSITY CURVES
GRAPH 5: GLENCORE MOST EXPOSED TO MID–AND LATE–CYCLE COMMODITIES
this is what truly sets the company apart from its peers. This segment effectively handles the physical trading of various commodities (this is what Glencore was initially built upon, prior to the purchase of Xstrata) and offers value-added services, including insurance, freight, storage and financing. To this end the company maintains a wide network of storage and logistics assets, allowing them to trade on a global scale. In addition to being the ‘middle-man’ between suppliers and final-users, the company also looks to exploit arbitrage opportunities. Owing to their scope and wide geographic footprint, the company is well-positioned to act on price differentials that emanate from three sources: product arbitrage (disparity between different grades or types of commodities), time arbitrage (spot versus future prices) and geographic arbitrage (same product but different prices in different regions).
We believe that the Marketing and Logistics segment will continue to be a material contributor to Glencore’s business and strategic growth. The contribution from a division that tends to be less correlated to commodity prices than pure mining, allows for further diversification of revenue sources and a less volatile earnings profile. We view this as a key competitive advantage relative to the other three big diversified miners i.e. Anglo American, BHP Billiton and Rio Tinto.
THE ‘LOST YEARS’ IN MININGThe period 2013 - 2016 is considered to be the lost years in mining. This is not only due to poor returns earned by investors investing in mining companies, but also because the contraction in the industry resulted in the loss of mines, loss
of confidence and, ultimately, loss of jobs.
Glencore was not immune to this cyclical
downturn and the major commodities the
company mined, and consequently the
company itself, experienced some of the
worst declines in its history.
However, it was not all cyclical as just
prior to the downturn in commodities,
Glencore had initiated and completed
its largest acquisition/merger to date,
that of mining giant Xstrata plc. The deal
with Xstrata was key to Glencore’s strategy
and provided substantial mining assets as
a base to support the trading business.
The only hiccup was timing. The financial
ramifications of a mega-merger at a time
when, in retrospect, commodity prices were
peaking post the Global Financial Crisis,
left a large pill for Glencore to swallow.
The company was resilient though.
Following Glencore Xstrata’s (as the
company was then known) maiden
results, the management team began
strategically addressing the fundamentals
GLENCORE – BETTING ON A SUSTAINABLE FUTURE
Source: Company reports
Source: Company reports
20
GLENCORE – BETTING ON A SUSTAINABLE FUTURE
of the business. Cash generation was prioritised, debt levels were being managed lower and profitability started to improve. 2015 saw management embark on a restructuring and recapitalisation exercise that involved a US$2.5 billion share placement, asset divestments totalling US$6.3 billion, the reduction in and suspension of inefficient mining assets, the suspension of dividend payments, refinancing of existing credit facilities and new debt issuances at more favourable interest rates. These efforts resulted in a total debt reduction of US$20 billion. The result of improved operational efficiencies, combined with recovering commodity prices, has seen Glencore’s share price rising over 200% since the beginning of 2016. Furthermore, in early 2017, the company reinstated its dividend and guided that the new policy will be to pay a fixed US$1 billion dividend (linked to the more stable cash flows from the Marketing division) and will incorporate a variable component of a minimum of 25% of industrial activities free cash flow.
SUSTAINABLE CONSUMPTIONThere are two key structural shifts emanating at present, namely the ‘digitalisation’ of the world and the promotion of more sustainable living. The latter, which refers to the need for renewable energy and sustainable agriculture, provides a tailwind for Glencore.
Glencore’s key commodities (copper, zinc, nickel, aluminium, cobalt, oil/gas, thermal coal and agricultural products) are all linked to mid- and late-cycle growth in commodities. As societies grow and mature, so too does the demand for these commodities. More specifically, the
advent of electric and hybrid vehicles has
garnered the most attention over the past
few years and Glencore is well-positioned
to contribute to this shift. Nickel, cobalt and
copper are key inputs into the manufacture
of batteries and it is estimated that the
average nickel manganese cobalt oxide
(NMC) battery uses 40-50kgs of nickel,
50-75kgs of copper and 5-15kgs of cobalt.
But it doesn’t end with electric vehicles as
the great push to sustainable living requires
more efficient and cost-effective means of
storing energy. Large scale battery farms
will be required to house and store wind
and solar energy for use at night and
during wind-free days.
Not only will society need to consume
energy more sustainably, we will also need
to find more sustainable ways of feeding
the global population. Glencore has long
maintained exposure to the agricultural
market (around 10% of marketing revenue
over the past five years). Building on
this earlier in the year, the company
showed their strongest intent yet to grow
in this market after approaching Bunge for
a potential business combination.
SETTING THE DEALS IN MOTIONBunge is a full supply chain agri-food
business incorporating operations that
span farm to consumer foods, across
more than 40 countries. A tie-up with
Bunge would provide Glencore with an
opportunity for consolidation with its existing
agri-business. Additionally, with agriculture
margins and share prices depressed, this
would appear an opportune time in the
cycle. Also supporting the rationale is
Glencore’s stronger financial position and
cash generation.
A deal with Bunge, or another large-scale agricultural business, highlights the potential benefits of scale and scope when considering managing the value chain. Glencore’s strategy to grow its logistics is supported by its ownership and interest in mining and agricultural assets. The more commodities they mine and/or control, the more they can pass on to their marketing/logistics business, providing increasing opportunities for margin growth. Glencore is playing the volume game, but not in the traditional ‘mine more and pay less per unit’ way. Instead, the company is adopting a ‘control and market more’ approach, thereby leveraging logistics to increase earnings.
MINING THE FUTUREGoing forward, society will increasingly place priority on green, sustainable energy and consumption solutions versus the unsustainable status quo. We believe that this structural shift, together with balanced commodity and trading exposures, a diversified resource mix, and structural-growth linked commodities, give Glencore a substantial competitive advantage relative to peers. Combining the above with an adept and invested management team and sound financial management will allow Glencore to sustainably maintain its competitive advantage well into the future.

22
23
The recent news that the 30–year–old wife of late multi-millionaire Playboy founder Hugh Hefner (91) is set to inherit nothing from his estimated US$43 million estate, due to a watertight prenuptial contract, has raised a number of questions around the legal standing of a prenuptial agreement after the death of a spouse and the importance of having a sound and an up-to-date will.
Given the rising rate of divorce and the increasing prevalence of blended families in South Africa, good estate planning can help ease the burden placed on loved ones left behind after the death of a bread winner. This is particularly important in cases where individuals – especially ultra-high-net-worth individuals – have multiple ex-partners and children from previous relationships, as an unclear will can result in years of fighting around how an estate should be divided up among different families and spouses. This often results in the interpretation of an unclear or a badly drafted will having to be settled in court, which can be costly in itself.
WILL VALIDITY & MAINTENANCE CLAIMS The validity of a will is also of utmost importance when it comes to the winding up of an estate. In South Africa, the Wills Act stipulates that, in order to be legally binding, a will must be valid and lawful, which means a number of requirements must be adhered to. This includes the will being signed in the presence of two witnesses, with the testator/testatrix’s signature appearing on each individual page. If a will is deemed invalid, the estate will be distributed according to the Intestate Succession Act.
FIDUCIARY LESSONS TO BE LEARNED FROM THE PASSING OF
HUGH HEFNERALIDA BRINK – FIDUCIARY SPECIALIST
Regarding the allegations around Hefner’s wife being left out of the will due to an 'ironclad' prenuptial agreement, depending on the circumstances, South African law may circumvent this. Under South African law, in terms of the Maintenance Act (No. 99 of 1998), if the surviving spouse was financially dependent on the deceased spouse and is unable to provide for him– or herself, the surviving spouse is permitted to claim maintenance in order to continue maintaining the living standards he or she has become accustomed to. The financial position of the estate in providing for the claim will also be considered. The court will then work out how much maintenance the surviving spouse would need over his or her life expectancy.
If, however, the surviving spouse is not destitute and was not dependent on the deceased, then the claim might not be successful. In the case of Friedrich and Others v Smit NO and Others [2017] ZASCA 19; 2017 (4) SA 144 (SCA), the claimant instituted a maintenance claim against her late husband’s estate as his will stipulated all inheritance was to be left to his surviving children from his previous marriage. The claimant was unsuccessful in this case as the court found that she did not meet the requirement of being financially dependent on the deceased and was able to look after herself. Hypothetically speaking, if Hefner and his wife were South Africans, considering that Hefner gave his wife US$5 million and an apartment before his passing, she would probably also not have succeeded with a maintenance claim in terms of the Maintenance of Surviving Spouses Act.
ESTATE PLANNING FOR BLENDED FAMILIESIt could also happen that a spouse sets up a trust to take care of the surviving spouse and that upon the death of the surviving spouse, the children from the first marriage will inherit. This is often done to avoid the second spouse’s children (who are not the children of the deceased) from inheriting anything from the deceased later.
The problems that commonly occur in the case of estate planning for blended families are as a result of competing interests between children from previous marriages and spouses. Often these situations can become extremely tumultuous and cause untold strain on all parties involved. However, this can all be avoided with proper estate planning and a well-drafted will.
To conclude, the most important thing to remember is to update your will as soon as any circumstances change, to ensure that it reflects your current reality. Remember that your most recent, valid will, will become applicable upon your passing, even if it was drafted 25 years ago. It is also important that the stipulations in your will are practical and executionable. An example would be where cash is left to someone, but there is no liquidity in the estate. As such, we advise you to be proactive when it comes to estate planning and seek the necessary professional help in order to do so.
24
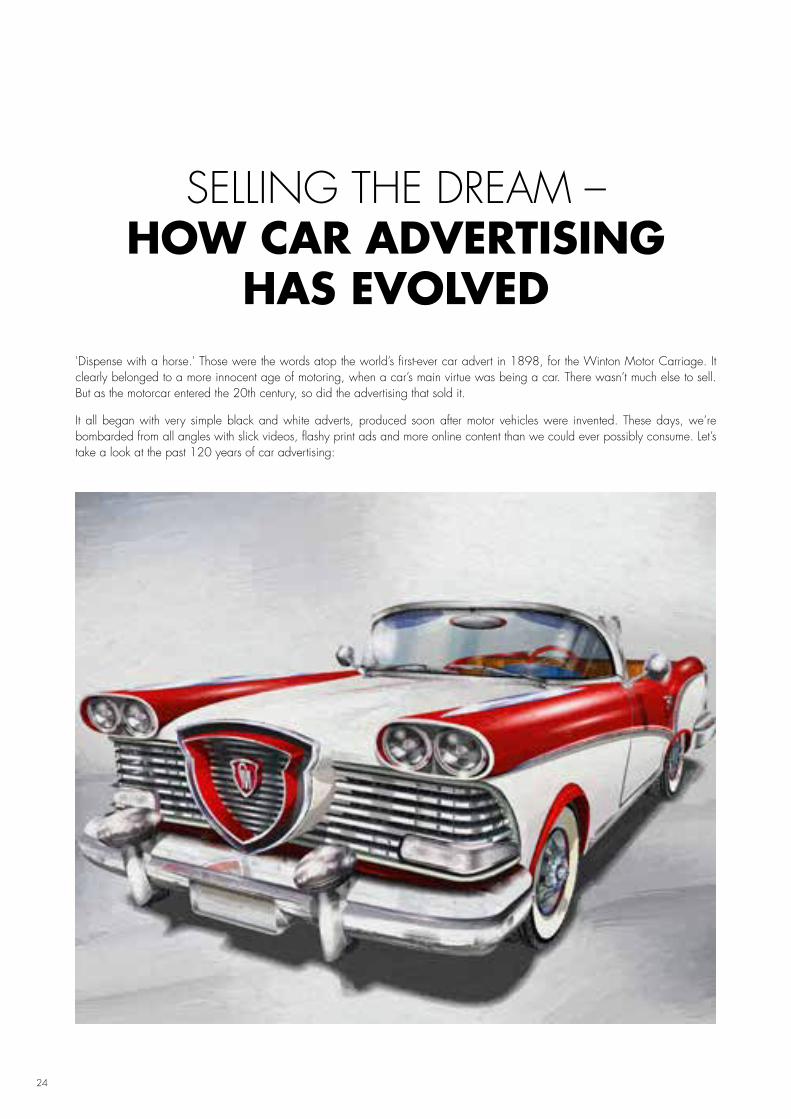
'Dispense with a horse.' Those were the words atop the world’s first-ever car advert in 1898, for the Winton Motor Carriage. It clearly belonged to a more innocent age of motoring, when a car’s main virtue was being a car. There wasn’t much else to sell. But as the motorcar entered the 20th century, so did the advertising that sold it.
It all began with very simple black and white adverts, produced soon after motor vehicles were invented. These days, we’re bombarded from all angles with slick videos, flashy print ads and more online content than we could ever possibly consume. Let’s take a look at the past 120 years of car advertising:
SELLING THE DREAM – HOW CAR ADVERTISING
HAS EVOLVED
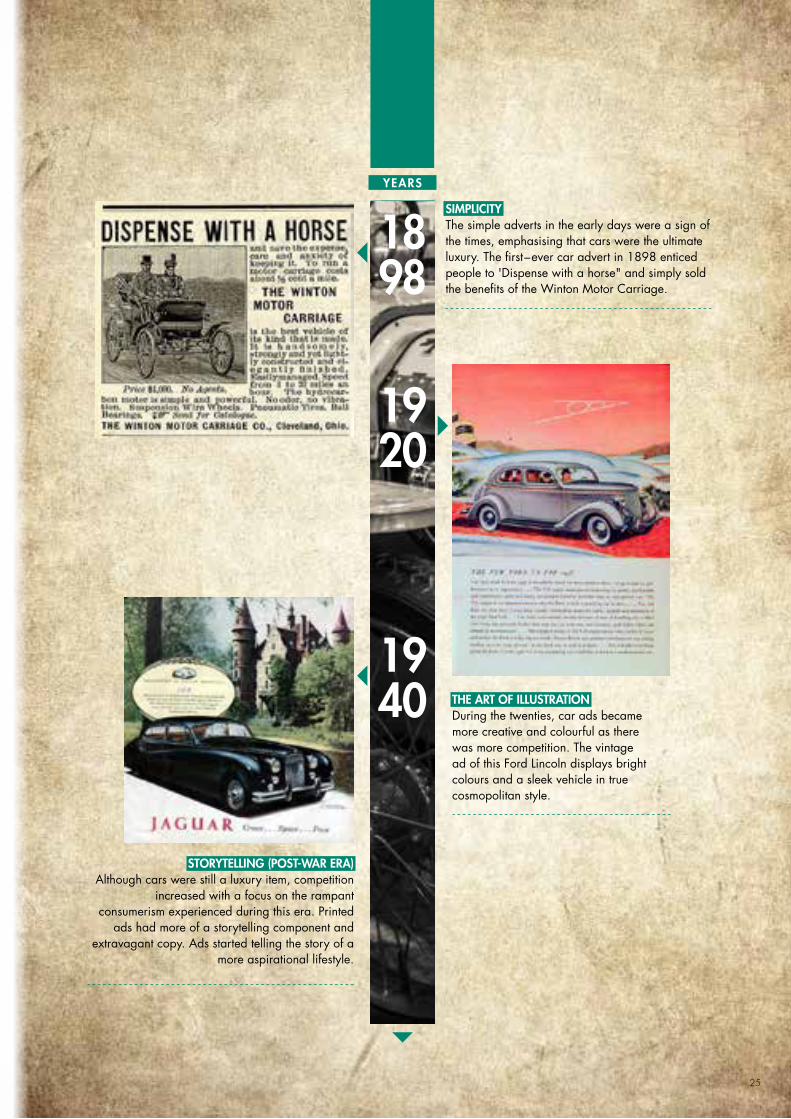
YEARS
SIMPLICITYThe simple adverts in the early days were a sign of the times, emphasising that cars were the ultimate luxury. The first–ever car advert in 1898 enticed people to 'Dispense with a horse" and simply sold the benefits of the Winton Motor Carriage.
1898
1940
1920
THE ART OF ILLUSTRATIONDuring the twenties, car ads became more creative and colourful as there was more competition. The vintage ad of this Ford Lincoln displays bright colours and a sleek vehicle in true cosmopolitan style.
STORYTELLING (POST-WAR ERA)Although cars were still a luxury item, competition
increased with a focus on the rampant consumerism experienced during this era. Printed
ads had more of a storytelling component and extravagant copy. Ads started telling the story of a
more aspirational lifestyle.
25
26
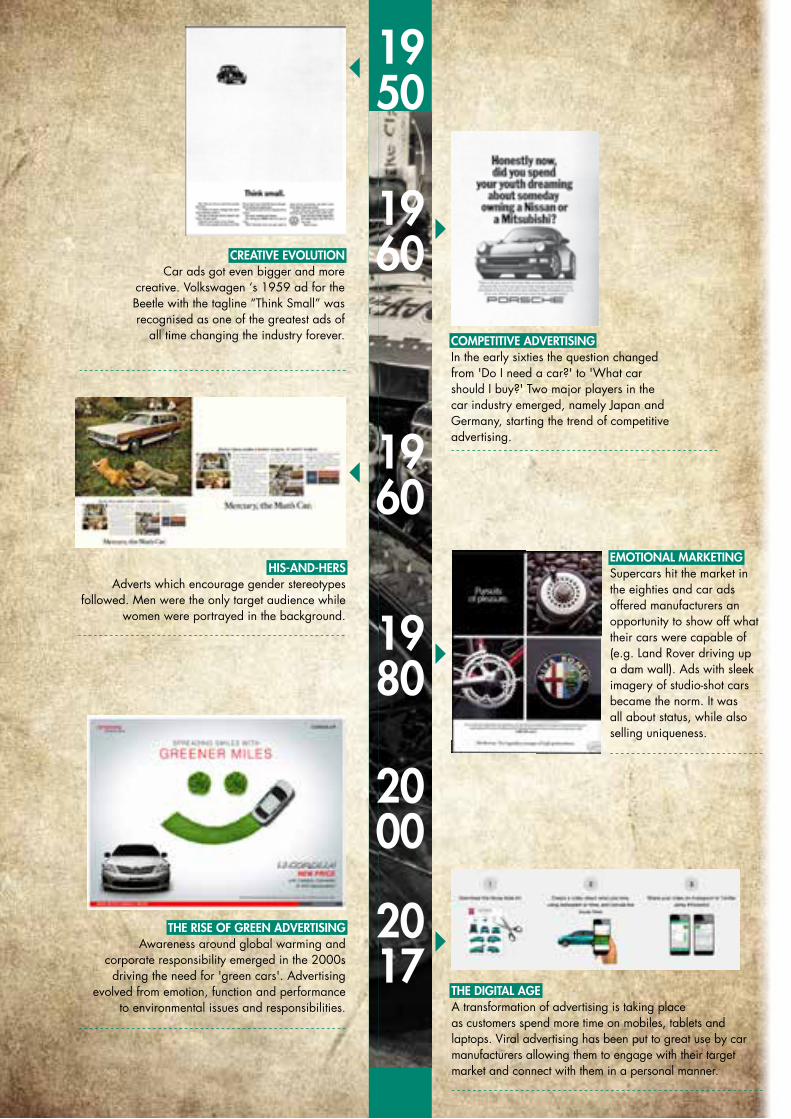
CREATIVE EVOLUTIONCar ads got even bigger and more
creative. Volkswagen ‘s 1959 ad for the Beetle with the tagline “Think Small” was recognised as one of the greatest ads of
all time changing the industry forever. COMPETITIVE ADVERTISING In the early sixties the question changed from 'Do I need a car?' to 'What car should I buy?' Two major players in the car industry emerged, namely Japan and Germany, starting the trend of competitive advertising.
1950
1960
1960
1980
2000
2017
HIS-AND-HERS Adverts which encourage gender stereotypes
followed. Men were the only target audience while women were portrayed in the background.
EMOTIONAL MARKETING Supercars hit the market in the eighties and car ads offered manufacturers an opportunity to show off what their cars were capable of (e.g. Land Rover driving up a dam wall). Ads with sleek imagery of studio-shot cars became the norm. It was all about status, while also selling uniqueness.
THE RISE OF GREEN ADVERTISING Awareness around global warming and
corporate responsibility emerged in the 2000s driving the need for 'green cars'. Advertising
evolved from emotion, function and performance to environmental issues and responsibilities.
THE DIGITAL AGEA transformation of advertising is taking place as customers spend more time on mobiles, tablets and laptops. Viral advertising has been put to great use by car manufacturers allowing them to engage with their target market and connect with them in a personal manner.
27
DEREK ALTONTel: 021 524 4566Cell: 072 290 [email protected]
SHANE LAWRENCETel: 021 524 4656 Cell: 079 526 [email protected]
PAUL STEVENTel: 021 524 4572Cell: 076 719 [email protected]
JOHANN VAN ZYLTel: 021 524 4574Cell: 083 261 [email protected]
MICHELLE MATTHEWSTel: 021 524 4421Cell: 083 979 [email protected]
DEAN GINSBERGTel: 011 245 3818Cell: 083 650 [email protected]
VISHAL HURRICHUNDTel: 011 245 3812Cell: 082 411 [email protected]
TREVOR O’CALLAGHANTel: 011 245 3801Cell: 083 660 [email protected]
MIKE SITHOLETel: 011 245 3741Cell: 083 352 [email protected]
GARY SMITHTel: 011 245 3802Cell: 082 464 [email protected]
ROY TOPOLTel: 011 245 3619Cell: 082 809 [email protected]
HELMAR BREYTENBACHTel: 031 581 0773Cell: 082 564 [email protected]
BRIAN VERMEULENCell: 083 408 [email protected]
LOUIS FOURIETel: 012 369 7232Cell: 083 391 [email protected]
GREGORY POTGIETERTel: 012 369 7234Cell: 082 823 [email protected]
JACQUES THERON Tel: 012 369 7235Cell: 082 495 [email protected]
JAMES BUZZARDTel: 031 581 0763Cell: 083 509 [email protected]
SCOTT LOGAN Tel: 031 581 0768Cell: 082 908 [email protected]
PRIVATE CLIENT PORTFOLIO MANAGERS
CHRIS POTGIETERHead of PCSTel: 021 524 4582Cell: 082 827 [email protected]
ANDREW DITTBERNERChief Investment OfficerTel: 021 524 4867 (CPT) 011 217 1945 (JHB)Cell: 083 296 [email protected]
VICTOR MUPUNGAResearch AnalystTel: 021 524 4466Cell: 072 838 [email protected]
MOOSA HASSIMInvestment Analyst Tel: 021 524 4609Cell: 072 448 [email protected]
SAMEER SINGHResearch AnalystTel: 021 524 4529Cell: 072 383 [email protected]
CONTACT US
CAPE TOWN
JOHANNESBURG
PRETORIA
DURBAN
BLOEMFONTEIN
28
This document is for information purposes only and does not constitute financial advice in any way or form. It is important to consult a financial planner to receive financial advice before acting on any information contained herein. Old Mutual Wealth and its directors, officers and employees shall not be responsible and disclaim all liability for any loss, damage (whether direct, indirect, special or consequential) and/or expense of any nature whatsoever, which may be suffered as a result of or which may be attributable, directly or indirectly, to the use of, or reliance upon any information contained in this document.
Old Mutual Wealth Private Client Securities (“PCS”) is a division of Old Mutual Wealth Trust Company (Pty) Ltd (“OMWTC”), an authorised Financial Services Provider, Reg No: 1925/002721/07. PCS is authorised to provide financial services on the OMWTC licence.
The Estuaries, 2 Oxbow Crescent, Century City 7441. Tel: +27 (0)21 524 4400, Fax: +27 (0)21 441 1060, Email: [email protected], Website: www.omwealth.co.za.