Embed Size (px)
Citation preview
© 2012 IBM Corporation
Cognos Visualization Workshop

© 2012 IBM Corporation 2
Agenda 8:45 – Introductions 9:00 – Discussion on Visualization 9:30 – Cognos Hands-On Lab 1 10:15 – Break 10:25 – Cognos Hands-On Lab 2 and 3 11:50 – Wrap-Up & Dismissal
© 2012 IBM Corporation 3
Introductions
Name Company Interaction with Cognos and Visualization background
© 2012 IBM Corporation 4
What is Visualization?
• The ability to create a visual display of structured and unstructured data
• Visualization creates encoding of data into visual channels that people can view and understand

© 2012 IBM Corporation 5
Why use Visualization? Science.
• The human brain’s short term memory is capable of
processing 3-7 items in place simultaneously
• “The human visual system is by far the richest, most immediate, highest bandwidth pipeline into the human mind. The amount of brain capacity that is devoted to processing visual input far exceeds that of the other human senses.”
– Alan Keahey
© 2012 IBM Corporation 6
What does all this mean?
A Picture is worth
a Thousand Words
© 2012 IBM Corporation 7
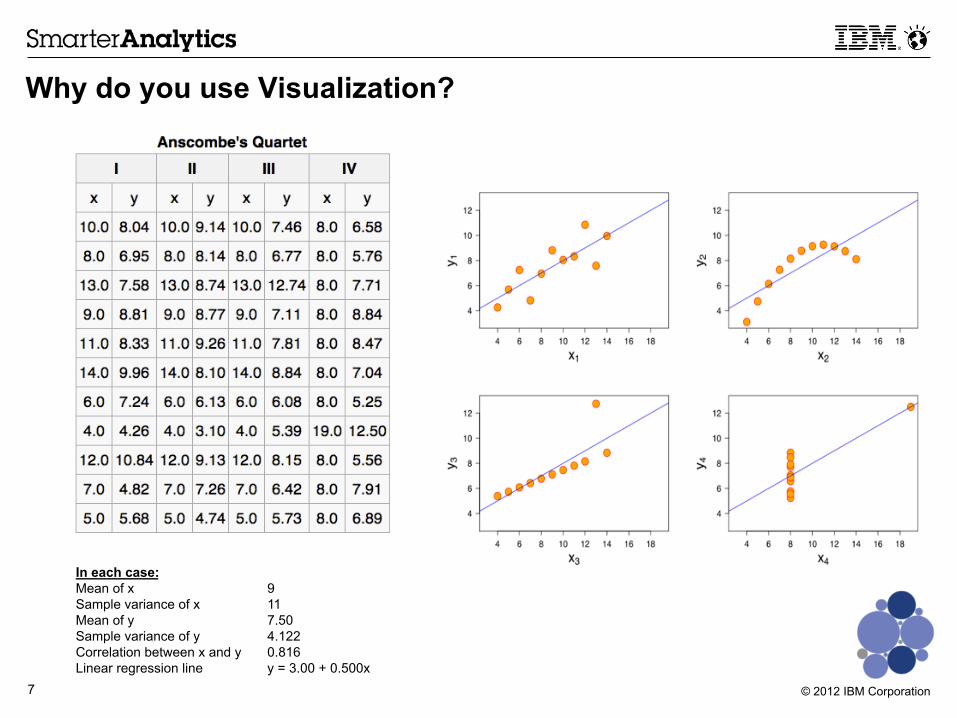
Why do you use Visualization?
In each case: Mean of x 9 Sample variance of x 11 Mean of y 7.50 Sample variance of y 4.122 Correlation between x and y 0.816 Linear regression line y = 3.00 + 0.500x
© 2012 IBM Corporation 8
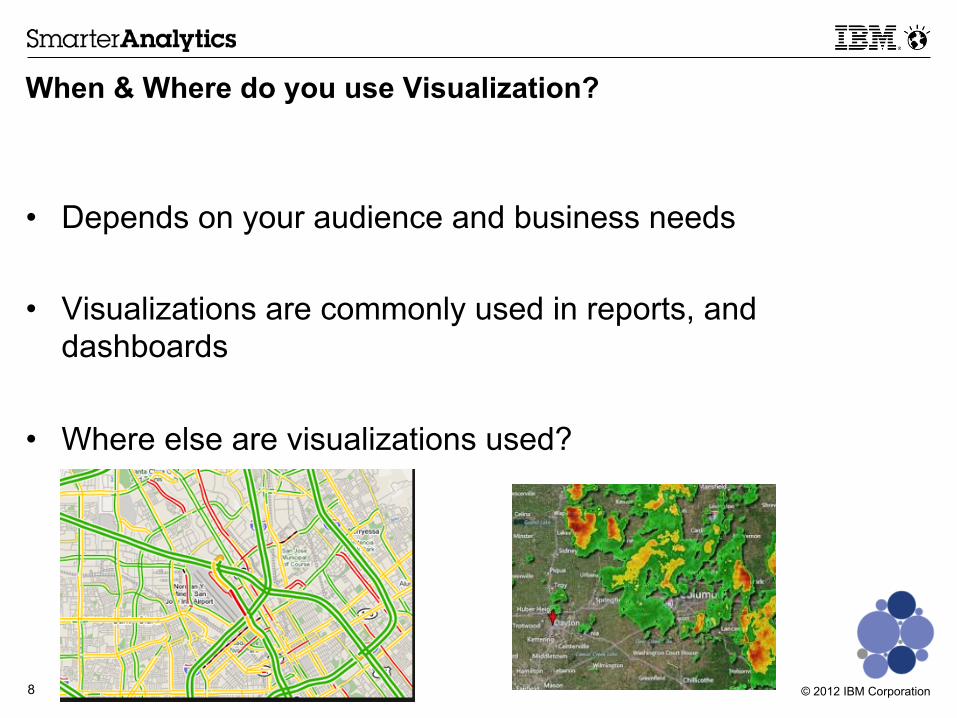
When & Where do you use Visualization?
• Depends on your audience and business needs
• Visualizations are commonly used in reports, and dashboards
• Where else are visualizations used?

© 2012 IBM Corporation 9
2 volunteers for an in-class study
30 seconds or less to answer the question: • What are the revenue trends for the four territories, and
which territory has the highest revenue in the 4th quarter?
• Volunteer #1 – graph • Volunteer #2 – 1,000 words
© 2012 IBM Corporation 10
What if you aren’t presented with a specific question?
• Visualization plays a vital role in gaining an understanding of large data sets
• Many organizations using visualizations to perform “data discovery” or “data mining” of their Big Data
© 2012 IBM Corporation 11
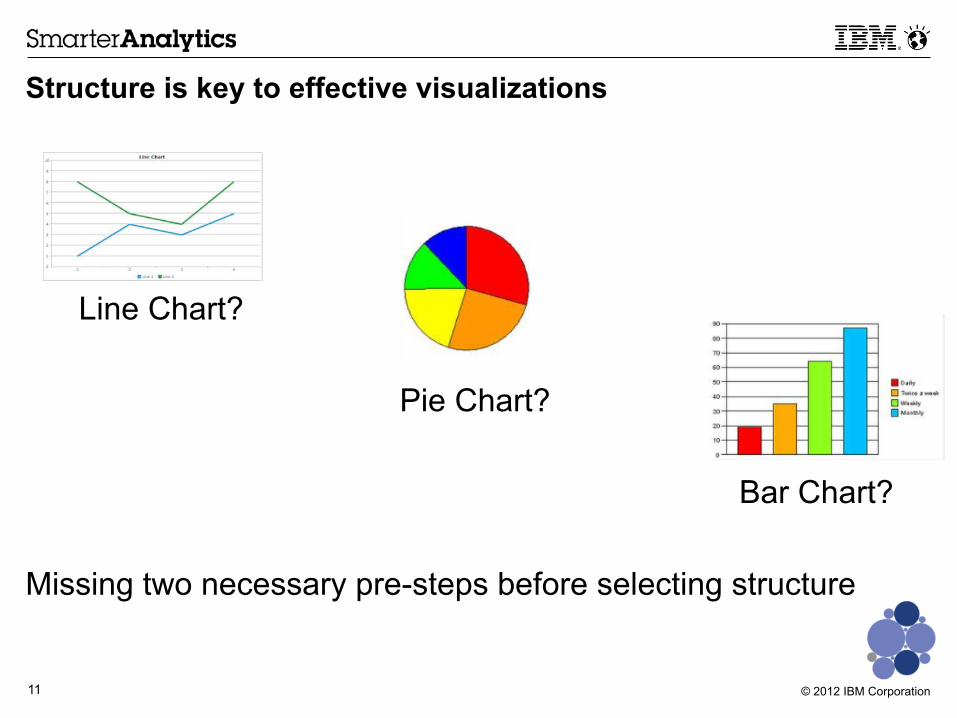
Structure is key to effective visualizations
Line Chart?
Pie Chart?
Bar Chart?
Missing two necessary pre-steps before selecting structure
© 2012 IBM Corporation 12
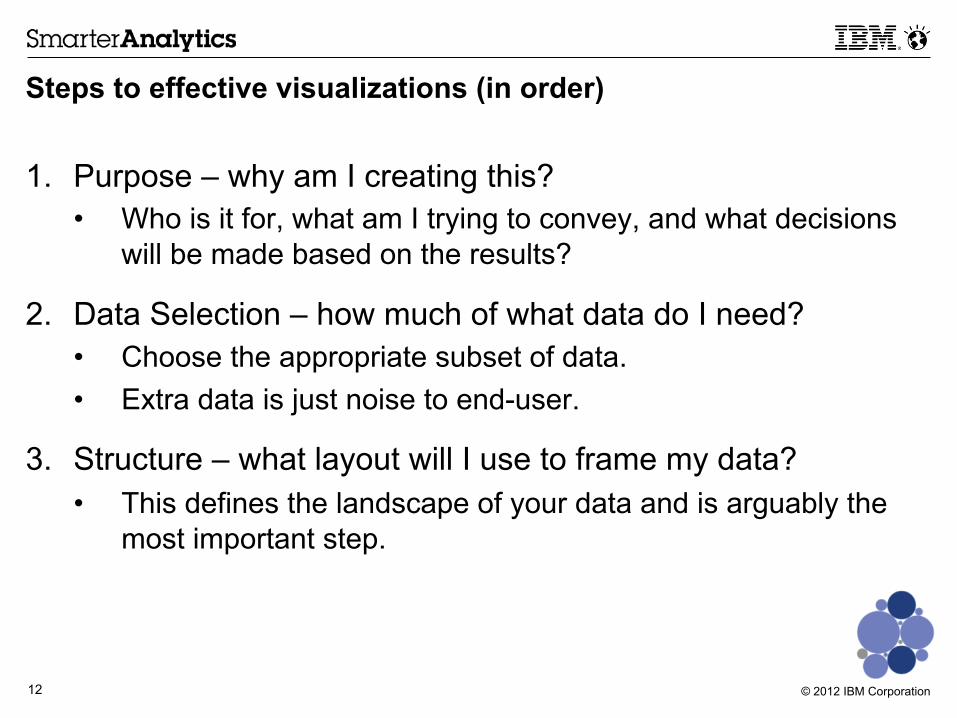
Steps to effective visualizations (in order)
1. Purpose – why am I creating this? • Who is it for, what am I trying to convey, and what decisions
will be made based on the results?
2. Data Selection – how much of what data do I need? • Choose the appropriate subset of data. • Extra data is just noise to end-user.
3. Structure – what layout will I use to frame my data? • This defines the landscape of your data and is arguably the
most important step.

© 2012 IBM Corporation 13
© 2012 IBM Corporation 14
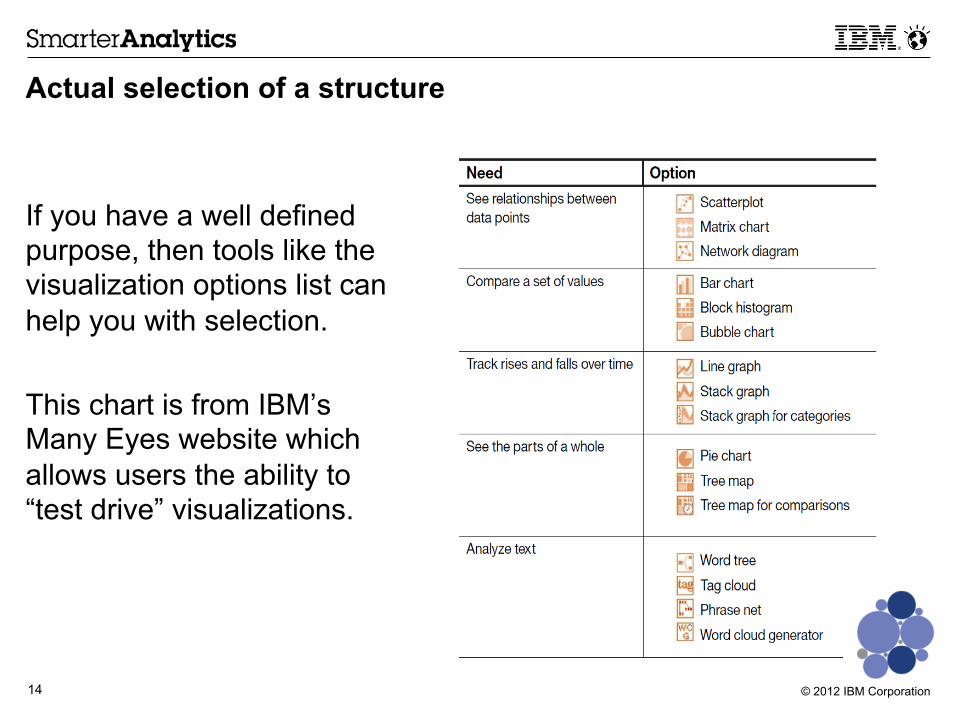
Actual selection of a structure
If you have a well defined purpose, then tools like the visualization options list can help you with selection. This chart is from IBM’s Many Eyes website which allows users the ability to “test drive” visualizations.
© 2012 IBM Corporation 15
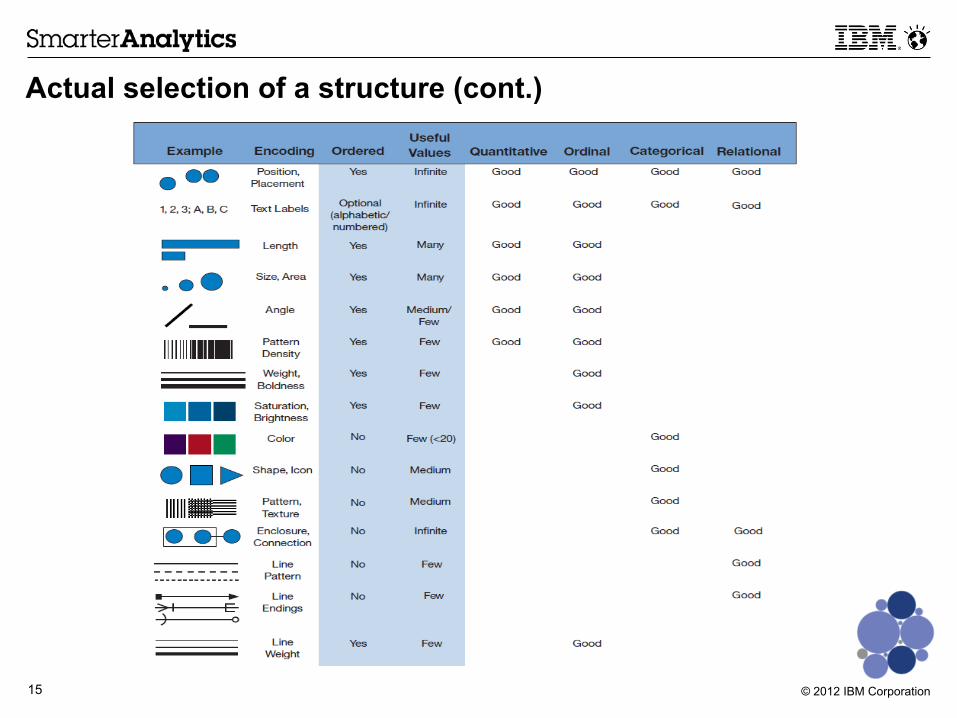
Actual selection of a structure (cont.)
© 2012 IBM Corporation 16
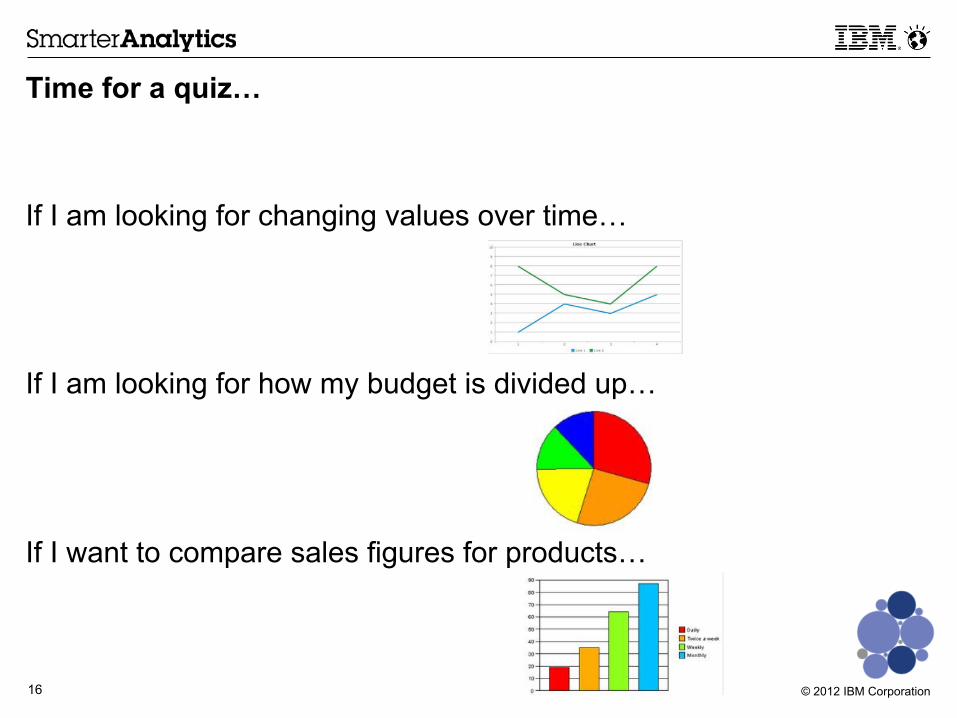
Time for a quiz…
If I am looking for changing values over time…
If I am looking for how my budget is divided up… If I want to compare sales figures for products…
© 2012 IBM Corporation 17
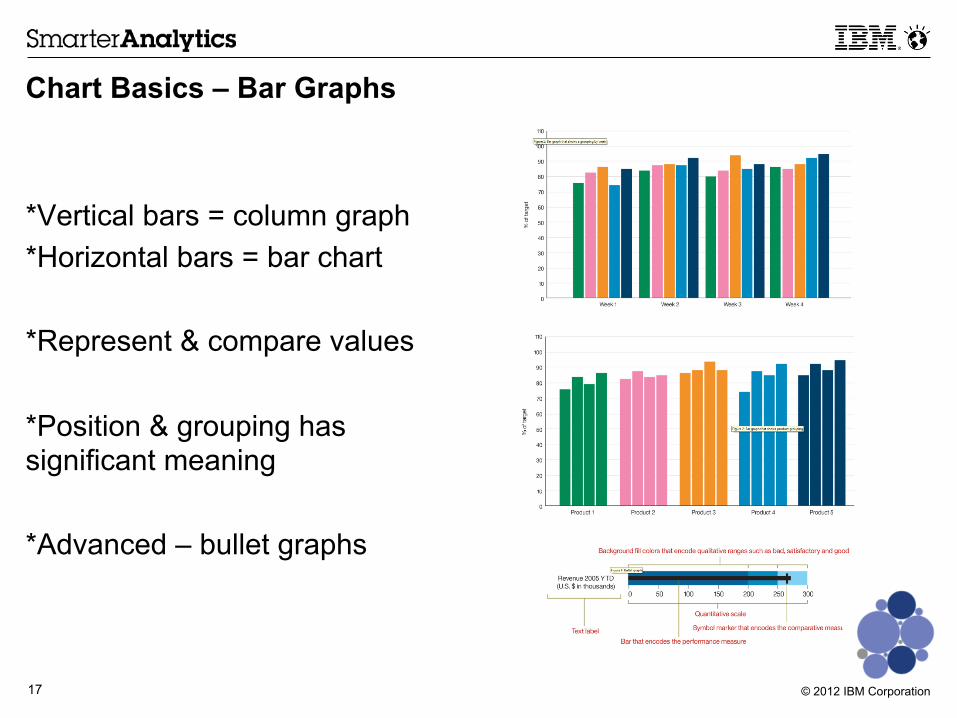
Chart Basics – Bar Graphs
*Vertical bars = column graph *Horizontal bars = bar chart *Represent & compare values *Position & grouping has significant meaning *Advanced – bullet graphs
© 2012 IBM Corporation 18
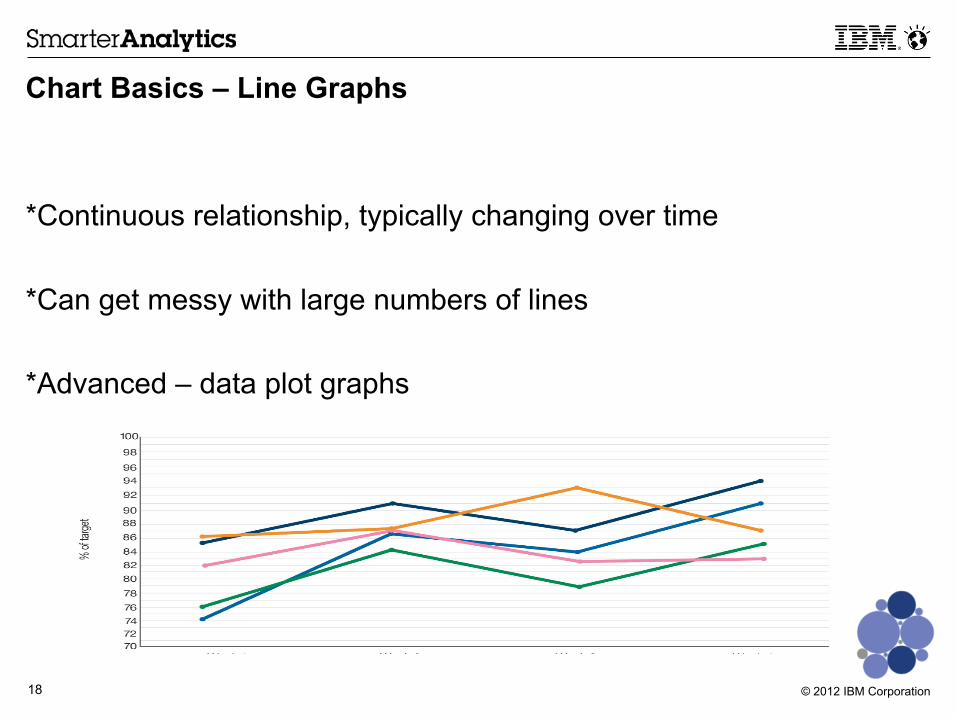
Chart Basics – Line Graphs
*Continuous relationship, typically changing over time *Can get messy with large numbers of lines *Advanced – data plot graphs
© 2012 IBM Corporation 19
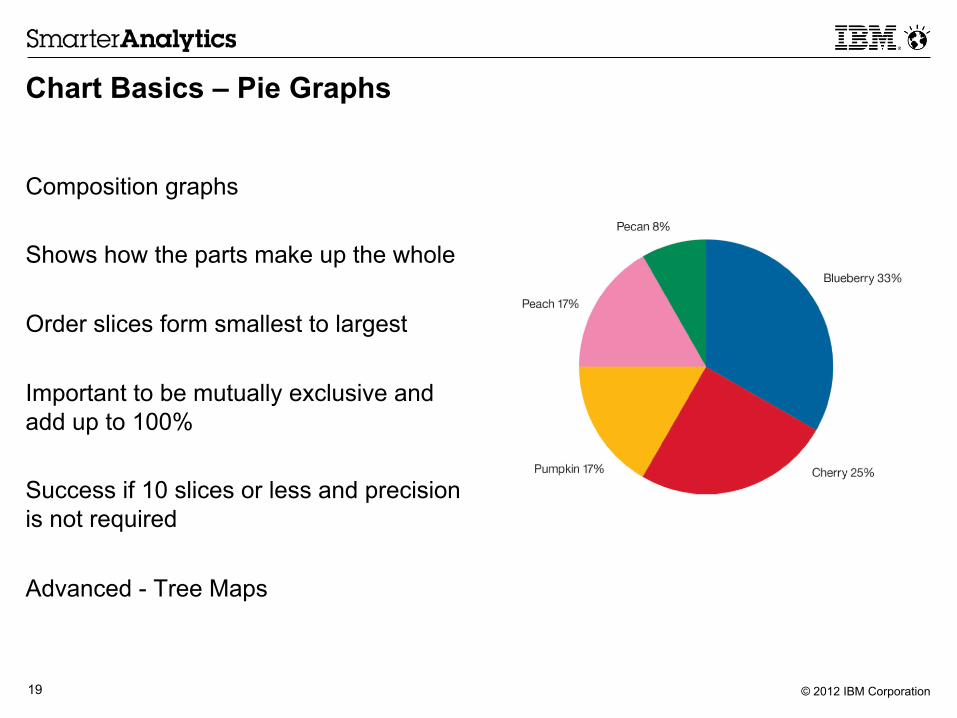
Chart Basics – Pie Graphs
Composition graphs Shows how the parts make up the whole Order slices form smallest to largest Important to be mutually exclusive and add up to 100% Success if 10 slices or less and precision is not required Advanced - Tree Maps

© 2012 IBM Corporation 20
A Good Pie Graph
© 2012 IBM Corporation 21
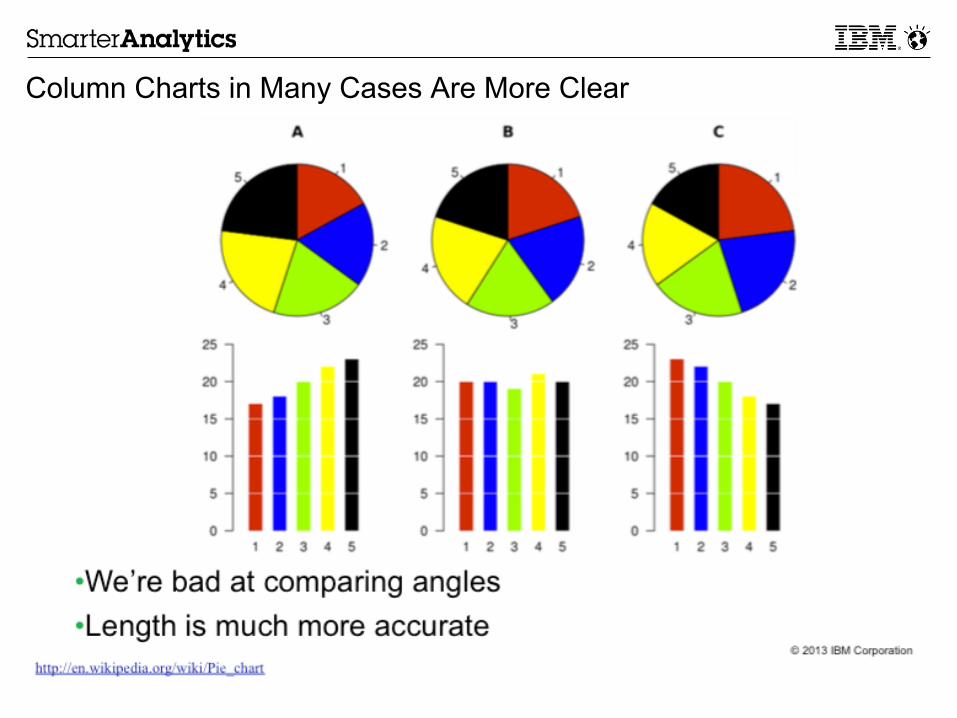
Column Charts in Many Cases Are More Clear
© 2012 IBM Corporation 22
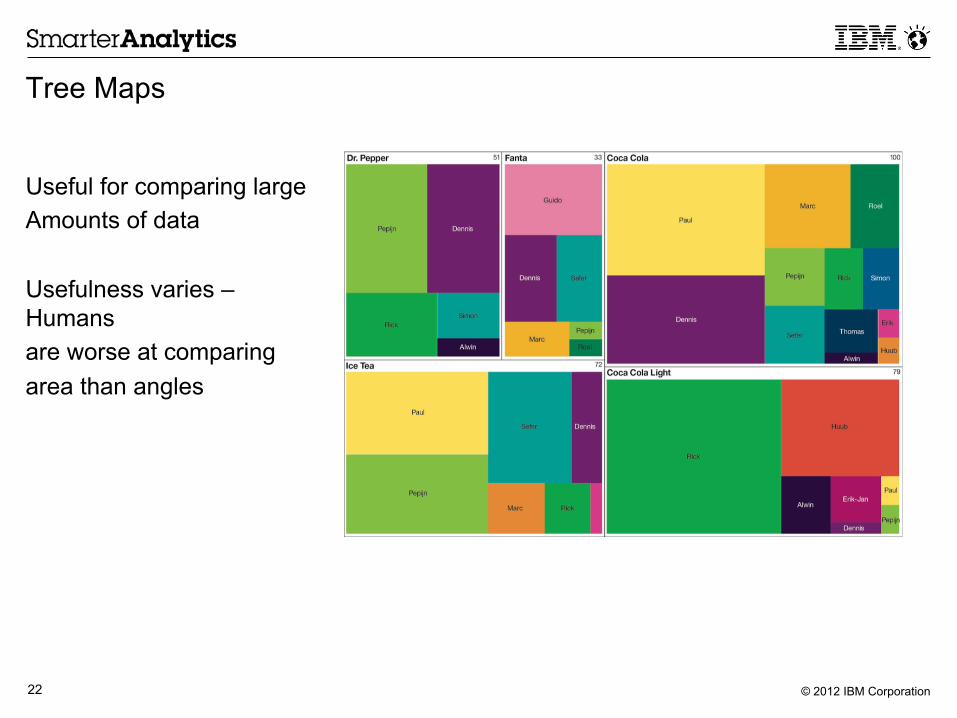
Tree Maps
Useful for comparing large Amounts of data Usefulness varies – Humans are worse at comparing area than angles

© 2012 IBM Corporation 23
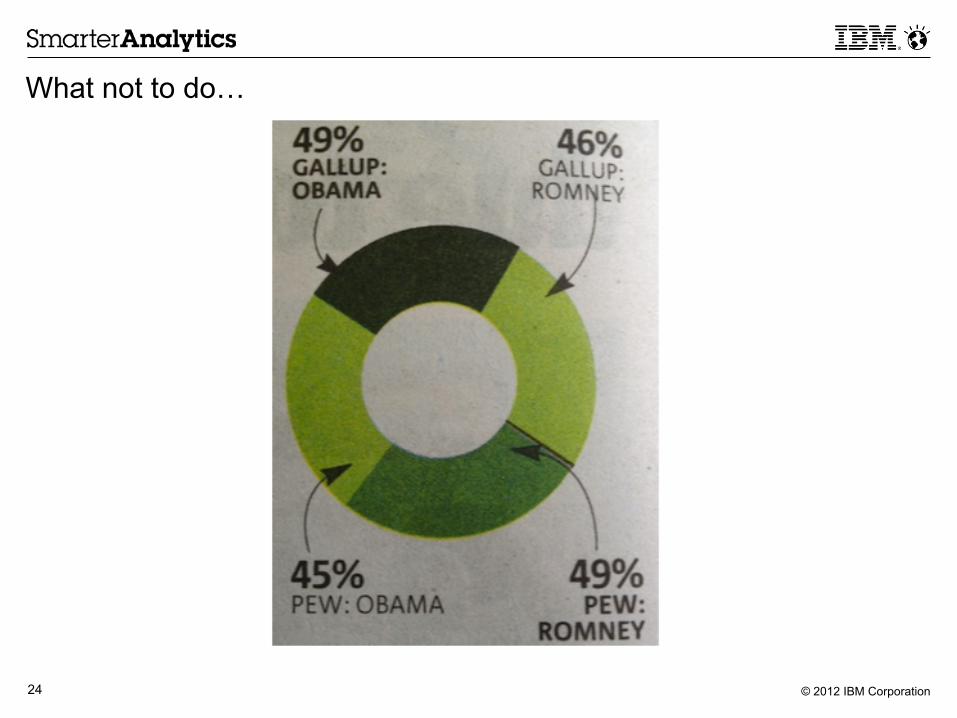
What not to do…
© 2012 IBM Corporation 24
What not to do…
© 2012 IBM Corporation 25
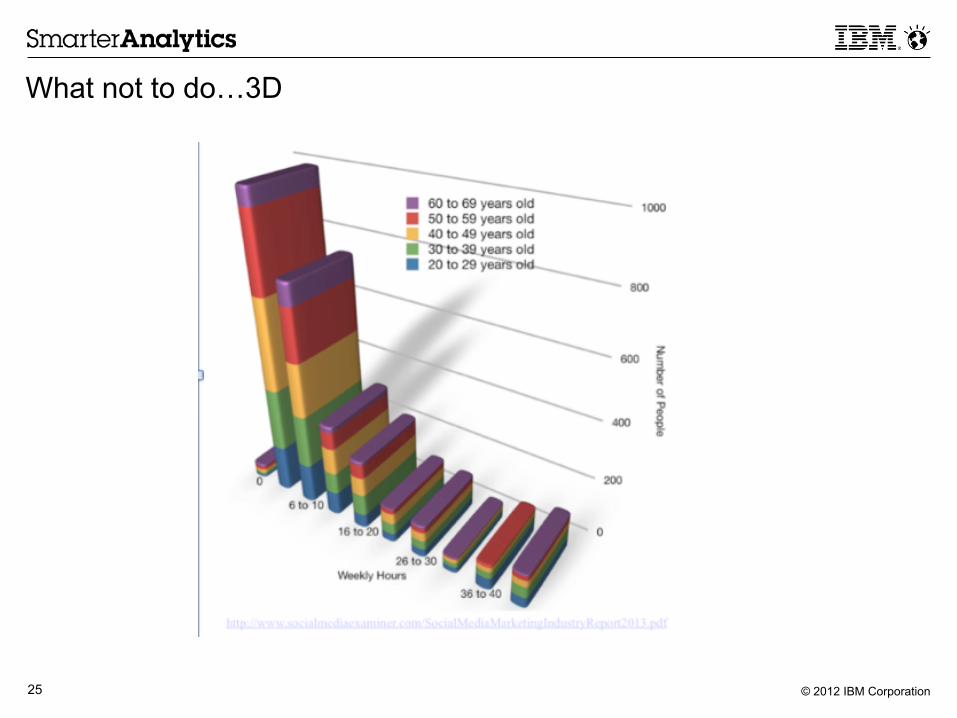
What not to do…3D
© 2012 IBM Corporation 26
© 2012 IBM Corporation 27
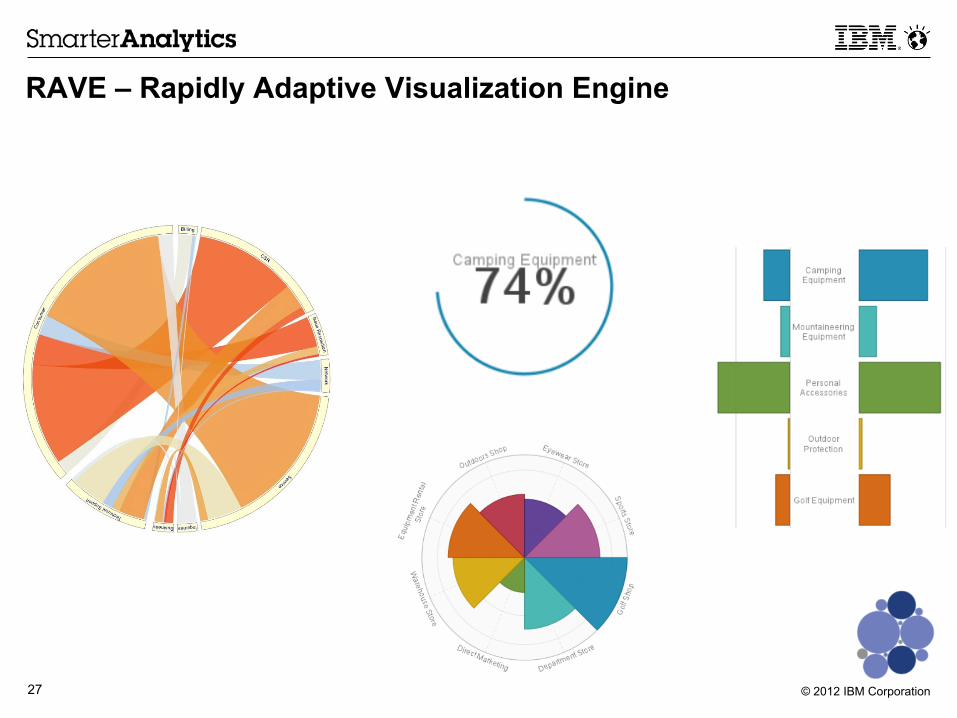
RAVE – Rapidly Adaptive Visualization Engine
© 2012 IBM Corporation 28
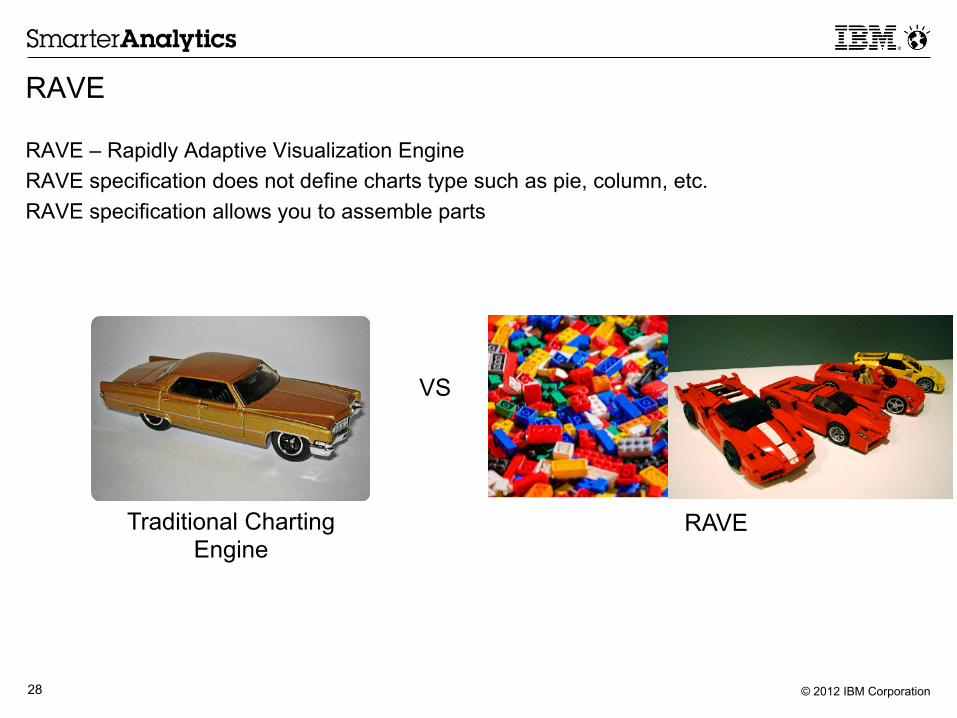
RAVE
RAVE – Rapidly Adaptive Visualization Engine RAVE specification does not define charts type such as pie, column, etc. RAVE specification allows you to assemble parts
VS
Traditional Charting Engine
RAVE
© 2012 IBM Corporation 29

© 2012 IBM Corporation 30
30
Visualization Tool
30
• Design to aid in the creation of visBundles for IBM Cognos BI v10.2.1
© 2012 IBM Corporation 31
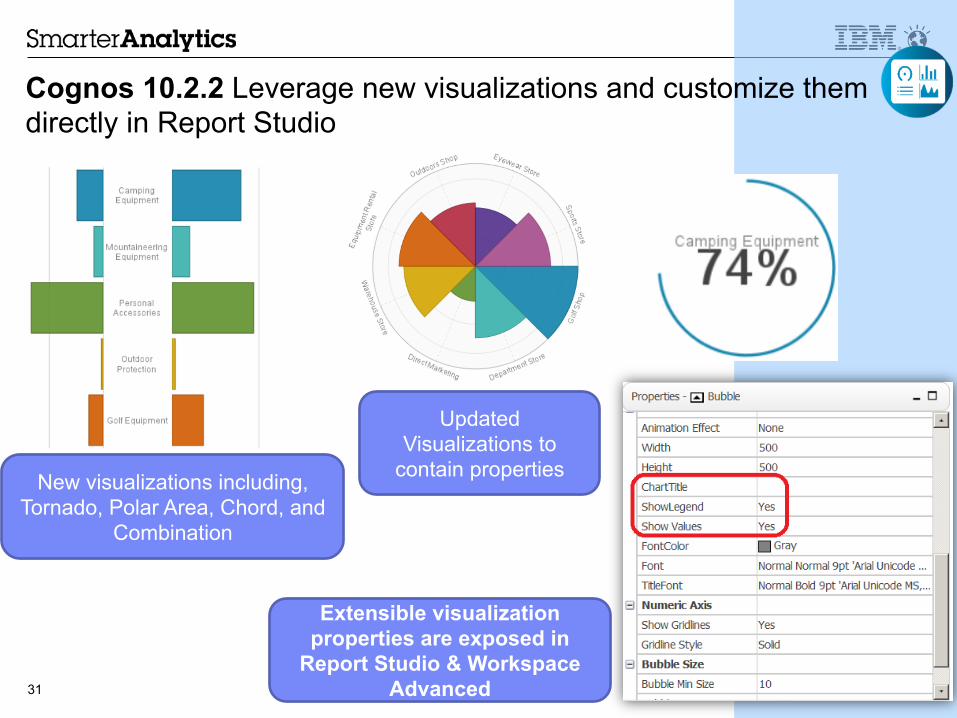
New visualizations including, Tornado, Polar Area, Chord, and
Combination
Updated Visualizations to
contain properties
Cognos 10.2.2 Leverage new visualizations and customize them directly in Report Studio
Extensible visualization properties are exposed in
Report Studio & Workspace Advanced
© 2012 IBM Corporation 32
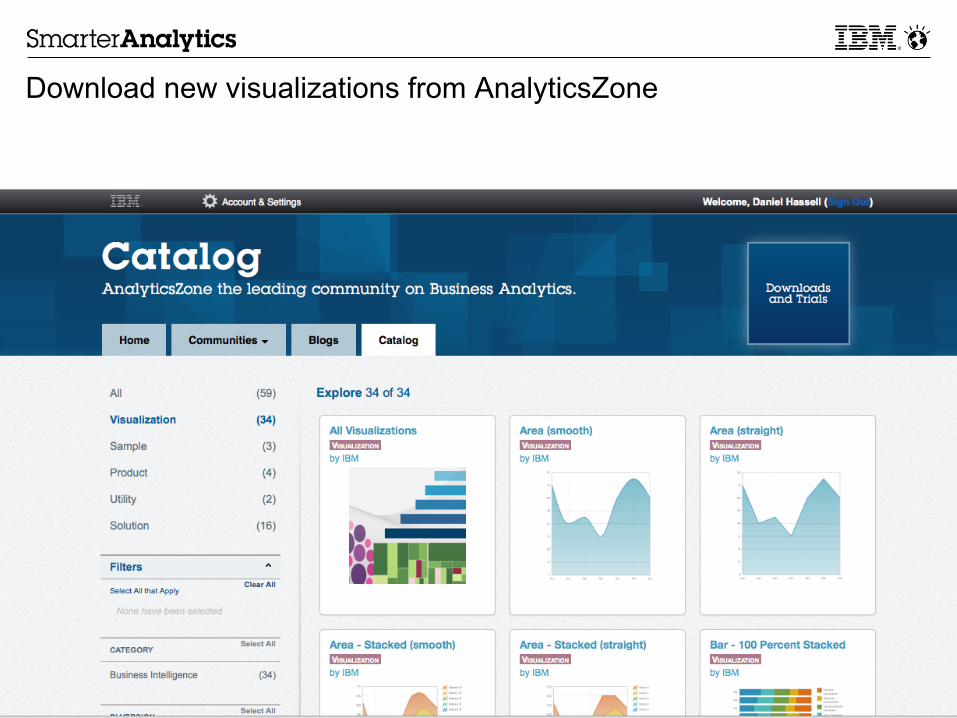
Download new visualizations from AnalyticsZone
© 2012 IBM Corporation 33 33
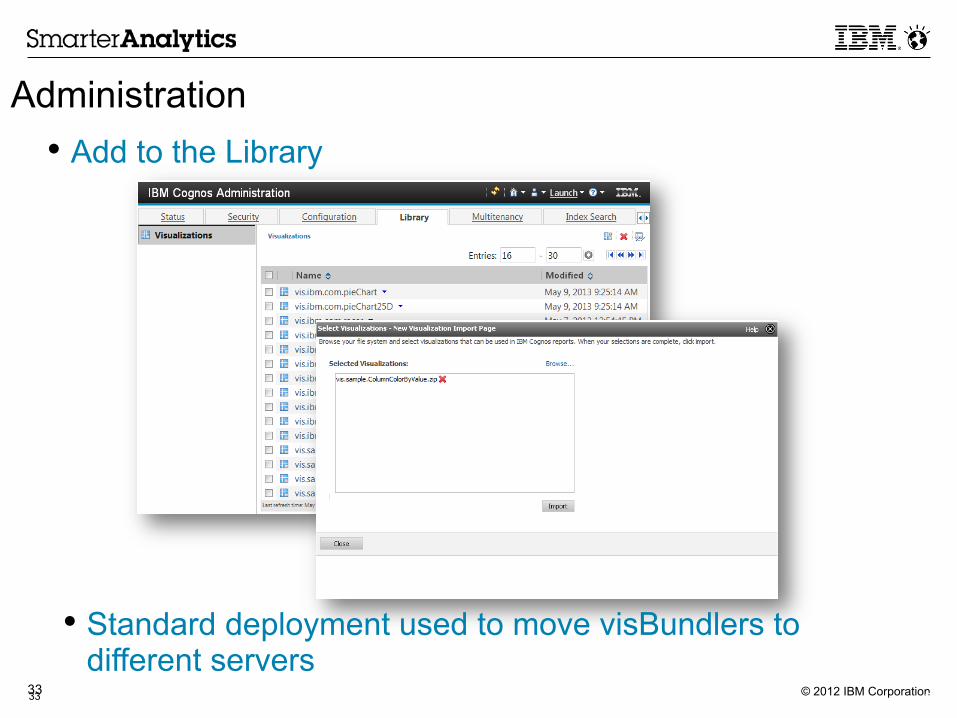
Administration
33
• Add to the Library
• Standard deployment used to move visBundlers to different servers
© 2012 IBM Corporation 34 34
VisBundles
34
• A Visbundles is a definition of a visualization that can be consumed in Report Studio
• Visbundles are must be stored in the content store for use in Report Studio
• A Visbundle is a zipped file that has a strict folder structure and set of files
© 2012 IBM Corporation 35

© 2012 IBM Corporation 36
© Copyright IBM Corporation 2014 All rights reserved. The information contained in these materials is provided for informational purposes only, and is provided AS IS without warranty of any kind, express or implied. IBM shall not be responsible for any damages arising out of the use of, or otherwise related to, these materials. Nothing contained in these materials is intended to, nor shall have the effect of, creating any warranties or representations from IBM or its suppliers or licensors, or altering the terms and conditions of the applicable license agreement governing the use of IBM software. References in these materials to IBM products, programs, or services do not imply that they will be available in all countries in which IBM operates. Product release dates and/or capabilities referenced in these materials may change at any time at IBM’s sole discretion based on market opportunities or other factors, and are not intended to be a commitment to future product or feature availability in any way. IBM, the IBM logo, Cognos, the Cognos logo, and other IBM products and services are trademarks of the International Business Machines Corporation, in the United States, other countries or both. Other company, product, or service names may be trademarks or service marks of others.
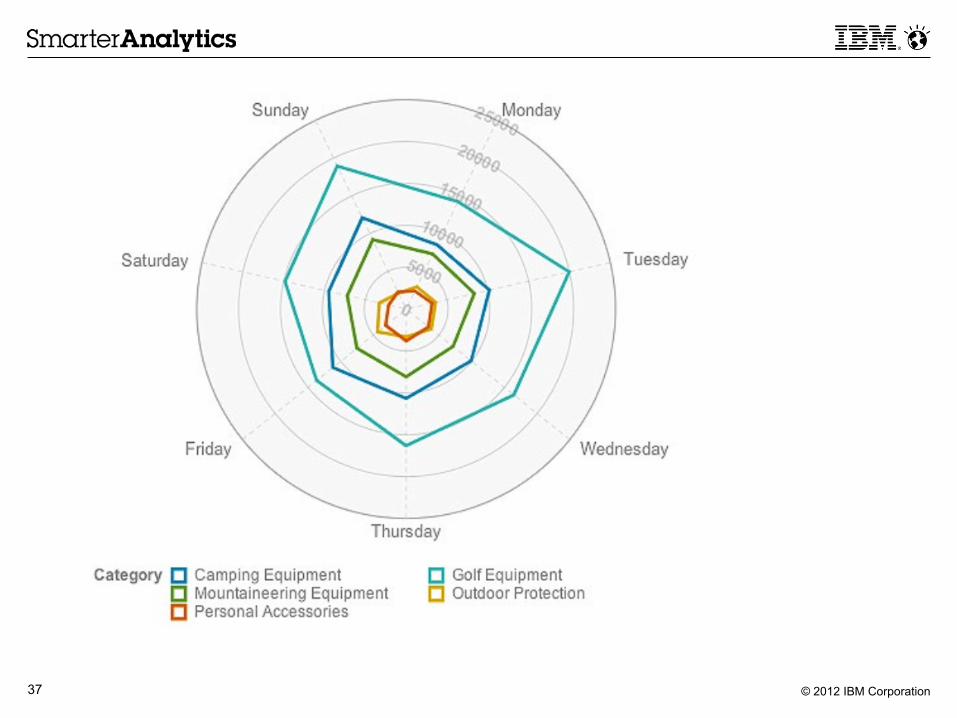
© 2012 IBM Corporation 37
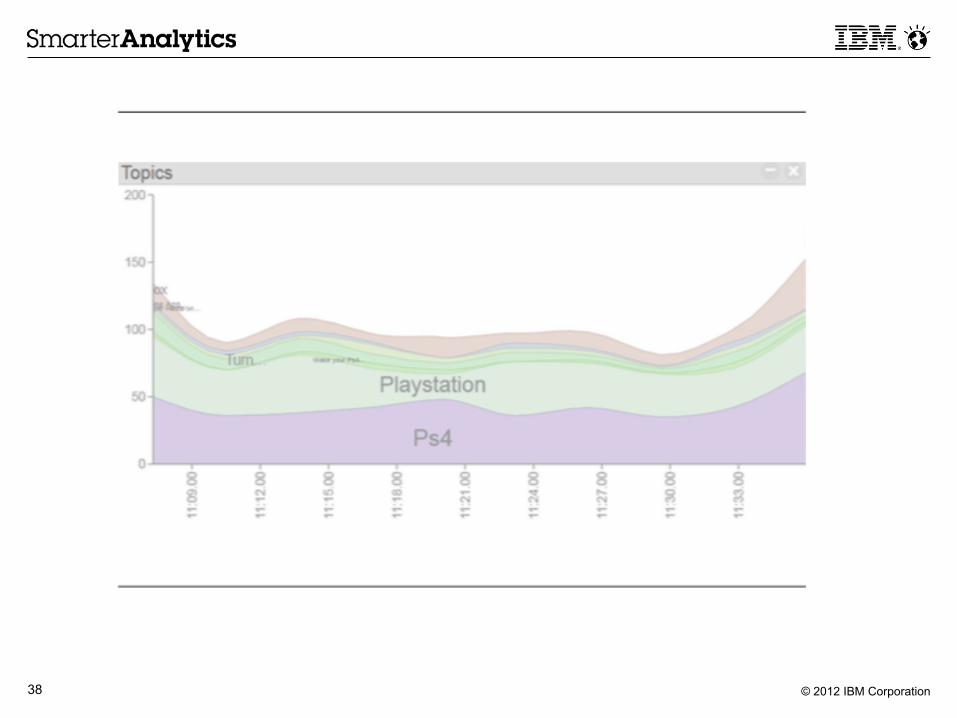
© 2012 IBM Corporation 38
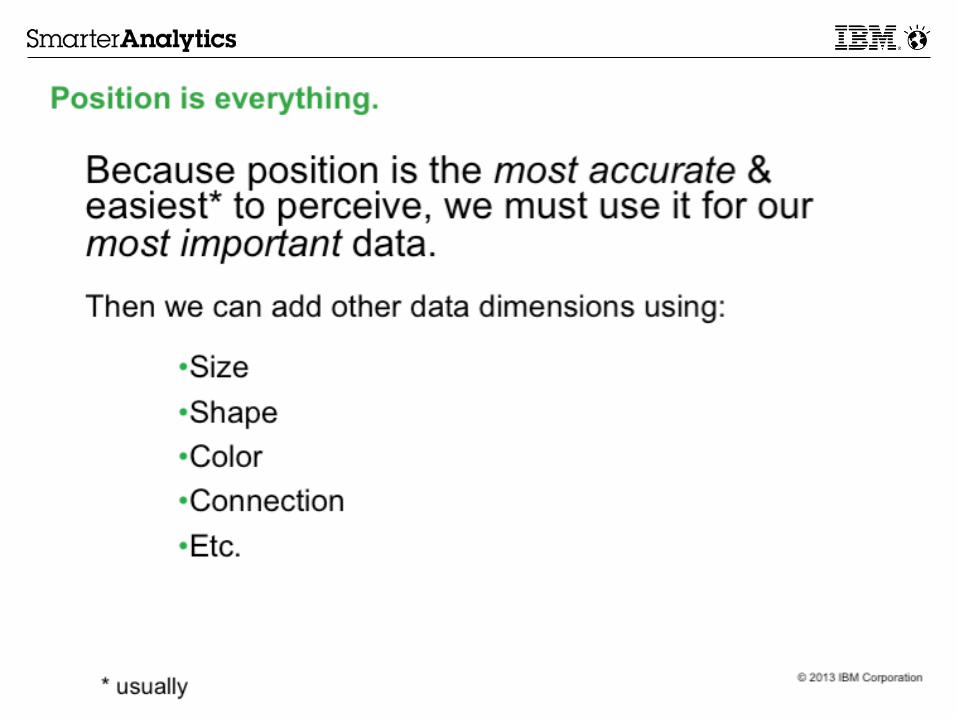
© 2012 IBM Corporation 39
© 2012 IBM Corporation 40