Embed Size (px)
Citation preview

Coherent Gradient Sensing Microscopy: Microinterferometric Technique
for Quantitative Cell Detection
M. Budyansky, C. Madormo, G. Lykotrafitis1
Department of Mechanical Engineering, University of Connecticut 191 Auditorium Road, UNIT 3139, Storrs-Mansfield, CT, 06269
ABSTRACT Micro-CGS, an integration of the interferometric optical method Coherent Gradient Sensing (CGS) [1-3] with an inverted microscope, is introduced. Micro-CGS extends the capabilities of Classical CGS into the cellular level. As such, it provides full-field, real-time, micro-interferometric quantitative imaging. Micro-CGS is based on the introduction of a microscope objective into the classical CGS setup. An experimental setup is detailed and resulting interferograms are shown. A digital image processing program is created to compute specimen curvature from the given fringe patterns. The experimental method is validated by the successful measurement of the curvature of 30-micron glass microspheres. KEYWORDS: Micro-interferometer, Fringe pattern analysis, Optical system, Image processing, Phase INTRODUCTION A majority of the optical techniques currently used in microscopy, such as Differential Interference Contrast (DIC), Dark-Field (DF), and Phase Contrast (PC) microscopy, are qualitative in nature. Recently, there has been an emergence of quantitative optical techniques that obtain spatial and temporal information from living cells [4-5]. In this framework, we developed micro-CGS which offers an increased stability and direct measurement of the surface curvature of microstructures. Classical CGS is a well-established large-scale quantitative optical interferometric technique which has been successfully used in the field of fracture mechanics as well as the measurement of residual stresses in thin films [1, 3]. CGS can be used in two operating modes, transmission and reflection. The working principle of transmission mode CGS is shown in Figure 1.
Fig. 1: Working principle of CGS
Proceedings of the SEM Annual ConferenceJune 7-10, 2010 Indianapolis, Indiana USA
©2010 Society for Experimental Mechanics Inc.
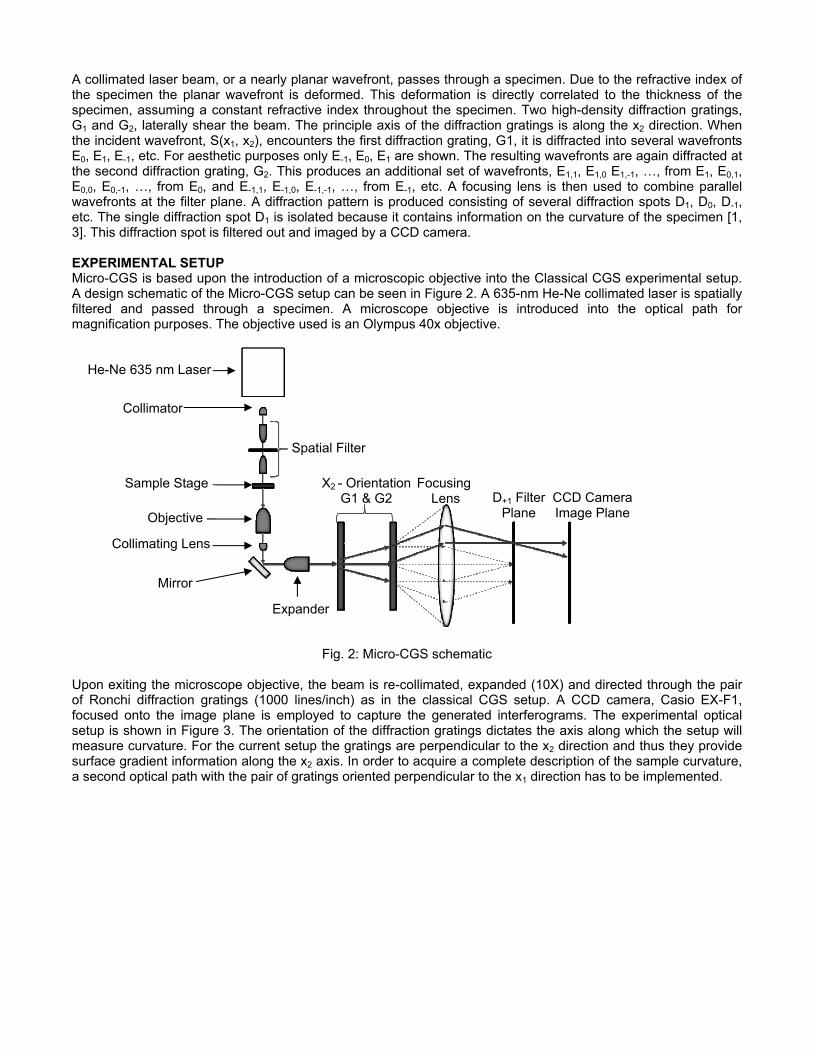
A collimated laser beam, or a nearly planar wavefront, passes through a specimen. Due to the refractive index of the specimen the planar wavefront is deformed. This deformation is directly correlated to the thickness of the specimen, assuming a constant refractive index throughout the specimen. Two high-density diffraction gratings, G1 and G2, laterally shear the beam. The principle axis of the diffraction gratings is along the x2 direction. When the incident wavefront, S(x1, x2), encounters the first diffraction grating, G1, it is diffracted into several wavefronts E0, E1, E-1, etc. For aesthetic purposes only E-1, E0, E1 are shown. The resulting wavefronts are again diffracted at the second diffraction grating, G2. This produces an additional set of wavefronts, E1,1, E1,0 E1,-1, …, from E1, E0,1, E0,0, E0,-1, …, from E0, and E-1,1, E-1,0, E-1,-1, …, from E-1, etc. A focusing lens is then used to combine parallel wavefronts at the filter plane. A diffraction pattern is produced consisting of several diffraction spots D1, D0, D-1, etc. The single diffraction spot D1 is isolated because it contains information on the curvature of the specimen [1, 3]. This diffraction spot is filtered out and imaged by a CCD camera. EXPERIMENTAL SETUP Micro-CGS is based upon the introduction of a microscopic objective into the Classical CGS experimental setup. A design schematic of the Micro-CGS setup can be seen in Figure 2. A 635-nm He-Ne collimated laser is spatially filtered and passed through a specimen. A microscope objective is introduced into the optical path for magnification purposes. The objective used is an Olympus 40x objective.
Fig. 2: Micro-CGS schematic
Upon exiting the microscope objective, the beam is re-collimated, expanded (10X) and directed through the pair of Ronchi diffraction gratings (1000 lines/inch) as in the classical CGS setup. A CCD camera, Casio EX-F1, focused onto the image plane is employed to capture the generated interferograms. The experimental optical setup is shown in Figure 3. The orientation of the diffraction gratings dictates the axis along which the setup will measure curvature. For the current setup the gratings are perpendicular to the x2 direction and thus they provide surface gradient information along the x2 axis. In order to acquire a complete description of the sample curvature, a second optical path with the pair of gratings oriented perpendicular to the x1 direction has to be implemented.
He-Ne 635 nm Laser
Collimator
Spatial Filter
Sample Stage
Objective
Collimating Lens
Mirror
Expander
X2 - Orientation G1 & G2
Focusing Lens D+1 Filter
Plane CCD Camera Image Plane

Fig. 3: Optical setup of Micro-CGS utilized in the experimentation IMAGE PROCESSING The software utilized to post-process the fringes was coded in MATLAB 2009. The algorithm begins by reading in the interferogram captured by the CCD camera [1]. The CCD camera records a pixel by pixel intensity distribution of the interferogram shown in Figure 4a. This interferogram corresponds to the x2 axis surface gradients of a 75mm Plano-convex lens. The intensity distribution of the CGS interferogram can be described by Eq. 1
( ) ( ) ( ) ( )δ= +1 2 1 2 1 2 1 2, , , cos ,I x x a x x b x x x x (1)
where ( )1 2,I x x is the intensity of the fringe pattern at point ( )1 2,x x , ( )1 2,a x x is the background intensity level,
( )1 2,b x x is the fringe visibility, and ( )δ 1 2,x x is the phase-angle term [1]. It can also be expressed in a complex form as Eq. 2
( ) ( ) ( ) ( )= + + *1 2 1 2 1 2 1 2, , , ,I x x a x x c x x c x x (2)
where ( ) ( ) ( )δ= 1 2,1 2 1 2
1, ,2
i x xc x x b x x e and ( )ω ω*1 2,c is the complex conjugate of ( )ω ω1 2,c .
Fig. 4: (a) Interferogram for 75mm diameter Plano-convex lens, (b) corresponding frequency power spectrum after converting to Fourier domain
(a) (b)
x2
x1

The program then converts the image to the Fourier domain by employing Fast-Fourier transform. The resulting frequency domain can be seen in Figure 4b. The intensity distribution in the Fourier domain is shown as Eq. 3
( ) ( ) ( ) ( )ω ω ω ω ω ω ω ω= + + − −*1 2 1 2 1 2 1 2, , , ,I A C C (3)
where ω1 and ω2 are the spatial frequencies in the Fourier domain, ( )ω ω1 2,A contains low-frequency information,
and ( )ω ω− −*1 2,C is the complex conjugate of ( )ω ω1 2,C . Bandpass filtering is used in order to eliminate ( )ω ω1 2,A
and either ( )ω ω1 2,C or ( )ω ω− −*1 2,C . The inverse Fourier transform of the remaining term is taken to obtain
( )ω ω1 2,c or ( )ω ω*1 2,c . The phase can then be found by using the following expression
( )( )( )
δ −⎡ ⎤⎣ ⎦=⎡ ⎤⎣ ⎦
1 211 2
1 2
Im ,, tan
Re ,
c x xx x
c x x (4)
This is the full-field wrapped phase as seen in Figure 5a. A single column representation is provided in Figure 5b to display values oscillating between π− and π .
Fig. 5: (a) Full field wrapped phase of Fig. 4a, (b) Phase in radians vs. distance on y-axis of the Fig. 5a in pixels After obtaining the wrapped phase, a phase unwrapping algorithm is used to unwrap the phase shown in Figure 5a. The resulting full field unwrapped phase is displayed in Figure 6a, accompanied by a single column representation shown in Figure 6b.
Fig. 6: a) Full field unwrapped phase, b) Unwrapped fringe order vs. distance on y-axis of Figure 6a in pixels
(a) (b)
(b)(a)
Unw
rapp
ed F
ringe
Ord
er
Wra
pped
Pha
se
x2
x1

This particular case established linearity in fringe order for the plano-convex lens which has constant curvature. To approximate the curvature 22κ of the specimen, the unwrapped phase is differentiated with respect to x2 direction according to Equation 5 [1-3] for CGS in transmission.
ρκ
∂ ∂≈ =
Δ ∂∂
21 2
22 22
( , )2
S x x nDx (5)
where ρ is the grating pitch, ∂n is the change in the number of fringes, Δ is the distance between the diffraction gratings, and ∂D is the distance between the fringes. Finally, a thickness profile is generated to obtain the thickness profile along the same direction as the curvature by integrating the unwrapped phase [6] RESULTS A sample of 30-micron glass microspheres (±1%), manufactured by Thermo-Scientific, in aqueous solution were imaged with the aforementioned experimental setup. The corresponding fringe interferogram of each bead captured in the CCD camera is shown in Figure 7a. The interferograms display a predicted constant curvature through the equidistant straight parallel fringes obtained about the y axis surface gradients. In addition, adjacent beads exhibit nearly the same fringe pattern and fringe spacing signifying identical curvature detection between these glass beads. For each of the labeled beads a rectangular cross section was isolated from Figure 7a, and analyzed by the currently in development image processing software. The results were averaged and presented in Figure 7b showing a calculated curvature ratio between numerical vs. analytical solutionsκ κ22 / bead . The average of the four beads has an average standard deviation of approximately 2.0% between the four beads. The numerical curvature values were also produced with an average difference of 1.5% from the analytical value (1/radius of curvature). The curvature was nearly constant along the x2-axis in the form of a reasonably flat plane in the field of the bead as exhibited in Figure 7b.
Fig. 7: a) Interferogram captured for 30-micron glass beads in aqueous solution b) Curvature ratio of calculated vs. analytical bead curvatureκ κ22 / bead
CONCLUSION A proposed adaptation to the optical method of Coherent Gradient Sensing (CGS), known as micro-CGS, has been presented. The constructed experimental setup was employed to produce interferograms from microbeads of known curvature. The preliminary curvature results obtained for a set of 30 micron beads produced an average error of 1.5% with respect to the known value. It is believed that with further refinements to the digital image processing program this result will become more accurate. The accuracy of the results signifies that micro-CGS can be used to successfully obtain curvature of static micro-specimens. In addition, the optical system produced repeatable fringe interferograms within the beads, signifying the successful detection capability of micro-CGS. Moving forward, the intention of the research is to further extend the capabilities of micro-CGS to cellular specimens. By characterizing the thermally induced surface vibrations of biological cells, their mechanical properties can be then determined.
a)
30 µm
x2
x1
Nor
mal
ized
Cur
vatu
re µ
m-1
1
2
3
4
(b)(a)

ACKNOWLEDGEMENTS We would like to acknowledge Ares J. Rosakis of the California Institute of Technology for very helpful discussions on Coherent Gradient Sensing and providing us with the Ronchi gratings used in the experimental setup. This work was supported by UCRF Large Grant J980. REFERENCES 1. Lee H, Rosakis AJ, & Freund LB, Full-field optical measurement of curvatures in ultra-thin-film-substrate
systems in the range of geometrically nonlinear deformations. Journal of Applied Physics 89(11):6116-6129. (2001).
2. Lee YJ, Lambros J, & Rosakis AJ, Analysis of Coherent Gradient Sensing (CGS) by Fourier optics. Optics and Lasers in Engineering 25(1):25-53. (1996).
3. Rosakis AJ, Singh RP, Tsuji Y, Kolawa E, & Moore NR, Full field measurements of curvature using coherent gradient sensing: application to thin film characterization. Thin Solid Films 325(1-2):42-54. (1998).
4. Ikeda T, Popescu G, Dasari RR, & Feld MS, Hilbert phase microscopy for investigating fast dynamics in transparent systems. Optics Letters 30(10):1165-1167. (2005).
5. Lue N, et al., Live cell refractometry using Hilbert phase microscopy and confocal reflectance microscopy. J Phys Chem A 113(47):13327-13330. (2009).
6. Lambros J & Rosakis AJ, An experimental study of dynamic delamination of thick fiber reinforced polymeric matrix composites. Experimental Mechanics 37(3):360-366. (1997).


![Piezoresponse Force Microscopy in Its Applications · Piezoresponse Force Microscopy (PFM) [1-4] is based on sensing of a tiny displacement of the samples caused by electric field](https://img.pdfslide.net/doc/110x75/5fc2216023ba5a71761bd5f6/piezoresponse-force-microscopy-in-its-applications-piezoresponse-force-microscopy.jpg)