Embed Size (px)
DESCRIPTION
Value Stream Mapping
Citation preview
Beneficiario COLFUTURO 2012
UNIVERSITY OF NEW SOUTH WALES
SCHOOL OF MECHANICAL AND MANUFACTURING ENGINEERING
SEBEL
Value Stream Mapping
Project Final Report
Juan Gutierrez
Student ID: 3413601
Master of Engineering Science
Specialisation of Manufacturing Engineering and Management
Project 6 UOC (GSOE0006)
June 2013
University Supervisor: Associate Prof. Sami Kara (Director Postgraduate Research)
Industry Supervisors: Michael Huang (Plastics Manager)

Beneficiario COLFUTURO 2012
Beneficiario COLFUTURO 2012
CERTIFICATE OF ORIGINALITY
I hereby declare that this submission is my own work and to the best of my
knowledge it contains no materials previously published or written by another
person, nor material which to a substantial extent has been accepted for the
award of any other degree or diploma at UNSW or any other educational
institution, except where due acknowledgement is made in the thesis. Any
contribution made to the project by others, with whom I have worked at UNSW
or elsewhere, is explicitly acknowledged in the document.
I also declare that the intellectual content of this report is the product of my own
work, except to the extent that assistance from others in the project’s design
and conception or in style, presentation and linguistic expression is
acknowledged.
(Signed) ……………………………………….
Beneficiario COLFUTURO 2012
ABSTRACT
This project was commissioned to study the feasibility of one of the most
complex and representative core products of Sebel Furniture (a well known
furniture manufacturing company, based in Sydney, Australia) by comparing its
current operations in a centralized model, to a future state in a de-centralized
logistics model. The method for doing this was Value Stream Mapping, a Lean
manufacturing methodology to identify non-value-added activities along the
processes, and reduce Lead Time (LT) and costs by removing those wastes.
It is important to mention that, although most of the information in this report
corresponded to real data, some assumptions were made, given constraints
such as time and the fact that, by the time this report was written, the company
was yet working on some of the projections for the future business model.
Through the development of the project, Value Stream Maps (VSM) for the
family product Postura Plus Shell range were documented on its centralized
and de- centralized logistics, main wastes and non-value-added activities were
identified, as well as considerations for improvement were raised. This report
also shows a basic simulation model of how the VSM would looks like in an
improved state, and how each scenario differs from the others. Results showed
risks of the future decentralized logistic model of the company regarding
complexity of operations planning and inventory management, as well as it
describes how successful could it be in terms of a shorter lead time, if an action
plan were implemented.
Beneficiario COLFUTURO 2012
ENDORSEMENT
This report has been reviewed by the company representative of Sebel
Furniture. It contains confidential information of Sebel Furniture.
Date: …………………………………….
…………………………………………….
Michael Huang
Plastic Molding Department Manager
Sebel Furniture
Beneficiario COLFUTURO 2012
ACKNOWLEDGEMENTS
It has been great honor to perform this project at Sebel Furniture Company. I
am very thankful to Mr. Pat Varanasi (Operations Manager) for giving me the
opportunity of put into practice my knowledge, whilst I acquired a different
experience in a different sector of the industry.
I would like to take opportunity to express my gratitude to Mr. Paul Fiddling
(Engineering Manager), Michael Huang (Plastics Manager) and Armin Asadi
(Manufacturing Engineer) for providing all facilities and support to meet my
project requirements, as well as to my Project Supervisor Prof. Sami Kara
(Director Postgraduate Research UNSW) for his guidance.
I am also thankful to Graeme Love (Supply Chain Manager) and Jacky Chan
(Planning and Assembly Manager) for helping me to understand the project
better, and to all people I had the pleasure to meet and interview for their
willingness to help me completing the assigned tasks.
Although there may be many who remain unacknowledged in this humble note
of gratitude there are none who remain unappreciated.

Beneficiario COLFUTURO 2012
TABLE OF CONTENTS
Glossary ............................................................................................................. viii
List of figures ........................................................................................................ ix
List of tables ......................................................................................................... x
List of abbreviations ............................................................................................. xi
List of appendices ............................................................................................... xii
INTRODUCTION ................................................................................................ xiii
1. COMPANY PROFILE .................................................................................... 1
2. PROJECT DESCRIPTION ............................................................................. 1
PROJECT BACKGROUND ............................................................................ 4
VSM PROJECT IMPACT OVER COMPANY’S STRATEGY ......................... 5
PROJECT PLAN ............................................................................................ 6
3. MATERIALS AND METHODS ....................................................................... 7
CURRENT STATE ......................................................................................... 8
FUTURE STATE .......................................................................................... 15
4. RECOMMENDATIONS ................................................................................ 21
IMPROVED STATE ..................................................................................... 21
5. CONCLUSIONS .......................................................................................... 25
6. REFERENCES ............................................................................................ 27
7. APPENDIcES .............................................................................................. 28
Beneficiario COLFUTURO 2012
1. GLOSSARY
Kaizen: A Japanese word that means "change for the better." Kaizen is a
combination of maintenance, problem solving, and innovation that is
generally performed by a team.(4)
Lead Time (LT): The time spent between the original customer order for a
particular product and its final delivery to the customer.(3)
Lean manufacturing: An approach to manufacturing that seeks to reduce
the cycle time of processes, increase flexibility, and improve quality. Lean
approaches help to eliminate waste in all its forms.(3)
Order-to-cash cycle: Normally refers to the business process for receiving
and processing customer sales.(4)
Takt time: The rate at which the customer requires your company to
manufacture products.(3)
Third Party Logistics (3PL): A firm that provides service to its customers
of outsourced (or "third party") logistics services for part, or all of their
supply chain management functions.(4)
Beneficiario COLFUTURO 2012
List of figures
Figure 1. Sebel’s strategy vs VSM impacts 5
Figure 2. Project’s Gantt Chart 6
Figure 3. Pareto analysis for sales margin of core family products 7
Figure 4. Postura Plus Shell chair 8
Figure 5. Plastic molding process 9
Figure 6. Assembly process 9
Figure 7. Postura Plus Shell VSM – Current (Centralised) State 10
Figure 8. Receiving/Dispatching Process 12
Figure 9. Seats WIP 12
Figure 10. Die change 13
Figure 11. Frames’ sorting 13
Figure 12. PMD Manual operation 14
Figure 13. Assembly sequence 14
Figure 14. Sebel new business model 15
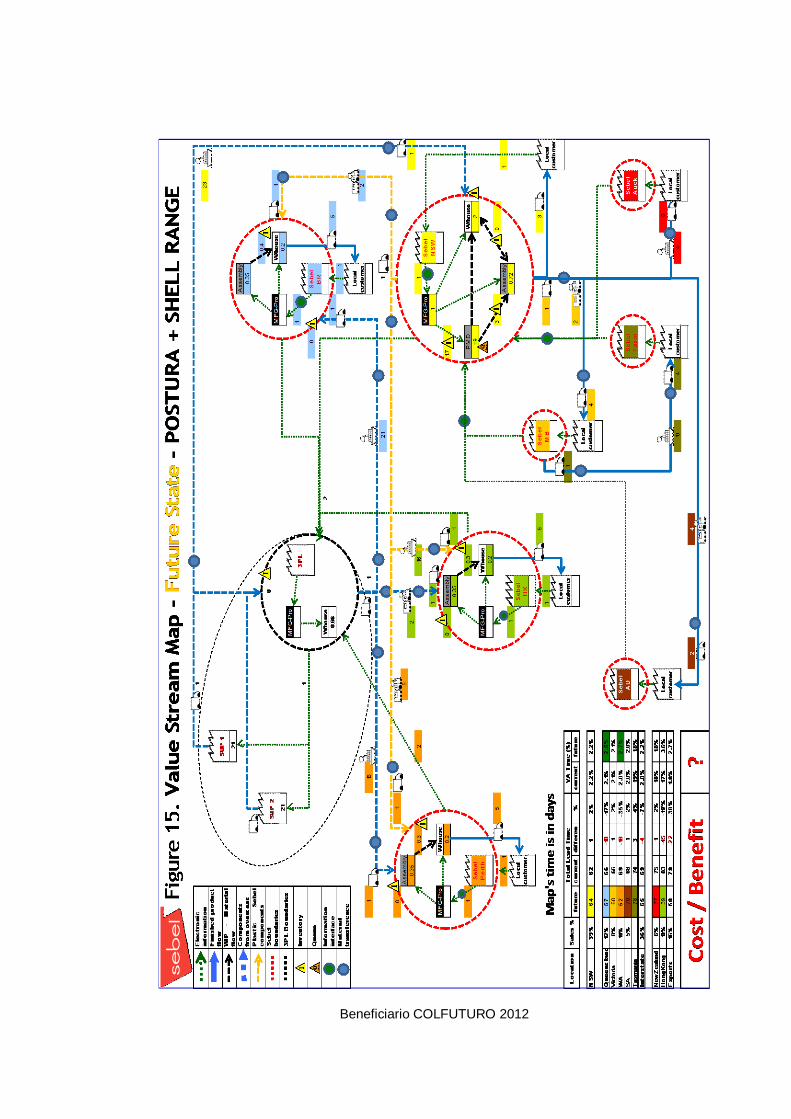
Figure 15. Postura Plus Shell VSM – Future (Decentralised) State 17
Figure 16. Postura Plus Shell VSM – Improved (Centralised) State 22
Figure 17. Postura Plus Shell VSM – Improved (Decentralised) State 23
Figure 18. Comparison of proportional value-added time 25
Beneficiario COLFUTURO 2012
List of tables
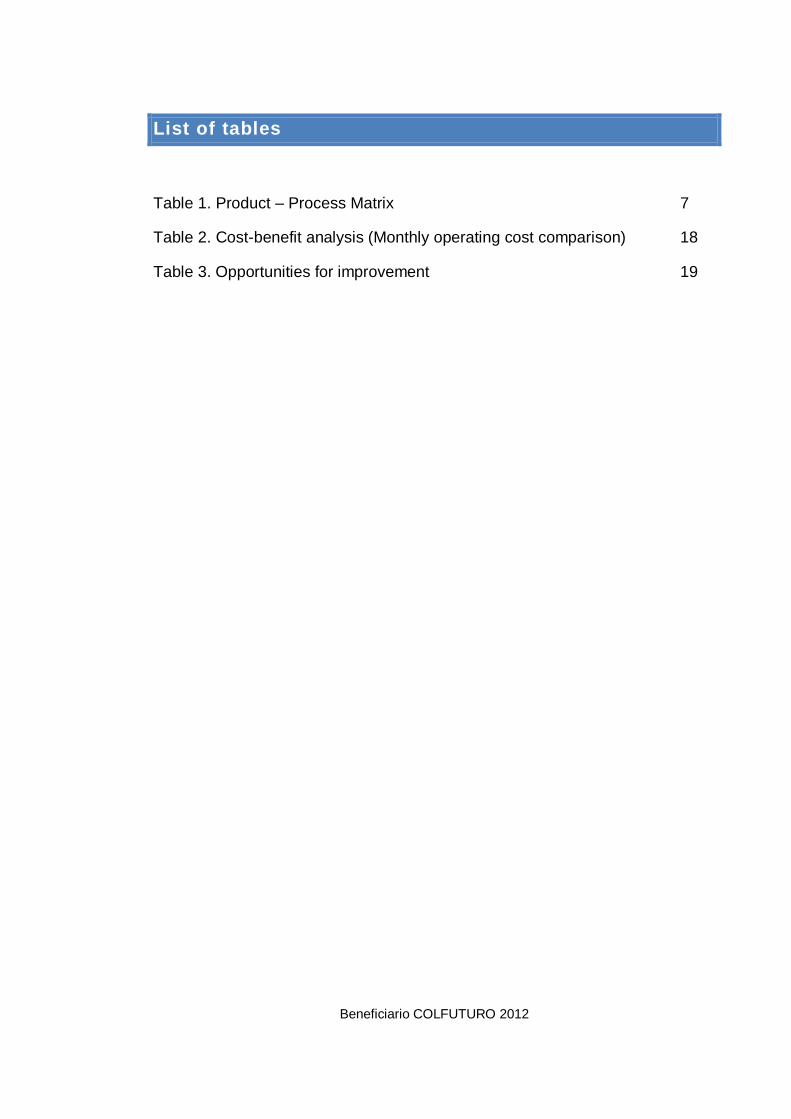
Table 1. Product – Process Matrix 7
Table 2. Cost-benefit analysis (Monthly operating cost comparison) 18
Table 3. Opportunities for improvement 19
Beneficiario COLFUTURO 2012
List of abbreviations
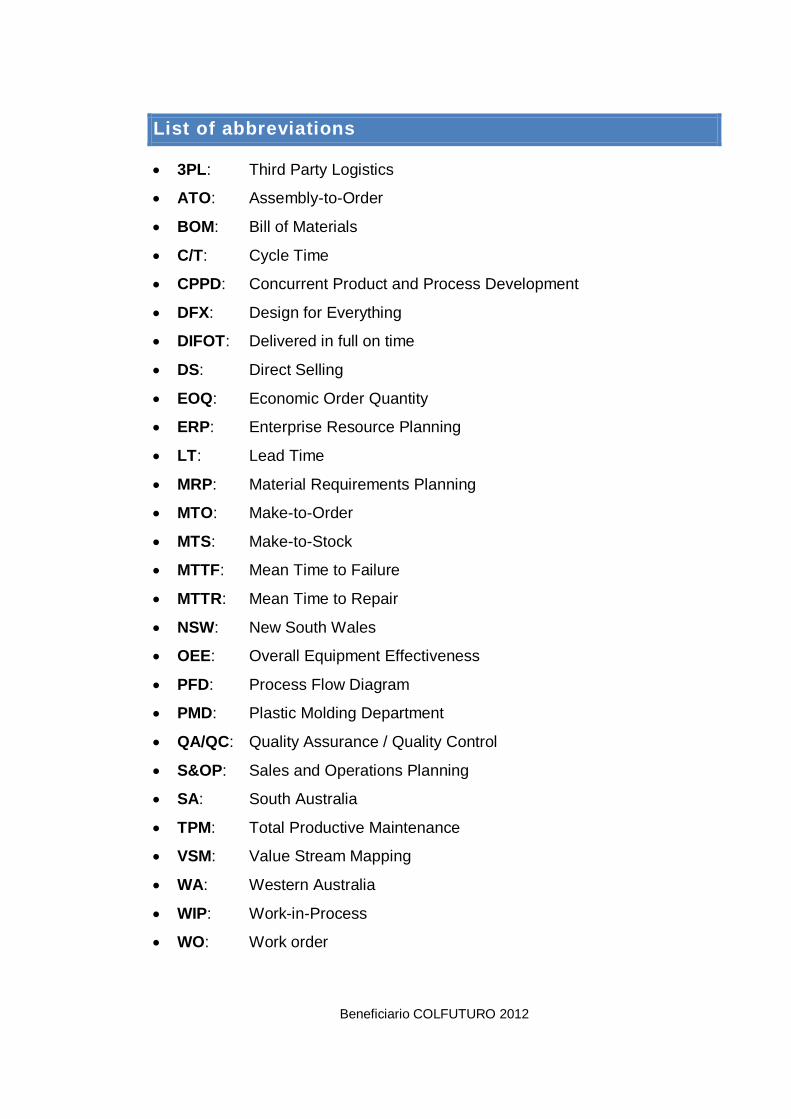
3PL: Third Party Logistics
ATO: Assembly-to-Order
BOM: Bill of Materials
C/T: Cycle Time
CPPD: Concurrent Product and Process Development
DFX: Design for Everything
DIFOT: Delivered in full on time
DS: Direct Selling
EOQ: Economic Order Quantity
ERP: Enterprise Resource Planning
LT: Lead Time
MRP: Material Requirements Planning
MTO: Make-to-Order
MTS: Make-to-Stock
MTTF: Mean Time to Failure
MTTR: Mean Time to Repair
NSW: New South Wales
OEE: Overall Equipment Effectiveness
PFD: Process Flow Diagram
PMD: Plastic Molding Department
QA/QC: Quality Assurance / Quality Control
S&OP: Sales and Operations Planning
SA: South Australia
TPM: Total Productive Maintenance
VSM: Value Stream Mapping
WA: Western Australia
WIP: Work-in-Process
WO: Work order
Beneficiario COLFUTURO 2012
List of appendices
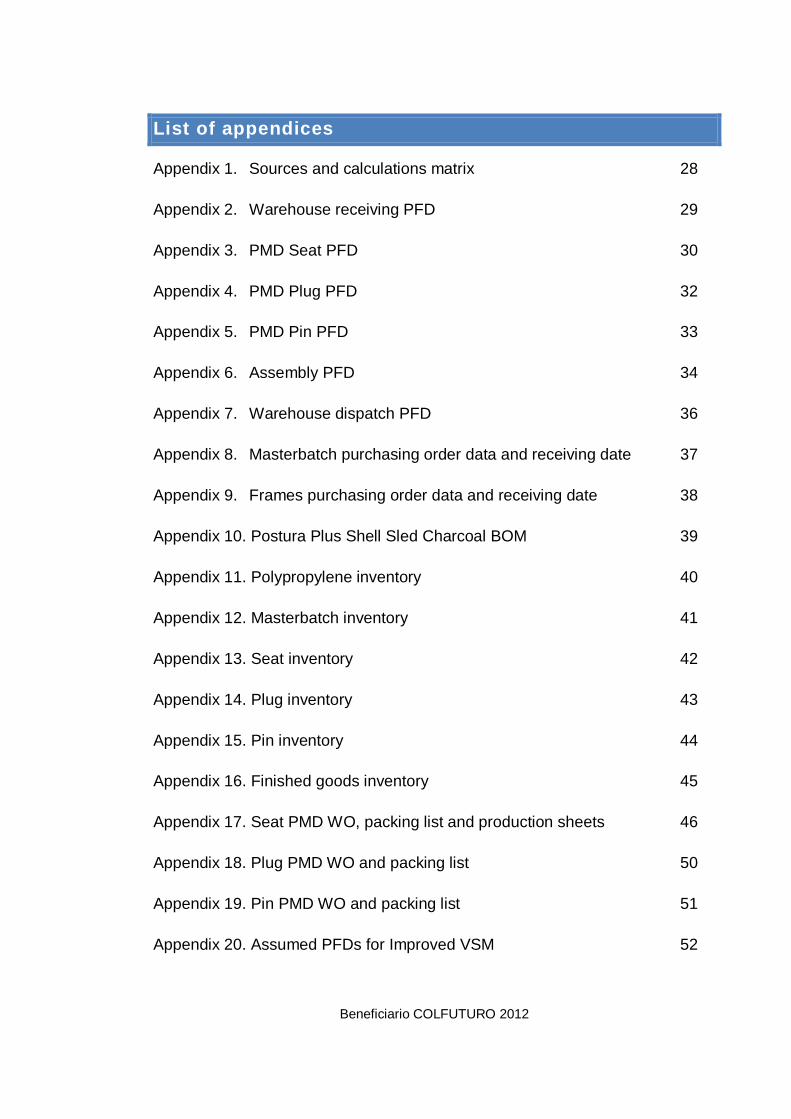
Appendix 1. Sources and calculations matrix 28
Appendix 2. Warehouse receiving PFD 29
Appendix 3. PMD Seat PFD 30
Appendix 4. PMD Plug PFD 32
Appendix 5. PMD Pin PFD 33
Appendix 6. Assembly PFD 34
Appendix 7. Warehouse dispatch PFD 36
Appendix 8. Masterbatch purchasing order data and receiving date 37
Appendix 9. Frames purchasing order data and receiving date 38
Appendix 10. Postura Plus Shell Sled Charcoal BOM 39
Appendix 11. Polypropylene inventory 40
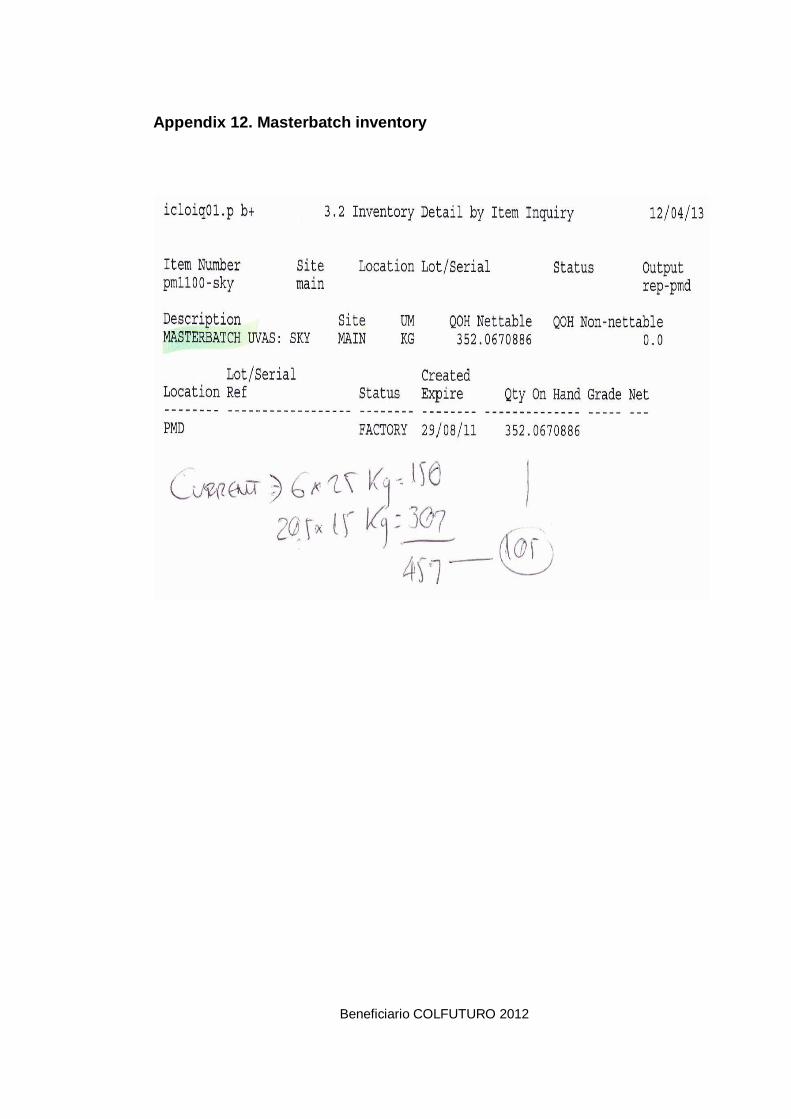
Appendix 12. Masterbatch inventory 41
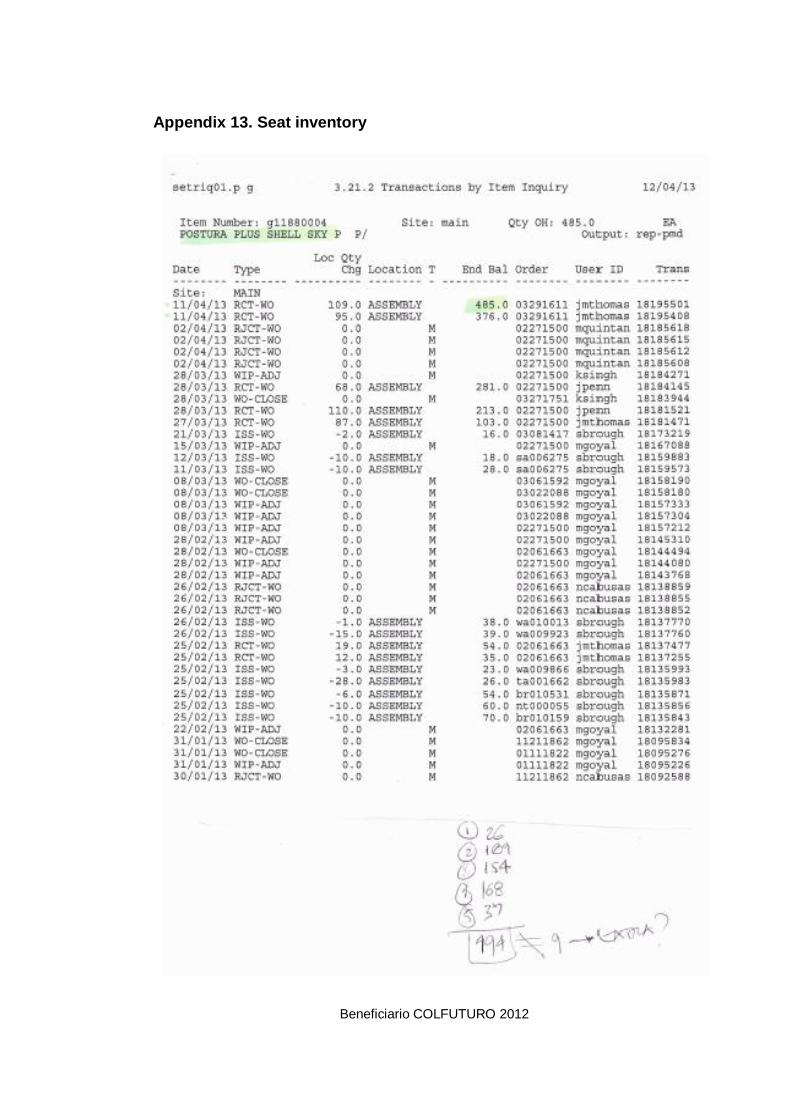
Appendix 13. Seat inventory 42
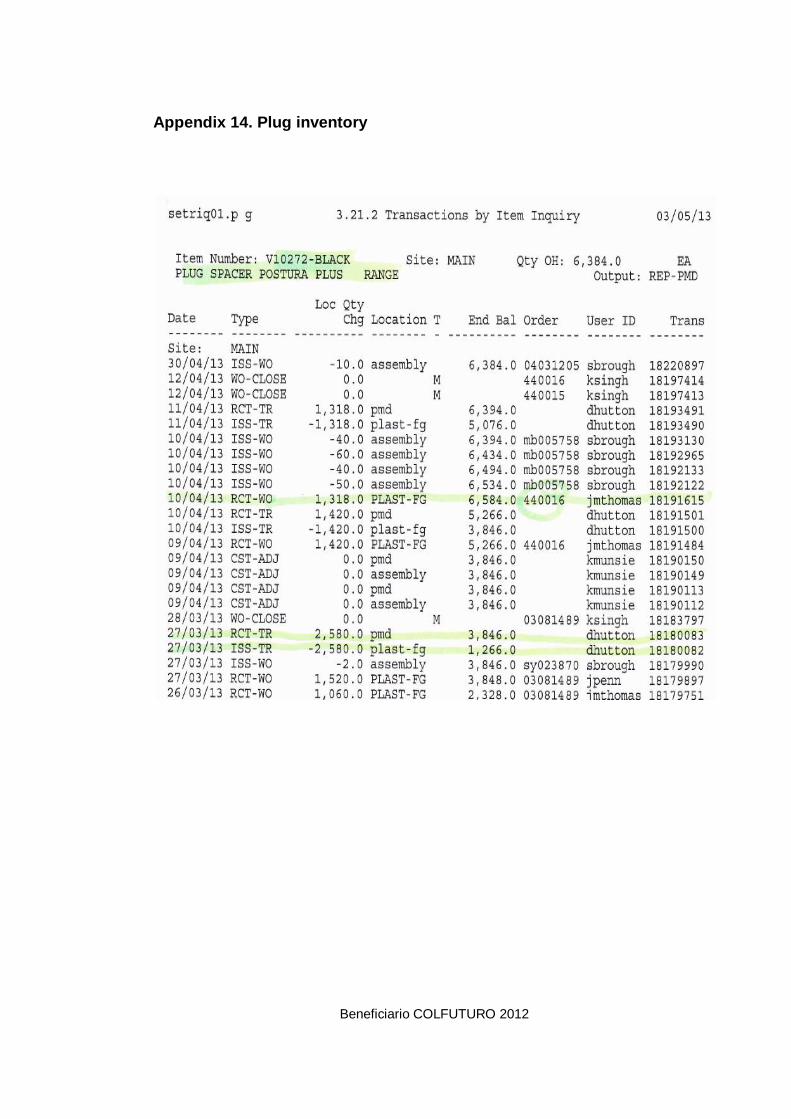
Appendix 14. Plug inventory 43
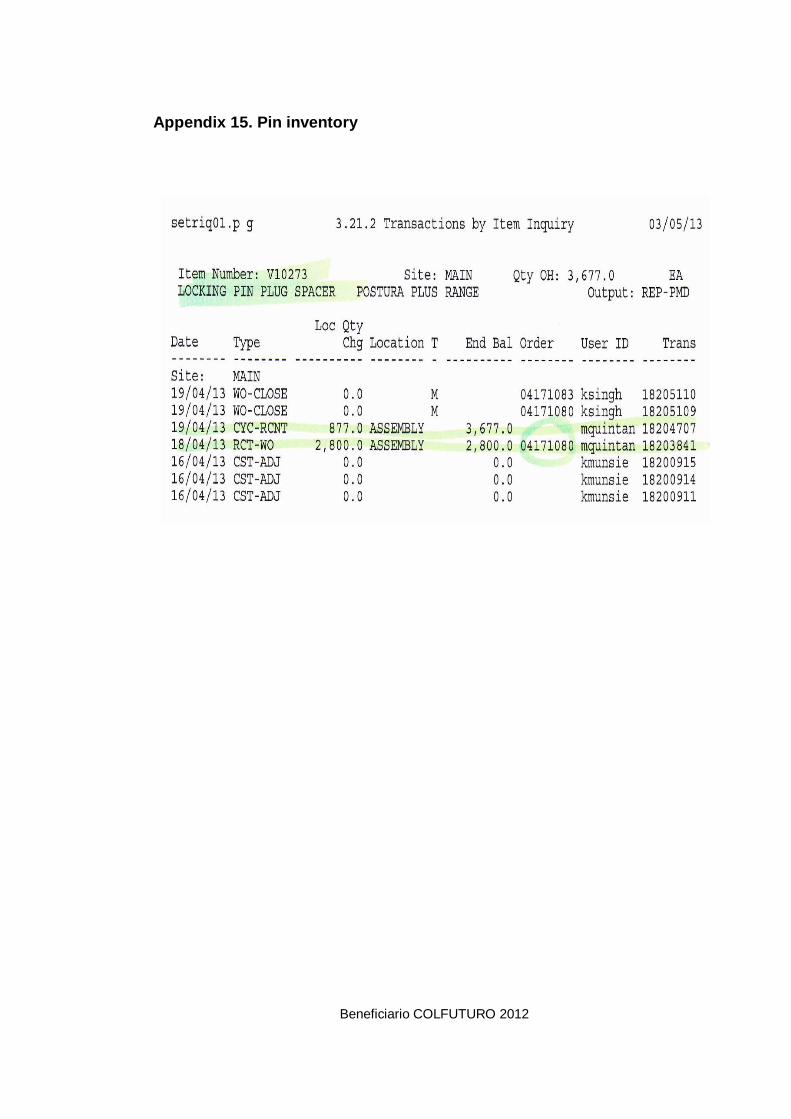
Appendix 15. Pin inventory 44
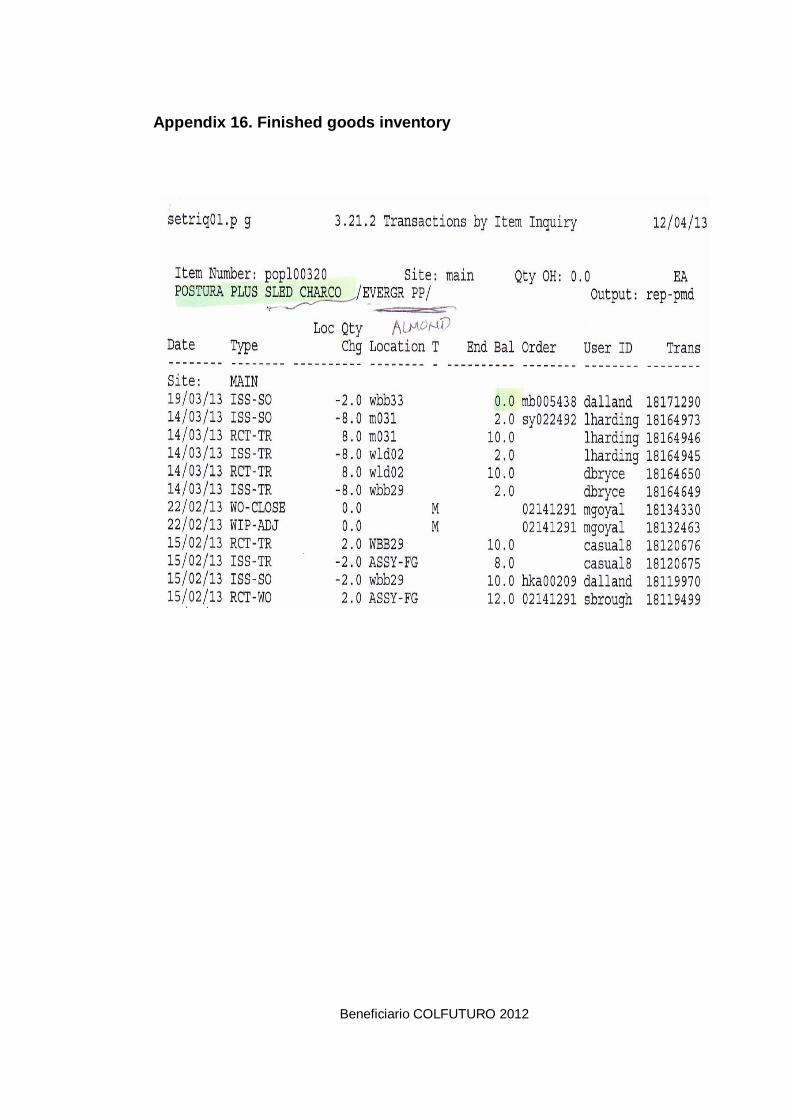
Appendix 16. Finished goods inventory 45
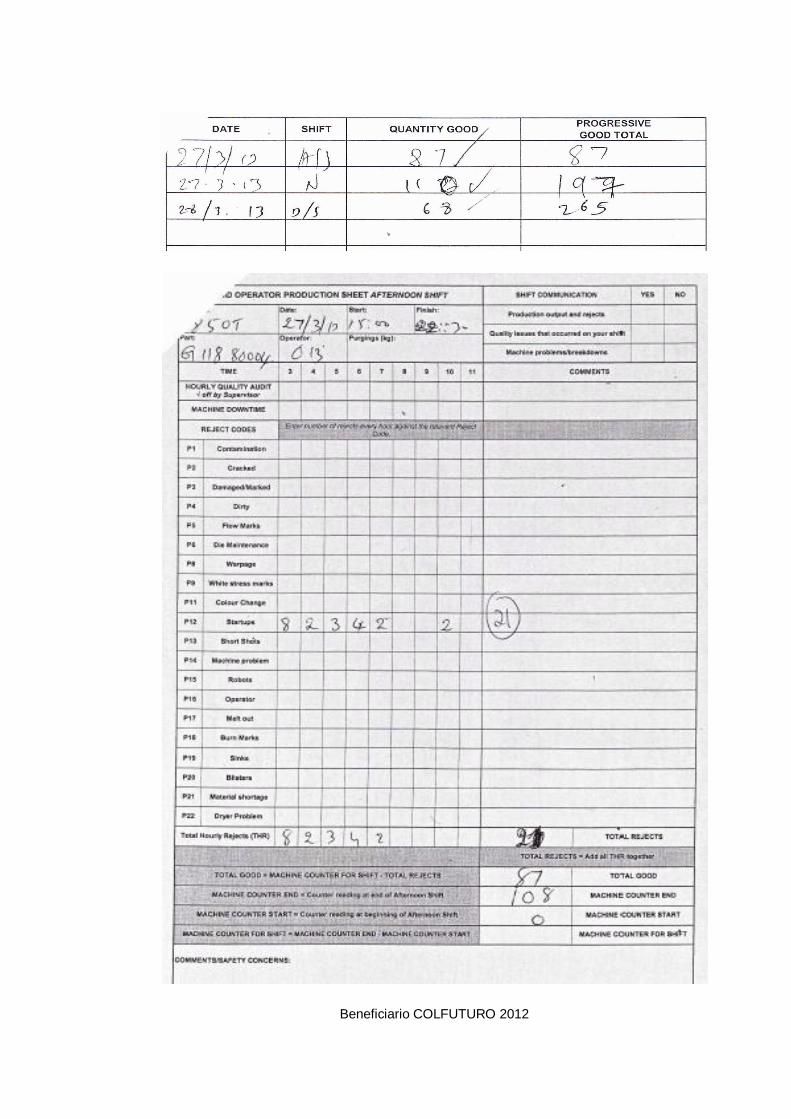
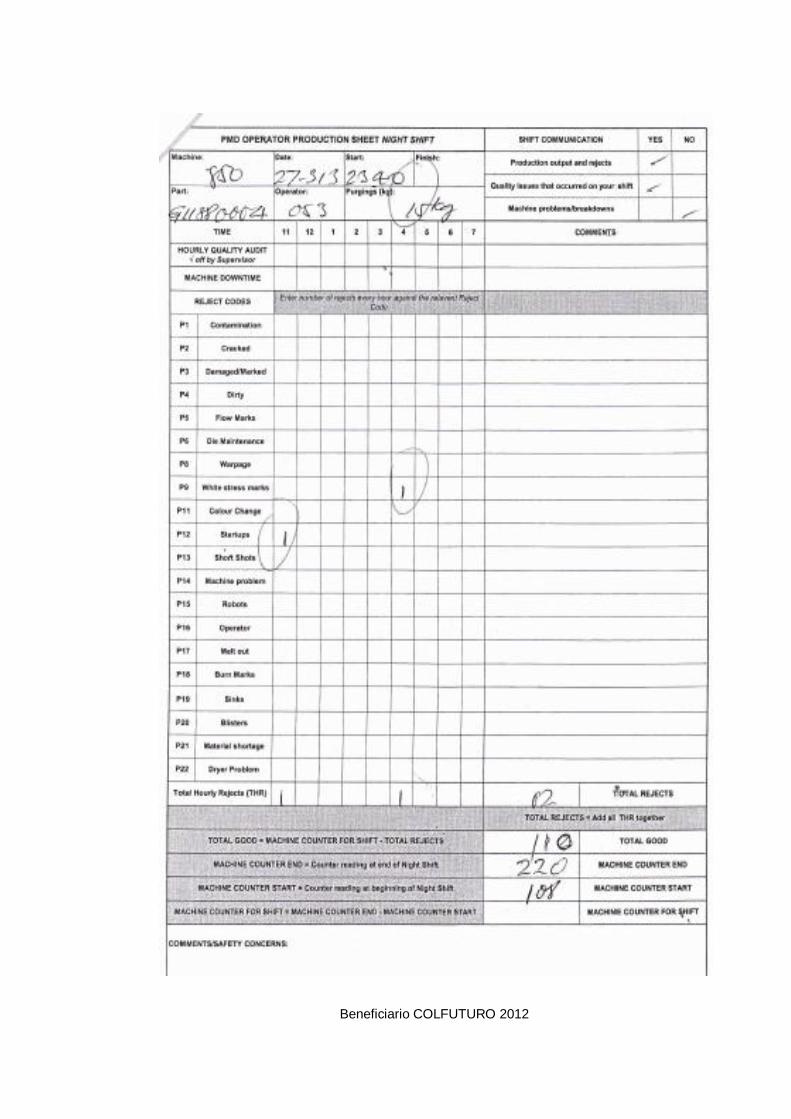
Appendix 17. Seat PMD WO, packing list and production sheets 46
Appendix 18. Plug PMD WO and packing list 50
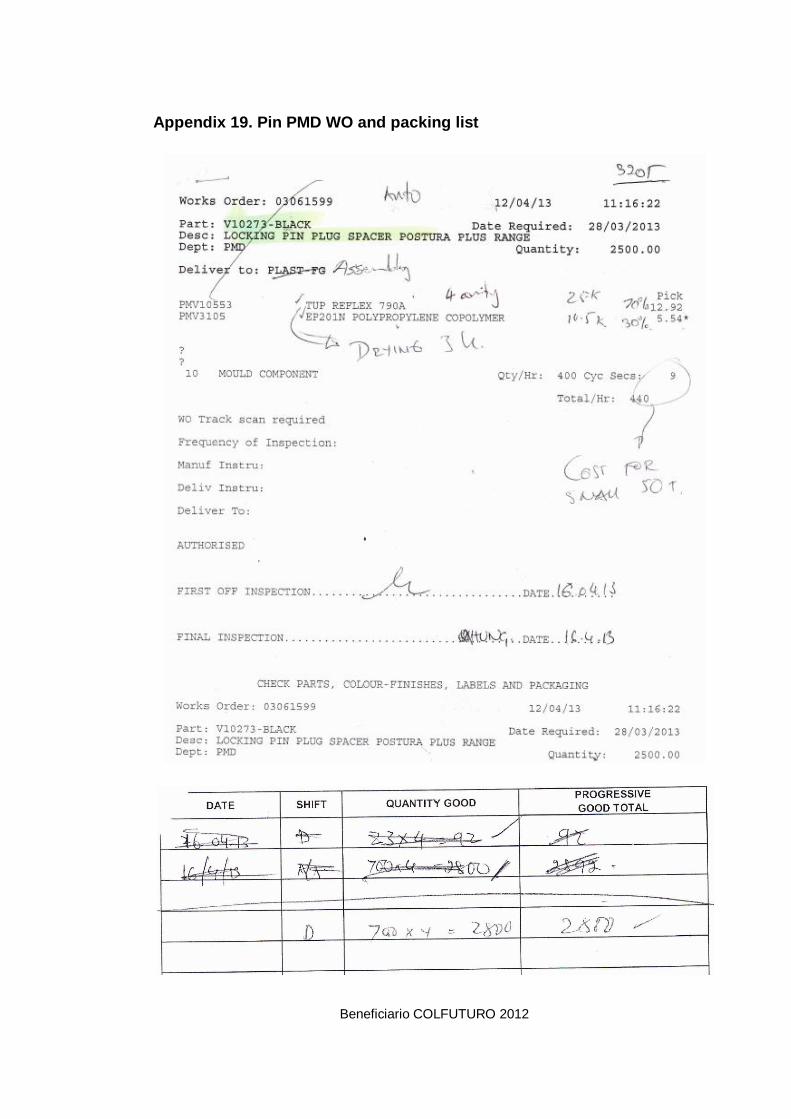
Appendix 19. Pin PMD WO and packing list 51
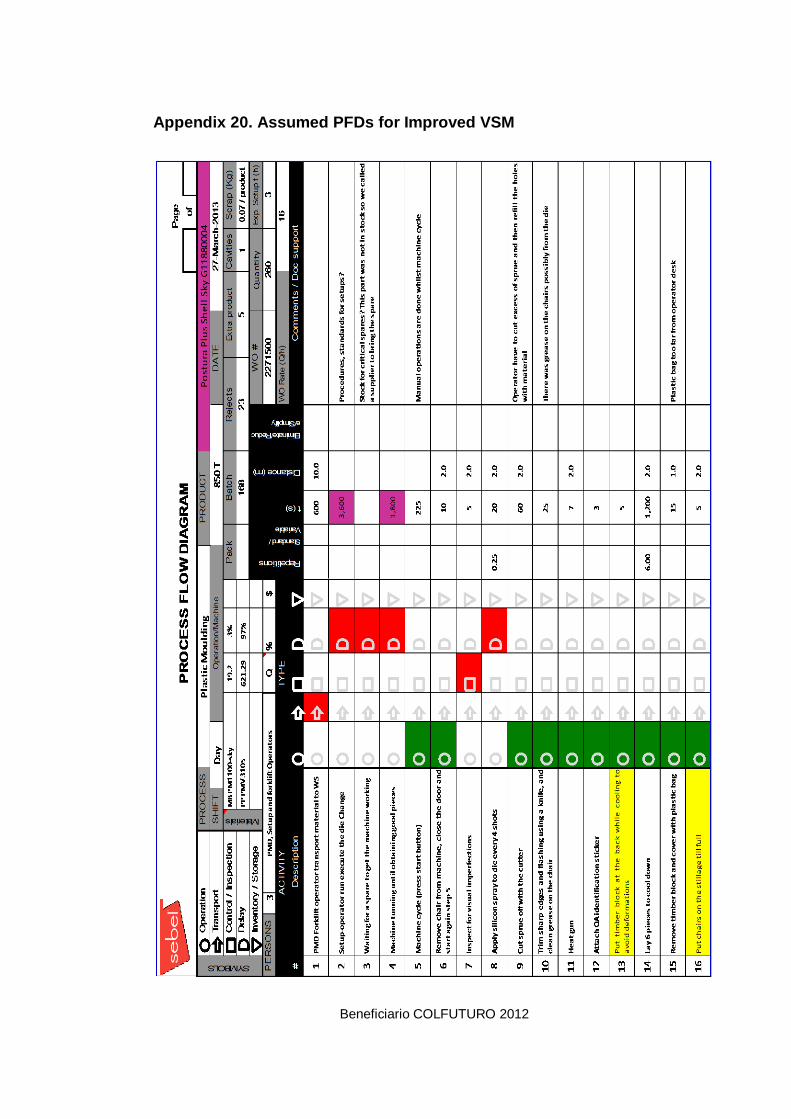
Appendix 20. Assumed PFDs for Improved VSM 52
Beneficiario COLFUTURO 2012
INTRODUCTION
Sebel Furniture was going through radical transformations as a company by
restructuring its business model to optimize their operations and moving to a
new site location. One of organization’s existing problems was the enormous
amount of products and product families, reason why the future model was
looking to reduce and optimize the product families.
The aim of this project was to examine the feasibility of Postura Plus Shell
range (Figure 4), one of the most significant (in terms of sales margin) and
complex family products of the firm (in terms of operations), from the
perspective of its current centralized state and the projected future
decentralized logistics model, as well as identify possible wastes along the
processes by using Value Stream Mapping (VSM), a lean manufacturing
principle focused on detect non-value-added activities to eliminate/reduce
them, shortening thus, the "order-to-cash cycle" of a product. The challenge
was to adopt the new concept of value stream provisions so that the mapping
not only captures material and information flow on a factory level, but
encompasses material and information flow pre/after factory. This exercise was
an essential input for the company to make simulations and benefit/cost
analysis about reducing its lead times and freight cost in two of its main sales
points (Western Australia, WA and Queensland) by decentralizing its assembly
and warehousing operations in these hubs as well as acquiring the figure of a
Third Party Logistics (3PL) for consolidation of its core components in China.
This report briefly describes the company’s profile, project scope and how the
VSM analyses contribute to the company's strategy. Following, a depiction of
the VSM was made for its current and future state, as well as potential Kaizens
were identified. Next, an improved state based on the implementation of
pointed considerations for improvement was made for both, a centralized and a
decentralized logistics model and finally, results and main findings of the
project are mentioned.
Beneficiario COLFUTURO 2012
2. COMPANY PROFILE
“Sebel began in 1951 with the production of Mobo toys and a new furniture
range based around the innovative Stak-a-Bye chair. In the late 1960s the
decision was made to drop the toy side of the business and concentrate
entirely on the furniture range.
The company went on to introduce many innovations, from being the first to
replace wooden chairs at schools with Polypropylene, to classic ergonomic
designs. Since then, and still behind each Sebel product today, is a genuine
manufacturing culture which is focused on making products that have the latest
ergonomics (Form), work at a practical level (Function) and are built to last
(Quality).
In 2011, the organization became part of KI www.ki.com the leading furniture
supplier in the USA for education, healthcare, corporate and government
markets. KI has sales offices and licensed manufacturing facilities throughout
the world, including now Australia, the United States, Canada, Latin America,
Europe, India, China and other Asian countries.”(The website of Sebel)
3. PROJECT DESCRIPTION
WHAT IS VALUE STREAM MAPPING?
“Developed during the work conducted by Taiichi Ohno at Toyota in the 1960’s
and 70‘s, at its basic level VSM is a systematic methodology to identify wasted
time and actions in a manufacturing process. In more recent times VSM it has
been used to re-engineer businesses because it identifies unnecessary effort
and resources to permit simplification and streamlining of operations
processes. It is useful to explain the meaning of several key concepts used in
VSM. These are: what waste is, what constitutes value-adding, along with what
is needless non-value-adding and what is necessary non-value-adding. VSM is
used to investigate processes to identify improvement opportunities lying in
their wastefulness and lack of fluidity.
Beneficiario COLFUTURO 2012
Waste is one of the seven wastes identified by Toyota. These are:
Overproduction: Producing items for which there are no orders.
Waiting Time: Employees standing about. Inventory at stand-still.
Unnecessary Transport: Moving material unnecessarily or long distances.
Over-processing: Using more steps to produce a product than necessary.
Excess Inventory: Retaining unnecessary inventory between process steps.
Unnecessary Movement: Any wasted motion by man or machine.
Defect: Making incorrect product.
Value is from the customer’s perspective, the customer being the person who
uses the output. Value-adding actions and resources are those which create
value for the customer. Non-value-adding is everything done in the process
which contributes no value for the customer but which they are forced to pay for
when they buy the product or service. Necessary non-value-adding are those
actions in a process that must be done to make the product but create no value
for the customer. Unnecessary non-value-adding is removed and necessary
non-value-adding is minimized to the least possible.
Value Stream Mapping Methodology
In VSM we follow a process from start to finish monitoring and measuring what
happens within, and between, each process step. For each process step we
record the variety of resources used in the step, the amount of their usage and
the range of times each resource is in use as a block of information specific to
that step. The measured variables are collected together in a ‘variable block’.
From the information collected during data gathering the process is drawn as a
flow diagram showing the times and resources used at each step and the time
delay between each step. This diagram is called the ‘current state map’.
Inventory movements between steps are identified by the ‘I’ inside a triangle.
Under the triangle is noted the range of times the inventory can take to be
moved. A visualization of the location of value-add and non-value-add steps is
presented as a line across the bottom of the page which jumps up during a
Beneficiario COLFUTURO 2012
value-adding step and stays low for all other times. The current state map is
scrutinized step by step to identify which of the functions and actions performed
in the step/process add ‘customer-value’ and which do not. The non-value-
adding actions and resources are analyzed to find where they can be
minimized through time-saving and cost-saving improvements. A secondary
benefit of timing the process steps and measuring the rate of throughput is
identification of the bottleneck steps. The bottlenecks can be redesigned to lift
their capacity and so increase the output rate of the whole process. The
reengineered process is drawn on a new flow chart known as the ‘future state
map’. It shows all the steps and information flows in a redesigned, simplified
and more efficient process.
Investigation
VSM requires spending time in the workplace recording the details of people,
product, equipment and information movements. It is necessary to record and
time the range of variables that occur in each process step during the
operation. It also requires viewing written records related to the process in
order to record dates, quantities, delays, stoppages, breakdowns, operating
decisions, absentees, etc that impacted on the performance of the operation
during the period being analyzed. The believability of the analysis is only as
good as its completeness of its content and the truthfulness and honesty it
contains. When there are provable facts extracted from documented evidence
and recorded site observation there can be belief in the findings from the
investigation.
Analysis
The worth of VSM becomes self-evident during the analysis phase. Once a
business or manufacturing process is drawn as a series of steps and described
in numerical terms, the inherent oddities and inconsistencies become evident.
The first analysis performed is to compute a ratio of total customer-value-
adding time to total process time to see how customer-effective the process is.
Often this figure is in the single digits. A low customer-value-adding ratio
Beneficiario COLFUTURO 2012
indicates a process design without the customer’s wishes being considered.
The fortunate aspect of non-customer-oriented processes is the great scope
offered to cut big amounts of waste and cost from them. Other important factors
to identify during the analysis are the variability between good and poor
performance in each of the process steps and the time that inventory is
standing still between steps. Poor inventory speed is an indicator of too much
work-in-progress not leveled to the bottleneck rate. The problems identified in
the process are quantified in terms of the customer-non-value-adding time they
take.
Identifying Improvements
Opportunities for improvement readily present themselves as the analysis is
conducted. When developing proposals it is ideal if that the users of the
process are included in identifying the solutions so they take ownership for the
future implementation. During the analysis simplifications in process steps are
identified, procedural changes to stop wasted actions show themselves, and
equipment and process modifications needed to increase throughput rates
become evident. The selected improvements are included in the redesigned
‘future state map’ of the process.” (Sondalini.2009)
PROJECT BACKGROUND
Sebel was drastically modifying its business model, which between others,
included a reduction of its products range in order to simplify its operations, a
downsizing of its production facilities and a re-design of its supply chain for its
core products. This reengineering process implied a study of the core products
in the current state Value Stream compared to a future state Value Stream in a
centralized and decentralized logistics model.
The project consisted of analyzing the manufacturing operations of the
company as well as its process flows and supply chains, to define its different
type of wastes and actual value-added time, in order to identify potential
Beneficiario COLFUTURO 2012
Kaizens for the company to improve its performance and reduce its costs and
total Lead Time.
Expected outcomes from the project were as follows:
1 Identified organizational processes or activities as potentially wasteful
2 The value chain broken down into its constituent processes/activities
3 Established relationship between processes/activities
4 Estimated average working time required to complete each process/activity
5 Identified average waiting time between processes/activities
6 Calculated total working time, wasted time, and efficiency
7 Analysis of current and future state model
8 Optional: A "what if?" alternative (a second such picture, "optimal future
state threshold" Value Stream Map). If one or more changes were
instituted, what would the future state look like in terms of total working
time, wasted time, and efficiency?
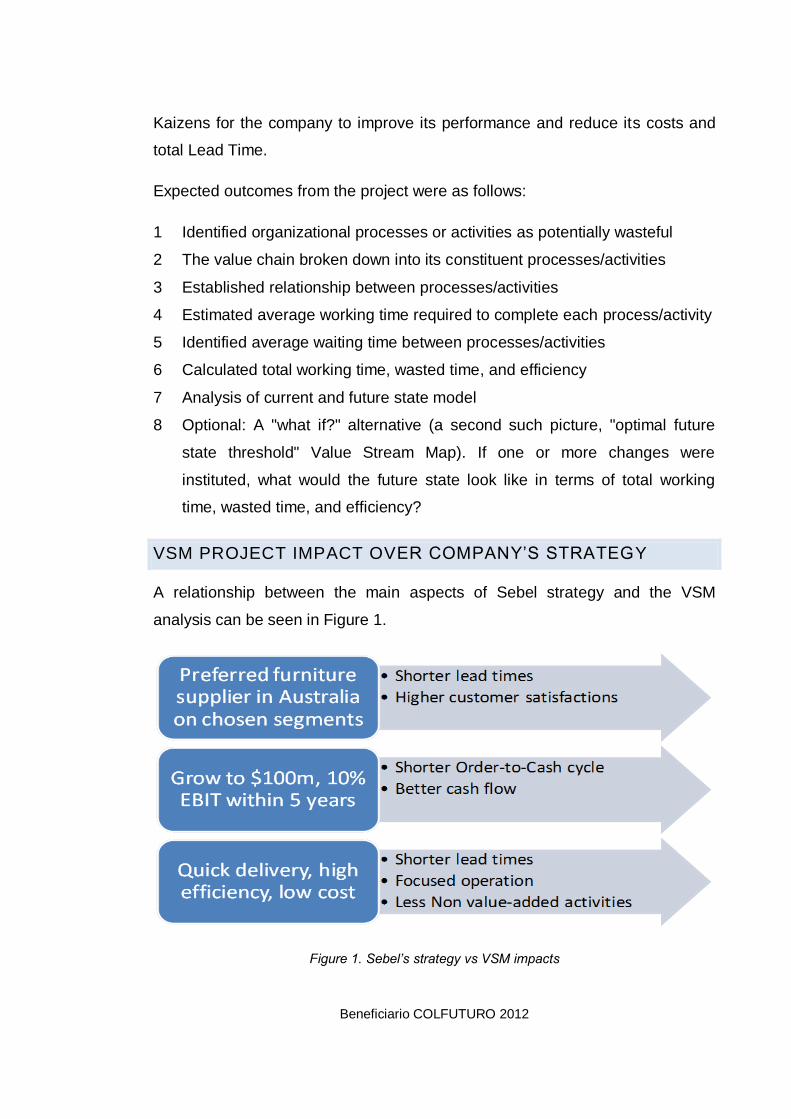
VSM PROJECT IMPACT OVER COMPANY’S STRATEGY
A relationship between the main aspects of Sebel strategy and the VSM
analysis can be seen in Figure 1.
Figure 1. Sebel’s strategy vs VSM impacts
Beneficiario COLFUTURO 2012
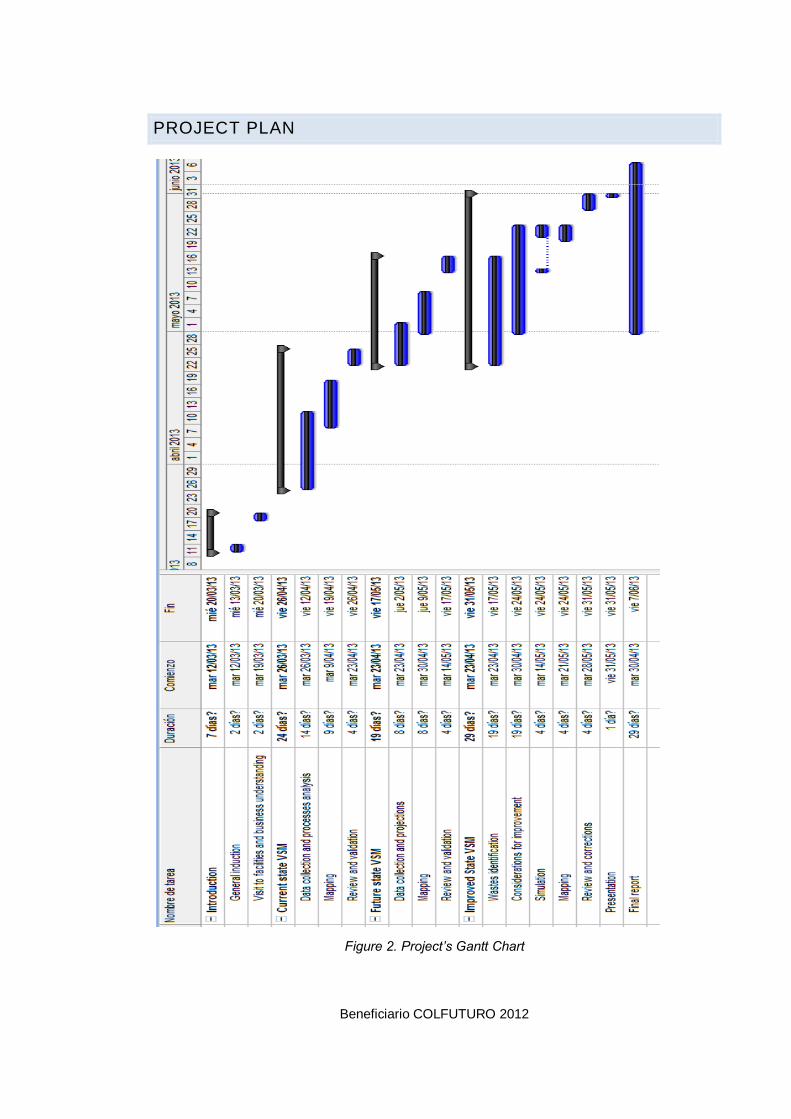
PROJECT PLAN
Figure 2. Project’s Gantt Chart
Beneficiario COLFUTURO 2012
4. MATERIALS AND METHODS
During the development of this project an office space with a desktop
computer, as well as office supplies were assigned for Sebel.
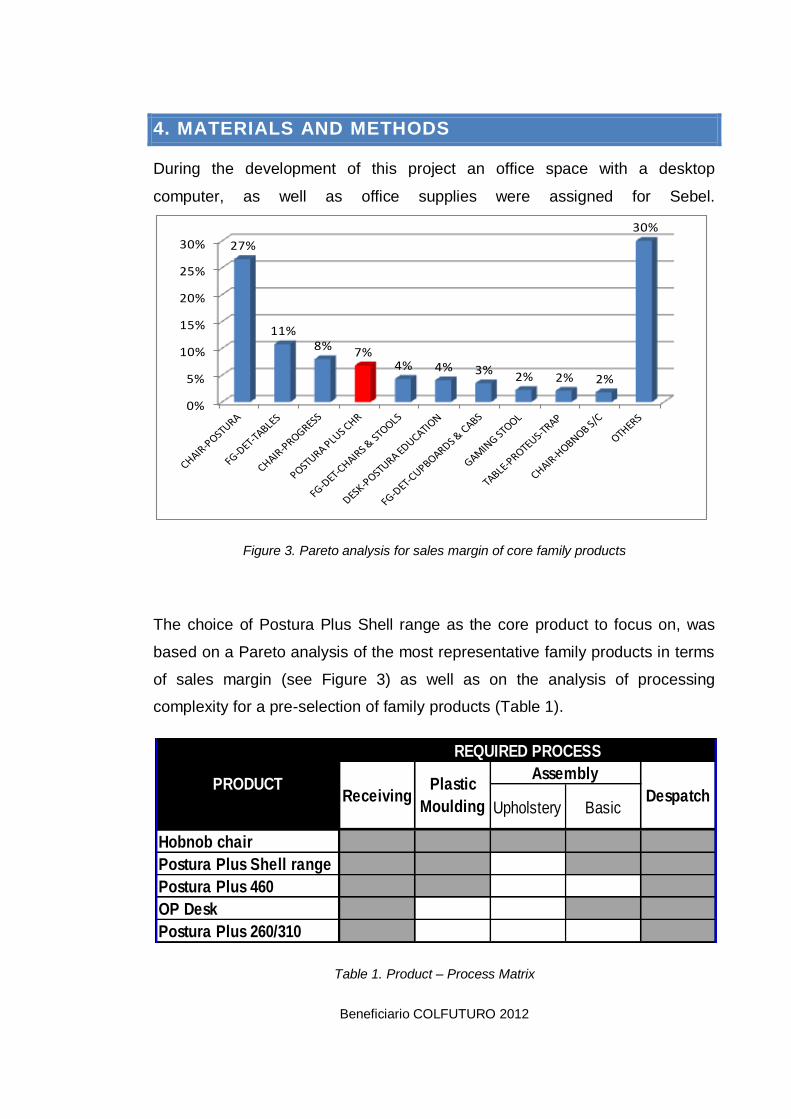
Figure 3. Pareto analysis for sales margin of core family products
The choice of Postura Plus Shell range as the core product to focus on, was
based on a Pareto analysis of the most representative family products in terms
of sales margin (see Figure 3) as well as on the analysis of processing
complexity for a pre-selection of family products (Table 1).
Table 1. Product – Process Matrix
0%
5%
10%
15%
20%
25%
30% 27%
11%8% 7%
4% 4% 3%2% 2% 2%
30%
Upholstery Basic
Hobnob chair
Postura Plus Shell range
Postura Plus 460
OP Desk
Postura Plus 260/310
PRODUCT
REQUIRED PROCESS
ReceivingPlastic
MouldingDespatch
Assembly
Beneficiario COLFUTURO 2012
The method for the construction of the VSM analysis was as follows:
1 Brief explanation of the situation through interview with functional
managers (as shown in Appendix 1).
2 Data collection: For collection of times and distances data at the plant, I
adapted the standard tool of Process Flow Diagram (PFD) to the specific
needs of the company and the project (see Appendices 2 to 7) to use it for
on-site inspections. Other information was obtained from the MFG-Pro
(organizational MRP software) consultations, functional performance
reports, documented records, photos, videos, interviews with processes
responsible and finally, some assumptions were made, mainly regarding
future projections and an improved state (Appendix 1).
3 Process analysis and Mapping: Collected data were typed into
spreadsheets as well as the drawing of the VSM. I decided to utilize MS
Excel, given the ease to link processes data from PFDs to the VSM as well
as between the different scenarios of the VSM through the formulation of
the cells. Therefore not only VSM picture, but a basic model was created to
modify according to the business needs and to be used on upcoming
events and other core family-products. Nevertheless, this information could
be easily incorporated into a MS Visio file or an Arena simulation.
4 Review and validation: Periodical reports for review were e-mailed to
Sebel's Supervisors, as well as several meetings were held for progress
validation.
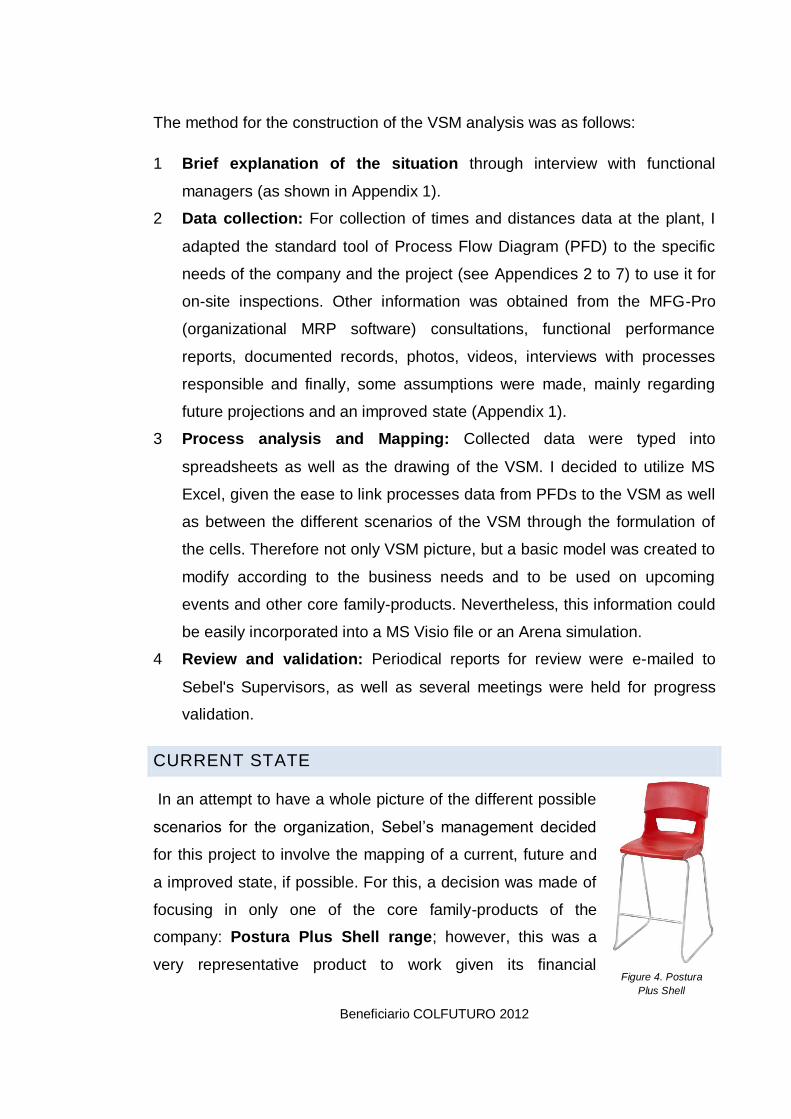
CURRENT STATE
In an attempt to have a whole picture of the different possible
scenarios for the organization, Sebel’s management decided
for this project to involve the mapping of a current, future and
a improved state, if possible. For this, a decision was made of
focusing in only one of the core family-products of the
company: Postura Plus Shell range; however, this was a
very representative product to work given its financial Figure 4. Postura
Plus Shell
Beneficiario COLFUTURO 2012
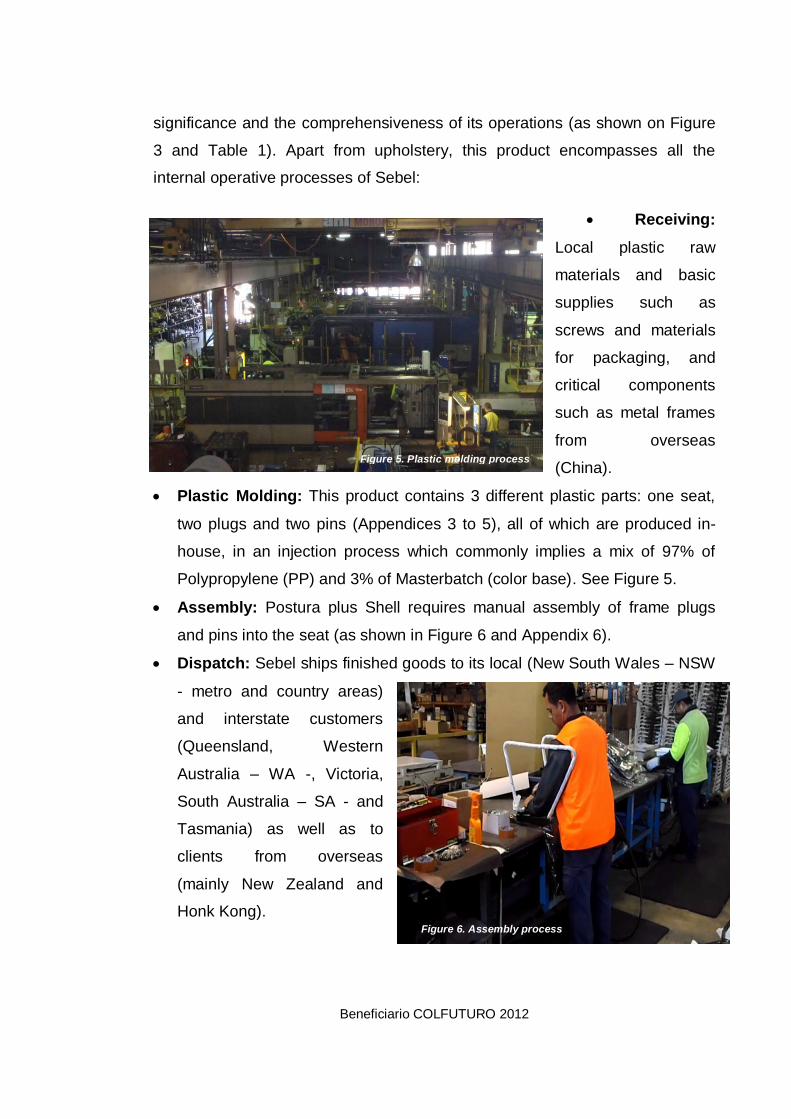
significance and the comprehensiveness of its operations (as shown on Figure
3 and Table 1). Apart from upholstery, this product encompasses all the
internal operative processes of Sebel:
Receiving:
Local plastic raw
materials and basic
supplies such as
screws and materials
for packaging, and
critical components
such as metal frames
from overseas
(China).
Plastic Molding: This product contains 3 different plastic parts: one seat,
two plugs and two pins (Appendices 3 to 5), all of which are produced in-
house, in an injection process which commonly implies a mix of 97% of
Polypropylene (PP) and 3% of Masterbatch (color base). See Figure 5.
Assembly: Postura plus Shell requires manual assembly of frame plugs
and pins into the seat (as shown in Figure 6 and Appendix 6).
Dispatch: Sebel ships finished goods to its local (New South Wales – NSW
- metro and country areas)
and interstate customers
(Queensland, Western
Australia – WA -, Victoria,
South Australia – SA - and
Tasmania) as well as to
clients from overseas
(mainly New Zealand and
Honk Kong).
Figure 5. Plastic molding process
Figure 6. Assembly process
Beneficiario COLFUTURO 2012
Beneficiario COLFUTURO 2012
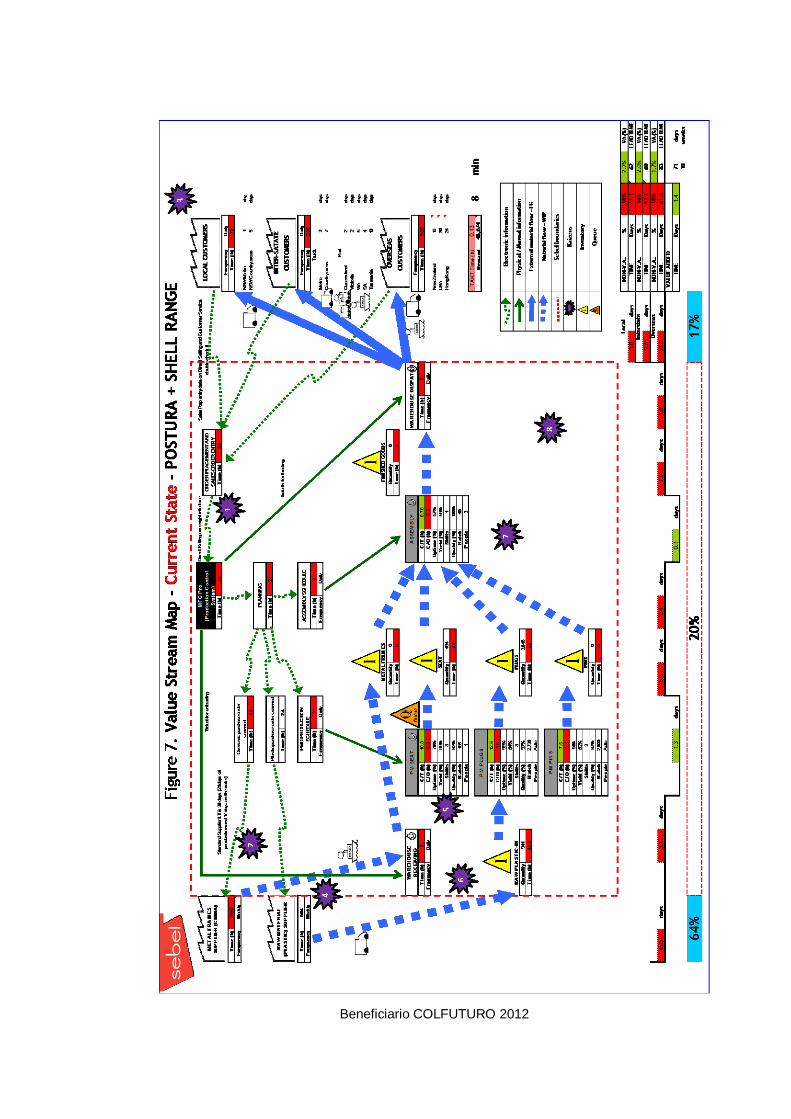
This general view about the business corresponded to the first part of the
project, a general induction for a basic understanding of the business. After
this, data collection and analysis stage began in the order in which Sebel
executed its processes/activities; as a result, a description of the current state
of the company’s VSM for Postura Plus Shell (Figure 7) was as follows:
1. A customer accepted, commonly by email or fax, a quote from Sebel and
during the course of the day, the Sales Rep enters the accepted quote into
Direct Selling, DS (organizational software for Sales and Customer Service
processes). Usually the next day, Customer service department carries out
a double-checking of basic data (product codes, etc.) uploaded from Sales
and places an official order on the system. However, given corporate
policies, orders were accepted indiscriminately regardless type of
customer, product or quantity ordered, normally offering 6 weeks or less of
LT to the customer, which resulted in low service levels and represented
high inefficiencies for the firm.
2. There is an overnight interface process between DS and MFG-Pro
(corporate MRP software), which groups and incorporates new sales orders
into MFG-Pro as new material requirements. This process represented one
more waiting day.
3. Planners release purchasing orders according to stock level and suppliers'
LT. It could take around 1 to 2 days for obtain a response from
suppliers, depending on the component. Parallel to it, internal Work Orders
(WO) can be released for scheduling of Plastic Molding Department (PMD),
assembly or dispatch. Purchasing orders are not only placed as a result of
sales orders but also depending on a minimum safety-stock and suppliers
usually deliver partial shipments. For purposes of this exercise, I tracked an
specific order for which the total supplier' LT was 6.5 weeks (Appendices
8 and 9), which represented an overdue on the time promised to the
customer and 64% of the total LT on the VSM for this order, as well as a
significant volume of Work-in-Process (WIP), since production of plastic
seats for this order was scheduled and ran regardless the lack of metal
Beneficiario COLFUTURO 2012
frames for assembly of the chairs. Additionally, it seems that one of the
reasons for this order of frames to take such a long time was also a special
event (Chinese year celebrations), which should have been considered
in advance for Sebel on its MRP process.
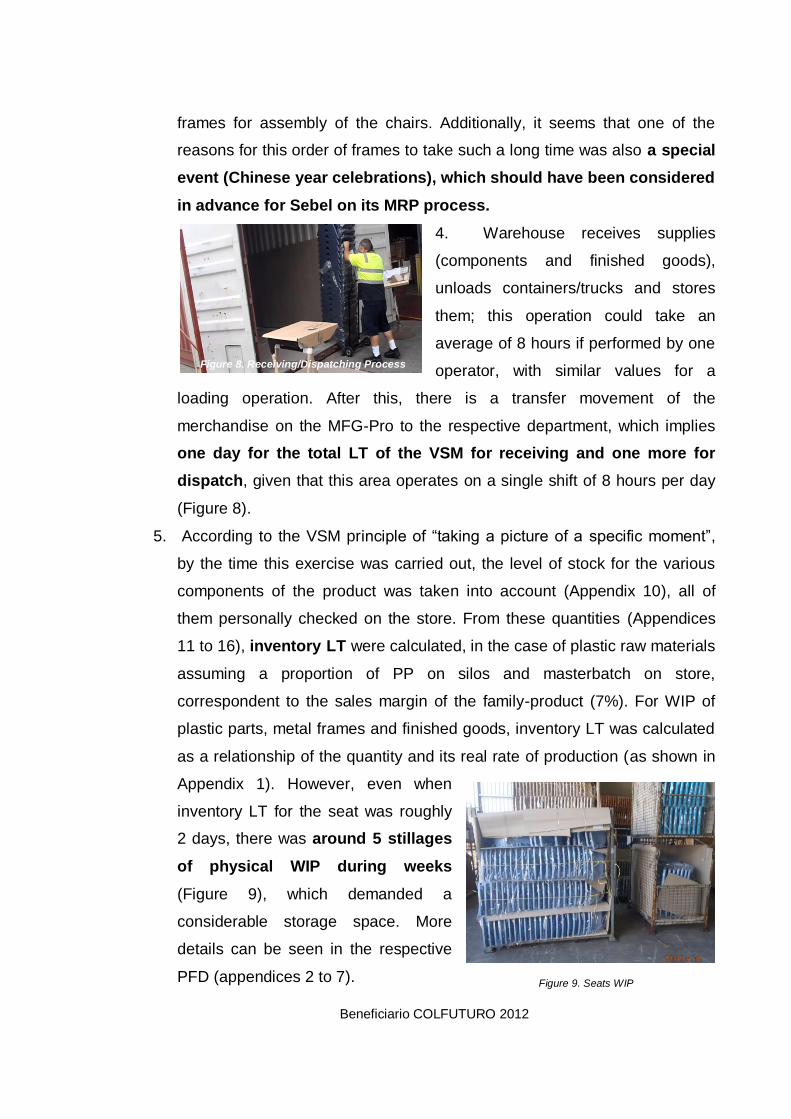
4. Warehouse receives supplies
(components and finished goods),
unloads containers/trucks and stores
them; this operation could take an
average of 8 hours if performed by one
operator, with similar values for a
loading operation. After this, there is a transfer movement of the
merchandise on the MFG-Pro to the respective department, which implies
one day for the total LT of the VSM for receiving and one more for
dispatch, given that this area operates on a single shift of 8 hours per day
(Figure 8).
5. According to the VSM principle of “taking a picture of a specific moment”,
by the time this exercise was carried out, the level of stock for the various
components of the product was taken into account (Appendix 10), all of
them personally checked on the store. From these quantities (Appendices
11 to 16), inventory LT were calculated, in the case of plastic raw materials
assuming a proportion of PP on silos and masterbatch on store,
correspondent to the sales margin of the family-product (7%). For WIP of
plastic parts, metal frames and finished goods, inventory LT was calculated
as a relationship of the quantity and its real rate of production (as shown in
Appendix 1). However, even when
inventory LT for the seat was roughly
2 days, there was around 5 stillages
of physical WIP during weeks
(Figure 9), which demanded a
considerable storage space. More
details can be seen in the respective
PFD (appendices 2 to 7).
Figure 8. Receiving/Dispatching Process
Figure 9. Seats WIP
Beneficiario COLFUTURO 2012
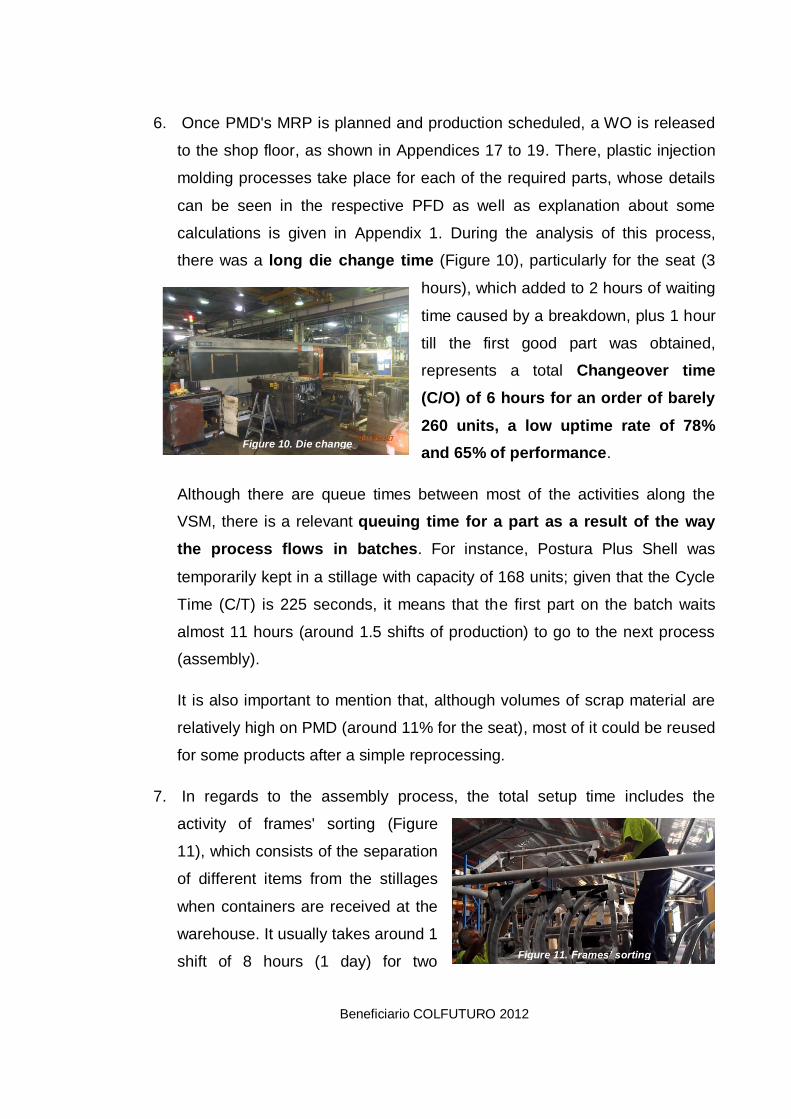
6. Once PMD's MRP is planned and production scheduled, a WO is released
to the shop floor, as shown in Appendices 17 to 19. There, plastic injection
molding processes take place for each of the required parts, whose details
can be seen in the respective PFD as well as explanation about some
calculations is given in Appendix 1. During the analysis of this process,
there was a long die change time (Figure 10), particularly for the seat (3
hours), which added to 2 hours of waiting
time caused by a breakdown, plus 1 hour
till the first good part was obtained,
represents a total Changeover time
(C/O) of 6 hours for an order of barely
260 units, a low uptime rate of 78%
and 65% of performance.
Although there are queue times between most of the activities along the
VSM, there is a relevant queuing time for a part as a result of the way
the process flows in batches. For instance, Postura Plus Shell was
temporarily kept in a stillage with capacity of 168 units; given that the Cycle
Time (C/T) is 225 seconds, it means that the first part on the batch waits
almost 11 hours (around 1.5 shifts of production) to go to the next process
(assembly).
It is also important to mention that, although volumes of scrap material are
relatively high on PMD (around 11% for the seat), most of it could be reused
for some products after a simple reprocessing.
7. In regards to the assembly process, the total setup time includes the
activity of frames' sorting (Figure
11), which consists of the separation
of different items from the stillages
when containers are received at the
warehouse. It usually takes around 1
shift of 8 hours (1 day) for two
Figure 10. Die change
Figure 11. Frames’ sorting
Beneficiario COLFUTURO 2012
people to classify a container (6 stillages). Given that the analyzed WO was
for only 96 units, the assumed time corresponds to one stillage, which is
almost one hour and a half. This time plus the real time spent to setup the
assembly line for a new product, represents a total C/O time of 2 hours,
which, once again, given such as small WO, has a negative impact on
the process uptime rate (57%) and performance (55%).
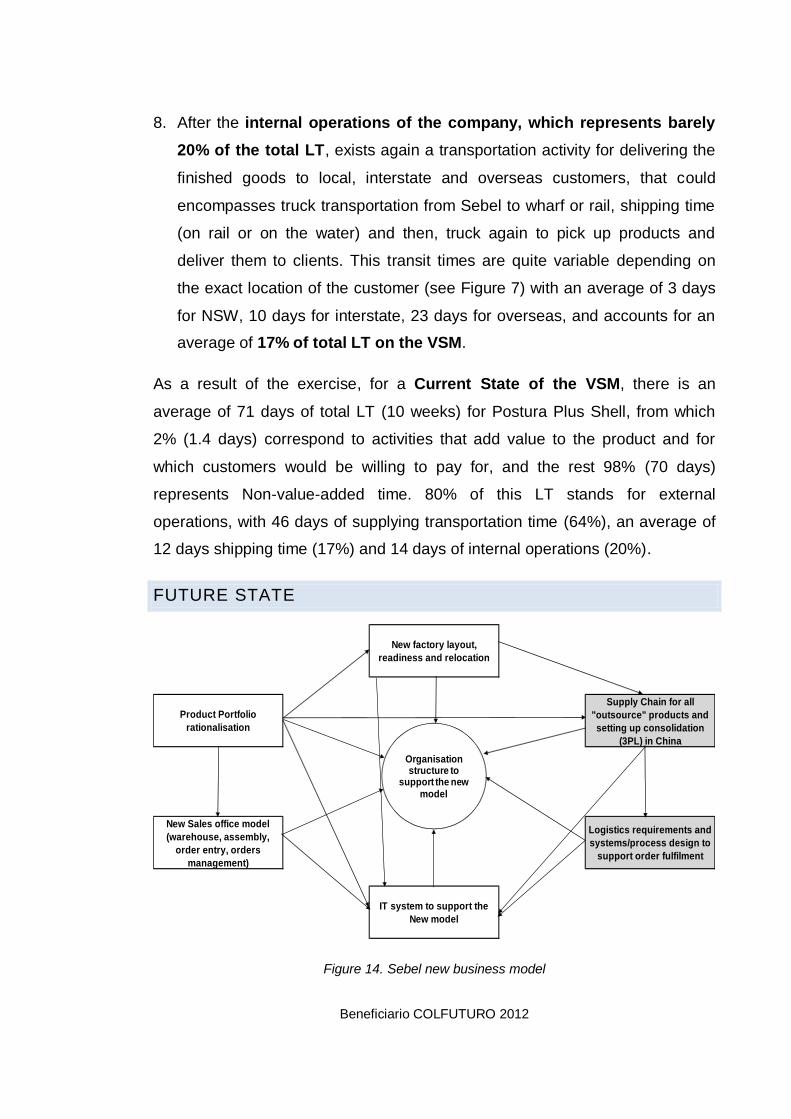
The design of the chair is complex and,
even when during the molding process
seats require, between others, manual
operations such as putting a timber block at
the back during the cooling time to avoid
deformations (as shown in Figure 12), the
assembly liaisons (frame, plugs and pins) are not simple and demands
excess of handle time and tooling such as hammers to align components.
Additionally, this is a modular design which obtains different product
references using same components by only changing the frame; however,
plugs and pins are not required for the product functionality of this particular
reference (sled), so their incorporation into the product means overdesign
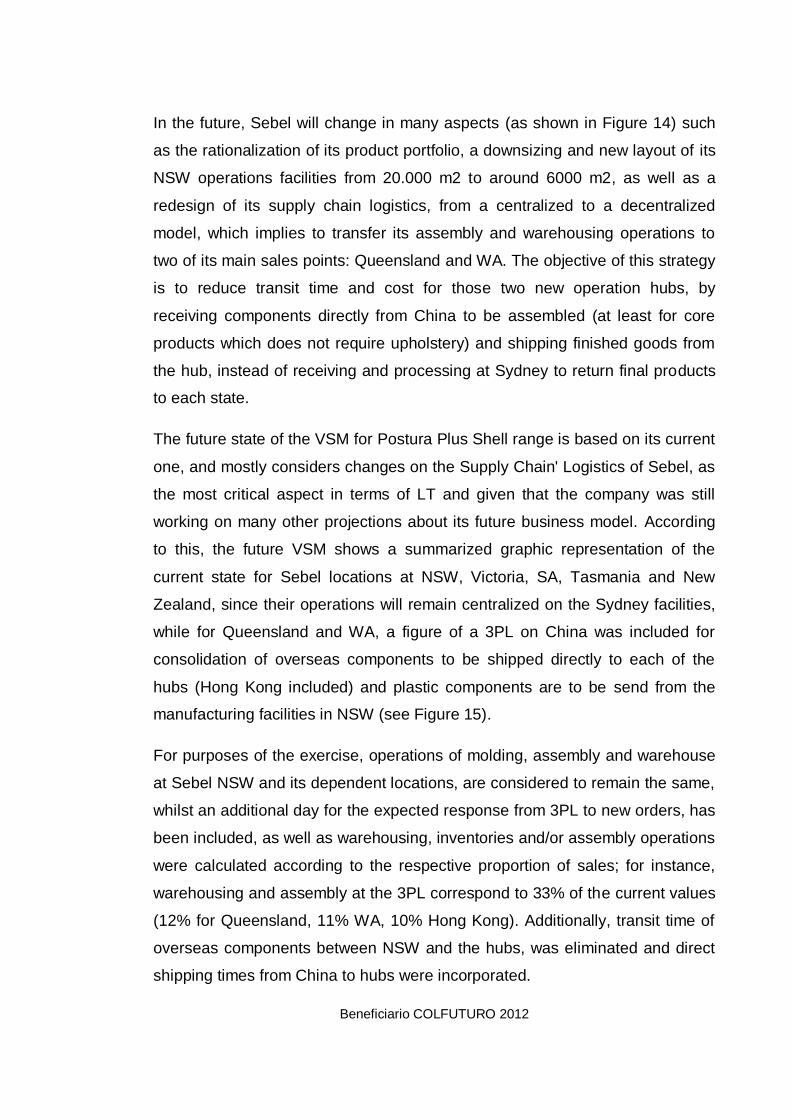
and overproduction, with all the respective costs' implications. Moreover,
chairs are grouped in stacks of 5 units, which, depending on the order, are
covered with a plastic bag tied on the
bottom, and heated into an oven. However,
given the dimension of the containers, this
operation is frequently undone at the
warehouse in order to fit more chairs per
stack, which means a waste of time,
energy, material and money.
Unlike the PMD C/T of almost 11 hours for a batch of 168 seats of Postura
Plus Shell, assembly works in batches of around 40 units (C/T of barely 47
min) which depicts a lack of production rhythm (Takt time) and could
represent a bottleneck.
Figure 12. PMD Manual operation
Figure 13. Assembly sequence
Beneficiario COLFUTURO 2012
8. After the internal operations of the company, which represents barely
20% of the total LT, exists again a transportation activity for delivering the
finished goods to local, interstate and overseas customers, that could
encompasses truck transportation from Sebel to wharf or rail, shipping time
(on rail or on the water) and then, truck again to pick up products and
deliver them to clients. This transit times are quite variable depending on
the exact location of the customer (see Figure 7) with an average of 3 days
for NSW, 10 days for interstate, 23 days for overseas, and accounts for an
average of 17% of total LT on the VSM.
As a result of the exercise, for a Current State of the VSM, there is an
average of 71 days of total LT (10 weeks) for Postura Plus Shell, from which
2% (1.4 days) correspond to activities that add value to the product and for
which customers would be willing to pay for, and the rest 98% (70 days)
represents Non-value-added time. 80% of this LT stands for external
operations, with 46 days of supplying transportation time (64%), an average of
12 days shipping time (17%) and 14 days of internal operations (20%).
FUTURE STATE
Figure 14. Sebel new business model
IT system to support the
New model
Product Portfolio
rationalisation
New factory layout,
readiness and relocation
Supply Chain for all
"outsource" products and
setting up consolidation
(3PL) in China
New Sales office model
(warehouse, assembly,
order entry, orders
management)
Logistics requirements and
systems/process design to
support order fulfilment
Organisation structure to
support the new model
Beneficiario COLFUTURO 2012
In the future, Sebel will change in many aspects (as shown in Figure 14) such
as the rationalization of its product portfolio, a downsizing and new layout of its
NSW operations facilities from 20.000 m2 to around 6000 m2, as well as a
redesign of its supply chain logistics, from a centralized to a decentralized
model, which implies to transfer its assembly and warehousing operations to
two of its main sales points: Queensland and WA. The objective of this strategy
is to reduce transit time and cost for those two new operation hubs, by
receiving components directly from China to be assembled (at least for core
products which does not require upholstery) and shipping finished goods from
the hub, instead of receiving and processing at Sydney to return final products
to each state.
The future state of the VSM for Postura Plus Shell range is based on its current
one, and mostly considers changes on the Supply Chain' Logistics of Sebel, as
the most critical aspect in terms of LT and given that the company was still
working on many other projections about its future business model. According
to this, the future VSM shows a summarized graphic representation of the
current state for Sebel locations at NSW, Victoria, SA, Tasmania and New
Zealand, since their operations will remain centralized on the Sydney facilities,
while for Queensland and WA, a figure of a 3PL on China was included for
consolidation of overseas components to be shipped directly to each of the
hubs (Hong Kong included) and plastic components are to be send from the
manufacturing facilities in NSW (see Figure 15).
For purposes of the exercise, operations of molding, assembly and warehouse
at Sebel NSW and its dependent locations, are considered to remain the same,
whilst an additional day for the expected response from 3PL to new orders, has
been included, as well as warehousing, inventories and/or assembly operations
were calculated according to the respective proportion of sales; for instance,
warehousing and assembly at the 3PL correspond to 33% of the current values
(12% for Queensland, 11% WA, 10% Hong Kong). Additionally, transit time of
overseas components between NSW and the hubs, was eliminated and direct
shipping times from China to hubs were incorporated.
Beneficiario COLFUTURO 2012
Beneficiario COLFUTURO 2012
As a result of the transition of the supply chain logistics to a decentralized
model for the two new hubs, a projection of Future State of the VSM shows
significant reductions on the LT for Queensland (-10 days) and WA (-18 days);
however, given that operations at the rest of the sales points was considered to
remain as it currently is, there is just an slight increase of 0.2% in terms of total
average value-added time (from a current 2% to 2.2% in the future). Taking this
into account, the challenge for the company was to carry out a cost-benefit
analysis to evaluate in what extend it is worth to establish a 3PL to decentralize
assembly and warehouse for those two markets, to save some money and
transit times for the hubs.
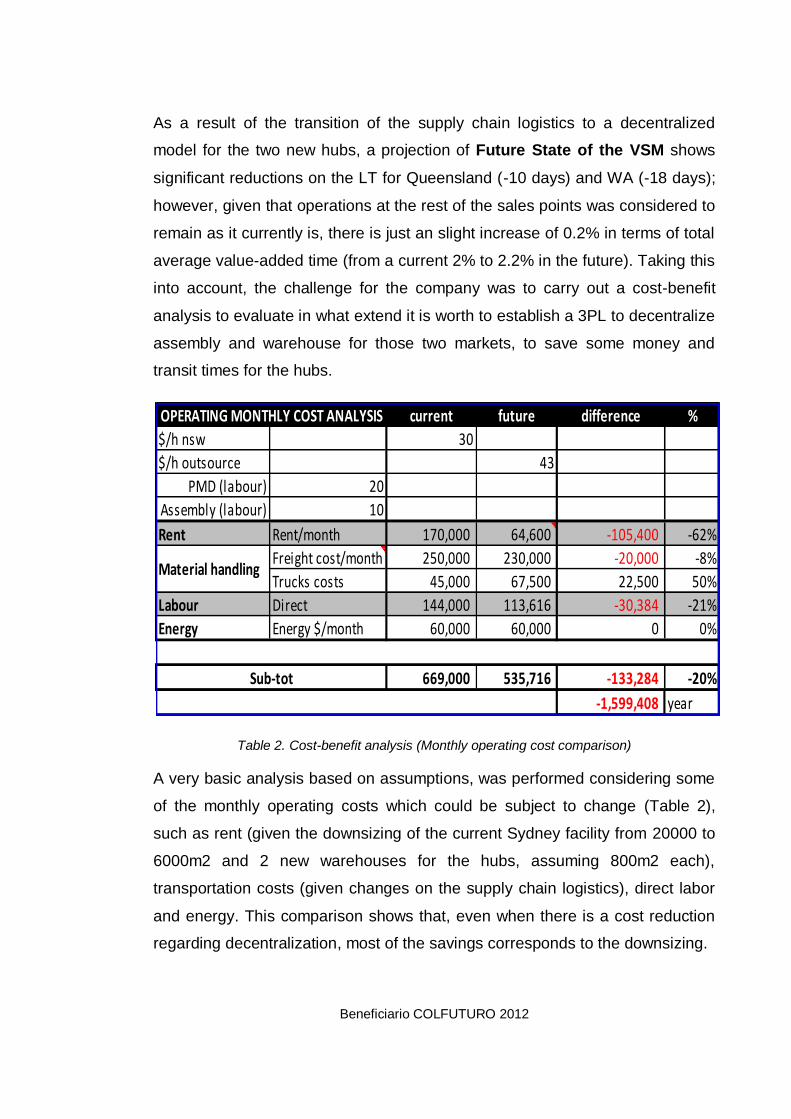
Table 2. Cost-benefit analysis (Monthly operating cost comparison)
A very basic analysis based on assumptions, was performed considering some
of the monthly operating costs which could be subject to change (Table 2),
such as rent (given the downsizing of the current Sydney facility from 20000 to
6000m2 and 2 new warehouses for the hubs, assuming 800m2 each),
transportation costs (given changes on the supply chain logistics), direct labor
and energy. This comparison shows that, even when there is a cost reduction
regarding decentralization, most of the savings corresponds to the downsizing.
current future difference %
$/h nsw 30
$/h outsource 43
PMD (labour) 20
Assembly (labour) 10
Rent Rent/month 170,000 64,600 -105,400 -62%
Freight cost/month 250,000 230,000 -20,000 -8%
Trucks costs 45,000 67,500 22,500 50%
Labour Direct 144,000 113,616 -30,384 -21%
Energy Energy $/month 60,000 60,000 0 0%
669,000 535,716 -133,284 -20%
-1,599,408 year
Material handling
OPERATING MONTHLY COST ANALYSIS
Sub-tot
Beneficiario COLFUTURO 2012
Beneficiario COLFUTURO 2012
Beneficiario COLFUTURO 2012
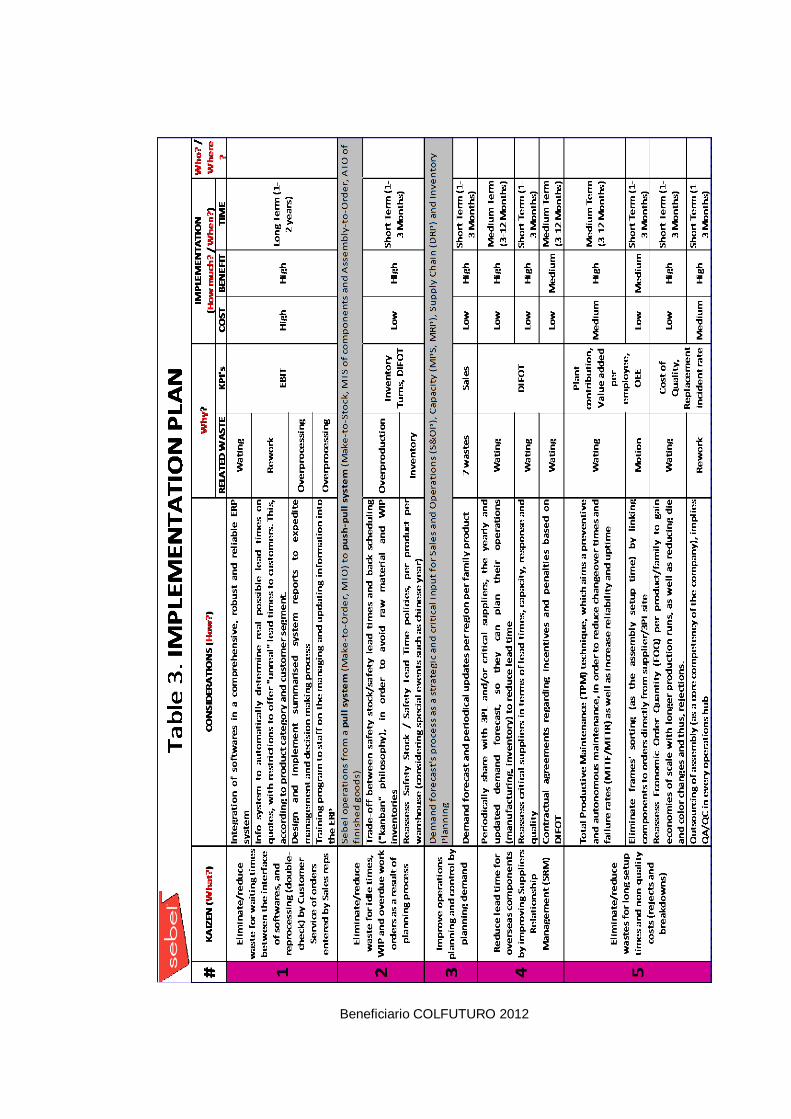
5. RECOMMENDATIONS
During the documentation of the current state and projection of the future VSM,
wastes and non-value-added activities were identified, as well as main
opportunities for improvement (Kaizens highlighted in purple on the maps) and
suggestions were raised on the following action plan based on the 5W2H
methodology (What?, Why?, When?, Who?, Where?, How?, How much?)
shown in Table 3. Assumptions for prioritization were made regarding costs-
benefit for the organization and it is recommended for the company to establish
project teams to work on each of the considerations.
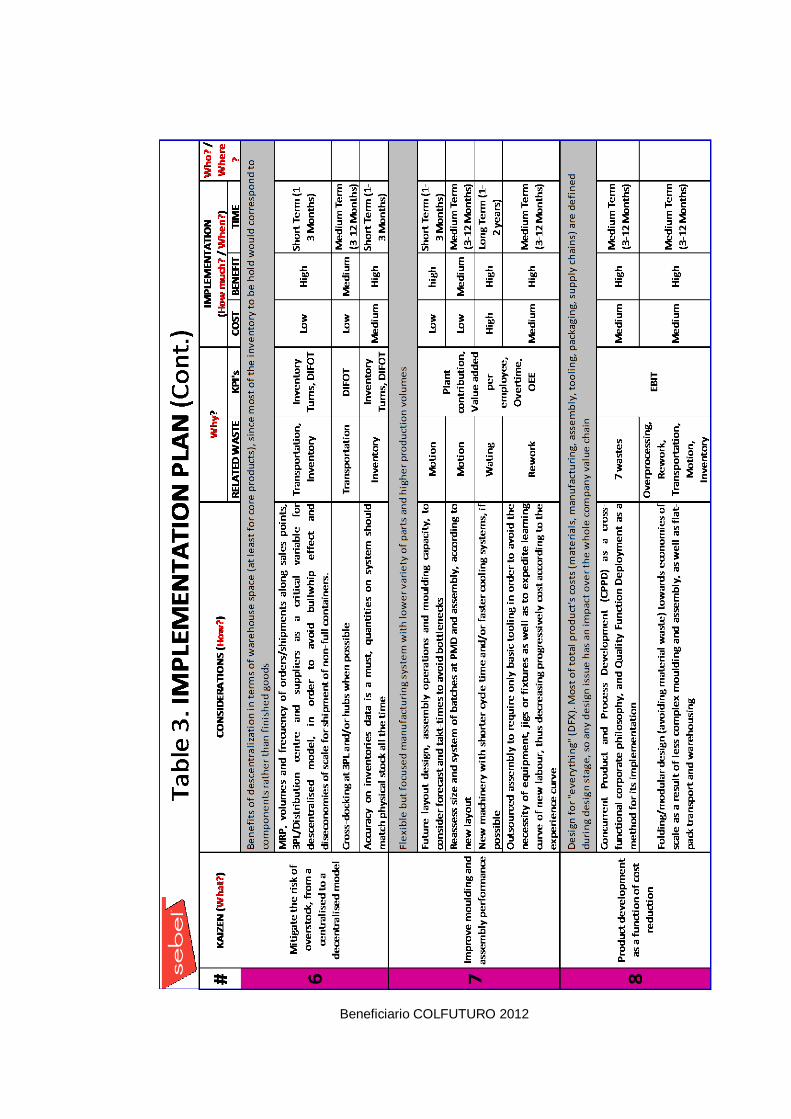
IMPROVED STATE
Considering the elimination/mitigation of the main non-value-added activities
and wastes after implementation of the Kaizens, an improved state of the VSM
was projected for a centralized and decentralized logistics model in Figures 16
and 17, and data modifications were highlighted on purple on the maps and
respective PFDs (Appendix 20). Assumptions were made as follows:
Planning of the operations would be immediately after a customer places an
order, given that double-checking at customer service would not be
necessary, and there is a comprehensive and robust ERP software that
avoids overnight interfaces and make easier the planning task.
Suppliers LT could be reduced in at least 4 weeks given that Sebel would
plan its demand based on accurate forecasts, which would be periodically
updated and shared with 3PL and suppliers, so that, they could plan their
production and inventories in advance to respond to weekly orders from the
company.
Receiving and dispatching times are halved at the warehouse as a result of
less merchandise volume (not shipment of finished goods from NSW to
Queensland and WA) and better packaging and loading methods.
Beneficiario COLFUTURO 2012
Beneficiario COLFUTURO 2012
Beneficiario COLFUTURO 2012
As a result of better preventive maintenance and setup practices at PMD,
C/O time and breakdowns would be reduced to half, while setup time for
assembly would disappear once frames' sorting is eliminated by linking
components to orders directly from supplier/3PL site.
Value-added time would increase if potential bottlenecks are prevented by
balancing the process flow (batch sizes).
As a result, for an Improved state of the VSM if Sebel decides to keep its
operation centralized, there is an average of 35 days of total LT (5 weeks) for
Postura Plus Shell, from which 5% (1.7 days) correspond to activities that
add value to the product, and the rest 95% (33 days) represents Non-value-
added time. 74% of this LT stands for external operations, with 14 days of
supplying transportation time (40%), an average of 12 days shipping time
(35%) and 9.2 days of internal operations (26%).
On the other hand, if Sebel goes for the decentralized model, in an Improved
state of the VSM there would be an average of 27 days of total LT (less than 4
weeks) for Postura Plus Shell, from which 7% (1.7 days) correspond to
activities that add value to the product and for which customers would be
willing to pay for, and the rest 93% (25 days) represents Non-value-added time.
Beneficiario COLFUTURO 2012
6. CONCLUSIONS
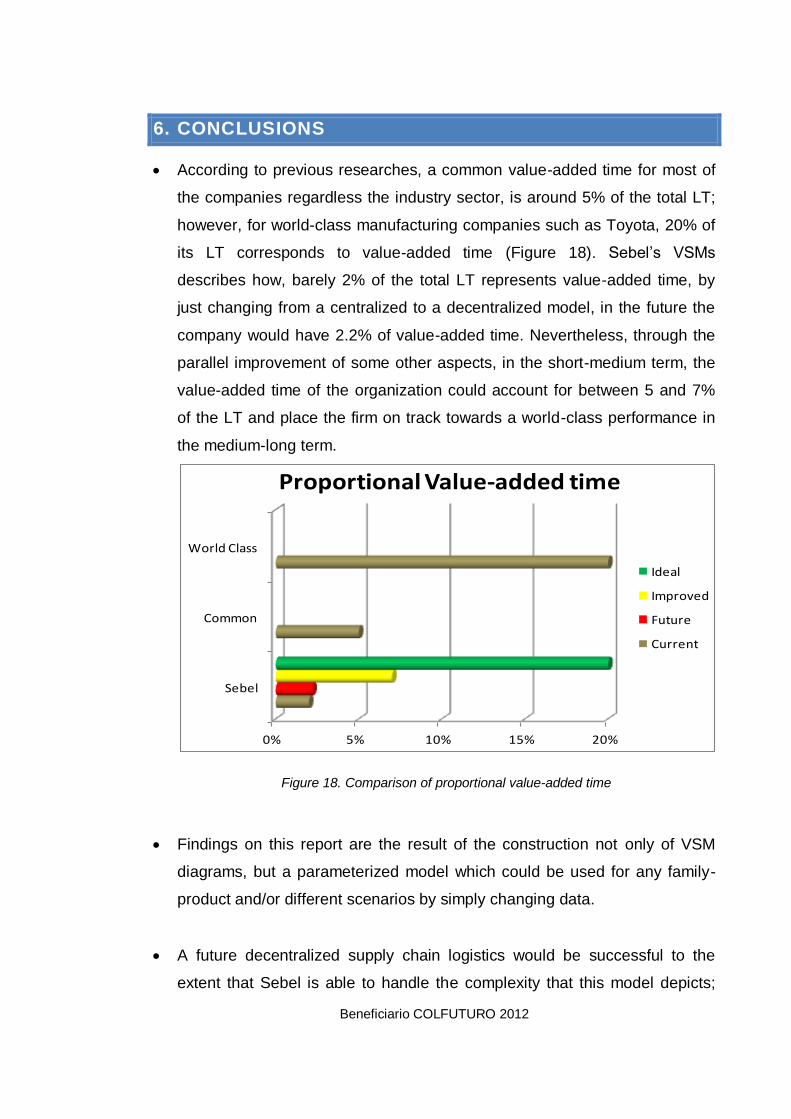
According to previous researches, a common value-added time for most of
the companies regardless the industry sector, is around 5% of the total LT;
however, for world-class manufacturing companies such as Toyota, 20% of
its LT corresponds to value-added time (Figure 18). Sebel’s VSMs
describes how, barely 2% of the total LT represents value-added time, by
just changing from a centralized to a decentralized model, in the future the
company would have 2.2% of value-added time. Nevertheless, through the
parallel improvement of some other aspects, in the short-medium term, the
value-added time of the organization could account for between 5 and 7%
of the LT and place the firm on track towards a world-class performance in
the medium-long term.
Figure 18. Comparison of proportional value-added time
Findings on this report are the result of the construction not only of VSM
diagrams, but a parameterized model which could be used for any family-
product and/or different scenarios by simply changing data.
A future decentralized supply chain logistics would be successful to the
extent that Sebel is able to handle the complexity that this model depicts;
0% 5% 10% 15% 20%
Sebel
Common
World Class
Proportional Value-added time
Ideal
Improved
Future
Current
Beneficiario COLFUTURO 2012
that is, the company’s Sales and Operations Planning (S&OP) should be
carried out based on its demand planning by forecast techniques. Moreover,
based on the S&OP and forecast periodic updates, the MRP process for
each of the operative locations should be accurate in order to match at the
hubs, components from different sources, as well as not to lose the saved
time and cost as a result of idle times and overstock, which involves a
reassessment of inventory policies regarding Safety Stock and Safety Lead
Times for every sales point. All this, requires a comprehensive, robust and
reliable ERP software, which additionally, facilitates to have handy
information for the management, to expedite the decision making process.
The 3PL figure would play a critical role in the decentralized model as it
could represent the inventory's trade-off for the hubs, as a result of
fluctuations on demand.
Beneficiario COLFUTURO 2012
7. REFERENCES
1. “Sebel’s corporate website”. Viewed 4 March 2013,
http://sebelfurniture.com/aboutus/aboutus-corporate.php
2. Mike Sondalini. “How to do Value Stream Mapping”. Viewed 8 March 2013,
http://www.lifetime-reliability.com/free-articles/lean-management-
methods/How_to_do_Value_Stream_Mapping.pdf
3. “Toolingu, Quality training, Lean Manufacturing”. Viewed 7 June 2013,
http://www.toolingu.com/class-900130-lean-manufacturing-overview.html
4. “Wikipedia”. Viewed 7 June 2013, http://en.wikipedia.org/
Beneficiario COLFUTURO 2012
8. APPENDICES
DATA/INFORMATION SOURCE SUPPORT / DEFINITION APPENDIX CALCULATION
Times for Sales Rep to entry
data on Direct Selling after
customer approve the quote
and Customer Service to
double-check it and officially
release the order
Customer Service
Management
Time for interface between
Direct Selling and MFG-ProPlanners
Time to perform the planning
and purchasing processes for
the daily requirements from
MFG-Pro
Planners
PMD Production schedule
timePMD Management
Assembly schedule time Assumption
Bill of Materials (BOM) MFG-Pro report 13.6 (Product structure inquiry) 10
Average LT for plastic raw
material from the time an order
is placed to the time it is
received
PlannersMFG-Pro reports 5.7 (Purchase order maintenance) and
5.9.18 (Supplier performance)8
Average LT for overseas
components from the time an
order is placed to the time it is
received
PlannersMFG-Pro reports 5.7 (Purchase order maintenance) and
3.21.2 (Transactions item by item inquiry)9
Warehouse receiving
(unloading) and despatch
(loading) times
Warehouse
Supervisor and Clerk
Cycle time (C/T) On-site inspection Effective operation time (Operation run time / piece) x batch size
Changeover time (C/O)
On-site inspection,
Daily day register
excel file
Setup time to prepare the Work Station (WS),
independent of batch size
Downtime of machine from last product (last
order) to first good product (next order)
Actual production time PFDs Total time spent to complete a work order Total production time per order
Available time PFDs
Actual production time that does not include downtime
events (planned maintenance, breakdowns, lunch
periods and breaks)
Actual production time - C/O time
Uptime (%) PFDs Proportion of the net available working time Actual prod t / Available time
Performance (%) PFDs Proportion of the real time in producing of an order(Tot units produced * C/T) / Actual production
time
Shifts PMD Management
Quality (%)
PFDs, Work order
packing list, PMD
Operator production
sheet
2 to 7, 17
to 19
Good parts prod / Tot parts prod or 1 -
Defectives %
Batch On-site inspection # of operators involved on the process
People On-site inspection
Defectives rate
PFDs, Work order
packing list, PMD
Operator production
sheet
# defective products / tot prod
ProductivityOn-site inspection,
PFDsGood parts / Total production time per order
Transportation PFDs
Movement of product between processes, normally
using a fork lift truck to manoeuvre product around the
factory
Waiting time PFDs
t spent waiting to be processed at a WC, which
depends on workload and schedule. waiting for
machines (breakdowns), products, people, information,
etc
Inventory quantities
On-site inspection,
MFG-Pro reports 3.2
(Inventory detail by
item inquiry) and
3.21.2 (Transactions
by item inquiry)
Inventory lead timeUnits in stock represented in terms of the required time
to produce themInventory quantity / productivity
Shipping/delivering average
times
Warehouse Clerk /
Credit ManagerAverages
Takt timeRate (rhythm) at which the company should produce to
satisfy the demand
Tot yearly time available for production /
Demand
DemandFinancial statement
Sales 2011-2012
Average sales 2011-2012 for postura plus
chair
Expected response time from
suppliers to 3PL in a future
state
Planning and
assembly
management
Suppliers production LT Planners
Sales composition per marketAccount
management
Shipping LTsSupply Chain
Management
Projected cost of outsourced
assembly
Account
management
2 to 7
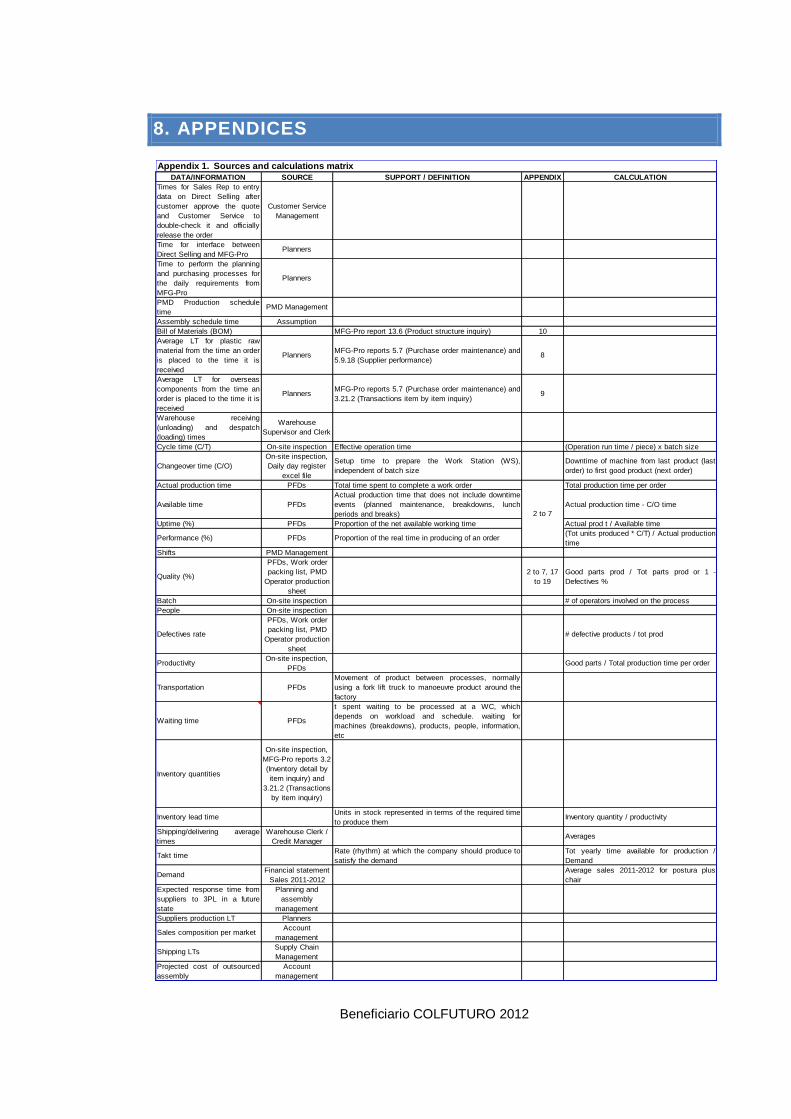
Appendix 1. Sources and calculations matrix
Beneficiario COLFUTURO 2012
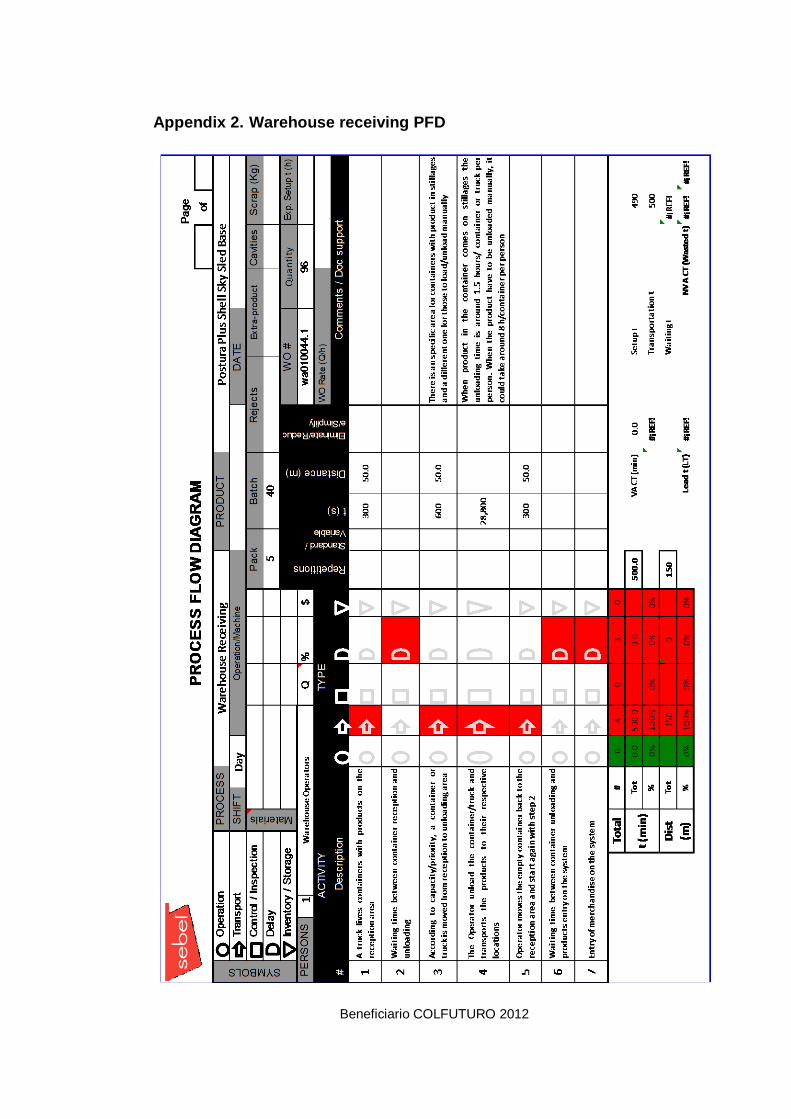
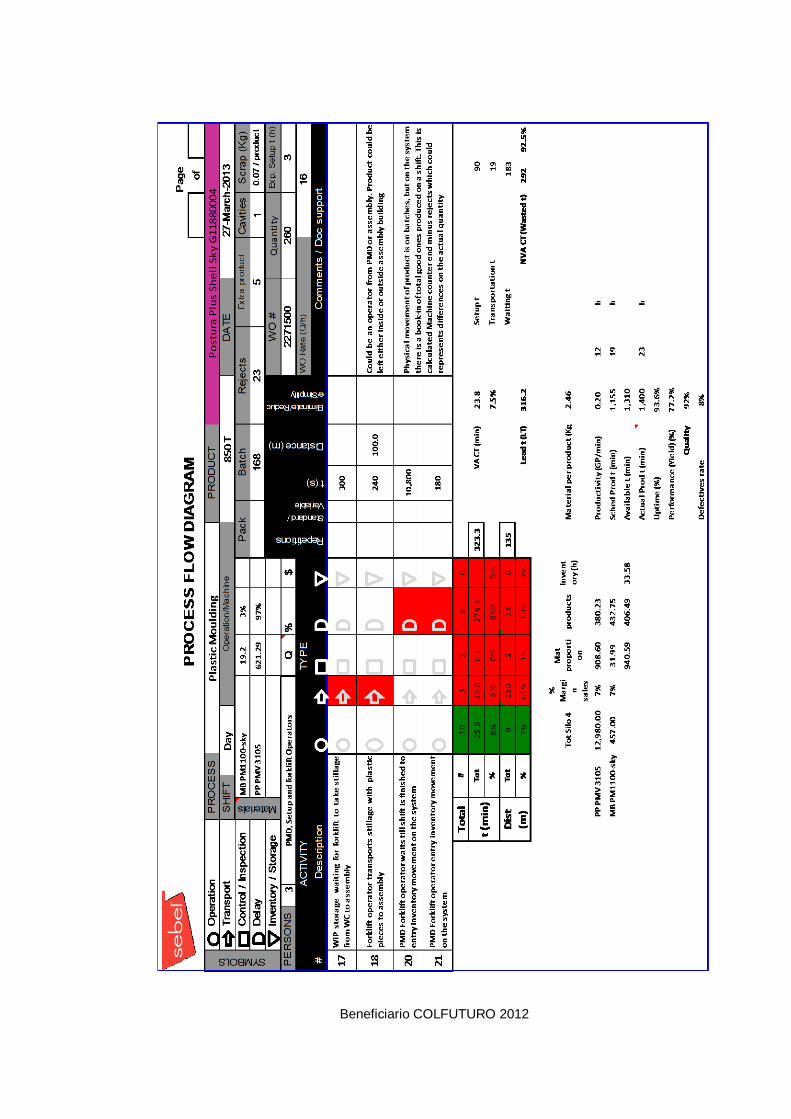
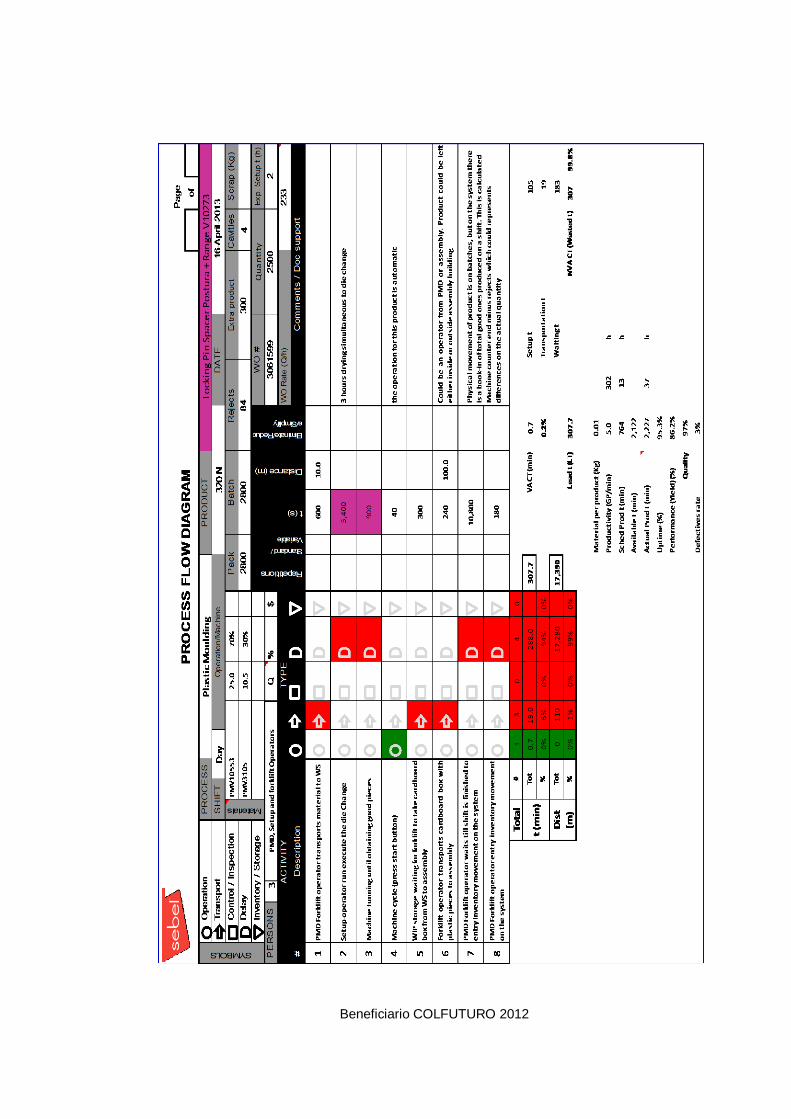
Appendix 2. Warehouse receiving PFD
Beneficiario COLFUTURO 2012
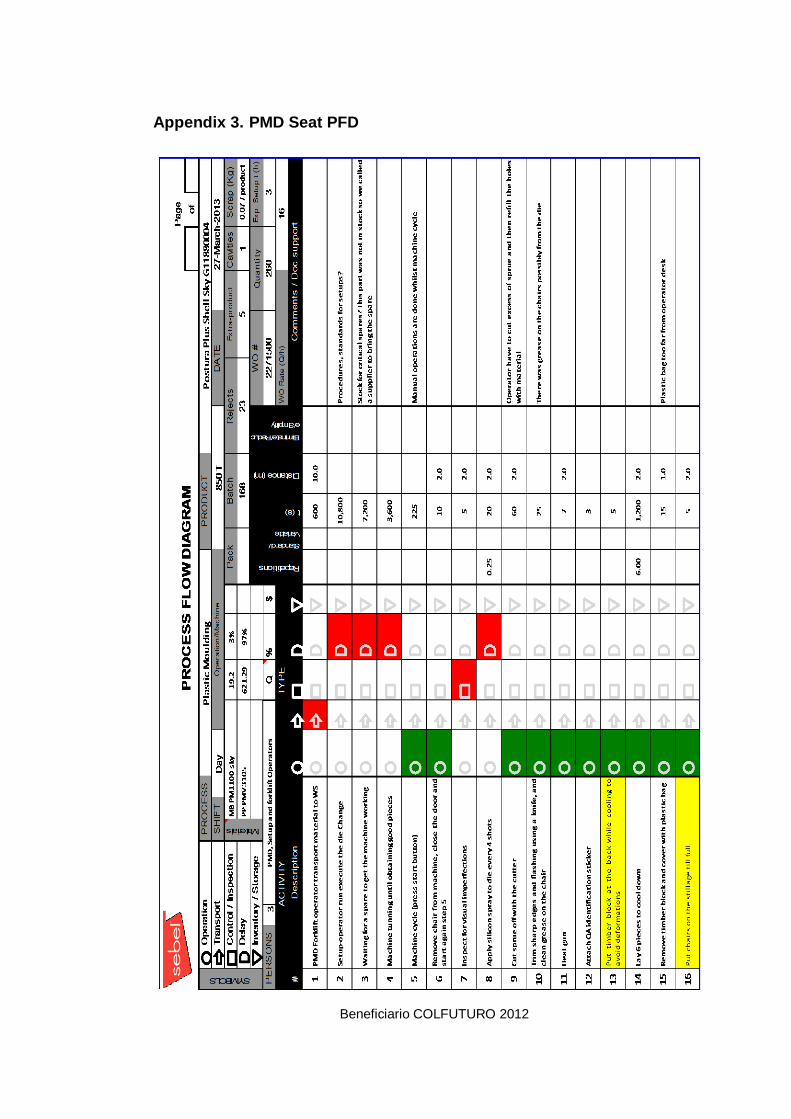
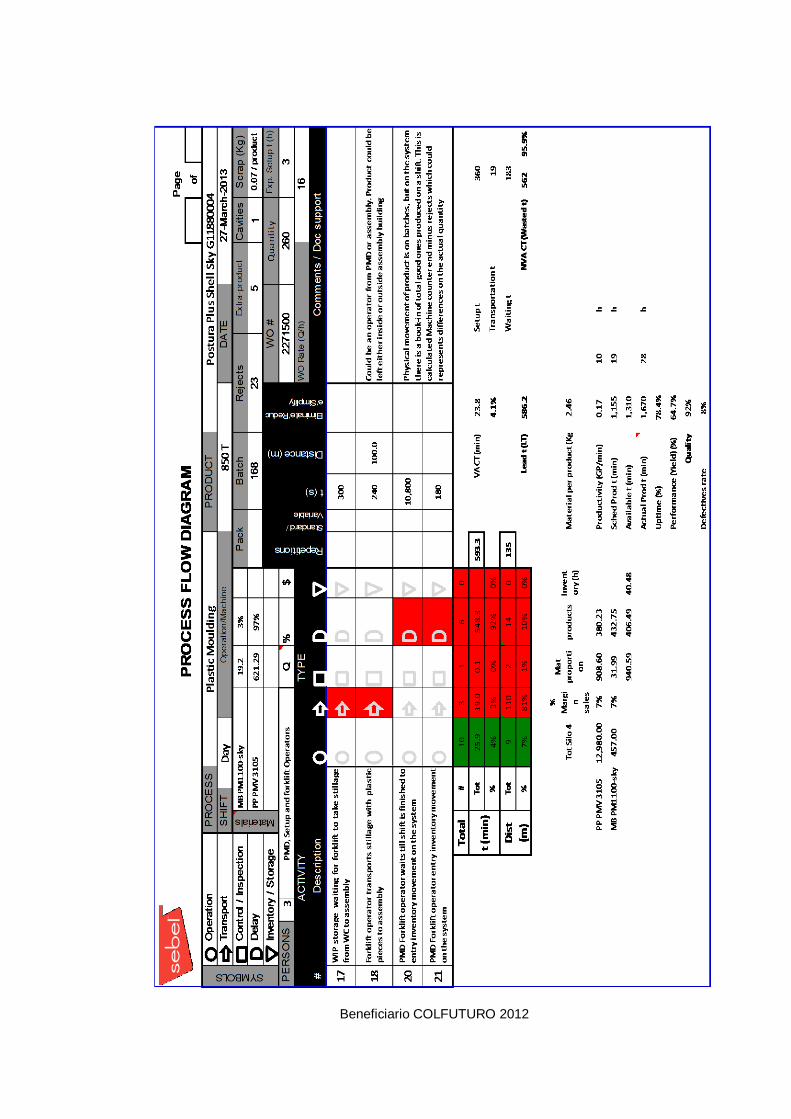
Appendix 3. PMD Seat PFD
Beneficiario COLFUTURO 2012
Beneficiario COLFUTURO 2012
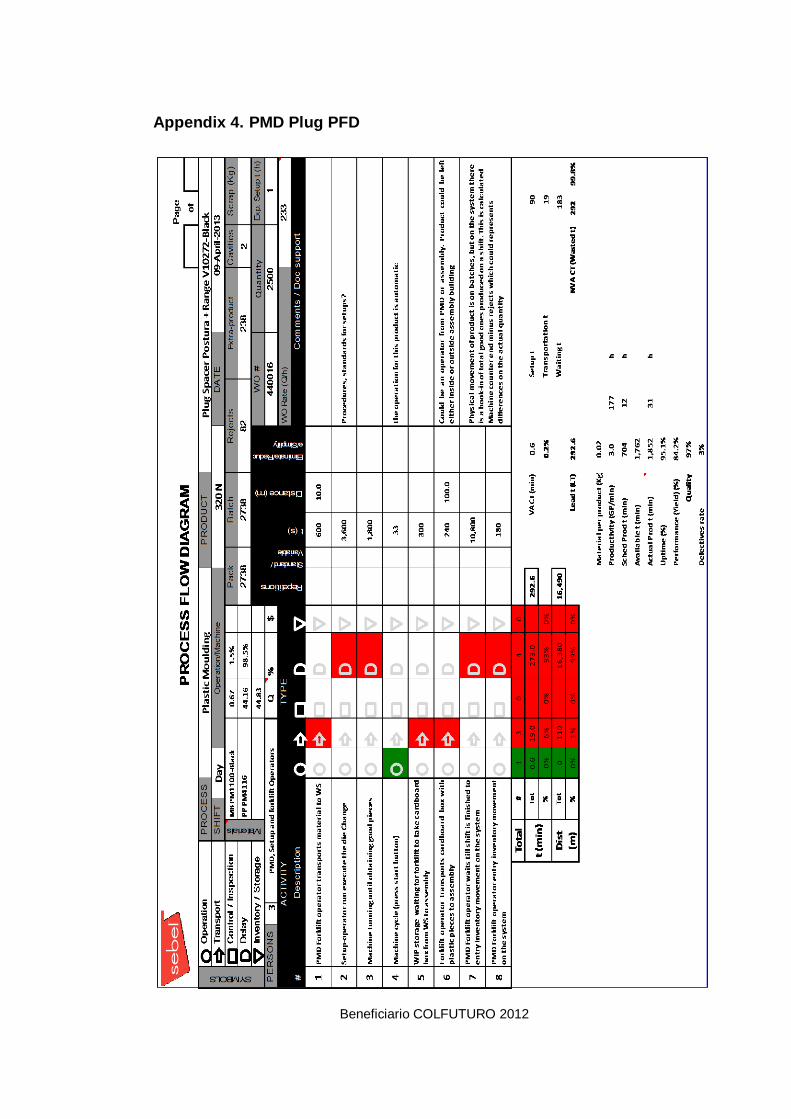
Appendix 4. PMD Plug PFD
Beneficiario COLFUTURO 2012
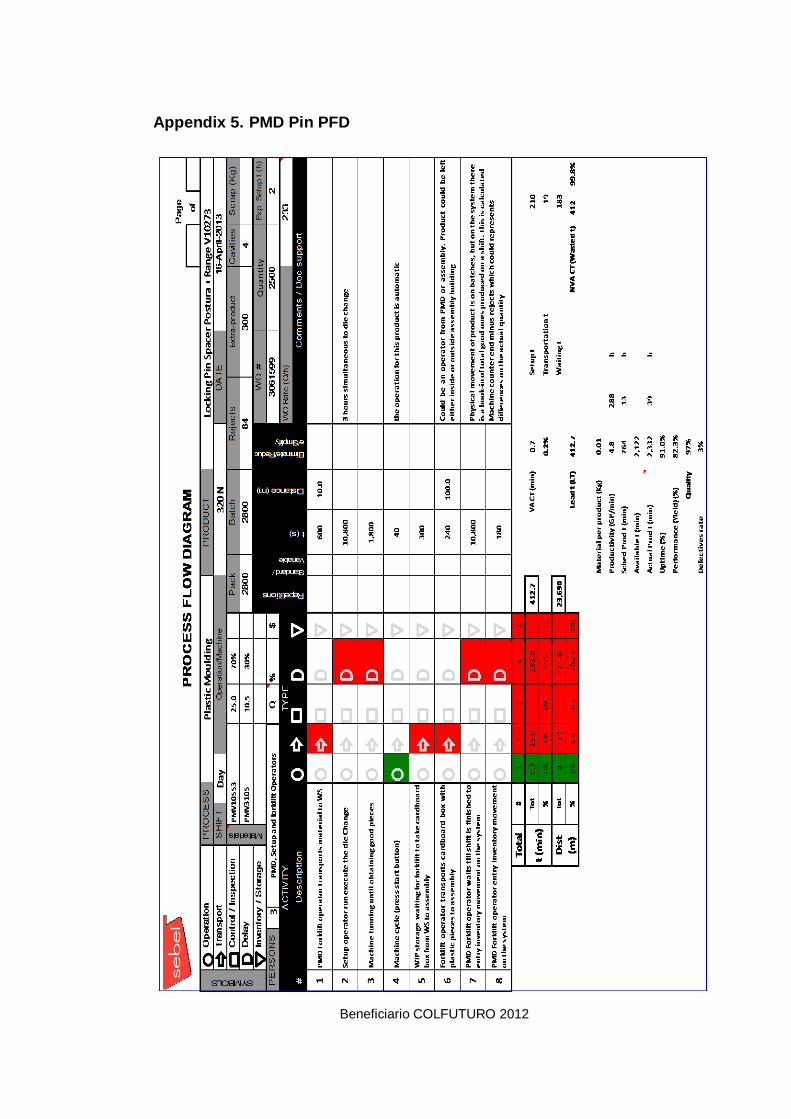
Appendix 5. PMD Pin PFD
Beneficiario COLFUTURO 2012
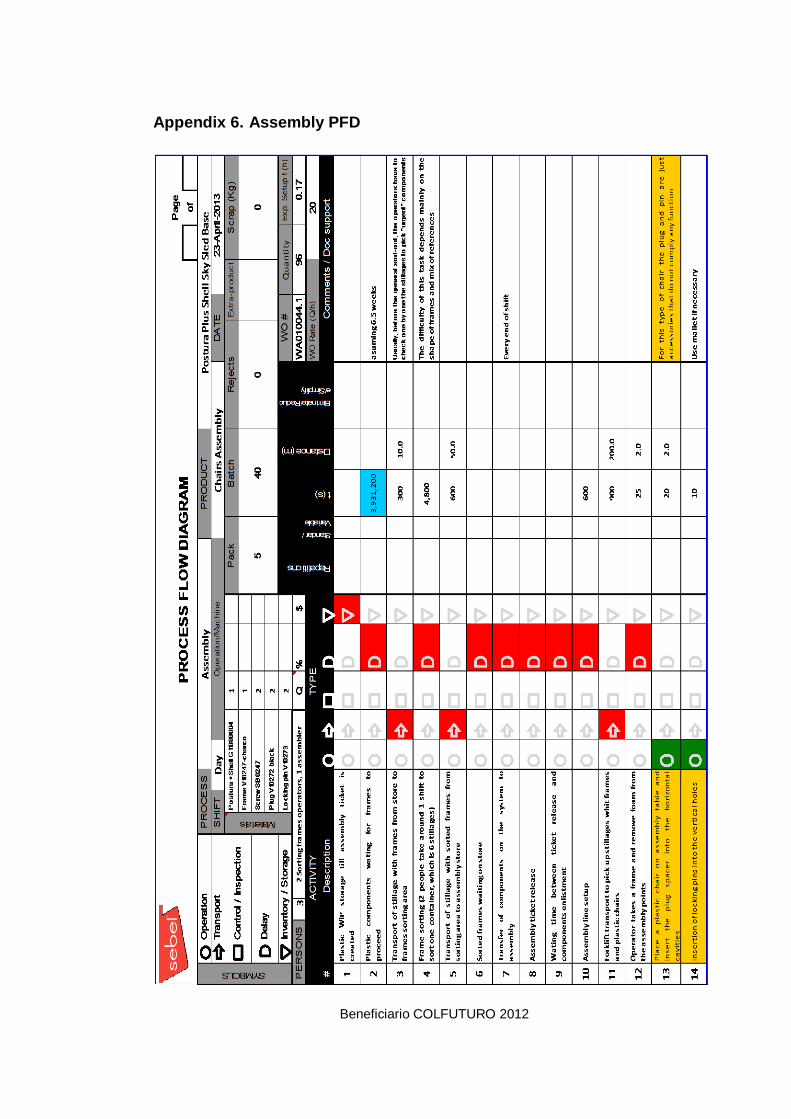
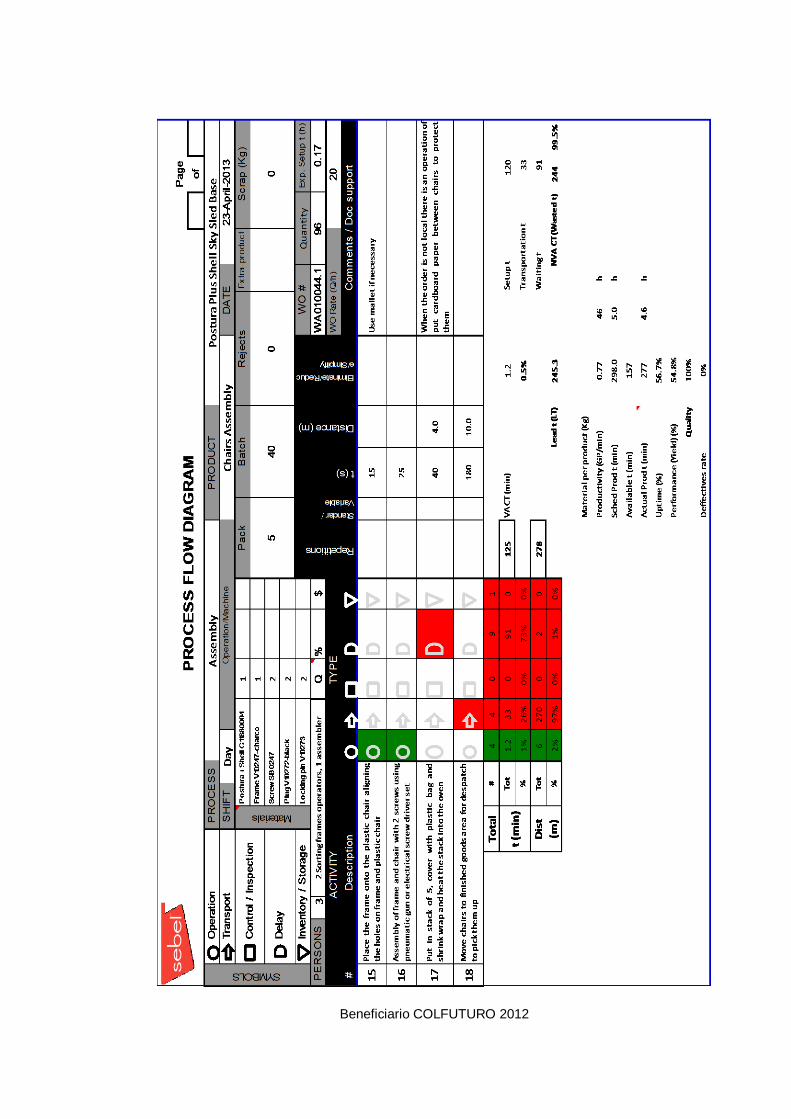
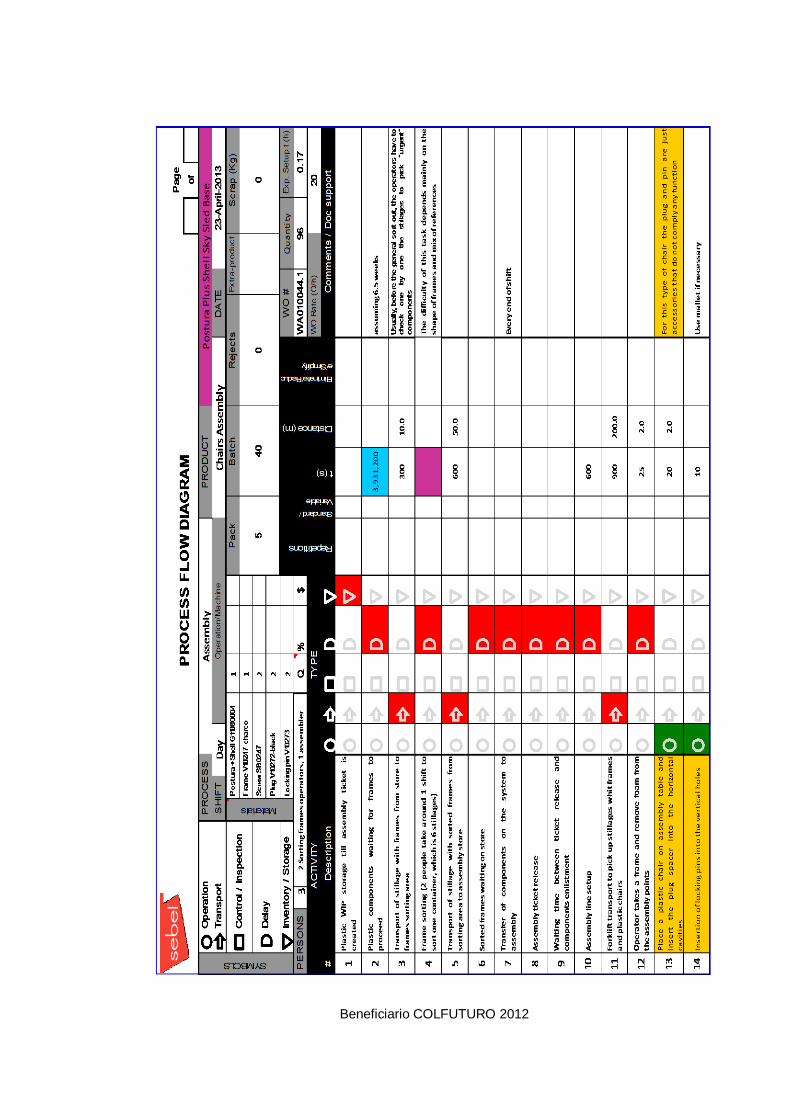
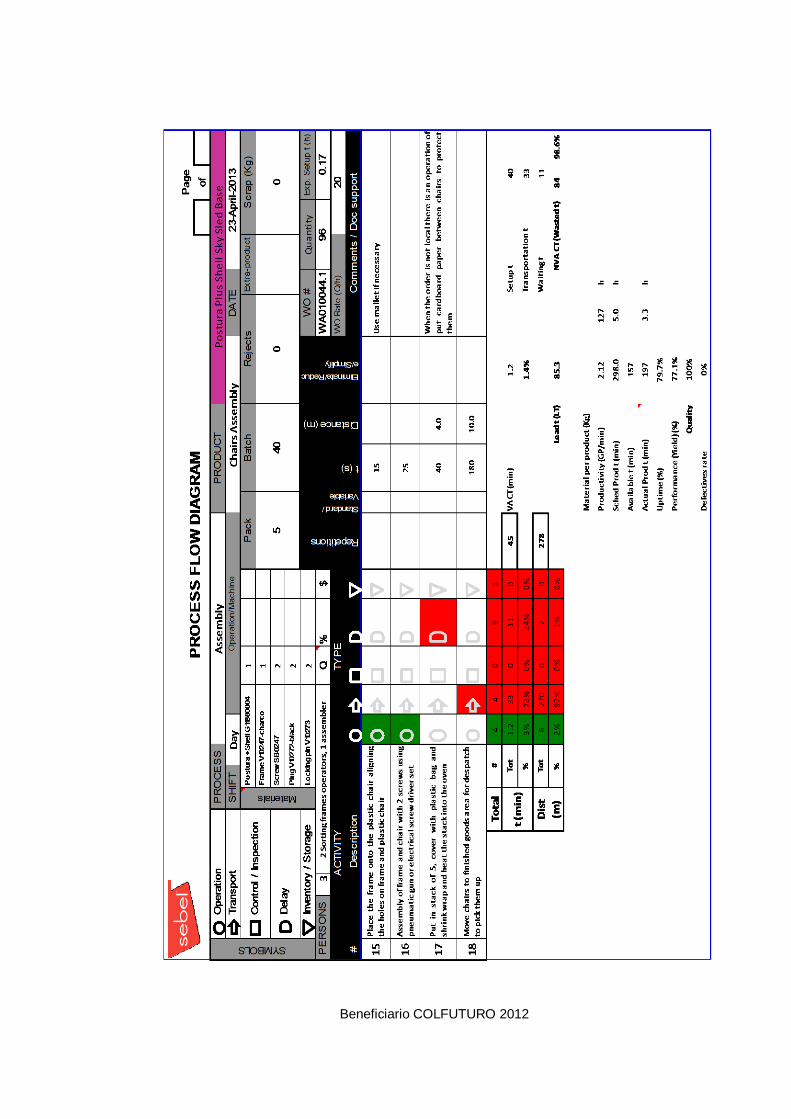
Appendix 6. Assembly PFD
Beneficiario COLFUTURO 2012
Beneficiario COLFUTURO 2012
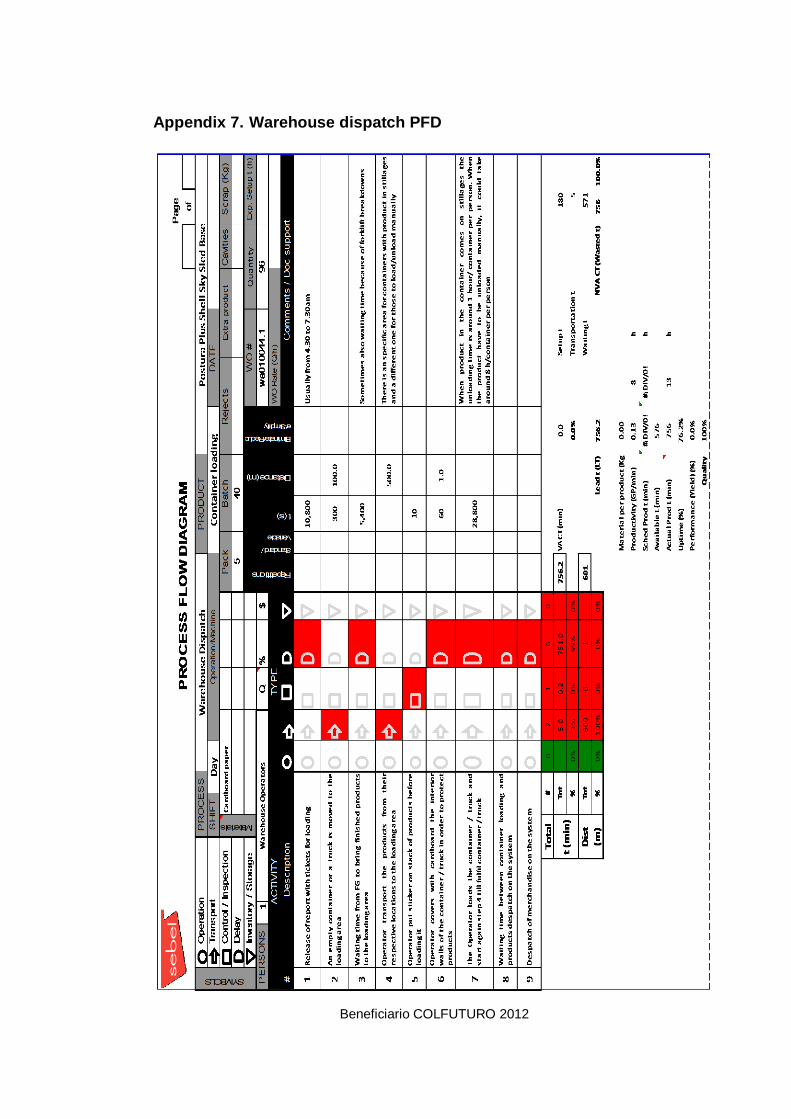
Appendix 7. Warehouse dispatch PFD
Beneficiario COLFUTURO 2012
Appendix 8. Masterbatch purchasing order data and receiving date
Beneficiario COLFUTURO 2012
Appendix 9. Frames purchasing order data and receiving date
Beneficiario COLFUTURO 2012
Appendix 10. Postura Plus Shell Sled Charcoal BOM
Beneficiario COLFUTURO 2012
Appendix 11. Polypropylene inventory
Beneficiario COLFUTURO 2012
Appendix 12. Masterbatch inventory
Beneficiario COLFUTURO 2012
Appendix 13. Seat inventory
Beneficiario COLFUTURO 2012
Appendix 14. Plug inventory
Beneficiario COLFUTURO 2012
Appendix 15. Pin inventory
Beneficiario COLFUTURO 2012
Appendix 16. Finished goods inventory
Beneficiario COLFUTURO 2012
Appendix 17. Seat PMD WO, packing list and production sheets
Beneficiario COLFUTURO 2012
Beneficiario COLFUTURO 2012
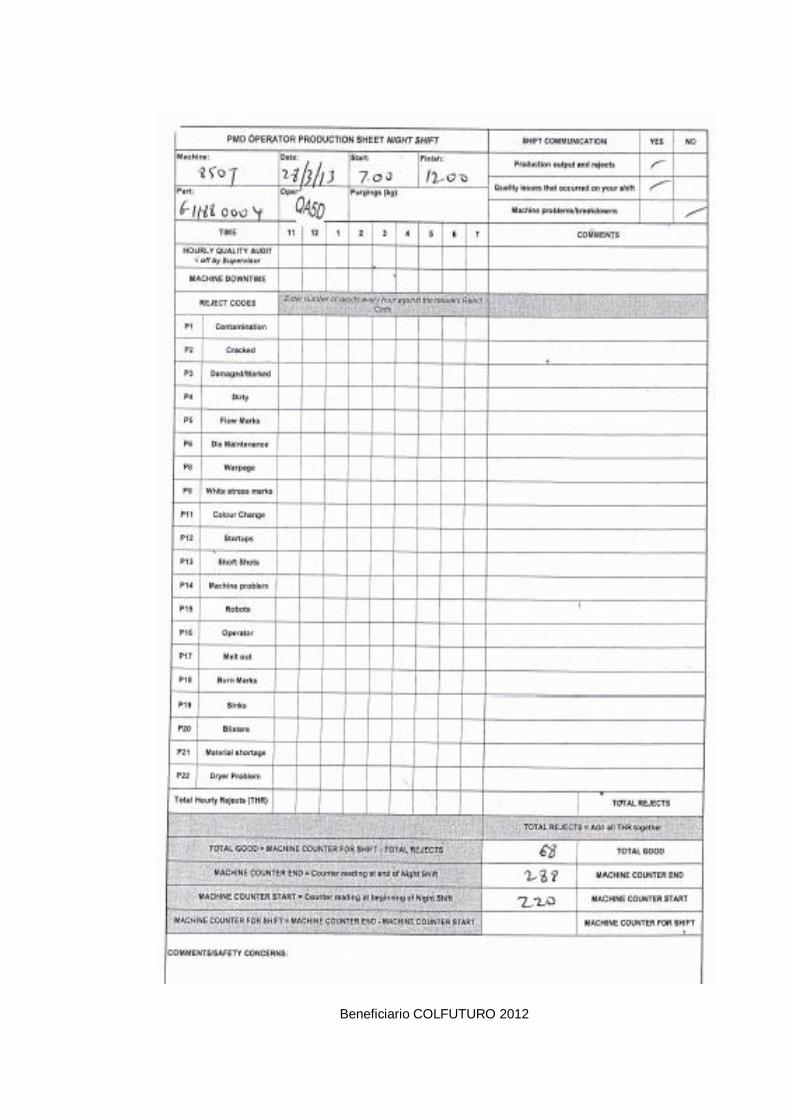
Beneficiario COLFUTURO 2012
Beneficiario COLFUTURO 2012
Appendix 18. Plug PMD WO and packing list
Beneficiario COLFUTURO 2012
Appendix 19. Pin PMD WO and packing list
Beneficiario COLFUTURO 2012
Appendix 20. Assumed PFDs for Improved VSM
Beneficiario COLFUTURO 2012

Beneficiario COLFUTURO 2012
Beneficiario COLFUTURO 2012
Beneficiario COLFUTURO 2012
Beneficiario COLFUTURO 2012