Embed Size (px)
Citation preview
f o r t h e p r o p o s e d
Colgate Divinity Re-Development
C i t y o f R o c h e s t e r M o n r o e C o u n t y , N e w Y o r k
May 2019
Project No. 39011
Prepared For:
Angelo Ingrassia 5 5 0 L a t o n a R o a d B l d g E , S u i t e 5 0 1
R o c h e s t e r , N e w Y o r k 1 4 6 2 6
Prepared By:
3 4 9 5 W i n t o n P l a c e B u i l d i n g E , S u i t e 1 1 0
R o c h e s t e r , N e w Y o r k 1 4 6 2 3
Multi-modal Transportation Impact Assessment
i May 2019
Multi-Modal Traffic Impact Study Proposed Colgate Divinity Re-Development City of Rochester, NY
TABLE OF CONTENTS
LIST OF TABLES ................................................................................................................................ ii
LIST OF FIGURES .............................................................................................................................. ii
LIST OF APPENDICES ..................................................................................................................... ii
LIST OF REFERENCES ..................................................................................................................... ii
EXECUTIVE SUMMARY .................................................................................................................. iii
I. INTRODUCTION ................................................................................................................ 1 II. LOCATION ........................................................................................................................... 1 III. EXISTING HIGHWAY SYSTEM ........................................................................................ 1 IV. EXISTING TRAFFIC CONDITIONS ............................................................................... 2
A. Peak Intervals for Analysis ........................................................................................ 2
B. Existing Traffic Volume Data .................................................................................... 2
C. Field Observations ...................................................................................................... 3
D. Sight Distance Evaluation .......................................................................................... 3
V. FUTURE AREA DEVELOPMENT AND LOCAL GROWTH ..................................... 4 VI. PROPOSED DEVELOPMENT ............................................................................................ 4
A. Description ................................................................................................................... 4
B. Site Traffic ..................................................................................................................... 5
C. Site Traffic Distribution ............................................................................................. 6
VII. FULL DEVELOPMENT VOLUMES.................................................................................... 7 VIII. CAPACITY ANALYSIS ........................................................................................................ 7 IX. LEFT-TURN TREATMENT WARRANT INVESTIGATION ...................................... 9 X. CONCLUSIONS & RECOMMENDATIONS ...............................................................10 XI. FIGURES ................................................................................................................................10
ii May 2019
Multi-Modal Traffic Impact Study Proposed Colgate Divinity Re-Development City of Rochester, NY
LIST OF TABLES TABLE I EXISTING HIGHWAY SYSTEM .............................................................................................1
TABLE II SIGHT DISTANCE EVALUATION ........................................................................................4
TABLE III PROJECTED TRIP GENERATION ........................................................................................6
TABLE IV CAPACITY ANALYSIS RESULTS ...........................................................................................8
TABLE V LEFT-TURN TREATMENT WARRANT INVESTIGATION ...........................................9
LIST OF FIGURES FIGURE 1 SITE LOCATION & STUDY AREA
FIGURE 2 LANE GEOMETRY & AVERAGE DAILY TRAFFIC
FIGURE 3 PEAK HOUR VOLUMES – 2019 EXISTING CONDITIONS
FIGURE 4 PEAK HOUR VOLUMES – 2022 BACKGROUND CONDITIONS
FIGURE 5 SITE PLAN
FIGURE 6 TRIP DISTRIBUTION
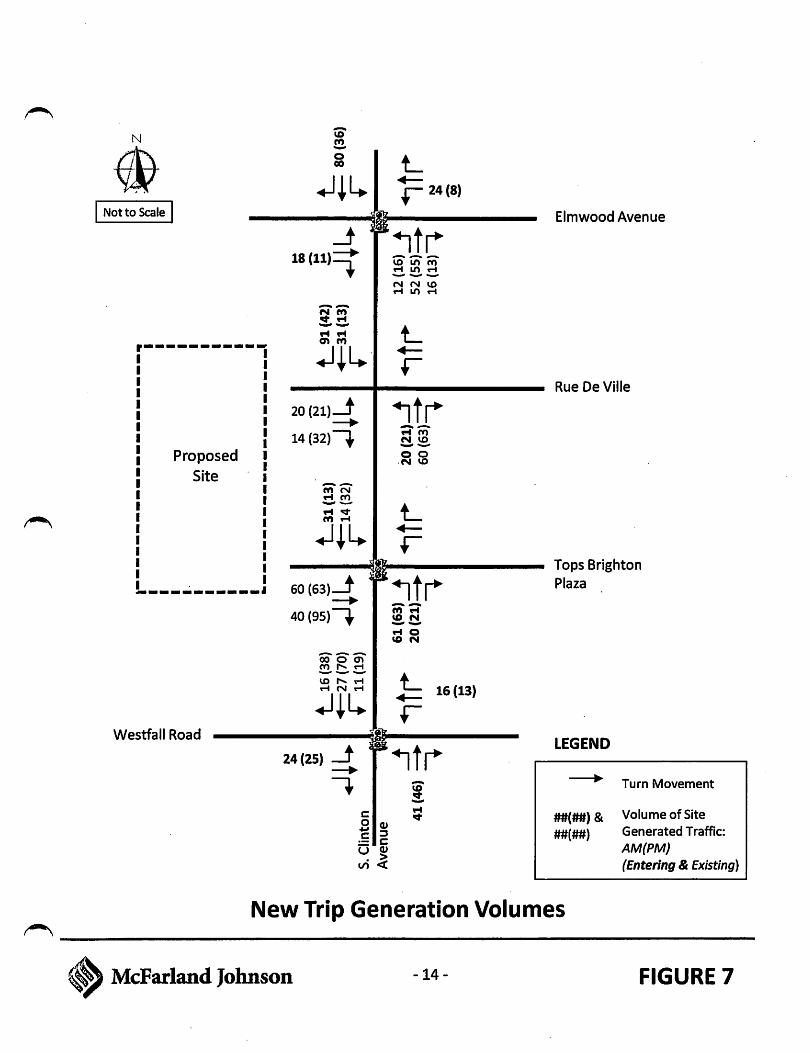
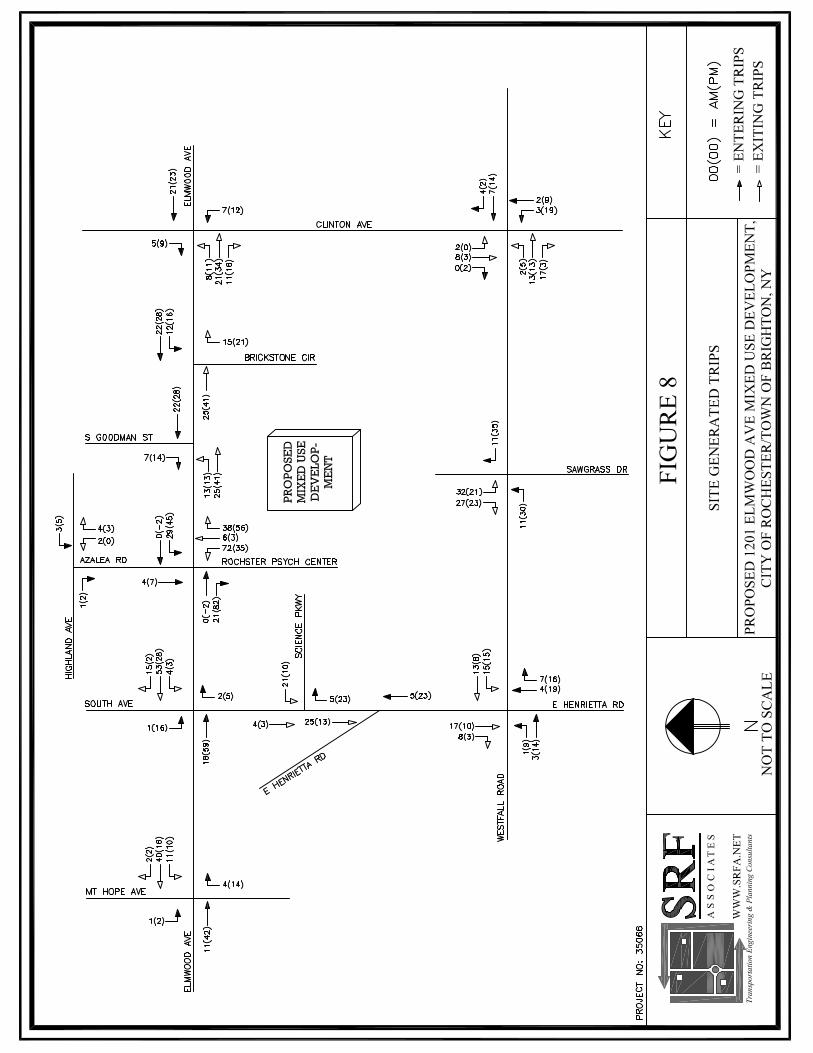
FIGURE 7 SITE GENERATED TRIPS
FIGURE 8 PEAK HOUR VOLUMES – FULL DEVELOPMENT CONDITIONS
LIST OF APPENDICES
A1. COLLECTED TRAFFIC VOLUME DATA
A2. MISCELLANEOUS TRAFFIC DATA AND CALCULATIONS
A3. LOS CRITERIA/DEFINITIONS
A4. LEVEL OF SERVICE CALCULATIONS – EXISTING CONDITIONS
A5. LEVEL OF SERVICE CALCULATIONS – BACKGROUND CONDITIONS
A6. LEVEL OF SERVICE CALCULATIONS – FULL DEVELOPMENT CONDITIONS
iii May 2019
Multi-Modal Traffic Impact Study Proposed Colgate Divinity Re-Development City of Rochester, NY
LIST OF REFERENCES
1. Highway Capacity Manual 6th Edition. Transportation Research Board (TRB). The National
Academies, Washington, DC. 2016.
2. Trip Generation, 10th Edition. Institute of Transportation Engineers (ITE). Washington, DC. 2017.
3. New York State Department of Transportation Traffic Data Viewer. Retrieved from https://www.dot.ny.gov/tdv. 2019.
4. National Cooperative Highway Research Program (NCHRP) Report 279: Intersection Channelization Design Guide. TRB. 1985.
5. A Policy on Geometric Design of Highways and Streets. The American Association of State Highway Transportation Officials (AASHTO). Washington, DC. 2011.
6. Traffic Impact Study for 1201 Elmwood Avenue Mixed Use Development, Brighton, NY. SRF Associates. 2016.
iv May 2019
Multi-Modal Traffic Impact Study Proposed Colgate Divinity Re-Development City of Rochester, NY
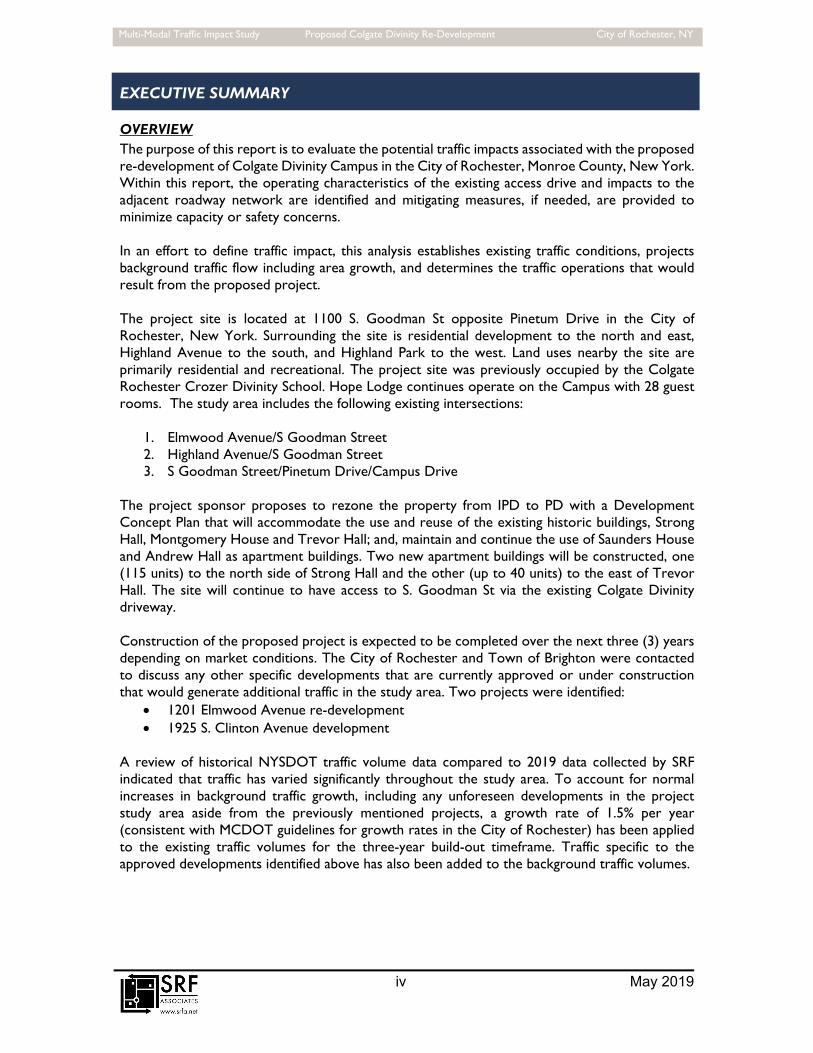
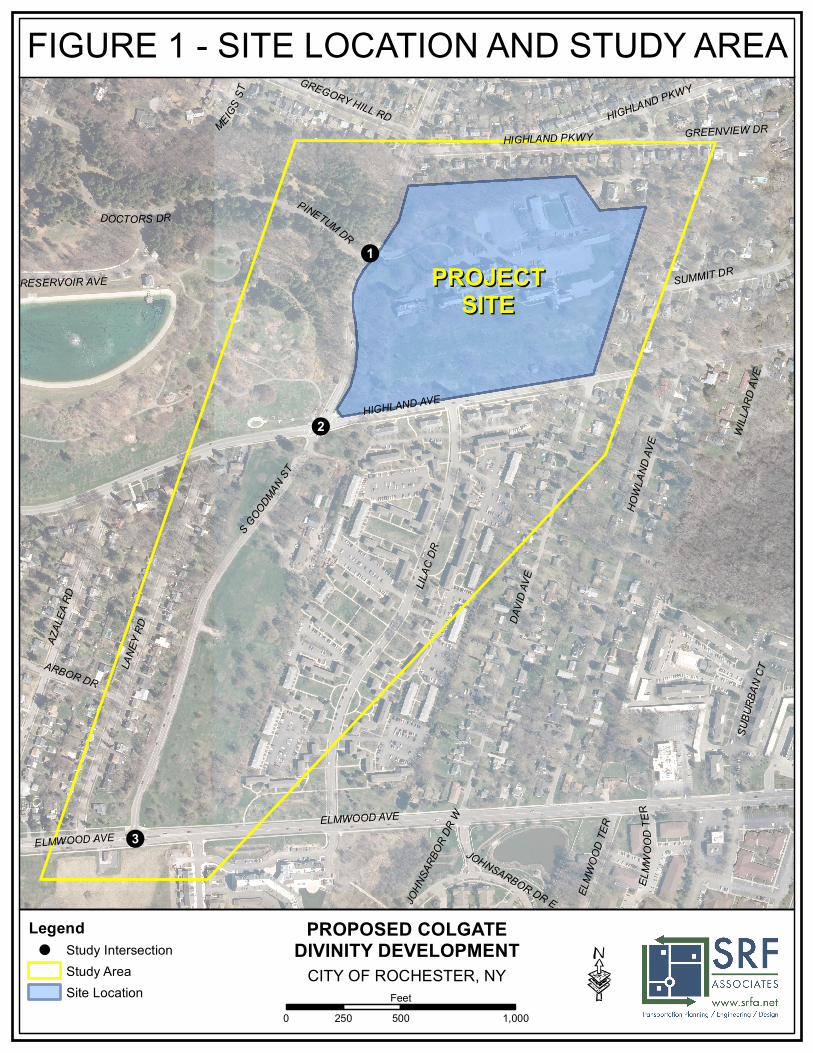
EXECUTIVE SUMMARY OVERVIEW The purpose of this report is to evaluate the potential traffic impacts associated with the proposed re-development of Colgate Divinity Campus in the City of Rochester, Monroe County, New York. Within this report, the operating characteristics of the existing access drive and impacts to the adjacent roadway network are identified and mitigating measures, if needed, are provided to minimize capacity or safety concerns. In an effort to define traffic impact, this analysis establishes existing traffic conditions, projects background traffic flow including area growth, and determines the traffic operations that would result from the proposed project. The project site is located at 1100 S. Goodman St opposite Pinetum Drive in the City of Rochester, New York. Surrounding the site is residential development to the north and east, Highland Avenue to the south, and Highland Park to the west. Land uses nearby the site are primarily residential and recreational. The project site was previously occupied by the Colgate Rochester Crozer Divinity School. Hope Lodge continues operate on the Campus with 28 guest rooms. The study area includes the following existing intersections:
1. Elmwood Avenue/S Goodman Street 2. Highland Avenue/S Goodman Street 3. S Goodman Street/Pinetum Drive/Campus Drive
The project sponsor proposes to rezone the property from IPD to PD with a Development Concept Plan that will accommodate the use and reuse of the existing historic buildings, Strong Hall, Montgomery House and Trevor Hall; and, maintain and continue the use of Saunders House and Andrew Hall as apartment buildings. Two new apartment buildings will be constructed, one (115 units) to the north side of Strong Hall and the other (up to 40 units) to the east of Trevor Hall. The site will continue to have access to S. Goodman St via the existing Colgate Divinity driveway. Construction of the proposed project is expected to be completed over the next three (3) years depending on market conditions. The City of Rochester and Town of Brighton were contacted to discuss any other specific developments that are currently approved or under construction that would generate additional traffic in the study area. Two projects were identified:
1201 Elmwood Avenue re-development 1925 S. Clinton Avenue development
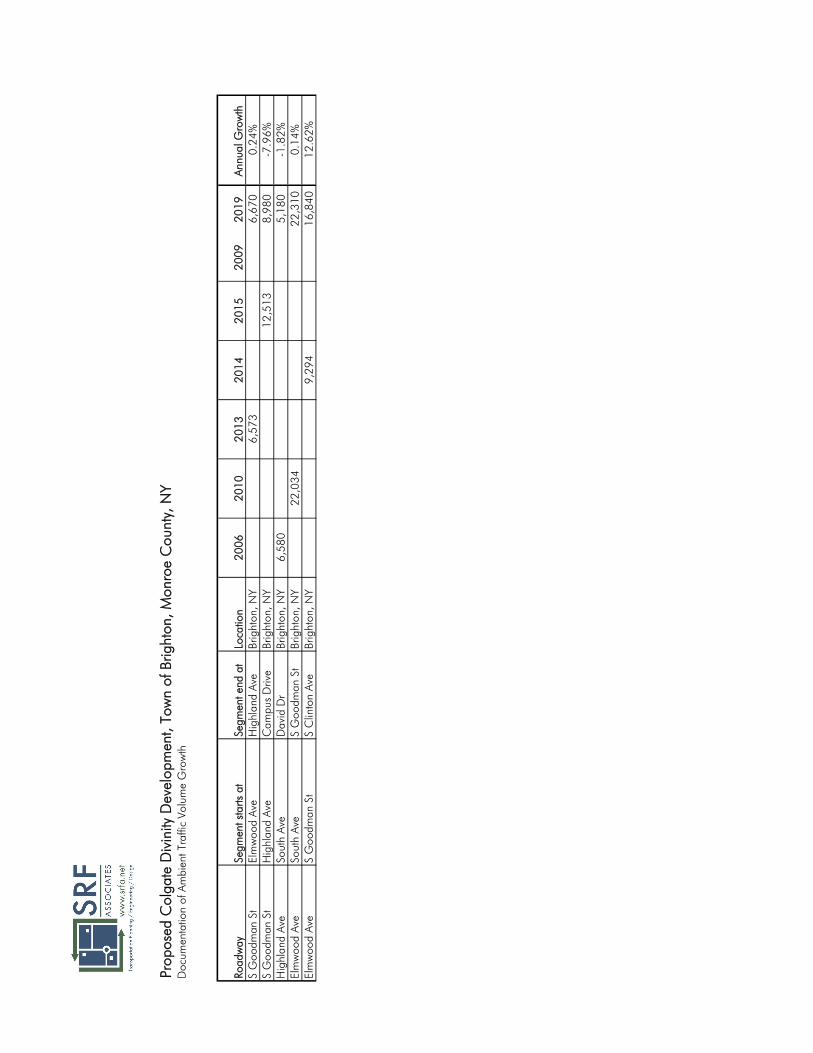
A review of historical NYSDOT traffic volume data compared to 2019 data collected by SRF indicated that traffic has varied significantly throughout the study area. To account for normal increases in background traffic growth, including any unforeseen developments in the project study area aside from the previously mentioned projects, a growth rate of 1.5% per year (consistent with MCDOT guidelines for growth rates in the City of Rochester) has been applied to the existing traffic volumes for the three-year build-out timeframe. Traffic specific to the approved developments identified above has also been added to the background traffic volumes.
v May 2019
Multi-Modal Traffic Impact Study Proposed Colgate Divinity Re-Development City of Rochester, NY
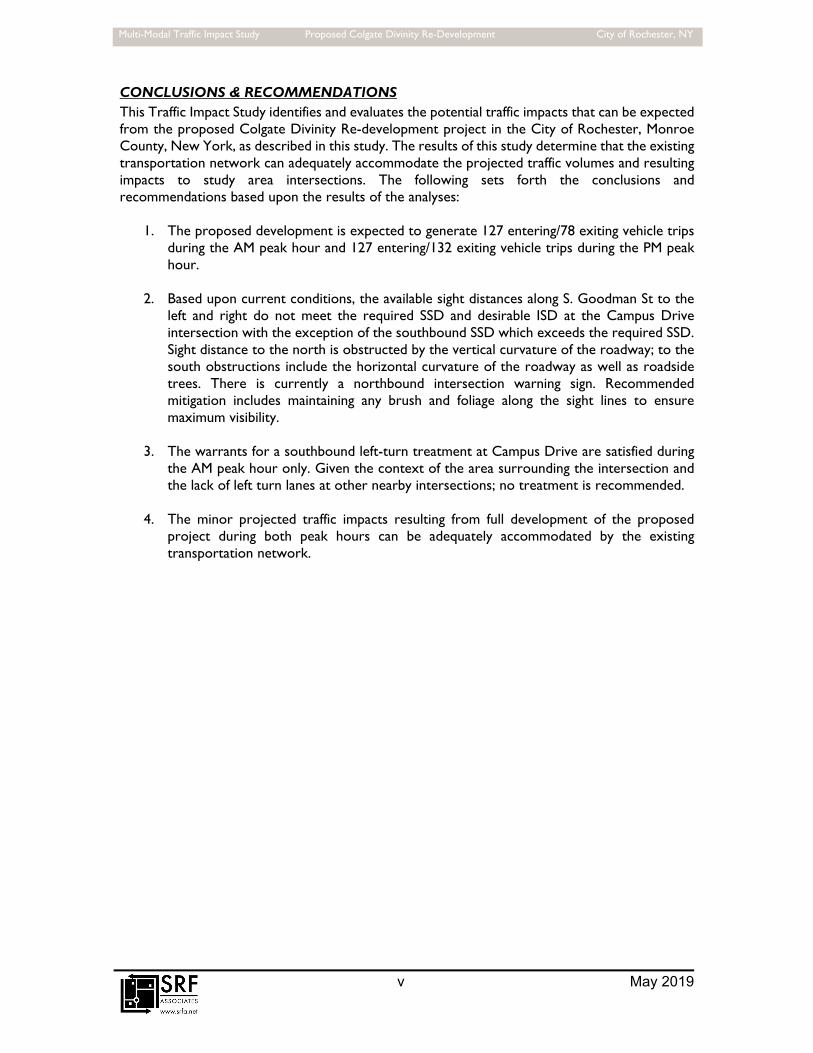
CONCLUSIONS & RECOMMENDATIONS This Traffic Impact Study identifies and evaluates the potential traffic impacts that can be expected from the proposed Colgate Divinity Re-development project in the City of Rochester, Monroe County, New York, as described in this study. The results of this study determine that the existing transportation network can adequately accommodate the projected traffic volumes and resulting impacts to study area intersections. The following sets forth the conclusions and recommendations based upon the results of the analyses:
1. The proposed development is expected to generate 127 entering/78 exiting vehicle trips during the AM peak hour and 127 entering/132 exiting vehicle trips during the PM peak hour.
2. Based upon current conditions, the available sight distances along S. Goodman St to the left and right do not meet the required SSD and desirable ISD at the Campus Drive intersection with the exception of the southbound SSD which exceeds the required SSD. Sight distance to the north is obstructed by the vertical curvature of the roadway; to the south obstructions include the horizontal curvature of the roadway as well as roadside trees. There is currently a northbound intersection warning sign. Recommended mitigation includes maintaining any brush and foliage along the sight lines to ensure maximum visibility.
3. The warrants for a southbound left-turn treatment at Campus Drive are satisfied during the AM peak hour only. Given the context of the area surrounding the intersection and the lack of left turn lanes at other nearby intersections; no treatment is recommended.
4. The minor projected traffic impacts resulting from full development of the proposed project during both peak hours can be adequately accommodated by the existing transportation network.
1 May 2019
Multi-Modal Traffic Impact Study Proposed Colgate Divinity Re-Development City of Rochester, NY
I. INTRODUCTION
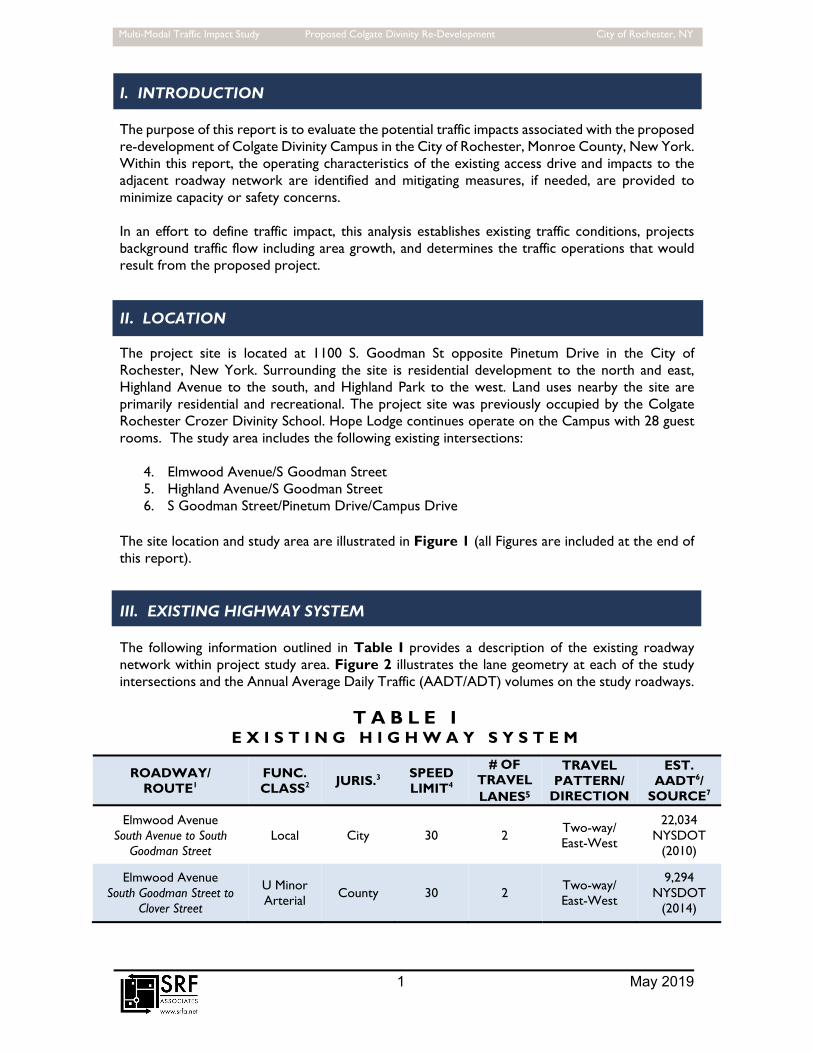
The purpose of this report is to evaluate the potential traffic impacts associated with the proposed re-development of Colgate Divinity Campus in the City of Rochester, Monroe County, New York. Within this report, the operating characteristics of the existing access drive and impacts to the adjacent roadway network are identified and mitigating measures, if needed, are provided to minimize capacity or safety concerns. In an effort to define traffic impact, this analysis establishes existing traffic conditions, projects background traffic flow including area growth, and determines the traffic operations that would result from the proposed project. II. LOCATION The project site is located at 1100 S. Goodman St opposite Pinetum Drive in the City of Rochester, New York. Surrounding the site is residential development to the north and east, Highland Avenue to the south, and Highland Park to the west. Land uses nearby the site are primarily residential and recreational. The project site was previously occupied by the Colgate Rochester Crozer Divinity School. Hope Lodge continues operate on the Campus with 28 guest rooms. The study area includes the following existing intersections:
4. Elmwood Avenue/S Goodman Street 5. Highland Avenue/S Goodman Street 6. S Goodman Street/Pinetum Drive/Campus Drive
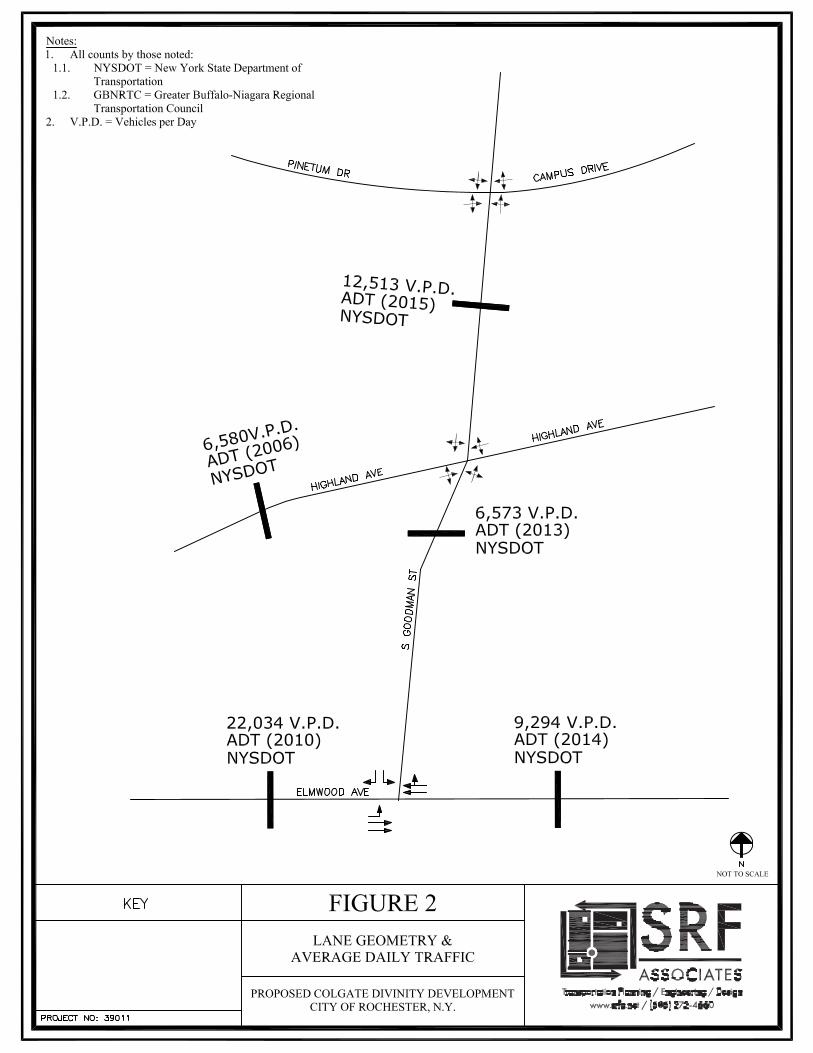
The site location and study area are illustrated in Figure 1 (all Figures are included at the end of this report). III. EXISTING HIGHWAY SYSTEM The following information outlined in Table I provides a description of the existing roadway network within project study area. Figure 2 illustrates the lane geometry at each of the study intersections and the Annual Average Daily Traffic (AADT/ADT) volumes on the study roadways.
T A B L E I E X I S T I N G H I G H W A Y S Y S T E M
ROADWAY/ ROUTE1
FUNC. CLASS2
JURIS.3 SPEED LIMIT4
# OF TRAVEL LANES5
TRAVEL PATTERN/
DIRECTION
EST. AADT6/
SOURCE7
Elmwood Avenue South Avenue to South
Goodman Street Local City 30 2
Two-way/ East-West
22,034 NYSDOT
(2010)
Elmwood Avenue South Goodman Street to
Clover Street
U Minor Arterial County 30 2
Two-way/ East-West
9,294 NYSDOT
(2014)
2 May 2019
Multi-Modal Traffic Impact Study Proposed Colgate Divinity Re-Development City of Rochester, NY
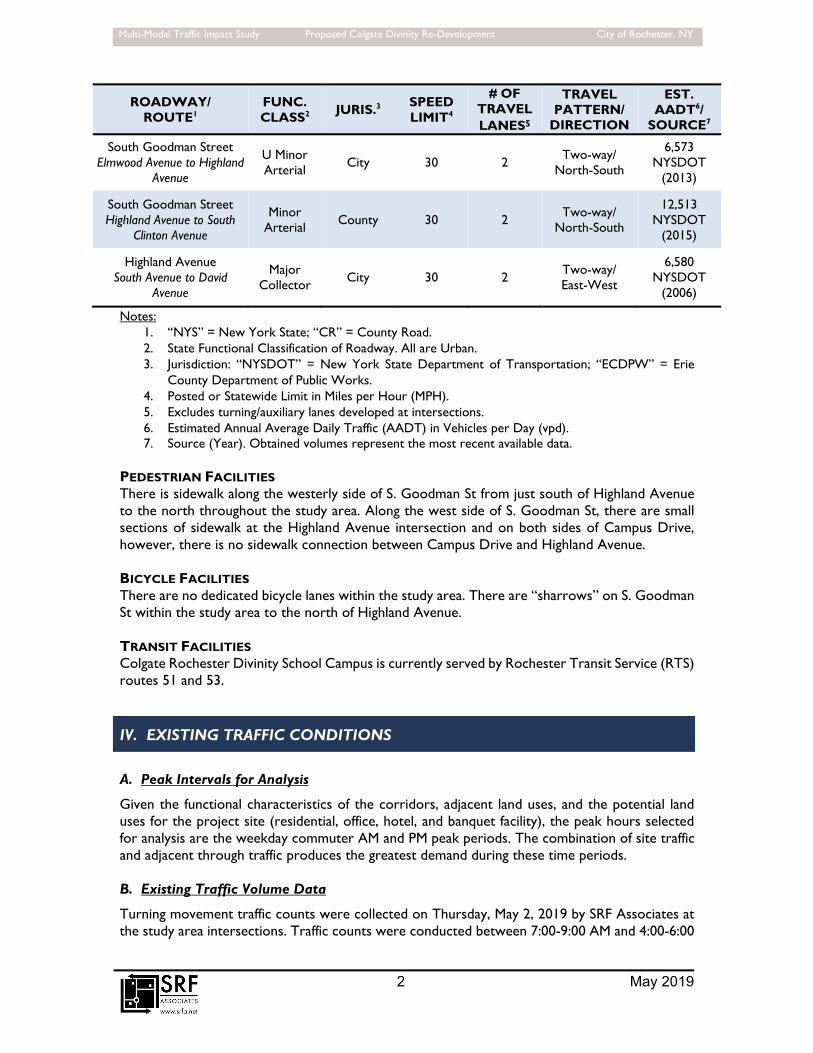
ROADWAY/ ROUTE1
FUNC. CLASS2
JURIS.3 SPEED LIMIT4
# OF TRAVEL LANES5
TRAVEL PATTERN/
DIRECTION
EST. AADT6/
SOURCE7
South Goodman Street Elmwood Avenue to Highland
Avenue
U Minor Arterial City 30 2
Two-way/ North-South
6,573 NYSDOT
(2013)
South Goodman Street Highland Avenue to South
Clinton Avenue
Minor Arterial County 30 2
Two-way/ North-South
12,513 NYSDOT
(2015)
Highland Avenue South Avenue to David
Avenue
Major Collector City 30 2
Two-way/ East-West
6,580 NYSDOT
(2006)
Notes: 1. “NYS” = New York State; “CR” = County Road. 2. State Functional Classification of Roadway. All are Urban. 3. Jurisdiction: “NYSDOT” = New York State Department of Transportation; “ECDPW” = Erie
County Department of Public Works. 4. Posted or Statewide Limit in Miles per Hour (MPH). 5. Excludes turning/auxiliary lanes developed at intersections. 6. Estimated Annual Average Daily Traffic (AADT) in Vehicles per Day (vpd). 7. Source (Year). Obtained volumes represent the most recent available data.
PEDESTRIAN FACILITIES There is sidewalk along the westerly side of S. Goodman St from just south of Highland Avenue to the north throughout the study area. Along the west side of S. Goodman St, there are small sections of sidewalk at the Highland Avenue intersection and on both sides of Campus Drive, however, there is no sidewalk connection between Campus Drive and Highland Avenue. BICYCLE FACILITIES There are no dedicated bicycle lanes within the study area. There are “sharrows” on S. Goodman St within the study area to the north of Highland Avenue. TRANSIT FACILITIES Colgate Rochester Divinity School Campus is currently served by Rochester Transit Service (RTS) routes 51 and 53. IV. EXISTING TRAFFIC CONDITIONS
A. Peak Intervals for Analysis
Given the functional characteristics of the corridors, adjacent land uses, and the potential land uses for the project site (residential, office, hotel, and banquet facility), the peak hours selected for analysis are the weekday commuter AM and PM peak periods. The combination of site traffic and adjacent through traffic produces the greatest demand during these time periods.
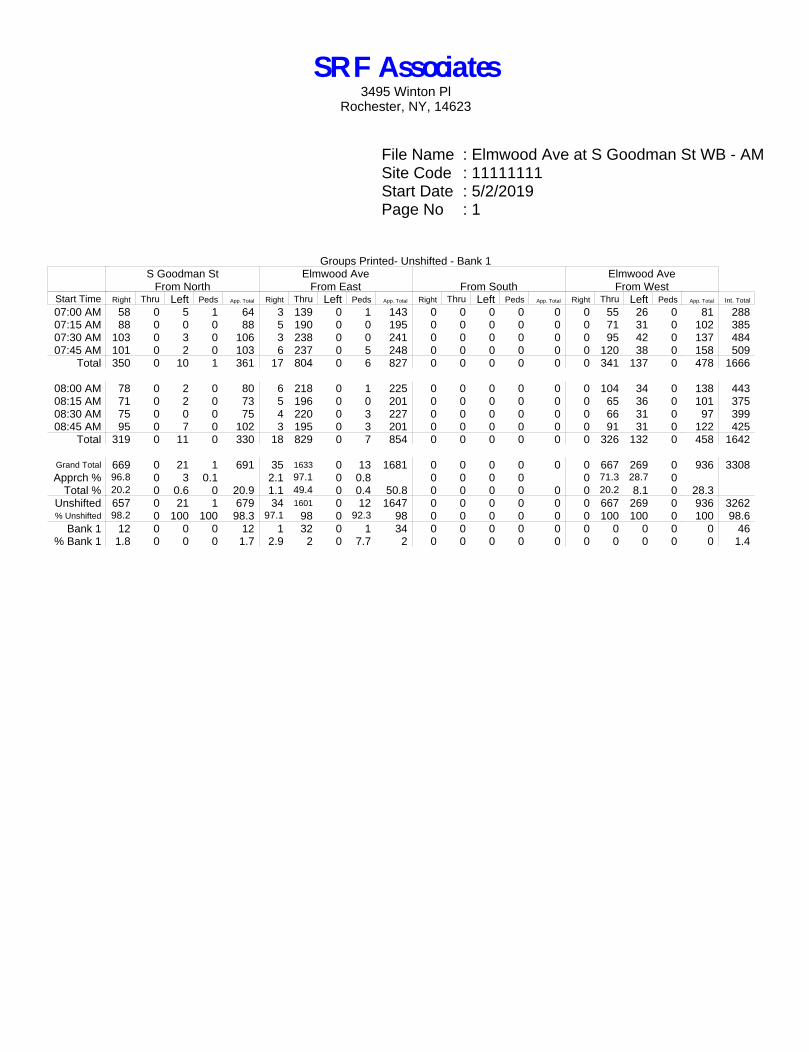
B. Existing Traffic Volume Data
Turning movement traffic counts were collected on Thursday, May 2, 2019 by SRF Associates at the study area intersections. Traffic counts were conducted between 7:00-9:00 AM and 4:00-6:00
3 May 2019
Multi-Modal Traffic Impact Study Proposed Colgate Divinity Re-Development City of Rochester, NY
PM for the weekday commuter AM and PM peak hours. The peak hour traffic periods generally occurred between 7:15-8:15 AM and 4:45-5:45 PM.
All turning movement count data was collected on a typical weekday. No adverse weather conditions impacted the traffic counts and all schools in the vicinity of the study area were in session. The traffic volumes were reviewed to confirm the accuracy and relative balance of the collective traffic counts. The actual differences in traffic volumes can be attributed to temporal variations in traffic volumes as well as activity related to driveways located in the segments between the study intersections. The 2019 existing weekday AM and PM peak hour volumes are reflected in Figure 3.
C. Field Observations
The study intersections were observed during both peak intervals to assess current traffic operations. Signal timing information was obtained from MCDOT Synchro files for the S. Goodman St/Highland Ave intersection and were utilized to determine peak hour phasing plans and phase durations during each interval. This information was used to support and/or calibrate capacity analysis models described in detail later in this report.
D. Sight Distance Evaluation
Sight distance was investigated at the existing Campus Drive intersection along S. Goodman St. Sight distance is provided at intersections to allow drivers to perceive the presence of potentially conflicting vehicles. This should occur in sufficient time for a motorist to stop or adjust their speed, as appropriate, to avoid a collision at the intersection. Sight distance is also provided at intersections to allow the drivers of stopped vehicles a sufficient view of the intersecting highway to anticipate and avoid potential incidents. If the available sight distance for an entering or crossing vehicle is at least equal to the appropriate Stopping Sight Distance (SSD) for the major road, then drivers have sufficient sight distance to anticipate and avoid collisions. To enhance traffic operations, Intersection Sight Distances (ISD) that exceed stopping sight distances are desirable along the major road.
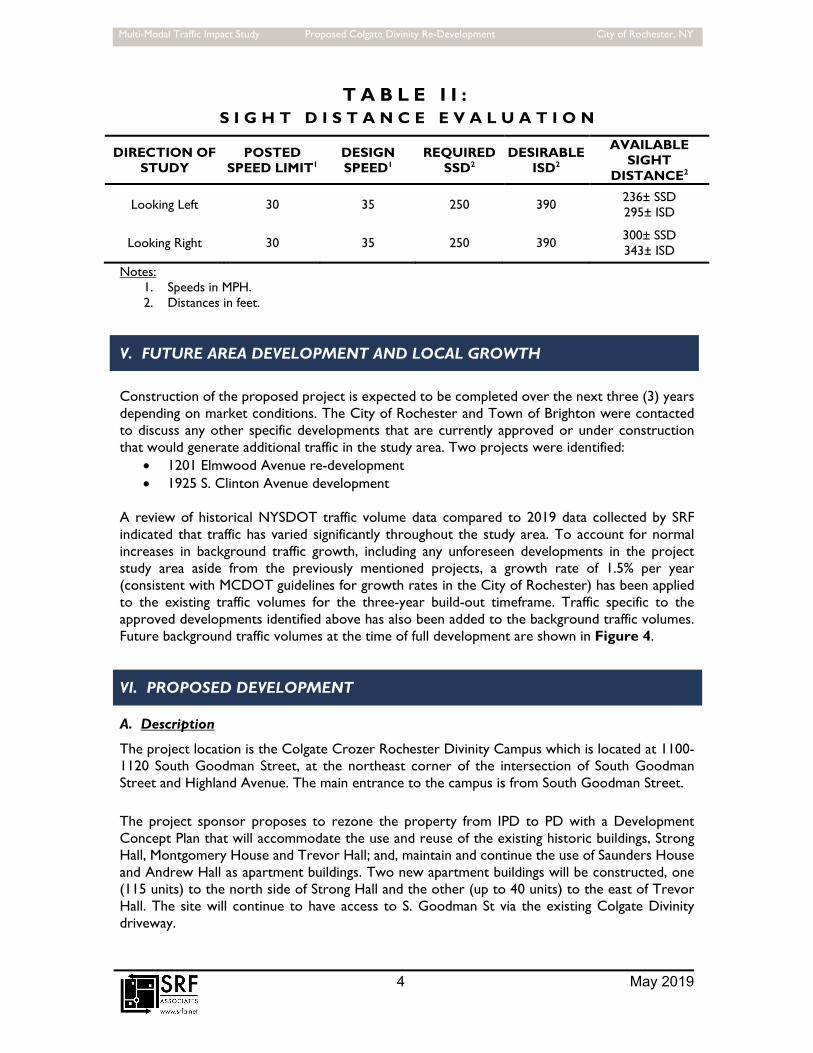
A Policy on Geometric Design of Highways and Streets 6th Edition (2011), published by the American Association of State Highway and Transportation Officials (AASHTO), was used as a reference to establish the required SSD and desirable ISD for the proposed access driveway location. Required SSD and desirable ISD are based on the design speed for a given section of roadway; generally, the design speed is the posted speed limit plus 5 MPH. In this case, the posted speed limit at the proposed access driveway location is 30 MPH. Hence a design speed of 35 MPH was used. The required SSD and desirable ISD based on the design speeds are shown in Table II. Based upon current conditions, the available sight distances along S. Goodman St to the left and right do not meet the required SSD and desirable ISD at the Campus Drive intersection with the exception of the southbound SSD which exceeds the required SSD. Sight distance to the north is obstructed by the vertical curvature of the roadway; to the south obstructions include the horizontal curvature of the roadway as well as roadside trees. There is currently a northbound intersection warning sign. Recommended mitigation includes maintaining any brush and foliage along the sight lines to ensure maximum visibility.
4 May 2019
Multi-Modal Traffic Impact Study Proposed Colgate Divinity Re-Development City of Rochester, NY
T A B L E I I : S I G H T D I S T A N C E E V A L U A T I O N
DIRECTION OF STUDY
POSTED SPEED LIMIT1
DESIGN SPEED1
REQUIRED SSD2
DESIRABLE ISD2
AVAILABLE SIGHT
DISTANCE2
Looking Left 30 35 250 390 236± SSD 295± ISD
Looking Right 30 35 250 390 300± SSD 343± ISD
Notes: 1. Speeds in MPH. 2. Distances in feet.
V. FUTURE AREA DEVELOPMENT AND LOCAL GROWTH
Construction of the proposed project is expected to be completed over the next three (3) years depending on market conditions. The City of Rochester and Town of Brighton were contacted to discuss any other specific developments that are currently approved or under construction that would generate additional traffic in the study area. Two projects were identified:
1201 Elmwood Avenue re-development 1925 S. Clinton Avenue development
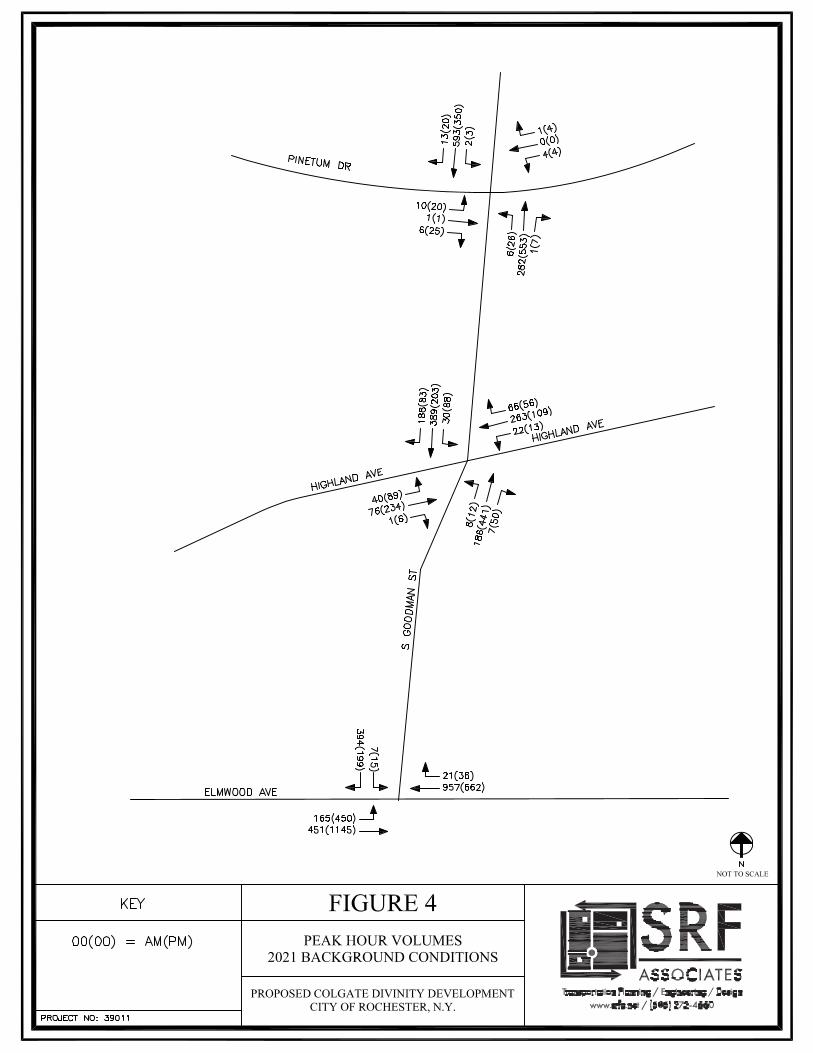
A review of historical NYSDOT traffic volume data compared to 2019 data collected by SRF indicated that traffic has varied significantly throughout the study area. To account for normal increases in background traffic growth, including any unforeseen developments in the project study area aside from the previously mentioned projects, a growth rate of 1.5% per year (consistent with MCDOT guidelines for growth rates in the City of Rochester) has been applied to the existing traffic volumes for the three-year build-out timeframe. Traffic specific to the approved developments identified above has also been added to the background traffic volumes. Future background traffic volumes at the time of full development are shown in Figure 4. VI. PROPOSED DEVELOPMENT
A. Description
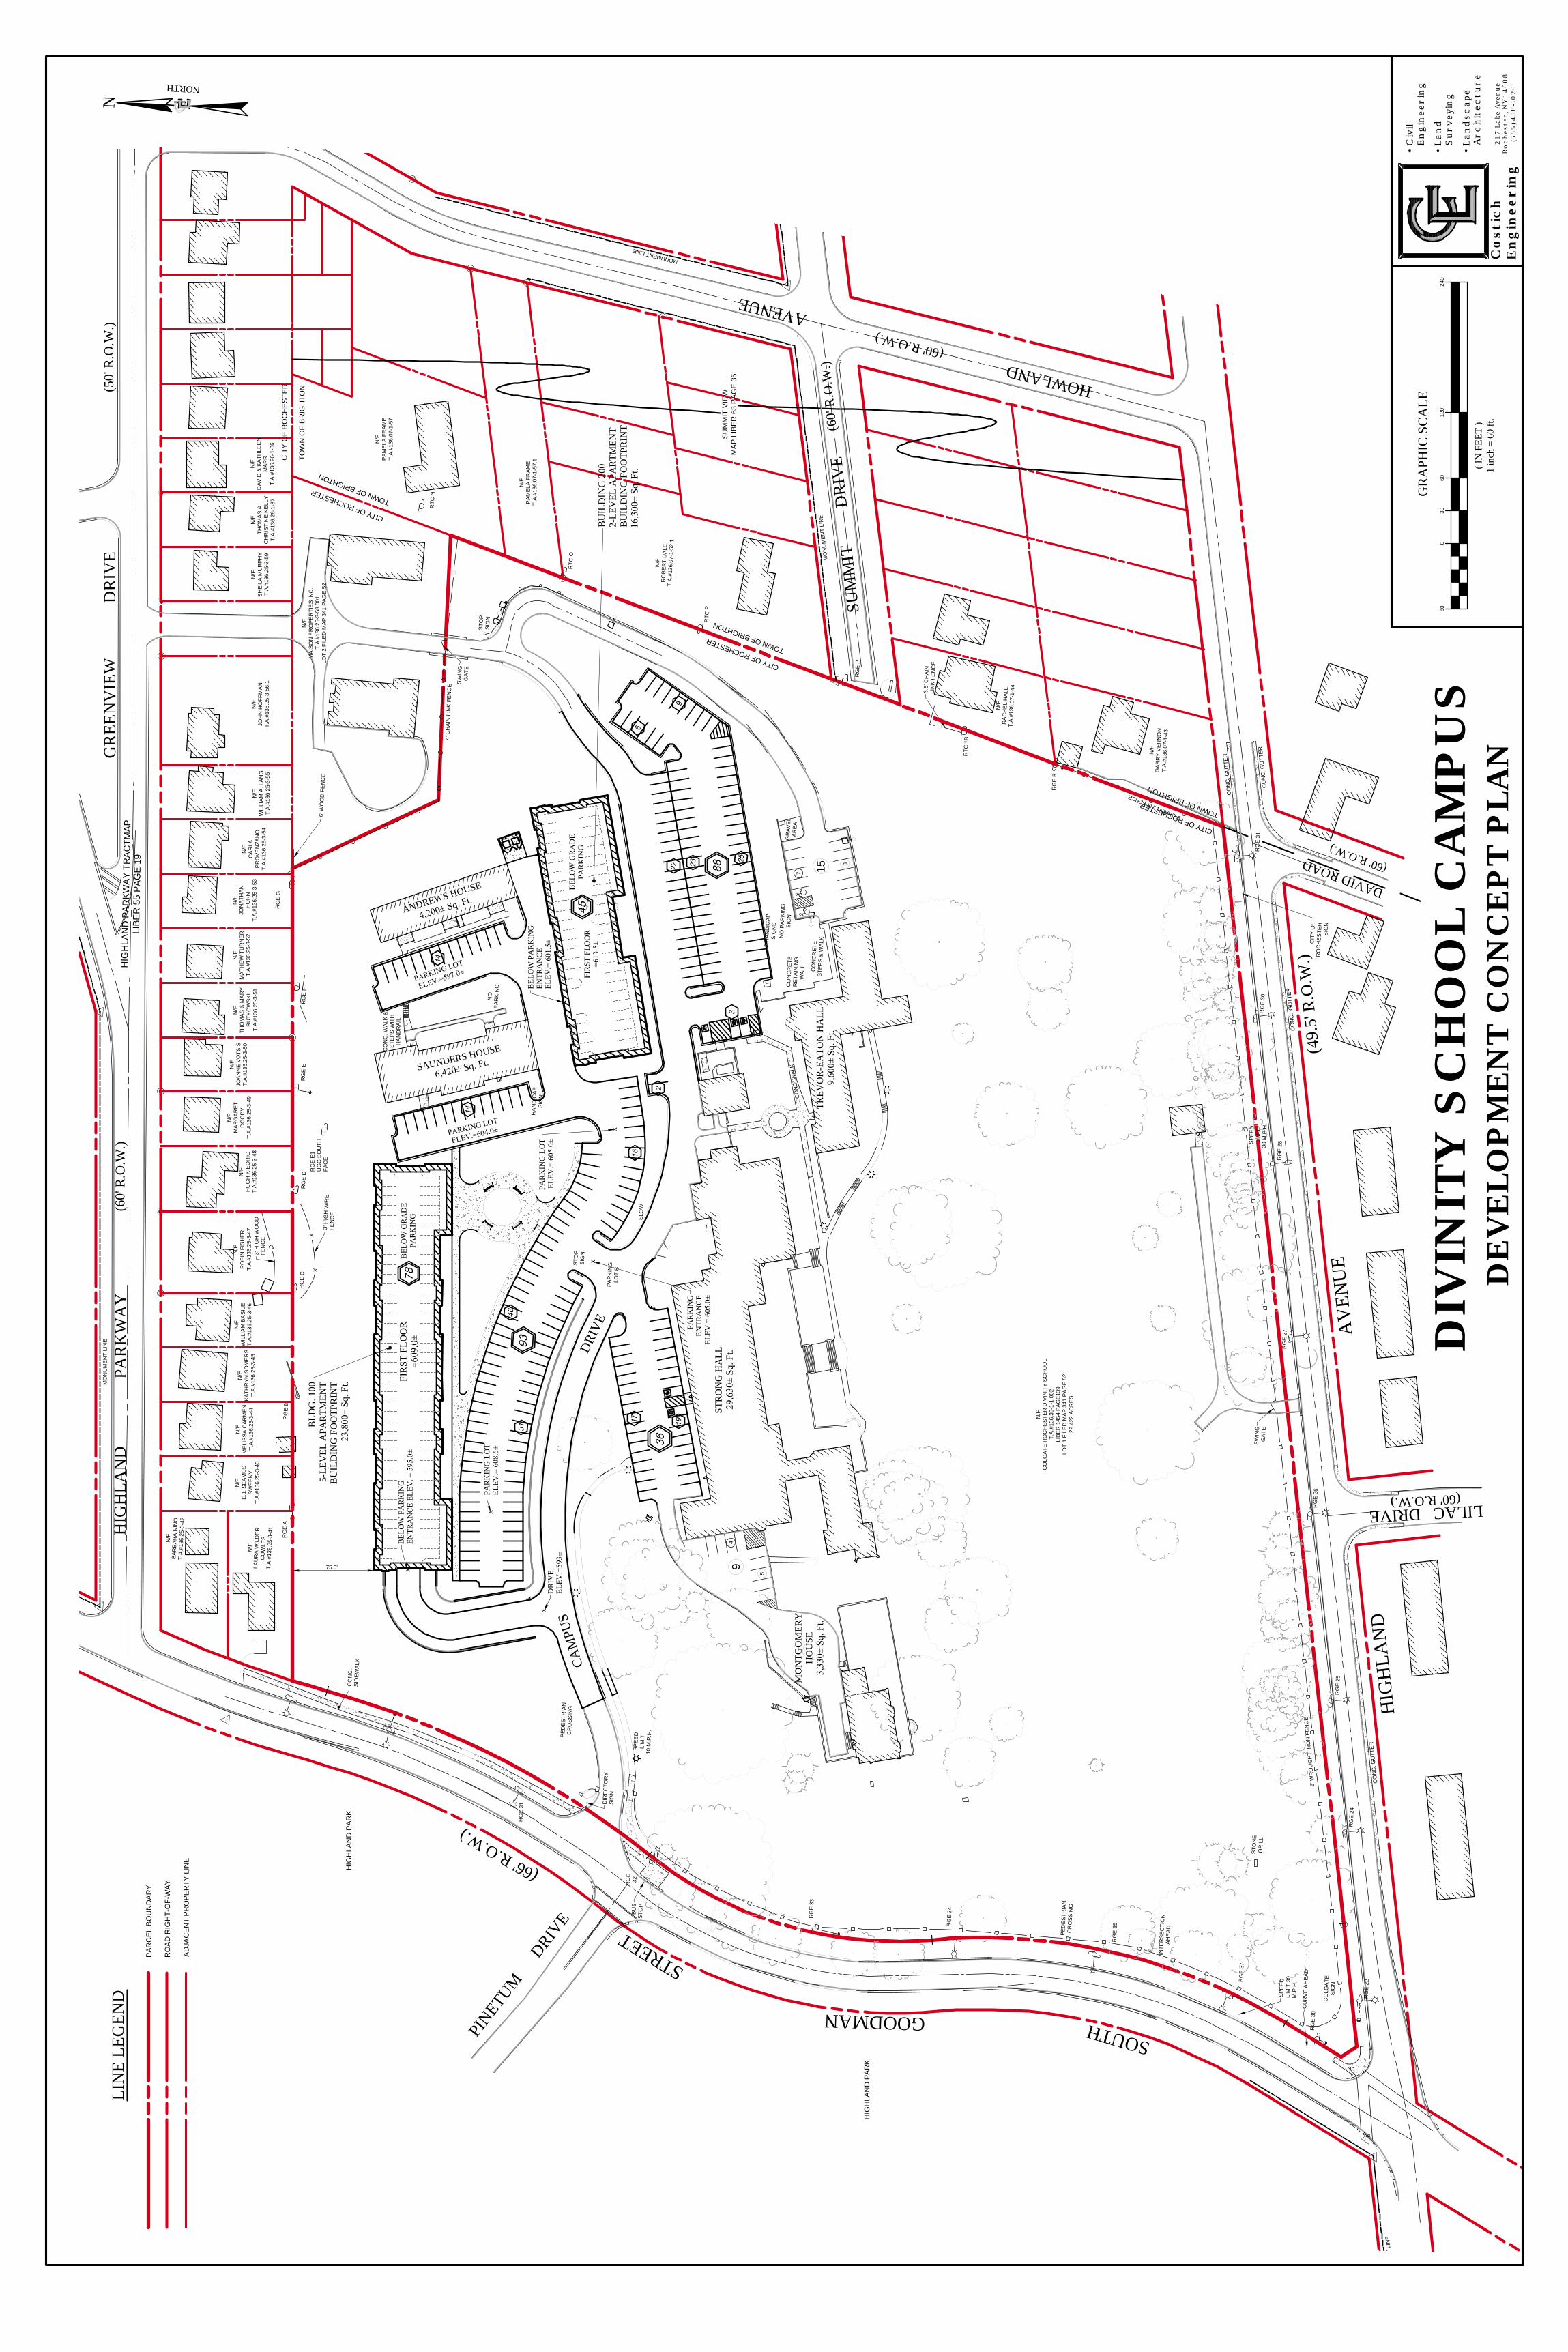
The project location is the Colgate Crozer Rochester Divinity Campus which is located at 1100-1120 South Goodman Street, at the northeast corner of the intersection of South Goodman Street and Highland Avenue. The main entrance to the campus is from South Goodman Street. The project sponsor proposes to rezone the property from IPD to PD with a Development Concept Plan that will accommodate the use and reuse of the existing historic buildings, Strong Hall, Montgomery House and Trevor Hall; and, maintain and continue the use of Saunders House and Andrew Hall as apartment buildings. Two new apartment buildings will be constructed, one (115 units) to the north side of Strong Hall and the other (up to 40 units) to the east of Trevor Hall. The site will continue to have access to S. Goodman St via the existing Colgate Divinity driveway.
5 May 2019
Multi-Modal Traffic Impact Study Proposed Colgate Divinity Re-Development City of Rochester, NY
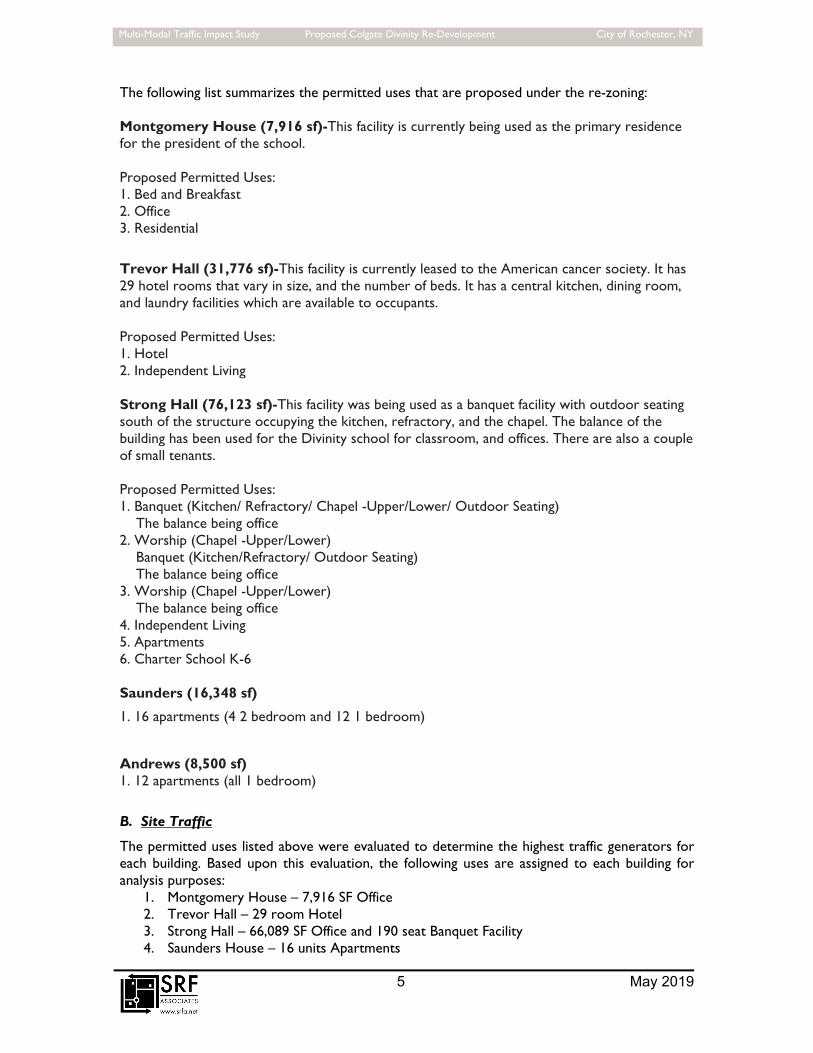
The following list summarizes the permitted uses that are proposed under the re-zoning: Montgomery House (7,916 sf)-This facility is currently being used as the primary residence for the president of the school. Proposed Permitted Uses: 1. Bed and Breakfast 2. Office 3. Residential
Trevor Hall (31,776 sf)-This facility is currently leased to the American cancer society. It has 29 hotel rooms that vary in size, and the number of beds. It has a central kitchen, dining room, and laundry facilities which are available to occupants. Proposed Permitted Uses: 1. Hotel 2. Independent Living Strong Hall (76,123 sf)-This facility was being used as a banquet facility with outdoor seating south of the structure occupying the kitchen, refractory, and the chapel. The balance of the building has been used for the Divinity school for classroom, and offices. There are also a couple of small tenants. Proposed Permitted Uses: 1. Banquet (Kitchen/ Refractory/ Chapel -Upper/Lower/ Outdoor Seating) The balance being office 2. Worship (Chapel -Upper/Lower) Banquet (Kitchen/Refractory/ Outdoor Seating) The balance being office 3. Worship (Chapel -Upper/Lower) The balance being office 4. Independent Living 5. Apartments 6. Charter School K-6 Saunders (16,348 sf)
1. 16 apartments (4 2 bedroom and 12 1 bedroom)
Andrews (8,500 sf) 1. 12 apartments (all 1 bedroom)
B. Site Traffic
The permitted uses listed above were evaluated to determine the highest traffic generators for each building. Based upon this evaluation, the following uses are assigned to each building for analysis purposes:
1. Montgomery House – 7,916 SF Office 2. Trevor Hall – 29 room Hotel 3. Strong Hall – 66,089 SF Office and 190 seat Banquet Facility 4. Saunders House – 16 units Apartments
6 May 2019
Multi-Modal Traffic Impact Study Proposed Colgate Divinity Re-Development City of Rochester, NY
5. Andrews House – 12 units Apartments 6. Two new buildings – 130 units Apartments total
The combination of these uses generates the highest volume of peak hour traffic compared to all of the uses permitted under the proposed zoning. Data contained in Trip Generation, 10th Edition, published by the Institute of Transportation Engineers (ITE) in 2017 was used to project the volume of traffic generated by the proposed development. Data published by the ITE is the nationally accepted standard for generating trips for new uses. According to the ITE, the following steps are recommended when determining trip generation for proposed land uses:
1. Check for the availability of local trip generation rates for comparable uses.
2. If local trip data for similar developments are not available and time and funding permit, conduct trip generation studies at sites with characteristics similar to those of the proposed development.
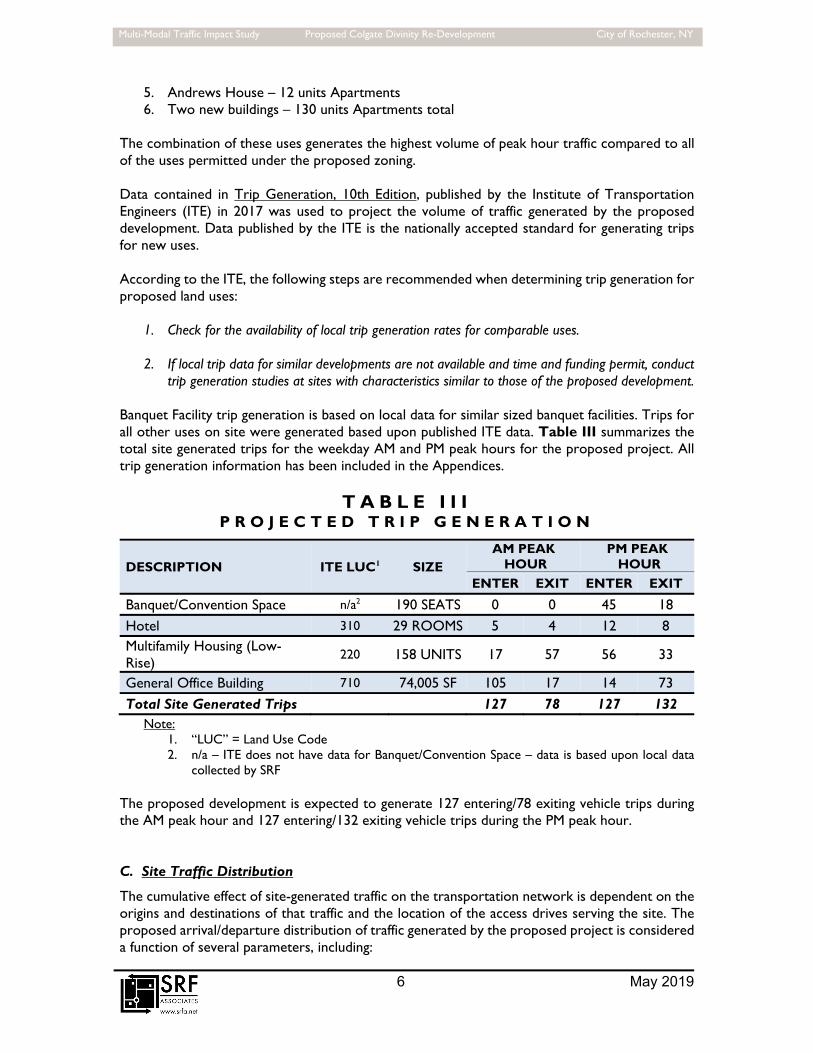
Banquet Facility trip generation is based on local data for similar sized banquet facilities. Trips for all other uses on site were generated based upon published ITE data. Table III summarizes the total site generated trips for the weekday AM and PM peak hours for the proposed project. All trip generation information has been included in the Appendices.
T A B L E I I I
P R O J E C T E D T R I P G E N E R A T I O N
DESCRIPTION ITE LUC1 SIZE AM PEAK
HOUR PM PEAK
HOUR
ENTER EXIT ENTER EXIT
Banquet/Convention Space n/a2 190 SEATS 0 0 45 18
Hotel 310 29 ROOMS 5 4 12 8
Multifamily Housing (Low-Rise)
220 158 UNITS 17 57 56 33
General Office Building 710 74,005 SF 105 17 14 73
Total Site Generated Trips 127 78 127 132
Note: 1. “LUC” = Land Use Code 2. n/a – ITE does not have data for Banquet/Convention Space – data is based upon local data
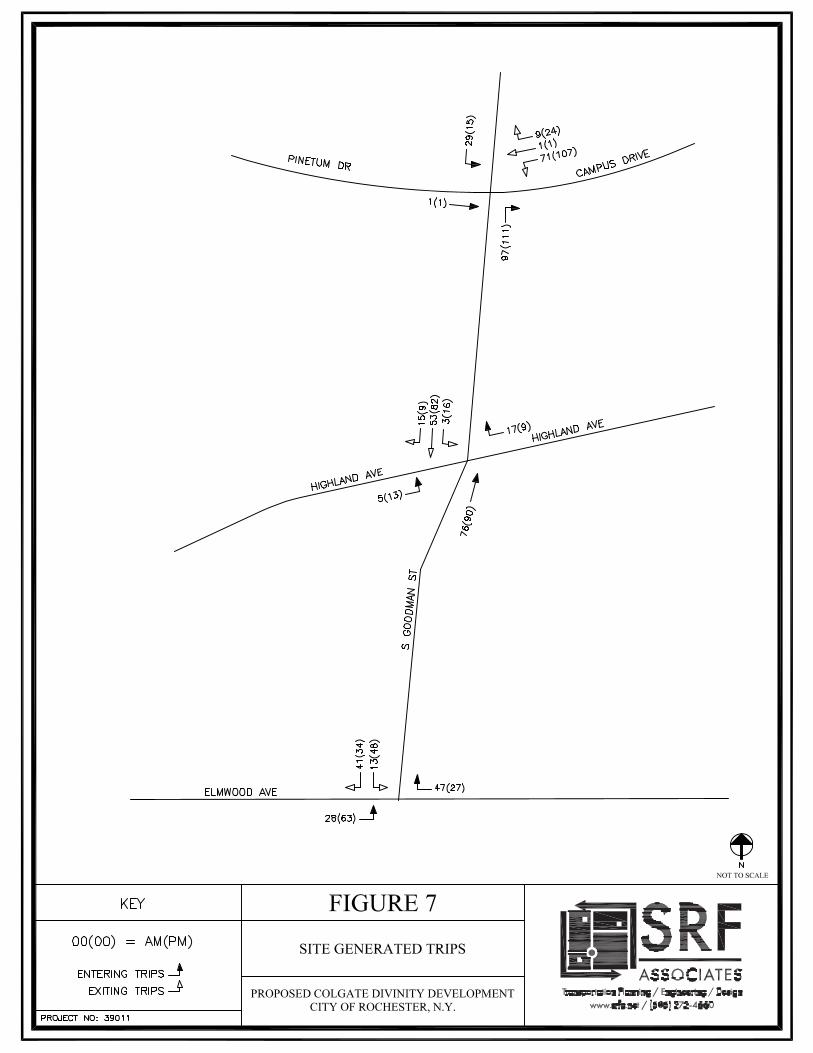
collected by SRF The proposed development is expected to generate 127 entering/78 exiting vehicle trips during the AM peak hour and 127 entering/132 exiting vehicle trips during the PM peak hour.
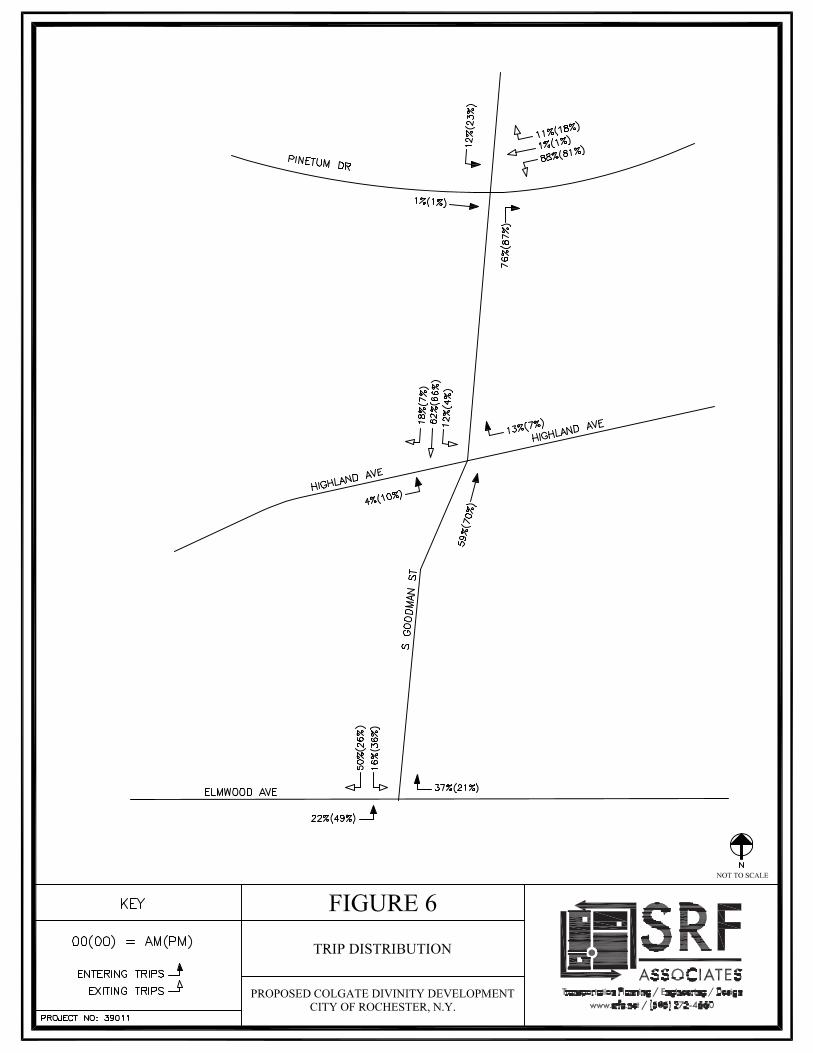
C. Site Traffic Distribution
The cumulative effect of site-generated traffic on the transportation network is dependent on the origins and destinations of that traffic and the location of the access drives serving the site. The proposed arrival/departure distribution of traffic generated by the proposed project is considered a function of several parameters, including:
7 May 2019
Multi-Modal Traffic Impact Study Proposed Colgate Divinity Re-Development City of Rochester, NY
Employment centers; Commercial centers in the area; Location the existing site driveway; Existing traffic patterns; and Existing traffic conditions and controls
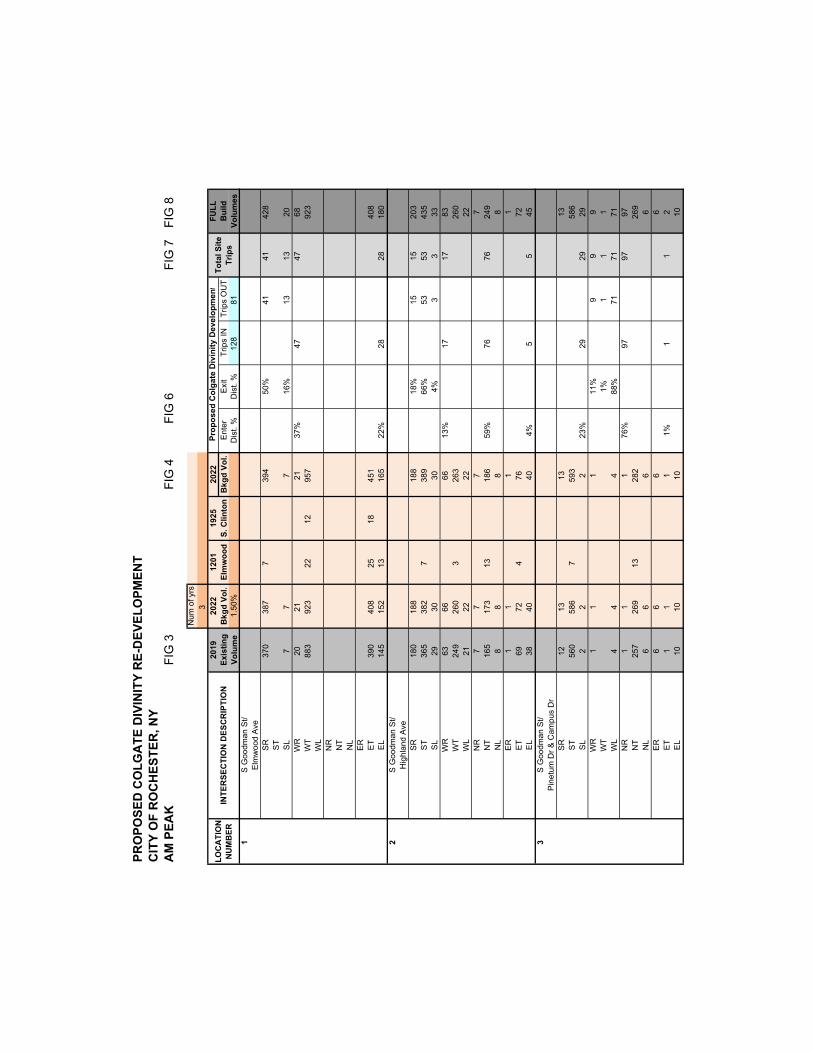
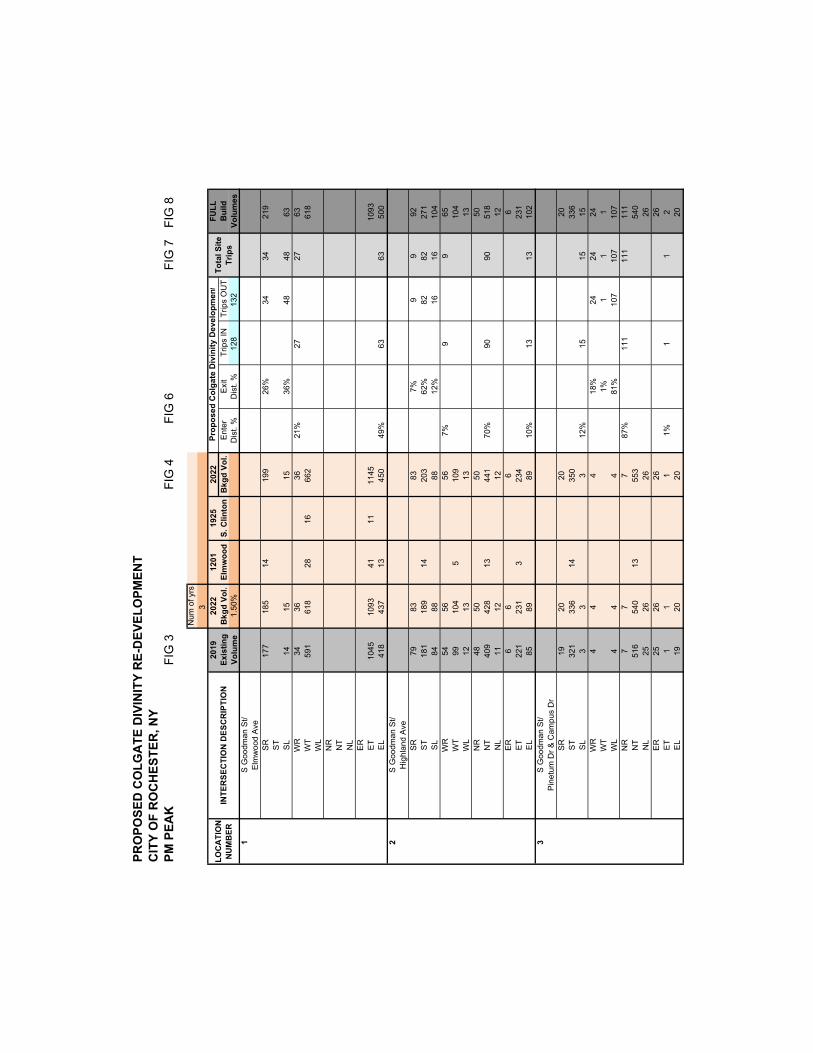
Figure 6 shows the anticipated trip distribution pattern percentages for the traffic from the proposed project. Figure 7 illustrates the peak hour site generated traffic based on those percentages.
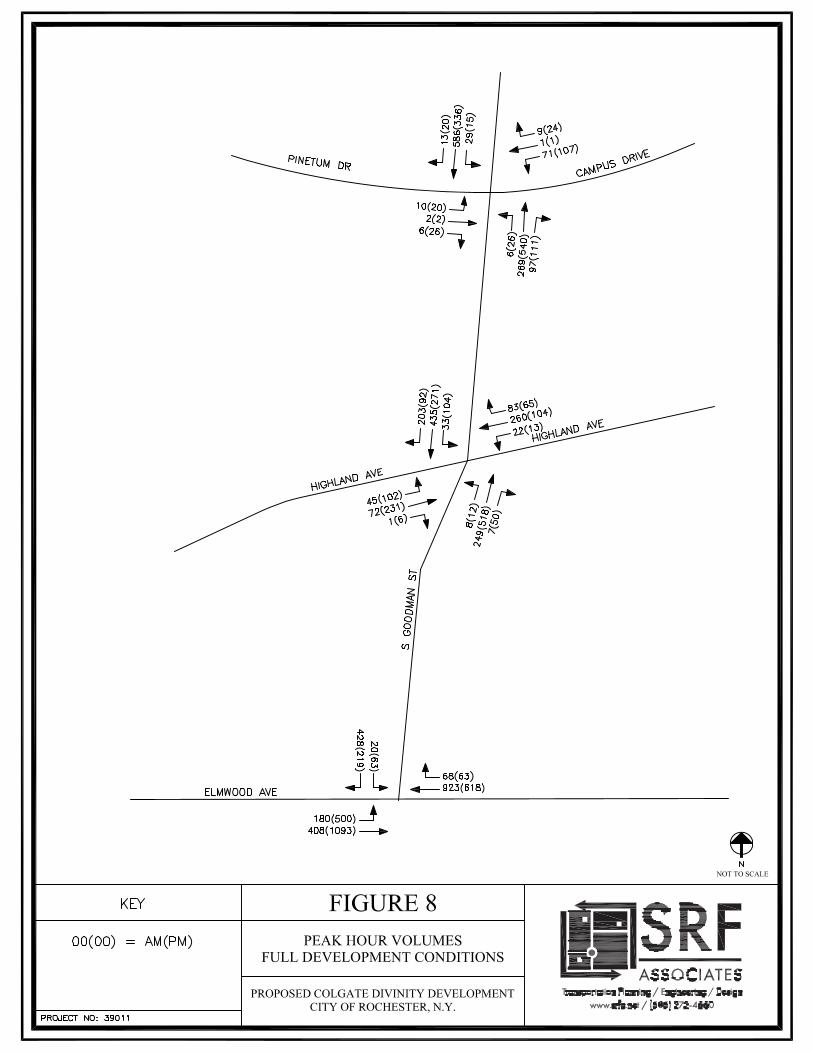
VII. FULL DEVELOPMENT VOLUMES
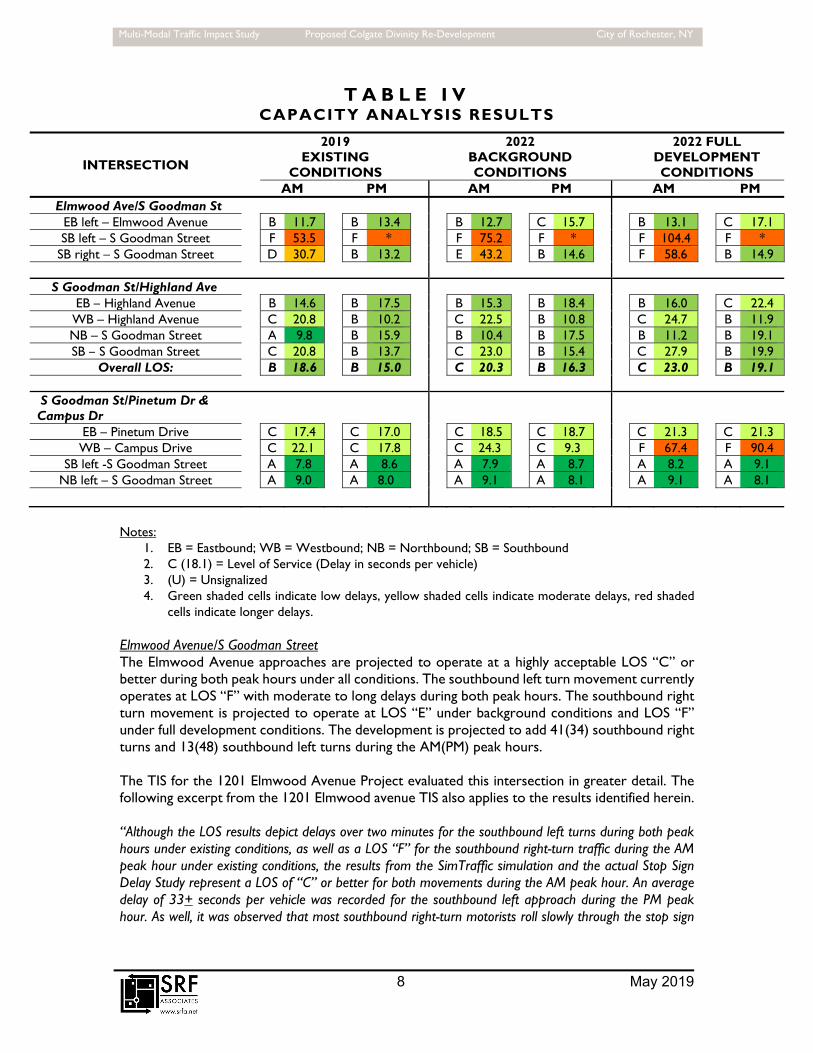
Proposed design hour traffic volumes are developed for the AM and PM peak hours by combining the background traffic conditions (Figure 4) and the new site-generated traffic volumes (Figure 7) to yield the traffic volumes under full development conditions. The resulting design hour volumes for the proposed project are illustrated in Figure 8 under full build-out conditions. VIII. CAPACITY ANALYSIS Capacity analysis is a technique used for determining a measure of effectiveness for a section of roadway and/or intersection based on the number of vehicles during a specific time period. The measure of effectiveness used for the capacity analysis is referred to as a Level of Service (LOS). Levels of Service are calculated to provide an indication of the amount of delay that a motorist experiences while traveling along a roadway or through an intersection. Since the most amount of delay to motorists usually occurs at intersections, capacity analysis typically focuses on intersections, as opposed to highway segments. Six Levels of Service are defined for analysis purposes. They are assigned letter designations, from "A" to "F", with LOS "A" representing the best conditions and LOS "F" the worst. Suggested ranges of service capacity and an explanation of Levels of Service are included in the Appendices. The standard procedure for capacity analysis of signalized and un-signalized intersections is outlined in the Highway Capacity Manual (HCM) 6th Edition (2016) published by the Transportation Research Board (TRB). Traffic analysis software, SYNCHRO 10, which is based on procedures and methodologies contained in the HCM, was used to analyze operating conditions at study area intersections. The procedure yields a LOS based on the HCM 6th Edition as an indicator of how well intersections operate. Existing and background operating conditions during the peak study periods are evaluated to determine a basis for comparison with the projected future conditions. The future traffic conditions generated by the project were analyzed to assess the operation of the study area intersections. Capacity results for existing, background, and full development conditions are listed in Table IV. The discussion following the table summarizes capacity conditions. All capacity analysis calculations are included in the Appendices.
8 May 2019
Multi-Modal Traffic Impact Study Proposed Colgate Divinity Re-Development City of Rochester, NY
T A B L E I V CAPACITY ANALYSIS RESULTS
INTERSECTION
2019 EXISTING
CONDITIONS
2022
BACKGROUND CONDITIONS
2022 FULL
DEVELOPMENT CONDITIONS
AM PM AM PM AM PM Elmwood Ave/S Goodman St
EB left – Elmwood Avenue B 11.7 B 13.4 B 12.7 C 15.7 B 13.1 C 17.1 SB left – S Goodman Street F 53.5 F * F 75.2 F * F 104.4 F *
SB right – S Goodman Street D 30.7 B 13.2 E 43.2 B 14.6 F 58.6 B 14.9
S Goodman St/Highland Ave EB – Highland Avenue B 14.6 B 17.5 B 15.3 B 18.4 B 16.0 C 22.4 WB – Highland Avenue C 20.8 B 10.2 C 22.5 B 10.8 C 24.7 B 11.9 NB – S Goodman Street A 9.8 B 15.9 B 10.4 B 17.5 B 11.2 B 19.1 SB – S Goodman Street C 20.8 B 13.7 C 23.0 B 15.4 C 27.9 B 19.9
Overall LOS: B 18.6 B 15.0 C 20.3 B 16.3 C 23.0 B 19.1
S Goodman St/Pinetum Dr & Campus Dr
EB – Pinetum Drive C 17.4 C 17.0 C 18.5 C 18.7 C 21.3 C 21.3 WB – Campus Drive C 22.1 C 17.8 C 24.3 C 9.3 F 67.4 F 90.4
SB left -S Goodman Street A 7.8 A 8.6 A 7.9 A 8.7 A 8.2 A 9.1 NB left – S Goodman Street A 9.0 A 8.0 A 9.1 A 8.1 A 9.1 A 8.1
Notes:
1. EB = Eastbound; WB = Westbound; NB = Northbound; SB = Southbound 2. C (18.1) = Level of Service (Delay in seconds per vehicle) 3. (U) = Unsignalized 4. Green shaded cells indicate low delays, yellow shaded cells indicate moderate delays, red shaded
cells indicate longer delays. Elmwood Avenue/S Goodman Street The Elmwood Avenue approaches are projected to operate at a highly acceptable LOS “C” or better during both peak hours under all conditions. The southbound left turn movement currently operates at LOS “F” with moderate to long delays during both peak hours. The southbound right turn movement is projected to operate at LOS “E” under background conditions and LOS “F” under full development conditions. The development is projected to add 41(34) southbound right turns and 13(48) southbound left turns during the AM(PM) peak hours. The TIS for the 1201 Elmwood Avenue Project evaluated this intersection in greater detail. The following excerpt from the 1201 Elmwood avenue TIS also applies to the results identified herein. “Although the LOS results depict delays over two minutes for the southbound left turns during both peak hours under existing conditions, as well as a LOS “F” for the southbound right-turn traffic during the AM peak hour under existing conditions, the results from the SimTraffic simulation and the actual Stop Sign Delay Study represent a LOS of “C” or better for both movements during the AM peak hour. An average delay of 33+ seconds per vehicle was recorded for the southbound left approach during the PM peak hour. As well, it was observed that most southbound right-turn motorists roll slowly through the stop sign
9 May 2019
Multi-Modal Traffic Impact Study Proposed Colgate Divinity Re-Development City of Rochester, NY
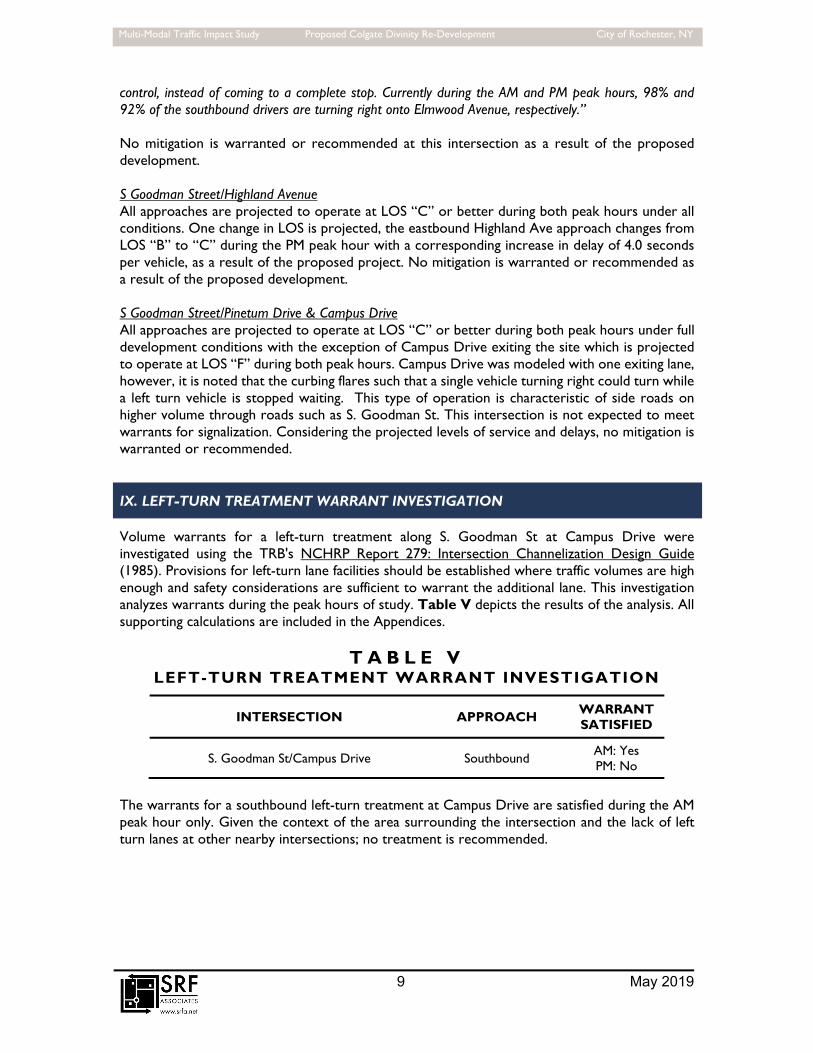
control, instead of coming to a complete stop. Currently during the AM and PM peak hours, 98% and 92% of the southbound drivers are turning right onto Elmwood Avenue, respectively.” No mitigation is warranted or recommended at this intersection as a result of the proposed development. S Goodman Street/Highland Avenue All approaches are projected to operate at LOS “C” or better during both peak hours under all conditions. One change in LOS is projected, the eastbound Highland Ave approach changes from LOS “B” to “C” during the PM peak hour with a corresponding increase in delay of 4.0 seconds per vehicle, as a result of the proposed project. No mitigation is warranted or recommended as a result of the proposed development. S Goodman Street/Pinetum Drive & Campus Drive All approaches are projected to operate at LOS “C” or better during both peak hours under full development conditions with the exception of Campus Drive exiting the site which is projected to operate at LOS “F” during both peak hours. Campus Drive was modeled with one exiting lane, however, it is noted that the curbing flares such that a single vehicle turning right could turn while a left turn vehicle is stopped waiting. This type of operation is characteristic of side roads on higher volume through roads such as S. Goodman St. This intersection is not expected to meet warrants for signalization. Considering the projected levels of service and delays, no mitigation is warranted or recommended. IX. LEFT-TURN TREATMENT WARRANT INVESTIGATION Volume warrants for a left-turn treatment along S. Goodman St at Campus Drive were investigated using the TRB's NCHRP Report 279: Intersection Channelization Design Guide (1985). Provisions for left-turn lane facilities should be established where traffic volumes are high enough and safety considerations are sufficient to warrant the additional lane. This investigation analyzes warrants during the peak hours of study. Table V depicts the results of the analysis. All supporting calculations are included in the Appendices.
T A B L E V LEFT-TURN TREATMENT WARRANT INVESTIGATION
INTERSECTION APPROACH WARRANT SATISFIED
S. Goodman St/Campus Drive Southbound AM: Yes PM: No
The warrants for a southbound left-turn treatment at Campus Drive are satisfied during the AM peak hour only. Given the context of the area surrounding the intersection and the lack of left turn lanes at other nearby intersections; no treatment is recommended.
10 May 2019
Multi-Modal Traffic Impact Study Proposed Colgate Divinity Re-Development City of Rochester, NY
X. CONCLUSIONS & RECOMMENDATIONS
This Traffic Impact Study identifies and evaluates the potential traffic impacts that can be expected from the proposed Colgate Divinity Re-development project in the City of Rochester, Monroe County, New York, as described in this study. The results of this study determine that the existing transportation network can adequately accommodate the projected traffic volumes and resulting impacts to study area intersections. The following sets forth the conclusions and recommendations based upon the results of the analyses:
1. The proposed development is expected to generate 127 entering/78 exiting vehicle trips during the AM peak hour and 127 entering/132 exiting vehicle trips during the PM peak hour.
2. Based upon current conditions, the available sight distances along S. Goodman St to the left and right do not meet the required SSD and desirable ISD at the Campus Drive intersection with the exception of the southbound SSD which exceeds the required SSD. Sight distance to the north is obstructed by the vertical curvature of the roadway; to the south obstructions include the horizontal curvature of the roadway as well as roadside trees. There is currently a northbound intersection warning sign. Recommended mitigation includes maintaining any brush and foliage along the sight lines to ensure maximum visibility.
3. The warrants for a southbound left-turn treatment at Campus Drive are satisfied during the AM peak hour only. Given the context of the area surrounding the intersection and the lack of left turn lanes at other nearby intersections; no treatment is recommended.
4. The minor projected traffic impacts resulting from full development of the proposed project during both peak hours can be adequately accommodated by the existing transportation network.
XI. FIGURES
Figures 1 through 8 are included on the following pages.
!
!
!
HIGHLAND AVE
GREENVIEW DR
DOCTORS DR
SU
BU
RB
AN
CT
JOHNSARBOR DR E
LILA
C D
R
RESERVOIR AVE
HIGHLAND PKWY
ARBOR DR
DA
VID
AV
E
SG
OO
DM
AN
ST
ELM
WO
OD
TE
R
EL
MW
OO
DT
ER
ELMWOOD AVE
ELMWOOD AVE
JOH
NS
AR
BO
R D
R W
AZ
ALE
A R
D
HO
WLA
ND
AV
E
SUMMIT DR
HIGHLAND PKWY
WIL
LAR
D A
VE
ME
IGS
ST
GREGORY HILL RD
PINETUMDR
LAN
EY
RD
!1
!2
!3
PROPOSED COLGATEDIVINITY DEVELOPMENT
·CITY OF ROCHESTER, NY
0 500 1,000250
Feet
Legend! Study Intersection
Study Area
Site Location
FIGURE 1 - SITE LOCATION AND STUDY AREA
PROJECTPROJECTSITESITE

RG
E C
RG
E D
RG
E E
1U
GC
SO
UTH
FAC
E
RG
E E
RG
E F
RG
E G
RTC
O
RTC
P
RTC
N
4' C
HA
IN L
INK
FE
NC
E
6' W
OO
D F
EN
CE
RG
E 2
2
5' W
RO
UG
HT
IRO
N F
ENC
E
RG
E 2
4
RG
E 2
5
RG
E 2
6
RG
E 2
7R
GE
28
RG
E 3
0
3' CHAIN LINK FENCE
RG
E 3
1
RG
E R
RTC
1B
3.5'
CH
AIN
LIN
K F
EN
CE
RG
E 3
8
RG
E 3
7
RG
E 3
5RG
E 3
4
RG
E 3
3
RG
E 3
1
RG
E32
RG
E A
RG
E B
RG
E P
N/F
BA
RB
AR
A N
INO
T.A
.#13
6.25
-3-4
2
N/F
LAU
RA
WIL
DE
RC
OW
LES
T.A
.#13
6.25
-3-4
1
N/F
E.J
. SE
AM
US
SW
EE
NY
T.A
.#13
6.25
-3-4
3
N/F
ME
LIS
SA
CA
RM
EN
T.A
.#13
6.25
-3-4
4
N/F
KA
THR
YN
SO
ME
RS
T.A
.#13
6.25
-3-4
5
N/F
WIL
LIA
M B
AS
ILE
T.A
.#13
6.25
-3-4
6
N/F
RO
BIN
FIS
HE
RT.
A.#
136.
25-3
-47
N/F
HU
GH
KIE
OR
IGT.
A.#
136.
25-3
-48
N/F
MA
RG
AR
ET
DO
OD
YT.
A.#
136.
25-3
-49
N/F
JOA
NN
E V
OTS
IST.
A.#
136.
25-3
-50
N/F
THO
MA
S &
MA
RY
RU
TKO
WS
KI
T.A
.#13
6.25
-3-5
1
MO
NU
ME
NT
LIN
E
MO
NU
MEN
T LI
NE
MO
NU
MEN
T LI
NE
MONUMENT LINE
N/F
MA
THE
W T
UR
NE
RT.
A.#
136.
25-3
-52
N/F
JON
ATH
AN
HO
RN
T.A
.#13
6.25
-3-5
3
N/F
CA
RLA
PR
OV
EN
ZAN
OT.
A.#
136.
25-3
-54
N/F
WIL
LIA
M A
. LA
NG
T.A
.#13
6.25
-3-5
5
N/F
JOH
N H
OFF
MA
NT.
A.#
136.
25-3
-56.
1
N/F
CO
LGA
TE R
OC
HE
STE
R D
IVIN
ITY
SC
HO
OL
T.A
.#13
6.33
-1-1
.002
LIB
ER
145
4 P
AG
E13
9LO
T 1
FILE
D M
AP
341
PA
GE
52
22.4
22 A
CR
ES
N/F
SH
EIL
A M
UR
PH
YT.
A.#
136.
25-3
-59
N/F
THO
MA
S &
CH
RIS
TIN
E K
ELL
YT.
A.#
136.
26-1
-87
N/F
DA
VID
& K
ATH
LEE
NM
AR
RT.
A.#
136.
26-1
-86 N
/FP
AM
ELA
FR
AM
ET.
A.#
136.
07-1
-57
N/F
RO
BE
RT
DA
LET.
A.#
136.
07-1
-52.
1
N/F
RA
CH
EL
HA
LLT.
A.#
136.
07-1
-44
N/F
GA
RR
Y V
ER
NO
NT.
A.#
136.
07-1
-43
N/F
PA
ME
LA F
RA
ME
T.A
.#13
6.07
-1-5
7.1
CITY OF ROCHESTERTOWN OF BRIGHTON
CITY OF ROCHESTERTOWN OF BRIGHTON
SU
MM
IT V
IEW
MA
P L
IBE
R 6
3 P
AG
E 3
5
HIG
HLA
ND
PA
RK
WA
Y T
RA
CTM
AP
LIB
ER
55
PA
GE
19
NO
PA
RK
ING
SIG
N
2-H
AN
DIC
AP
SIG
NS
SW
ING
GA
TE
SW
ING
GA
TE
GR
AV
EL
AR
EA
PA
RK
ING
LOT
B
SLO
W
NO
PA
RK
ING
STO
PS
IGN
CO
NC
RE
TER
ETA
ININ
GW
ALL C
ON
CR
ETE
STE
PS
& W
ALK
CO
NC
. WAL
K
CO
NC
. WA
LK &
STE
PS
WIT
HH
AN
DR
AIL
HA
ND
ICA
PS
IGN
STO
PS
IGN
SP
EE
DLI
MIT
10 M
.P.H
.
PE
DE
STR
IAN
CR
OS
SIN
G
STO
NE
GR
ILL
PE
DE
STR
IAN
CR
OS
SIN
G
INTE
RS
EC
TIO
NA
HE
AD
CO
LGA
TES
IGN
CO
NC
. GU
TTER
CO
NC
. G
UTT
ER
CO
NC
. GU
TTER
CO
NC
. GU
TTER
SP
EE
DLI
MIT
30 M
.P.H
.
CIT
Y O
F R
OC
HE
STE
R
TOW
N O
F B
RIG
HTO
N
CITY OF ROCHESTERTOWN OF BRIGHTON
CIT
Y O
FR
OC
HE
STE
RS
IGN
4
5
7
8
BU
SS
TOP
CU
RV
E A
HE
AD
SP
EE
DLI
MIT
30
M.P
.H.
DIR
EC
TOR
YS
IGN
4631
23
14
BE
LO
W G
RA
DE
PA
RK
ING
XX
16
3' H
IGH
WO
OD
FEN
CE
3' H
IGH
WIR
EFE
NC
E
CO
NC
.S
IDE
WA
LK
78
SAUNDERS HOUSE
6,420± Sq. Ft.
ANDREWS HOUSE
4,200± Sq. Ft.
BU
ILD
ING
20
02
-LE
VE
L A
PA
RT
ME
NT
BU
ILD
ING
FO
OT
PR
INT
16
,300
± S
q. F
t.
TR
EV
OR
-EA
TO
N H
AL
L9
,60
0±
Sq
. F
t.
ST
RO
NG
HA
LL
29
,63
0±
Sq.
Ft.
75.0'
93
BL
DG
. 10
05
-LE
VE
L A
PA
RT
ME
NT
BU
ILD
ING
FO
OT
PR
INT
23,8
00±
Sq.
Ft.
14
22
25
6
9
3
T
2
88
BE
LO
W G
RA
DE
PA
RK
ING
45
17 19
36
FIR
ST
FL
OO
R=
60
9.0
±
FIR
ST
FL
OO
R=
613.5
±
BE
LO
W P
AR
KIN
GE
NT
RA
NC
EE
LE
V.=
601.5
±
x
PARKING LOT
ELEV.=597.0±
PARKING LOT
ELEV.=604.0±
PA
RK
ING
LO
TE
LE
V.=
605.0
±
x
x
PA
RK
ING
EN
TR
AN
CE
EL
EV
.= 6
05.0
±
PA
RK
ING
LO
TE
LE
V.=
608.5
±x
DR
IVE
EL
EV
.=593±
x
BE
LO
W P
AR
KIN
G
EN
TR
AN
CE
EL
EV
. =
595.0
±x
N/F
MA
ISO
N P
RO
PE
RTI
ES
INC
.T.
A.#
136.
25-3
-58.
001
LOT
2 FI
LED
MA
P 3
41 P
AG
E 5
2
HIG
HLA
ND
PA
RK
HIG
HLA
ND
PA
RK
15
9
MO
NT
GO
ME
RY
HO
US
E3
,330
± S
q. F
t.
DIV
INIT
Y S
CH
OO
L C
AM
PU
S(
IN F
EE
T )
GR
AP
HIC
SC
AL
E
0
1 i
nch
= 6
0 f
t.
3060
120
240
60
N
NORTH
PA
RC
EL
BO
UN
DA
RY
LIN
E L
EG
EN
D
RO
AD
RIG
HT-
OF-
WA
Y
AD
JAC
EN
T P
RO
PE
RTY
LIN
E
GOODMAN
(66' R.O
.W.)
HIG
HL
AN
D
P
AR
KW
AY
(60' R
.O.W
.)
HIG
HL
AN
D A
VE
NU
E
(49.5
' R.O
.W.)
SU
MM
IT D
RIV
E(6
0' R
.O.W
.)
HOWLAND
AVENUE
(60' R.O.W.)
GR
EE
NV
IEW
DR
IVE
(50' R
.O.W
.)
STREET
SOUTH
LILAC DRIVE(60' R.O.W.)
DAVID ROAD (60' R.O.W.)
CA
MP
US
DR
IVE
DE
VE
LO
PM
EN
T C
ON
CE
PT
PLA
N2
17
La
ke
Av
en
ue
Ro
ch
es
te
r,
NY
14
60
8
(5
85
) 4
58
-30
20
Co
st
ich
En
gin
ee
rin
g
Civ
il
En
gin
ee
rin
g
La
nd
Su
rv
ey
ing
La
nd
sc
ap
e
Ar
ch
ite
ct
ur
e
PIN
ETU
M
D
RIV
E

APPENDICES

A1
Collected Traffic Volume Data
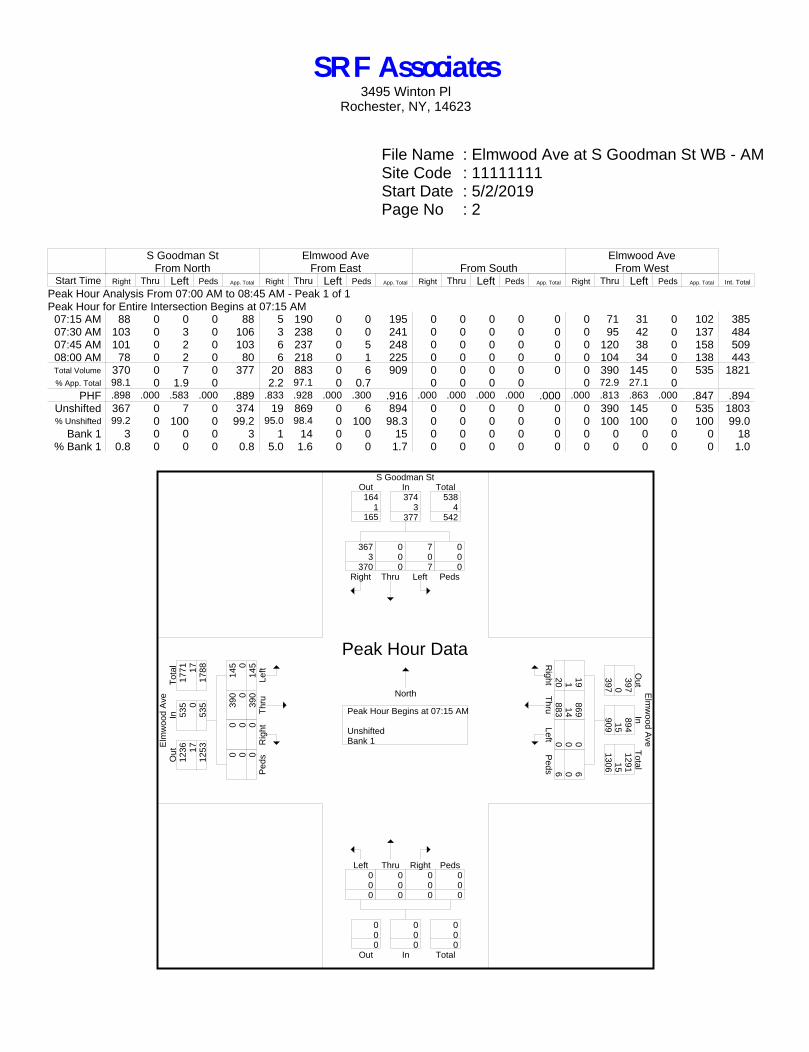
File Name : Elmwood Ave at S Goodman St WB - AMSite Code : 11111111Start Date : 5/2/2019Page No : 1
Groups Printed- Unshifted - Bank 1S Goodman St
From NorthElmwood Ave
From East From SouthElmwood Ave
From WestStart Time Right Thru Left Peds App. Total Right Thru Left Peds App. Total Right Thru Left Peds App. Total Right Thru Left Peds App. Total Int. Total
07:00 AM 58 0 5 1 64 3 139 0 1 143 0 0 0 0 0 0 55 26 0 81 28807:15 AM 88 0 0 0 88 5 190 0 0 195 0 0 0 0 0 0 71 31 0 102 38507:30 AM 103 0 3 0 106 3 238 0 0 241 0 0 0 0 0 0 95 42 0 137 48407:45 AM 101 0 2 0 103 6 237 0 5 248 0 0 0 0 0 0 120 38 0 158 509
Total 350 0 10 1 361 17 804 0 6 827 0 0 0 0 0 0 341 137 0 478 1666
08:00 AM 78 0 2 0 80 6 218 0 1 225 0 0 0 0 0 0 104 34 0 138 44308:15 AM 71 0 2 0 73 5 196 0 0 201 0 0 0 0 0 0 65 36 0 101 37508:30 AM 75 0 0 0 75 4 220 0 3 227 0 0 0 0 0 0 66 31 0 97 39908:45 AM 95 0 7 0 102 3 195 0 3 201 0 0 0 0 0 0 91 31 0 122 425
Total 319 0 11 0 330 18 829 0 7 854 0 0 0 0 0 0 326 132 0 458 1642
Grand Total 669 0 21 1 691 35 1633 0 13 1681 0 0 0 0 0 0 667 269 0 936 3308Apprch % 96.8 0 3 0.1 2.1 97.1 0 0.8 0 0 0 0 0 71.3 28.7 0
Total % 20.2 0 0.6 0 20.9 1.1 49.4 0 0.4 50.8 0 0 0 0 0 0 20.2 8.1 0 28.3Unshifted 657 0 21 1 679 34 1601 0 12 1647 0 0 0 0 0 0 667 269 0 936 3262% Unshifted 98.2 0 100 100 98.3 97.1 98 0 92.3 98 0 0 0 0 0 0 100 100 0 100 98.6
Bank 1 12 0 0 0 12 1 32 0 1 34 0 0 0 0 0 0 0 0 0 0 46% Bank 1 1.8 0 0 0 1.7 2.9 2 0 7.7 2 0 0 0 0 0 0 0 0 0 0 1.4
SRF Associates3495 Winton Pl
Rochester, NY, 14623
File Name : Elmwood Ave at S Goodman St WB - AMSite Code : 11111111Start Date : 5/2/2019Page No : 2
S Goodman StFrom North
Elmwood AveFrom East From South
Elmwood AveFrom West
Start Time Right Thru Left Peds App. Total Right Thru Left Peds App. Total Right Thru Left Peds App. Total Right Thru Left Peds App. Total Int. Total
Peak Hour Analysis From 07:00 AM to 08:45 AM - Peak 1 of 1Peak Hour for Entire Intersection Begins at 07:15 AM
07:15 AM 88 0 0 0 88 5 190 0 0 195 0 0 0 0 0 0 71 31 0 102 38507:30 AM 103 0 3 0 106 3 238 0 0 241 0 0 0 0 0 0 95 42 0 137 48407:45 AM 101 0 2 0 103 6 237 0 5 248 0 0 0 0 0 0 120 38 0 158 50908:00 AM 78 0 2 0 80 6 218 0 1 225 0 0 0 0 0 0 104 34 0 138 443Total Volume 370 0 7 0 377 20 883 0 6 909 0 0 0 0 0 0 390 145 0 535 1821% App. Total 98.1 0 1.9 0 2.2 97.1 0 0.7 0 0 0 0 0 72.9 27.1 0
PHF .898 .000 .583 .000 .889 .833 .928 .000 .300 .916 .000 .000 .000 .000 .000 .000 .813 .863 .000 .847 .894Unshifted 367 0 7 0 374 19 869 0 6 894 0 0 0 0 0 0 390 145 0 535 1803% Unshifted 99.2 0 100 0 99.2 95.0 98.4 0 100 98.3 0 0 0 0 0 0 100 100 0 100 99.0
Bank 1 3 0 0 0 3 1 14 0 0 15 0 0 0 0 0 0 0 0 0 0 18% Bank 1 0.8 0 0 0 0.8 5.0 1.6 0 0 1.7 0 0 0 0 0 0 0 0 0 0 1.0
S Goodman St
Elm
wo
od
Ave
Elm
wo
od
Ave
Right
367 3
370 Thru
0 0 0
Left
7 0 7
Peds
0 0 0
InOut Total164 374 538
1 3 4 165 542 377
Rig
ht
19
1
2
0
Th
ru
86
9
14
8
83
L
eft 0
0
0
P
ed
s 6
0
6
Ou
tT
ota
lIn
39
7
89
4
12
91
0
1
5
15
3
97
1
30
6
90
9
Left0 0 0
Thru0 0 0
Right0 0 0
Peds0 0 0
Out TotalIn
0 0 0 0 0 0 0 0 0
Le
ft
14
5
0
14
5
Th
ru39
0
0
39
0
Rig
ht0
0
0
Pe
ds0
0
0
To
tal
Ou
tIn
12
36
5
35
1
77
1
17
0
1
7
12
53
1
78
8
53
5
Peak Hour Begins at 07:15 AM UnshiftedBank 1
Peak Hour Data
North
SRF Associates3495 Winton Pl
Rochester, NY, 14623
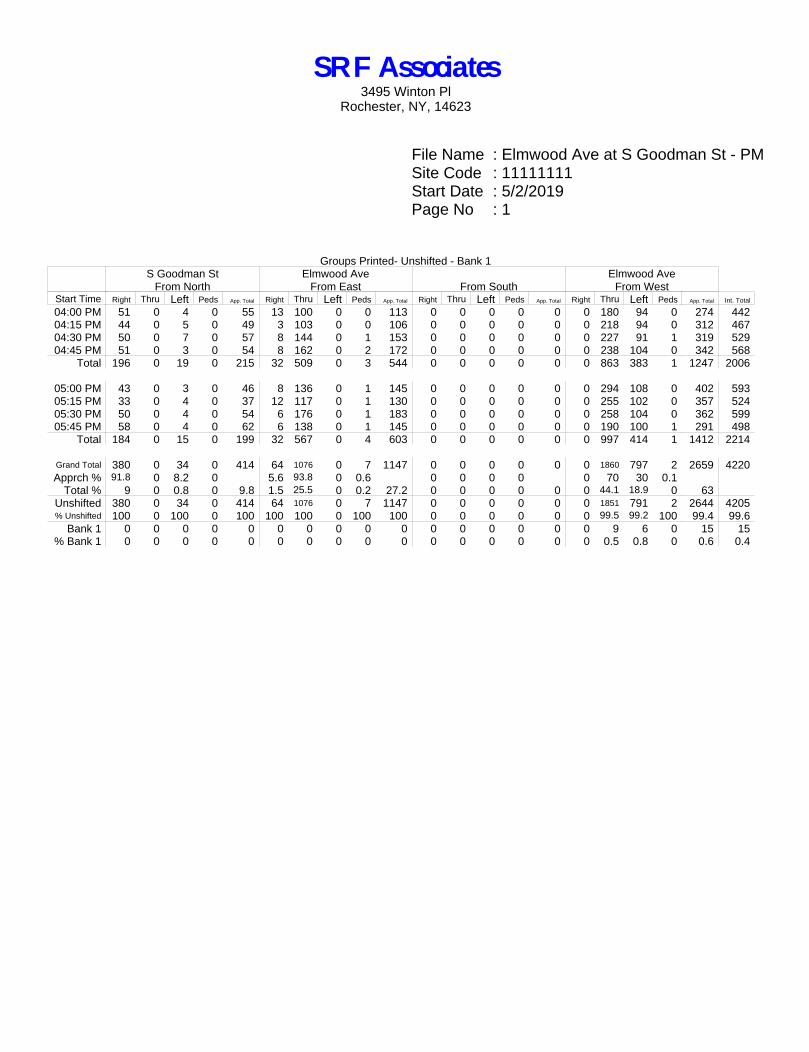
File Name : Elmwood Ave at S Goodman St - PMSite Code : 11111111Start Date : 5/2/2019Page No : 1
Groups Printed- Unshifted - Bank 1S Goodman St
From NorthElmwood Ave
From East From SouthElmwood Ave
From WestStart Time Right Thru Left Peds App. Total Right Thru Left Peds App. Total Right Thru Left Peds App. Total Right Thru Left Peds App. Total Int. Total
04:00 PM 51 0 4 0 55 13 100 0 0 113 0 0 0 0 0 0 180 94 0 274 44204:15 PM 44 0 5 0 49 3 103 0 0 106 0 0 0 0 0 0 218 94 0 312 46704:30 PM 50 0 7 0 57 8 144 0 1 153 0 0 0 0 0 0 227 91 1 319 52904:45 PM 51 0 3 0 54 8 162 0 2 172 0 0 0 0 0 0 238 104 0 342 568
Total 196 0 19 0 215 32 509 0 3 544 0 0 0 0 0 0 863 383 1 1247 2006
05:00 PM 43 0 3 0 46 8 136 0 1 145 0 0 0 0 0 0 294 108 0 402 59305:15 PM 33 0 4 0 37 12 117 0 1 130 0 0 0 0 0 0 255 102 0 357 52405:30 PM 50 0 4 0 54 6 176 0 1 183 0 0 0 0 0 0 258 104 0 362 59905:45 PM 58 0 4 0 62 6 138 0 1 145 0 0 0 0 0 0 190 100 1 291 498
Total 184 0 15 0 199 32 567 0 4 603 0 0 0 0 0 0 997 414 1 1412 2214
Grand Total 380 0 34 0 414 64 1076 0 7 1147 0 0 0 0 0 0 1860 797 2 2659 4220Apprch % 91.8 0 8.2 0 5.6 93.8 0 0.6 0 0 0 0 0 70 30 0.1
Total % 9 0 0.8 0 9.8 1.5 25.5 0 0.2 27.2 0 0 0 0 0 0 44.1 18.9 0 63Unshifted 380 0 34 0 414 64 1076 0 7 1147 0 0 0 0 0 0 1851 791 2 2644 4205% Unshifted 100 0 100 0 100 100 100 0 100 100 0 0 0 0 0 0 99.5 99.2 100 99.4 99.6
Bank 1 0 0 0 0 0 0 0 0 0 0 0 0 0 0 0 0 9 6 0 15 15% Bank 1 0 0 0 0 0 0 0 0 0 0 0 0 0 0 0 0 0.5 0.8 0 0.6 0.4
SRF Associates3495 Winton Pl
Rochester, NY, 14623

File Name : Elmwood Ave at S Goodman St - PMSite Code : 11111111Start Date : 5/2/2019Page No : 2
S Goodman StFrom North
Elmwood AveFrom East From South
Elmwood AveFrom West
Start Time Right Thru Left Peds App. Total Right Thru Left Peds App. Total Right Thru Left Peds App. Total Right Thru Left Peds App. Total Int. Total
Peak Hour Analysis From 04:00 PM to 05:45 PM - Peak 1 of 1Peak Hour for Entire Intersection Begins at 04:45 PM
04:45 PM 51 0 3 0 54 8 162 0 2 172 0 0 0 0 0 0 238 104 0 342 56805:00 PM 43 0 3 0 46 8 136 0 1 145 0 0 0 0 0 0 294 108 0 402 59305:15 PM 33 0 4 0 37 12 117 0 1 130 0 0 0 0 0 0 255 102 0 357 52405:30 PM 50 0 4 0 54 6 176 0 1 183 0 0 0 0 0 0 258 104 0 362 599Total Volume 177 0 14 0 191 34 591 0 5 630 0 0 0 0 0 0 1045 418 0 1463 2284% App. Total 92.7 0 7.3 0 5.4 93.8 0 0.8 0 0 0 0 0 71.4 28.6 0
PHF .868 .000 .875 .000 .884 .708 .839 .000 .625 .861 .000 .000 .000 .000 .000 .000 .889 .968 .000 .910 .953Unshifted 177 0 14 0 191 34 591 0 5 630 0 0 0 0 0 0 1039 416 0 1455 2276% Unshifted 100 0 100 0 100 100 100 0 100 100 0 0 0 0 0 0 99.4 99.5 0 99.5 99.6
Bank 1 0 0 0 0 0 0 0 0 0 0 0 0 0 0 0 0 6 2 0 8 8% Bank 1 0 0 0 0 0 0 0 0 0 0 0 0 0 0 0 0 0.6 0.5 0 0.5 0.4
S Goodman St
Elm
wo
od
Ave
Elm
wo
od
Ave
Right
177 0
177 Thru
0 0 0
Left
14 0
14 Peds
0 0 0
InOut Total450 191 641
2 0 2 452 643 191
Rig
ht
34
0
3
4
Th
ru
59
1
0
59
1
Le
ft 0
0
0
Pe
ds 5
0
5
Ou
tT
ota
lIn
10
53
6
30
1
68
3
6
0
6
10
59
1
68
9
63
0
Left0 0 0
Thru0 0 0
Right0 0 0
Peds0 0 0
Out TotalIn
0 0 0 0 0 0 0 0 0
Le
ft
41
6
2
41
8
Th
ru
10
39
6
1
04
5
Rig
ht0
0
0
Pe
ds0
0
0
To
tal
Ou
tIn
76
8
14
55
2
22
3
0
8
8
76
8
22
31
1
46
3
Peak Hour Begins at 04:45 PM UnshiftedBank 1
Peak Hour Data
North
SRF Associates3495 Winton Pl
Rochester, NY, 14623
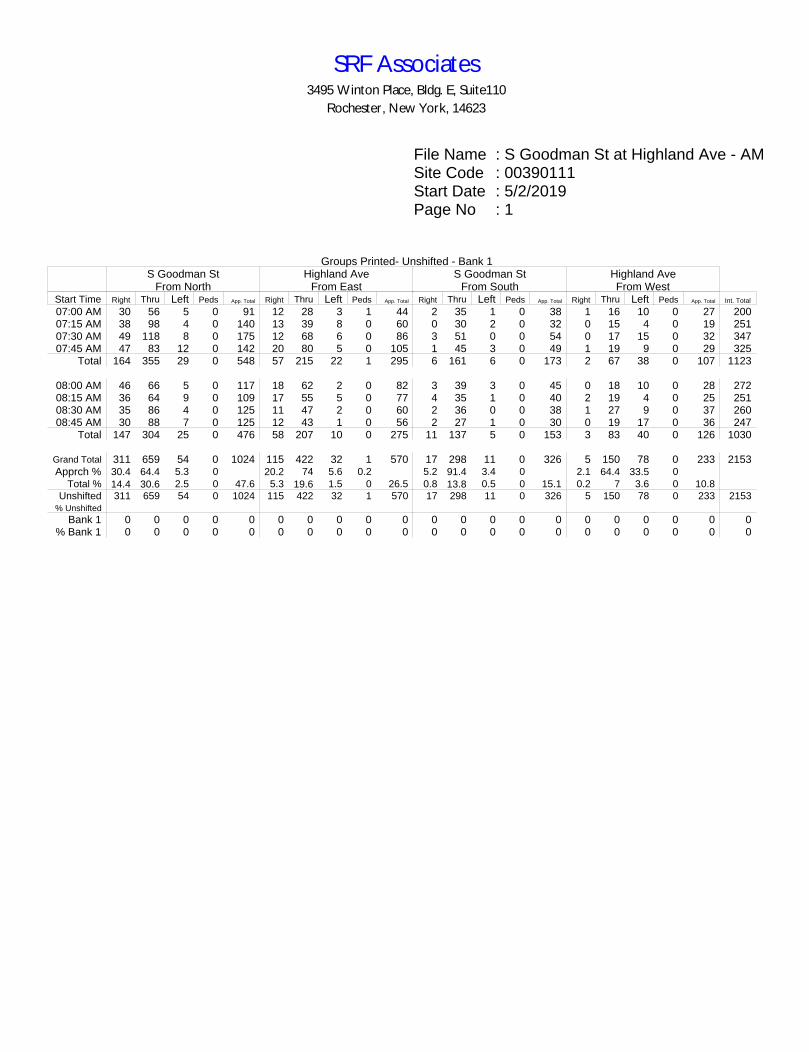
File Name : S Goodman St at Highland Ave - AMSite Code : 00390111Start Date : 5/2/2019Page No : 1
Groups Printed- Unshifted - Bank 1S Goodman St
From NorthHighland Ave
From EastS Goodman St
From SouthHighland AveFrom West
Start Time Right Thru Left Peds App. Total Right Thru Left Peds App. Total Right Thru Left Peds App. Total Right Thru Left Peds App. Total Int. Total
07:00 AM 30 56 5 0 91 12 28 3 1 44 2 35 1 0 38 1 16 10 0 27 20007:15 AM 38 98 4 0 140 13 39 8 0 60 0 30 2 0 32 0 15 4 0 19 25107:30 AM 49 118 8 0 175 12 68 6 0 86 3 51 0 0 54 0 17 15 0 32 34707:45 AM 47 83 12 0 142 20 80 5 0 105 1 45 3 0 49 1 19 9 0 29 325
Total 164 355 29 0 548 57 215 22 1 295 6 161 6 0 173 2 67 38 0 107 1123
08:00 AM 46 66 5 0 117 18 62 2 0 82 3 39 3 0 45 0 18 10 0 28 27208:15 AM 36 64 9 0 109 17 55 5 0 77 4 35 1 0 40 2 19 4 0 25 25108:30 AM 35 86 4 0 125 11 47 2 0 60 2 36 0 0 38 1 27 9 0 37 26008:45 AM 30 88 7 0 125 12 43 1 0 56 2 27 1 0 30 0 19 17 0 36 247
Total 147 304 25 0 476 58 207 10 0 275 11 137 5 0 153 3 83 40 0 126 1030
Grand Total 311 659 54 0 1024 115 422 32 1 570 17 298 11 0 326 5 150 78 0 233 2153Apprch % 30.4 64.4 5.3 0 20.2 74 5.6 0.2 5.2 91.4 3.4 0 2.1 64.4 33.5 0
Total % 14.4 30.6 2.5 0 47.6 5.3 19.6 1.5 0 26.5 0.8 13.8 0.5 0 15.1 0.2 7 3.6 0 10.8Unshifted 311 659 54 0 1024 115 422 32 1 570 17 298 11 0 326 5 150 78 0 233 2153
% Unshifted
Bank 1 0 0 0 0 0 0 0 0 0 0 0 0 0 0 0 0 0 0 0 0 0% Bank 1 0 0 0 0 0 0 0 0 0 0 0 0 0 0 0 0 0 0 0 0 0
SRF Associates3495 Winton Place, Bldg. E, Suite110
Rochester, New York, 14623

File Name : S Goodman St at Highland Ave - AMSite Code : 00390111Start Date : 5/2/2019Page No : 2
S Goodman StFrom North
Highland AveFrom East
S Goodman StFrom South
Highland AveFrom West
Start Time Right Thru Left Peds App. Total Right Thru Left Peds App. Total Right Thru Left Peds App. Total Right Thru Left Peds App. Total Int. Total
Peak Hour Analysis From 07:00 AM to 08:45 AM - Peak 1 of 1Peak Hour for Entire Intersection Begins at 07:15 AM
07:15 AM 38 98 4 0 140 13 39 8 0 60 0 30 2 0 32 0 15 4 0 19 25107:30 AM 49 118 8 0 175 12 68 6 0 86 3 51 0 0 54 0 17 15 0 32 34707:45 AM 47 83 12 0 142 20 80 5 0 105 1 45 3 0 49 1 19 9 0 29 32508:00 AM 46 66 5 0 117 18 62 2 0 82 3 39 3 0 45 0 18 10 0 28 272Total Volume 180 365 29 0 574 63 249 21 0 333 7 165 8 0 180 1 69 38 0 108 1195% App. Total 31.4 63.6 5.1 0 18.9 74.8 6.3 0 3.9 91.7 4.4 0 0.9 63.9 35.2 0
PHF .918 .773 .604 .000 .820 .788 .778 .656 .000 .793 .583 .809 .667 .000 .833 .250 .908 .633 .000 .844 .861Unshifted 180 365 29 0 574 63 249 21 0 333 7 165 8 0 180 1 69 38 0 108 1195
% Unshifted
Bank 1 0 0 0 0 0 0 0 0 0 0 0 0 0 0 0 0 0 0 0 0 0% Bank 1 0 0 0 0 0 0 0 0 0 0 0 0 0 0 0 0 0 0 0 0 0
S Goodman St
Hig
hla
nd
Ave
Hig
hla
nd
Ave
S Goodman St
Right
180 0
180 Thru
365 0
365 Left
29 0
29 Peds
0 0 0
InOut Total266 574 840
0 0 0 266 840 574
Rig
ht
63
0
6
3
Th
ru
24
9
0
24
9
Le
ft 21
0
2
1
Pe
ds 0
0
0
Ou
tT
ota
lIn
10
5
33
3
43
8
0
0
0
10
5
43
8
33
3
Left8 0 8
Thru165
0 165
Right7 0 7
Peds0 0 0
Out TotalIn
387 180 567 0 0 0
387 567 180
Le
ft38
0
3
8
Th
ru69
0
6
9
Rig
ht1
0
1
Pe
ds0
0
0
To
tal
Ou
tIn
43
7
10
8
54
5
0
0
0
43
7
54
5
10
8
Peak Hour Begins at 07:15 AM UnshiftedBank 1
Peak Hour Data
North
SRF Associates3495 Winton Place, Bldg. E, Suite110
Rochester, New York, 14623
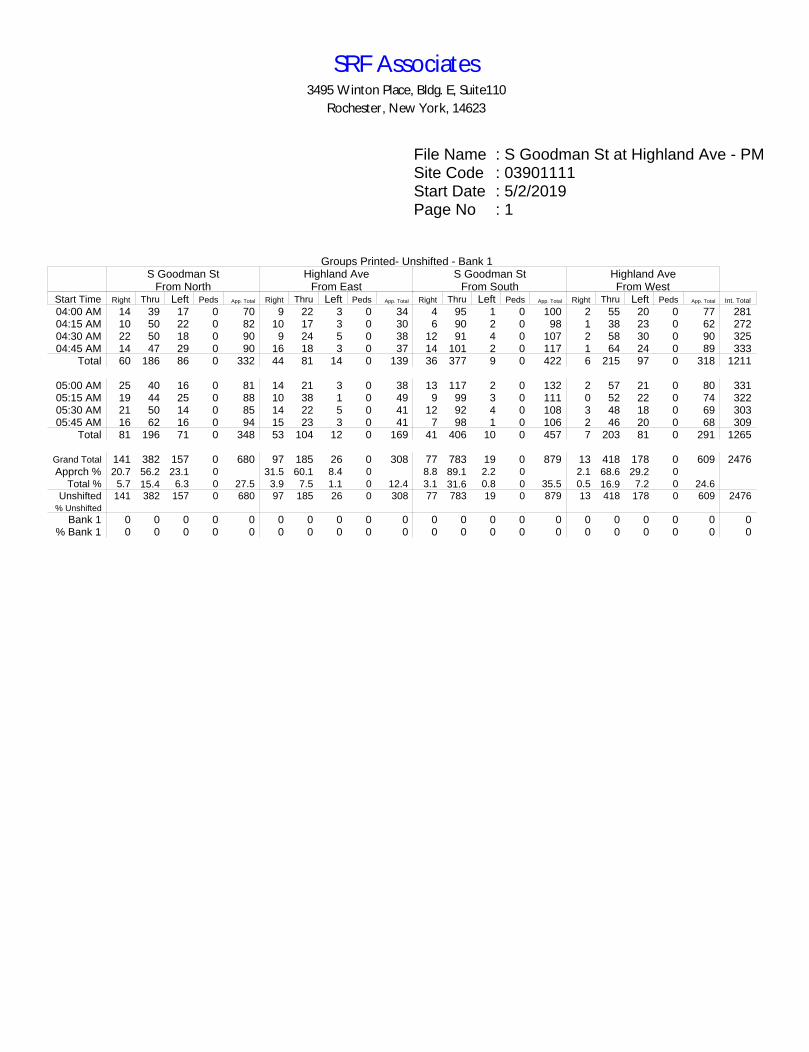
File Name : S Goodman St at Highland Ave - PMSite Code : 03901111Start Date : 5/2/2019Page No : 1
Groups Printed- Unshifted - Bank 1S Goodman St
From NorthHighland Ave
From EastS Goodman St
From SouthHighland AveFrom West
Start Time Right Thru Left Peds App. Total Right Thru Left Peds App. Total Right Thru Left Peds App. Total Right Thru Left Peds App. Total Int. Total
04:00 AM 14 39 17 0 70 9 22 3 0 34 4 95 1 0 100 2 55 20 0 77 28104:15 AM 10 50 22 0 82 10 17 3 0 30 6 90 2 0 98 1 38 23 0 62 27204:30 AM 22 50 18 0 90 9 24 5 0 38 12 91 4 0 107 2 58 30 0 90 32504:45 AM 14 47 29 0 90 16 18 3 0 37 14 101 2 0 117 1 64 24 0 89 333
Total 60 186 86 0 332 44 81 14 0 139 36 377 9 0 422 6 215 97 0 318 1211
05:00 AM 25 40 16 0 81 14 21 3 0 38 13 117 2 0 132 2 57 21 0 80 33105:15 AM 19 44 25 0 88 10 38 1 0 49 9 99 3 0 111 0 52 22 0 74 32205:30 AM 21 50 14 0 85 14 22 5 0 41 12 92 4 0 108 3 48 18 0 69 30305:45 AM 16 62 16 0 94 15 23 3 0 41 7 98 1 0 106 2 46 20 0 68 309
Total 81 196 71 0 348 53 104 12 0 169 41 406 10 0 457 7 203 81 0 291 1265
Grand Total 141 382 157 0 680 97 185 26 0 308 77 783 19 0 879 13 418 178 0 609 2476Apprch % 20.7 56.2 23.1 0 31.5 60.1 8.4 0 8.8 89.1 2.2 0 2.1 68.6 29.2 0
Total % 5.7 15.4 6.3 0 27.5 3.9 7.5 1.1 0 12.4 3.1 31.6 0.8 0 35.5 0.5 16.9 7.2 0 24.6Unshifted 141 382 157 0 680 97 185 26 0 308 77 783 19 0 879 13 418 178 0 609 2476
% Unshifted
Bank 1 0 0 0 0 0 0 0 0 0 0 0 0 0 0 0 0 0 0 0 0 0% Bank 1 0 0 0 0 0 0 0 0 0 0 0 0 0 0 0 0 0 0 0 0 0
SRF Associates3495 Winton Place, Bldg. E, Suite110
Rochester, New York, 14623
File Name : S Goodman St at Highland Ave - PMSite Code : 03901111Start Date : 5/2/2019Page No : 2
S Goodman StFrom North
Highland AveFrom East
S Goodman StFrom South
Highland AveFrom West
Start Time Right Thru Left Peds App. Total Right Thru Left Peds App. Total Right Thru Left Peds App. Total Right Thru Left Peds App. Total Int. Total
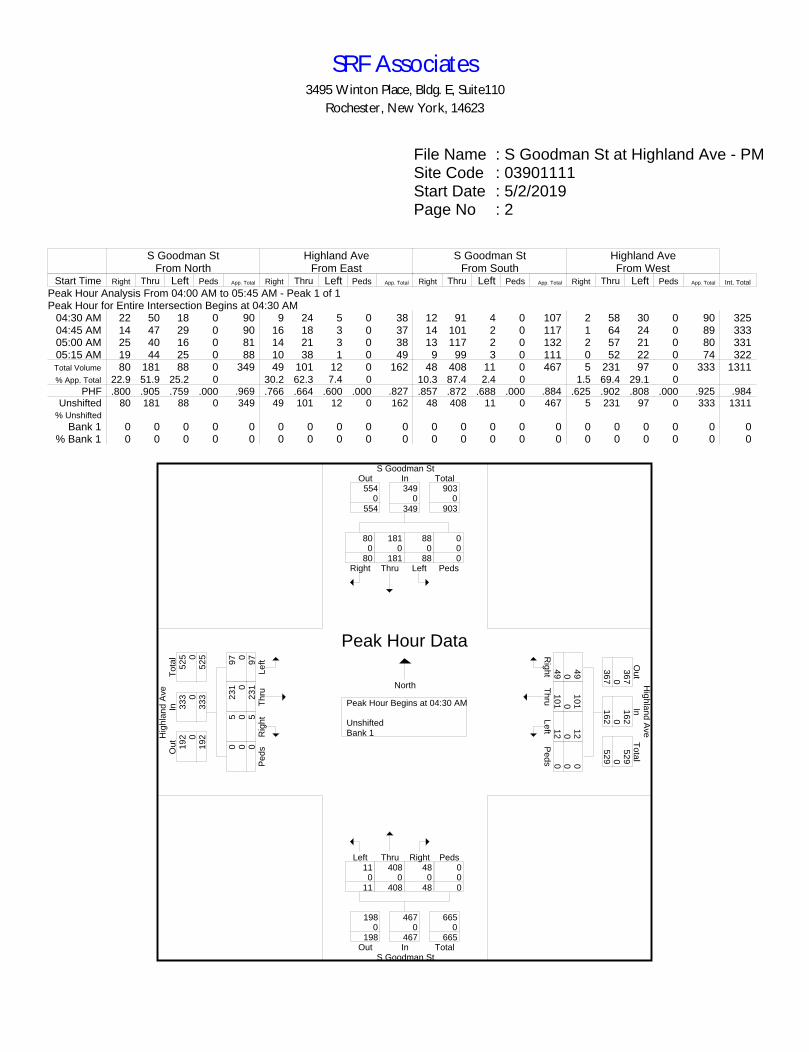
Peak Hour Analysis From 04:00 AM to 05:45 AM - Peak 1 of 1Peak Hour for Entire Intersection Begins at 04:30 AM
04:30 AM 22 50 18 0 90 9 24 5 0 38 12 91 4 0 107 2 58 30 0 90 32504:45 AM 14 47 29 0 90 16 18 3 0 37 14 101 2 0 117 1 64 24 0 89 33305:00 AM 25 40 16 0 81 14 21 3 0 38 13 117 2 0 132 2 57 21 0 80 33105:15 AM 19 44 25 0 88 10 38 1 0 49 9 99 3 0 111 0 52 22 0 74 322Total Volume 80 181 88 0 349 49 101 12 0 162 48 408 11 0 467 5 231 97 0 333 1311% App. Total 22.9 51.9 25.2 0 30.2 62.3 7.4 0 10.3 87.4 2.4 0 1.5 69.4 29.1 0
PHF .800 .905 .759 .000 .969 .766 .664 .600 .000 .827 .857 .872 .688 .000 .884 .625 .902 .808 .000 .925 .984Unshifted 80 181 88 0 349 49 101 12 0 162 48 408 11 0 467 5 231 97 0 333 1311
% Unshifted
Bank 1 0 0 0 0 0 0 0 0 0 0 0 0 0 0 0 0 0 0 0 0 0% Bank 1 0 0 0 0 0 0 0 0 0 0 0 0 0 0 0 0 0 0 0 0 0
S Goodman St
Hig
hla
nd
Ave
Hig
hla
nd
Ave
S Goodman St
Right
80 0
80 Thru
181 0
181 Left
88 0
88 Peds
0 0 0
InOut Total554 349 903
0 0 0 554 903 349
Rig
ht
49
0
4
9
Th
ru
10
1
0
10
1
Le
ft 12
0
1
2
Pe
ds 0
0
0
Ou
tT
ota
lIn
36
7
16
2
52
9
0
0
0
36
7
52
9
16
2
Left11 0
11
Thru408
0 408
Right48 0
48
Peds0 0 0
Out TotalIn
198 467 665 0 0 0
198 665 467
Le
ft97
0
9
7
Th
ru23
1
0
23
1
Rig
ht5
0
5
Pe
ds0
0
0
To
tal
Ou
tIn
19
2
33
3
52
5
0
0
0
19
2
52
5
33
3
Peak Hour Begins at 04:30 AM UnshiftedBank 1
Peak Hour Data
North
SRF Associates3495 Winton Place, Bldg. E, Suite110
Rochester, New York, 14623
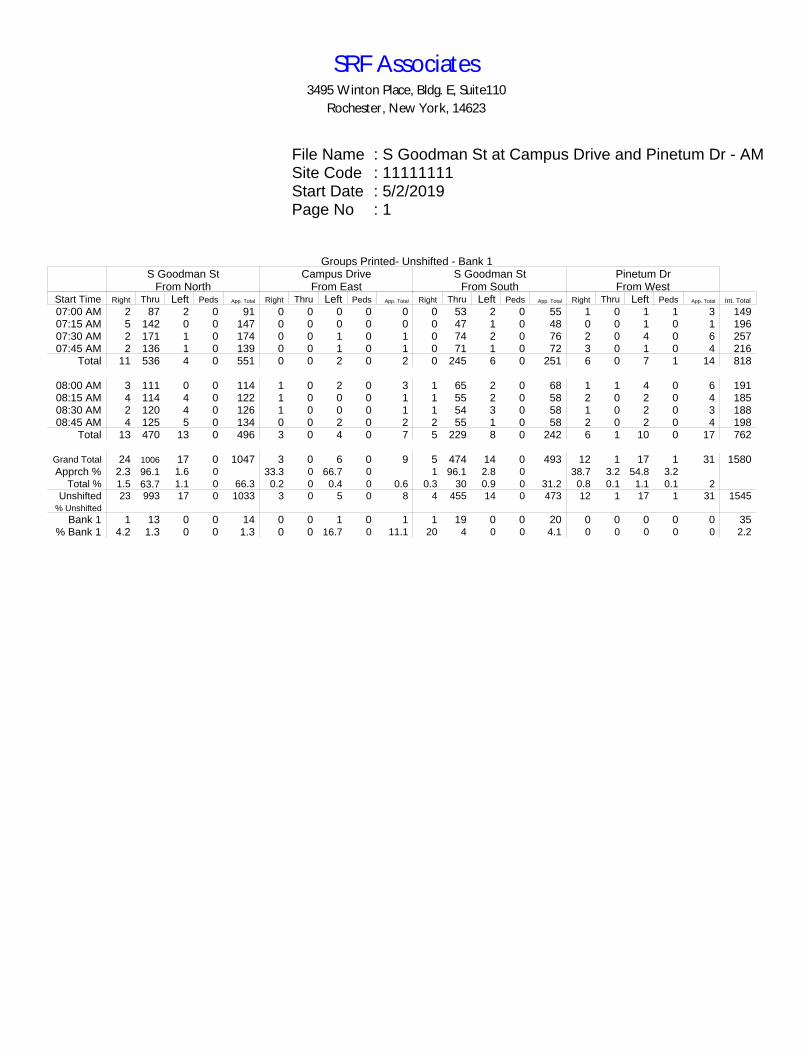
File Name : S Goodman St at Campus Drive and Pinetum Dr - AMSite Code : 11111111Start Date : 5/2/2019Page No : 1
Groups Printed- Unshifted - Bank 1S Goodman St
From NorthCampus Drive
From EastS Goodman St
From SouthPinetum DrFrom West
Start Time Right Thru Left Peds App. Total Right Thru Left Peds App. Total Right Thru Left Peds App. Total Right Thru Left Peds App. Total Int. Total
07:00 AM 2 87 2 0 91 0 0 0 0 0 0 53 2 0 55 1 0 1 1 3 14907:15 AM 5 142 0 0 147 0 0 0 0 0 0 47 1 0 48 0 0 1 0 1 19607:30 AM 2 171 1 0 174 0 0 1 0 1 0 74 2 0 76 2 0 4 0 6 25707:45 AM 2 136 1 0 139 0 0 1 0 1 0 71 1 0 72 3 0 1 0 4 216
Total 11 536 4 0 551 0 0 2 0 2 0 245 6 0 251 6 0 7 1 14 818
08:00 AM 3 111 0 0 114 1 0 2 0 3 1 65 2 0 68 1 1 4 0 6 19108:15 AM 4 114 4 0 122 1 0 0 0 1 1 55 2 0 58 2 0 2 0 4 18508:30 AM 2 120 4 0 126 1 0 0 0 1 1 54 3 0 58 1 0 2 0 3 18808:45 AM 4 125 5 0 134 0 0 2 0 2 2 55 1 0 58 2 0 2 0 4 198
Total 13 470 13 0 496 3 0 4 0 7 5 229 8 0 242 6 1 10 0 17 762
Grand Total 24 1006 17 0 1047 3 0 6 0 9 5 474 14 0 493 12 1 17 1 31 1580Apprch % 2.3 96.1 1.6 0 33.3 0 66.7 0 1 96.1 2.8 0 38.7 3.2 54.8 3.2
Total % 1.5 63.7 1.1 0 66.3 0.2 0 0.4 0 0.6 0.3 30 0.9 0 31.2 0.8 0.1 1.1 0.1 2Unshifted 23 993 17 0 1033 3 0 5 0 8 4 455 14 0 473 12 1 17 1 31 1545
% Unshifted
Bank 1 1 13 0 0 14 0 0 1 0 1 1 19 0 0 20 0 0 0 0 0 35% Bank 1 4.2 1.3 0 0 1.3 0 0 16.7 0 11.1 20 4 0 0 4.1 0 0 0 0 0 2.2
SRF Associates3495 Winton Place, Bldg. E, Suite110
Rochester, New York, 14623

File Name : S Goodman St at Campus Drive and Pinetum Dr - AMSite Code : 11111111Start Date : 5/2/2019Page No : 2
S Goodman StFrom North
Campus DriveFrom East
S Goodman StFrom South
Pinetum DrFrom West
StartTime
Right Thru Left Peds App. Total Right Thru Left Peds App. Total Right Thru Left Peds App. Total Right Thru Left Peds App. Total Int. Total
Peak Hour Analysis From 07:00 AM to 08:45 AM - Peak 1 of 1Peak Hour for Entire Intersection Begins at 07:15 AM
07:15 AM 5 142 0 0 147 0 0 0 0 0 0 47 1 0 48 0 0 1 0 1 19607:30 AM 2 171 1 0 174 0 0 1 0 1 0 74 2 0 76 2 0 4 0 6 25707:45 AM 2 136 1 0 139 0 0 1 0 1 0 71 1 0 72 3 0 1 0 4 21608:00 AM 3 111 0 0 114 1 0 2 0 3 1 65 2 0 68 1 1 4 0 6 191Total Volume 12 560 2 0 574 1 0 4 0 5 1 257 6 0 264 6 1 10 0 17 860% App. Total 2.1 97.6 0.3 0 20 0 80 0 0.4 97.3 2.3 0 35.3 5.9 58.8 0
PHF .600 .819 .500 .000 .825 .250 .000 .500 .000 .417 .250 .868 .750 .000 .868 .500 .250 .625 .000 .708 .837Unshifted 12 556 2 0 570 1 0 3 0 4 0 250 6 0 256 6 1 10 0 17 847
% Unshifted 99.3 100 0 99.3 100 0 75.0 0 80.0 0 97.3 100 0 97.0 100 100 100 0 100 98.5Bank 1 0 4 0 0 4 0 0 1 0 1 1 7 0 0 8 0 0 0 0 0 13
% Bank 1 0 0.7 0 0 0.7 0 0 25.0 0 20.0 100 2.7 0 0 3.0 0 0 0 0 0 1.5
S Goodman St
Pin
etu
m D
r C
am
pu
s Drive
S Goodman St
Right
12 0
12 Thru
556 4
560 Left
2 0 2
Peds
0 0 0
InOut Total261 570 831
7 4 11 268 842 574
Rig
ht 1
0
1
Th
ru 0
0
0
Le
ft 3
1
4
Pe
ds 0
0
0
Ou
tT
ota
lIn
3
4
7
1
1
2
4
9
5
Left6 0 6
Thru250
7 257
Right0 1 1
Peds0 0 0
Out TotalIn
565 256 821 5 8 13
570 834 264
Le
ft10
0
1
0
Th
ru
1
0
1
Rig
ht6
0
6
Pe
ds0
0
0
To
tal
Ou
tIn
18
1
7
35
0
0
0
1
8
35
1
7
Peak Hour Begins at 07:15 AM UnshiftedBank 1
Peak Hour Data
North
SRF Associates3495 Winton Place, Bldg. E, Suite110
Rochester, New York, 14623

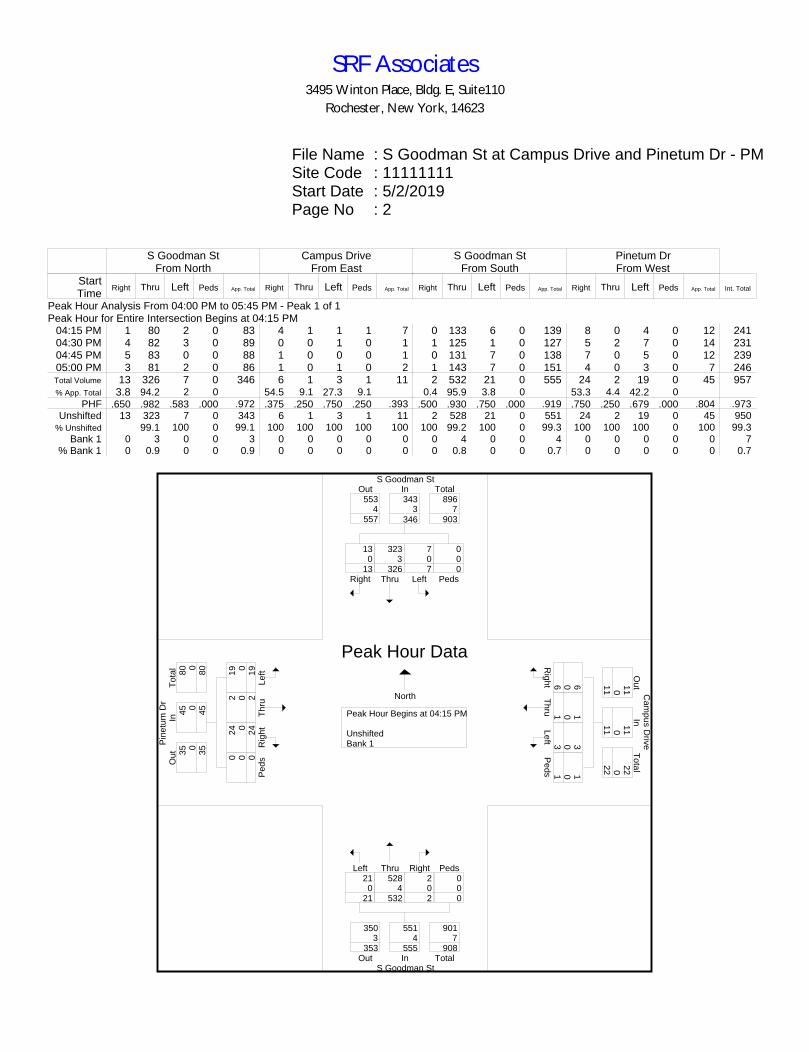
File Name : S Goodman St at Campus Drive and Pinetum Dr - PMSite Code : 11111111Start Date : 5/2/2019Page No : 1
Groups Printed- Unshifted - Bank 1S Goodman St
From NorthCampus Drive
From EastS Goodman St
From SouthPinetum DrFrom West
Start Time Right Thru Left Peds App. Total Right Thru Left Peds App. Total Right Thru Left Peds App. Total Right Thru Left Peds App. Total Int. Total
04:00 PM 3 69 0 0 72 4 0 3 0 7 1 116 4 0 121 8 0 3 0 11 21104:15 PM 1 80 2 0 83 4 1 1 1 7 0 133 6 0 139 8 0 4 0 12 24104:30 PM 4 82 3 0 89 0 0 1 0 1 1 125 1 0 127 5 2 7 0 14 23104:45 PM 5 83 0 0 88 1 0 0 0 1 0 131 7 0 138 7 0 5 0 12 239
Total 13 314 5 0 332 9 1 5 1 16 2 505 18 0 525 28 2 19 0 49 922
05:00 PM 3 81 2 0 86 1 0 1 0 2 1 143 7 0 151 4 0 3 0 7 24605:15 PM 3 76 0 0 79 2 0 2 0 4 0 129 6 0 135 8 0 4 0 12 23005:30 PM 8 81 1 0 90 0 0 1 0 1 6 113 5 0 124 6 1 7 0 14 22905:45 PM 7 84 0 0 91 0 0 1 0 1 1 122 5 0 128 6 0 7 0 13 233
Total 21 322 3 0 346 3 0 5 0 8 8 507 23 0 538 24 1 21 0 46 938
Grand Total 34 636 8 0 678 12 1 10 1 24 10 1012 41 0 1063 52 3 40 0 95 1860Apprch % 5 93.8 1.2 0 50 4.2 41.7 4.2 0.9 95.2 3.9 0 54.7 3.2 42.1 0
Total % 1.8 34.2 0.4 0 36.5 0.6 0.1 0.5 0.1 1.3 0.5 54.4 2.2 0 57.2 2.8 0.2 2.2 0 5.1Unshifted 34 631 8 0 673 12 1 10 1 24 10 1007
% Unshifted 100 99.2 100 0 99.3 100 100 100 100 100 100 99.5 100 0 99.5 100 100 100 0 100 99.5Bank 1 0 5 0 0 5 0 0 0 0 0 0 5 0 0 5 0 0 0 0 0 10
% Bank 1 0 0.8 0 0 0.7 0 0 0 0 0 0 0.5 0 0 0.5 0 0 0 0 0 0.5
SRF Associates3495 Winton Place, Bldg. E, Suite110
Rochester, New York, 14623
File Name : S Goodman St at Campus Drive and Pinetum Dr - PMSite Code : 11111111Start Date : 5/2/2019Page No : 2
S Goodman StFrom North
Campus DriveFrom East
S Goodman StFrom South
Pinetum DrFrom West
StartTime
Right Thru Left Peds App. Total Right Thru Left Peds App. Total Right Thru Left Peds App. Total Right Thru Left Peds App. Total Int. Total
Peak Hour Analysis From 04:00 PM to 05:45 PM - Peak 1 of 1Peak Hour for Entire Intersection Begins at 04:15 PM
04:15 PM 1 80 2 0 83 4 1 1 1 7 0 133 6 0 139 8 0 4 0 12 24104:30 PM 4 82 3 0 89 0 0 1 0 1 1 125 1 0 127 5 2 7 0 14 23104:45 PM 5 83 0 0 88 1 0 0 0 1 0 131 7 0 138 7 0 5 0 12 23905:00 PM 3 81 2 0 86 1 0 1 0 2 1 143 7 0 151 4 0 3 0 7 246Total Volume 13 326 7 0 346 6 1 3 1 11 2 532 21 0 555 24 2 19 0 45 957% App. Total 3.8 94.2 2 0 54.5 9.1 27.3 9.1 0.4 95.9 3.8 0 53.3 4.4 42.2 0
PHF .650 .982 .583 .000 .972 .375 .250 .750 .250 .393 .500 .930 .750 .000 .919 .750 .250 .679 .000 .804 .973Unshifted 13 323 7 0 343 6 1 3 1 11 2 528 21 0 551 24 2 19 0 45 950
% Unshifted 99.1 100 0 99.1 100 100 100 100 100 100 99.2 100 0 99.3 100 100 100 0 100 99.3Bank 1 0 3 0 0 3 0 0 0 0 0 0 4 0 0 4 0 0 0 0 0 7
% Bank 1 0 0.9 0 0 0.9 0 0 0 0 0 0 0.8 0 0 0.7 0 0 0 0 0 0.7
S Goodman St
Pin
etu
m D
r C
am
pu
s Drive
S Goodman St
Right
13 0
13 Thru
323 3
326 Left
7 0 7
Peds
0 0 0
InOut Total553 343 896
4 3 7 557 903 346
Rig
ht 6
0
6
Th
ru 1
0
1
Le
ft 3
0
3
Pe
ds 1
0
1
Ou
tT
ota
lIn
11
1
1
22
0
0
0
1
1
22
1
1
Left21 0
21
Thru528
4 532
Right2 0 2
Peds0 0 0
Out TotalIn
350 551 901 3 4 7
353 908 555
Le
ft19
0
1
9
Th
ru
2
0
2
Rig
ht
24
0
2
4
Pe
ds0
0
0
To
tal
Ou
tIn
35
4
5
80
0
0
0
3
5
80
4
5
Peak Hour Begins at 04:15 PM UnshiftedBank 1
Peak Hour Data
North
SRF Associates3495 Winton Place, Bldg. E, Suite110
Rochester, New York, 14623
A2
Miscellaneous Traffic Data
and Calculations
Prop
osed
Col
gate
Div
inity
Dev
elop
men
t, To
wn
of B
right
on, M
onro
e C
ount
y, N
YD
ocum
enta
tion
of A
mbi
ent T
raffi
c Vo
lum
e G
row
th
Road
way
Segm
ent s
tarts
at
Segm
ent e
nd a
tLo
catio
n20
0620
1020
1320
1420
1520
0920
19An
nual
Gro
wth
S G
oodm
an S
tEl
mw
ood
Ave
Hig
hlan
d Av
e Br
ight
on, N
Y 6,
573
6,67
00.
24%
S G
oodm
an S
tH
ighl
and
Ave
Cam
pus
Driv
e Br
ight
on, N
Y 12
,513
8,98
0-7
.96%
Hig
hlan
d Av
e So
uth
Ave
Dav
id D
r Br
ight
on, N
Y 6,
580
5,18
0-1
.82%
Elm
woo
d Av
eSo
uth
Ave
S G
oodm
an S
t Br
ight
on, N
Y 22
,034
22,3
100.
14%
Elm
woo
d Av
eS
Goo
dman
St
S C
linto
n Av
e Br
ight
on, N
Y 9,
294
16,8
4012
.62%
PRO
POSE
D C
OLG
ATE
DIV
INIT
Y R
E-D
EVEL
OPM
ENT
CIT
Y O
F R
OC
HES
TER
, NY
AM
PEA
KF
IG 3
FIG
4F
IG 7
FIG
8
Num
of y
rs3
2019
20
22
1201
19
25
2022
B
kgd
Vol.
Elm
woo
dS.
Clin
ton
Bkg
d Vo
l.E
nter
Exi
tT
rips
INT
rips
OU
T1.
50%
Dis
t. %
Dis
t. %
128
811
S G
oodm
an S
t/E
lmw
ood
Ave
SR
370
387
739
450
%41
4142
8S
TS
L7
77
16%
1313
20W
R20
2121
37%
4747
68W
T88
392
322
1295
792
3W
LN
RN
TN
LE
RE
T39
040
825
1845
140
8E
L14
515
213
165
22%
2828
180
2S
Goo
dman
St/
Hig
hlan
d A
veS
R18
018
818
818
%15
1520
3S
T36
538
27
389
66%
5353
435
SL
2930
304%
33
33W
R63
6666
13%
1717
83W
T24
926
03
263
260
WL
2122
2222
NR
77
77
NT
165
173
1318
659
%76
7624
9N
L8
88
8E
R1
11
1E
T69
724
7672
EL
3840
404%
55
453
S G
oodm
an S
t/P
inet
um D
r &
Cam
pus
Dr
SR
1213
1313
ST
560
586
759
358
6S
L2
22
23%
2929
29W
R1
11
11%
99
9W
T1%
11
1W
L4
44
88%
7171
71N
R1
11
76%
9797
97N
T25
726
913
282
269
NL
66
66
ER
66
66
ET
11
11%
11
2E
L10
1010
10
LOC
ATI
ON
N
UM
BER
INTE
RSE
CTI
ON
DES
CR
IPTI
ON
Tota
l Site
Tr
ips
FULL
B
uild
Vo
lum
es
FIG
6
Prop
osed
Col
gate
Div
inity
Dev
elop
men
tEx
istin
g Vo
lum
e
PRO
POSE
D C
OLG
ATE
DIV
INIT
Y R
E-D
EVEL
OPM
ENT
CIT
Y O
F R
OC
HES
TER
, NY
PM P
EAK
FIG
3F
IG 4
FIG
7F
IG 8
Num
of y
rs3
2019
20
22
1201
19
25
2022
B
kgd
Vol.
Elm
woo
dS.
Clin
ton
Bkg
d Vo
l.E
nter
Exi
tT
rips
INT
rips
OU
T1.
50%
Dis
t. %
Dis
t. %
128
132
1S
Goo
dman
St/
Elm
woo
d A
veS
R17
718
514
199
26%
3434
219
ST
SL
1415
1536
%48
4863
WR
3436
3621
%27
2763
WT
591
618
2816
662
618
WL
NR
NT
NL
ER
ET
1045
1093
4111
1145
1093
EL
418
437
1345
049
%63
6350
02
S G
oodm
an S
t/H
ighl
and
Ave
SR
7983
837%
99
92S
T18
118
914
203
62%
8282
271
SL
8488
8812
%16
1610
4W
R54
5656
7%9
965
WT
9910
45
109
104
WL
1213
1313
NR
4850
5050
NT
409
428
1344
170
%90
9051
8N
L11
1212
12E
R6
66
6E
T22
123
13
234
231
EL
8589
8910
%13
1310
23
S G
oodm
an S
t/P
inet
um D
r &
Cam
pus
Dr
SR
1920
2020
ST
321
336
1435
033
6S
L3
33
12%
1515
15W
R4
44
18%
2424
24W
T1%
11
1W
L4
44
81%
107
107
107
NR
77
787
%11
111
111
1N
T51
654
013
553
540
NL
2526
2626
ER
2526
2626
ET
11
11%
11
2E
L19
2020
20
Tota
l Site
Tr
ips
FULL
B
uild
Vo
lum
es
FIG
6
Exis
ting
Volu
me
LOC
ATI
ON
N
UM
BER
INTE
RSE
CTI
ON
DES
CR
IPTI
ON
Prop
osed
Col
gate
Div
inity
Dev
elop
men
t
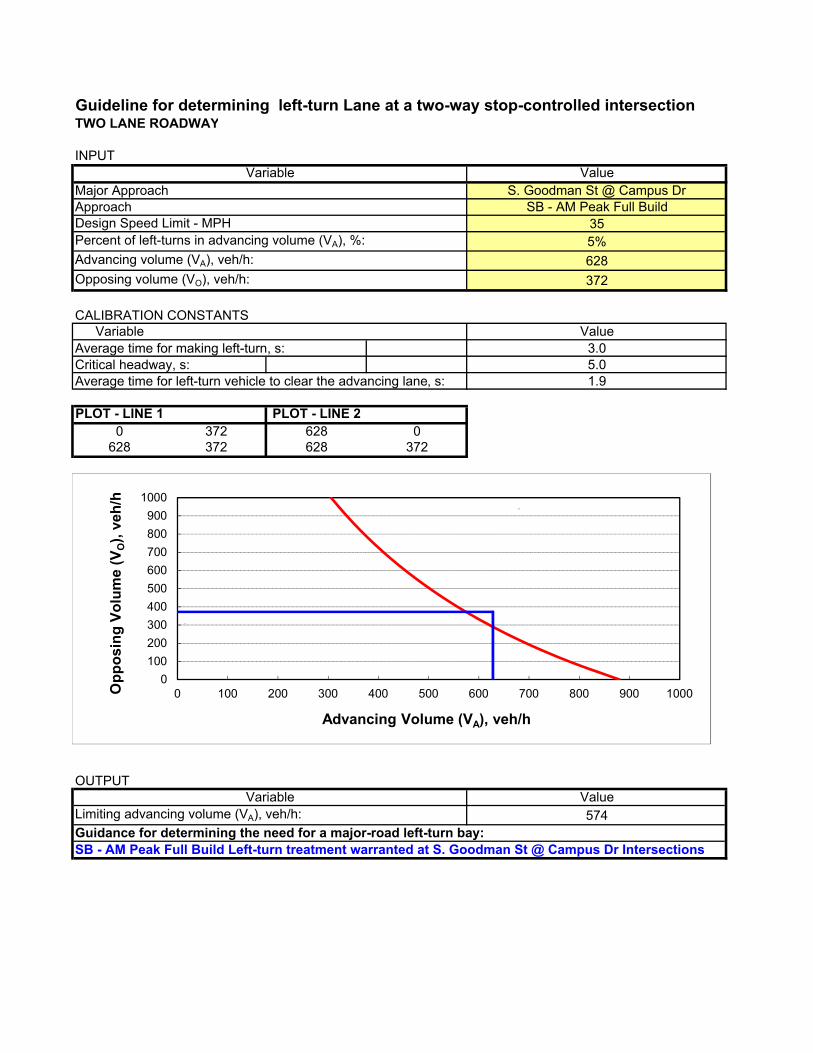
Guideline for determining left-turn Lane at a two-way stop-controlled intersectionTWO LANE ROADWAY
INPUTValue
S. Goodman St @ Campus DrSB - AM Peak Full Build
355%
628
372
CALIBRATION CONSTANTSVariable Value
Average time for making left-turn, s: 3.0Critical headway, s: 5.0Average time for left-turn vehicle to clear the advancing lane, s: 1.9
PLOT - LINE 1 PLOT - LINE 20 372 628 0
628 372 628 372
OUTPUTValue574
Opposing volume (VO), veh/h:
VariableLimiting advancing volume (VA), veh/h:
Guidance for determining the need for a major-road left-turn bay:SB - AM Peak Full Build Left-turn treatment warranted at S. Goodman St @ Campus Dr Intersections
Advancing volume (VA), veh/h:
VariableMajor ApproachApproachDesign Speed Limit - MPHPercent of left-turns in advancing volume (VA), %:
0
100
200
300
400
500
600
700
800
900
1000
0 100 200 300 400 500 600 700 800 900 1000Opp
osin
g Vo
lum
e (V
O),
veh/
h
Advancing Volume (VA), veh/h
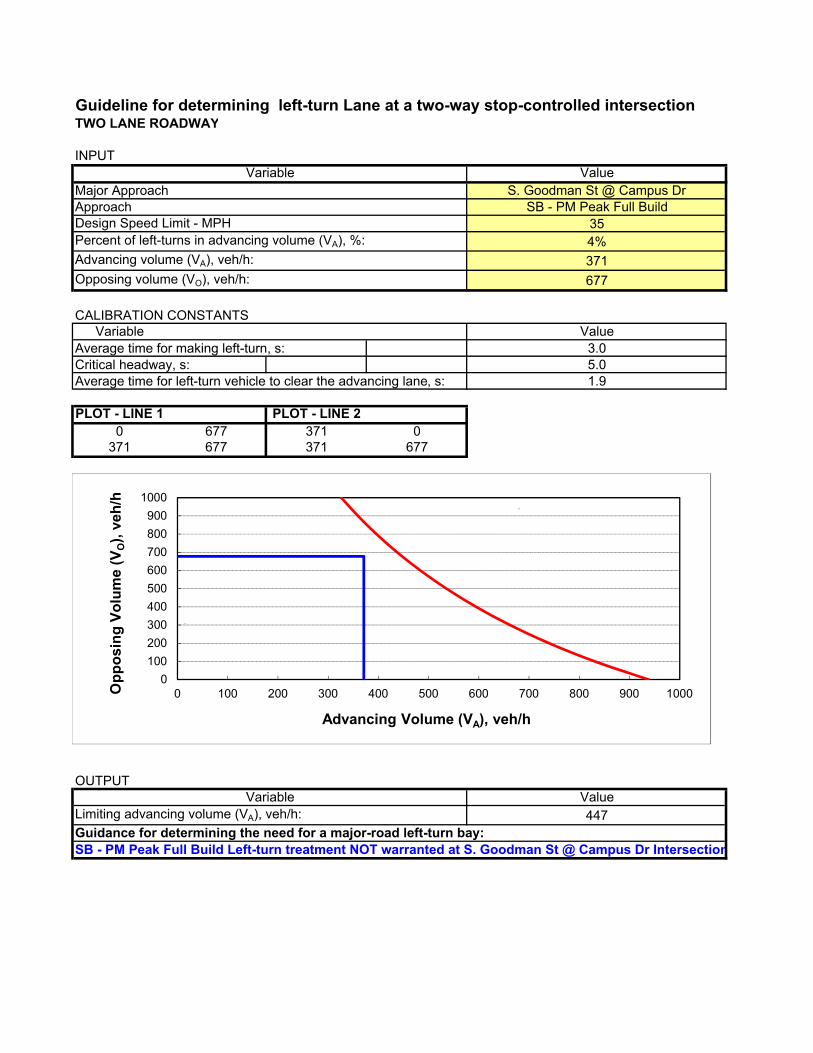
Guideline for determining left-turn Lane at a two-way stop-controlled intersectionTWO LANE ROADWAY
INPUTValue
S. Goodman St @ Campus DrSB - PM Peak Full Build
354%
371
677
CALIBRATION CONSTANTSVariable Value
Average time for making left-turn, s: 3.0Critical headway, s: 5.0Average time for left-turn vehicle to clear the advancing lane, s: 1.9
PLOT - LINE 1 PLOT - LINE 20 677 371 0
371 677 371 677
OUTPUTValue447
Opposing volume (VO), veh/h:
VariableLimiting advancing volume (VA), veh/h:
Guidance for determining the need for a major-road left-turn bay:SB - PM Peak Full Build Left-turn treatment NOT warranted at S. Goodman St @ Campus Dr Intersection
Advancing volume (VA), veh/h:
VariableMajor ApproachApproachDesign Speed Limit - MPHPercent of left-turns in advancing volume (VA), %:
0
100
200
300
400
500
600
700
800
900
1000
0 100 200 300 400 500 600 700 800 900 1000Opp
osin
g Vo
lum
e (V
O),
veh/
h
Advancing Volume (VA), veh/h
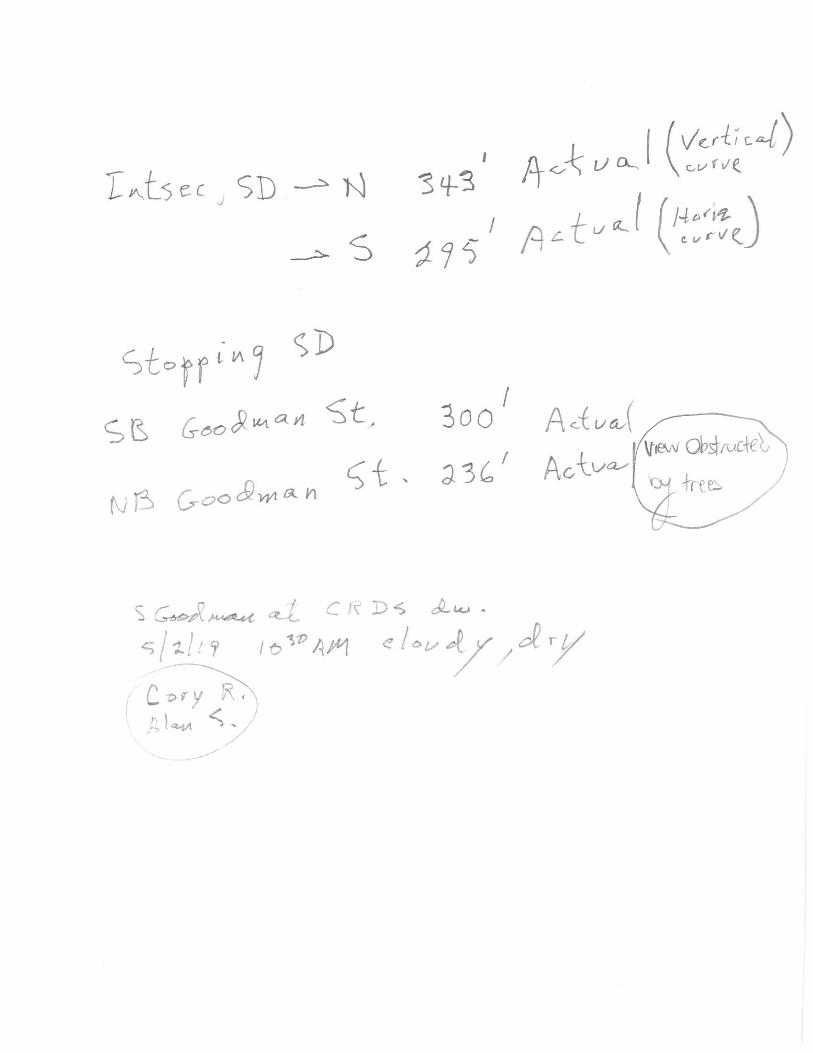
A3
Level of Service:
Criteria and Definitions
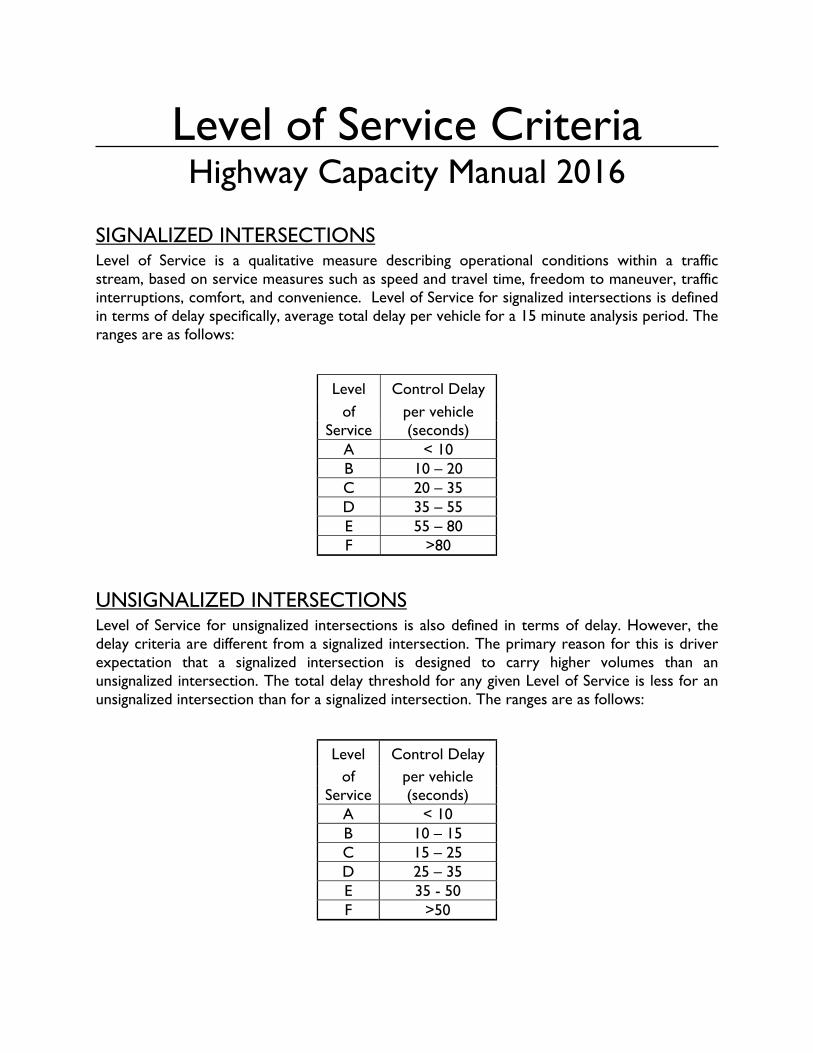
Level of Service Criteria Highway Capacity Manual 2016
SIGNALIZED INTERSECTIONS Level of Service is a qualitative measure describing operational conditions within a traffic stream, based on service measures such as speed and travel time, freedom to maneuver, traffic interruptions, comfort, and convenience. Level of Service for signalized intersections is defined in terms of delay specifically, average total delay per vehicle for a 15 minute analysis period. The ranges are as follows:
Level Control Delay of per vehicle
Service (seconds) A < 10 B 10 – 20 C 20 – 35 D 35 – 55 E 55 – 80 F >80
UNSIGNALIZED INTERSECTIONS Level of Service for unsignalized intersections is also defined in terms of delay. However, the delay criteria are different from a signalized intersection. The primary reason for this is driver expectation that a signalized intersection is designed to carry higher volumes than an unsignalized intersection. The total delay threshold for any given Level of Service is less for an unsignalized intersection than for a signalized intersection. The ranges are as follows:
Level Control Delay of per vehicle
Service (seconds) A < 10 B 10 – 15 C 15 – 25 D 25 – 35 E 35 - 50 F >50
A4
Level of Service Calculations:
Existing Conditions
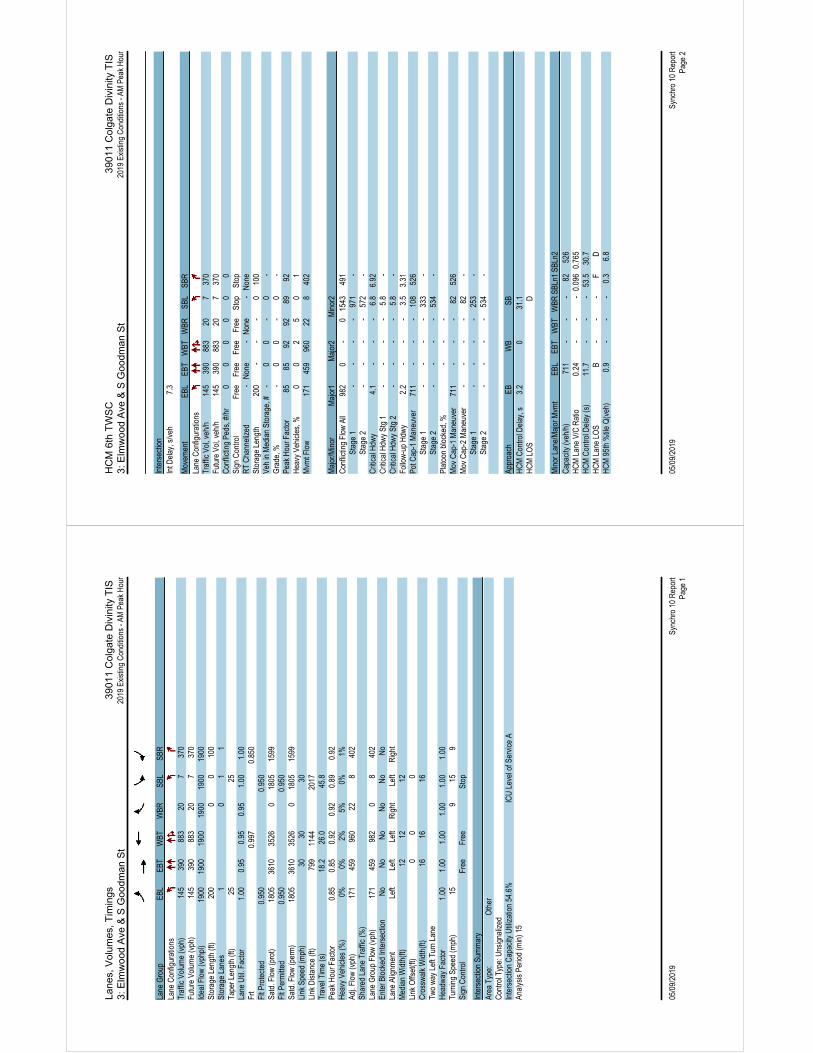
Lane
s, V
olum
es, T
imin
gs39
011
Col
gate
Div
inity
TIS
3:
Elm
woo
d A
ve &
S G
oodm
an S
t 20
19 E
xist
ing
Con
ditio
ns -
AM P
eak
Hou
r
05/0
9/20
19Sy
nchr
o 10
Rep
ort
Page
1
Lane
Gro
upEB
LEB
TW
BTW
BRSB
LSB
RLa
ne C
onfig
urat
ions
Traf
fic V
olum
e (v
ph)
145
390
883
207
370
Futu
re V
olum
e (v
ph)
145
390
883
207
370
Idea
l Flo
w (v
phpl
)19
0019
0019
0019
0019
0019
00St
orag
e Le
ngth
(ft)
200
00
100
Stor
age
Lane
s1
01
1Ta
per L
engt
h (ft
)25
25La
ne U
til. F
acto
r1.
000.
950.
950.
951.
001.
00Fr
t0.
997
0.85
0Fl
t Pro
tect
ed0.
950
0.95
0Sa
td. F
low
(pro
t)18
0536
1035
260
1805
1599
Flt P
erm
itted
0.95
00.
950
Satd
. Flo
w (p
erm
)18
0536
1035
260
1805
1599
Link
Spe
ed (m
ph)
3030
30Li
nk D
ista
nce
(ft)
799
1144
2017
Trav
el T
ime
(s)
18.2
26.0
45.8
Peak
Hou
r Fac
tor
0.85
0.85
0.92
0.92
0.89
0.92
Hea
vy V
ehic
les
(%)
0%0%
2%5%
0%1%
Adj.
Flow
(vph
)17
145
996
022
840
2Sh
ared
Lan
e Tr
affic
(%)
Lane
Gro
up F
low
(vph
)17
145
998
20
840
2En
ter B
lock
ed In
ters
ectio
nN
oN
oN
oN
oN
oN
oLa
ne A
lignm
ent
Left
Left
Left
Rig
htLe
ftR
ight
Med
ian
Wid
th(ft
)12
1212
Link
Offs
et(ft
)0
00
Cro
ssw
alk
Wid
th(ft
)16
1616
Two
way
Lef
t Tur
n La
neH
eadw
ay F
acto
r1.
001.
001.
001.
001.
001.
00Tu
rnin
g Sp
eed
(mph
)15
915
9Si
gn C
ontro
lFr
eeFr
eeSt
op
Inte
rsec
tion
Sum
mar
yAr
ea T
ype:
Oth
erC
ontro
l Typ
e: U
nsig
naliz
edIn
ters
ectio
n C
apac
ity U
tiliz
atio
n 54
.6%
ICU
Lev
el o
f Ser
vice
AAn
alys
is P
erio
d (m
in) 1
5
HC
M 6
th T
WS
C39
011
Col
gate
Div
inity
TIS
3:
Elm
woo
d A
ve &
S G
oodm
an S
t 20
19 E
xist
ing
Con
ditio
ns -
AM P
eak
Hou
r
05/0
9/20
19Sy
nchr
o 10
Rep
ort
Page
2
Inte
rsec
tion
Int D
elay
, s/v
eh7.
3
Mov
emen
tEB
LEB
TW
BTW
BRSB
LSB
RLa
ne C
onfig
urat
ions
Traf
fic V
ol, v
eh/h
145
390
883
207
370
Futu
re V
ol, v
eh/h
145
390
883
207
370
Con
flict
ing
Peds
, #/h
r0
00
00
0Si
gn C
ontro
l Fr
eeFr
eeFr
eeFr
eeSt
opSt
opR
T C
hann
eliz
ed-
Non
e-
Non
e-
Non
eSt
orag
e Le
ngth
200
--
-0
100
Veh
in M
edia
n St
orag
e, #
-0
0-
0-
Gra
de, %
-0
0-
0-
Peak
Hou
r Fac
tor
8585
9292
8992
Hea
vy V
ehic
les,
%0
02
50
1M
vmt F
low
171
459
960
228
402
Maj
or/M
inor
Maj
or1
Maj
or2
Min
or2
Con
flict
ing
Flow
All
982
0-
015
4349
1
Sta
ge 1
--
--
971
-
Sta
ge 2
--
--
572
-C
ritic
al H
dwy
4.1
--
-6.
86.
92C
ritic
al H
dwy
Stg
1-
--
-5.
8-
Crit
ical
Hdw
y St
g 2
--
--
5.8
-Fo
llow
-up
Hdw
y2.
2-
--
3.5
3.31
Pot C
ap-1
Man
euve
r71
1-
--
108
526
S
tage
1-
--
-33
3-
S
tage
2-
--
-53
4-
Plat
oon
bloc
ked,
%-
--
Mov
Cap
-1 M
aneu
ver
711
--
-82
526
Mov
Cap
-2 M
aneu
ver
--
--
82-
S
tage
1-
--
-25
3-
S
tage
2-
--
-53
4-
Appr
oach
EBW
BSB
HC
M C
ontro
l Del
ay, s
3.2
031
.1H
CM
LO
SD
Min
or L
ane/
Maj
or M
vmt
EBL
EBT
WBT
WBR
SBLn
1SB
Ln2
Cap
acity
(veh
/h)
711
--
-82
526
HC
M L
ane
V/C
Rat
io0.
24-
--
0.09
60.
765
HC
M C
ontro
l Del
ay (s
)11
.7-
--
53.5
30.7
HC
M L
ane
LOS
B-
--
FD
HC
M 9
5th
%til
e Q
(veh
)0.
9-
--
0.3
6.8
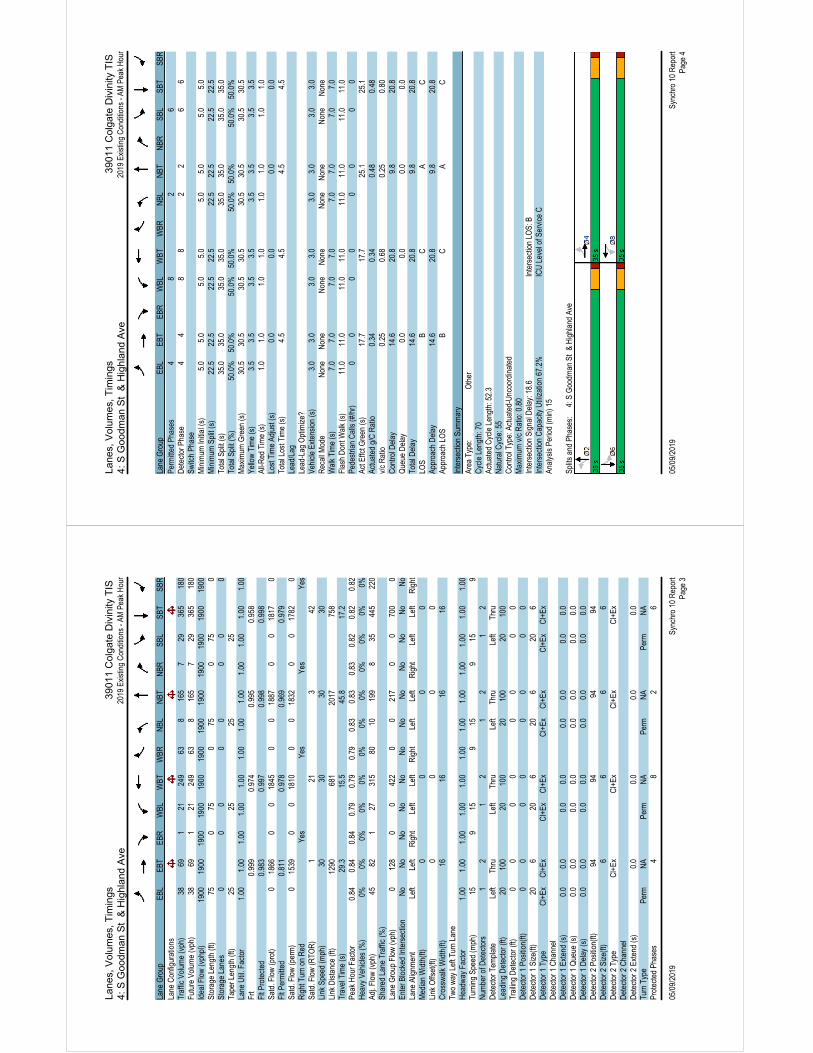
Lane
s, V
olum
es, T
imin
gs39
011
Col
gate
Div
inity
TIS
4:
S G
oodm
an S
t &
Hig
hlan
d A
ve20
19 E
xist
ing
Con
ditio
ns -
AM P
eak
Hou
r
05/0
9/20
19Sy
nchr
o 10
Rep
ort
Page
3
Lane
Gro
upEB
LEB
TEB
RW
BLW
BTW
BRN
BLN
BTN
BRSB
LSB
TSB
RLa
ne C
onfig
urat
ions
Traf
fic V
olum
e (v
ph)
3869
121
249
638
165
729
365
180
Futu
re V
olum
e (v
ph)
3869
121
249
638
165
729
365
180
Idea
l Flo
w (v
phpl
)19
0019
0019
0019
0019
0019
0019
0019
0019
0019
0019
0019
00St
orag
e Le
ngth
(ft)
750
750
750
750
Stor
age
Lane
s0
00
00
00
0Ta
per L
engt
h (ft
)25
2525
25La
ne U
til. F
acto
r1.
001.
001.
001.
001.
001.
001.
001.
001.
001.
001.
001.
00Fr
t0.
999
0.97
40.
995
0.95
8Fl
t Pro
tect
ed0.
983
0.99
70.
998
0.99
8Sa
td. F
low
(pro
t)0
1866
00
1845
00
1887
00
1817
0Fl
t Per
mitt
ed0.
811
0.97
80.
969
0.97
9Sa
td. F
low
(per
m)
015
390
018
100
018
320
017
820
Rig
ht T
urn
on R
edYe
sYe
sYe
sYe
sSa
td. F
low
(RTO
R)
121
342
Link
Spe
ed (m
ph)
3030
3030
Link
Dis
tanc
e (ft
)12
9068
120
1775
8Tr
avel
Tim
e (s
)29
.315
.545
.817
.2Pe
ak H
our F
acto
r0.
840.
840.
840.
790.
790.
790.
830.
830.
830.
820.
820.
82H
eavy
Veh
icle
s (%
)0%
0%0%
0%0%
0%0%
0%0%
0%0%
0%Ad
j. Fl
ow (v
ph)
4582
127
315
8010
199
835
445
220
Shar
ed L
ane
Traf
fic (%
)La
ne G
roup
Flo
w (v
ph)
012
80
042
20
021
70
070
00
Ente
r Blo
cked
Inte
rsec
tion
No
No
No
No
No
No
No
No
No
No
No
No
Lane
Alig
nmen
tLe
ftLe
ftR
ight
Left
Left
Rig
htLe
ftLe
ftR
ight
Left
Left
Rig
htM
edia
n W
idth
(ft)
00
00
Link
Offs
et(ft
)0
00
0C
ross
wal
k W
idth
(ft)
1616
1616
Two
way
Lef
t Tur
n La
neH
eadw
ay F
acto
r1.
001.
001.
001.
001.
001.
001.
001.
001.
001.
001.
001.
00Tu
rnin
g Sp
eed
(mph
)15
915
915
915
9N
umbe
r of D
etec
tors
1
21
21
21
2D
etec
tor T
empl
ate
Left
Thru
Left
Thru
Left
Thru
Left
Thru
Lead
ing
Det
ecto
r (ft)
2010
020
100
2010
020
100
Trai
ling
Det
ecto
r (ft)
00
00
00
00
Det
ecto
r 1 P
ositi
on(ft
)0
00
00
00
0D
etec
tor 1
Siz
e(ft)
206
206
206
206
Det
ecto
r 1 T
ype
Cl+
ExC
l+Ex
Cl+
ExC
l+Ex
Cl+
ExC
l+Ex
Cl+
ExC
l+Ex
Det
ecto
r 1 C
hann
elD
etec
tor 1
Ext
end
(s)
0.0
0.0
0.0
0.0
0.0
0.0
0.0
0.0
Det
ecto
r 1 Q
ueue
(s)
0.0
0.0
0.0
0.0
0.0
0.0
0.0
0.0
Det
ecto
r 1 D
elay
(s)
0.0
0.0
0.0
0.0
0.0
0.0
0.0
0.0
Det
ecto
r 2 P
ositi
on(ft
)94
9494
94D
etec
tor 2
Siz
e(ft)
66
66
Det
ecto
r 2 T
ype
Cl+
ExC
l+Ex
Cl+
ExC
l+Ex
Det
ecto
r 2 C
hann
elD
etec
tor 2
Ext
end
(s)
0.0
0.0
0.0
0.0
Turn
Typ
ePe
rmN
APe
rmN
APe
rmN
APe
rmN
APr
otec
ted
Phas
es4
82
6
Lane
s, V
olum
es, T
imin
gs39
011
Col
gate
Div
inity
TIS
4:
S G
oodm
an S
t &
Hig
hlan
d A
ve20
19 E
xist
ing
Con
ditio
ns -
AM P
eak
Hou
r
05/0
9/20
19Sy
nchr
o 10
Rep
ort
Page
4
Lane
Gro
upEB
LEB
TEB
RW
BLW
BTW
BRN
BLN
BTN
BRSB
LSB
TSB
RPe
rmitt
ed P
hase
s4
82
6D
etec
tor P
hase
44
88
22
66
Switc
h Ph
ase
Min
imum
Initi
al (s
)5.
05.
05.
05.
05.
05.
05.
05.
0M
inim
um S
plit
(s)
22.5
22.5
22.5
22.5
22.5
22.5
22.5
22.5
Tota
l Spl
it (s
)35
.035
.035
.035
.035
.035
.035
.035
.0To
tal S
plit
(%)
50.0
%50
.0%
50.0
%50
.0%
50.0
%50
.0%
50.0
%50
.0%
Max
imum
Gre
en (s
)30
.530
.530
.530
.530
.530
.530
.530
.5Ye
llow
Tim
e (s
)3.
53.
53.
53.
53.
53.
53.
53.
5Al
l-Red
Tim
e (s
)1.
01.
01.
01.
01.
01.
01.
01.
0Lo
st T
ime
Adju
st (s
)0.
00.
00.
00.
0To
tal L
ost T
ime
(s)
4.5
4.5
4.5
4.5
Lead
/Lag
Lead
-Lag
Opt
imiz
e?Ve
hicl
e Ex
tens
ion
(s)
3.0
3.0
3.0
3.0
3.0
3.0
3.0
3.0
Rec
all M
ode
Non
eN
one
Non
eN
one
Non
eN
one
Non
eN
one
Wal
k Ti
me
(s)
7.0
7.0
7.0
7.0
7.0
7.0
7.0
7.0
Flas
h D
ont W
alk
(s)
11.0
11.0
11.0
11.0
11.0
11.0
11.0
11.0
Pede
stria
n C
alls
(#/h
r)0
00
00
00
0Ac
t Effc
t Gre
en (s
)17
.717
.725
.125
.1Ac
tuat
ed g
/C R
atio
0.34
0.34
0.48
0.48
v/c
Rat
io0.
250.
680.
250.
80C
ontro
l Del
ay14
.620
.89.
820
.8Q
ueue
Del
ay0.
00.
00.
00.
0To
tal D
elay
14.6
20.8
9.8
20.8
LOS
BC
AC
Appr
oach
Del
ay14
.620
.89.
820
.8Ap
proa
ch L
OS
BC
AC
Inte
rsec
tion
Sum
mar
yAr
ea T
ype:
Oth
erC
ycle
Len
gth:
70
Actu
ated
Cyc
le L
engt
h: 5
2.3
Nat
ural
Cyc
le: 5
5C
ontro
l Typ
e: A
ctua
ted-
Unc
oord
inat
edM
axim
um v
/c R
atio
: 0.8
0In
ters
ectio
n Si
gnal
Del
ay: 1
8.6
Inte
rsec
tion
LOS:
BIn
ters
ectio
n C
apac
ity U
tiliz
atio
n 67
.2%
ICU
Lev
el o
f Ser
vice
CAn
alys
is P
erio
d (m
in) 1
5
Split
s an
d Ph
ases
:
4: S
Goo
dman
St
& H
ighl
and
Ave

Lane
s, V
olum
es, T
imin
gs39
011
Col
gate
Div
inity
TIS
9:
S G
oodm
an S
t &
Pin
etum
Dr/
Cam
pus
Driv
e20
19 E
xist
ing
Con
ditio
ns -
AM P
eak
Hou
r
05/0
9/20
19Sy
nchr
o 10
Rep
ort
Page
5
Lane
Gro
upEB
LEB
TEB
RW
BLW
BTW
BRN
BLN
BTN
BRSB
LSB
TSB
RLa
ne C
onfig
urat
ions
Traf
fic V
olum
e (v
ph)
61
104
01
625
71
256
012
Futu
re V
olum
e (v
ph)
61
104
01
625
71
256
012
Idea
l Flo
w (v
phpl
)19
0019
0019
0019
0019
0019
0019
0019
0019
0019
0019
0019
00La
ne U
til. F
acto
r1.
001.
001.
001.
001.
001.
001.
001.
001.
001.
001.
001.
00Fr
t0.
918
0.97
70.
997
Flt P
rote
cted
0.98
30.
960
0.99
9Sa
td. F
low
(pro
t)0
1715
00
1475
00
1844
00
1876
0Fl
t Per
mitt
ed0.
983
0.96
00.
999
Satd
. Flo
w (p
erm
)0
1715
00
1475
00
1844
00
1876
0Li
nk S
peed
(mph
)30
3030
30Li
nk D
ista
nce
(ft)
392
349
758
552
Trav
el T
ime
(s)
8.9
7.9
17.2
12.5
Peak
Hou
r Fac
tor
0.71
0.71
0.71
0.42
0.42
0.42
0.87
0.87
0.87
0.82
0.82
0.82
Hea
vy V
ehic
les
(%)
0%0%
0%25
%0%
0%0%
3%0%
0%1%
0%Ad
j. Fl
ow (v
ph)
81
1410
02
729
51
268
315
Shar
ed L
ane
Traf
fic (%
)La
ne G
roup
Flo
w (v
ph)
023
00
120
030
30
070
00
Ente
r Blo
cked
Inte
rsec
tion
No
No
No
No
No
No
No
No
No
No
No
No
Lane
Alig
nmen
tLe
ftLe
ftR
ight
Left
Left
Rig
htLe
ftLe
ftR
ight
Left
Left
Rig
htM
edia
n W
idth
(ft)
00
00
Link
Offs
et(ft
)0
00
0C
ross
wal
k W
idth
(ft)
1616
1616
Two
way
Lef
t Tur
n La
neH
eadw
ay F
acto
r1.
001.
001.
001.
001.
001.
001.
001.
001.
001.
001.
001.
00Tu
rnin
g Sp
eed
(mph
)15
915
915
915
9Si
gn C
ontro
lSt
opSt
opFr
eeFr
ee
Inte
rsec
tion
Sum
mar
yAr
ea T
ype:
Oth
erC
ontro
l Typ
e: U
nsig
naliz
edIn
ters
ectio
n C
apac
ity U
tiliz
atio
n 41
.2%
ICU
Lev
el o
f Ser
vice
AAn
alys
is P
erio
d (m
in) 1
5
HC
M 6
th T
WS
C39
011
Col
gate
Div
inity
TIS
9:
S G
oodm
an S
t &
Pin
etum
Dr/
Cam
pus
Driv
e20
19 E
xist
ing
Con
ditio
ns -
AM P
eak
Hou
r
05/0
9/20
19Sy
nchr
o 10
Rep
ort
Page
6
Inte
rsec
tion
Int D
elay
, s/v
eh0.
7
Mov
emen
tEB
LEB
TEB
RW
BLW
BTW
BRN
BLN
BTN
BRSB
LSB
TSB
RLa
ne C
onfig
urat
ions
Traf
fic V
ol, v
eh/h
61
104
01
625
71
256
012
Futu
re V
ol, v
eh/h
61
104
01
625
71
256
012
Con
flict
ing
Peds
, #/h
r0
00
00
00
00
00
0Si
gn C
ontro
l St
opSt
opSt
opSt
opSt
opSt
opFr
eeFr
eeFr
eeFr
eeFr
eeFr
eeR
T C
hann
eliz
ed-
-N
one
--
Non
e-
-N
one
--
Non
eSt
orag
e Le
ngth
--
--
--
--
--
--
Veh
in M
edia
n St
orag
e, #
-0
--
0-
-0
--
0-
Gra
de, %
-0
--
0-
-0
--
0-
Peak
Hou
r Fac
tor
7171
7142
4242
8787
8782
8282
Hea
vy V
ehic
les,
%0
00
250
00
30
01
0M
vmt F
low
81
1410
02
729
51
268
315
Maj
or/M
inor
Min
or2
Min
or1
Maj
or1
Maj
or2
Con
flict
ing
Flow
All
1006
1005
691
1012
1012
296
698
00
296
00
S
tage
169
569
5-
310
310
--
--
--
-
Sta
ge 2
311
310
-70
270
2-
--
--
--
Crit
ical
Hdw
y7.
16.
56.
27.
356.
56.
24.
1-
-4.
1-
-C
ritic
al H
dwy
Stg
16.
15.
5-
6.35
5.5
--
--
--
-C
ritic
al H
dwy
Stg
26.
15.
5-
6.35
5.5
--
--
--
-Fo
llow
-up
Hdw
y3.
54
3.3
3.72
54
3.3
2.2
--
2.2
--
Pot C
ap-1
Man
euve
r22
224
344
819
824
174
890
8-
-12
77-
-
Sta
ge 1
436
447
-65
466
3-
--
--
--
S
tage
270
466
3-
394
443
--
--
--
-Pl
atoo
n bl
ocke
d, %
--
--
Mov
Cap
-1 M
aneu
ver
219
240
448
189
238
748
908
--
1277
--
Mov
Cap
-2 M
aneu
ver
219
240
-18
923
8-
--
--
--
S
tage
143
244
6-
648
657
--
--
--
-
Sta
ge 2
695
657
-37
944
2-
--
--
--
Appr
oach
EBW
BN
BSB
HC
M C
ontro
l Del
ay, s
17.4
22.1
0.2
0H
CM
LO
SC
C M
inor
Lan
e/M
ajor
Mvm
tN
BLN
BTN
BREB
Ln1W
BLn1
SBL
SBT
SBR
Cap
acity
(veh
/h)
908
--
315
222
1277
--
HC
M L
ane
V/C
Rat
io0.
008
--
0.07
60.
054
0.00
2-
-H
CM
Con
trol D
elay
(s)
90
-17
.422
.17.
80
-H
CM
Lan
e LO
SA
A-
CC
AA
-H
CM
95t
h %
tile
Q(v
eh)
0-
-0.
20.
20
--
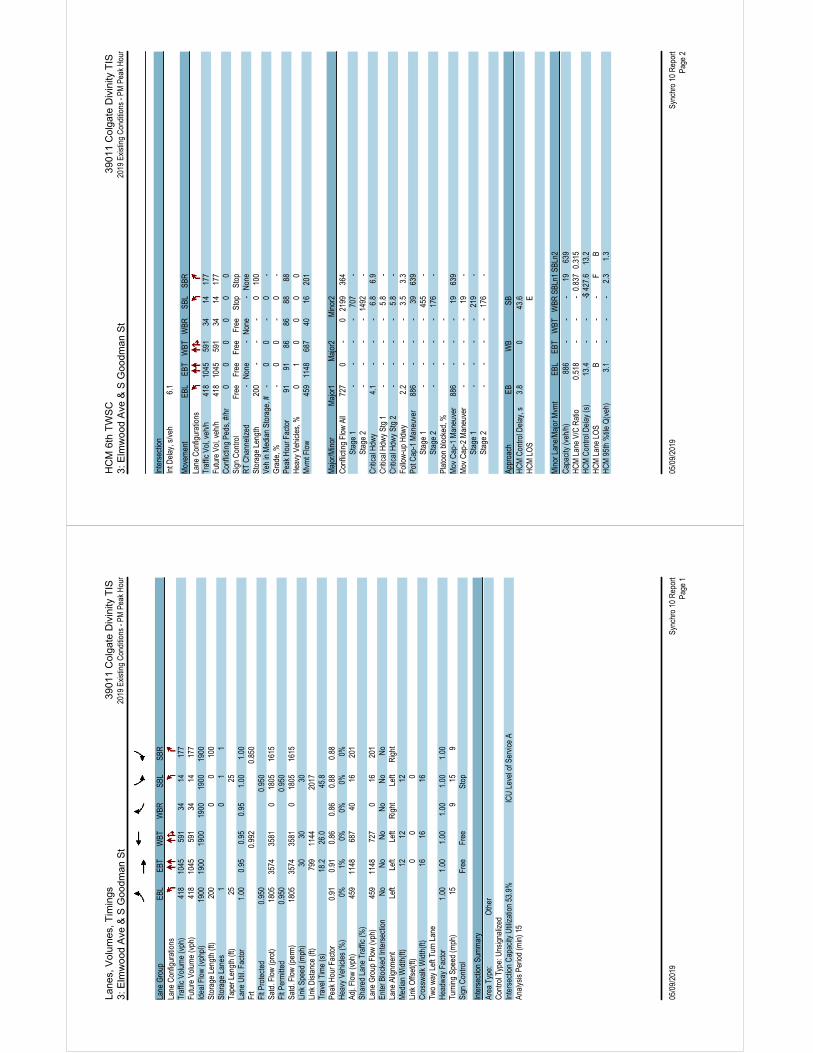
Lane
s, V
olum
es, T
imin
gs39
011
Col
gate
Div
inity
TIS
3:
Elm
woo
d A
ve &
S G
oodm
an S
t 20
19 E
xist
ing
Con
ditio
ns -
PM P
eak
Hou
r
05/0
9/20
19Sy
nchr
o 10
Rep
ort
Page
1
Lane
Gro
upEB
LEB
TW
BTW
BRSB
LSB
RLa
ne C
onfig
urat
ions
Traf
fic V
olum
e (v
ph)
418
1045
591
3414
177
Futu
re V
olum
e (v
ph)
418
1045
591
3414
177
Idea
l Flo
w (v
phpl
)19
0019
0019
0019
0019
0019
00St
orag
e Le
ngth
(ft)
200
00
100
Stor
age
Lane
s1
01
1Ta
per L
engt
h (ft
)25
25La
ne U
til. F
acto
r1.
000.
950.
950.
951.
001.
00Fr
t0.
992
0.85
0Fl
t Pro
tect
ed0.
950
0.95
0Sa
td. F
low
(pro
t)18
0535
7435
810
1805
1615
Flt P
erm
itted
0.95
00.
950
Satd
. Flo
w (p
erm
)18
0535
7435
810
1805
1615
Link
Spe
ed (m
ph)
3030
30Li
nk D
ista
nce
(ft)
799
1144
2017
Trav
el T
ime
(s)
18.2
26.0
45.8
Peak
Hou
r Fac
tor
0.91
0.91
0.86
0.86
0.88
0.88
Hea
vy V
ehic
les
(%)
0%1%
0%0%
0%0%
Adj.
Flow
(vph
)45
911
4868
740
1620
1Sh
ared
Lan
e Tr
affic
(%)
Lane
Gro
up F
low
(vph
)45
911
4872
70
1620
1En
ter B
lock
ed In
ters
ectio
nN
oN
oN
oN
oN
oN
oLa
ne A
lignm
ent
Left
Left
Left
Rig
htLe
ftR
ight
Med
ian
Wid
th(ft
)12
1212
Link
Offs
et(ft
)0
00
Cro
ssw
alk
Wid
th(ft
)16
1616
Two
way
Lef
t Tur
n La
neH
eadw
ay F
acto
r1.
001.
001.
001.
001.
001.
00Tu
rnin
g Sp
eed
(mph
)15
915
9Si
gn C
ontro
lFr
eeFr
eeSt
op
Inte
rsec
tion
Sum
mar
yAr
ea T
ype:
Oth
erC
ontro
l Typ
e: U
nsig
naliz
edIn
ters
ectio
n C
apac
ity U
tiliz
atio
n 53
.9%
ICU
Lev
el o
f Ser
vice
AAn
alys
is P
erio
d (m
in) 1
5
HC
M 6
th T
WS
C39
011
Col
gate
Div
inity
TIS
3:
Elm
woo
d A
ve &
S G
oodm
an S
t 20
19 E
xist
ing
Con
ditio
ns -
PM P
eak
Hou
r
05/0
9/20
19Sy
nchr
o 10
Rep
ort
Page
2
Inte
rsec
tion
Int D
elay
, s/v
eh6.
1
Mov
emen
tEB
LEB
TW
BTW
BRSB
LSB
RLa
ne C
onfig
urat
ions
Traf
fic V
ol, v
eh/h
418
1045
591
3414
177
Futu
re V
ol, v
eh/h
418
1045
591
3414
177
Con
flict
ing
Peds
, #/h
r0
00
00
0Si
gn C
ontro
l Fr
eeFr
eeFr
eeFr
eeSt
opSt
opR
T C
hann
eliz
ed-
Non
e-
Non
e-
Non
eSt
orag
e Le
ngth
200
--
-0
100
Veh
in M
edia
n St
orag
e, #
-0
0-
0-
Gra
de, %
-0
0-
0-
Peak
Hou
r Fac
tor
9191
8686
8888
Hea
vy V
ehic
les,
%0
10
00
0M
vmt F
low
459
1148
687
4016
201
Maj
or/M
inor
Maj
or1
Maj
or2
Min
or2
Con
flict
ing
Flow
All
727
0-
021
9936
4
Sta
ge 1
--
--
707
-
Sta
ge 2
--
--
1492
-C
ritic
al H
dwy
4.1
--
-6.
86.
9C
ritic
al H
dwy
Stg
1-
--
-5.
8-
Crit
ical
Hdw
y St
g 2
--
--
5.8
-Fo
llow
-up
Hdw
y2.
2-
--
3.5
3.3
Pot C
ap-1
Man
euve
r88
6-
--
3963
9
Sta
ge 1
--
--
455
-
Sta
ge 2
--
--
176
-Pl
atoo
n bl
ocke
d, %
--
-M
ov C
ap-1
Man
euve
r88
6-
--
1963
9M
ov C
ap-2
Man
euve
r-
--
-19
-
Sta
ge 1
--
--
219
-
Sta
ge 2
--
--
176
- Ap
proa
chEB
WB
SBH
CM
Con
trol D
elay
, s3.
80
43.6
HC
M L
OS
E M
inor
Lan
e/M
ajor
Mvm
tEB
LEB
TW
BTW
BRSB
Ln1
SBLn
2C
apac
ity (v
eh/h
)88
6-
--
1963
9H
CM
Lan
e V/
C R
atio
0.51
8-
--
0.83
70.
315
HC
M C
ontro
l Del
ay (s
)13
.4-
--$
427
.613
.2H
CM
Lan
e LO
SB
--
-F
BH
CM
95t
h %
tile
Q(v
eh)
3.1
--
-2.
31.
3
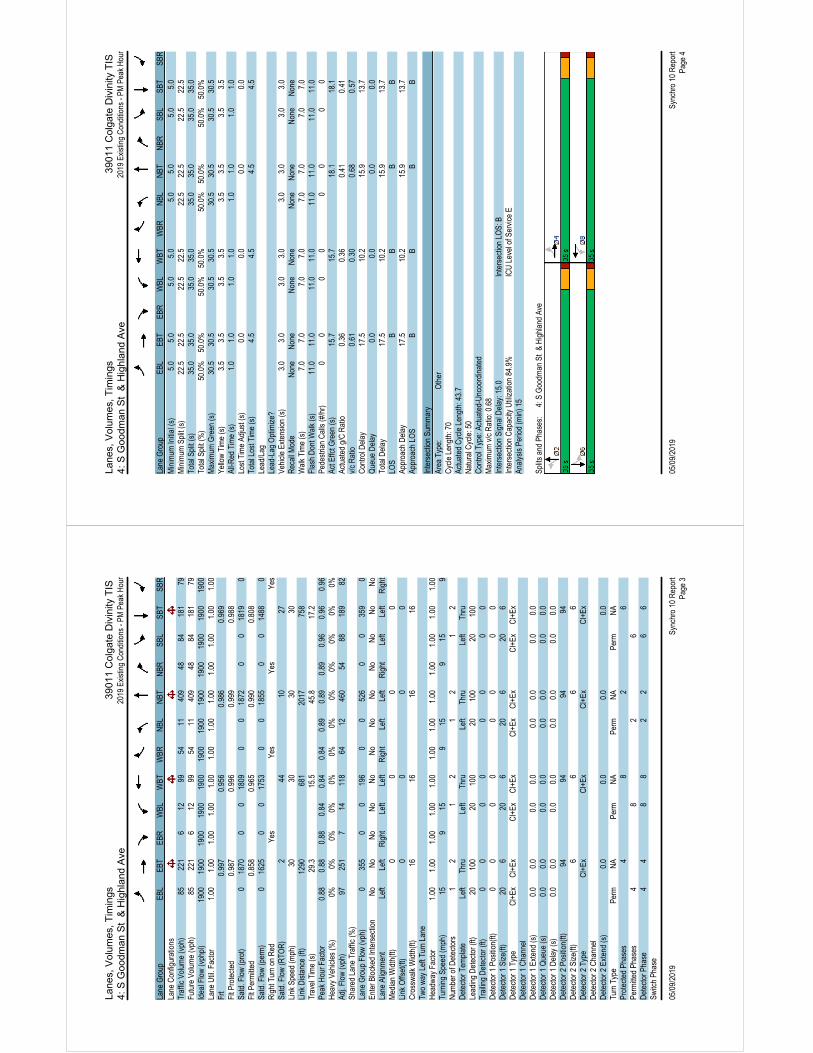
Lane
s, V
olum
es, T
imin
gs39
011
Col
gate
Div
inity
TIS
4:
S G
oodm
an S
t &
Hig
hlan
d A
ve20
19 E
xist
ing
Con
ditio
ns -
PM P
eak
Hou
r
05/0
9/20
19Sy
nchr
o 10
Rep
ort
Page
3
Lane
Gro
upEB
LEB
TEB
RW
BLW
BTW
BRN
BLN
BTN
BRSB
LSB
TSB
RLa
ne C
onfig
urat
ions
Traf
fic V
olum
e (v
ph)
8522
16
1299
5411
409
4884
181
79Fu
ture
Vol
ume
(vph
)85
221
612
9954
1140
948
8418
179
Idea
l Flo
w (v
phpl
)19
0019
0019
0019
0019
0019
0019
0019
0019
0019
0019
0019
00La
ne U
til. F
acto
r1.
001.
001.
001.
001.
001.
001.
001.
001.
001.
001.
001.
00Fr
t0.
997
0.95
60.
986
0.96
9Fl
t Pro
tect
ed0.
987
0.99
60.
999
0.98
8Sa
td. F
low
(pro
t)0
1870
00
1809
00
1872
00
1819
0Fl
t Per
mitt
ed0.
858
0.96
50.
990
0.80
8Sa
td. F
low
(per
m)
016
250
017
530
018
550
014
880
Rig
ht T
urn
on R
edYe
sYe
sYe
sYe
sSa
td. F
low
(RTO
R)
244
1027
Link
Spe
ed (m
ph)
3030
3030
Link
Dis
tanc
e (ft
)12
9068
120
1775
8Tr
avel
Tim
e (s
)29
.315
.545
.817
.2Pe
ak H
our F
acto
r0.
880.
880.
880.
840.
840.
840.
890.
890.
890.
960.
960.
96H
eavy
Veh
icle
s (%
)0%
0%0%
0%0%
0%0%
0%0%
0%0%
0%Ad
j. Fl
ow (v
ph)
9725
17
1411
864
1246
054
8818
982
Shar
ed L
ane
Traf
fic (%
)La
ne G
roup
Flo
w (v
ph)
035
50
019
60
052
60
035
90
Ente
r Blo
cked
Inte
rsec
tion
No
No
No
No
No
No
No
No
No
No
No
No
Lane
Alig
nmen
tLe
ftLe
ftR
ight
Left
Left
Rig
htLe
ftLe
ftR
ight
Left
Left
Rig
htM
edia
n W
idth
(ft)
00
00
Link
Offs
et(ft
)0
00
0C
ross
wal
k W
idth
(ft)
1616
1616
Two
way
Lef
t Tur
n La
neH
eadw
ay F
acto
r1.
001.
001.
001.
001.
001.
001.
001.
001.
001.
001.
001.
00Tu
rnin
g Sp
eed
(mph
)15
915
915
915
9N
umbe
r of D
etec
tors
1
21
21
21
2D
etec
tor T
empl
ate
Left
Thru
Left
Thru
Left
Thru
Left
Thru
Lead
ing
Det
ecto
r (ft)
2010
020
100
2010
020
100
Trai
ling
Det
ecto
r (ft)
00
00
00
00
Det
ecto
r 1 P
ositi
on(ft
)0
00
00
00
0D
etec
tor 1
Siz
e(ft)
206
206
206
206
Det
ecto
r 1 T
ype
Cl+
ExC
l+Ex
Cl+
ExC
l+Ex
Cl+
ExC
l+Ex
Cl+
ExC
l+Ex
Det
ecto
r 1 C
hann
elD
etec
tor 1
Ext
end
(s)
0.0
0.0
0.0
0.0
0.0
0.0
0.0
0.0
Det
ecto
r 1 Q
ueue
(s)
0.0
0.0
0.0
0.0
0.0
0.0
0.0
0.0
Det
ecto
r 1 D
elay
(s)
0.0
0.0
0.0
0.0
0.0
0.0
0.0
0.0
Det
ecto
r 2 P
ositi
on(ft
)94
9494
94D
etec
tor 2
Siz
e(ft)
66
66
Det
ecto
r 2 T
ype
Cl+
ExC
l+Ex
Cl+
ExC
l+Ex
Det
ecto
r 2 C
hann
elD
etec
tor 2
Ext
end
(s)
0.0
0.0
0.0
0.0
Turn
Typ
ePe
rmN
APe
rmN
APe
rmN
APe
rmN
APr
otec
ted
Phas
es4
82
6Pe
rmitt
ed P
hase
s4
82
6D
etec
tor P
hase
44
88
22
66
Switc
h Ph
ase
Lane
s, V
olum
es, T
imin
gs39
011
Col
gate
Div
inity
TIS
4:
S G
oodm
an S
t &
Hig
hlan
d A
ve20
19 E
xist
ing
Con
ditio
ns -
PM P
eak
Hou
r
05/0
9/20
19Sy
nchr
o 10
Rep
ort
Page
4
Lane
Gro
upEB
LEB
TEB
RW
BLW
BTW
BRN
BLN
BTN
BRSB
LSB
TSB
RM
inim
um In
itial
(s)
5.0
5.0
5.0
5.0
5.0
5.0
5.0
5.0
Min
imum
Spl
it (s
)22
.522
.522
.522
.522
.522
.522
.522
.5To
tal S
plit
(s)
35.0
35.0
35.0
35.0
35.0
35.0
35.0
35.0
Tota
l Spl
it (%
)50
.0%
50.0
%50
.0%
50.0
%50
.0%
50.0
%50
.0%
50.0
%M
axim
um G
reen
(s)
30.5
30.5
30.5
30.5
30.5
30.5
30.5
30.5
Yello
w T
ime
(s)
3.5
3.5
3.5
3.5
3.5
3.5
3.5
3.5
All-R
ed T
ime
(s)
1.0
1.0
1.0
1.0
1.0
1.0
1.0
1.0
Lost
Tim
e Ad
just
(s)
0.0
0.0
0.0
0.0
Tota
l Los
t Tim
e (s
)4.
54.
54.
54.
5Le
ad/L
agLe
ad-L
ag O
ptim
ize?
Vehi
cle
Exte
nsio
n (s
)3.
03.
03.
03.
03.
03.
03.
03.
0R
ecal
l Mod
eN
one
Non
eN
one
Non
eN
one
Non
eN
one
Non
eW
alk
Tim
e (s
)7.
07.
07.
07.
07.
07.
07.
07.
0Fl
ash
Don
t Wal
k (s
)11
.011
.011
.011
.011
.011
.011
.011
.0Pe
dest
rian
Cal
ls (#
/hr)
00
00
00
00
Act E
ffct G
reen
(s)
15.7
15.7
18.1
18.1
Actu
ated
g/C
Rat
io0.
360.
360.
410.
41v/
c R
atio
0.61
0.30
0.68
0.57
Con
trol D
elay
17.5
10.2
15.9
13.7
Que
ue D
elay
0.0
0.0
0.0
0.0
Tota
l Del
ay17
.510
.215
.913
.7LO
SB
BB
BAp
proa
ch D
elay
17.5
10.2
15.9
13.7
Appr
oach
LO
SB
BB
B
Inte
rsec
tion
Sum
mar
yAr
ea T
ype:
Oth
erC
ycle
Len
gth:
70
Actu
ated
Cyc
le L
engt
h: 4
3.7
Nat
ural
Cyc
le: 5
0C
ontro
l Typ
e: A
ctua
ted-
Unc
oord
inat
edM
axim
um v
/c R
atio
: 0.6
8In
ters
ectio
n Si
gnal
Del
ay: 1
5.0
Inte
rsec
tion
LOS:
BIn
ters
ectio
n C
apac
ity U
tiliz
atio
n 84
.9%
ICU
Lev
el o
f Ser
vice
EAn
alys
is P
erio
d (m
in) 1
5
Split
s an
d Ph
ases
:
4: S
Goo
dman
St
& H
ighl
and
Ave

Lane
s, V
olum
es, T
imin
gs39
011
Col
gate
Div
inity
TIS
9:
S G
oodm
an S
t &
Pin
etum
Dr/
Cam
pus
Driv
e20
19 E
xist
ing
Con
ditio
ns -
PM P
eak
Hou
r
05/0
9/20
19Sy
nchr
o 10
Rep
ort
Page
5
Lane
Gro
upEB
LEB
TEB
RW
BLW
BTW
BRN
BLN
BTN
BRSB
LSB
TSB
RLa
ne C
onfig
urat
ions
Traf
fic V
olum
e (v
ph)
191
254
04
2551
67
332
119
Futu
re V
olum
e (v
ph)
191
254
04
2551
67
332
119
Idea
l Flo
w (v
phpl
)19
0019
0019
0019
0019
0019
0019
0019
0019
0019
0019
0019
00La
ne U
til. F
acto
r1.
001.
001.
001.
001.
001.
001.
001.
001.
001.
001.
001.
00Fr
t0.
925
0.93
20.
998
0.99
3Fl
t Pro
tect
ed0.
979
0.97
60.
998
Satd
. Flo
w (p
rot)
017
210
017
110
018
920
018
690
Flt P
erm
itted
0.97
90.
976
0.99
8Sa
td. F
low
(per
m)
017
210
017
110
018
920
018
690
Link
Spe
ed (m
ph)
3030
3030
Link
Dis
tanc
e (ft
)39
234
975
855
2Tr
avel
Tim
e (s
)8.
97.
917
.212
.5Pe
ak H
our F
acto
r0.
800.
800.
800.
500.
500.
500.
910.
910.
910.
950.
950.
95H
eavy
Veh
icle
s (%
)0%
0%0%
0%0%
2%0%
0%0%
0%1%
0%Ad
j. Fl
ow (v
ph)
241
318
08
2756
78
333
820
Shar
ed L
ane
Traf
fic (%
)La
ne G
roup
Flo
w (v
ph)
056
00
160
060
20
036
10
Ente
r Blo
cked
Inte
rsec
tion
No
No
No
No
No
No
No
No
No
No
No
No
Lane
Alig
nmen
tLe
ftLe
ftR
ight
Left
Left
Rig
htLe
ftLe
ftR
ight
Left
Left
Rig
htM
edia
n W
idth
(ft)
00
00
Link
Offs
et(ft
)0
00
0C
ross
wal
k W
idth
(ft)
1616
1616
Two
way
Lef
t Tur
n La
neH
eadw
ay F
acto
r1.
001.
001.
001.
001.
001.
001.
001.
001.
001.
001.
001.
00Tu
rnin
g Sp
eed
(mph
)15
915
915
915
9Si
gn C
ontro
lSt
opSt
opFr
eeFr
ee
Inte
rsec
tion
Sum
mar
yAr
ea T
ype:
Oth
erC
ontro
l Typ
e: U
nsig
naliz
edIn
ters
ectio
n C
apac
ity U
tiliz
atio
n 53
.9%
ICU
Lev
el o
f Ser
vice
AAn
alys
is P
erio
d (m
in) 1
5
HC
M 6
th T
WS
C39
011
Col
gate
Div
inity
TIS
9:
S G
oodm
an S
t &
Pin
etum
Dr/
Cam
pus
Driv
e20
19 E
xist
ing
Con
ditio
ns -
PM P
eak
Hou
r
05/0
9/20
19Sy
nchr
o 10
Rep
ort
Page
6
Inte
rsec
tion
Int D
elay
, s/v
eh1.
5
Mov
emen
tEB
LEB
TEB
RW
BLW
BTW
BRN
BLN
BTN
BRSB
LSB
TSB
RLa
ne C
onfig
urat
ions
Traf
fic V
ol, v
eh/h
191
254
04
2551
67
332
119
Futu
re V
ol, v
eh/h
191
254
04
2551
67
332
119
Con
flict
ing
Peds
, #/h
r0
00
00
00
00
00
0Si
gn C
ontro
l St
opSt
opSt
opSt
opSt
opSt
opFr
eeFr
eeFr
eeFr
eeFr
eeFr
eeR
T C
hann
eliz
ed-
-N
one
--
Non
e-
-N
one
--
Non
eSt
orag
e Le
ngth
--
--
--
--
--
--
Veh
in M
edia
n St
orag
e, #
-0
--
0-
-0
--
0-
Gra
de, %
-0
--
0-
-0
--
0-
Peak
Hou
r Fac
tor
8080
8050
5050
9191
9195
9595
Hea
vy V
ehic
les,
%0
00
00
20
00
01
0M
vmt F
low
241
318
08
2756
78
333
820
Maj
or/M
inor
Min
or2
Min
or1
Maj
or1
Maj
or2
Con
flict
ing
Flow
All
983
983
348
995
989
571
358
00
575
00
S
tage
135
435
4-
625
625
--
--
--
-
Sta
ge 2
629
629
-37
036
4-
--
--
--
Crit
ical
Hdw
y7.
16.
56.
27.
16.
56.
224.
1-
-4.
1-
-C
ritic
al H
dwy
Stg
16.
15.
5-
6.1
5.5
--
--
--
-C
ritic
al H
dwy
Stg
26.
15.
5-
6.1
5.5
--
--
--
-Fo
llow
-up
Hdw
y3.
54
3.3
3.5
43.
318
2.2
--
2.2
--
Pot C
ap-1
Man
euve
r23
025
170
022
624
952
012
12-
-10
08-
-
Sta
ge 1
667
634
-47
648
0-
--
--
--
S
tage
247
447
8-
654
627
--
--
--
-Pl
atoo
n bl
ocke
d, %
--
--
Mov
Cap
-1 M
aneu
ver
220
242
700
209
240
520
1212
--
1008
--
Mov
Cap
-2 M
aneu
ver
220
242
-20
924
0-
--
--
--
S
tage
164
563
1-
460
464
--
--
--
-
Sta
ge 2
451
462
-62
162
4-
--
--
--
Appr
oach
EBW
BN
BSB
HC
M C
ontro
l Del
ay, s
1717
.80.
40.
1H
CM
LO
SC
C M
inor
Lan
e/M
ajor
Mvm
tN
BLN
BTN
BREB
Ln1W
BLn1
SBL
SBT
SBR
Cap
acity
(veh
/h)
1212
--
357
298
1008
--
HC
M L
ane
V/C
Rat
io0.
023
--
0.15
80.
054
0.00
3-
-H
CM
Con
trol D
elay
(s)
80
-17
17.8
8.6
0-
HC
M L
ane
LOS
AA
-C
CA
A-
HC
M 9
5th
%til
e Q
(veh
)0.
1-
-0.
60.
20
--
A5
Level of Service Calculations: Background Conditions

Lane
s, V
olum
es, T
imin
gs39
011
Col
gate
Div
inity
TIS
3:
Elm
woo
d A
ve &
S G
oodm
an S
t 20
22 B
ackg
roun
d C
ondi
tions
- AM
Pea
k H
our
05/0
9/20
19Sy
nchr
o 10
Rep
ort
Page
1
Lane
Gro
upEB
LEB
TW
BTW
BRSB
LSB
RLa
ne C
onfig
urat
ions
Traf
fic V
olum
e (v
ph)
165
451
957
217
394
Futu
re V
olum
e (v
ph)
165
451
957
217
394
Idea
l Flo
w (v
phpl
)19
0019
0019
0019
0019
0019
00St
orag
e Le
ngth
(ft)
200
00
100
Stor
age
Lane
s1
01
1Ta
per L
engt
h (ft
)25
25La
ne U
til. F
acto
r1.
000.
950.
950.
951.
001.
00Fr
t0.
997
0.85
0Fl
t Pro
tect
ed0.
950
0.95
0Sa
td. F
low
(pro
t)18
0536
1035
260
1805
1599
Flt P
erm
itted
0.95
00.
950
Satd
. Flo
w (p
erm
)18
0536
1035
260
1805
1599
Link
Spe
ed (m
ph)
3030
30Li
nk D
ista
nce
(ft)
799
1144
2017
Trav
el T
ime
(s)
18.2
26.0
45.8
Peak
Hou
r Fac
tor
0.85
0.85
0.92
0.92
0.89
0.92
Hea
vy V
ehic
les
(%)
0%0%
2%5%
0%1%
Adj.
Flow
(vph
)19
453
110
4023
842
8Sh
ared
Lan
e Tr
affic
(%)
Lane
Gro
up F
low
(vph
)19
453
110
630
842
8En
ter B
lock
ed In
ters
ectio
nN
oN
oN
oN
oN
oN
oLa
ne A
lignm
ent
Left
Left
Left
Rig
htLe
ftR
ight
Med
ian
Wid
th(ft
)12
1212
Link
Offs
et(ft
)0
00
Cro
ssw
alk
Wid
th(ft
)16
1616
Two
way
Lef
t Tur
n La
neH
eadw
ay F
acto
r1.
001.
001.
001.
001.
001.
00Tu
rnin
g Sp
eed
(mph
)15
915
9Si
gn C
ontro
lFr
eeFr
eeSt
op
Inte
rsec
tion
Sum
mar
yAr
ea T
ype:
Oth
erC
ontro
l Typ
e: U
nsig
naliz
edIn
ters
ectio
n C
apac
ity U
tiliz
atio
n 58
.2%
ICU
Lev
el o
f Ser
vice
BAn
alys
is P
erio
d (m
in) 1
5
HC
M 6
th T
WS
C39
011
Col
gate
Div
inity
TIS
3:
Elm
woo
d A
ve &
S G
oodm
an S
t 20
22 B
ackg
roun
d C
ondi
tions
- AM
Pea
k H
our
05/0
9/20
19Sy
nchr
o 10
Rep
ort
Page
2
Inte
rsec
tion
Int D
elay
, s/v
eh9.
7
Mov
emen
tEB
LEB
TW
BTW
BRSB
LSB
RLa
ne C
onfig
urat
ions
Traf
fic V
ol, v
eh/h
165
451
957
217
394
Futu
re V
ol, v
eh/h
165
451
957
217
394
Con
flict
ing
Peds
, #/h
r0
00
00
0Si
gn C
ontro
l Fr
eeFr
eeFr
eeFr
eeSt
opSt
opR
T C
hann
eliz
ed-
Non
e-
Non
e-
Non
eSt
orag
e Le
ngth
200
--
-0
100
Veh
in M
edia
n St
orag
e, #
-0
0-
0-
Gra
de, %
-0
0-
0-
Peak
Hou
r Fac
tor
8585
9292
8992
Hea
vy V
ehic
les,
%0
02
50
1M
vmt F
low
194
531
1040
238
428
Maj
or/M
inor
Maj
or1
Maj
or2
Min
or2
Con
flict
ing
Flow
All
1063
0-
017
0653
2
Sta
ge 1
--
--
1052
-
Sta
ge 2
--
--
654
-C
ritic
al H
dwy
4.1
--
-6.
86.
92C
ritic
al H
dwy
Stg
1-
--
-5.
8-
Crit
ical
Hdw
y St
g 2
--
--
5.8
-Fo
llow
-up
Hdw
y2.
2-
--
3.5
3.31
Pot C
ap-1
Man
euve
r66
3-
--
8449
5
Sta
ge 1
--
--
302
-
Sta
ge 2
--
--
485
-Pl
atoo
n bl
ocke
d, %
--
-M
ov C
ap-1
Man
euve
r66
3-
--
5949
5M
ov C
ap-2
Man
euve
r-
--
-59
-
Sta
ge 1
--
--
214
-
Sta
ge 2
--
--
485
- Ap
proa
chEB
WB
SBH
CM
Con
trol D
elay
, s3.
40
43.8
HC
M L
OS
E M
inor
Lan
e/M
ajor
Mvm
tEB
LEB
TW
BTW
BRSB
Ln1
SBLn
2C
apac
ity (v
eh/h
)66
3-
--
5949
5H
CM
Lan
e V/
C R
atio
0.29
3-
--
0.13
30.
865
HC
M C
ontro
l Del
ay (s
)12
.7-
--
75.2
43.2
HC
M L
ane
LOS
B-
--
FE
HC
M 9
5th
%til
e Q
(veh
)1.
2-
--
0.4
9.2

Lane
s, V
olum
es, T
imin
gs39
011
Col
gate
Div
inity
TIS
4:
S G
oodm
an S
t &
Hig
hlan
d A
ve20
22 B
ackg
roun
d C
ondi
tions
- AM
Pea
k H
our
05/0
9/20
19Sy
nchr
o 10
Rep
ort
Page
3
Lane
Gro
upEB
LEB
TEB
RW
BLW
BTW
BRN
BLN
BTN
BRSB
LSB
TSB
RLa
ne C
onfig
urat
ions
Traf
fic V
olum
e (v
ph)
4076
122
263
668
186
730
389
188
Futu
re V
olum
e (v
ph)
4076
122
263
668
186
730
389
188
Idea
l Flo
w (v
phpl
)19
0019
0019
0019
0019
0019
0019
0019
0019
0019
0019
0019
00St
orag
e Le
ngth
(ft)
750
750
750
750
Stor
age
Lane
s0
00
00
00
0Ta
per L
engt
h (ft
)25
2525
25La
ne U
til. F
acto
r1.
001.
001.
001.
001.
001.
001.
001.
001.
001.
001.
001.
00Fr
t0.
999
0.97
50.
996
0.95
8Fl
t Pro
tect
ed0.
983
0.99
70.
998
0.99
8Sa
td. F
low
(pro
t)0
1866
00
1847
00
1889
00
1817
0Fl
t Per
mitt
ed0.
784
0.97
70.
971
0.97
7Sa
td. F
low
(per
m)
014
880
018
100
018
380
017
780
Rig
ht T
urn
on R
edYe
sYe
sYe
sYe
sSa
td. F
low
(RTO
R)
121
341
Link
Spe
ed (m
ph)
3030
3030
Link
Dis
tanc
e (ft
)12
9068
120
1775
8Tr
avel
Tim
e (s
)29
.315
.545
.817
.2Pe
ak H
our F
acto
r0.
840.
840.
840.
790.
790.
790.
830.
830.
830.
820.
820.
82H
eavy
Veh
icle
s (%
)0%
0%0%
0%0%
0%0%
0%0%
0%0%
0%Ad
j. Fl
ow (v
ph)
4890
128
333
8410
224
837
474
229
Shar
ed L
ane
Traf
fic (%
)La
ne G
roup
Flo
w (v
ph)
013
90
044
50
024
20
074
00
Ente
r Blo
cked
Inte
rsec
tion
No
No
No
No
No
No
No
No
No
No
No
No
Lane
Alig
nmen
tLe
ftLe
ftR
ight
Left
Left
Rig
htLe
ftLe
ftR
ight
Left
Left
Rig
htM
edia
n W
idth
(ft)
00
00
Link
Offs
et(ft
)0
00
0C
ross
wal
k W
idth
(ft)
1616
1616
Two
way
Lef
t Tur
n La
neH
eadw
ay F
acto
r1.
001.
001.
001.
001.
001.
001.
001.
001.
001.
001.
001.
00Tu
rnin
g Sp
eed
(mph
)15
915
915
915
9N
umbe
r of D
etec
tors
1
21
21
21
2D
etec
tor T
empl
ate
Left
Thru
Left
Thru
Left
Thru
Left
Thru
Lead
ing
Det
ecto
r (ft)
2010
020
100
2010
020
100
Trai
ling
Det
ecto
r (ft)
00
00
00
00
Det
ecto
r 1 P
ositi
on(ft
)0
00
00
00
0D
etec
tor 1
Siz
e(ft)
206
206
206
206
Det
ecto
r 1 T
ype
Cl+
ExC
l+Ex
Cl+
ExC
l+Ex
Cl+
ExC
l+Ex
Cl+
ExC
l+Ex
Det
ecto
r 1 C
hann
elD
etec
tor 1
Ext
end
(s)
0.0
0.0
0.0
0.0
0.0
0.0
0.0
0.0
Det
ecto
r 1 Q
ueue
(s)
0.0
0.0
0.0
0.0
0.0
0.0
0.0
0.0
Det
ecto
r 1 D
elay
(s)
0.0
0.0
0.0
0.0
0.0
0.0
0.0
0.0
Det
ecto
r 2 P
ositi
on(ft
)94
9494
94D
etec
tor 2
Siz
e(ft)
66
66
Det
ecto
r 2 T
ype
Cl+
ExC
l+Ex
Cl+
ExC
l+Ex
Det
ecto
r 2 C
hann
elD
etec
tor 2
Ext
end
(s)
0.0
0.0
0.0
0.0
Turn
Typ
ePe
rmN
APe
rmN
APe
rmN
APe
rmN
APr
otec
ted
Phas
es4
82
6
Lane
s, V
olum
es, T
imin
gs39
011
Col
gate
Div
inity
TIS
4:
S G
oodm
an S
t &
Hig
hlan
d A
ve20
22 B
ackg
roun
d C
ondi
tions
- AM
Pea
k H
our
05/0
9/20
19Sy
nchr
o 10
Rep
ort
Page
4
Lane
Gro
upEB
LEB
TEB
RW
BLW
BTW
BRN
BLN
BTN
BRSB
LSB
TSB
RPe
rmitt
ed P
hase
s4
82
6D
etec
tor P
hase
44
88
22
66
Switc
h Ph
ase
Min
imum
Initi
al (s
)5.
05.
05.
05.
05.
05.
05.
05.
0M
inim
um S
plit
(s)
22.5
22.5
22.5
22.5
22.5
22.5
22.5
22.5
Tota
l Spl
it (s
)35
.035
.035
.035
.035
.035
.035
.035
.0To
tal S
plit
(%)
50.0
%50
.0%
50.0
%50
.0%
50.0
%50
.0%
50.0
%50
.0%
Max
imum
Gre
en (s
)30
.530
.530
.530
.530
.530
.530
.530
.5Ye
llow
Tim
e (s
)3.
53.
53.
53.
53.
53.
53.
53.
5Al
l-Red
Tim
e (s
)1.
01.
01.
01.
01.
01.
01.
01.
0Lo
st T
ime
Adju
st (s
)0.
00.
00.
00.
0To
tal L
ost T
ime
(s)
4.5
4.5
4.5
4.5
Lead
/Lag
Lead
-Lag
Opt
imiz
e?Ve
hicl
e Ex
tens
ion
(s)
3.0
3.0
3.0
3.0
3.0
3.0
3.0
3.0
Rec
all M
ode
Non
eN
one
Non
eN
one
Non
eN
one
Non
eN
one
Wal
k Ti
me
(s)
7.0
7.0
7.0
7.0
7.0
7.0
7.0
7.0
Flas
h D
ont W
alk
(s)
11.0
11.0
11.0
11.0
11.0
11.0
11.0
11.0
Pede
stria
n C
alls
(#/h
r)0
00
00
00
0Ac
t Effc
t Gre
en (s
)19
.019
.027
.827
.8Ac
tuat
ed g
/C R
atio
0.34
0.34
0.50
0.50
v/c
Rat
io0.
280.
710.
270.
82C
ontro
l Del
ay15
.322
.510
.423
.0Q
ueue
Del
ay0.
00.
00.
00.
0To
tal D
elay
15.3
22.5
10.4
23.0
LOS
BC
BC
Appr
oach
Del
ay15
.322
.510
.423
.0Ap
proa
ch L
OS
BC
BC
Inte
rsec
tion
Sum
mar
yAr
ea T
ype:
Oth
erC
ycle
Len
gth:
70
Actu
ated
Cyc
le L
engt
h: 5
6.1
Nat
ural
Cyc
le: 5
5C
ontro
l Typ
e: A
ctua
ted-
Unc
oord
inat
edM
axim
um v
/c R
atio
: 0.8
2In
ters
ectio
n Si
gnal
Del
ay: 2
0.3
Inte
rsec
tion
LOS:
CIn
ters
ectio
n C
apac
ity U
tiliz
atio
n 71
.0%
ICU
Lev
el o
f Ser
vice
CAn
alys
is P
erio
d (m
in) 1
5
Split
s an
d Ph
ases
:
4: S
Goo
dman
St
& H
ighl
and
Ave
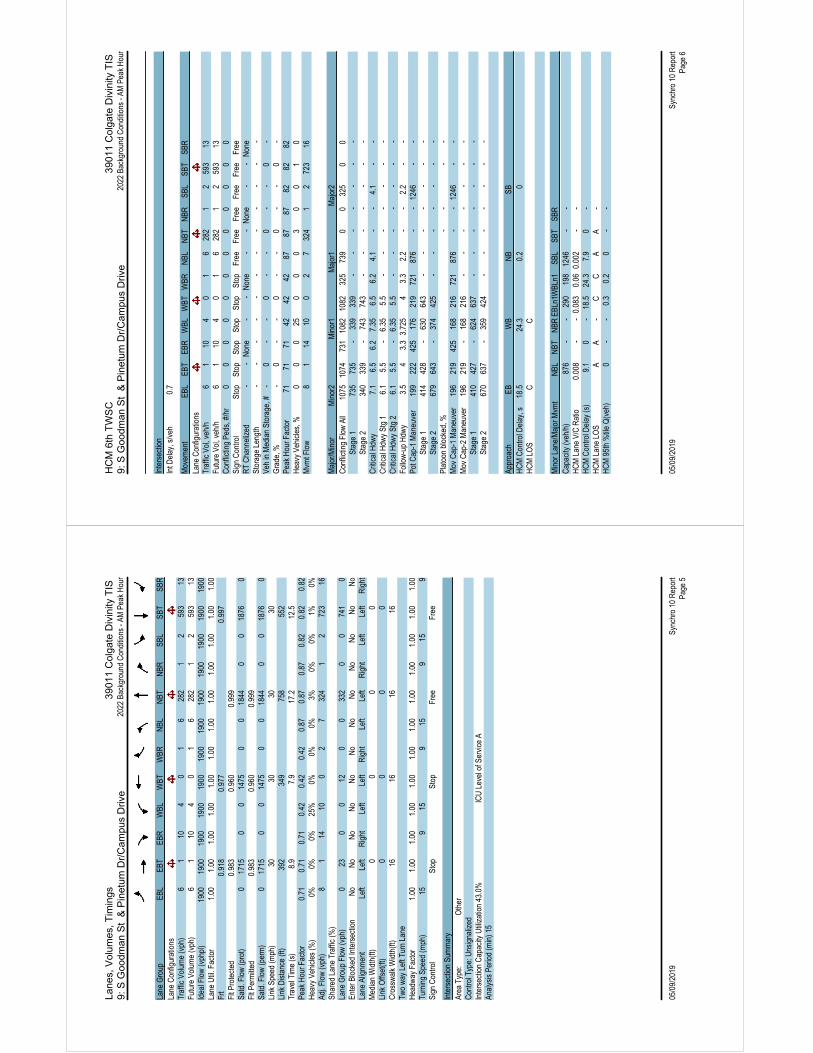
Lane
s, V
olum
es, T
imin
gs39
011
Col
gate
Div
inity
TIS
9:
S G
oodm
an S
t &
Pin
etum
Dr/
Cam
pus
Driv
e20
22 B
ackg
roun
d C
ondi
tions
- AM
Pea
k H
our
05/0
9/20
19Sy
nchr
o 10
Rep
ort
Page
5
Lane
Gro
upEB
LEB
TEB
RW
BLW
BTW
BRN
BLN
BTN
BRSB
LSB
TSB
RLa
ne C
onfig
urat
ions
Traf
fic V
olum
e (v
ph)
61
104
01
628
21
259
313
Futu
re V
olum
e (v
ph)
61
104
01
628
21
259
313
Idea
l Flo
w (v
phpl
)19
0019
0019
0019
0019
0019
0019
0019
0019
0019
0019
0019
00La
ne U
til. F
acto
r1.
001.
001.
001.
001.
001.
001.
001.
001.
001.
001.
001.
00Fr
t0.
918
0.97
70.
997
Flt P
rote
cted
0.98
30.
960
0.99
9Sa
td. F
low
(pro
t)0
1715
00
1475
00
1844
00
1876
0Fl
t Per
mitt
ed0.
983
0.96
00.
999
Satd
. Flo
w (p
erm
)0
1715
00
1475
00
1844
00
1876
0Li
nk S
peed
(mph
)30
3030
30Li
nk D
ista
nce
(ft)
392
349
758
552
Trav
el T
ime
(s)
8.9
7.9
17.2
12.5
Peak
Hou
r Fac
tor
0.71
0.71
0.71
0.42
0.42
0.42
0.87
0.87
0.87
0.82
0.82
0.82
Hea
vy V
ehic
les
(%)
0%0%
0%25
%0%
0%0%
3%0%
0%1%
0%Ad
j. Fl
ow (v
ph)
81
1410
02
732
41
272
316
Shar
ed L
ane
Traf
fic (%
)La
ne G
roup
Flo
w (v
ph)
023
00
120
033
20
074
10
Ente
r Blo
cked
Inte
rsec
tion
No
No
No
No
No
No
No
No
No
No
No
No
Lane
Alig
nmen
tLe
ftLe
ftR
ight
Left
Left
Rig
htLe
ftLe
ftR
ight
Left
Left
Rig
htM
edia
n W
idth
(ft)
00
00
Link
Offs
et(ft
)0
00
0C
ross
wal
k W
idth
(ft)
1616
1616
Two
way
Lef
t Tur
n La
neH
eadw
ay F
acto
r1.
001.
001.
001.
001.
001.
001.
001.
001.
001.
001.
001.
00Tu
rnin
g Sp
eed
(mph
)15
915
915
915
9Si
gn C
ontro
lSt
opSt
opFr
eeFr
ee
Inte
rsec
tion
Sum
mar
yAr
ea T
ype:
Oth
erC
ontro
l Typ
e: U
nsig
naliz
edIn
ters
ectio
n C
apac
ity U
tiliz
atio
n 43
.0%
ICU
Lev
el o
f Ser
vice
AAn
alys
is P
erio
d (m
in) 1
5
HC
M 6
th T
WS
C39
011
Col
gate
Div
inity
TIS
9:
S G
oodm
an S
t &
Pin
etum
Dr/
Cam
pus
Driv
e20
22 B
ackg
roun
d C
ondi
tions
- AM
Pea
k H
our
05/0
9/20
19Sy
nchr
o 10
Rep
ort
Page
6
Inte
rsec
tion
Int D
elay
, s/v
eh0.
7
Mov
emen
tEB
LEB
TEB
RW
BLW
BTW
BRN
BLN
BTN
BRSB
LSB
TSB
RLa
ne C
onfig
urat
ions
Traf
fic V
ol, v
eh/h
61
104
01
628
21
259
313
Futu
re V
ol, v
eh/h
61
104
01
628
21
259
313
Con
flict
ing
Peds
, #/h
r0
00
00
00
00
00
0Si
gn C
ontro
l St
opSt
opSt
opSt
opSt
opSt
opFr
eeFr
eeFr
eeFr
eeFr
eeFr
eeR
T C
hann
eliz
ed-
-N
one
--
Non
e-
-N
one
--
Non
eSt
orag
e Le
ngth
--
--
--
--
--
--
Veh
in M
edia
n St
orag
e, #
-0
--
0-
-0
--
0-
Gra
de, %
-0
--
0-
-0
--
0-
Peak
Hou
r Fac
tor
7171
7142
4242
8787
8782
8282
Hea
vy V
ehic
les,
%0
00
250
00
30
01
0M
vmt F
low
81
1410
02
732
41
272
316
Maj
or/M
inor
Min
or2
Min
or1
Maj
or1
Maj
or2
Con
flict
ing
Flow
All
1075
1074
731
1082
1082
325
739
00
325
00
S
tage
173
573
5-
339
339
--
--
--
-
Sta
ge 2
340
339
-74
374
3-
--
--
--
Crit
ical
Hdw
y7.
16.
56.
27.
356.
56.
24.
1-
-4.
1-
-C
ritic
al H
dwy
Stg
16.
15.
5-
6.35
5.5
--
--
--
-C
ritic
al H
dwy
Stg
26.
15.
5-
6.35
5.5
--
--
--
-Fo
llow
-up
Hdw
y3.
54
3.3
3.72
54
3.3
2.2
--
2.2
--
Pot C
ap-1
Man
euve
r19
922
242
517
621
972
187
6-
-12
46-
-
Sta
ge 1
414
428
-63
064
3-
--
--
--
S
tage
267
964
3-
374
425
--
--
--
-Pl
atoo
n bl
ocke
d, %
--
--
Mov
Cap
-1 M
aneu
ver
196
219
425
168
216
721
876
--
1246
--
Mov
Cap
-2 M
aneu
ver
196
219
-16
821
6-
--
--
--
S
tage
141
042
7-
624
637
--
--
--
-
Sta
ge 2
670
637
-35
942
4-
--
--
--
Appr
oach
EBW
BN
BSB
HC
M C
ontro
l Del
ay, s
18.5
24.3
0.2
0H
CM
LO
SC
C M
inor
Lan
e/M
ajor
Mvm
tN
BLN
BTN
BREB
Ln1W
BLn1
SBL
SBT
SBR
Cap
acity
(veh
/h)
876
--
290
198
1246
--
HC
M L
ane
V/C
Rat
io0.
008
--
0.08
30.
060.
002
--
HC
M C
ontro
l Del
ay (s
)9.
10
-18
.524
.37.
90
-H
CM
Lan
e LO
SA
A-
CC
AA
-H
CM
95t
h %
tile
Q(v
eh)
0-
-0.
30.
20
--
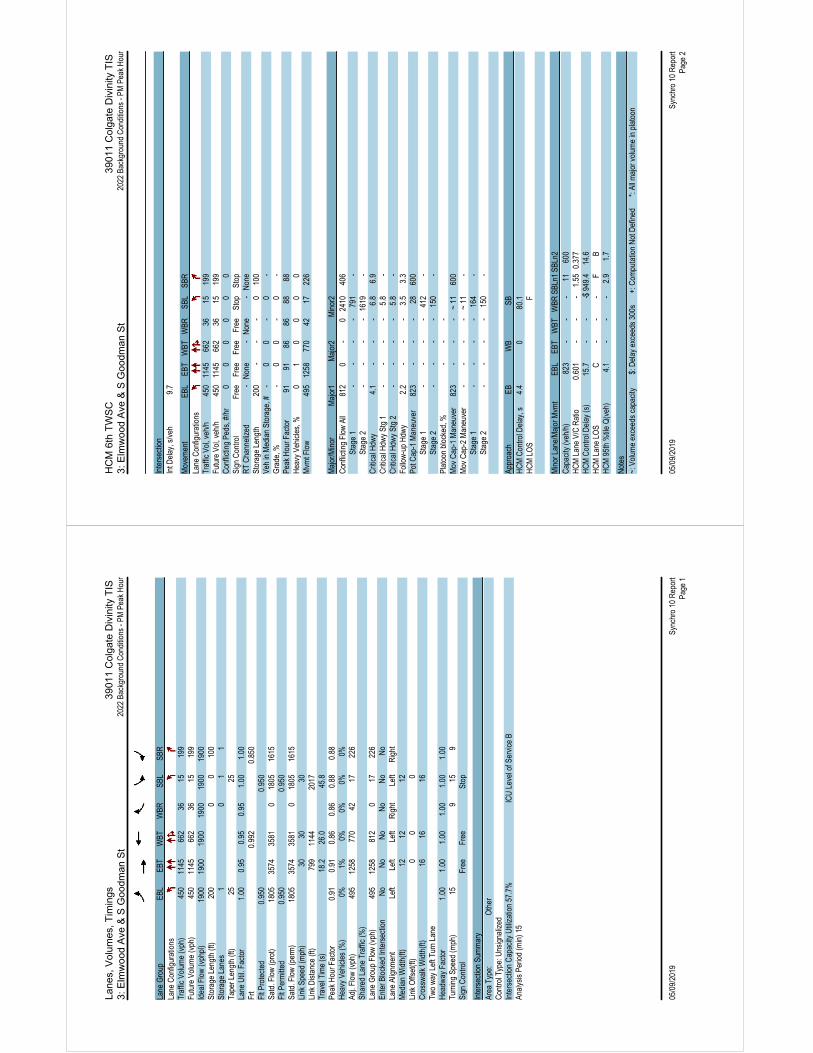
Lane
s, V
olum
es, T
imin
gs39
011
Col
gate
Div
inity
TIS
3:
Elm
woo
d A
ve &
S G
oodm
an S
t 20
22 B
ackg
roun
d C
ondi
tions
- PM
Pea
k H
our
05/0
9/20
19Sy
nchr
o 10
Rep
ort
Page
1
Lane
Gro
upEB
LEB
TW
BTW
BRSB
LSB
RLa
ne C
onfig
urat
ions
Traf
fic V
olum
e (v
ph)
450
1145
662
3615
199
Futu
re V
olum
e (v
ph)
450
1145
662
3615
199
Idea
l Flo
w (v
phpl
)19
0019
0019
0019
0019
0019
00St
orag
e Le
ngth
(ft)
200
00
100
Stor
age
Lane
s1
01
1Ta
per L
engt
h (ft
)25
25La
ne U
til. F
acto
r1.
000.
950.
950.
951.
001.
00Fr
t0.
992
0.85
0Fl
t Pro
tect
ed0.
950
0.95
0Sa
td. F
low
(pro
t)18
0535
7435
810
1805
1615
Flt P
erm
itted
0.95
00.
950
Satd
. Flo
w (p
erm
)18
0535
7435
810
1805
1615
Link
Spe
ed (m
ph)
3030
30Li
nk D
ista
nce
(ft)
799
1144
2017
Trav
el T
ime
(s)
18.2
26.0
45.8
Peak
Hou
r Fac
tor
0.91
0.91
0.86
0.86
0.88
0.88
Hea
vy V
ehic
les
(%)
0%1%
0%0%
0%0%
Adj.
Flow
(vph
)49
512
5877
042
1722
6Sh
ared
Lan
e Tr
affic
(%)
Lane
Gro
up F
low
(vph
)49
512
5881
20
1722
6En
ter B
lock
ed In
ters
ectio
nN
oN
oN
oN
oN
oN
oLa
ne A
lignm
ent
Left
Left
Left
Rig
htLe
ftR
ight
Med
ian
Wid
th(ft
)12
1212
Link
Offs
et(ft
)0
00
Cro
ssw
alk
Wid
th(ft
)16
1616
Two
way
Lef
t Tur
n La
neH
eadw
ay F
acto
r1.
001.
001.
001.
001.
001.
00Tu
rnin
g Sp
eed
(mph
)15
915
9Si
gn C
ontro
lFr
eeFr
eeSt
op
Inte
rsec
tion
Sum
mar
yAr
ea T
ype:
Oth
erC
ontro
l Typ
e: U
nsig
naliz
edIn
ters
ectio
n C
apac
ity U
tiliz
atio
n 57
.7%
ICU
Lev
el o
f Ser
vice
BAn
alys
is P
erio
d (m
in) 1
5
HC
M 6
th T
WS
C39
011
Col
gate
Div
inity
TIS
3:
Elm
woo
d A
ve &
S G
oodm
an S
t 20
22 B
ackg
roun
d C
ondi
tions
- PM
Pea
k H
our
05/0
9/20
19Sy
nchr
o 10
Rep
ort
Page
2
Inte
rsec
tion
Int D
elay
, s/v
eh9.
7
Mov
emen
tEB
LEB
TW
BTW
BRSB
LSB
RLa
ne C
onfig
urat
ions
Traf
fic V
ol, v
eh/h
450
1145
662
3615
199
Futu
re V
ol, v
eh/h
450
1145
662
3615
199
Con
flict
ing
Peds
, #/h
r0
00
00
0Si
gn C
ontro
l Fr
eeFr
eeFr
eeFr
eeSt
opSt
opR
T C
hann
eliz
ed-
Non
e-
Non
e-
Non
eSt
orag
e Le
ngth
200
--
-0
100
Veh
in M
edia
n St
orag
e, #
-0
0-
0-
Gra
de, %
-0
0-
0-
Peak
Hou
r Fac
tor
9191
8686
8888
Hea
vy V
ehic
les,
%0
10
00
0M
vmt F
low
495
1258
770
4217
226
Maj
or/M
inor
Maj
or1
Maj
or2
Min
or2
Con
flict
ing
Flow
All
812
0-
024
1040
6
Sta
ge 1
--
--
791
-
Sta
ge 2
--
--
1619
-C
ritic
al H
dwy
4.1
--
-6.
86.
9C
ritic
al H
dwy
Stg
1-
--
-5.
8-
Crit
ical
Hdw
y St
g 2
--
--
5.8
-Fo
llow
-up
Hdw
y2.
2-
--
3.5
3.3
Pot C
ap-1
Man
euve
r82
3-
--
2860
0
Sta
ge 1
--
--
412
-
Sta
ge 2
--
--
150
-Pl
atoo
n bl
ocke
d, %
--
-M
ov C
ap-1
Man
euve
r82
3-
--
~ 11
600
Mov
Cap
-2 M
aneu
ver
--
--
~ 11
-
Sta
ge 1
--
--
164
-
Sta
ge 2
--
--
150
- Ap
proa
chEB
WB
SBH
CM
Con
trol D
elay
, s4.
40
80.1
HC
M L
OS
F M
inor
Lan
e/M
ajor
Mvm
tEB
LEB
TW
BTW
BRSB
Ln1
SBLn
2C
apac
ity (v
eh/h
)82
3-
--
1160
0H
CM
Lan
e V/
C R
atio
0.60
1-
--
1.55
0.37
7H
CM
Con
trol D
elay
(s)
15.7
--
-$ 9
49.4
14.6
HC
M L
ane
LOS
C-
--
FB
HC
M 9
5th
%til
e Q
(veh
)4.
1-
--
2.9
1.7
Not
es~:
Vol
ume
exce
eds
capa
city
$: D
elay
exc
eeds
300
s
+: C
ompu
tatio
n N
ot D
efin
ed
*:
All m
ajor
vol
ume
in p
lato
on
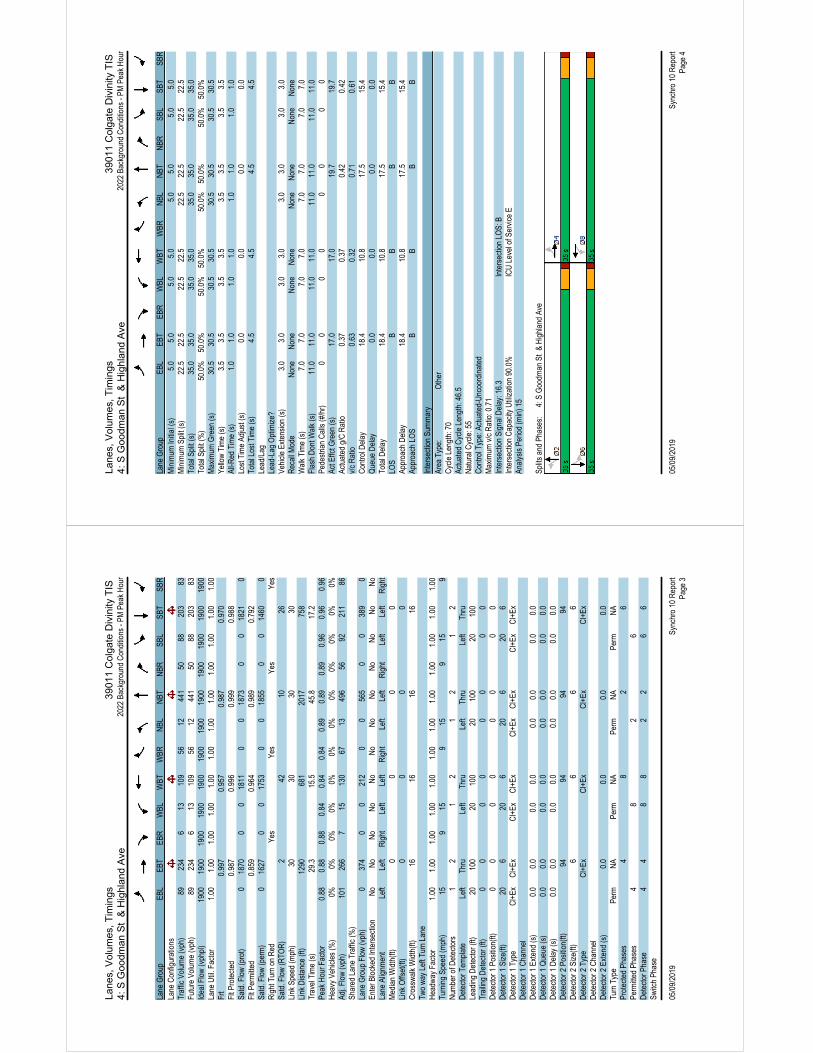
Lane
s, V
olum
es, T
imin
gs39
011
Col
gate
Div
inity
TIS
4:
S G
oodm
an S
t &
Hig
hlan
d A
ve20
22 B
ackg
roun
d C
ondi
tions
- PM
Pea
k H
our
05/0
9/20
19Sy
nchr
o 10
Rep
ort
Page
3
Lane
Gro
upEB
LEB
TEB
RW
BLW
BTW
BRN
BLN
BTN
BRSB
LSB
TSB
RLa
ne C
onfig
urat
ions
Traf
fic V
olum
e (v
ph)
8923
46
1310
956
1244
150
8820
383
Futu
re V
olum
e (v
ph)
8923
46
1310
956
1244
150
8820
383
Idea
l Flo
w (v
phpl
)19
0019
0019
0019
0019
0019
0019
0019
0019
0019
0019
0019
00La
ne U
til. F
acto
r1.
001.
001.
001.
001.
001.
001.
001.
001.
001.
001.
001.
00Fr
t0.
997
0.95
70.
987
0.97
0Fl
t Pro
tect
ed0.
987
0.99
60.
999
0.98
8Sa
td. F
low
(pro
t)0
1870
00
1811
00
1873
00
1821
0Fl
t Per
mitt
ed0.
859
0.96
40.
989
0.79
2Sa
td. F
low
(per
m)
016
270
017
530
018
550
014
600
Rig
ht T
urn
on R
edYe
sYe
sYe
sYe
sSa
td. F
low
(RTO
R)
242
1026
Link
Spe
ed (m
ph)
3030
3030
Link
Dis
tanc
e (ft
)12
9068
120
1775
8Tr
avel
Tim
e (s
)29
.315
.545
.817
.2Pe
ak H
our F
acto
r0.
880.
880.
880.
840.
840.
840.
890.
890.
890.
960.
960.
96H
eavy
Veh
icle
s (%
)0%
0%0%
0%0%
0%0%
0%0%
0%0%
0%Ad
j. Fl
ow (v
ph)
101
266
715
130
6713
496
5692
211
86Sh
ared
Lan
e Tr
affic
(%)
Lane
Gro
up F
low
(vph
)0
374
00
212
00
565
00
389
0En
ter B
lock
ed In
ters
ectio
nN
oN
oN
oN
oN
oN
oN
oN
oN
oN
oN
oN
oLa
ne A
lignm
ent
Left
Left
Rig
htLe
ftLe
ftR
ight
Left
Left
Rig
htLe
ftLe
ftR
ight
Med
ian
Wid
th(ft
)0
00
0Li
nk O
ffset
(ft)
00
00
Cro
ssw
alk
Wid
th(ft
)16
1616
16Tw
o w
ay L
eft T
urn
Lane
Hea
dway
Fac
tor
1.00
1.00
1.00
1.00
1.00
1.00
1.00
1.00
1.00
1.00
1.00
1.00
Turn
ing
Spee
d (m
ph)
159
159
159
159
Num
ber o
f Det
ecto
rs
12
12
12
12
Det
ecto
r Tem
plat
e Le
ftTh
ruLe
ftTh
ruLe
ftTh
ruLe
ftTh
ruLe
adin
g D
etec
tor (
ft)20
100
2010
020
100
2010
0Tr
ailin
g D
etec
tor (
ft)0
00
00
00
0D
etec
tor 1
Pos
ition
(ft)
00
00
00
00
Det
ecto
r 1 S
ize(
ft)20
620
620
620
6D
etec
tor 1
Typ
eC
l+Ex
Cl+
ExC
l+Ex
Cl+
ExC
l+Ex
Cl+
ExC
l+Ex
Cl+
ExD
etec
tor 1
Cha
nnel
Det
ecto
r 1 E
xten
d (s
)0.
00.
00.
00.
00.
00.
00.
00.
0D
etec
tor 1
Que
ue (s
)0.
00.
00.
00.
00.
00.
00.
00.
0D
etec
tor 1
Del
ay (s
)0.
00.
00.
00.
00.
00.
00.
00.
0D
etec
tor 2
Pos
ition
(ft)
9494
9494
Det
ecto
r 2 S
ize(
ft)6
66
6D
etec
tor 2
Typ
eC
l+Ex
Cl+
ExC
l+Ex
Cl+
ExD
etec
tor 2
Cha
nnel
Det
ecto
r 2 E
xten
d (s
)0.
00.
00.
00.
0Tu
rn T
ype
Perm
NA
Perm
NA
Perm
NA
Perm
NA
Prot
ecte
d Ph
ases
48
26
Perm
itted
Pha
ses
48
26
Det
ecto
r Pha
se4
48
82
26
6Sw
itch
Phas
e
Lane
s, V
olum
es, T
imin
gs39
011
Col
gate
Div
inity
TIS
4:
S G
oodm
an S
t &
Hig
hlan
d A
ve20
22 B
ackg
roun
d C
ondi
tions
- PM
Pea
k H
our
05/0
9/20
19Sy
nchr
o 10
Rep
ort
Page
4
Lane
Gro
upEB
LEB
TEB
RW
BLW
BTW
BRN
BLN
BTN
BRSB
LSB
TSB
RM
inim
um In
itial
(s)
5.0
5.0
5.0
5.0
5.0
5.0
5.0
5.0
Min
imum
Spl
it (s
)22
.522
.522
.522
.522
.522
.522
.522
.5To
tal S
plit
(s)
35.0
35.0
35.0
35.0
35.0
35.0
35.0
35.0
Tota
l Spl
it (%
)50
.0%
50.0
%50
.0%
50.0
%50
.0%
50.0
%50
.0%
50.0
%M
axim
um G
reen
(s)
30.5
30.5
30.5
30.5
30.5
30.5
30.5
30.5
Yello
w T
ime
(s)
3.5
3.5
3.5
3.5
3.5
3.5
3.5
3.5
All-R
ed T
ime
(s)
1.0
1.0
1.0
1.0
1.0
1.0
1.0
1.0
Lost
Tim
e Ad
just
(s)
0.0
0.0
0.0
0.0
Tota
l Los
t Tim
e (s
)4.
54.
54.
54.
5Le
ad/L
agLe
ad-L
ag O
ptim
ize?
Vehi
cle
Exte
nsio
n (s
)3.
03.
03.
03.
03.
03.
03.
03.
0R
ecal
l Mod
eN
one
Non
eN
one
Non
eN
one
Non
eN
one
Non
eW
alk
Tim
e (s
)7.
07.
07.
07.
07.
07.
07.
07.
0Fl
ash
Don
t Wal
k (s
)11
.011
.011
.011
.011
.011
.011
.011
.0Pe
dest
rian
Cal
ls (#
/hr)
00
00
00
00
Act E
ffct G
reen
(s)
17.0
17.0
19.7
19.7
Actu
ated
g/C
Rat
io0.
370.
370.
420.
42v/
c R
atio
0.63
0.32
0.71
0.61
Con
trol D
elay
18.4
10.8
17.5
15.4
Que
ue D
elay
0.0
0.0
0.0
0.0
Tota
l Del
ay18
.410
.817
.515
.4LO
SB
BB
BAp
proa
ch D
elay
18.4
10.8
17.5
15.4
Appr
oach
LO
SB
BB
B
Inte
rsec
tion
Sum
mar
yAr
ea T
ype:
Oth
erC
ycle
Len
gth:
70
Actu
ated
Cyc
le L
engt
h: 4
6.5
Nat
ural
Cyc
le: 5
5C
ontro
l Typ
e: A
ctua
ted-
Unc
oord
inat
edM
axim
um v
/c R
atio
: 0.7
1In
ters
ectio
n Si
gnal
Del
ay: 1
6.3
Inte
rsec
tion
LOS:
BIn
ters
ectio
n C
apac
ity U
tiliz
atio
n 90
.0%
ICU
Lev
el o
f Ser
vice
EAn
alys
is P
erio
d (m
in) 1
5
Split
s an
d Ph
ases
:
4: S
Goo
dman
St
& H
ighl
and
Ave

Lane
s, V
olum
es, T
imin
gs39
011
Col
gate
Div
inity
TIS
9:
S G
oodm
an S
t &
Pin
etum
Dr/
Cam
pus
Driv
e20
22 B
ackg
roun
d C
ondi
tions
- PM
Pea
k H
our
05/0
9/20
19Sy
nchr
o 10
Rep
ort
Page
5
Lane
Gro
upEB
LEB
TEB
RW
BLW
BTW
BRN
BLN
BTN
BRSB
LSB
TSB
RLa
ne C
onfig
urat
ions
Traf
fic V
olum
e (v
ph)
201
264
04
2655
37
335
020
Futu
re V
olum
e (v
ph)
201
264
04
2655
37
335
020
Idea
l Flo
w (v
phpl
)19
0019
0019
0019
0019
0019
0019
0019
0019
0019
0019
0019
00La
ne U
til. F
acto
r1.
001.
001.
001.
001.
001.
001.
001.
001.
001.
001.
001.
00Fr
t0.
924
0.93
20.
998
0.99
3Fl
t Pro
tect
ed0.
979
0.97
60.
998
Satd
. Flo
w (p
rot)
017
190
017
110
018
920
018
690
Flt P
erm
itted
0.97
90.
976
0.99
8Sa
td. F
low
(per
m)
017
190
017
110
018
920
018
690
Link
Spe
ed (m
ph)
3030
3030
Link
Dis
tanc
e (ft
)39
234
975
855
2Tr
avel
Tim
e (s
)8.
97.
917
.212
.5Pe
ak H
our F
acto
r0.
800.
800.
800.
500.
500.
500.
910.
910.
910.
950.
950.
95H
eavy
Veh
icle
s (%
)0%
0%0%
0%0%
2%0%
0%0%
0%1%
0%Ad
j. Fl
ow (v
ph)
251
338
08
2960
88
336
821
Shar
ed L
ane
Traf
fic (%
)La
ne G
roup
Flo
w (v
ph)
059
00
160
064
50
039
20
Ente
r Blo
cked
Inte
rsec
tion
No
No
No
No
No
No
No
No
No
No
No
No
Lane
Alig
nmen
tLe
ftLe
ftR
ight
Left
Left
Rig
htLe
ftLe
ftR
ight
Left
Left
Rig
htM
edia
n W
idth
(ft)
00
00
Link
Offs
et(ft
)0
00
0C
ross
wal
k W
idth
(ft)
1616
1616
Two
way
Lef
t Tur
n La
neH
eadw
ay F
acto
r1.
001.
001.
001.
001.
001.
001.
001.
001.
001.
001.
001.
00Tu
rnin
g Sp
eed
(mph
)15
915
915
915
9Si
gn C
ontro
lSt
opSt
opFr
eeFr
ee
Inte
rsec
tion
Sum
mar
yAr
ea T
ype:
Oth
erC
ontro
l Typ
e: U
nsig
naliz
edIn
ters
ectio
n C
apac
ity U
tiliz
atio
n 56
.7%
ICU
Lev
el o
f Ser
vice
BAn
alys
is P
erio
d (m
in) 1
5
HC
M 6
th T
WS
C39
011
Col
gate
Div
inity
TIS
9:
S G
oodm
an S
t &
Pin
etum
Dr/
Cam
pus
Driv
e20
22 B
ackg
roun
d C
ondi
tions
- PM
Pea
k H
our
05/0
9/20
19Sy
nchr
o 10
Rep
ort
Page
6
Inte
rsec
tion
Int D
elay
, s/v
eh1.
5
Mov
emen
tEB
LEB
TEB
RW
BLW
BTW
BRN
BLN
BTN
BRSB
LSB
TSB
RLa
ne C
onfig
urat
ions
Traf
fic V
ol, v
eh/h
201
264
04
2655
37
335
020
Futu
re V
ol, v
eh/h
201
264
04
2655
37
335
020
Con
flict
ing
Peds
, #/h
r0
00
00
00
00
00
0Si
gn C
ontro
l St
opSt
opSt
opSt
opSt
opSt
opFr
eeFr
eeFr
eeFr
eeFr
eeFr
eeR
T C
hann
eliz
ed-
-N
one
--
Non
e-
-N
one
--
Non
eSt
orag
e Le
ngth
--
--
--
--
--
--
Veh
in M
edia
n St
orag
e, #
-0
--
0-
-0
--
0-
Gra
de, %
-0
--
0-
-0
--
0-
Peak
Hou
r Fac
tor
8080
8050
5050
9191
9195
9595
Hea
vy V
ehic
les,
%0
00
00
20
00
01
0M
vmt F
low
251
338
08
2960
88
336
821
Maj
or/M
inor
Min
or2
Min
or1
Maj
or1
Maj
or2
Con
flict
ing
Flow
All
1059
1059
379
1072
1065
612
389
00
616
00
S
tage
138
538
5-
670
670
--
--
--
-
Sta
ge 2
674
674
-40
239
5-
--
--
--
Crit
ical
Hdw
y7.
16.
56.
27.
16.
56.
224.
1-
-4.
1-
-C
ritic
al H
dwy
Stg
16.
15.
5-
6.1
5.5
--
--
--
-C
ritic
al H
dwy
Stg
26.
15.
5-
6.1
5.5
--
--
--
-Fo
llow
-up
Hdw
y3.
54
3.3
3.5
43.
318
2.2
--
2.2
--
Pot C
ap-1
Man
euve
r20
422
667
220
022
449
311
81-
-97
4-
-
Sta
ge 1
642
614
-45
045
9-
--
--
--
S
tage
244
845
7-
629
608
--
--
--
-Pl
atoo
n bl
ocke
d, %
--
--
Mov
Cap
-1 M
aneu
ver
194
217
672
184
215
493
1181
--
974
--
Mov
Cap
-2 M
aneu
ver
194
217
-18
421
5-
--
--
--
S
tage
161
861
2-
433
442
--
--
--
-
Sta
ge 2
424
440
-59
560
6-
--
--
--
Appr
oach
EBW
BN
BSB
HC
M C
ontro
l Del
ay, s
18.7
19.3
0.4
0.1
HC
M L
OS
CC
Min
or L
ane/
Maj
or M
vmt
NBL
NBT
NBR
EBLn
1WBL
n1SB
LSB
TSB
RC
apac
ity (v
eh/h
)11
81-
-32
126
897
4-
-H
CM
Lan
e V/
C R
atio
0.02
4-
-0.
183
0.06
0.00
3-
-H
CM
Con
trol D
elay
(s)
8.1
0-
18.7
19.3
8.7
0-
HC
M L
ane
LOS
AA
-C
CA
A-
HC
M 9
5th
%til
e Q
(veh
)0.
1-
-0.
70.
20
--
A6
Level of Service Calculations: Full Development Conditions
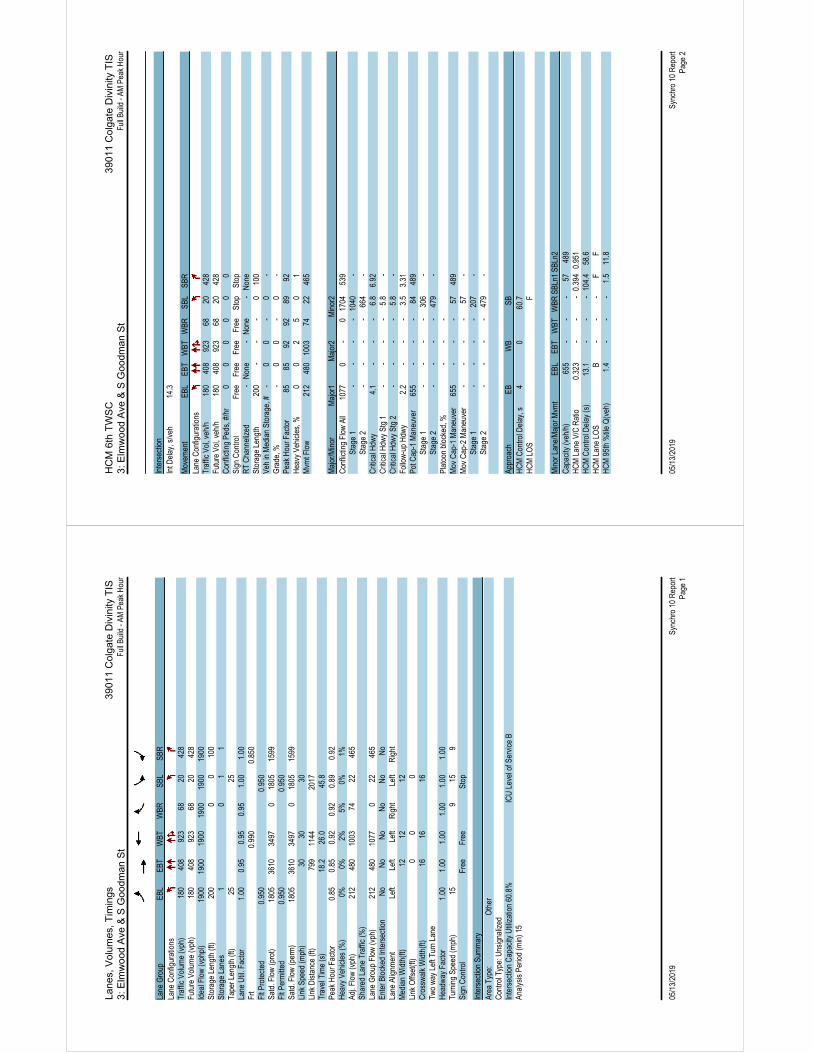
Lane
s, V
olum
es, T
imin
gs39
011
Col
gate
Div
inity
TIS
3:
Elm
woo
d A
ve &
S G
oodm
an S
t Fu
ll Bu
ild -
AM P
eak
Hou
r
05/1
3/20
19Sy
nchr
o 10
Rep
ort
Page
1
Lane
Gro
upEB
LEB
TW
BTW
BRSB
LSB
RLa
ne C
onfig
urat
ions
Traf
fic V
olum
e (v
ph)
180
408
923
6820
428
Futu
re V
olum
e (v
ph)
180
408
923
6820
428
Idea
l Flo
w (v
phpl
)19
0019
0019
0019
0019
0019
00St
orag
e Le
ngth
(ft)
200
00
100
Stor
age
Lane
s1
01
1Ta
per L
engt
h (ft
)25
25La
ne U
til. F
acto
r1.
000.
950.
950.
951.
001.
00Fr
t0.
990
0.85
0Fl
t Pro
tect
ed0.
950
0.95
0Sa
td. F
low
(pro
t)18
0536
1034
970
1805
1599
Flt P
erm
itted
0.95
00.
950
Satd
. Flo
w (p
erm
)18
0536
1034
970
1805
1599
Link
Spe
ed (m
ph)
3030
30Li
nk D
ista
nce
(ft)
799
1144
2017
Trav
el T
ime
(s)
18.2
26.0
45.8
Peak
Hou
r Fac
tor
0.85
0.85
0.92
0.92
0.89
0.92
Hea
vy V
ehic
les
(%)
0%0%
2%5%
0%1%
Adj.
Flow
(vph
)21
248
010
0374
2246
5Sh
ared
Lan
e Tr
affic
(%)
Lane
Gro
up F
low
(vph
)21
248
010
770
2246
5En
ter B
lock
ed In
ters
ectio
nN
oN
oN
oN
oN
oN
oLa
ne A
lignm
ent
Left
Left
Left
Rig
htLe
ftR
ight
Med
ian
Wid
th(ft
)12
1212
Link
Offs
et(ft
)0
00
Cro
ssw
alk
Wid
th(ft
)16
1616
Two
way
Lef
t Tur
n La
neH
eadw
ay F
acto
r1.
001.
001.
001.
001.
001.
00Tu
rnin
g Sp
eed
(mph
)15
915
9Si
gn C
ontro
lFr
eeFr
eeSt
op
Inte
rsec
tion
Sum
mar
yAr
ea T
ype:
Oth
erC
ontro
l Typ
e: U
nsig
naliz
edIn
ters
ectio
n C
apac
ity U
tiliz
atio
n 60
.8%
ICU
Lev
el o
f Ser
vice
BAn
alys
is P
erio
d (m
in) 1
5
HC
M 6
th T
WS
C39
011
Col
gate
Div
inity
TIS
3:
Elm
woo
d A
ve &
S G
oodm
an S
t Fu
ll Bu
ild -
AM P
eak
Hou
r
05/1
3/20
19Sy
nchr
o 10
Rep
ort
Page
2
Inte
rsec
tion
Int D
elay
, s/v
eh14
.3
Mov
emen
tEB
LEB
TW
BTW
BRSB
LSB
RLa
ne C
onfig
urat
ions
Traf
fic V
ol, v
eh/h
180
408
923
6820
428
Futu
re V
ol, v
eh/h
180
408
923
6820
428
Con
flict
ing
Peds
, #/h
r0
00
00
0Si
gn C
ontro
l Fr
eeFr
eeFr
eeFr
eeSt
opSt
opR
T C
hann
eliz
ed-
Non
e-
Non
e-
Non
eSt
orag
e Le
ngth
200
--
-0
100
Veh
in M
edia
n St
orag
e, #
-0
0-
0-
Gra
de, %
-0
0-
0-
Peak
Hou
r Fac
tor
8585
9292
8992
Hea
vy V
ehic
les,
%0
02
50
1M
vmt F
low
212
480
1003
7422
465
Maj
or/M
inor
Maj
or1
Maj
or2
Min
or2
Con
flict
ing
Flow
All
1077
0-
017
0453
9
Sta
ge 1
--
--
1040
-
Sta
ge 2
--
--
664
-C
ritic
al H
dwy
4.1
--
-6.
86.
92C
ritic
al H
dwy
Stg
1-
--
-5.
8-
Crit
ical
Hdw
y St
g 2
--
--
5.8
-Fo
llow
-up
Hdw
y2.
2-
--
3.5
3.31
Pot C
ap-1
Man
euve
r65
5-
--
8448
9
Sta
ge 1
--
--
306
-
Sta
ge 2
--
--
479
-Pl
atoo
n bl
ocke
d, %
--
-M
ov C
ap-1
Man
euve
r65
5-
--
5748
9M
ov C
ap-2
Man
euve
r-
--
-57
-
Sta
ge 1
--
--
207
-
Sta
ge 2
--
--
479
- Ap
proa
chEB
WB
SBH
CM
Con
trol D
elay
, s4
060
.7H
CM
LO
SF
Min
or L
ane/
Maj
or M
vmt
EBL
EBT
WBT
WBR
SBLn
1SB
Ln2
Cap
acity
(veh
/h)
655
--
-57
489
HC
M L
ane
V/C
Rat
io0.
323
--
-0.
394
0.95
1H
CM
Con
trol D
elay
(s)
13.1
--
-10
4.4
58.6
HC
M L
ane
LOS
B-
--
FF
HC
M 9
5th
%til
e Q
(veh
)1.
4-
--
1.5
11.8
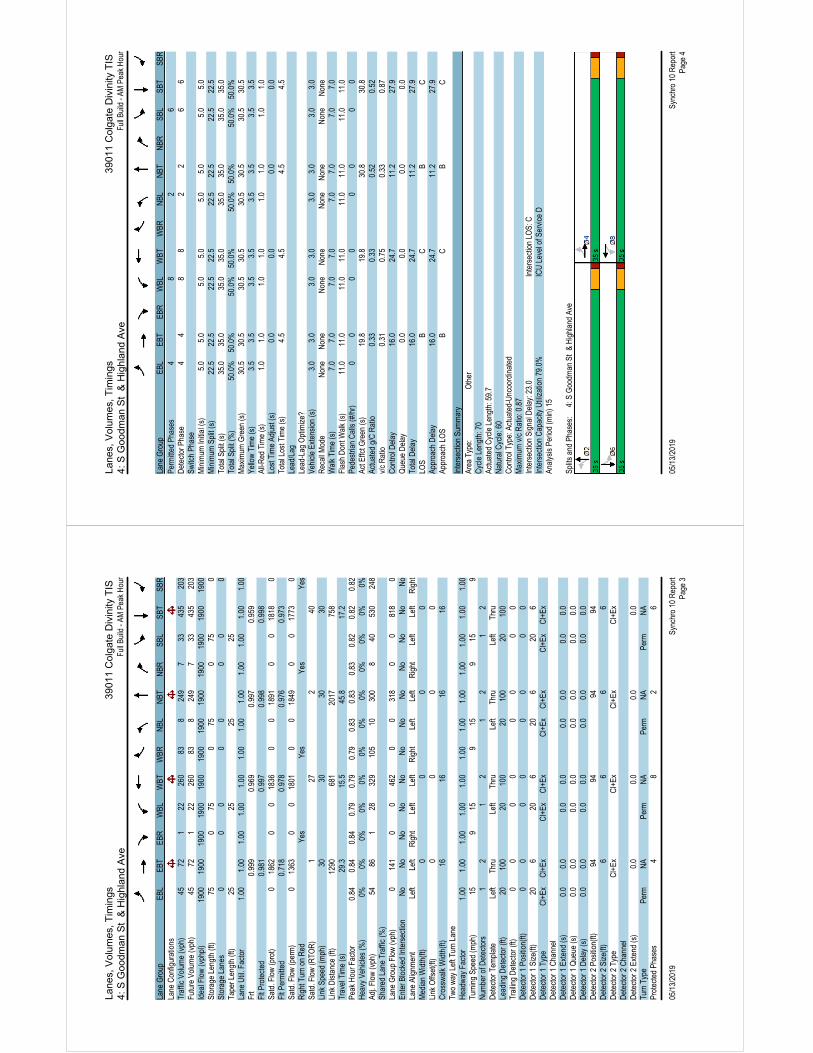
Lane
s, V
olum
es, T
imin
gs39
011
Col
gate
Div
inity
TIS
4:
S G
oodm
an S
t &
Hig
hlan
d A
veFu
ll Bu
ild -
AM P
eak
Hou
r
05/1
3/20
19Sy
nchr
o 10
Rep
ort
Page
3
Lane
Gro
upEB
LEB
TEB
RW
BLW
BTW
BRN
BLN
BTN
BRSB
LSB
TSB
RLa
ne C
onfig
urat
ions
Traf
fic V
olum
e (v
ph)
4572
122
260
838
249
733
435
203
Futu
re V
olum
e (v
ph)
4572
122
260
838
249
733
435
203
Idea
l Flo
w (v
phpl
)19
0019
0019
0019
0019
0019
0019
0019
0019
0019
0019
0019
00St
orag
e Le
ngth
(ft)
750
750
750
750
Stor
age
Lane
s0
00
00
00
0Ta
per L
engt
h (ft
)25
2525
25La
ne U
til. F
acto
r1.
001.
001.
001.
001.
001.
001.
001.
001.
001.
001.
001.
00Fr
t0.
999
0.96
90.
997
0.95
9Fl
t Pro
tect
ed0.
981
0.99
70.
998
0.99
8Sa
td. F
low
(pro
t)0
1862
00
1836
00
1891
00
1818
0Fl
t Per
mitt
ed0.
718
0.97
80.
976
0.97
3Sa
td. F
low
(per
m)
013
630
018
010
018
490
017
730
Rig
ht T
urn
on R
edYe
sYe
sYe
sYe
sSa
td. F
low
(RTO
R)
127
240
Link
Spe
ed (m
ph)
3030
3030
Link
Dis
tanc
e (ft
)12
9068
120
1775
8Tr
avel
Tim
e (s
)29
.315
.545
.817
.2Pe
ak H
our F
acto
r0.
840.
840.
840.
790.
790.
790.
830.
830.
830.
820.
820.
82H
eavy
Veh
icle
s (%
)0%
0%0%
0%0%
0%0%
0%0%
0%0%
0%Ad
j. Fl
ow (v
ph)
5486
128
329
105
1030
08
4053
024
8Sh
ared
Lan
e Tr
affic
(%)
Lane
Gro
up F
low
(vph
)0
141
00
462
00
318
00
818
0En
ter B
lock
ed In
ters
ectio
nN
oN
oN
oN
oN
oN
oN
oN
oN
oN
oN
oN
oLa
ne A
lignm
ent
Left
Left
Rig
htLe
ftLe
ftR
ight
Left
Left
Rig
htLe
ftLe
ftR
ight
Med
ian
Wid
th(ft
)0
00
0Li
nk O
ffset
(ft)
00
00
Cro
ssw
alk
Wid
th(ft
)16
1616
16Tw
o w
ay L
eft T
urn
Lane
Hea
dway
Fac
tor
1.00
1.00
1.00
1.00
1.00
1.00
1.00
1.00
1.00
1.00
1.00
1.00
Turn
ing
Spee
d (m
ph)
159
159
159
159
Num
ber o
f Det
ecto
rs
12
12
12
12
Det
ecto
r Tem
plat
e Le
ftTh
ruLe
ftTh
ruLe
ftTh
ruLe
ftTh
ruLe
adin
g D
etec
tor (
ft)20
100
2010
020
100
2010
0Tr
ailin
g D
etec
tor (
ft)0
00
00
00
0D
etec
tor 1
Pos
ition
(ft)
00
00
00
00
Det
ecto
r 1 S
ize(
ft)20
620
620
620
6D
etec
tor 1
Typ
eC
l+Ex
Cl+
ExC
l+Ex
Cl+
ExC
l+Ex
Cl+
ExC
l+Ex
Cl+
ExD
etec
tor 1
Cha
nnel
Det
ecto
r 1 E
xten
d (s
)0.
00.
00.
00.
00.
00.
00.
00.
0D
etec
tor 1
Que
ue (s
)0.
00.
00.
00.
00.
00.
00.
00.
0D
etec
tor 1
Del
ay (s
)0.
00.
00.
00.
00.
00.
00.
00.
0D
etec
tor 2
Pos
ition
(ft)
9494
9494
Det
ecto
r 2 S
ize(
ft)6
66
6D
etec
tor 2
Typ
eC
l+Ex
Cl+
ExC
l+Ex
Cl+
ExD
etec
tor 2
Cha
nnel
Det
ecto
r 2 E
xten
d (s
)0.
00.
00.
00.
0Tu
rn T
ype
Perm
NA
Perm
NA
Perm
NA
Perm
NA
Prot
ecte
d Ph
ases
48
26
Lane
s, V
olum
es, T
imin
gs39
011
Col
gate
Div
inity
TIS
4:
S G
oodm
an S
t &
Hig
hlan
d A
veFu
ll Bu
ild -
AM P
eak
Hou
r
05/1
3/20
19Sy
nchr
o 10
Rep
ort
Page
4
Lane
Gro
upEB
LEB
TEB
RW
BLW
BTW
BRN
BLN
BTN
BRSB
LSB
TSB
RPe
rmitt
ed P
hase
s4
82
6D
etec
tor P
hase
44
88
22
66
Switc
h Ph
ase
Min
imum
Initi
al (s
)5.
05.
05.
05.
05.
05.
05.
05.
0M
inim
um S
plit
(s)
22.5
22.5
22.5
22.5
22.5
22.5
22.5
22.5
Tota
l Spl
it (s
)35
.035
.035
.035
.035
.035
.035
.035
.0To
tal S
plit
(%)
50.0
%50
.0%
50.0
%50
.0%
50.0
%50
.0%
50.0
%50
.0%
Max
imum
Gre
en (s
)30
.530
.530
.530
.530
.530
.530
.530
.5Ye
llow
Tim
e (s
)3.
53.
53.
53.
53.
53.
53.
53.
5Al
l-Red
Tim
e (s
)1.
01.
01.
01.
01.
01.
01.
01.
0Lo
st T
ime
Adju
st (s
)0.
00.
00.
00.
0To
tal L
ost T
ime
(s)
4.5
4.5
4.5
4.5
Lead
/Lag
Lead
-Lag
Opt
imiz
e?Ve
hicl
e Ex
tens
ion
(s)
3.0
3.0
3.0
3.0
3.0
3.0
3.0
3.0
Rec
all M
ode
Non
eN
one
Non
eN
one
Non
eN
one
Non
eN
one
Wal
k Ti
me
(s)
7.0
7.0
7.0
7.0
7.0
7.0
7.0
7.0
Flas
h D
ont W
alk
(s)
11.0
11.0
11.0
11.0
11.0
11.0
11.0
11.0
Pede
stria
n C
alls
(#/h
r)0
00
00
00
0Ac
t Effc
t Gre
en (s
)19
.819
.830
.830
.8Ac
tuat
ed g
/C R
atio
0.33
0.33
0.52
0.52
v/c
Rat
io0.
310.
750.
330.
87C
ontro
l Del
ay16
.024
.711
.227
.9Q
ueue
Del
ay0.
00.
00.
00.
0To
tal D
elay
16.0
24.7
11.2
27.9
LOS
BC
BC
Appr
oach
Del
ay16
.024
.711
.227
.9Ap
proa
ch L
OS
BC
BC
Inte
rsec
tion
Sum
mar
yAr
ea T
ype:
Oth
erC
ycle
Len
gth:
70
Actu
ated
Cyc
le L
engt
h: 5
9.7
Nat
ural
Cyc
le: 6
0C
ontro
l Typ
e: A
ctua
ted-
Unc
oord
inat
edM
axim
um v
/c R
atio
: 0.8
7In
ters
ectio
n Si
gnal
Del
ay: 2
3.0
Inte
rsec
tion
LOS:
CIn
ters
ectio
n C
apac
ity U
tiliz
atio
n 79
.0%
ICU
Lev
el o
f Ser
vice
DAn
alys
is P
erio
d (m
in) 1
5
Split
s an
d Ph
ases
:
4: S
Goo
dman
St
& H
ighl
and
Ave
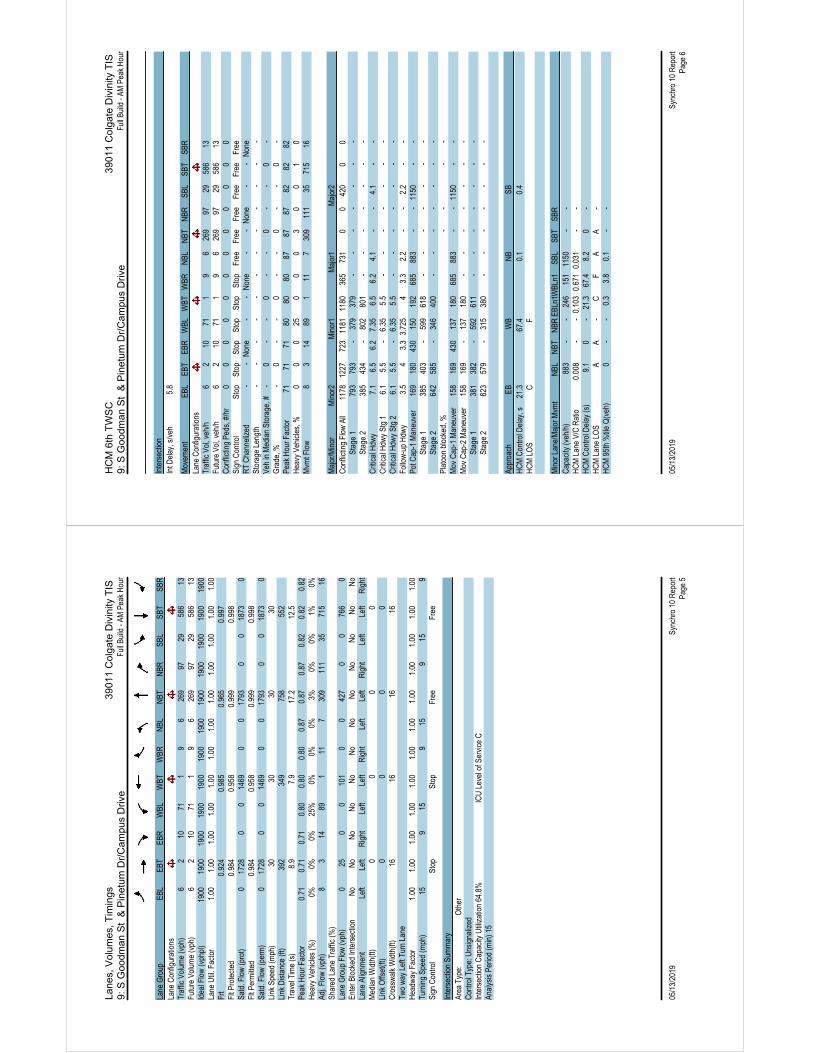
Lane
s, V
olum
es, T
imin
gs39
011
Col
gate
Div
inity
TIS
9:
S G
oodm
an S
t &
Pin
etum
Dr/
Cam
pus
Driv
eFu
ll Bu
ild -
AM P
eak
Hou
r
05/1
3/20
19Sy
nchr
o 10
Rep
ort
Page
5
Lane
Gro
upEB
LEB
TEB
RW
BLW
BTW
BRN
BLN
BTN
BRSB
LSB
TSB
RLa
ne C
onfig
urat
ions
Traf
fic V
olum
e (v
ph)
62
1071
19
626
997
2958
613
Futu
re V
olum
e (v
ph)
62
1071
19
626
997
2958
613
Idea
l Flo
w (v
phpl
)19
0019
0019
0019
0019
0019
0019
0019
0019
0019
0019
0019
00La
ne U
til. F
acto
r1.
001.
001.
001.
001.
001.
001.
001.
001.
001.
001.
001.
00Fr
t0.
924
0.98
50.
965
0.99
7Fl
t Pro
tect
ed0.
984
0.95
80.
999
0.99
8Sa
td. F
low
(pro
t)0
1728
00
1469
00
1793
00
1873
0Fl
t Per
mitt
ed0.
984
0.95
80.
999
0.99
8Sa
td. F
low
(per
m)
017
280
014
690
017
930
018
730
Link
Spe
ed (m
ph)
3030
3030
Link
Dis
tanc
e (ft
)39
234
975
855
2Tr
avel
Tim
e (s
)8.
97.
917
.212
.5Pe
ak H
our F
acto
r0.
710.
710.
710.
800.
800.
800.
870.
870.
870.
820.
820.
82H
eavy
Veh
icle
s (%
)0%
0%0%
25%
0%0%
0%3%
0%0%
1%0%
Adj.
Flow
(vph
)8
314
891
117
309
111
3571
516
Shar
ed L
ane
Traf
fic (%
)La
ne G
roup
Flo
w (v
ph)
025
00
101
00
427
00
766
0En
ter B
lock
ed In
ters
ectio
nN
oN
oN
oN
oN
oN
oN
oN
oN
oN
oN
oN
oLa
ne A
lignm
ent
Left
Left
Rig
htLe
ftLe
ftR
ight
Left
Left
Rig
htLe
ftLe
ftR
ight
Med
ian
Wid
th(ft
)0
00
0Li
nk O
ffset
(ft)
00
00
Cro
ssw
alk
Wid
th(ft
)16
1616
16Tw
o w
ay L
eft T
urn
Lane
Hea
dway
Fac
tor
1.00
1.00
1.00
1.00
1.00
1.00
1.00
1.00
1.00
1.00
1.00
1.00
Turn
ing
Spee
d (m
ph)
159
159
159
159
Sign
Con
trol
Stop
Stop
Free
Free
Inte
rsec
tion
Sum
mar
yAr
ea T
ype:
Oth
erC
ontro
l Typ
e: U
nsig
naliz
edIn
ters
ectio
n C
apac
ity U
tiliz
atio
n 64
.8%
ICU
Lev
el o
f Ser
vice
CAn
alys
is P
erio
d (m
in) 1
5
HC
M 6
th T
WS
C39
011
Col
gate
Div
inity
TIS
9:
S G
oodm
an S
t &
Pin
etum
Dr/
Cam
pus
Driv
eFu
ll Bu
ild -
AM P
eak
Hou
r
05/1
3/20
19Sy
nchr
o 10
Rep
ort
Page
6
Inte
rsec
tion
Int D
elay
, s/v
eh5.
8
Mov
emen
tEB
LEB
TEB
RW
BLW
BTW
BRN
BLN
BTN
BRSB
LSB
TSB
RLa
ne C
onfig
urat
ions
Traf
fic V
ol, v
eh/h
62
1071
19
626
997
2958
613
Futu
re V
ol, v
eh/h
62
1071
19
626
997
2958
613
Con
flict
ing
Peds
, #/h
r0
00
00
00
00
00
0Si
gn C
ontro
l St
opSt
opSt
opSt
opSt
opSt
opFr
eeFr
eeFr
eeFr
eeFr
eeFr
eeR
T C
hann
eliz
ed-
-N
one
--
Non
e-
-N
one
--
Non
eSt
orag
e Le
ngth
--
--
--
--
--
--
Veh
in M
edia
n St
orag
e, #
-0
--
0-
-0
--
0-
Gra
de, %
-0
--
0-
-0
--
0-
Peak
Hou
r Fac
tor
7171
7180
8080
8787
8782
8282
Hea
vy V
ehic
les,
%0
00
250
00
30
01
0M
vmt F
low
83
1489
111
730
911
135
715
16 M
ajor
/Min
orM
inor
2M
inor
1M
ajor
1M
ajor
2C
onfli
ctin
g Fl
ow A
ll11
7812
2772
311
8111
8036
573
10
042
00
0
Sta
ge 1
793
793
-37
937
9-
--
--
--
S
tage
238
543
4-
802
801
--
--
--
-C
ritic
al H
dwy
7.1
6.5
6.2
7.35
6.5
6.2
4.1
--
4.1
--
Crit
ical
Hdw
y St
g 1
6.1
5.5
-6.
355.
5-
--
--
--
Crit
ical
Hdw
y St
g 2
6.1
5.5
-6.
355.
5-
--
--
--
Follo
w-u
p H
dwy
3.5
43.
33.
725
43.
32.
2-
-2.
2-
-Po
t Cap
-1 M
aneu
ver
169
180
430
150
192
685
883
--
1150
--
S
tage
138
540
3-
599
618
--
--
--
-
Sta
ge 2
642
585
-34
640
0-
--
--
--
Plat
oon
bloc
ked,
%-
--
-M
ov C
ap-1
Man
euve
r15
816
943
013
718
068
588
3-
-11
50-
-M
ov C
ap-2
Man
euve
r15
816
9-
137
180
--
--
--
-
Sta
ge 1
381
382
-59
261
1-
--
--
--
S
tage
262
357
9-
315
380
--
--
--
- Ap
proa
chEB
WB
NB
SBH
CM
Con
trol D
elay
, s21
.367
.40.
10.
4H
CM
LO
SC
F M
inor
Lan
e/M
ajor
Mvm
tN
BLN
BTN
BREB
Ln1W
BLn1
SBL
SBT
SBR
Cap
acity
(veh
/h)
883
--
246
151
1150
--
HC
M L
ane
V/C
Rat
io0.
008
--
0.10
30.
671
0.03
1-
-H
CM
Con
trol D
elay
(s)
9.1
0-
21.3
67.4
8.2
0-
HC
M L
ane
LOS
AA
-C
FA
A-
HC
M 9
5th
%til
e Q
(veh
)0
--
0.3
3.8
0.1
--
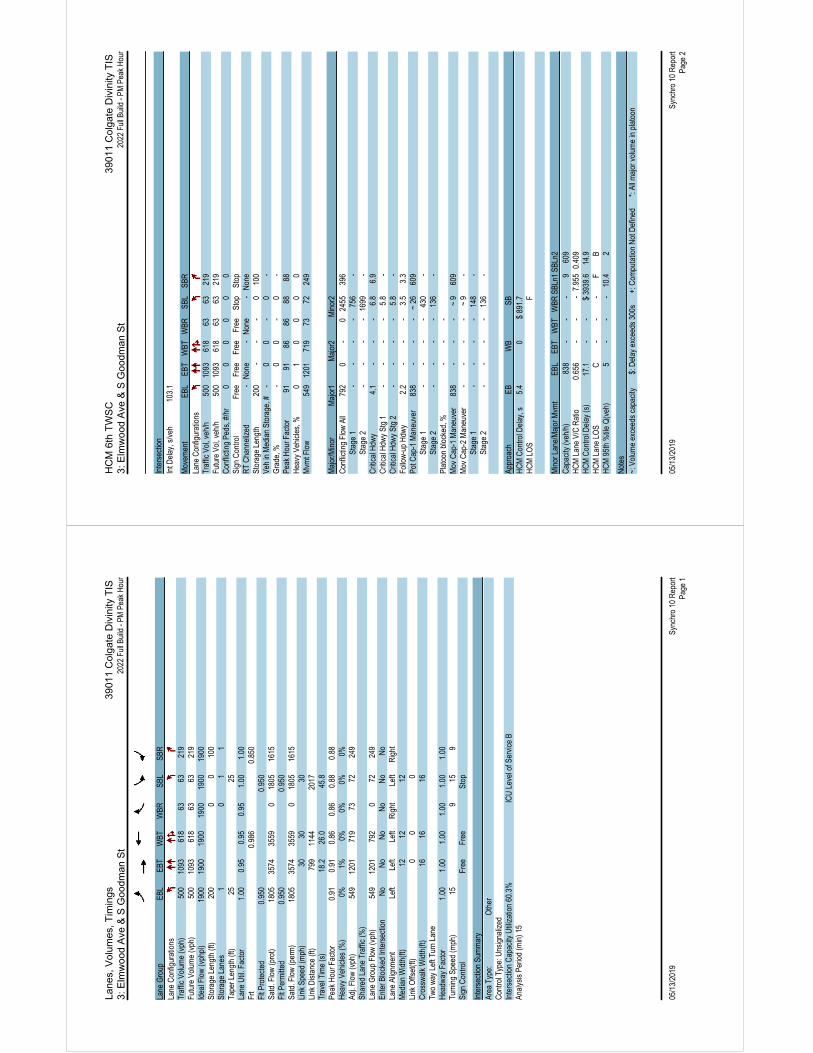
Lane
s, V
olum
es, T
imin
gs39
011
Col
gate
Div
inity
TIS
3:
Elm
woo
d A
ve &
S G
oodm
an S
t 20
22 F
ull B
uild
- PM
Pea
k H
our
05/1
3/20
19Sy
nchr
o 10
Rep
ort
Page
1
Lane
Gro
upEB
LEB
TW
BTW
BRSB
LSB
RLa
ne C
onfig
urat
ions
Traf
fic V
olum
e (v
ph)
500
1093
618
6363
219
Futu
re V
olum
e (v
ph)
500
1093
618
6363
219
Idea
l Flo
w (v
phpl
)19
0019
0019
0019
0019
0019
00St
orag
e Le
ngth
(ft)
200
00
100
Stor
age
Lane
s1
01
1Ta
per L
engt
h (ft
)25
25La
ne U
til. F
acto
r1.
000.
950.
950.
951.
001.
00Fr
t0.
986
0.85
0Fl
t Pro
tect
ed0.
950
0.95
0Sa
td. F
low
(pro
t)18
0535
7435
590
1805
1615
Flt P
erm
itted
0.95
00.
950
Satd
. Flo
w (p
erm
)18
0535
7435
590
1805
1615
Link
Spe
ed (m
ph)
3030
30Li
nk D
ista
nce
(ft)
799
1144
2017
Trav
el T
ime
(s)
18.2
26.0
45.8
Peak
Hou
r Fac
tor
0.91
0.91
0.86
0.86
0.88
0.88
Hea
vy V
ehic
les
(%)
0%1%
0%0%
0%0%
Adj.
Flow
(vph
)54
912
0171
973
7224
9Sh
ared
Lan
e Tr
affic
(%)
Lane
Gro
up F
low
(vph
)54
912
0179
20
7224
9En
ter B
lock
ed In
ters
ectio
nN
oN
oN
oN
oN
oN
oLa
ne A
lignm
ent
Left
Left
Left
Rig
htLe
ftR
ight
Med
ian
Wid
th(ft
)12
1212
Link
Offs
et(ft
)0
00
Cro
ssw
alk
Wid
th(ft
)16
1616
Two
way
Lef
t Tur
n La
neH
eadw
ay F
acto
r1.
001.
001.
001.
001.
001.
00Tu
rnin
g Sp
eed
(mph
)15
915
9Si
gn C
ontro
lFr
eeFr
eeSt
op
Inte
rsec
tion
Sum
mar
yAr
ea T
ype:
Oth
erC
ontro
l Typ
e: U
nsig
naliz
edIn
ters
ectio
n C
apac
ity U
tiliz
atio
n 60
.3%
ICU
Lev
el o
f Ser
vice
BAn
alys
is P
erio
d (m
in) 1
5
HC
M 6
th T
WS
C39
011
Col
gate
Div
inity
TIS
3:
Elm
woo
d A
ve &
S G
oodm
an S
t 20
22 F
ull B
uild
- PM
Pea
k H
our
05/1
3/20
19Sy
nchr
o 10
Rep
ort
Page
2
Inte
rsec
tion
Int D
elay
, s/v
eh10
3.1
Mov
emen
tEB
LEB
TW
BTW
BRSB
LSB
RLa
ne C
onfig
urat
ions
Traf
fic V
ol, v
eh/h
500
1093
618
6363
219
Futu
re V
ol, v
eh/h
500
1093
618
6363
219
Con
flict
ing
Peds
, #/h
r0
00
00
0Si
gn C
ontro
l Fr
eeFr
eeFr
eeFr
eeSt
opSt
opR
T C
hann
eliz
ed-
Non
e-
Non
e-
Non
eSt
orag
e Le
ngth
200
--
-0
100
Veh
in M
edia
n St
orag
e, #
-0
0-
0-
Gra
de, %
-0
0-
0-
Peak
Hou
r Fac
tor
9191
8686
8888
Hea
vy V
ehic
les,
%0
10
00
0M
vmt F
low
549
1201
719
7372
249
Maj
or/M
inor
Maj
or1
Maj
or2
Min
or2
Con
flict
ing
Flow
All
792
0-
024
5539
6
Sta
ge 1
--
--
756
-
Sta
ge 2
--
--
1699
-C
ritic
al H
dwy
4.1
--
-6.
86.
9C
ritic
al H
dwy
Stg
1-
--
-5.
8-
Crit
ical
Hdw
y St
g 2
--
--
5.8
-Fo
llow
-up
Hdw
y2.
2-
--
3.5
3.3
Pot C
ap-1
Man
euve
r83
8-
--
~ 26
609
S
tage
1-
--
-43
0-
S
tage
2-
--
-13
6-
Plat
oon
bloc
ked,
%-
--
Mov
Cap
-1 M
aneu
ver
838
--
-~
960
9M
ov C
ap-2
Man
euve
r-
--
-~
9-
S
tage
1-
--
-14
8-
S
tage
2-
--
-13
6-
Appr
oach
EBW
BSB
HC
M C
ontro
l Del
ay, s
5.4
0$
891.
7H
CM
LO
SF
Min
or L
ane/
Maj
or M
vmt
EBL
EBT
WBT
WBR
SBLn
1SB
Ln2
Cap
acity
(veh
/h)
838
--
-9
609
HC
M L
ane
V/C
Rat
io0.
656
--
-7.
955
0.40
9H
CM
Con
trol D
elay
(s)
17.1
--
-$ 39
39.6
14.9
HC
M L
ane
LOS
C-
--
FB
HC
M 9
5th
%til
e Q
(veh
)5
--
-10
.42
Not
es~:
Vol
ume
exce
eds
capa
city
$: D
elay
exc
eeds
300
s
+: C
ompu
tatio
n N
ot D
efin
ed
*:
All m
ajor
vol
ume
in p
lato
on
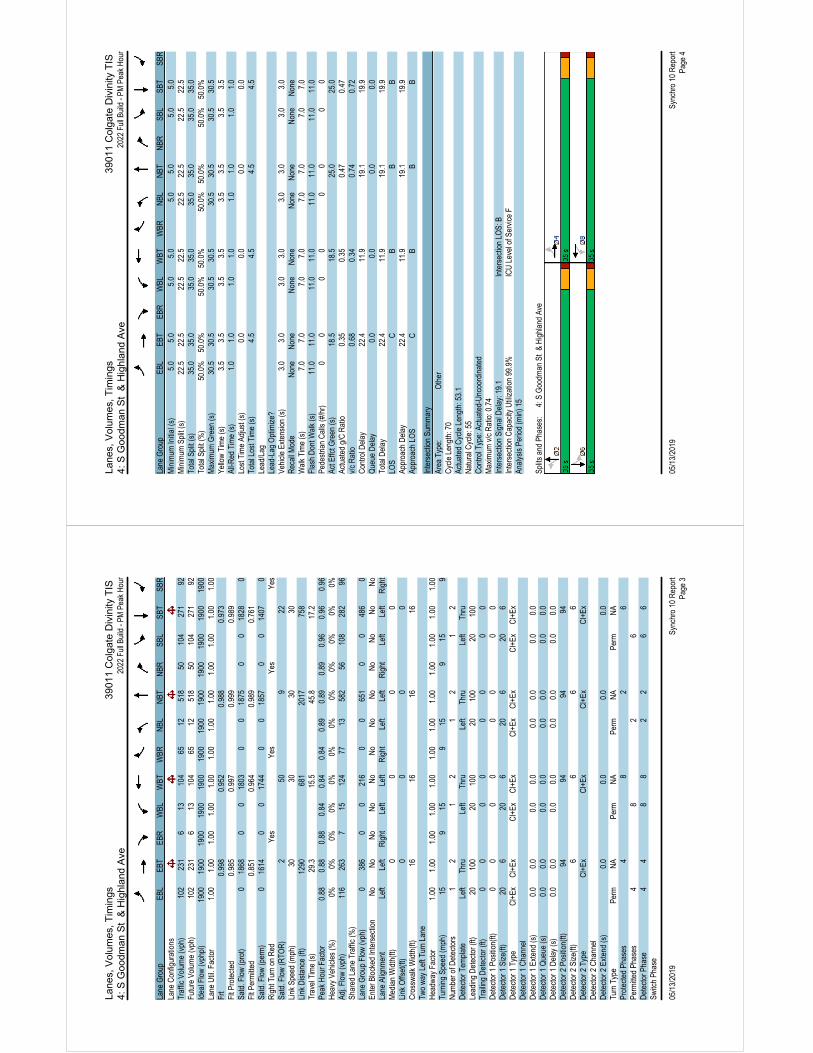
Lane
s, V
olum
es, T
imin
gs39
011
Col
gate
Div
inity
TIS
4:
S G
oodm
an S
t &
Hig
hlan
d A
ve20
22 F
ull B
uild
- PM
Pea
k H
our
05/1
3/20
19Sy
nchr
o 10
Rep
ort
Page
3
Lane
Gro
upEB
LEB
TEB
RW
BLW
BTW
BRN
BLN
BTN
BRSB
LSB
TSB
RLa
ne C
onfig
urat
ions
Traf
fic V
olum
e (v
ph)
102
231
613
104
6512
518
5010
427
192
Futu
re V
olum
e (v
ph)
102
231
613
104
6512
518
5010
427
192
Idea
l Flo
w (v
phpl
)19
0019
0019
0019
0019
0019
0019
0019
0019
0019
0019
0019
00La
ne U
til. F
acto
r1.
001.
001.
001.
001.
001.
001.
001.
001.
001.
001.
001.
00Fr
t0.
998
0.95
20.
988
0.97
3Fl
t Pro
tect
ed0.
985
0.99
70.
999
0.98
9Sa
td. F
low
(pro
t)0
1868
00
1803
00
1875
00
1828
0Fl
t Per
mitt
ed0.
851
0.96
40.
989
0.76
1Sa
td. F
low
(per
m)
016
140
017
440
018
570
014
070
Rig
ht T
urn
on R
edYe
sYe
sYe
sYe
sSa
td. F
low
(RTO
R)
250
922
Link
Spe
ed (m
ph)
3030
3030
Link
Dis
tanc
e (ft
)12
9068
120
1775
8Tr
avel
Tim
e (s
)29
.315
.545
.817
.2Pe
ak H
our F
acto
r0.
880.
880.
880.
840.
840.
840.
890.
890.
890.
960.
960.
96H
eavy
Veh
icle
s (%
)0%
0%0%
0%0%
0%0%
0%0%
0%0%
0%Ad
j. Fl
ow (v
ph)
116
263
715
124
7713
582
5610
828
296
Shar
ed L
ane
Traf
fic (%
)La
ne G
roup
Flo
w (v
ph)
038
60
021
60
065
10
048
60
Ente
r Blo
cked
Inte
rsec
tion
No
No
No
No
No
No
No
No
No
No
No
No
Lane
Alig
nmen
tLe
ftLe
ftR
ight
Left
Left
Rig
htLe
ftLe
ftR
ight
Left
Left
Rig
htM
edia
n W
idth
(ft)
00
00
Link
Offs
et(ft
)0
00
0C
ross
wal
k W
idth
(ft)
1616
1616
Two
way
Lef
t Tur
n La
neH
eadw
ay F
acto
r1.
001.
001.
001.
001.
001.
001.
001.
001.
001.
001.
001.
00Tu
rnin
g Sp
eed
(mph
)15
915
915
915
9N
umbe
r of D
etec
tors
1
21
21
21
2D
etec
tor T
empl
ate
Left
Thru
Left
Thru
Left
Thru
Left
Thru
Lead
ing
Det
ecto
r (ft)
2010
020
100
2010
020
100
Trai
ling
Det
ecto
r (ft)
00
00
00
00
Det
ecto
r 1 P
ositi
on(ft
)0
00
00
00
0D
etec
tor 1
Siz
e(ft)
206
206
206
206
Det
ecto
r 1 T
ype
Cl+
ExC
l+Ex
Cl+
ExC
l+Ex
Cl+
ExC
l+Ex
Cl+
ExC
l+Ex
Det
ecto
r 1 C
hann
elD
etec
tor 1
Ext
end
(s)
0.0
0.0
0.0
0.0
0.0
0.0
0.0
0.0
Det
ecto
r 1 Q
ueue
(s)
0.0
0.0
0.0
0.0
0.0
0.0
0.0
0.0
Det
ecto
r 1 D
elay
(s)
0.0
0.0
0.0
0.0
0.0
0.0
0.0
0.0
Det
ecto
r 2 P
ositi
on(ft
)94
9494
94D
etec
tor 2
Siz
e(ft)
66
66
Det
ecto
r 2 T
ype
Cl+
ExC
l+Ex
Cl+
ExC
l+Ex
Det
ecto
r 2 C
hann
elD
etec
tor 2
Ext
end
(s)
0.0
0.0
0.0
0.0
Turn
Typ
ePe
rmN
APe
rmN
APe
rmN
APe
rmN
APr
otec
ted
Phas
es4
82
6Pe
rmitt
ed P
hase
s4
82
6D
etec
tor P
hase
44
88
22
66
Switc
h Ph
ase
Lane
s, V
olum
es, T
imin
gs39
011
Col
gate
Div
inity
TIS
4:
S G
oodm
an S
t &
Hig
hlan
d A
ve20
22 F
ull B
uild
- PM
Pea
k H
our
05/1
3/20
19Sy
nchr
o 10
Rep
ort
Page
4
Lane
Gro
upEB
LEB
TEB
RW
BLW
BTW
BRN
BLN
BTN
BRSB
LSB
TSB
RM
inim
um In
itial
(s)
5.0
5.0
5.0
5.0
5.0
5.0
5.0
5.0
Min
imum
Spl
it (s
)22
.522
.522
.522
.522
.522
.522
.522
.5To
tal S
plit
(s)
35.0
35.0
35.0
35.0
35.0
35.0
35.0
35.0
Tota
l Spl
it (%
)50
.0%
50.0
%50
.0%
50.0
%50
.0%
50.0
%50
.0%
50.0
%M
axim
um G
reen
(s)
30.5
30.5
30.5
30.5
30.5
30.5
30.5
30.5
Yello
w T
ime
(s)
3.5
3.5
3.5
3.5
3.5
3.5
3.5
3.5
All-R
ed T
ime
(s)
1.0
1.0
1.0
1.0
1.0
1.0
1.0
1.0
Lost
Tim
e Ad
just
(s)
0.0
0.0
0.0
0.0
Tota
l Los
t Tim
e (s
)4.
54.
54.
54.
5Le
ad/L
agLe
ad-L
ag O
ptim
ize?
Vehi
cle
Exte
nsio
n (s
)3.
03.
03.
03.
03.
03.
03.
03.
0R
ecal
l Mod
eN
one
Non
eN
one
Non
eN
one
Non
eN
one
Non
eW
alk
Tim
e (s
)7.
07.
07.
07.
07.
07.
07.
07.
0Fl
ash
Don
t Wal
k (s
)11
.011
.011
.011
.011
.011
.011
.011
.0Pe
dest
rian
Cal
ls (#
/hr)
00
00
00
00
Act E
ffct G
reen
(s)
18.5
18.5
25.0
25.0
Actu
ated
g/C
Rat
io0.
350.
350.
470.
47v/
c R
atio
0.68
0.34
0.74
0.72
Con
trol D
elay
22.4
11.9
19.1
19.9
Que
ue D
elay
0.0
0.0
0.0
0.0
Tota
l Del
ay22
.411
.919
.119
.9LO
SC
BB
BAp
proa
ch D
elay
22.4
11.9
19.1
19.9
Appr
oach
LO
SC
BB
B
Inte
rsec
tion
Sum
mar
yAr
ea T
ype:
Oth
erC
ycle
Len
gth:
70
Actu
ated
Cyc
le L
engt
h: 5
3.1
Nat
ural
Cyc
le: 5
5C
ontro
l Typ
e: A
ctua
ted-
Unc
oord
inat
edM
axim
um v
/c R
atio
: 0.7
4In
ters
ectio
n Si
gnal
Del
ay: 1
9.1
Inte
rsec
tion
LOS:
BIn
ters
ectio
n C
apac
ity U
tiliz
atio
n 99
.9%
ICU
Lev
el o
f Ser
vice
FAn
alys
is P
erio
d (m
in) 1
5
Split
s an
d Ph
ases
:
4: S
Goo
dman
St
& H
ighl
and
Ave
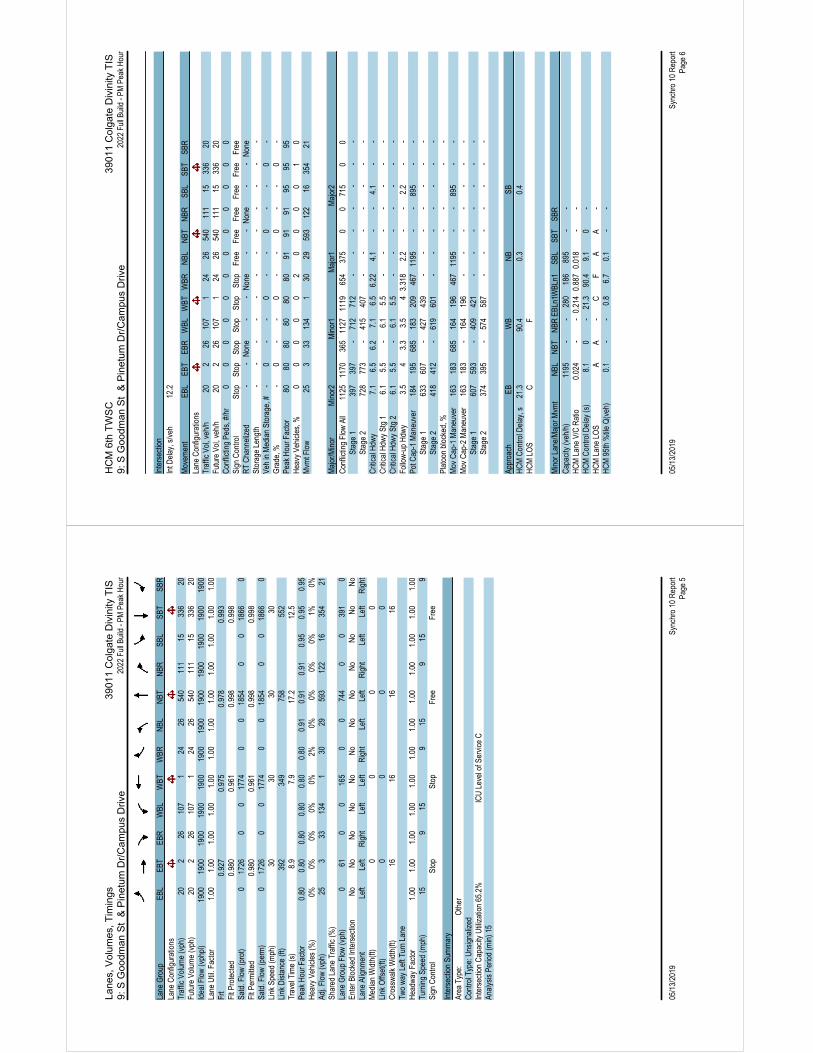
Lane
s, V
olum
es, T
imin
gs39
011
Col
gate
Div
inity
TIS
9:
S G
oodm
an S
t &
Pin
etum
Dr/
Cam
pus
Driv
e20
22 F
ull B
uild
- PM
Pea
k H
our
05/1
3/20
19Sy
nchr
o 10
Rep
ort
Page
5
Lane
Gro
upEB
LEB
TEB
RW
BLW
BTW
BRN
BLN
BTN
BRSB
LSB
TSB
RLa
ne C
onfig
urat
ions
Traf
fic V
olum
e (v
ph)
202
2610
71
2426
540
111
1533
620
Futu
re V
olum
e (v
ph)
202
2610
71
2426
540
111
1533
620
Idea
l Flo
w (v
phpl
)19
0019
0019
0019
0019
0019
0019
0019
0019
0019
0019
0019
00La
ne U
til. F
acto
r1.
001.
001.
001.
001.
001.
001.
001.
001.
001.
001.
001.
00Fr
t0.
927
0.97
50.
978
0.99
3Fl
t Pro
tect
ed0.
980
0.96
10.
998
0.99
8Sa
td. F
low
(pro
t)0
1726
00
1774
00
1854
00
1866
0Fl
t Per
mitt
ed0.
980
0.96
10.
998
0.99
8Sa
td. F
low
(per
m)
017
260
017
740
018
540
018
660
Link
Spe
ed (m
ph)
3030
3030
Link
Dis
tanc
e (ft
)39
234
975
855
2Tr
avel
Tim
e (s
)8.
97.
917
.212
.5Pe
ak H
our F
acto
r0.
800.
800.
800.
800.
800.
800.
910.
910.
910.
950.
950.
95H
eavy
Veh
icle
s (%
)0%
0%0%
0%0%
2%0%
0%0%
0%1%
0%Ad
j. Fl
ow (v
ph)
253
3313
41
3029
593
122
1635
421
Shar
ed L
ane
Traf
fic (%
)La
ne G
roup
Flo
w (v
ph)
061
00
165
00
744
00
391
0En
ter B
lock
ed In
ters
ectio
nN
oN
oN
oN
oN
oN
oN
oN
oN
oN
oN
oN
oLa
ne A
lignm
ent
Left
Left
Rig
htLe
ftLe
ftR
ight
Left
Left
Rig
htLe
ftLe
ftR
ight
Med
ian
Wid
th(ft
)0
00
0Li
nk O
ffset
(ft)
00
00
Cro
ssw
alk
Wid
th(ft
)16
1616
16Tw
o w
ay L
eft T
urn
Lane
Hea
dway
Fac
tor
1.00
1.00
1.00
1.00
1.00
1.00
1.00
1.00
1.00
1.00
1.00
1.00
Turn
ing
Spee
d (m
ph)
159
159
159
159
Sign
Con
trol
Stop
Stop
Free
Free
Inte
rsec
tion
Sum
mar
yAr
ea T
ype:
Oth
erC
ontro
l Typ
e: U
nsig
naliz
edIn
ters
ectio
n C
apac
ity U
tiliz
atio
n 65
.2%
ICU
Lev
el o
f Ser
vice
CAn
alys
is P
erio
d (m
in) 1
5
HC
M 6
th T
WS
C39
011
Col
gate
Div
inity
TIS
9:
S G
oodm
an S
t &
Pin
etum
Dr/
Cam
pus
Driv
e20
22 F
ull B
uild
- PM
Pea
k H
our
05/1
3/20
19Sy
nchr
o 10
Rep
ort
Page
6
Inte
rsec
tion
Int D
elay
, s/v
eh12
.2
Mov
emen
tEB
LEB
TEB
RW
BLW
BTW
BRN
BLN
BTN
BRSB
LSB
TSB
RLa
ne C
onfig
urat
ions
Traf
fic V
ol, v
eh/h
202
2610
71
2426
540
111
1533
620
Futu
re V
ol, v
eh/h
202
2610
71
2426
540
111
1533
620
Con
flict
ing
Peds
, #/h
r0
00
00
00
00
00
0Si
gn C
ontro
l St
opSt
opSt
opSt
opSt
opSt
opFr
eeFr
eeFr
eeFr
eeFr
eeFr
eeR
T C
hann
eliz
ed-
-N
one
--
Non
e-
-N
one
--
Non
eSt
orag
e Le
ngth
--
--
--
--
--
--
Veh
in M
edia
n St
orag
e, #
-0
--
0-
-0
--
0-
Gra
de, %
-0
--
0-
-0
--
0-
Peak
Hou
r Fac
tor
8080
8080
8080
9191
9195
9595
Hea
vy V
ehic
les,
%0
00
00
20
00
01
0M
vmt F
low
253
3313
41
3029
593
122
1635
421
Maj
or/M
inor
Min
or2
Min
or1
Maj
or1
Maj
or2
Con
flict
ing
Flow
All
1125
1170
365
1127
1119
654
375
00
715
00
S
tage
139
739
7-
712
712
--
--
--
-
Sta
ge 2
728
773
-41
540
7-
--
--
--
Crit
ical
Hdw
y7.
16.
56.
27.
16.
56.
224.
1-
-4.
1-
-C
ritic
al H
dwy
Stg
16.
15.
5-
6.1
5.5
--
--
--
-C
ritic
al H
dwy
Stg
26.
15.
5-
6.1
5.5
--
--
--
-Fo
llow
-up
Hdw
y3.
54
3.3
3.5
43.
318
2.2
--
2.2
--
Pot C
ap-1
Man
euve
r18
419
568
518
320
946
711
95-
-89
5-
-
Sta
ge 1
633
607
-42
743
9-
--
--
--
S
tage
241
841
2-
619
601
--
--
--
-Pl
atoo
n bl
ocke
d, %
--
--
Mov
Cap
-1 M
aneu
ver
163
183
685
164
196
467
1195
--
895
--
Mov
Cap
-2 M
aneu
ver
163
183
-16
419
6-
--
--
--
S
tage
160
759
3-
409
421
--
--
--
-
Sta
ge 2
374
395
-57
458
7-
--
--
--
Appr
oach
EBW
BN
BSB
HC
M C
ontro
l Del
ay, s
21.3
90.4
0.3
0.4
HC
M L
OS
CF
Min
or L
ane/
Maj
or M
vmt
NBL
NBT
NBR
EBLn
1WBL
n1SB
LSB
TSB
RC
apac
ity (v
eh/h
)11
95-
-28
018
689
5-
-H
CM
Lan
e V/
C R
atio
0.02
4-
-0.
214
0.88
70.
018
--
HC
M C
ontro
l Del
ay (s
)8.
10
-21
.390
.49.
10
-H
CM
Lan
e LO
SA
A-
CF
AA
-H
CM
95t
h %
tile
Q(v
eh)
0.1
--
0.8
6.7
0.1
--