Embed Size (px)
Citation preview

Collaborative and cross-company project
management within the automotive industry
using the Balanced Scorecard
Klaus Dieter Niebecker
Thesis submitted for the degree of
Doctor of Philosophy
University of Technology, Sydney
2009
I
Abstract
Cross-company product development projects are often managed without clearly
defined project goals and without an alignment of these goals to an organisations
strategy and objectives. With a shift towards more decentralised and distributed
development teams, and an increasing level of collaboration, project transparency is
reduced and status measurement more difficult due to a lack of transparency. To
overcome these difficulties, the quality of collaboration in the automotive manufacturing
industry needs to be improved. The understanding of unifying goals and of the mutual
purpose to produce new products is essential for efficient and effective collaboration.
A methodological study in the automotive industry as part of this research lead to the
conclusion that a strategic scorecard method based on the Balanced Scorecard
concept by Kaplan and Norton is capable to improve cross-company project
management and reduce existing difficulties in typical product development
collaboration, such as communication or collaborative risk management. A common
definition of project goals, leading and lagging indicators to measure the status, and
defining corrective action are core elements of the Collaborative Project Scorecard
concept.
This thesis identifies the current problems and difficulties in automotive project
management and explores solutions to improve its efficiency and effectiveness based
on the Collaborative Project Scorecard. It is shown how the concept is derived from
business strategies for an improved alignment of project goals with business
objectives. A project impact analysis facilitates the development of project strategy
maps to increase transparency of goal impact interdependencies. Furthermore, based
on the results of workshops, surveys, and interviews the Collaborative Project
Scorecard concept is applied to typical automotive product development projects and
the identified advantages and limitations are evaluated by an application to a cross-
company project of an automotive supplier and a manufacturer. The development of
the Collaborative Project Scorecard is followed by a software implementation of the
results. The integration of a collaborative project management model that has a focus
on time, task and communication management enables the project manager to create
operational indicators that can be controlled on a strategic level by the Collaborative
Project Scorecard. Additionally, it is shown how risk management and performance

II
assessment are supported by the concept. Advantages, benefits, and limitations of the
methodology are identified and further application scenarios suggested.

IV
Preface
The automotive industry has undergone great structural changes in the last years. An
increasing number of project partners that are required for the development and
manufacturing of a vehicle has also changed the way automotive projects are
managed. The industry requires adapted methods to improve performance of cross-
company and collaborative projects and to reduce product recalls and project failures.
This research was dedicated to find a new path for the future by designing a concept
that can be adapted to a wide range of projects and organisational requirements. As
the concept has been developed within this research project its evaluation is limited to
chosen project types and to selected areas of project management. The fundamental
structure of the Collaborative Project Scorecard allows an organisation and project
partnership to adopt the concept in various ways ranging from simple stand alone
solutions in pilot projects to a complete integration to project portfolio and business
management. The concept alone is no guarantee for success and improvement as it
depends on a careful consideration of several aspects. Some of them are related to the
organisation itself and its management structure and project types, others to the
selection of relevant objectives and correspondent measures. While project
management experience and skills cannot be replaced by a method, a framework such
as part of the Collaborative Project Scorecard can support beginners and experts to
focus on the relevant goal achievements by linking operational tasks to an overall
strategy.

V
Acknowledgement
During the last three years of my research project I have met many inspiring people
who understood the challenges of a PhD and supported me with their innovative ideas
and help in various different ways. A network of research partners and friends was
created that will hopefully sustain and grow stronger. Research is not possible without
other people, their guidance, advice, and motivation to understand your goals and
objectives. My special thanks go to David Eager, my principle supervisor and research
partner over those three years. David supported me in any possible aspect with strong
dedication, patience, and humour. He made my time as a research student enjoyable
and fascinating by opening doors to new experiences in my life. I am also thankful to
Bruce Moulton, my alternate supervisor at UTS, who helped me to commence my PhD
at UTS from the very beginning and who always had the right advice how to improve
my work.
A number of coincidences brought me to another great person, Klaus Kubitza, who was
the chairman of the ProSTEP iViP Collaborative Project Management project in
Germany. Klaus made it possible to continue my research with the BMW Group in
Germany and the USA. He was also highly dedicated to create the necessary
environment within the organisation that allowed me to carry out my research without
any boundaries. His continuous care and great understanding for my research needs
were indispensable for the success of this project. My gratefulness goes to him and to
the whole BMW Group in Germany, the department of processes, methods, and tools
for product projects in particular, and the BMW Group in the U.S., where I always
found open minds and cooperativeness to answer my questions and great curiosity to
participate in workshops and interviews. At this time I also want to mention Joachim
Taiber, head of the IT Research Centre in South Carolina, and the workshop and
interview team from plant 10. Without them the contributions to the research project in
South Carolina could not have been achieved. My special thanks go to Maximilian
Kissel, my Master student at that time, who has greatly contributed to the concept
development and workshops in South Carolina. He made our concept discussions very
productive and his creativity influenced the quality of this research. He was also an
essential team member to implement the CPS concept together with Microsoft and
supported me with his work as a research partner and friend. In this context I would like
to thank the project partners from Dräxlmaier USA and Juergen Frank in particular.

VI
Without their co-operation some of the methods and tools could not have been
evaluated.
The research has continuously been carried out in a wide network of research partners.
Major contributions were developed thanks to the support of Reinhard Wagner,
chairman of the Automotive Chapter of the German Project Management Association.
Reinhard gave me the opportunity to organise relevant chapter workshops to develop
the concept and he also supported me in publishing and presenting major parts of the
research activities. He was also a driving force that initiated the idea of the
Collaborative Project Scorecard. Hence, my thanks go to the members of the GPM
e.V. Automotive Chapter who participated in the two major workshops.
In addition, I would like to express my thankfulness to the contribution of the
postgraduate students of the course Managing Projects at UTS who I supervised for
their final assignment from 2006 to 2008 and the administrative support of Phyllis Agius
from the Faculty of Engineering and IT. Finally, I also want to thank my family and my
friends for their understanding and helpfulness during these sometimes eventful times.

VII
Table of Contents
ABSTRACT .......................................... ...................................................... I
CERTIFICATE OF AUTHORSHIP/ORIGINALITY ............. ...................... III
PREFACE ................................................................................................. IV
ACKNOWLEDGEMENT ................................... ......................................... V
TABLE OF CONTENTS ................................. ......................................... VII
LIST OF FIGURES .................................................................................. XII
LIST OF TABLES .................................... .............................................. XVI
NOMENCLATURE ...................................... ......................................... XVII
PUBLICATIONS ...................................... .............................................. XIX
1 INTRODUCTION ................................................................................. 1
1.1 RESEARCH BACKGROUND AND SIGNIFICANCE .................................................... 2
1.1.1 Changes and developments in the automotive industry ........................... 3
1.1.2 The Balanced Scorecard approach to project management .................... 4
1.2 RESEARCH OBJECTIVES AND STEPS .................................................................. 5
1.3 STRUCTURE OF THESIS ..................................................................................... 8
2 THEORETICAL BACKGROUND TO PROJECT MANAGEMENT .. 10
2.1 HISTORY OF PROJECT MANAGEMENT ............................................................... 10
2.1.1 Relation to management science ........................................................... 11
2.2 DEFINING PROJECTS AND PROJECT MANAGEMENT ........................................... 12
2.2.1 Projects ................................................................................................. 13
2.2.2 Definition of project management .......................................................... 14
2.2.2.1 Project management characteristics ............................................... 14
2.2.2.2 Kerzner’s definition of project management .................................... 15
2.2.3 Modern project management ................................................................. 16
2.2.3.1 Agile project management .............................................................. 17
2.2.3.2 Project management second order ................................................. 18
2.3 PROJECT MANAGEMENT METHODS , TOOLS, AND STANDARDS ........................... 21
2.3.1 Reference class forecasting................................................................... 22
2.3.2 Project management associations ......................................................... 23
2.4 STRATEGY AND PROJECT MANAGEMENT .......................................................... 24
2.4.1 Creating a strategy-focused project organisation ................................... 25
3 PROJECT MANAGEMENT IN THE AUTOMOTIVE INDUSTRY ..... 26
3.1 DEVELOPMENTS IN THE AUTOMOTIVE INDUSTRY ............................................... 27
3.1.1 The role of project management in the automotive sector ...................... 28
3.1.2 Project management dimensions ........................................................... 29
3.2 AUTOMOTIVE PROJECT MANAGEMENT ............................................................. 31
3.2.1 Success factors ..................................................................................... 31
3.2.2 Automotive organisational management structures ............................... 32
3.2.2.1 Engineering and the project management office ............................. 34
3.2.3 Project failures in the automotive industry .............................................. 35
3.3 PRODUCT DEVELOPMENT AND PROJECT MANAGEMENT IN THE AUTOMOTIVE INDUSTRY ................................................................................................................. 36
3.3.1 Project and product development cycles................................................ 37

VIII
3.3.2 From definition to project and maturity stage control .............................. 39
3.3.2.1 Definition phase .............................................................................. 40
3.3.2.2 Project planning and control ........................................................... 41
3.3.2.3 Project maturity control ................................................................... 42
3.4 CHANGE, CLAIM AND CONFIGURATION MANAGEMENT ....................................... 44
3.5 PRODUCT DATA MANAGEMENT (PDM) ............................................................. 45
4 CROSS-COMPANY PROJECT MANAGEMENT .................. ........... 46
4.1 DEFINITION OF COLLABORATIVE AND CROSS -COMPANY PROJECT MANAGEMENT 47
4.2 VIRTUAL TEAMS IN PROJECT MANAGEMENT ..................................................... 49
4.2.1 Definition of virtual project teams ........................................................... 49
4.2.2 Levels of collaboration ........................................................................... 50
4.2.3 Collaboration as a key to business success ........................................... 51
4.2.3.1 Early identification of collaboration benefits .................................... 52
4.2.3.2 The definition of collaborative standards as a key to success ......... 53
4.3 VIRTUAL TEAMS AND PRODUCT DEVELOPMENT PROJECTS ................................ 53
4.3.1 Distributed product development ........................................................... 53
4.3.1.1 Cooperation model for distributed product development ................. 54
4.3.2 Communication as a driving force .......................................................... 55
4.4 CULTURAL ASPECTS : LIMITATIONS AND CHANCES ............................................ 56
4.4.1 Cross-cultural development projects ...................................................... 57
4.5 GENERAL DIFFICULTIES IN CROSS -COMPANY PROJECT MANAGEMENT ............... 57
4.5.1 Change towards complex projects ......................................................... 58
4.5.2 Technologies as a driver for virtual teams.............................................. 60
4.5.3 New processes need adaptation to distributed work environment .......... 61
4.6 CROSS-COMPANY PROJECT MANAGEMENT IN THE AUTOMOTIVE INDUSTRY ........ 61
4.6.1 A move towards networked project structures ....................................... 62
4.6.2 Evolving cooperation and joint ventures ................................................ 62
4.6.2.1 Chances and risks in cooperation ................................................... 63
4.6.2.2 Value creation and success factors of existing cooperation ............ 63
4.7 AUTOMOTIVE SPECIFIC PROBLEMS .................................................................. 65
4.7.1 Impact factors and their capability.......................................................... 66
4.7.2 Ways to overcome difficulties in automotive project management ......... 67
4.8 ACTIVITIES OF AUTOMOTIVE ASSOCIATIONS ..................................................... 68
4.8.1 The Prostep iViP CPM Reference Model ............................................... 69
4.8.1.1 Introduction to the CPM Reference Model ...................................... 69
4.8.1.2 Methods, tools and processes for cross-company project management .................................................................................................... 72
4.8.1.3 Benefits of the CPM Reference Model ............................................ 73
4.9 METHODS FOR PROCESS INTRODUCTION ......................................................... 73
4.9.1 Board simulation in practice ................................................................... 73
4.9.2 Example: development of the ProSTEP iViP CPM Reference Model ..... 74
5 RESEARCH METHODOLOGY AND PLAN ..................... ................ 75
5.1 SCIENTIFIC APPROACH TO RESEARCH METHODOLOGY ...................................... 75
5.2 METHODOLOGY OVERVIEW ............................................................................. 79
5.3 FROM IDENTIFICATION TO HYPOTHESIS ............................................................ 80
5.3.1 Analysis of a manufacturer and additional interviews ............................. 80
5.3.2 Research questions, objectives and hypothesis..................................... 83
5.3.2.1 From research questions to research objectives ............................. 84
5.3.2.2 Research hypothesis ...................................................................... 86
5.4 RESEARCH PLAN AND INFORMATION SOURCES ................................................ 87
5.4.1 Research activities on an international level .......................................... 88
5.4.2 Milestones and information sources ....................................................... 88

IX
5.4.3 A variety of core methods as part of the CPS methodology ................... 89
5.4.4 Continuous development, adaptation and improvements ....................... 90
6 BALANCED SCORECARD AND PROJECT MANAGEMENT ........ 92
6.1 STRATEGIC APPROACH TO PROJECT MANAGEMENT .......................................... 93
6.1.1 Managing by objectives and Hoshin Process ......................................... 93
6.2 THE BALANCED SCORECARD FOR STRATEGY BASED MANAGEMENT .................. 94
6.2.1 Recent Balanced Scorecard study results ............................................. 97
6.2.1.1 The Balanced Scorecard and IT support ........................................ 99
6.2.2 Strategy Maps ..................................................................................... 100
6.3 MANAGING PROJECTS BASED ON THE BALANCED SCORECARD ...................... 101
6.3.1 Project team performance and strategic project selection .................... 102
6.3.2 Projects as mini-organisations ............................................................. 102
6.4 THE PROJECT SCORECARD .......................................................................... 103
6.4.1 Structure and organisational integration of the Project Scorecard ........ 104
6.4.1.1 Structure of a PSC ........................................................................ 104
6.4.1.2 Organisational integration of a PSC .............................................. 105
6.4.1.3 Project Strategy Map and Impact Matrix Analysis ......................... 106
6.4.2 Key performance indicators for project scorecards .............................. 109
6.4.2.1 Examples of KPIs for a Project Scorecard .................................... 109
6.4.3 PSC application in practice .................................................................. 112
6.4.3.1 Risk management aspects ........................................................... 113
6.4.3.2 Balanced and Project Scorecards for supply chain management . 113
6.4.4 The Project Scorecard concept as an adaptive approach .................... 114
6.4.4.1 Adoption of Six Sigma and management frameworks ................... 114
6.5 THE BALANCED SCORECARD FOR CROSS-COMPANY PROJECT MANAGEMENT .. 115
6.5.1 A new approach to collaborative and networked project environments 115
6.5.2 Performance measurement as a key condition for effective project management ...................................................................................................... 116
6.5.3 X-engineering requires a holistic view .................................................. 116
6.5.4 A need for a Collaborative Project Scorecard ...................................... 117
7 THE CONCEPT OF THE COLLABORATIVE PROJECT SCORECARD ........................................................................................ 118
7.1 INTRODUCTION ............................................................................................. 118
7.1.1 Goals of the Collaborative Project Scorecard ...................................... 120
7.1.2 Characteristics of the CPS ................................................................... 120
7.2 STRUCTURE OF THE COLLABORATIVE PROJECT SCORECARD ......................... 121
7.2.1 The CPS perspectives ......................................................................... 122
7.2.1.1 Definition of the CPS perspectives ............................................... 123
7.3 CPS DEVELOPMENT PROCEDURE .................................................................. 126
7.3.1 Collaborative project strategy .............................................................. 126
7.3.2 From Common goal definition to corrective action ............................... 128
7.4 INTEGRATION OF THE CPS INTO PROJECT NETWORKS AND ENVIRONMENTS ..... 130
7.4.1 Reducing relationships to one-to-one partnerships .............................. 130
7.5 ORGANISATIONAL INTEGRATION OF A CPS .................................................... 133
7.5.1 Creating a common vision and a strategic framework .......................... 133
7.6 THE CPS FOR PROJECT PORTFOLIO AND PARTNERSHIP MANAGEMENT ............ 135
7.7 THE PROJECT IMPACT MATRIX AND STRATEGY MAP ........................................ 136
7.7.1 The collaborative project impact matrix analysis .................................. 136
7.7.2 Developing a collaborative project strategy map .................................. 138
7.8 INTEGRATING SOFT FACTS FOR SUSTAINABLE COLLABORATION ...................... 139
8 THE CPS FOR AUTOMOTIVE PROJECTS ................... ................ 142

X
8.1 INTRODUCTION ............................................................................................. 142
8.2 CONCEPT ADAPTATION TO AUTOMOTIVE ENVIRONMENT .................................. 143
8.2.1 First workshop results Vilsbiburg ......................................................... 144
8.2.1.1 Work group results ....................................................................... 145
8.2.1.2 Feedback results .......................................................................... 146
8.2.2 Second workshop results Erfurt ........................................................... 147
8.2.2.1 CPS development and adaptation procedure model ..................... 148
8.2.2.2 Introducing a CPS to an organisation ........................................... 150
8.2.3 Automotive industry surveys ................................................................ 151
8.2.3.1 First automotive survey................................................................. 151
8.2.3.2 Second automotive survey ........................................................... 152
8.2.3.3 Results of the second survey ........................................................ 153
9 THE CPS FOR AN AUTOMOTIVE SUPPLIER AND OEM ........ .... 158
9.1 PROJECT PARTNER SELECTION CRITERIA (STEP 1 TO 2) ................................. 159
9.2 BRIEFING AND DISCUSSING THE CPS CONCEPT (STEP 3) ................................ 161
9.3 CHOICE OF PROJECT PHASE (STEP 4) ............................................................ 161
9.3.1 Definition of launch phase ................................................................... 162
9.3.2 Change management phase................................................................ 163
9.4 DEFINITION OF OWN PROJECT STRATEGIES AND OBJECTIVES (STEP 5) ............ 165
9.5 THE CPS WORKSHOP (STEP 6) ..................................................................... 166
9.5.1 Expectations, goals and agenda of CPS workshop .............................. 166
9.6 THE STRATEGIC COLLABORATIVE PROJECT SCORECARD AND COLLABORATIVE STRATEGY MAP ...................................................................................................... 169
9.7 THE CPS FOR CHANGE AND LAUNCH MANAGEMENT ....................................... 172
9.8 DISCUSSION OF RESULTS AND WORKSHOP QUESTIONNAIRE (STEP 7) .............. 177
9.8.1 Benefits of the CPS concept ................................................................ 177
9.8.2 Barriers and efforts of the CPS concept ............................................... 178
9.8.3 Conclusion of research pilot project in the USA ................................... 178
10 CPS IT IMPLEMENTATION ............................. ............................ 180
10.1 INTRODUCTION TO IT IMPLEMENTATION ......................................................... 180
10.2 SOFTWARE REQUIREMENTS .......................................................................... 181
10.2.1 Selection criteria of chosen tool ........................................................... 181
10.3 CPS IMPLEMENTATION WITH MS PERFORMANCE POINT 2007 ........................ 184
10.3.1 Alternative software consideration and limitations ................................ 184
10.3.2 Functionality of MS Performance Point Server 2007 ............................ 185
10.3.3 Meeting the CPS requirements ............................................................ 186
10.3.3.1 Identified deficiencies of the system ............................................. 187
10.4 CONCLUSION ............................................................................................... 190
10.4.1 Efforts and benefits of an IT implementation ........................................ 191
11 INTEGRATING A COLLABORATIVE MANAGEMENT MODEL INTO THE CPS ...................................................................................... 192
11.1 INTRODUCTION ............................................................................................. 192
11.2 THE PROSTEP IVIP CPM REFERENCE MODEL AS A SOURCE FOR OPERATIONAL AND STRATEGIC KPIS ............................................................................................. 194
11.2.1 KPIs based on CPM tools .................................................................... 194
11.2.2 KPIs based on CPM processes ........................................................... 196
11.2.3 Combining CPM processes and tools for operational KPIs .................. 196
11.3 COMMENTS ON THE INTEGRATED APPROACH ................................................. 198
12 ASSESSING PERFORMANCE OF CROSS-COMPANY PROJECTS ............................................................................................ 199

XI
12.1 ASSESSMENT OF COLLABORATIVE PROJECTS BASED ON PROJECT EXCELLENCE CRITERIA ................................................................................................................ 199
12.1.1 Mapping the assessment criteria and sub criteria with the Project Scorecard .......................................................................................................... 200
12.1.2 Mapping the Project Excellence Model with the Collaborative Project Scorecard .......................................................................................................... 204
12.2 REMARKS ON CPS PERFORMANCE ASSESSMENT ........................................... 208
13 COLLABORATIVE PROJECT RISK MANAGEMENT WITH A COLLABORATIVE PROJECT SCORECARD ................... ................... 210
13.1 INTRODUCTION TO PROJECT RISK MANAGEMENT ............................................ 211
13.2 PROJECT RISK MANAGEMENT IN THE AUTOMOTIVE INDUSTRY .......................... 211
13.3 A BALANCED SCORECARD APPROACH TO RISK ............................................. 215
13.4 RISK MANAGEMENT WITH A PROJECT SCORECARD ........................................ 215
13.5 COLLABORATIVE PROJECT RISK MANAGEMENT WITH A CPS ........................... 216
14 CONCLUSION .............................................................................. 220
14.1 DIFFICULTIES IN AUTOMOTIVE COLLABORATIVE PROJECT MANAGEMENT ......... 220
14.2 THE BALANCED SCORECARD APPROACH TO COLLABORATIVE PROJECT MANAGEMENT ......................................................................................................... 221
14.3 STEPS TOWARDS AN ACHIEVEMENT OF THE RESEARCH OBJECTIVES ............... 221
14.3.1 Initial workshop results ........................................................................ 222
14.3.2 Evaluation by applying to a vehicle project .......................................... 222
14.3.3 Concept extensions ............................................................................. 223
14.4 FINAL REMARKS AND RECOMMENDATION ON FUTURE RESEARCH .................... 224
15 APPENDIX A ................................................................................ 226
15.1 CAPABILITY MATURITY MODEL INTEGRATION .................................................. 226
15.2 PROJECTS IN CONTROLLED ENVIRONMENTS (PRINCE2) .................................. 227
15.3 THE V-MODELL XT ....................................................................................... 228
15.4 INTERNATIONAL ORGANISATION FOR STANDARDIZATION (ISO)....................... 229
15.4.1 ISO 9000 family ................................................................................... 229
15.4.1.1 ISO 9001 ...................................................................................... 230
15.4.2 Earned value management .................................................................. 230
15.5 PROCESS WORKFLOW “ EXECUTE ESCALATION ” ............................................. 231
16 APPENDIX B ................................................................................ 232
16.1 WORKSHOP QUESTIONNAIRE VILSBIBURG JULY 2007 .................................... 232
16.2 PROJECT SCORECARD SURVEY QUESTIONNAIRE (GPM) ................................ 238
16.3 COLLABORATIVE PROJECT SCORECARD SURVEY QUESTIONNAIRE (ONLINE).... 246
17 APPENDIX C ................................................................................ 253
17.1 AGENDA OF THE CPS WORKSHOP 11TH MARCH 2008 ................................... 253
17.2 ORIGINAL STRATEGY MAP OF THE STRATEGIC COLLABORATIVE SCORECARD (WHITEBOARD) ....................................................................................................... 254
17.3 CPS WORKSHOP QUESTIONNAIRE ................................................................. 255
BIBLIOGRAPHY ...................................... ............................................. 256

XII
List of Figures
FIGURE 1.1: INTRODUCTION CHAPTER ............................................................................. 2
FIGURE 1.2: RESEARCH STEPS ........................................................................................ 7
FIGURE 1.3: STRUCTURE OF THESIS CHAPTERS ................................................................ 8
FIGURE 2.1: OVERVIEW OF CHAPTER 2 .......................................................................... 10
FIGURE 2.2: PURITANISM INFLUENCING TODAY’S PROJECT MANAGEMENT (WHITTY, 2007) 12
FIGURE 2.3: SELECTIVE PERCEPTION OF PROJECTS (RIETIKER, 2006, P. 24) .................... 13
FIGURE 2.4: A PROJECT AS AN OPEN SYSTEM (RIETIKER 2006, P. 25) .............................. 14
FIGURE 2.5: MAPPING OF PROJECT MANAGEMENT PROCESS GROUPS (PMI, 2004, P. 39-40) ............................................................................................................................ 15
FIGURE 2.6: THE WATERFALL MODEL (HASS, 2007, P. 1) ............................................... 17
FIGURE 2.7: AGILE DEVELOPMENT MODEL (HASS, 2007, P. 3) ......................................... 18
FIGURE 2.8: ARCHITECTURE AND PROCESS MODEL PM 2ND ORDER (SAYNISCH, 2007, P. 7) ............................................................................................................................ 19
FIGURE 2.9: SYSTEMIC ARCHITECTURE AND PROCESS MODEL OF PM 2ND ORDER (SAYNISCH, 2007, P. 8) ......................................................................................... 21
FIGURE 2.10: THE PRINCIPLES OF A STRATEGY FOCUSED ORGANISATION (KAPLAN AND NORTON, 2001, P. 9)........................................................................ 25
FIGURE 3.1: OVERVIEW CHAPTER 3 ............................................................................... 26
FIGURE 3.2: NUMBER OF PRODUCT RECALLS IN GERMANY (HAB AND WAGNER, 2006, P. 3) ............................................................................................................................ 27
FIGURE 3.3: INTERACTION BETWEEN IMPACT FACTORS ON PROJECT MANAGEMENT (WAGNER, 2009, P. 75) ......................................................................................... 28
FIGURE 3.4: GPM PROJECT MANAGEMENT SURVEY RESULTS .......................................... 29
FIGURE 3.5: GPM SURVEY RESULTS OF GOAL ACHIEVEMENT, BUDGET AND TIME ADHERENCE (WAGNER, 2000, P. 76) ......................................................................................... 30
FIGURE 3.6: FROM HIERARCHICAL TOWARDS NETWORKED PROJECT STRUCTURES (HAB AND WAGNER, 2006, P. 256) ........................................................................ 31
FIGURE 3.7: MATRIX ORGANISATION OF A VEHICLE MANUFACTURER (HAB AND WAGNER, 2006, P. 42) .......................................................................................................... 33
FIGURE 3.8: THE PROJECT MANAGEMENT OFFICE TASKS AT STRATEGIC AND OPERATIONAL LEVEL (HAB AND WAGNER, 2006, P. 209) ............................................................... 35
FIGURE 3.9: REASONS FOR PROJECT FAILURES (ENGEL AND HOLM, 2007) ...................... 36
FIGURE 3.10: INTERRELATION OF PRODUCT DEVELOPMENT PHASES (HAB AND WAGNER, 2006, P. 26) .......................................................................................................... 37
FIGURE 3.11: PROJECT MANAGEMENT CONTROL CYCLE AND PRODUCT DEVELOPMENT PROCESS (VDA, 2003, P. 14) ................................................................................ 38
FIGURE 3.12: INTERACTION OF PROJECT MANAGEMENT AND TECHNICAL PRODUCT DEVELOPMENT PROCESSES (HAB AND WAGNER, 2006, P. 27) .................................. 39
FIGURE 3.13: FROM KICK-OFF TO PLANNING WORKSHOP (HAB AND WAGNER, 2006, P. 109) ............................................................................................................................ 41
FIGURE 3.14: POSSIBLE DEFINITION OF TRAFFIC LIGHTS FOR QUALITY GATE CONTROL (HAB AND WAGNER, 2006, P. 146) ......................................................................... 42
FIGURE 3.15: STEPS OF THE 8D METHOD (HAB AND WAGNER, 2006, P. 165) .................. 43
FIGURE 3.16: SIMPLIFIED ILLUSTRATION OF A PROJECT COCKPIT .................................... 43
FIGURE 4.1: OVERVIEW OF CHAPTER 4 .......................................................................... 46
FIGURE 4.2: PROJECT CLASSIFICATION SCHEME (EVARISTO ET AL., 1999, P. 277) ........... 48
FIGURE 4.3: HIERARCHY OF COLLABORATION (CHEN ET AL., 2002, P. 8) .......................... 51
FIGURE 4.4: COOPERATION MODEL OF DISTRIBUTED PRODUCT DEVELOPMENT (GIERHARDT, 2001, P.56) ...................................................................................... 55

XIII
FIGURE 4.5: FACTORS THAT INFLUENCE THE SUCCESS OF CROSS-BORDER PROJECTS (LEUNG ET AL., 2005)............................................................................................ 57
FIGURE 4.6: DEVELOPMENT OF PRODUCTION AND VALUE CREATION CHAIN TOWARDS MORE SUPPLIERS (HAB AND WAGNER, 2006, P. 4) ............................................................ 62
FIGURE 4.7: HIERARCHY AND VALUE CREATION OF EXISTING COOPERATION (MERCER AND TUM, 2005) .......................................................................................................... 64
FIGURE 4.8: CRITERIA OF COOPERATION (SPIES, 2003) .................................................. 64
FIGURE 4.9: SUCCESS FACTORS FOR COOPERATION ...................................................... 65
FIGURE 4.10: C3PM MODEL (PANDER AND WAGNER, 2005, P. 25) .................................. 66
FIGURE 4.11: SATISFACTION OF STUDY PARTICIPANTS WITH RESPECT TO IMPACT FACTORS (WAGNER AND PANDER, 2005, P. 41) ..................................................................... 67
FIGURE 4.12: CAPABILITY OF IMPACT FACTORS TO IMPROVE CROSS-COMPANY COLLABORATION (WAGNER AND PANDER, 2005, P. 43) ........................................... 67
FIGURE 4.13: CPM REFERENCE MODEL SCOPE (PROSTEP IVIP, 2007A, P.III) ................. 70
FIGURE 4.14: RELATION BETWEEN PRODUCT DEVELOPMENT PROCESS AND PROJECT MANAGEMENT ON A COLLABORATIVE LEVEL (PROSTEP IVIP, 2007A, P. 9) ................. 71
FIGURE 4.15: INTERACTION CHAIN TO INTEGRATE AN ENTERTAINMENT SYSTEM OF A PARTNER (PROSTEP IVIP, 2007A, P. 22) ............................................................... 71
FIGURE 4.16: STRUCTURE OF THE DATA EXCHANGE MODEL (PROSTEP IVIP, 2007B, P.2) .. 72
FIGURE 5.1: OVERVIEW OF CHAPTER 5 .......................................................................... 75
FIGURE 5.2: MAJOR RESEARCH STEPS ........................................................................... 79
FIGURE 5.3: STEPS TOWARDS RESEARCH QUESTIONS, OBJECTIVES, AND HYPOTHESIS ..... 81
FIGURE 5.4: STEPS TOWARDS RESEARCH QUESTIONS AND OBJECTIVES ........................... 83
FIGURE 5.5: FROM RESEARCH QUESTIONS TO OBJECTIVES ............................................. 84
FIGURE 5.6: PHASES OF RESEARCH OBJECTIVES ............................................................ 85
FIGURE 5.7: FROM RESEARCH QUESTIONS TO HYPOTHESIS TESTING ............................... 86
FIGURE 5.8: PROJECT PHASES AND PROJECT MANAGEMENT LIFE CYCLE (ON THE BASIS OF: HAB AND WAGNER, 2006, P. 30) ............................................................................ 87
FIGURE 5.9: RESEARCH PLAN ........................................................................................ 89
FIGURE 5.10: SET OF DEVELOPED METHODS FOR CPS METHODOLOGY ........................... 90
FIGURE 6.1: OVERVIEW OF CHAPTER 6 .......................................................................... 92
FIGURE 6.2: SEVEN STEPS OF THE HOSHIN PLANNING PROCESS (JOLAYEMI, 2008, P. 298) ............................................................................................................................ 94
FIGURE 6.3: BALANCED SCORECARD FRAMEWORK (KAPLAN AND NORTON, 1996, P. 9) .... 95
FIGURE 6.4: SIMILAR STRATEGIES AS COMPETITION ........................................................ 97
FIGURE 6.5: STRATEGY IMPLEMENTATION CONSIDERED AS STRENGTH OR WEAKNESS ...... 98
FIGURE 6.6: NUMBER OF BSC A SINGLE ORGANISATION HAS IMPLEMENTED ..................... 99
FIGURE 6.7: SATISFACTION WITH OFFICE TOOL SET FOR MANAGEMENT TASKS ................ 100
FIGURE 6.8: SAMPLE STRATEGY MAP ........................................................................... 101
FIGURE 6.9: FOUR LEVELS OF A PROJECT SCORECARD (SELDERS AND MAERKLE, 2003, P.3) .......................................................................................................................... 104
FIGURE 6.10: PROJECT SCORECARD FRAMEWORK ....................................................... 105
FIGURE 6.11: DERIVATION OF A PSC (NIEBECKER ET AL., 2008A, P. 372) ...................... 106
FIGURE 6.12: PROJECT STRATEGY MAP EXAMPLE ........................................................ 107
FIGURE 6.13: GENERIC FRAMEWORK OF THE PROJECT IMPACT MATRIX ......................... 108
FIGURE 6.14: EXAMPLE OF OBJECTIVES AND KPIS FOR AN AUTOMOTIVE PRODUCT DEVELOPMENT PROJECT ...................................................................................... 112
FIGURE 7.1: OVERVIEW OF CHAPTER 7 ........................................................................ 118
FIGURE 7.2: FROM PROJECT SCORECARDS TO A CPS .................................................. 119
FIGURE 7.3: CHARACTERISTICS OF THE CPS ............................................................... 121
FIGURE 7.4: THE FRAMEWORK OF THE COLLABORATIVE PROJECT SCORECARD ............. 123
FIGURE 7.5: OPERATIONAL VERSUS STRATEGIC GOALS ................................................. 124
FIGURE 7.6: SHORT VERSUS LONG TERM PROSPECTS ................................................... 124
FIGURE 7.7: PROJECT RESULTS VERSUS PROCESSES ................................................... 125

XIV
FIGURE 7.8: PROCEDURE TO DEVELOP A CPS.............................................................. 126
FIGURE 7.9: RELATION BETWEEN STRATEGY AND PROJECT MANAGEMENT (SCHELLE, 2008, P.135) ................................................................................................................ 127
FIGURE 7.10: DEFINING COMMON GOALS ..................................................................... 129
FIGURE 7.11: RISK MANAGEMENT AS AN INTEGRATED PART OF THE CPS ....................... 130
FIGURE 7.12: A SINGLE CPS FOR ALL PROJECT PARTNERS ........................................... 131
FIGURE 7.13: REDUCTION TO ONE-TO-ONE CPS RELATIONSHIPS .................................. 131
FIGURE 7.14: POSSIBLE NETWORK CONSTELLATIONS FOR THE INSTALLATION OF A CPS . 132
FIGURE 7.15: DERIVATION OF A CPS FROM A BSC AND PSC ........................................ 133
FIGURE 7.16: STRATEGIC COLLABORATIVE SCORECARD (OEM-SUPPLIER) .................... 134
FIGURE 7.17: STRATEGIC SCORECARD AND CPS APPLICATION ..................................... 135
FIGURE 7.18: THE STRATEGIC PARTNERSHIP SCORECARD ........................................... 136
FIGURE 7.19: FRAMEWORK OF THE COLLABORATIVE PROJECT IMPACT MATRIX (CPIM).. 137
FIGURE 7.20: CPIM EXAMPLE ..................................................................................... 138
FIGURE 7.21: EXAMPLE OF A COLLABORATIVE PROJECT STRATEGY MAP (CPSM) ........... 139
FIGURE 7.22: TEMPLATE TO MEASURE PROJECT TEAM TRUST ....................................... 140
FIGURE 8.1: OVERVIEW OF CHAPTER 8 ........................................................................ 142
FIGURE 8.2: DEVELOPMENT STEPS TOWARDS AN AUTOMOTIVE CPS .............................. 143
FIGURE 8.3: WORKSHOP QUESTIONNAIRE RESULTS VILSBIBURG JULY 2007 .................. 147
FIGURE 8.4: 2ND WORKSHOP RESULTS GROUP I ........................................................... 148
FIGURE 8.5: PROCEDURE MODEL TO ADAPT AND CHANGE A CPS .................................. 149
FIGURE 8.6: SATISFACTION OF EXISTING PROJECT MANAGEMENT TOOLS FOR INFORMATION EXCHANGE .......................................................................................................... 155
FIGURE 8.7: BENEFITS OF A CPS COMPARED TO ITS EFFORTS ...................................... 156
FIGURE 8.8: IMPACT OF CPS ON PROJECT TRANSPARENCY........................................... 156
FIGURE 8.9: IMPROVEMENT OF ALIGNMENT OF PROJECT WITH BUSINESS OBJECTIVES ..... 157
FIGURE 9.1: OVERVIEW OF CHAPTER 9 ........................................................................ 158
FIGURE 9.2: EIGHT STEP APPROACH OF THE RESEARCH PILOT PROJECT IN THE USA ...... 159
FIGURE 9.3: CRITERIA FOR A PROJECT PARTNER TO DEVELOP A CPS IN A PILOT PROJECT .......................................................................................................................... 160
FIGURE 9.4: APPLICATION OF A CPS TO EACH PROJECT PHASE ..................................... 161
FIGURE 9.5: LAUNCH AND CHANGE MANAGEMENT PHASE .............................................. 162
FIGURE 9.6: SUBSEQUENT INDIVIDUAL WORKSHOPS ..................................................... 165
FIGURE 9.7: SWOT ANALYSIS RESULTS OF THE INDIVIDUAL WORKSHOPS ....................... 166
FIGURE 9.8: DEVELOPMENT OF A SCS AND STRATEGY MAP .......................................... 168
FIGURE 9.9: PROCEDURE OF THE CPS WORKSHOP ...................................................... 169
FIGURE 9.10: COMMON VISION OF THE PROJECT PARTNERSHIP ..................................... 170
FIGURE 9.11: THE STRATEGIC COLLABORATIVE SCORECARD ........................................ 170
FIGURE 9.12: STRATEGY MAP OF THE STRATEGIC COLLABORATIVE SCORECARD ........... 171
FIGURE 9.13: PROCEDURE TO DEVELOP A CPS ............................................................ 172
FIGURE 10.1: OVERVIEW OF CHAPTER 10 .................................................................... 180
FIGURE 10.2: STEPS OF IT IMPLEMENTATION ............................................................... 181
FIGURE10.3: WORKFLOW CAPACITY REQUIREMENTS .................................................... 182
FIGURE 10.4: SHARED DATA BETWEEN OEM AND SUPPLIER TO CREATE KPIS ................ 183
FIGURE 10.5: ARCHITECTURE OF LAB ENVIRONMENT FOR CPS IMPLEMENTATION ........... 184
FIGURE 10.6: SYSTEM COMPONENTS OF THE MS PERFORMANCE POINT SERVER 2007 (MICROSOFT, 2007) ............................................................................................ 186
FIGURE 10.7: SCREENSHOT OF CPS IMPLEMENTATION ................................................. 188
FIGURE 10.8: GRAPHICAL PLOT OF PPM VALUES IN TIME .............................................. 189
FIGURE 10.9: ADVANTAGES AND DISADVANTAGES OF SELECTED TOOL FOR CPS CONCEPT .......................................................................................................................... 190
FIGURE 10.10: CHRONOLOGICAL EVALUATION OF EFFORTS AND BENEFITS OF AN IT IMPLEMENTATION ................................................................................................ 191
FIGURE 11.1: OVERVIEW OF CHAPTER 11 .................................................................... 192
XV
FIGURE 11.2: INTERACTION OF CPS AND PROSTEP IVIP REFERENCE MODEL ON STRATEGIC AND OPERATIONAL LEVEL (NIEBECKER ET AL., 2008C, P. 10) ................ 194
FIGURE 11.3: KPIS BASED ON CPM TOOLS FOR PROJECT RESULT PERSPECTIVE ............ 195
FIGURE 11.4: CREATION OF KPIS FOR THE PROCESS PERSPECTIVE BASED ON CPM PROCESSES ........................................................................................................ 196
FIGURE 11.5: CPM COMMUNICATION MATRIX (BASED ON PROSTEP IVIP, 2007A, P. 55) 197
FIGURE 11.6: PART OF CPM ISSUE LIST TEMPLATE (PROSTEP IVIP 2007A, P.53) ......... 197
FIGURE 11.7: EXAMPLES OF KPIS BASED ON CPM FOR COLLABORATION AND LEARNING & DEVELOPMENT .................................................................................................... 198
FIGURE 12.1: OVERVIEW OF CHAPTER 12 .................................................................... 199
FIGURE 12.2: FRAMEWORK OF THE PROJECT EXCELLENCE MODEL (IPMA, 2008) .......... 200
FIGURE 12.3: MAPPING OF THE PROJECT SCORECARD PERSPECTIVES WITH THE PROJECT EXCELLENCE MODEL ........................................................................................... 201
FIGURE 12.4: INTEGRATION OF PROJECT EXCELLENCE ASSESSMENT INTO A PROJECT SCORECARD (NIEBECKER ET AL., 2008B, P. 4) ...................................................... 203
FIGURE 12.5 MODIFIED ASSESSMENT MODEL .............................................................. 204
FIGURE 12.6: MODIFIED MAPPING OF CRITERIA WITH A CPS (NIEBECKER ET AL., 2008B, P. 3) ....................................................................................................................... 205
FIGURE 12.7: INTEGRATING COLLABORATIVE PROJECT ASSESSMENT RESULTS INTO A CPS (NIEBECKER ET AL., 2008B, P. 5) .......................................................................... 206
FIGURE 13.1: OVERVIEW OF CHAPTER 13 .................................................................... 210
FIGURE 13.2: RISK MANAGEMENT PROCESS IN THE AUTOMOTIVE INDUSTRY (SCHUH, 2000, P. 181). .............................................................................................................. 213
FIGURE 13.3: DEVELOPMENT PROCESS FMEA AS AN EXTENSION TO TRADITIONAL PROCESS FMEA ................................................................................................................ 213
FIGURE 13.4: RISK MANAGEMENT WITH A COLLABORATIVE PROJECT SCORECARD ......... 217
FIGURE 13.5: RISK OCCURRENCE AND CPS RISK MANAGEMENT PROCEDURE ................. 218
FIGURE 13.6: CPS RISK MANAGEMENT CATEGORY EXTENSION ...................................... 218
FIGURE 14.1: STRUCTURE OF CHAPTER 14 .................................................................. 220
FIGURE 15.1: CMMI PROCESS AREAS AND MATURITY LEVELS ....................................... 226
FIGURE 15.2: PROCESS WORKFLOW “EXECUTE ESCALATION” (PROSTEP IVIP 2007A, P. 51) .......................................................................................................................... 231
FIGURE 17.1: STRATEGY MAP CPS WHITEBOARD ........................................................ 254

XVI
List of Tables
TABLE 2.1: THE FOUR WORLDS OF PM 2ND ORDER (SAYNISCH, 2007) .......................... 20
TABLE 4.1: COLLABORATION FRAMEWORK (NUNAMAKER ET AL., 2000) ............................ 50
TABLE 4.2: ORGANISATIONAL STRUCTURE OF PRODUCT DEVELOPMENT (PRASAD, 1996, P. 397) ........................................................................................ 54
TABLE 4.3: STRATEGIC ISSUES IN DISTRIBUTED DEVELOPMENT (NIDIFFER ET AL., 2005, P. 69) ................................................................................................................... 58
TABLE 4.4: ISSUES IN DISTRIBUTED DEVELOPMENT (NIDIFFER ET AL., 2005, P. 69) ........... 59
TABLE 4.5: TECHNICAL AND SECURITY ISSUES IN DISTRIBUTED DEVELOPMENT (NIDIFFER ET AL., 2005, P. 69) .............................................................................. 60
TABLE 5.1: RESEARCH PARADIGMS (GUBA AND LINCOLN, 1994) AND (MCPHAIL AND PERRY, 2002) ................................................................................................................... 76
TABLE 5.2: SELECTION OF AN APPROPRIATE RESEARCH METHODOLOGY (YIN, 2002) ........ 78
TABLE 6.1: KEY PERFORMANCE INDICATORS OF A BSC COMPARED TO A PROJECT SCORECARD ....................................................................................................... 110
TABLE 6.2: KPIS FOR A PROJECT SCORECARD WITH RESPECT TO TYPE, CALCULATION METHOD, AND ESTIMATION EFFORT. ...................................................................... 110
TABLE 6.3: OTHER KPIS FOR A PROJECT SCORECARD WITH RESPECT TO TYPE, CALCULATION METHOD, AND ESTIMATION EFFORT. ................................................. 111
TABLE 8.1: INTRODUCTORY QUESTION RESULTS (QUESTION 1-6) ................................... 154
TABLE 9.1: PROJECT RESULTS LAUNCH MANAGEMENT CPS .......................................... 173
TABLE 9.2 PROCESSES LAUNCH MANAGEMENT CPS ..................................................... 173
TABLE 9.3: COLLABORATION LAUNCH MANAGEMENT CPS ............................................. 174
TABLE 9.4: LEARNING AND DEVELOPMENT LAUNCH MANAGEMENT CPS ......................... 174
TABLE 9.5: PROJECT RESULTS CHANGE MANAGEMENT CPS ......................................... 175
TABLE 9.6: PROCESSES CHANGE MANAGEMENT CPS ................................................... 175
TABLE 9.7: COLLABORATION CHANGE MANAGEMENT CPS ............................................ 176
TABLE 9.8: LEARNING AND DEVELOPMENT CHANGE MANAGEMENT CPS ......................... 176
TABLE 12.1: MAPPING OF PSC OBJECTIVES WITH PROJECT EXCELLENCE CRITERIA ....... 202
TABLE 12.2: MAPPING OF CPS OBJECTIVES WITH PROJECT EXCELLENCE CRITERIA ....... 207
TABLE 17.1: USA WORKSHOP AGENDA ........................................................................ 253

XVII
Nomenclature
AIAG Automotive Industry Action Group
AIPM Australian Institute of Project Management
APA American Planning Association
APM Agile Project Management
APQP Advanced Product Quality Planning
ARC Appraisal Requirements for CMMI
AS Active Sum
ASAM Association for Standardization of Automation and Measuring Systems
BMW Bayerische Motorenwerke
BSC Balanced Scorecard
C3PM Cross-Company-Collaboration Project Management
CCPM Critical Chain Project Management
CCTA Central Computer and Telecommunications Agency
CMMI Capability Maturity Model Integration
CPIM Collaborative Project Impact Matrix
CPM Critical Path Method & Collaborative Project Management
CPS Collaborative Project Scorecard
CPSM Collaborative Project Strategy Map
DFA Design for Assembly
DFM Design for Manufacturing
DIN Deutsches Institut fuer Normung
DMU Digital Mock Up
EDM Engineering Data Management
EFQM European Foundation for Quality Management
GM General Motors
GPM German Project Management Association
IAO (Fraunhofer)
IPMA International Project Management Association
IRNOP The International Research Network on Organizing by Projects
ISO International Organisation for Standardization
IT Information Technology
JIS Just in Sequence
JIT Just in Time

XVIII
KGI Key Goal Indicator
KI Key Indicator
KPI Key Performance Indicator
LOB Line of Balance
MbO Managing by Objectives
MbP Managing by Policy
MOST Mission, Objectives, Strategies, and Tactics
NGO Non-governmental Organisation
OEM Original Equipment Manufacturer
OGC Office of Government Commerce
OSM Office of Strategy Management
PA Process Area
PDM Product Data Management & Precedence Diagram Method
PDP Product Development Process
PE Project Excellence
PERT Program Evaluation and Review Technique
PMBoK Project Management Book of Knowledge
PMI Project Management Institute
PMO Project Management Office
PS Passive Sum
PSC Project Scorecard
QDX Quality Data Exchange
QFD Quality Function Deployment
ROCE Return on Capital Employed
ROI Return on Investment
SCS Strategic Collaboration Scorecard
SE Simultaneous Engineering
SIG Special Interest Group
SPICE Software Process Improvement and Capability Determination
SPSC Strategic Partnership Scorecard
SPSM Strategic Project Strategy Map
SWOT Strengths, Weaknesses, Opportunities, and Threats
TQM Total Quality Management
VDA Verband der Automobilindustrie
WBS Work Breakdown Structure
XIX
Publications
Conference proceedings:
Niebecker, K., Eager, D. and Kubitza, K. (2007), “A strategy based scorecard for cross-
company project management in the automotive industry, Proceedings of the ICAN
Conference, 29th -30th November 2007, Sydney, Australia.
Niebecker, K., Eager, D., Kubitza, K. and Plischke, D. (2008), “Integrating a
collaborative management model into a project scorecard for efficient cross-company
project management, Proceedings of the AIPM Conference, 12th – 15th October 2008,
Australian Institute of Project Management, Canberra, Australia.
Niebecker, K. and Wagner, R. (2008), “Effizientes Steuern in unternehmens-
übergreifenden Projektstrukturen mit der Collaborative Project Scorecard“,
Proceedings of the International German Project Management Forum, PMForum, 22nd -
23rd October 2008, Wiesbaden, Germany.
Niebecker, K. and Plischke, D. (2008), “Collaborative Project Management (CPM) in
der Automobilindustrie“, Proceedings of the International German Project Management
Forum, PMForum, 22nd -23rd October 2008, Wiesbaden, Germany.
Niebecker K., Eager, D., Wagner, R. and Kubitza, K. (2008), “Efficient project
management and performance assessment of cross-company projects with a
collaborative project scorecard, Proceedings of the IPMA World Congress, 9th-12th
November 2008, International Project Management Association, Rome, Italy.
Journals:
Niebecker, K., Eager, D. and Kubitza, K. (2008), “Improving cross-company project
management performance with a collaborative project scorecard”, International Journal
of Managing Projects in Business, Emerald Group Publishing Limited, vol. 1, no. 3, p.
368-386.

XX
Magazines:
Wagner, R. and Niebecker, K. (2008), “Die Collaborative Project Scorecard (CPS) als
zentrales Tool zur Steuerung unternehmensübergreifender Projekte“,
projektMANAGEMENT aktuell, 2nd edition, Nuernberg, Germany.
Niebecker, K, Wagner, R. and Plischke, D. (2008), “Unternehmensuebergreifende
Zusammenarbeit verbessern – die Collaborative Project Scorecard (CPS)“,
ProjektMagazin, edition 18/2008, Germany.

1
1 Introduction
The number of project oriented organisations has globally increased and the impact of
successful projects on the profit-loss status has been widely recognised. The
heightened pressure to ensure the reduction of costs and shorter product development
life cycles has lead to a complex network of virtual teams that work together around the
globe (Rad and Levin, 2003).
Many industry sectors have gone through a structural change towards complex project
networks where project teams are geographically dispersed and several industry
partners are involved in the development, production or sales of new products. Due to a
steadily growing competition in the market, the number and percentage of automotive
suppliers contributing to the value creation chain has highly increased and will still
continue to rise. Therefore, cross-company projects and virtual teams have become
essential to the future success of a car manufacturer (Hab and Wagner, 2006).
Organisations and associations within the industry have already begun to develop
standardised methods and processes to improve the efficiency and effectiveness of
cross-company project management. However, many problems are still not solved and
new methods are required to address the industry’s challenges, difficulties, and
opportunities of today and tomorrow.
The development and validation of a strategy based method to plan, monitor, and
control collaborative and cross-company projects in the automotive industry was part of
a research project at the Faculty of Engineering and IT of the University of Technology,
Sydney. The research activities were primarily conducted at the BMW Group facilities in
Germany and the USA but also in collaboration with the Automotive Chapter of the
German Project Management Association (GPM e.V.) and the ProSTEP iViP
Association in Darmstadt. The method adopted was the Collaborative Project Scorecard
(CPS), a concept that includes procedures and tools that aim to improve the planning,
monitoring and control of cross-company and collaborative projects based on identified
problems within the industry.
This chapter includes a short introduction to the research background and significance
with a focus on the automotive industry sector. The proposed method of a Balanced
Scorecard applied to project management is briefly described and followed by the

2
research objectives and relevant steps to achieve them. This is further discussed in
Chapter 5 in more detail. The last section of this chapter contains a description of the
thesis structure and illustrates where the reader can find the major elements of the
research project. Figure 1.1 illustrates the contents of this chapter.
FIGURE 1.1: INTRODUCTION CHAPTER
1.1 Research background and significance
Different time zones and cultural aspects are some of the reasons that limit
communication between project teams and make it difficult to maintain control on the
quality and scope of the projects. The use of virtual teams has become reality mainly
due to an improved communication technology as teams are no longer limited by
physical boundaries. Business opportunities to support strategic goals are not bound to
a geographic location anymore and resources can be chosen from a large pool with
immediate access. Virtual teams have a number of different names, such as modules,
clusters, learning networks, boundariless organisations, cross-company or collaborative
project teams, and are often classified into domestic, overseas, foreign or global project
environments (Gray and Larson, 2006). Project based activities are the fundament of
the virtual organisation as it means working in a limited time frame with geographically
dispersed teams. Complex products are often a result of a collective effort and centrally
managed by the product integrator who controls product contributors and suppliers
(Bourgault et al., 2002). However, next to product integrators or network managers who
control a distributed team there are also coequal partnerships such as joint venture
projects. Responsibilities are then distributed among various stakeholders and project
members.
Short description of
each chapter
Developments and
changes in the
automotive industry &
Balanced Scorecard for
project management
The Collaborative
Project Scorecard as a
logical next step
Difficulties in today’s automotive project
management & objectives and the necessary
steps for their achievement
1.1 Research background and
significance
1.2 Research objectives and
steps
1.3 Structure of thesis
3
The effects of a globalising world also change the practice of engineering, which is
partially due to the development of new communication technology. High competition on
the international market has forced many companies to distribute their teams around the
globe, and considerable advances in information technology have lead to a dispersed
product development, production, or sales. In addition, management functions are no
longer bound to a single location. Product design, as an example, will increasingly use
web-based systems with open standards that improve communication and engineering
prediction in early stages of the project. With this technology the time required for a
detailed product design can be decreased by a third (Dryer et al., 2003).
Especially, organisations with a focus on product development aim to reduce costs by
dislocating project teams to other countries and to gain and use region specific know-
how. The rise in geographically distributed projects is a trend that can be found in
different industry sectors. For example, the IT, construction, and automotive sectors
have experienced a dramatic change in their project structures in recent years but also
the financial sector has realised that it is necessary to focus on worldwide collaboration
as it is a key driver to sustainable project success (Deutsche Bank Research, 2005).
The IT industry began early with the use of virtual project teams but a lack of
standardised methods and processes to manage those teams has caused a high
number of project failures (Prikladnicki et al., 2002).
1.1.1 Changes and developments in the automotive in dustry
Unlike many other industry sectors, the automotive industry has begun with the
development of cross-company standards several years ago. This was caused by the
allocation of components, modules, and even whole vehicle models to external project
partners due to an increased international competition. Cost and time reduction, as well
as the relocation of know-how lead to a role change of the Original Equipment
Manufacturer (OEM) to a network manager (Hab and Wagner, 2006). The fundamental
change from top down processes to a network organisation and the distribution of
competencies required new methods and processes, which had to be developed
collaboratively. Whereas some of the difficulties could have been solved, such as
standards for quality data exchange (VDA QDX) others still require more focus and
industry commitment. A study of the Automotive Chapter of the German Project
Management Association identified areas that require improvement for successful cross-
company project management. Next to general frameworks for cultural differences,

4
individual capabilities and the clarification of project goals are some of the areas that
have an impact on project performance and are still not sufficiently addressed by the
automotive industry (Wagner and Hab, 2006). Ambiguously defined goals, low
transparency of project structures, inadequate allocation of responsibilities, and
insufficient integration of project stakeholders followed by a missing alignment of project
goals with business strategies are often caused by differing interests of the participating
companies (Pander and Wagner, 2005). These problem areas need more industry
attention and fundamental research to overcome present and future constraints of
cross-company project management. A detailed analysis of cross-company project
management difficulties with a focus on the automotive industry can be found in
Chapter 4.
1.1.2 The Balanced Scorecard approach to project ma nagement
The Balanced Scorecard is a management system that incorporates a balanced set of
financial and non-financial measures and translates “a business unit’s mission and
strategy into tangible objectives and measures” (Kaplan and Norton, 1996, p. 10).
Therefore, it is a strategic management system that manages strategy over the long run.
A project oriented organisation implements its strategies with initiatives and projects and
often categorises its units in program, project portfolio, and project management
divisions. Whereas project portfolio management is on a strategic level, program and
project management is on an operative one. Although, the Balanced Scorecard has
been demonstrated to be an efficient concept to manage a business (Kaplan and
Norton, 2001), its application to project management by translating a project strategy
into project objectives and measures has been investigated by only few researchers.
However, it could be demonstrated that the performance of project teams can be
improved by an application of a Balanced Scorecard to project management (Norrie and
Walker, 2004). Furthermore, the project oriented Balanced Scorecard refocuses the way
projects are managed as project and internal business processes are aligned with the
“core values and practices of the organisation” (Stewart, 2001, p. 47). Additionally,
project managers begin to understand the impact of a project’s success on their
organisation and realise the interdependency to success between the project, project
portfolio, and organisation. Chapter 5 further describes the current research progress on
the application of a Balanced Scorecard to project management which is often called
the Project Scorecard (PSC).
5
Due to the increasing number of distributed project teams, the application of the
Balanced Scorecard to cross-company and collaborative projects is a consequent step
towards the future demands of project management. The definition of commonly agreed
project goals and measures that are aligned with each company’s project strategy is
relevant to the future success of both project partners. Research is necessary to
investigate the advantages, disadvantages, and limitations of this approach, and to
develop a set of methods that helps the companies to implement and operate the
concept that is, henceforward, called the Collaborative Project Scorecard (CPS). In
2002, some researchers believed it was “clearly too early in the investigation process to
claim that a comprehensive list of metrics has been, or can be, established” for an
application of the Balanced Scorecard to distributed project management (Bourgault et
al., 2002, p.4), however, since then Norrie and Walker (2004) have contributed to a
significant development of the concept that provides a fundament to proceed with a
cross-company application. Performance measurement of virtual teams is essential to
evaluate the status and progress of a distributed project. A strategic alignment enables
the commitment of a target system for a networked project environment. The application
of a CPS is a logical consequence that has not been discussed in current literature yet
(Horvath, 2003). Therefore, the development of the CPS is the main element of this
research project. Chapter 4 includes a detailed analysis of existing research related to
the Collaborative Project Scorecard.
The objectives of the CPS research project were derived from the identified industry
demand to develop a new concept that incorporates the definition of common project
goals, ensures the alignment of these goals with business strategies, integrates
stakeholders, and enables efficient monitoring and control of cross-company projects.
The results of a BMW internal analysis, interviews, and an automotive study conducted
by the Automotive Chapter of the GPM e.V. were the foundation of the research
questions and objectives. Subsequent workshops, surveys, and interviews supported
the development of the CPS methodology.
1.2 Research objectives and steps
A literature review of cross-company project management and an analysis of interviews
within the automotive industry identified major difficulties and weaknesses in project
management methods, practices and procedures. Some of them are deficiencies in
defining and clarifying project goals, low project transparency and flexibility in project
6
organisation, and a different understanding of applied technologies that impedes
collaboration in the vehicle development. Whereas some of these results are based on
an automotive study conducted by the GPM e.V., the following aspects are a short
summary of the deficiencies according to an internal study and additional interviews at a
major German OEM as part of this research project:
• Deficiencies in defining and clarifying project goals.
• Low transparency and flexibility in project organisation.
• Status of project maturity not clearly defined and evaluation difficult.
• Project management methods and processes are not entirely integrated.
• Project goals not clearly defined and aligned with business strategies.
• Stakeholders not sufficiently integrated.
• Undefined documentation processes.
• Low project transparency and cause-and-effect relationships not clear and not
transparent.
• Risk management methods of collaborative product development projects are
not sufficiently developed.
• Corrective action often not pre-defined.
• Methods and processes for monitoring and control of time, task, risks, resources,
scope, and communication management not sufficiently integrated.
The goal of this research project was to develop a methodology that addresses the
identified problems and creates opportunities to improve the management of cross-
company projects with a focus on planning, monitoring and control. This lead to the
definition of the following research objectives:
• Detailed identification of difficulties with a focus on the project phases of
planning, monitoring and control of cross-company projects in the automotive
industry.
• Development of a methodology that addresses the problems of:
- Low transparency and flexibility in project organisation.
- Defining and clarifying project goals.
- Alignment of project goals with business strategies.
- Stakeholder integration.
7
- Integrated monitoring and control of relevant project management areas,
such as time, task, risk, resources, scope, corrective action and target
management.
- Identification and evaluation of project status.
- Agreed corrective action and control measures.
After analysing the strengths and weaknesses of the Balanced Scorecard application to
project oriented organisations, the adaptation of the concept to a collaborative and
networked project environment was a logical step for a performance improvement of
cross-company and collaborative project management. The Project Scorecard (PSC)
has been demonstrated to improve performance of project teams and to align project
objectives with business strategies. Therefore, the development and implementation of
a Collaborative Project Scorecard (CPS) as a further step to improve cross-company
project management is the core of the research hypothesis. After the methodology was
developed it was then applied to an automotive project and adapted to the requirements
of an automotive manufacturer followed by a partial implementation of the CPS
methodology with an IT solution. The results of the project application and IT
implementation were analysed and the concept extended with other management and
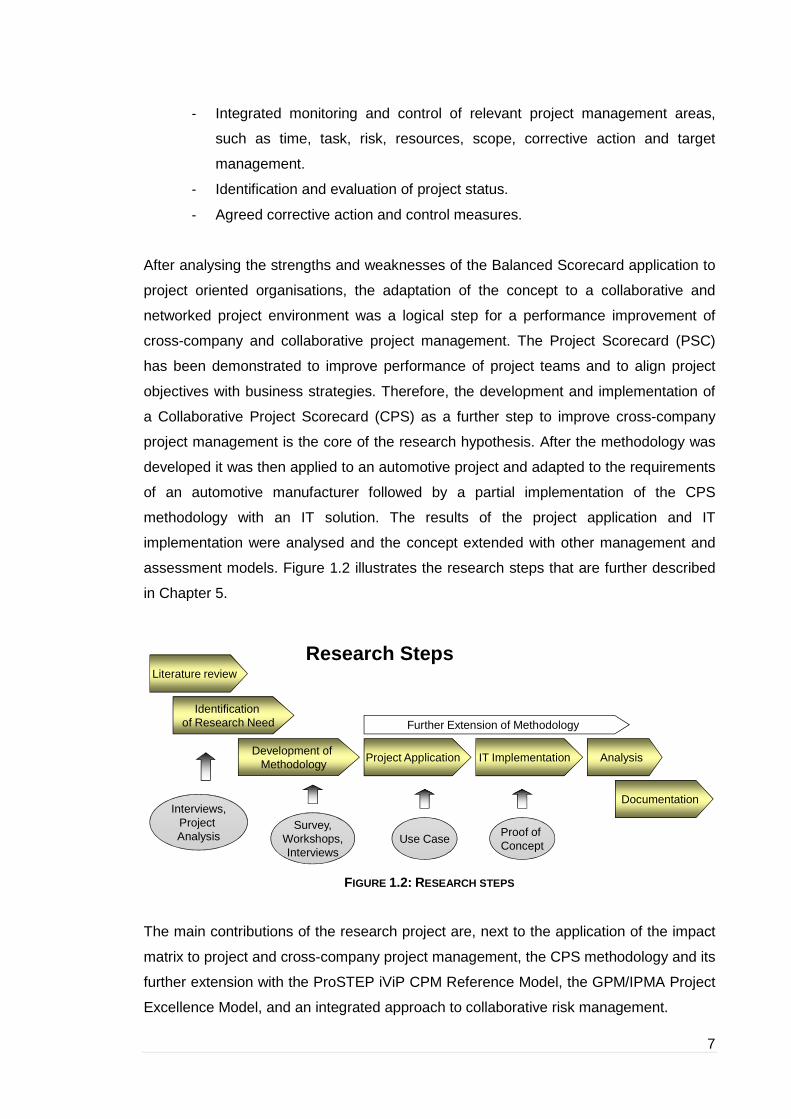
assessment models. Figure 1.2 illustrates the research steps that are further described
in Chapter 5.
FIGURE 1.2: RESEARCH STEPS
The main contributions of the research project are, next to the application of the impact
matrix to project and cross-company project management, the CPS methodology and its
further extension with the ProSTEP iViP CPM Reference Model, the GPM/IPMA Project
Excellence Model, and an integrated approach to collaborative risk management.
Literature review
Identification of Research Need
Project ApplicationDevelopment of
MethodologyIT Implementation Analysis
Interviews,Project Analysis
Survey,Workshops,Interviews
Use CaseProof of Concept
Documentation
Research Steps
Further Extension of Methodology

8
1.3 Structure of thesis
The thesis is structured into four major parts. The first part is the introduction to the
research topic (Chapter 1), to the theoretical background of project management in
general (Chapter 2), and to project management in the automotive industry in particular
(Chapter 3). Both chapters identify recent difficulties in project management and
illustrate why cross-company projects have become significant for an organisation’s
success. Figure 1.3 illustrates how the thesis is structured with respect to the chapters.
FIGURE 1.3: STRUCTURE OF THESIS CHAPTERS
An introduction to cross-company project management, difficulties and developments in
the automotive industry are presented in Chapter 4. This leads to the assumption that
the Balanced Scorecard concept may provide an efficient and effective approach to
enhance project management by an application on a project management and cross-
company project management level and is described in Chapter 6. This chapter also
includes a literature review of existing scorecard approaches to project and cross-
company project management and includes the evaluation of the demand for the
development of a sophisticated concept for collaborative projects based on the
Balanced Scorecard.
Structure of Chapters
1. Introduction
2. Theoretical background to
project management
3. Project management in
the automotive industry
9. The CPS for an
automotive
supplier and OEM
4. Cross-company project
management
5. Research methodology
and plan
6. Balanced Scorecard and
project management
7. The concept of the
Collaborative Project Scorecard
8 . The CPS for
automotive projects
10. CPS IT
Implementation
11. Integrating a
Collaborative Model
12. Assessing
performance
13. Collaborative risk
management
14. Conclusion

9
The scientific contribution of the research area begins with Chapter 6, e.g. with the
application of an impact matrix for developing a project strategy map. The research
approach, methodology, and hypothesis can be found in Chapter 5.
The main elements of the concept developed in this research, the Collaborative Project
Scorecard, are illustrated in Chapter 7. Based on those main elements further concept
development results within the automotive industry are documented in Chapter 8
including the results of the GPM e.V. Automotive Chapter workshops, surveys, and
interviews. The results of an application of the CPS concept to a collaborative project of
an OEM and a supplier in the USA are presented in Chapter 9 including a detailed
discussion about its benefits and limitations. Experiences with an IT implementation as
part of a proof of concept can be found in Chapter 10.
Finally, the CPS concept was extended with several other management methods. The
integration of a collaborative project management reference model (ProSTEP iViP CPM
Reference Model) to create collaboration relevant KPIs and objectives (Chapter 11), and
the integration and modification of a project assessment model (Project Excellence
Model) for cross-company projects (Chapter 12) is followed by a chapter about the
opportunities and concept ability to integrate project risk management methods for
improved efficiency due to the mitigation of collaborative risks (Chapter 13). The last
chapter includes a final conclusion and a recommendation on future research relevant
to ensure a sustainable application and improvement of the CPS concept.

10
2 Theoretical background to project management
Project management has developed from different fields of application since the
development of human made tools and buildings. Theoretical approaches have been
diverse and often are a competitive advantage of an organisation. This chapter gives an
overview of existing and future project management methods that are relevant to
understand the classification of the CPS concept presented in Chapter 7. This chapter
begins with a short introduction to the history of project management and its relation to
management science (Figure 2.1).
FIGURE 2.1: OVERVIEW OF CHAPTER 2
This is followed by a definition of projects and project management including traditional,
conventional, and modern approaches, such as agile project management and project
management 2nd order. Some recent developed methods and tools in project
management science are illustrated and activities of project management associations
included. Finally, the strategic approach to project management by strategy focussed
organisations complement this chapter.
2.1 History of project management
Projects have been undertaken for millennia including the ancient Egyptians who
constructed the pyramids already 4500 years ago. Sun Tzu wrote about strategy and
planning nearly 2500 ago that every battle is a project to be first won, and then fought.
In the latter half of the 20th century, people started to talk about project management.
Reference class
forecasting and current
activities of PM
associations
Traditional and modern
approachAgile and PM 2nd Order
2.1 Historical background
and relation to management
science
2.2 Definition of projects and
project management
2.3 Project management
methods and tools
2.4 Strategy and project
management

11
Beginning with the industrial revolution, management science evolved through the 19th
and 20th centuries. Various processes and techniques were developed, such as the
Gantt Chart by Henry Gantt in 1917, the flow-line scheduling in the 1930s that was used
to schedule the construction of the Empire State Building, and the Line of Balance
(LOB) technique developed by the Goodyear Company in the 1940s and later adopted
by the U.S. Navy for programming and control of repetitive and non-repetitive projects.
Construction, engineering, or defence are some of the early fields of project
management applications. With Henry Gantt the discipline became an accepted field of
science.
The modern era of project management started in the 1950s when project managers
used Gantt charts, the Program Evaluation and Review Technique (PERT), the Critical
Path Methods (CPM), and other new methods to manage time, tasks, or costs. Whilst
CPM and PERT use the same general approach (both include the activity-on-arrow
network diagram), PERT has a focus on time as the key variable, whereas CPM fixes
time and varies the cost of achieving the target time.
The invention of the “iron triangle” that includes cost, time and output by Martin Barnes
in 1969 in the UK supported a relatively precise cost and scope control. With the
foundation of the Project Management Institute (PMI) in 1969, an association to serve
the interests of the industry, processes and techniques were documented and published
in the Guide to the Project Management Body of Knowledge first in 1981.
2.1.1 Relation to management science
Management science evolved in the 19th and 20th centuries in response to an upcoming
increase of innovation in business and society. The origin of project management can
be traced back to the protestant reformation of the 15th century when the Protestants
and later the Puritans introduced ideas that included reductionism, individualism, and
the protestant work ethic. These ideas were later incorporated into two key philosophies:
the Liberalism and the Newtonianism. Liberalism included the general ideas of
capitalism and the division of work. Figure 2.2 shows the development of project
management since the time of the Puritanism (Whitty, 2007).

12
FIGURE 2.2: PURITANISM INFLUENCING TODAY ’S PROJECT MANAGEMENT (WHITTY, 2007)
Newtonianism marked the time of scientific enquiry and Newton understood the world as
a harmonious mechanism that is controlled by a universal law. Robert Owen and
Charles Babbage realised in the 19th century that people should not be considered as
simple machinery and, therefore, introduced improved working conditions.
All of these philosophies had an impact on the scientific management theories by Taylor
who was undoubtedly influenced by Quaker who came from Puritanism. Taylor worked
in a capitalistic society and applied the scientific approach of Newtonianism when he
developed the classical school of scientific management. Further insights into the
classical school, scientific management, the late evolved human relations school in the
1920s that was followed by the human resource school and systems theory (1940s) and
contingency view in the 1960s has been extensively analysed by Weaver (Weaver,
2007). Weaver argues that since the 1960s, new management viewpoints have
emerged. Some of them include quality management, reengineering, chaos theory, and
project/program and portfolio management.
2.2 Defining projects and project management
When it comes to the definition of projects and project management, different ways that
describe the discipline can be found in the literature. The next two sections include the
traditional and modern definitions of project and project management. One great
difference of the modern view from the traditional one is that projects are usually
managed in an open system where uncertainty limits the possibility of planning a project
and where complex dependencies can lead to unforeseen events that cannot longer be
managed by risk management alone.
Puritanism
Newtonianism
Liberalism
TaylorismProject
Management
Influence

13
2.2.1 Projects
According to Gray and Larson (2006, p.4 ) “a project is a complex, non-routine, one-time
effort limited by time, budget, resources, and performance specifications designed to
meet customer needs”, whereas the satisfaction of the customer needs are rated as the
major goal of an organisation. The main characteristics of a project are defined as
having an established objective, a defined life span with a beginning and an end,
involvement of departments and professionals, a unique task, and specific cost, time,
and performance requirements.
According to the Project Management Body of Knowledge (PMBoK), a project is defined
as temporary with a beginning and an end, and it creates unique products, services, or
results with progressive elaboration (PMI, 2005). Kerzner (2003) defines a project as
any series of activities and tasks with a specific objective to be completed within certain
specifications, with a defined start and end date, limited funds, and that include human
and nonhuman resources, and have a multifunctional character.
There are several aspects that influence a project during its life time. Rietiker (2008)
understands projects as open systems and as an integrated part of a greater whole. He
emphasises that we need to change our understanding of projects from closed systems
to open systems as we can only understand the characteristics of a project in the
context of its environment (Gharajedaghi, 1999). He also argues that a selective
perception of a project leads to a selective action in project management (Figure 2.3).
FIGURE 2.3: SELECTIVE PERCEPTION OF PROJECTS (RIETIKER, 2006, P. 24)
Rietiker (2006) identified in his research critical factors that have an impact on projects.
Stakeholder, suppliers, competition, clients, project members, government, NGOs and
Project Context(project sponsor, risks, internal and external impacts)
Definition and Planning
Control Closure
Product Development
Project
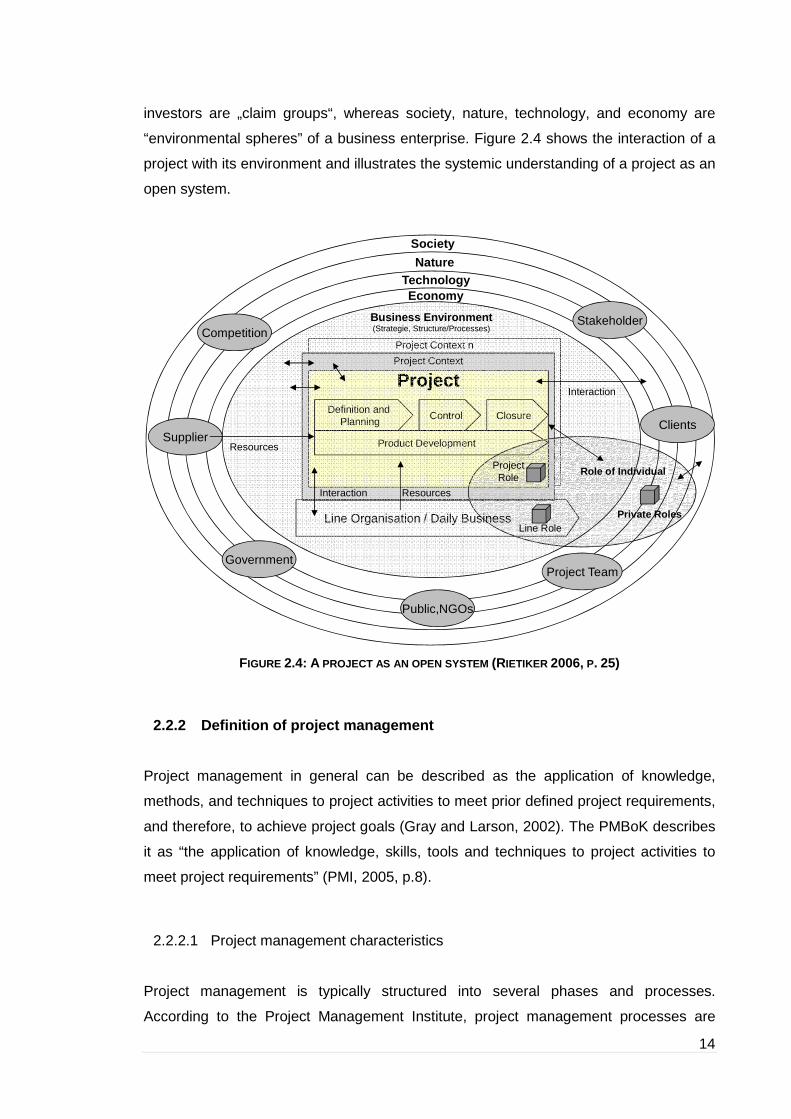
14
investors are „claim groups“, whereas society, nature, technology, and economy are
“environmental spheres” of a business enterprise. Figure 2.4 shows the interaction of a
project with its environment and illustrates the systemic understanding of a project as an
open system.
FIGURE 2.4: A PROJECT AS AN OPEN SYSTEM (RIETIKER 2006, P. 25)
2.2.2 Definition of project management
Project management in general can be described as the application of knowledge,
methods, and techniques to project activities to meet prior defined project requirements,
and therefore, to achieve project goals (Gray and Larson, 2002). The PMBoK describes
it as “the application of knowledge, skills, tools and techniques to project activities to
meet project requirements” (PMI, 2005, p.8).
2.2.2.1 Project management characteristics
Project management is typically structured into several phases and processes.
According to the Project Management Institute, project management processes are
Project Context n
Project Context
ProjectDefinition and
PlanningControl Closure
Product Development
Line Organisation / Daily Business
Business Environment(Strategie, Structure/Processes)Competition
Supplier
Government
Public,NGOs
Project Team
Clients
Stakeholder
ResourcesInteraction
Interaction
Resources
Private Roles
Project Role
Line Role
Role of Individual
TechnologyEconomy
Nature
Society
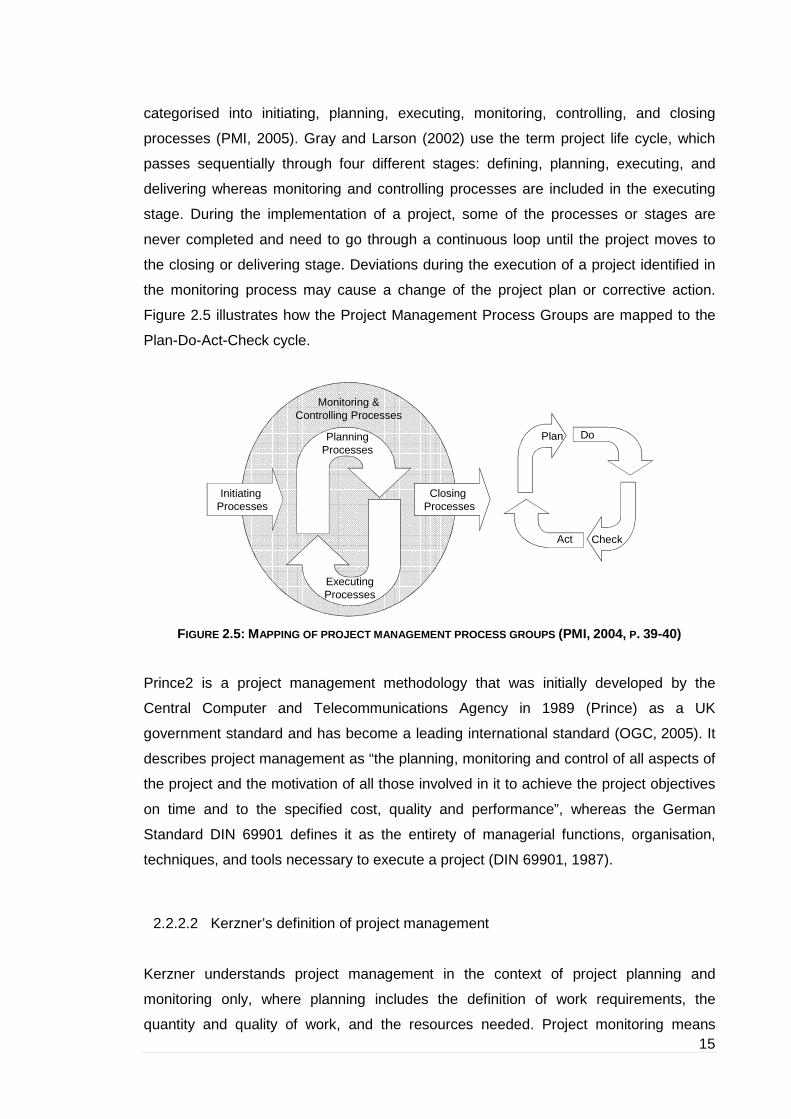
15
categorised into initiating, planning, executing, monitoring, controlling, and closing
processes (PMI, 2005). Gray and Larson (2002) use the term project life cycle, which
passes sequentially through four different stages: defining, planning, executing, and
delivering whereas monitoring and controlling processes are included in the executing
stage. During the implementation of a project, some of the processes or stages are
never completed and need to go through a continuous loop until the project moves to
the closing or delivering stage. Deviations during the execution of a project identified in
the monitoring process may cause a change of the project plan or corrective action.
Figure 2.5 illustrates how the Project Management Process Groups are mapped to the
Plan-Do-Act-Check cycle.
FIGURE 2.5: MAPPING OF PROJECT MANAGEMENT PROCESS GROUPS (PMI, 2004, P. 39-40)
Prince2 is a project management methodology that was initially developed by the
Central Computer and Telecommunications Agency in 1989 (Prince) as a UK
government standard and has become a leading international standard (OGC, 2005). It
describes project management as “the planning, monitoring and control of all aspects of
the project and the motivation of all those involved in it to achieve the project objectives
on time and to the specified cost, quality and performance”, whereas the German
Standard DIN 69901 defines it as the entirety of managerial functions, organisation,
techniques, and tools necessary to execute a project (DIN 69901, 1987).
2.2.2.2 Kerzner’s definition of project management
Kerzner understands project management in the context of project planning and
monitoring only, where planning includes the definition of work requirements, the
quantity and quality of work, and the resources needed. Project monitoring means
Monitoring & Controlling Processes
Initiating Processes
Planning Processes
Executing Processes
Closing Processes
Plan Do
CheckAct
16
tracking the progress, comparing actual outcome to predicted outcome, analysing the
impact, and making adjustments. A successful project is described as achieved within
time and cost at desired performance or technology level, utilising assigned resources
effectively and efficiently, and accepted by the customer.
Kerzner lists a number of benefits from project management but also identified threats to
a project, such as project complexity, organisational restructuring, project risks, changes
in technology, forward planning and pricing, or customer’s special requirements and
scope changes. He realised that many events cannot be foreseen and describes project
management in the following sentence: “project management is the art of creating the
illusion that any outcome is the result of a series of predetermined, deliberate acts
when, in fact, it was dumb luck” (Kerzner, 2003, p. 4). He understands that project
management is designed to increase the efficiency how work is done and that
companies need to be structured to allow a horizontal and vertical communication flow
to achieve successful projects. Based on that assumption his definition is: “project
management is the planning, organizing, directing, and controlling of company
resources for a relatively short-term objective that has been established to complete
specific goals and objectives. Furthermore, project management utilises the systems
approach to management by having functional personnel (the vertical hierarchy)
assigned to a specific project (the horizontal hierarchy)” (Kerzner, 2003, p. 4).
2.2.3 Modern project management
Modern project management is characterised by the assumption that our environment is
unstable and events are no longer entirely predictable. Traditional project management
in contrary assumes that project life cycle phases are recognizable, tasks completed in
sequence, and tools well understood.
In contrast to modern project management, traditional project management is often
limited due to the fact that projects do not follow a sequential flow and that clients
experience difficulties in completely stating all relevant requirements in an early stage of
the project.
This model is called the waterfall model and shown in Figure 2.6.

17
FIGURE 2.6: THE WATERFALL MODEL (HASS, 2007, P. 1)
The change towards complex project structures that are interconnected and
interdependent has caused a constant change of the environment and the
understanding of a project as an open system. Project alliances with strategic suppliers,
rapidly changing technologies and global competition have had an impact on modern
project management (Hass, 2007). Especially, the IT industry has experienced a
dramatic change due to geographically dispersed software development teams and has
searched for new solutions to work more efficiently under these new circumstances.
Agile project management was one of the answers to complex and rapidly changing
project environments in the IT industry, whereas project management second order
(PM 2nd Order) is a new approach that aims to extend traditional project management
with new methods based on the evolutionary and chaos theory, and other theories such
as the theory of complex systems (Saynisch, 2007).
2.2.3.1 Agile project management
Agile project management (APM) includes an iterative process where project
stakeholder and members of a product development project (usually a software product)
actively work together to identify the objectives and prioritise the functionality of a
product. Software development projects are well known for constant change requests,
and agile methods are necessary to ensure the participation of the customers,
Waterfall Model
Business
Requirements
Systen
Requirements
Design
Construction
Test
Deliver
Operation &
Maintenance

18
designers, and developers even when they are geographically dispersed. The iterative
planning and development cycles enable the project team to constantly evaluate the
product development and integrate feedback from the project stakeholders (in Figure
2.7 shown as review lessons learned). Lessons are learned from each iteration step and
working methods can be improved.
The agile development model shown in Figure 2.7 and illustrates the iterative approach
of this method.
FIGURE 2.7: AGILE DEVELOPMENT MODEL (HASS, 2007, P. 3)
APM has emerged directly from software development, unlike traditional project
management that has its origins in the construction, engineering or defence industry.
Several key elements are included in APM and are called agile management
components. Visual control, co-located high performance teams, test-driven
development, collaborative development, feature-driven development, leadership and
collaboration rather than command and control, move from cost to revenue focus, and
lessons learned are the components and part of the fundamental techniques of APM
(Hass, 2007).
2.2.3.2 Project management second order
Based on new insights into social science, such as the evolutionary and chaos theory,
theory about self-organisation, synergetic, brain research, social systems theory, and
Agile Development Model
Initial Requirements and
Architecture ModelsI
Iteration #1
Iteration #2
Iteration #3
Iteration #1
Iteration #n
Review
Lessons Learned
Review
Lessons Learned
Review
Lessons Learned...

19
theory of complex systems, project management 2nd order (PM 2nd order) is the result of
the research programme “beyond frontiers of traditional project management”
(Saynisch, 2004). The rapid increase of complex and new technologies, innovations in
industrial and social sciences were the reason to find new methods to minimise an
increasing loss in project management efficiency.
PM 2nd order extends the traditional concept with an approach that is predicated on
systemic-evolutionary (self-organizing), system-technological (constructive), and
determined principles. It integrated the traditional approach (PM 1st order) with the
research results of the research programme mentioned above. During 12 years of
research from 1990 to 2002 several scientists have explored and developed theories
that support the management of complex projects and are an integrated part PM 2nd
order. PM 2nd order assumes that traditional project management is based on linear,
mechanical, mono-causal, non-dynamic structures and underlie the Cartesian causality
and Newtonian logic. The simultaneous and synchronous acting of evolutionary
dynamics, antipoetic systems, chaotic and self-organisational processes are not
considered in traditional project management. To overcome the difficulties of our new
environment, PM 2nd order integrates two cybernetic cycles, the cybernetic 2nd order
(observer/manager inside of the system) based on the trans-classical logic
(Jaafari, 2003) and the cybernetic 1st order (observer/manager outside of the system)
that is based on the classical logic of Aristotle. The result is a dual cybernetic and
complementary cycle principle that is shown in Figure 2.8.
FIGURE 2.8: ARCHITECTURE AND PROCESS MODEL PM 2ND ORDER (SAYNISCH, 2007, P. 7)
Complexity ManagementCybernetic 2nd order – Dynamic – Catalyst
Systemic-evolutionary – Self-organization
Traditional Project
ManagementCybernetic 1st Order – Command & Control
Hard Reality – Plan / Actual – Hard Acting
IDEAProject
Initiating
Project-/Product-ProcessesConfiguration and Realization of Project-Object/Product
Project-Executing and Expiration – Project-Dynamic
RESULTSProject
Closing

20
Four WORLDs describe the architecture of PM 2nd order and a detailed description of
each WORLD is shown in Table 2.1.
WORLD 1 Traditional project management and cybernetic 1st order:
• Techniques and acting as centre of control.
• Problem solving contents mostly linear and goal-oriented
information processing.
WORLD 2 Management of complexity and cybernetic 2nd order:
• High evolutionary dynamic, mastering of complex instabilities and
situations with self-organisation or self-reference.
• Relevant methods: communication, observing and perception of
project dynamics.
• Problem solving contents: consideration of system approach,
thinking in networks and circular processing control in the context of
influence.
WORLD 3 Universe of human behaviour:
• Behaviour of human being in groups and organisations are the
centre of control.
• Project culture is an important part of management.
• Logic of behaviour dominates, consideration of values, personal
attitudes, and personal interests.
• Methodological approaches include motivation, coaching,
reflections, learning support, leading with confidence and goals,
communication of visions.
WORLD 4 Universe of ground rules and ways of thinking:
• Thinking in cycles and adoption of principle of pilgrim steps (two
forward and one backward).
• Networked jumps between steps of problem solving are thinking
ways and acting principles.
• Ways of thinking and principles of acting influence other WORLDs.
TABLE 2.1: THE FOUR WORLDS OF PM 2ND ORDER (SAYNISCH, 2007)
WORLD 1 is represented by traditional project management and WORLD 2 by
complexity management. WORLD 3 is described by the universe of human behaviour,
and WORLD 4 by the universe of ground rules and ways of thinking.
Figure 2.9 illustrates the interaction of the four WORLDs and represents the systemic
architecture and process model of PM 2nd order.

21
FIGURE 2.9: SYSTEMIC ARCHITECTURE AND PROCESS MODEL OF PM 2ND
ORDER
(SAYNISCH, 2007, P. 8)
Saynisch (2007) further illustrates the potential use of PM 2nd order and its
implementation in different project types. Additionally, principles, methods, and
processes are described and demonstrated in a real life project.
2.3 Project management methods, tools, and standard s
The establishment of structures, frameworks, and tools to achieve reliable and efficient
project structures has lead to the development of several project management methods
and standards. The popularity of methodologies grew rapidly from the beginning of the
1970s until the 1980s but has shifted from organisations purchasing methodologies from
commercial vendors towards adopting the use of maturity models such as Capability
Maturity Model (Weaver, 2007). Well known models to measure the maturity of an
organisation are the Capability Maturity Model Integration (CMMI) developed by the SEI
in the US, P2MM Prince2 Maturity Model (OGC, UK), OPM3 Organisational Project
Management Maturity Model (PMI, USA), P3M3 Portfolio, Programme, and Project
Management Model (OGC, UK), P2M3 Programme and Project Management Model
(OGC, UK), PMMM Project Management Maturity Model (Kerzner, USA), or the German
WORLD 2
Complexity ManagementCybernetic 2nd order – Dynamic – Catalyst
Systemic-evolutionary – Self-organization
WORLD 1
Traditional Project ManagementCybernetic 1st Order – Command & Control
Hard Reality – Plan / Actual – Hard Acting
IDEAProject
Initiating
Project-/Product-ProcessesConfiguration and Realization of Project-Object/Product
Project-Executing and Expiration – Project-Dynamic
RESULTSProject
Closing
WORLD 3Collaborators / People
Behaviour – Project Culture
WORLD 4Foundations
Ways of
Thinking
Systemic
Views
Networking
Circular
Processes

22
Project Excellence Model (GPM/IPMA, Germany). All maturity models provide
processes or process models, such as the V-Modell XT that includes project
management methods, processes, and tools originally developed within the German
defence industry. The core of all methodologies is its process descriptions. The
processes are usually implemented by the consistent use of templates, forms and
software, and the methodology is supported and developed by a project management
office (PMO).
Next to methodologies and models there are also single methods for specific project
management areas, such as the critical path method that has a focus on project
planning, or tools such as the Work Breakdown Structure (WBS) that supports the
project manager to structure work packages and tasks. Appendix A includes a more
detailed description of the Capability Maturity Model Integration (CMMI), projects in
controlled environments (Prince2), the V-Modell XT, ISO 9000 Family (including
ISO 900), and earned value management and earned value performance measurement.
2.3.1 Reference class forecasting
The reference class forecasting method was endorsed by the American Planning
Association (APA) in April 2005. This method is based on the theories of decision
making under uncertainty that won the 2002 Nobel Prise in economics.
Most of the project estimation is inaccurate and makes the project very risky. According
to research by Bent Flyvbjerg (2006), inaccuracy of the estimation is not derived from
the technical or imperfect data and model. He argues that if it was due to a lack of data
or imperfect data and models, then accuracy should be improved over time. Therefore,
substantial efforts have been made to improve data and estimation methods. The
explanation for the inaccuracy can be better understood when viewed in psychological
and political terms. Psychological explanation towards inaccuracy is the optimism bias.
Most of the estimators judge the future events in an optimistic way, probably due to
overconfidence and insufficiency in distributional information, and tend to underestimate
constraints that might occur in the actual performance. On the other hand, the political
explanation is a strategic misrepresentation, which means that most estimators
deliberately and strategically overestimate the benefits and underestimate the costs to
gain approval of their project. This behaviour is called planning fallacy as people
underestimate the costs, completion times and risks of planned action whereas they

23
overestimate the outcomes and benefits. The reference class forecasting method
bypasses the human bias and includes the optimism bias and strategic
misrepresentation that usually underpin the inaccuracy while making decisions under
uncertainty. It is a method to produce unbiased forecasts of human judgment that leads
to an increased accuracy of the forecasts compared to conventional forecasting
methods. In order to obtain unbiased forecasts and to cure the planning fallacy, the
method uses an outside view by applying the distributional information from other
projects similar to that being estimated (Flyvbjerg, 2006).
The reference class forecasting method in a project requires these three steps:
• Identification of a relevant reference class of past, similar projects. The class
must be broad enough to be statistically meaningful, but narrow enough to be
comparable with the specific projects.
• Establishing a probability distribution for the selected reference class. This
requires access to credible, empirical data for a sufficient number of projects
within the reference class to make statistically meaningful conclusions.
• Comparing the specific project with the reference class distribution, in order to
establish the most likely outcome for the specific project.
It is clear that the reference class forecasting method does not aim to forecast the
specific uncertain events that affect the project, but instead, it places the project in a
statistical distribution of outcomes from the class of reference projects. The method may
work well when it deals with the optimism bias as the root cause of inaccuracy.
Optimism bias is a self-deception, which means an honest mistake while forecasting.
Whereas, if the cause of inaccuracy is due to strategic misrepresentation, which means
the inaccuracy is deliberately made, the potential for reference class forecasting is low
as there is no interest to improve accuracy (Flyvbjerg, 2006).
2.3.2 Project management associations
Several associations and organisations have been founded to develop best practices,
standards, and new methods for more efficient and effective project management. Most
of these organisations act on an international level, whereas national organisations are
usually members of international associations that work together on a global level. The
two biggest international organisations are the Project Management Institute (PMI) in

24
the US and the International Project Management Association (IPMA) with its seat in
Switzerland. As an example, the German Project Management Association (GPM) and
the Australian Institute of Project Management (AIPM) are members of the IPMA. The
PMI has local chapters at several locations worldwide and consists of special interest
groups (SIG) that focus on industry specific areas such as the IT or financial sector.
Other associations are the International Research Network on Organising by Projects
(IRNOP) that was founded in 1993 and aims to connect researchers in countries all over
the world with a background in business, economics, or engineering and who have a
common interest in project organisations, projects or temporary systems.
2.4 Strategy and project management
Strategies and the implementation of strategic concepts have recently become more
important for business organisations. The expertise to implement strategies is an
essential competence to differentiate with competing enterprises and to ensure long-
term competitive advantage (Horvath and Partner, 2005). Despite an improvement in
strategy deployment due to further developments of methods and tools, there is still a
great need for action (Rietiker, 2008). According to a study of the Wharton Business
School and the Gartner Group, managers are educated in strategic planning but not in
its implementation. Other major structural and process related reasons are that strategy
implementation is considered as a task of middle and lower management, it takes more
time and human resources, and it is more complex than the development of a strategy.
Additionally, it is a long-term process and not a single and short-term feasible action
programme (Hrebiniak, 2005). Primarily, strategies are implemented by projects and
initiatives; therefore, the alignment of project goals with business strategies is an
essential step for an effective and efficient strategy implementation. Hrebiniak identified
four critical strategic planning aspects that influence its success:
• Solid planning and clearly focussed strategy.
• Business and departmental strategies need to be consistently and self-
supporting.
• Strategic goals need to be translatable into operative, measurable targets.
• Requirements of strategy and its successful implementation need to be
understood.

25
2.4.1 Creating a strategy-focused project organisat ion
Kaplan and Norton (2001) identified that organisations have difficulties in implementing
well-formulated strategies and that the execution of strategy is more important than the
quality of the strategy itself. They demonstrated that the Balanced Scorecard can help
organisations to overcome difficulties in executing their strategy and they defined five
principles that characterise an organisation as strategy focused. They also argue that
the Balanced Scorecard is a means to align and focus resources on strategy, such as
the executive team, business units, human resources, information technology, and
budgets as well as capital investments.
The five principles of a strategy focused organisation are “translate the strategy to
operational teams”, “align the organisation to the strategy”, “make strategy everyone’s
everyday job”, “make strategy a continual process”, “mobilise change through executive
leadership”, and are further described in Figure 2.10.
FIGURE 2.10: THE PRINCIPLES OF A STRATEGY FOCUSED ORGANISATION
(KAPLAN AND NORTON, 2001, P. 9)
Although, Kaplan and Norton’s theoretical work regarding the strategy focused
organisation is based on only four case studies, they argue that the “application and
performance breakthroughs are by no means limited to these examples, these
industries, or even the companies for which we served as consultants” (Kaplan and
Norton, 2001, p. 17).
Balanced
Strategy
Scorecard
Mobilize Change through
Executive Leadership-Mobilization
-Governance Process
-Strategic Management System
Make Strategy a
Continual Process-Link Budgets and
Strategies
-Analytics and
Information Systems
-Strategic Learning
Translate the
Strategy to
Operational Terms-Strategy Maps
-Balanced Scorecards
Align the Organization to
the Strategy-Corporate Role
-Business Unit Synergies
-Shared Service Synergies
Make Strategy Everone’s
Everyday Job-Strategic Awareness
-Personal Scorecards
-Balanced Paychecks
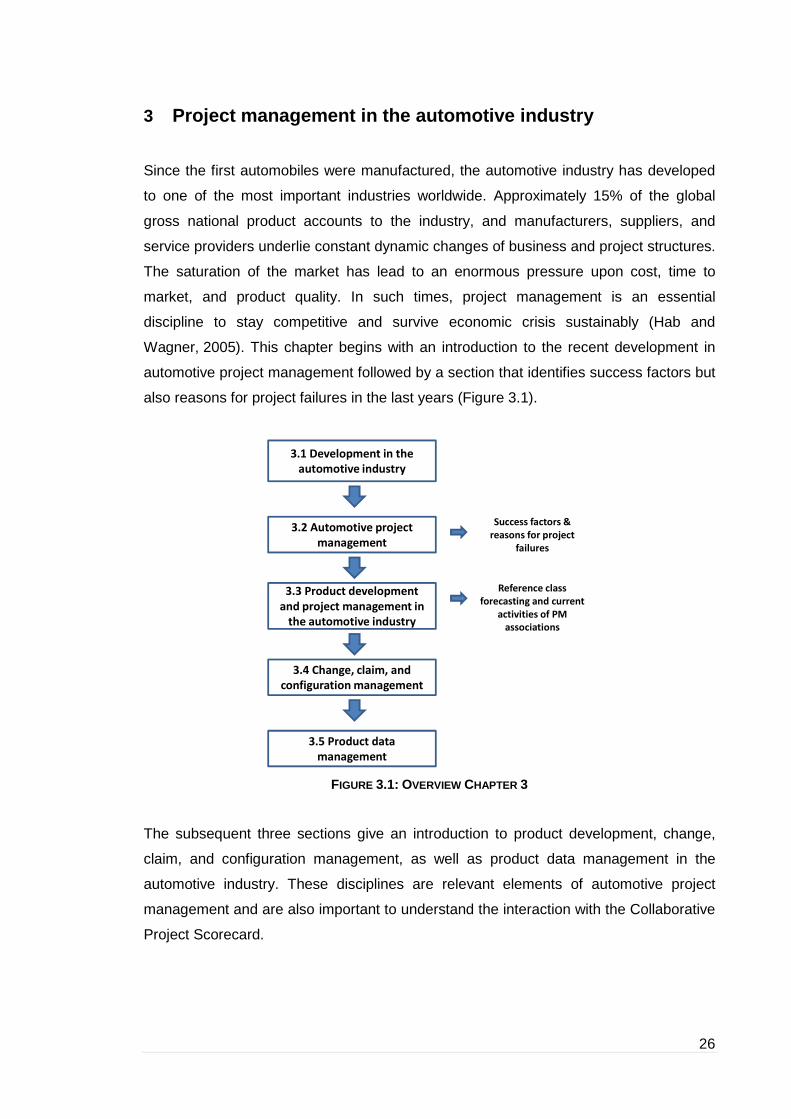
26
3 Project management in the automotive industry
Since the first automobiles were manufactured, the automotive industry has developed
to one of the most important industries worldwide. Approximately 15% of the global
gross national product accounts to the industry, and manufacturers, suppliers, and
service providers underlie constant dynamic changes of business and project structures.
The saturation of the market has lead to an enormous pressure upon cost, time to
market, and product quality. In such times, project management is an essential
discipline to stay competitive and survive economic crisis sustainably (Hab and
Wagner, 2005). This chapter begins with an introduction to the recent development in
automotive project management followed by a section that identifies success factors but
also reasons for project failures in the last years (Figure 3.1).
FIGURE 3.1: OVERVIEW CHAPTER 3
The subsequent three sections give an introduction to product development, change,
claim, and configuration management, as well as product data management in the
automotive industry. These disciplines are relevant elements of automotive project
management and are also important to understand the interaction with the Collaborative
Project Scorecard.
Reference class
forecasting and current
activities of PM
associations
Success factors &
reasons for project
failures
3.1 Development in the
automotive industry
3.2 Automotive project
management
3.3 Product development
and project management in
the automotive industry
3.4 Change, claim, and
configuration management
3.5 Product data
management
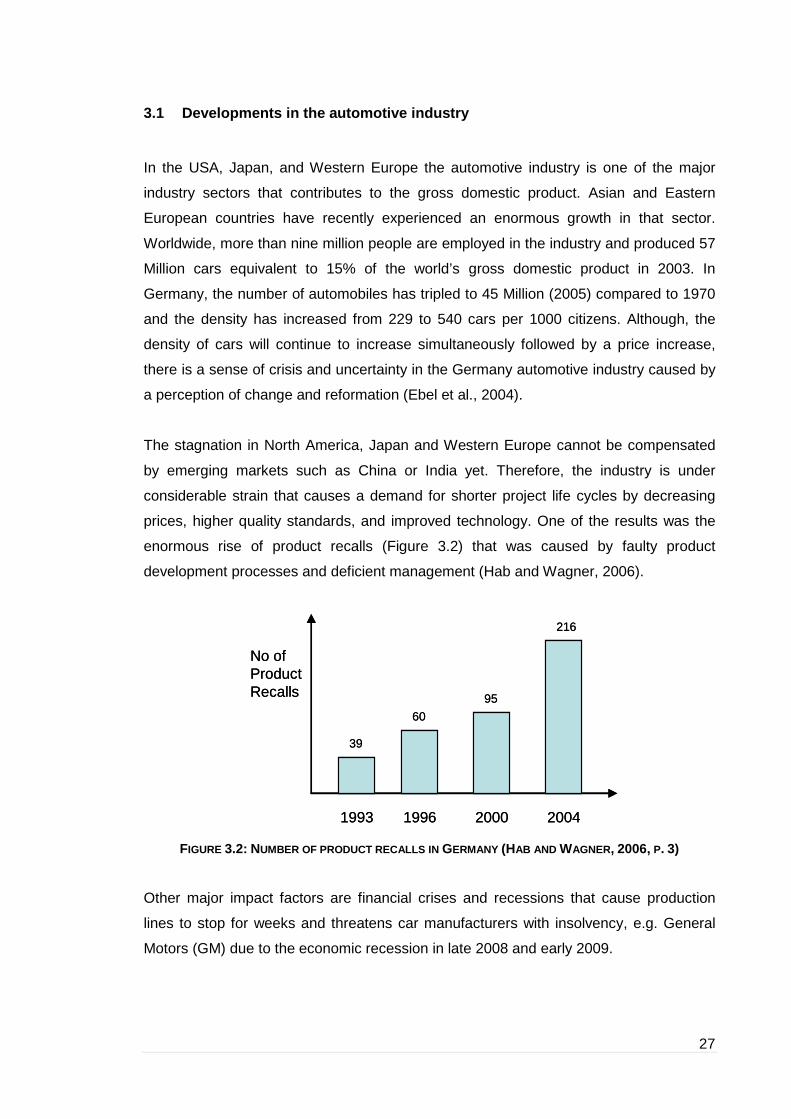
27
3.1 Developments in the automotive industry
In the USA, Japan, and Western Europe the automotive industry is one of the major
industry sectors that contributes to the gross domestic product. Asian and Eastern
European countries have recently experienced an enormous growth in that sector.
Worldwide, more than nine million people are employed in the industry and produced 57
Million cars equivalent to 15% of the world’s gross domestic product in 2003. In
Germany, the number of automobiles has tripled to 45 Million (2005) compared to 1970
and the density has increased from 229 to 540 cars per 1000 citizens. Although, the
density of cars will continue to increase simultaneously followed by a price increase,
there is a sense of crisis and uncertainty in the Germany automotive industry caused by
a perception of change and reformation (Ebel et al., 2004).
The stagnation in North America, Japan and Western Europe cannot be compensated
by emerging markets such as China or India yet. Therefore, the industry is under
considerable strain that causes a demand for shorter project life cycles by decreasing
prices, higher quality standards, and improved technology. One of the results was the
enormous rise of product recalls (Figure 3.2) that was caused by faulty product
development processes and deficient management (Hab and Wagner, 2006).
FIGURE 3.2: NUMBER OF PRODUCT RECALLS IN GERMANY (HAB AND WAGNER, 2006, P. 3)
Other major impact factors are financial crises and recessions that cause production
lines to stop for weeks and threatens car manufacturers with insolvency, e.g. General
Motors (GM) due to the economic recession in late 2008 and early 2009.
1993 200420001996
No of ProductRecalls
39
216
95
60
1993 200420001996
No of ProductRecalls
39
216
95
60

28
3.1.1 The role of project management in the automot ive sector
Since 1964, the number of independent manufacturers has decreased from 56 to 12
corporate groups with similar development in the supplier industry. According to a study
of the Mercer Management Consulting and the Fraunhofer Gesellschaft in Munich, the
number of suppliers will decrease from 5500 in 2002 to 2800 in 2015
(FAST 2015, 2004). The saturation of the market caused a development of numerous
new models, versions and special editions to attract customers. Whereas the strategy
has been successful for some manufacturers, it has also caused an increased
complexity within the product development processes and after-sales-services. Various
interaction and influences on project management need to be considered as project
management has to focus on the demands of the market and also the demands of a
chosen strategy. Strategy should clearly demonstrate which function is taken by project
management in a manner that all project members clearly understand the manager’s
decision. Project management plans and controls the operational execution of projects
by targeting the goals and considering respective cost and time lines. In order to fulfil
this task, several processes and organisational structures need to be coordinated.
Additionally, cultural prerequisites need to be created for an effective and efficient
collaboration of different business units or partner companies within the supply chain.
Figure 3.3 illustrates the interaction between impact of culture, strategy, structure, and
processes on project management, whereas “q” stands for quality, “t” for time, and “c”
for cost.
FIGURE 3.3: INTERACTION BETWEEN IMPACT FACTORS ON PROJECT MANAGE MENT
(WAGNER, 2009, P. 75)
Market
CultureStrategy
ProcessesProcesses
Structure
q
tc
Market
CultureStrategy
ProcessesProcesses
Structure
q
tc
q
tc

29
As the strategic challenges for manufacturers and suppliers increase, project
management also has to face new challenges and requirements to satisfy the growing
demands of customers in terms of quality, functionality, and cost of a vehicle. Not only
the newest technologies are requirements of the customers but also driving comfort,
safety, driving power, and low emission. This has lead to shorter development cycles
and a growing number of models.
3.1.2 Project management dimensions
High quality, lower prices, and decreasing budgets at shortened time to market cycles
limit the freedom of action of the manufacturers. In 2006 a research group of the
German Project Management Association performed a survey within the German
automotive industry to identify the current situation of major trends in project
management. More than sixty companies participated in the survey. Among those
companies were Audi AG, BMW AG, Daimler, and Volkswagen as OEMs, and Autoliv,
Dräxlmaier, Hella, and Siemens VDO as suppliers together with various service
providers. Based on the results of this survey, thirteen experts participated in intensive
interviews to verify the survey results and to give recommendations on how to improve
project management. Figure 3.4 shows the overall results in all dimensions of strategy,
innovation and learning, processes and standards, methods and tools, partnership,
employees, and leadership and categorised into “importance”, “existence”, and
“realization”.
FIGURE 3.4: GPM PROJECT MANAGEMENT SURVEY RESULTS
0
0.2
0.4
0.6
0.8Strategy
Processes & Standards
Methods & Tools
EmployeesLeadership
Partnership
Innovation & Learning
Importance Existence Realization

30
Although, all areas need improvement, innovation and learning needs more attention
according to the survey participants.
Figure 3.5 illustrates the performance of project management in the German automotive
industry, where approximately 70 % of the survey participants are satisfied with their
goal achievement within 90% of their projects; however, only 8% are satisfied with their
goal achievement in 100% of their projects.
FIGURE 3.5: GPM SURVEY RESULTS OF GOAL ACHIEVEMENT , BUDGET AND TIME ADHERENCE
(WAGNER, 2000, P. 76)
To achieve more efficiency in project management, companies need to evaluate their
performance regularly to be able to improve their capabilities and abilities, and to
implement new processes and a culture of innovation and learning
(Hab and Wagner, 2006).
The increase of complexity in automotive product development has also changed the
project structures from a hierarchical to a networked structure as shown in Figure 3.6.
8 32 14 4
2 15 29 11
1 11 27 19
0% 20% 40% 60% 80% 100%
GoalAchievement
TimeAdherence
BudgetAdherence
100% of Projects 90% of Projects75% of Projects < 50% of Projects
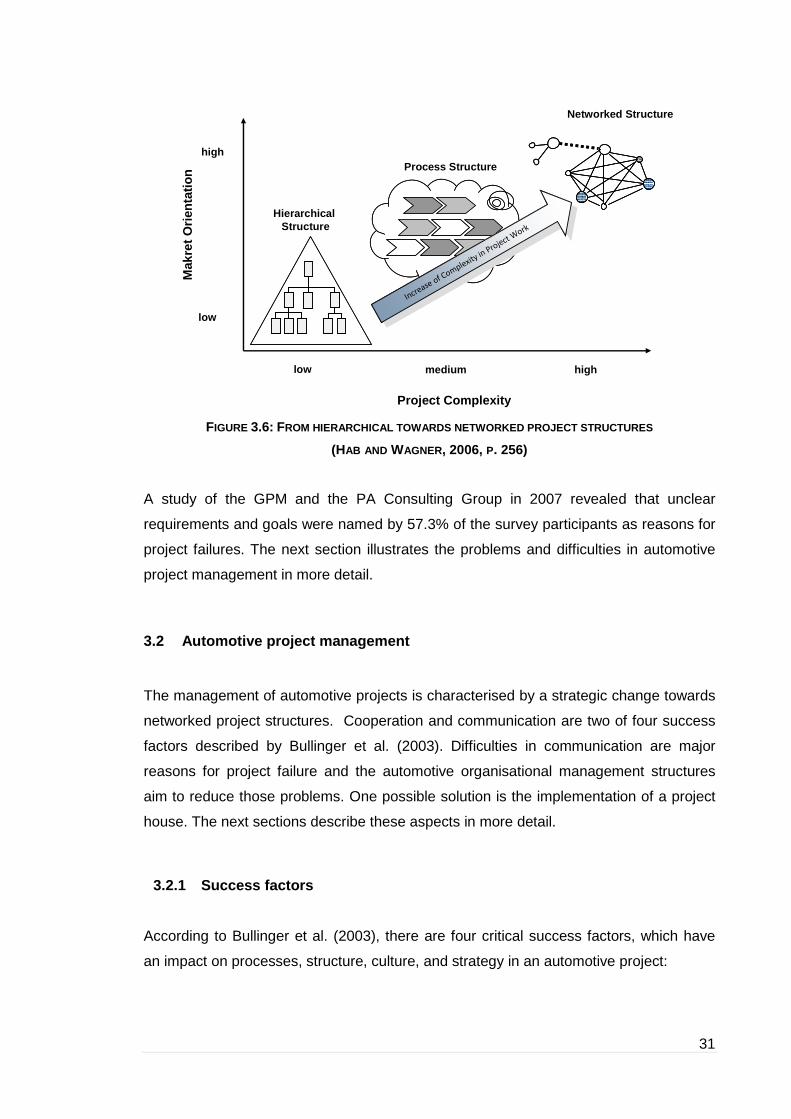
31
FIGURE 3.6: FROM HIERARCHICAL TOWARDS NETWORKED PROJECT STRUCTUR ES
(HAB AND WAGNER, 2006, P. 256)
A study of the GPM and the PA Consulting Group in 2007 revealed that unclear
requirements and goals were named by 57.3% of the survey participants as reasons for
project failures. The next section illustrates the problems and difficulties in automotive
project management in more detail.
3.2 Automotive project management
The management of automotive projects is characterised by a strategic change towards
networked project structures. Cooperation and communication are two of four success
factors described by Bullinger et al. (2003). Difficulties in communication are major
reasons for project failure and the automotive organisational management structures
aim to reduce those problems. One possible solution is the implementation of a project
house. The next sections describe these aspects in more detail.
3.2.1 Success factors
According to Bullinger et al. (2003), there are four critical success factors, which have
an impact on processes, structure, culture, and strategy in an automotive project:
Mak
retO
rient
atio
n
low
Networked Structure
HierarchicalStructure
Project Complexity
medium high
low
highProcess Structure
Increase of Complexity
in Project Work
Increase of Complexity
in Project Work

32
1. Focus and Innovation: focus on market demands and own strengths and core
competencies with innovative products.
2. Coordination and Integration: coordination and integration of processes and
structures, strengthening of project management and flexible integration of
project partner processes.
3. Cooperation and Interaction: development of trust, fair distribution of chances
and risks, common agreement on goals.
4. Communication and Information: communication is a core factor for success.
The four critical success factors are also called key indicators (KI) for a successful
management of vehicle projects. The KIs are part of a KI-Success Model that is a
holistic approach to project management and assumes that not only software solutions
and methods are success criteria but also market demands and the related strategic
procedural structures, as well as cultural impact factors.
3.2.2 Automotive organisational management structur es
An automotive company has usually implemented a matrix organisation consisting of
two dimensions, the functional line (vertical) including sales, development, design,
production, etc., and projects in the horizontal line. In some companies project
management and the project management process represent an additional virtual
organisation and is called project office. This office takes over administrative tasks and
evaluates and implements project management methods. Due to the development
towards networked project structures, the organisation has to integrate project partners
that usually work within a matrix organisation, too. Figure 3.7 shows the matrix
organisation of a typical vehicle developer and manufacturer.

33
FIGURE 3.7: MATRIX ORGANISATION OF A VEHICLE MANUFACTURER (HAB AND WAGNER, 2006, P. 42)
The integration of project partners is a challenge for a network manager as each partner
has its own processes and time lines that need to be synchronised. An early discussion
about common project goals and technical concepts is essential to manage the
complexity of such projects. The traditional concepts of simultaneous engineering, line
and project management need to be adapted to the new environment. There is a shift
from functional teams in line projects towards autonomous project teams. The new
organisation is called “project house” where functional and cross-company activities are
controlled and synchronised and project members of the participating enterprises work
together. The advantage of the project house is that information can be exchanged
quickly and solutions for problems and conflicts can be found more effectively due to an
improved communication. However, as a project house is established only for the time
of the project there are significant costs and high efforts to ensure confidentiality
involved. Additionally, common processes still need to be defined and cultural
differences identified (Hab and Wagner, 2006). Other problems are that specific project
management standards or procedures are often implemented but project managers do
not refer to these standards or obviously do not apply them. One of the reasons is that
project management standards are developed externally and do not always meet the
specific requirements of the companies´ projects. Standards need to be designed and
implemented by an internal team of experts and should be adaptable to the different
Executive
Board
PM Office
...
Partner Companies
PMO PMO PMO PMO
PM
PM
PMO PMO
Departments (line organization)
... ...

34
types of projects. In cross-company and collaborative projects these standards have to
be synchronised with standards being used in the automotive industry (Wagner, 2005).
3.2.2.1 Engineering and the project management office
Simultaneous Engineering (SE) is adopted in most of the projects in the automotive
industry (Dixius, 1998). Within the SE core team, specifications, solutions, and decisions
are coordinated that are related to the whole vehicle and its interfaces between the
modules and main functional groups at the level of technical project management. Each
module, depending on the complexity, includes a sub structure that requires another
team. During the development process of a sub module or each functional group, the
relevant departments work together by focusing on the specific process. The
coordination of those teams is managed by an interdisciplinary and process oriented SE
team that consists of a deputy from each division.
Next to Simultaneous Engineering other methods are necessary to manage the complex
processes of a vehicle development. A global goal definition, e.g., is not sufficient as the
objectives and requirements of the components and functions of the product need to be
defined on several levels and scales. For the detailed definition of the technical project
goals, the Quality Function Deployment (QFD) has been proven as a powerful method
(Gessner, 2001). The product divisions define project goals in a two stage process. In
the first stage, the goals are identified during a goal finding process. After that the team
develops a project goal catalogue that quantifies and translates the goals into technical
requirements. During the first stage, the development of a system consisting of several
hierarchical lists, tables, and matrices (House of Quality) takes place. The goal
agreement process in the second stage completes the project goal catalogue and
ascertains the goal targets in the subsequent process chain.
Projects that run parallel in the context of multi project management are common in the
automotive industry and the sum of all projects is defined as the project portfolio.
Several projects that share similar goals and strategies, e.g., same client or product line,
are summarised in a program. Project portfolio, program, and multi project management
are relevant disciplines in the automotive industry that require a complex organisational
structure. A multi and division project management office, and a project portfolio board
that controls the divisions and steering committees are relevant elements of such
organisation (Hab and Wagner, 2006). The strategic project management office at the

35
level of the executive management board coordinates the project portfolio, the program
office at the level of the division management coordinates the program management,
and the project office assists in project coaching and control. The structure and tasks at
each level is shown Figure 3.8.
FIGURE 3.8: THE PROJECT MANAGEMENT OFFICE TASKS AT STRATEGIC AND OPERATIONAL LEVEL
(HAB AND WAGNER, 2006, P. 209)
3.2.3 Project failures in the automotive industry
A study of the GPM and the Fraunhofer Institute (IAO) in 2003 identified that there is still
a 30% room for improvement to optimise the product development in the automotive
industry, and project management plays a significant role in the improvement potential
(Hab and Wagner, 2005). One reason is that many companies are not aware of the
strategic significance of project management. A study of the PA Consulting Group and
the GPM in 2007 revealed that a lack in communication caused 61% of the projects to
fail, which is followed by 57.3% due to unclear requirements and project goals. Figure
3.9 shows the results of the joint study.
Board of
Management
Division
Management
Project
Management
Strategic
PM-Office
Program
Office
Project
Office
Portfolio
Management
Program
Management
Project
Coaching
Project
Controlling
Re
sou
rce
Ma
na
ge
me
nt
Strategic
Level
Operational
Level
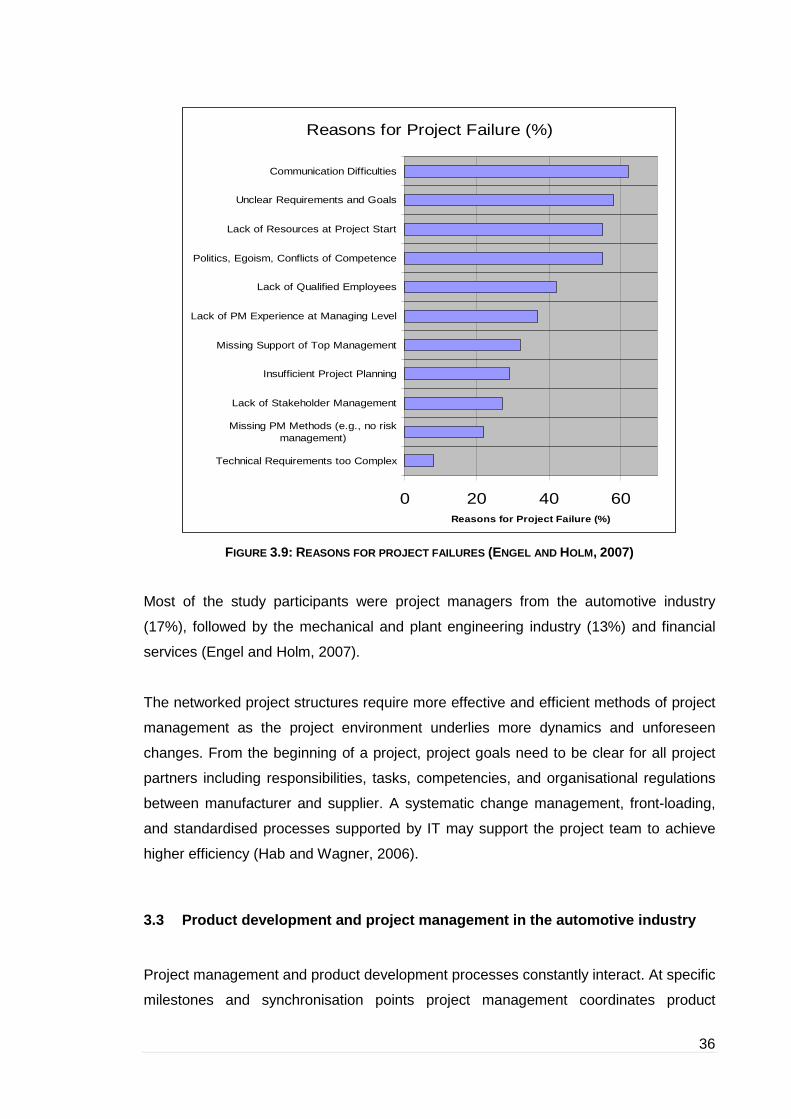
36
FIGURE 3.9: REASONS FOR PROJECT FAILURES (ENGEL AND HOLM, 2007)
Most of the study participants were project managers from the automotive industry
(17%), followed by the mechanical and plant engineering industry (13%) and financial
services (Engel and Holm, 2007).
The networked project structures require more effective and efficient methods of project
management as the project environment underlies more dynamics and unforeseen
changes. From the beginning of a project, project goals need to be clear for all project
partners including responsibilities, tasks, competencies, and organisational regulations
between manufacturer and supplier. A systematic change management, front-loading,
and standardised processes supported by IT may support the project team to achieve
higher efficiency (Hab and Wagner, 2006).
3.3 Product development and project management in t he automotive industry
Project management and product development processes constantly interact. At specific
milestones and synchronisation points project management coordinates product
Reasons for Project Failure (%)
0 20 40 60
Technical Requirements too Complex
Missing PM Methods (e.g., no riskmanagement)
Lack of Stakeholder Management
Insufficient Project Planning
Missing Support of Top Management
Lack of PM Experience at Managing Level
Lack of Qualified Employees
Politics, Egoism, Conflicts of Competence
Lack of Resources at Project Start
Unclear Requirements and Goals
Communication Difficulties
Reasons for Project Failure (%)
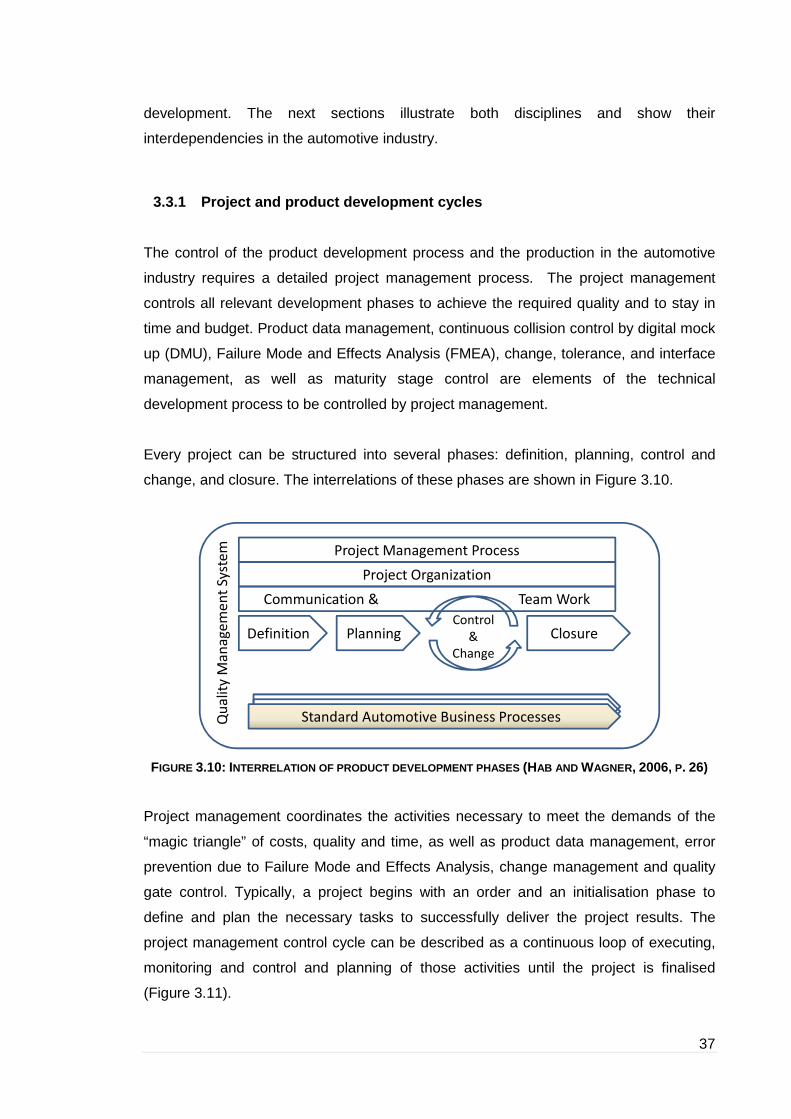
37
development. The next sections illustrate both disciplines and show their
interdependencies in the automotive industry.
3.3.1 Project and product development cycles
The control of the product development process and the production in the automotive
industry requires a detailed project management process. The project management
controls all relevant development phases to achieve the required quality and to stay in
time and budget. Product data management, continuous collision control by digital mock
up (DMU), Failure Mode and Effects Analysis (FMEA), change, tolerance, and interface
management, as well as maturity stage control are elements of the technical
development process to be controlled by project management.
Every project can be structured into several phases: definition, planning, control and
change, and closure. The interrelations of these phases are shown in Figure 3.10.
FIGURE 3.10: INTERRELATION OF PRODUCT DEVELOPMENT PHASES (HAB AND WAGNER, 2006, P. 26)
Project management coordinates the activities necessary to meet the demands of the
“magic triangle” of costs, quality and time, as well as product data management, error
prevention due to Failure Mode and Effects Analysis, change management and quality
gate control. Typically, a project begins with an order and an initialisation phase to
define and plan the necessary tasks to successfully deliver the project results. The
project management control cycle can be described as a continuous loop of executing,
monitoring and control and planning of those activities until the project is finalised
(Figure 3.11).
Project Management Process
Project Organization
Communication & Team Work
Definition PlanningControl
&
Change
Closure
Qu
ali
ty M
an
ag
em
en
t Syst
em
Standard Automotive Business Processes
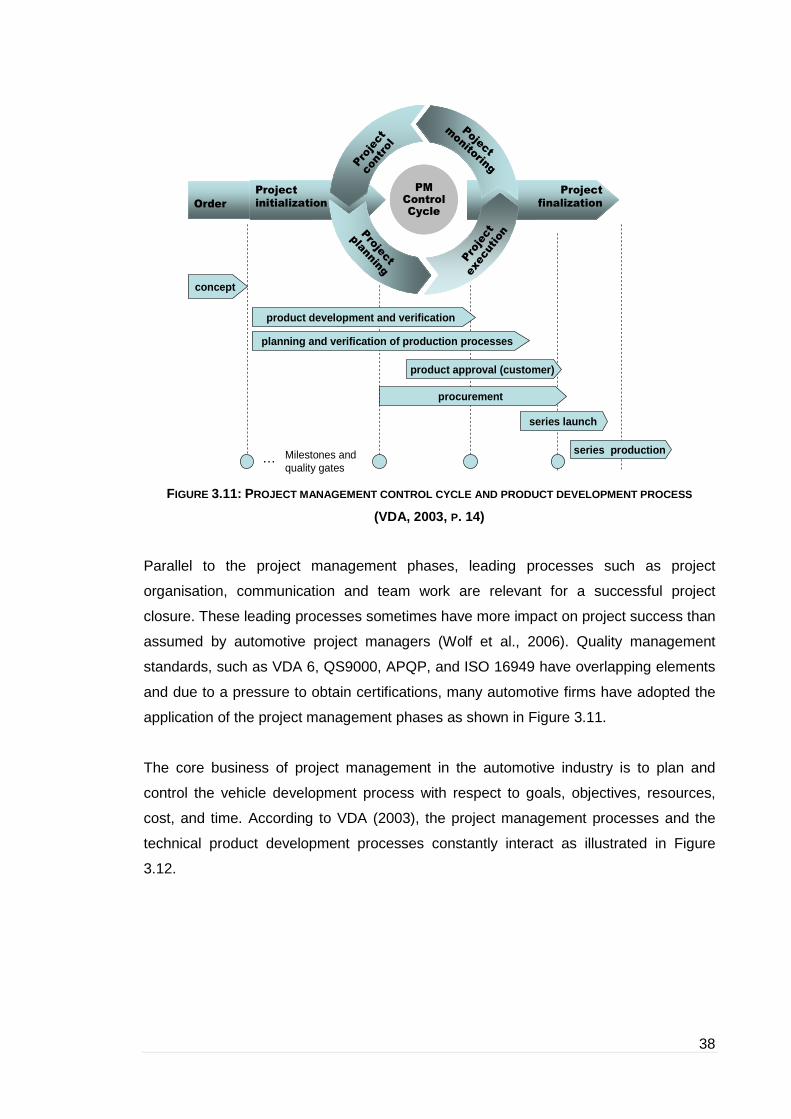
38
FIGURE 3.11: PROJECT MANAGEMENT CONTROL CYCLE AND PRODUCT DEVELOP MENT PROCESS
(VDA, 2003, P. 14)
Parallel to the project management phases, leading processes such as project
organisation, communication and team work are relevant for a successful project
closure. These leading processes sometimes have more impact on project success than
assumed by automotive project managers (Wolf et al., 2006). Quality management
standards, such as VDA 6, QS9000, APQP, and ISO 16949 have overlapping elements
and due to a pressure to obtain certifications, many automotive firms have adopted the
application of the project management phases as shown in Figure 3.11.
The core business of project management in the automotive industry is to plan and
control the vehicle development process with respect to goals, objectives, resources,
cost, and time. According to VDA (2003), the project management processes and the
technical product development processes constantly interact as illustrated in Figure
3.12.
Order
Project
finalization
Project
initialization
PMControlCycle
Poject
monitoring
Project
executionP
roject
planning
Project
control
Order
Project
finalization
Project
initialization
PMControlCycle
Poject
monitoring
Project
executionP
roject
planning
Project
control
concept
product development and verification
planning and verification of production processes
product approval (customer)
procurement
series launch
series productionMilestones and quality gates
…

39
FIGURE 3.12: INTERACTION OF PROJECT MANAGEMENT AND TECHNICAL PROD UCT DEVELOPMENT
PROCESSES (HAB AND WAGNER, 2006, P. 27)
Reliable and stable technical processes are an essential requirement for a successful
project management and in most automotive companies these processes are already
adopted on a standardised level. Parallel to the product development process, the
manufacturing facilities need to be established. Milestones and synchronisation points
are necessary to coordinate all parallel and subsequent processes. Quality gates are
top milestones that define important steps and phases during the vehicle development.
The definition of milestones in the early development phase of a project facilitates the
implementation of strategic decisions in the offer phase for a coordinated tender and
project start approval (Hab and Wagner, 2006).
3.3.2 From definition to project and maturity stage control
A project typically begins with a definition phase. Next to other tasks, project goals and
specification documents are defined in this phase. The planning phase includes a more
Communication & Team Work
Definition PlanningControl
&
Change
Closure
Concept
Product Development and Verification
Planning and Verification of Production Processes
Product Approval (customer)
Procurement of Resources
Series Launch
Series Production
AProject
Contract
BApproval
Concept
Develop-
ment
CApproval
Product
Develop-
ment
(Detailed)
DApproval
Detailed
Planning of
Production
Processes
EApproval
Procurement
and
Manufacturing
Means of
Production
FApproval
Series
Production
(SOP)
GClosure
Project Organization

40
detailed approach and the objectives are structured into work packages. Project control
ensures that all defined tasks, procedures, processes, etc. are within the defined and
planned corridor. A maturity stage control supports the monitoring and evaluation of the
current project status. The next sections describe the project management phases and
control methods in more detail.
3.3.2.1 Definition phase
The definition phase of a vehicle project includes the clarification of project goals as part
of the tender or specification document. Product specifications, quality, target and
delivery dates (time), cost and strategies are approved in this phase. Responsibilities
are clarified in an organisational chart as well as information flow and directions.
Structures, such as milestone plans and a product and production facility structure
facilitate the development of project transparency. Front-loading as a project
management strategy, an analysis of the project environment, risk analysis, time and
budget planning, requirements analysis, lead user analysis, benefit analysis, product,
process and system FMEA, design for assembly (DFA), design for manufacturing
(DFM), House of Quality, and network plan techniques are all elements of the project
definition phase. The phase and milestone plan categorises the project into single steps
and are part of the stage gate process (Kerzner, 2003).
Quality gates structure the product development process (PDP) into phases that allow
the evaluation of the project status at each gate. Indicators and measurements define
the requirements whether a gate can be passed or not. Synchronisation points support
the coordination between manufacturers, suppliers, and development partners. At
predefined times, the maturity of the development status is assessed and necessary
decisions are made. Milestones and synchronisation points are also relevant indicators
for progress control as the defined measurements indicate whether a certain deliverable
is achieved or additional measures have to be taken. The internal kick-off meeting
informs the business divisions and the responsible work package manager about
contents, objectives, structures, organisation, and time plan of the project. It also
officially initiates the project within the organisation. The external kick-off meeting with
the project partners is relevant to clarify the contract deliverables, interfaces, and
responsibilities during the project. The next step is the elaboration of the project plan.

41
3.3.2.2 Project planning and control
A planning workshop helps the project team to develop the plan and to familiarise with
the project members. This is especially important if the project team members are
geographically dispersed during the project duration. Part of this workshop is the
structuring of the project and work packages to reduce complexity. In a further step,
tasks are summarised in a timely manner to define detailed work packages. After
estimating the effort for each work packages they are delivered to the responsible work
package manager to approve target values for resources and cost, as well as duration
and cycle times for the time plan. Figure 3.13 shows the relevant steps of the planning
workshop including the kick-off workshop in the definition phase.
FIGURE 3.13: FROM KICK-OFF TO PLANNING WORKSHOP (HAB AND WAGNER, 2006, P. 109)
The result of the planning workshop is the project structure plan that is the basis for
project planning and control with regard to cost, time and tasks. It includes all necessary
tasks and work packages and categorises the activities into work units regarding to the
milestones. A detailed time plan, cost plan and calculation, risk management (risk
analysis: risk identification and evaluation, risk measures and success control) with a
risk management process, risk checklists (technical, commercial, organisational risks)
are part of the project planning phase.
Project
Goals
Milestones
Tender &
Specification
Document, Contract,
Risk Analysis, etc.
Product and Production
Facilities Structure
Kick-off Workshop
Planning WorkshopEstimation
of Effort
Work
Packages
Project Structure
Time Plan
Standard
Cycle Times
Detailed
Time PlanCalculation
12
3
4
56
9
6
7 8
8
Capacity Planning

42
Project control is characterised by a continuous monitoring and control of milestones,
cost, project objectives, and tasks. As in most automotive projects deviations from the
initial plan occur, change and claim management are required. The project management
control cycle that was described in the previous section includes a steady control of the
target and actual project status (variance analysis/target-actual comparison). Traffic
signals (red, yellow, green) indicate whether a milestone or quality gate can be passed
or the target may possibly or certainly not be achieved if corrective action is not
implemented. A possible definition of the traffic light indicators is shown in Figure 3.14.
FIGURE 3.14: POSSIBLE DEFINITION OF TRAFFIC LIGHTS FOR QUALITY GA TE CONTROL
(HAB AND WAGNER, 2006, P. 146)
The evaluation of progress also includes the estimation of future target values. A
milestone trend analysis (MTA) is useful to visualise the results in time and to identify
major trends that allows for preventative action.
3.3.2.3 Project maturity control
Stage maturity control of the product and processes is relevant to measure the actual
progress of a project and product. Indicators that measure the maturity can be fixed,
such as weight, manufacturing cost, quality, or they can depend on time (output
indicators), e.g. approvals, launch curves, or vehicle testings. Input indicators to
evaluate efficiency of a development process can be the resource consumption or the
cost increase of a project.
RED
YELLOW
GREEN
SIGNAL Definition
Actual deviates from target value: there is
no corrective action plan available
Actual deviates from target value: there is
an approved corrective action plan
available
Actual and target value are corresponding

43
Deviations from the indicator’s target value need to be controlled with corrective action
and measures. The 8D (8 Disciplines) Method is one possibility to identify the unknown
reasons for a deviation. The steps are shown in Figure 3.15.
FIGURE 3.15: STEPS OF THE 8D METHOD (HAB AND WAGNER, 2006, P. 165)
Project reporting ensures the information flow between the project team and the
stakeholders or steering committee. Standardised reporting measures and indicators
are developed to evaluate the current status with regard to the business plan. Usually,
these reports are produced on a monthly basis. Other means of communicating the
project status are dashboards, generally supported by IT solutions. They are also called
project cockpits and typically include a cost control diagram, milestone trend analysis,
review iteration, and degree of completion (Wildemann, 2004). A systematic illustration
is shown in Figure 3.16.
FIGURE 3.16: SIMPLIFIED ILLUSTRATION OF A PROJECT COCKPIT
Traffic lights indicate the current status of each indicator or measurement. The project
cockpit is an efficient monitoring tool and the scope of the cockpit can be extended by
other relevant project objectives and status relevant information. The Project Scorecard
D1: Assemble a cross-functional team of experts
D2: Define the problem
D3: Implement and verify interim containment actions (ICAs)
as needed
D4: Identify and verify root cause
D5: Choose and verify permanent corrective actions (PCAs).
preventive actions are also chosen.
D6: Implement and validate permanent corrective actions
D7: Prevent recurrence of the problem/root cause
D8: Recognize the efforts of the team
Project Cockpit
Cost Control
Diagram
Milestone
Trend Analysis
Review
Iteration
Degree of
Completion

44
(PSC) that is described in Chapter 6 in more detail is a possible extension to the project
cockpit as it integrates methods based on the Balanced Scorecard. The major difference
is that not only hard facts, such as cost, are integrated but also soft facts that, for
example, describe the quality or performance of team work.
3.4 Change, claim and configuration management
Changes occur frequently in a vehicle project and are partially caused by the application
of Simultaneous Engineering that aims to achieve shorter product life cycles. Other
reasons are the current speed of changes in innovation; therefore, relevant changes
need to be managed during the development and also during the production phase of a
vehicle. Changes are defined agreed commitments of a new state instead of the former
state and its related transformation (Lindemann et al., 1998). Causes for change can be
divided into changes due to mistakes or functional difficulties, and changes caused by
new customer requests or new laws and regulations, new technologies or materials.
Claim management includes the monitoring and control, documenting, and defence of
requests by the customer or client that were not approved in the project contract. In
automotive projects claims typically concern design or component changes, time
changes, quality problems or delayed approvals. Claim management documents the
demands and requirements of the organisation or of the own project and defends the
organisation’s demands against the project partner (Kuehnel et al., 2002).
In a complex and dynamic project change is inevitable. Configuration management does
not consider changes as avoidable disturbances but as chances to improve the
development, procurement, and production process. It controls the change processes of
a project and ensures documentation so that the product and its structure are generated
and contents and scope of the project are updated with regard to the project plan.
Therefore, configuration management increases transparency and quality sustainably
(Saynisch, 2006). Configuration management is divided into configuration identification,
configuration monitoring (change management), configuration auditing, and
configuration documentation.
45
3.5 Product data management (PDM)
The documentation of project data and an ensured access to current and updated
information is relevant for an efficient project cycle management. Systems for product
data management (PDM) or engineering data management (EDM) typically include
product descriptions, illustrations of technical and organisational business processes
and, therefore, functionalities of project management. Next to project planning and
control, such systems also include functionality for change management. Information
flow is realised by a work flow manager that coordinates the relevant activities for each
project member and documents all operations automatically. Due to an increased team
oriented work environment, the development and design engineer is more and more
involved in the planning, procurement, and production process. Therefore, the engineer
needs new methods for decision support. The newly developed PDM systems for
product development and life cycle management include an additional scope of
electronic engineering, supply chain management and configuration management
(Eigner and Stelzer, 2004). Status reports or dashboards represent the current project
or even program status. Documentation of operations between project partners is also a
part of the Advanced Product Quality Planning And Control Plan (APQP) that requires a
system support for the documentation process (AIAG, 1995).
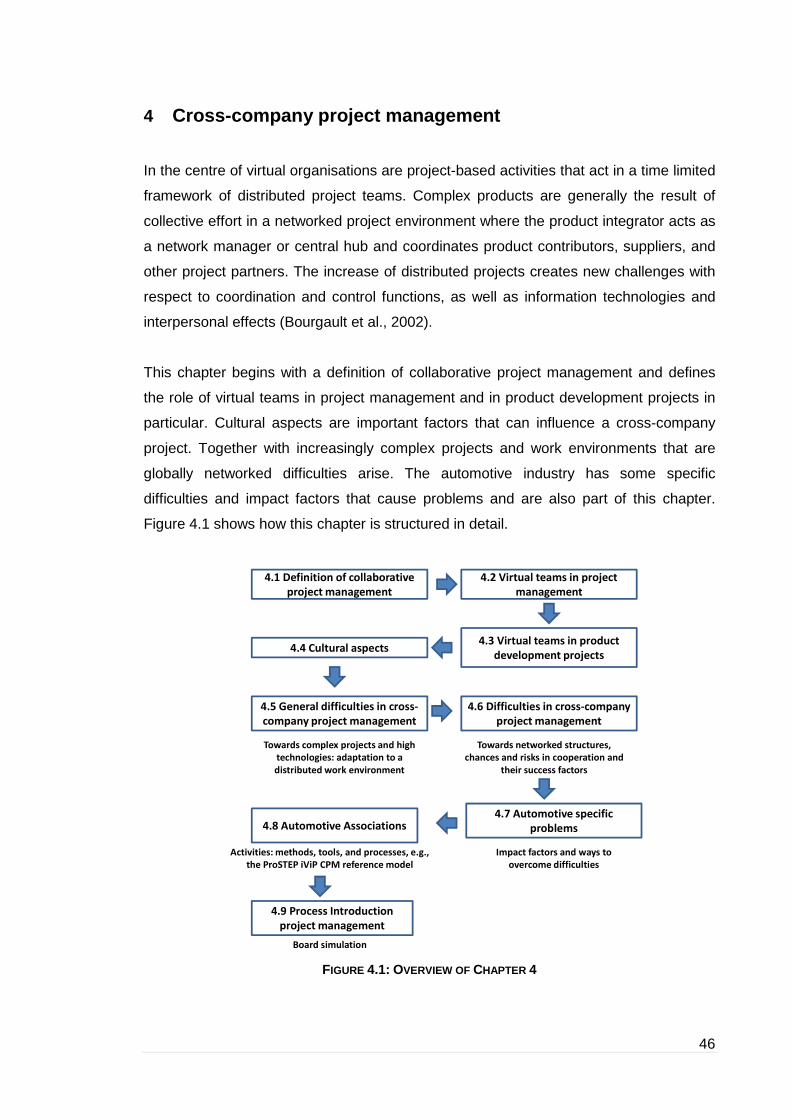
46
4 Cross-company project management
In the centre of virtual organisations are project-based activities that act in a time limited
framework of distributed project teams. Complex products are generally the result of
collective effort in a networked project environment where the product integrator acts as
a network manager or central hub and coordinates product contributors, suppliers, and
other project partners. The increase of distributed projects creates new challenges with
respect to coordination and control functions, as well as information technologies and
interpersonal effects (Bourgault et al., 2002).
This chapter begins with a definition of collaborative project management and defines
the role of virtual teams in project management and in product development projects in
particular. Cultural aspects are important factors that can influence a cross-company
project. Together with increasingly complex projects and work environments that are
globally networked difficulties arise. The automotive industry has some specific
difficulties and impact factors that cause problems and are also part of this chapter.
Figure 4.1 shows how this chapter is structured in detail.
FIGURE 4.1: OVERVIEW OF CHAPTER 4
Towards complex projects and high
technologies: adaptation to a
distributed work environment
4.1 Definition of collaborative
project management
4.2 Virtual teams in project
management
4.3 Virtual teams in product
development projects4.4 Cultural aspects
4.5 General difficulties in cross-
company project management
4.6 Difficulties in cross-company
project management
Towards networked structures,
chances and risks in cooperation and
their success factors
4.7 Automotive specific
problems4.8 Automotive Associations
4.9 Process Introduction
project management
Impact factors and ways to
overcome difficulties
Activities: methods, tools, and processes, e.g.,
the ProSTEP iViP CPM reference model
Board simulation
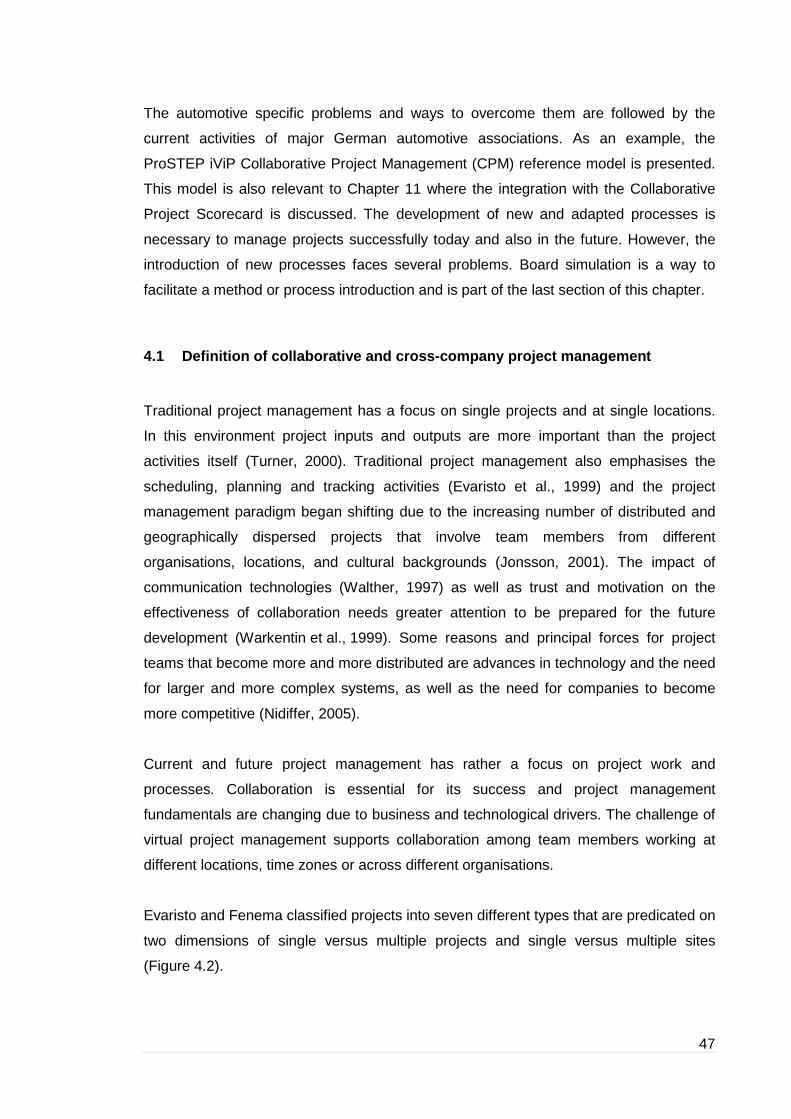
47
The automotive specific problems and ways to overcome them are followed by the
current activities of major German automotive associations. As an example, the
ProSTEP iViP Collaborative Project Management (CPM) reference model is presented.
This model is also relevant to Chapter 11 where the integration with the Collaborative
Project Scorecard is discussed. The development of new and adapted processes is
necessary to manage projects successfully today and also in the future. However, the
introduction of new processes faces several problems. Board simulation is a way to
facilitate a method or process introduction and is part of the last section of this chapter.
4.1 Definition of collaborative and cross-company p roject management
Traditional project management has a focus on single projects and at single locations.
In this environment project inputs and outputs are more important than the project
activities itself (Turner, 2000). Traditional project management also emphasises the
scheduling, planning and tracking activities (Evaristo et al., 1999) and the project
management paradigm began shifting due to the increasing number of distributed and
geographically dispersed projects that involve team members from different
organisations, locations, and cultural backgrounds (Jonsson, 2001). The impact of
communication technologies (Walther, 1997) as well as trust and motivation on the
effectiveness of collaboration needs greater attention to be prepared for the future
development (Warkentin et al., 1999). Some reasons and principal forces for project
teams that become more and more distributed are advances in technology and the need
for larger and more complex systems, as well as the need for companies to become
more competitive (Nidiffer, 2005).
Current and future project management has rather a focus on project work and
processes. Collaboration is essential for its success and project management
fundamentals are changing due to business and technological drivers. The challenge of
virtual project management supports collaboration among team members working at
different locations, time zones or across different organisations.
Evaristo and Fenema classified projects into seven different types that are predicated on
two dimensions of single versus multiple projects and single versus multiple sites
(Figure 4.2).

48
FIGURE 4.2: PROJECT CLASSIFICATION SCHEME (EVARISTO ET AL., 1999, P. 277)
Evaristo et al. (1999) assume that the critical difference between a distributed and a
traditional project are related to the coordination mechanism and that traditional project
management emphasises the management of single projects at a single location with a
focus on scheduling. Collaborative project management is defined as any project-
oriented collaboration between two and more project teams. These teams can either be
from the same organisation or distributed over several different organisations or
companies. Therefore, a project that acts between different divisions located at different
geographical locations and/or over different time zones of a single organisation can be
considered as a collaborative project.
When a project acts across different organisations and companies, it can be defined as
a cross-company project that also includes the characteristics of a collaborative project.
Major differences are that cross-company projects tend to be more complex and face
more difficulties and constraints. Some of them are information protection, management
of innovation, and different business processes that require the definition of
standardised interfaces and common process for collaborative project management.
Cross-company project management is often defined as cross-company collaboration
project management (C3PM) as it includes also the collaboration aspects as previously
defined.
Single Location
Single Project Program (Multiple Projects)
Multiple Locations
Traditional Project Co-located Program
Multi Traditional Projects
Multi Co-locatedPrograms
Multi Distributed Projects: Discrete Locations
Multi Distributed Projects: Shared Locations
Distributed Project
= Location = Project
49
4.2 Virtual teams in project management
Mayer (1998) describes the virtual team as a team that is composed of people who are
distributed across buildings, states, and countries. Mayer also noted that the virtual
organisation is the model for corporations in the future. The Project Management
Institute showed results in 2001 that 21% of the respondents worked on a project
involving multiple states or provinces, and 15% worked on projects involving multiple
continents (PMI, 2001). One of the reasons for this transformation is that employees,
suppliers, and manufacturers are not located in the same city but rather in different
locations and continents with different time zones. Rad (2003, p.1) also believes that
“global projects with virtual teams have emerged as vehicles by which the cost and
duration of projects can be reduced while maintaining a reasonable control on the
quality and scope of the projects”.
4.2.1 Definition of virtual project teams
Virtual teams may also be defined as team members who are geographically dispersed
and work collaboratively on the same project. These team members can be members of
the same company or organisation, or members of two or more companies working in a
cross-company project and at different locations. In that case, project deliverables are
distributed and project management is partially or fully decentralised. Project planning,
monitoring and control methods of virtual teams differ from conventional techniques and
different factors influence their performance (Akilesh et al., 2002).
Gray and Larson (2002) define projects consisting of virtual team members as
“international projects” and according to them the number of international projects
continues to increase. Kahn (2005) also realises the increase of virtual teams in the
development of products. This increase of virtual project environments requires the
development of new methods to manage barriers due to the distance of project
members but also due to cultural aspects. Additionally, knowledge management and
information protection is facing essential changes in the planning and monitoring
process.

50
4.2.2 Levels of collaboration
Collaboration can be categorised into different levels. A major framework that is widely
accepted is the collaboration framework developed by Nunamaker et al. (2000). It
consists of five different levels: communicative, collective, coordinative, and concerted
and is shown in Table 4.1.
Levels Nature of
efforts
Team
productivity
Process/tasks Applications Metaphors
Communicative dialog and
common
understanding,
dominated or
egalitarian,
information
sharing, non
task oriented.
minimal informal/ semi-
formal
communication,
conversational,
chaotic,
unstructured,
uncoordinated.
email, chat,
notes/
databases, news
groups,
computer-
mediated
communication.
huddle,
hallway
meeting,
coffee clutch.
Collective individual,
separate,
piece-meal
tasks.
sum of individual
performances
individualised
(start-end), minimal
integration.
word
processing,
spreadsheets,
graphics.
sprinters
Cooperat ive group-based,
uncoordinated.
sum of individual
performances
ad hoc, separate
tasks toward
common goal
final integration.
net meeting
application
sharing
hockey,
soccer.
Coordinated sequential
team,
precedential.
sum of
sequential
individual
performances
chronological, step
by step, ordered,
hand-offs, work
flow oriented,
progressive
integration.
work flow relay, work
flow.
Concerted mutual,
communal.
sum of
individual, ad-
hoc team and
coordinated
team
performances
jointly shared,
synchronised,
continuously,
integrative,
simultaneous,
flexible,
repeatable,
customisable.
group support
systems,
computer
supported,
collaborative
work.
crew, tug of
war, group
writing, group
problem
solving.
Table 4.1: Collaboration framework (Nunamaker et al., 2000)
A simpler framework reduces the five levels to three: collected, coordinated and
concerted (Chen et al., 2002). The level concerted is the level that contributes with the
most value to project management as it offers effective and efficient support for
complexity management (Romano, 2002). The collected level is described by individual

51
efforts of team members where no coordination is required for achieving productivity.
Group productivity is cumulated by individual efforts and is similar to sprinters who aim
to make their best individual effort. At the coordinated level, each member still
contributes individually with their effort but success of some of the team members might
depend on a timely achievement of deliverables produced by other team members. The
success of the team depends on the coordination ability and can be described by a
team of relay runners. The level of collaboration includes managing of
interdependencies between activities. The coordinated level is characterised by the
contribution of the whole team to the group effort as performance of any other member
has an impact on the ability of all other members to the overall performance. A rowing
team is a metaphor that describes this level best as all rowers have to synchronise their
efforts and contribute simultaneously to achieve successful results. Figure 4.3 shows
the hierarchical model of collaboration described in this paragraph.
FIGURE 4.3: HIERARCHY OF COLLABORATION (CHEN ET AL., 2002, P. 8)
Project management at a concerted level requires effective coordination of all project
members and a project management tool should support all functions involved.
4.2.3 Collaboration as a key to business success
Due to globalisation and growing competition on the international marketplace
companies and organisations are forced to strengthen collaboration in project
CollectedWork
Process Structure and Task Structure
Inte
ract
ivity
of C
omm
unic
atio
n
IndividualWork
CoordinatedWork
ConcertedWork
Sprinters
RelayRelay
CrewCrew
Hierarchy of Collaboration

52
management. Major progress in information and communication technology allows a
distribution of work packages and tasks but also in product development, production,
sales, and important management functions. Especially, product development
organisations aim to distribute and relocate parts of the development to foreign low cost
countries, not only to save cost but also to use resources and local know-how more
efficiently. The IT industry has begun very early with the relocation and distribution of
project teams and aimed to overcome the new difficulties and challenges. However, the
lack of standardised collaborative methods and processes has caused the failure of
several projects in those times (Prikladnicki et al., 2004).
According to a study of the Deutsche Bank Research, 15% of the value creation chain in
Germany will be characterised by temporary, cooperative, and often international value
creation processes. In 2007, the contribution was only 2%. The Deutsche Bank
Research deduces the development from an increasing level of innovation in
information technology. On the basis of a project managed by the Deutsche Bank
Research in 2005, a scenario analysis was applied and several impact factors on future
structural change implied. Included were dynamic factors based on identified trends
(Bergheim, 2005).
4.2.3.1 Early identification of collaboration benefits
Various developments were summarised to the two major core dynamics of
“configuration of the political-legal framework and use of the societal potential” and
“change of business culture and value creation pattern”. A main result of the Deutsche
Bank Research study is that the comprehensive value creation will manifest as a
“project economic System” in 2020. The “Project Economic System” is defined as a
cooperative value creation in organisational and judicial independent and temporary
projects. These results are based on the assumption that project cooperation boosts
flexibility and innovation, as well as it limits and distributes risks between project
partners. In the course of globalization, companies can only act collaboratively, i.e.
cooperatively. The relevant depth of knowledge to develop new products is only
ensured by efficient cooperation where individual survival can only be assured by a
strong specialization. The results of the survey lead to the conclusion that organisations
have to think about cooperation relevant aspects early to stay competitive in the future.
One aspect, e.g., is the specific choice of a cooperation partner and the clear definition

53
of roles in that cooperation. The open up of innovation processes to partners and
customers is a relevant criterion of success (Bergheim, 2005).
4.2.3.2 The definition of collaborative standards as a key to success
Clearly defined rules for the distribution of rights regarding the development results
need to be discussed, therefore, early development, adoptions and implementation of
standards is a key to success for all involved partners. A reason for this is that partners
within the “project economic system” change frequently and standards for human
resource and information management as well as technical interfaces for collaborative
product development, services, and systems are required. Project relevant databases
need to be connected efficiently that customer data, design data, and process
parameters can be exchanged safely (Hofmann et al., 2007).
4.3 Virtual teams and product development projects
Cross-company and virtual development teams are facing new challenges on a
technical and project management level as products are increasingly developed in
cross-company and geographically dispersed project teams. The section describes the
aspects of distributed product development in more detail.
4.3.1 Distributed product development
Product development includes the holistic planning of a product life cycle that is
influenced by various impacts (Birkhofer, 2000). Product development is typically
structured into the phases of product planning, task clarification, product conception,
product draft and product engineering.
The interaction with and integration of the product life cycle is an essential element of
product development and is embedded into a structure of several levels and
perspectives (Prasad, 1996). Perspectives are organisation, product, and process. The
relation to the hierarchical levels is illustrated in Table 4.2.

54
Organisation Product Process
Hierarchy
Levels
(top-down)
Business Unit Tasks Modelling element
Strategic business
Unit
Project vision
and Mission
System Process
sub unit Strategies,
values,
objectives
Sub system Sub process
Product
development team
Project initiatives
and tasks
Components Activities, functional
chain (sub-sub
process)
Work group Project teams Parts Work procedures,
sub functions
Experts Team members,
time plans
Attribute Activities, methods
TABLE 4.2: ORGANISATIONAL STRUCTURE OF PRODUCT DEVELOPMENT (PRASAD , 1996, P. 397)
Product development within geographically dispersed project teams is often called
“collaborative product design” or “collaborative product development”. Gierhardt (2001)
defines the distributed product development as a combination and configuration of
different process elements: human beings, material, activities, methods and tools for an
effective and efficient development of products. His theory is based on the principles of
systems engineering (Daenzer et al., 1997).
4.3.1.1 Cooperation model for distributed product development
A cooperation model defined by Gierhardt (2001) extends the traditional understanding
of visualising the interface between partners in a global and distributed product
development only. It aims to represent the complex cooperation processes and
correlations between a distributed environment and the process, organisational, and
product level. The model describes collaborative team work of different development
partners in a dispersed environment and assumes that the reason for collaboration is
the solution of a development task. A major element of the model is represented by the
activities of the development partners that act within five levels: the process,
organisational, product, knowledge, and objective level. The second element is the
distribution space where all activities take place. Figure 4.4 illustrates the cooperation
model.

55
FIGURE 4.4: COOPERATION MODEL OF DISTRIBUTED PRODUCT DEVELOPMENT
(GIERHARDT, 2001, P.56)
Within the distributed cooperation, activities are networked with the distribution space;
therefore, understanding is a relevant requirement for the project. Understanding is
described by information as contents and communication as a transfer process. The
activity level of the development partners represent the levels of the distributed product
development and are the basis of cooperation due to their networked structure.
4.3.2 Communication as a driving force
The communication process in product development organisations is considered as a
key element to improve development performance. Information exchange in
geographically dispersed product development teams is of a highly interdependent
nature, and the use of electronic-based communication media changed the way
development teams communicate (Sosa et al., 2002). Global new product development
project teams are becoming increasingly common due to a growing demand for
organisations to compete in an international economy.
The management of communication in global development teams requires the
capabilities of various communication mechanisms and their effective application. The
results of an analysis by McDonough et al. (1999) revealed an impact of differences in
country, culture, country of origin, and geographic dispersion on the demand for
KnowledgeLevel
Target Level
Target
Level
Know
ledgeLevel
Target Level
Know
ledgeLevel
Development Partner BDevelopment Partner A
Process Level Process Level
Organisational Level Organisational Level
Product Level Product Level
Room of Distribution
Communication & Understanding
Communication & Understanding
DistributedCooperation
and Networking
Dev
elop
men
tPar
tner
C
Pro
cess
Leve
l
Org
anis
atio
nal
Leve
l
Pro
duct
Leve
l

56
communicating information quickly that is rich and consists of different volumes. They
also found that these differences have an indirect affect on communication that was
caused by six factors (McDonough et al., 1999):
1. Approach used to solve problems.
2. Means used to communicate with leaders.
3. Decision-making practices.
4. Different languages spoken by team members.
5. Technological capability of the member’s country of origin.
6. Extreme geographical dispersion.
Only two information mechanisms were associated with performance, which are the use
of phone calls and videoconferencing. Videoconferencing has been found to have a
negative relation to performance. Relevant key issues that have an impact on
performance are building trust among distributed team members and the team leader
and ensuring cooperation on the team (McDonough et al., 1999). Although, benefits
such as cost and time savings are main reasons for the acceptance of this technology
by executives, the technological complexity has been considered as an unreliable
business tool. However, a new service on the marked that offers managed video
conferencing may support the improvement of performance and reliability that leads to
an increased user satisfaction and lower per meeting costs (Weinstein, 2004).
4.4 Cultural aspects: limitations and chances
The human element of a project team is in most cases an element for success in a
virtual and distributed project environment. It is also a variable that is difficult to address
as it deals with a change of cultural factors in areas of conflicting behaviours, processes,
and technologies. New human and interpersonal skills are required to work in a
distributed project environment and a shift from project management to project
leadership is supported by the fact that a manager has to act in a networked world of
interconnected relationships. Negotiation as a core competency for the modern project
manager who balances the demands and needs of an increasingly large and diverse set
of stakeholders is an essential asset (Nidiffer et al., 2005).
Herzog (2001) assumes that if a project manager employs 15 specific activities it will
increase communication and build trust in a team. Management by walking around gives
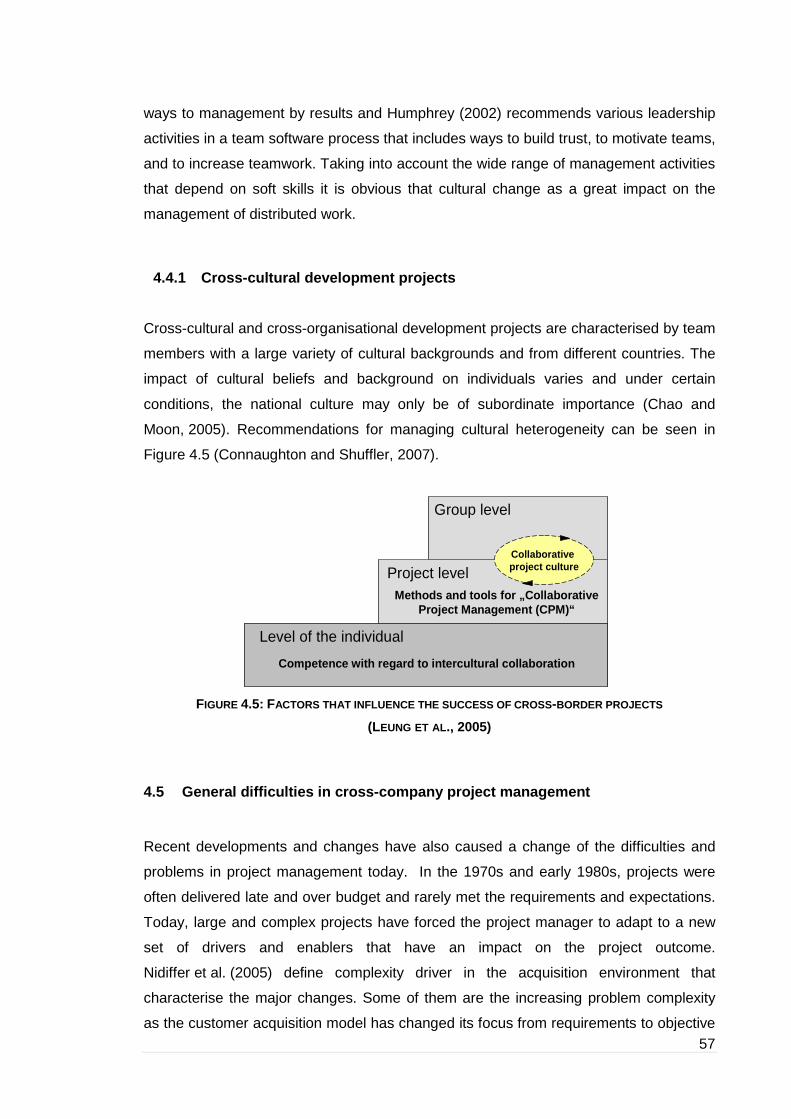
57
ways to management by results and Humphrey (2002) recommends various leadership
activities in a team software process that includes ways to build trust, to motivate teams,
and to increase teamwork. Taking into account the wide range of management activities
that depend on soft skills it is obvious that cultural change as a great impact on the
management of distributed work.
4.4.1 Cross-cultural development projects
Cross-cultural and cross-organisational development projects are characterised by team
members with a large variety of cultural backgrounds and from different countries. The
impact of cultural beliefs and background on individuals varies and under certain
conditions, the national culture may only be of subordinate importance (Chao and
Moon, 2005). Recommendations for managing cultural heterogeneity can be seen in
Figure 4.5 (Connaughton and Shuffler, 2007).
FIGURE 4.5: FACTORS THAT INFLUENCE THE SUCCESS OF CROSS -BORDER PROJECTS
(LEUNG ET AL., 2005)
4.5 General difficulties in cross-company project m anagement
Recent developments and changes have also caused a change of the difficulties and
problems in project management today. In the 1970s and early 1980s, projects were
often delivered late and over budget and rarely met the requirements and expectations.
Today, large and complex projects have forced the project manager to adapt to a new
set of drivers and enablers that have an impact on the project outcome.
Nidiffer et al. (2005) define complexity driver in the acquisition environment that
characterise the major changes. Some of them are the increasing problem complexity
as the customer acquisition model has changed its focus from requirements to objective
Level of the individual
Competence with regard to intercultural collaboration
Level of the individual
Competence with regard to intercultural collaboration
Project levelMethods and tools for „Collaborative
Project Management (CPM)“
Group level
Collaborative project culture

58
capability statements, or the increasing solution complexity that is described by a shift
from platform to enterprise emphasis. Other complexity drivers are increasing technical
compliance, and team complexity.
4.5.1 Change towards complex projects
The change towards complex projects has also caused a change of project
management towards a world of distributed and geographically dispersed project teams
that focus simultaneously on processes, people, and technology. The Standish Chaos
Report states that most project management techniques were designed for co-located
project teams and that these techniques may possibly not be suitable for global and
multi-site organisations (Standish Group, 1999).
Malone (2004) states that the virtual project workforce is not technology independent as
high cost of communication has lead all kind of organisations to search for more efficient
ways of communication. Technology itself is not considered as a solution but an enabler
to change organisations and management.
The major problems of distributed project management have been identified by guided
interviews with lead engineering managers in 2003 and are shown in following three
tables (Table 4.3, 4.4. and 4.5). The problems are categorised into six different issues
that are of strategic, project and process management, communication, cultural,
technical, and security character.
Strategic :
Difficulty leveraging
available resources.
Potential enablers
• Understanding common
issues on distributed projects
so that stakeholders can
anticipate and manage risks.
• Knowledge management
systems, especially expertise
management systems.
Current constrain ts
• Best practices are often deemed
proprietary
• Time consuming to implement
and maintain.
TABLE 4.3: STRATEGIC ISSUES IN DISTRIBUTED DEVELOPMENT (NIDIFFER ET AL., 2005, P. 69)
Issues related to project and process management, communication, and culture are
shown in Table 4.4.
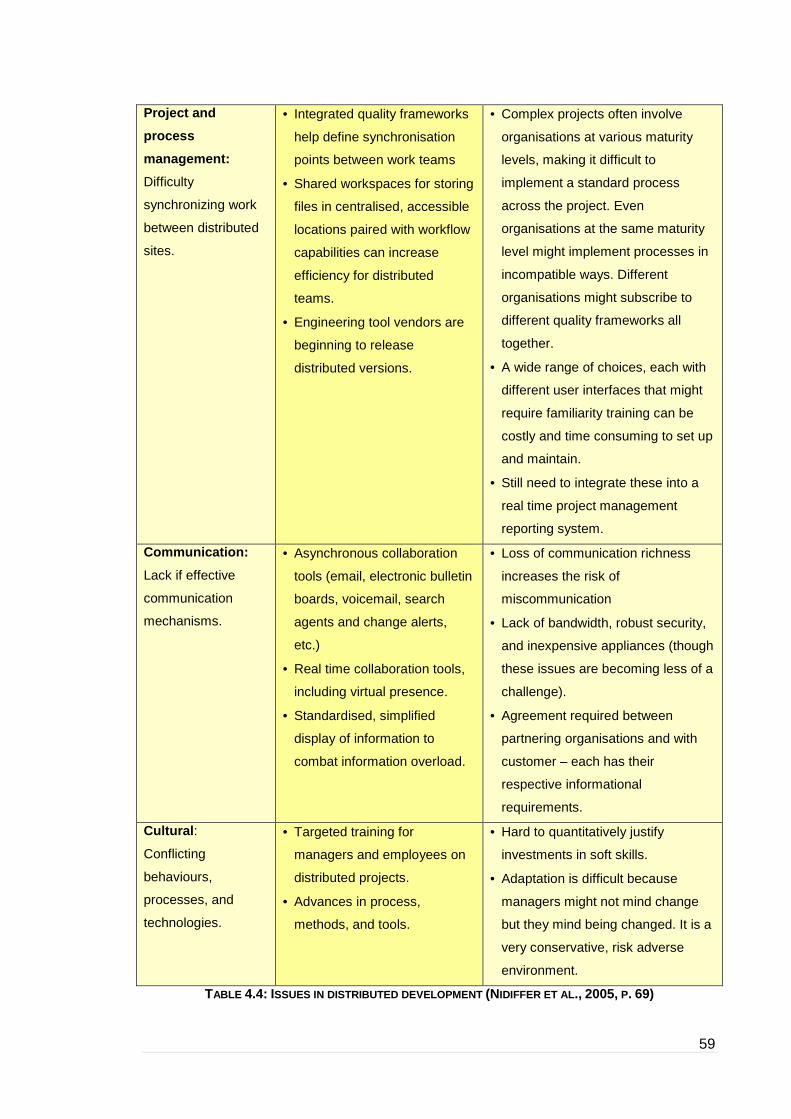
59
Project and
process
management:
Difficulty
synchronizing work
between distributed
sites.
• Integrated quality frameworks
help define synchronisation
points between work teams
• Shared workspaces for storing
files in centralised, accessible
locations paired with workflow
capabilities can increase
efficiency for distributed
teams.
• Engineering tool vendors are
beginning to release
distributed versions.
• Complex projects often involve
organisations at various maturity
levels, making it difficult to
implement a standard process
across the project. Even
organisations at the same maturity
level might implement processes in
incompatible ways. Different
organisations might subscribe to
different quality frameworks all
together.
• A wide range of choices, each with
different user interfaces that might
require familiarity training can be
costly and time consuming to set up
and maintain.
• Still need to integrate these into a
real time project management
reporting system.
Communication:
Lack if effective
communication
mechanisms.
• Asynchronous collaboration
tools (email, electronic bulletin
boards, voicemail, search
agents and change alerts,
etc.)
• Real time collaboration tools,
including virtual presence.
• Standardised, simplified
display of information to
combat information overload.
• Loss of communication richness
increases the risk of
miscommunication
• Lack of bandwidth, robust security,
and inexpensive appliances (though
these issues are becoming less of a
challenge).
• Agreement required between
partnering organisations and with
customer – each has their
respective informational
requirements.
Cultural :
Conflicting
behaviours,
processes, and
technologies.
• Targeted training for
managers and employees on
distributed projects.
• Advances in process,
methods, and tools.
• Hard to quantitatively justify
investments in soft skills.
• Adaptation is difficult because
managers might not mind change
but they mind being changed. It is a
very conservative, risk adverse
environment.
TABLE 4.4: ISSUES IN DISTRIBUTED DEVELOPMENT (NIDIFFER ET AL., 2005, P. 69)
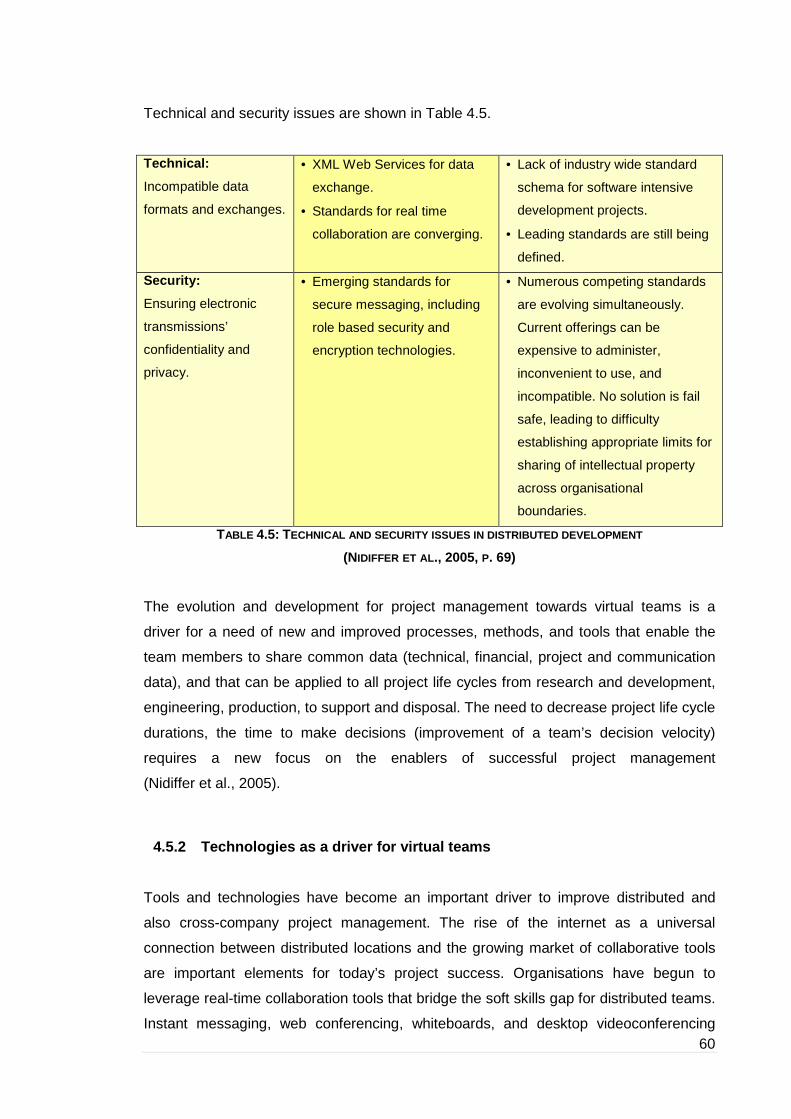
60
Technical and security issues are shown in Table 4.5.
Technical:
Incompatible data
formats and exchanges.
• XML Web Services for data
exchange.
• Standards for real time
collaboration are converging.
• Lack of industry wide standard
schema for software intensive
development projects.
• Leading standards are still being
defined.
Security:
Ensuring electronic
transmissions’
confidentiality and
privacy.
• Emerging standards for
secure messaging, including
role based security and
encryption technologies.
• Numerous competing standards
are evolving simultaneously.
Current offerings can be
expensive to administer,
inconvenient to use, and
incompatible. No solution is fail
safe, leading to difficulty
establishing appropriate limits for
sharing of intellectual property
across organisational
boundaries.
TABLE 4.5: TECHNICAL AND SECURITY ISSUES IN DISTRIBUTED DEVELOP MENT
(NIDIFFER ET AL., 2005, P. 69)
The evolution and development for project management towards virtual teams is a
driver for a need of new and improved processes, methods, and tools that enable the
team members to share common data (technical, financial, project and communication
data), and that can be applied to all project life cycles from research and development,
engineering, production, to support and disposal. The need to decrease project life cycle
durations, the time to make decisions (improvement of a team’s decision velocity)
requires a new focus on the enablers of successful project management
(Nidiffer et al., 2005).
4.5.2 Technologies as a driver for virtual teams
Tools and technologies have become an important driver to improve distributed and
also cross-company project management. The rise of the internet as a universal
connection between distributed locations and the growing market of collaborative tools
are important elements for today’s project success. Organisations have begun to
leverage real-time collaboration tools that bridge the soft skills gap for distributed teams.
Instant messaging, web conferencing, whiteboards, and desktop videoconferencing
61
provide different communication methods than the telephone, email, or face-to-face
meetings. Tools for unstructured collaboration can enhance communication by
increasing communication between distant team members. A recent development in
knowledge-management projects has demonstrated that relying on the strategy that if
you build the system, users will follow, often leads to the adoption of expensive and later
unused concepts (Nidiffer et al., 2005).
4.5.3 New processes need adaptation to distributed work envir onment
When organisations re-evaluate processes and procedures they should also re-assess
existing processes with regard to their capability to use in a distributed work
environment. Some may be proved as inappropriate, controlling, or confining, whereas
others may require a more formalised structure to achieve higher effectiveness.
Process improvement models such as CMMI have originally been developed to assess
and improve the processes of a single organisation. The adherence to a single
framework enables an organisation to implement common and shared processes across
all of its business divisions and units. However, compliance to a single standard within
the organisation may not be sufficient in an increasingly distributed environment as
suppliers and project partners are part of the process, too (Nidiffer et al., 2005).
4.6 Cross-company project management in the automot ive industry
The increasing number of cross-company product development projects has changed
the collaboration models of today substantially. While partnerships and collaboration
were dominated by the OEM in the past, today many collaboration projects are based
on equality. Large organisations have formerly built up research and development
capacities that now need to be covered by external partners. The formation of
partnerships is one way to maintain reliable research and development partners, and in
average an OEM in the automotive industry has about 50 development partnerships
(Wildemann, 2004b). The responsibility for the management of systems, modules or
vehicles is increasingly shifting towards the development partners and requires the
establishment of project management know-how and capabilities to exchange project
data and technical data at the partner’s site. Project management capacities are the
foundation to coordinate and integrate partners and suppliers. Existing outsourcing to
suppliers of product or component development such as gearing systems, axes, and
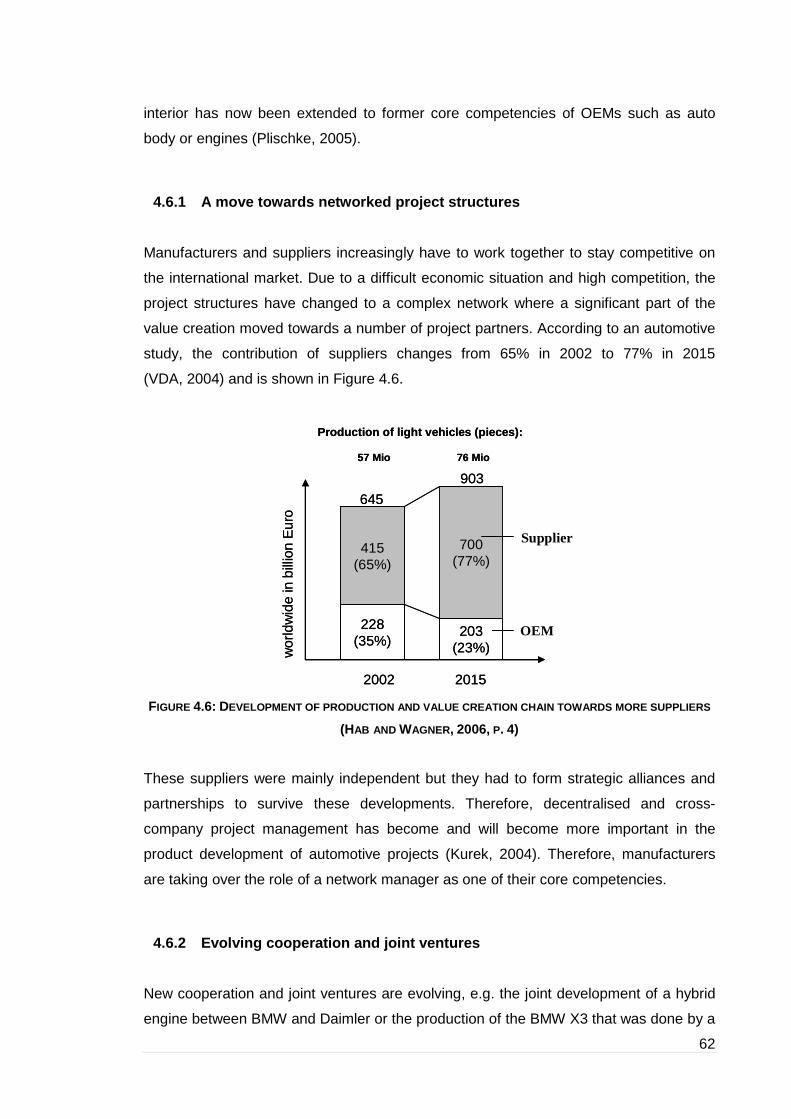
62
interior has now been extended to former core competencies of OEMs such as auto
body or engines (Plischke, 2005).
4.6.1 A move towards networked project structures
Manufacturers and suppliers increasingly have to work together to stay competitive on
the international market. Due to a difficult economic situation and high competition, the
project structures have changed to a complex network where a significant part of the
value creation moved towards a number of project partners. According to an automotive
study, the contribution of suppliers changes from 65% in 2002 to 77% in 2015
(VDA, 2004) and is shown in Figure 4.6.
FIGURE 4.6: DEVELOPMENT OF PRODUCTION AND VALUE CREATION CHAIN T OWARDS MORE SUPPLIERS
(HAB AND WAGNER, 2006, P. 4)
These suppliers were mainly independent but they had to form strategic alliances and
partnerships to survive these developments. Therefore, decentralised and cross-
company project management has become and will become more important in the
product development of automotive projects (Kurek, 2004). Therefore, manufacturers
are taking over the role of a network manager as one of their core competencies.
4.6.2 Evolving cooperation and joint ventures
New cooperation and joint ventures are evolving, e.g. the joint development of a hybrid
engine between BMW and Daimler or the production of the BMW X3 that was done by a
wor
ldw
ide
in b
illio
nE
uro
2002
228(35%)
415(65%)
203(23%)
700(77%)
2015
645
903
Production of light vehicles (pieces):
57 Mio 76 Mio
OEM
Supplier
wor
ldw
ide
in b
illio
nE
uro
2002
228(35%)
415(65%)
203(23%)
700(77%)
2015
645
903
Production of light vehicles (pieces):
57 Mio 76 Mio
OEM
Supplier
63
supplier in Austria. Another cooperation project was the collaborative engine
development of Ford and PSA.
4.6.2.1 Chances and risks in cooperation
Due to the competitive market and the demand for lower prices, the manufacturers are
under enormous pressure that is partially passed to the supplier. Pander and
Wagner (2005) named this situation “coopetition” which is a combination of competition
and cooperation. They identified the chances and risks that may occur in such project
environment. Some chances are the strengthening of the competitive position, the
possibility to extend their market share, increase of know-how and innovation,
distribution of investment costs, higher resource flexibility, and advantages in
purchasing, logistics, and sales. On the other hand, risks may be a dependency on the
project partners, conflicts of interests, a loss of know-how, a high effort to coordinate, a
creation of new competition, liability risks, different cultures and a loss of identity.
The Asian automotive market has gone through major changes as well as new Asian
manufacturers also collaborate with Western OEMs. The automotive development faces
a strong variation of development cycles due to the growing importance of electronics
and software. The cycle time of a change in the control software is dramatically shorter
than the cycle times of the body parts and leads to an increased occurrence of changes
that impacts the management of development data. Flexible and easy to use solutions
can help to minimise the change effort. The new concept of collaboration causes a
change from top-down processes to network organisations with clear distribution of
competencies according to the specific knowledge areas (Plischke, 2005).
4.6.2.2 Value creation and success factors of existing cooperation
Cooperation in the automotive industry can be divided into the composition of partner
organisations, the specific project phase of collaboration, and the technical type of
collaboration, e.g., whether it is a technology collaboration or a production or sales and
distribution partnership. Figure 4.7 illustrates the perspectives of hierarchical
composition and value creation with respect to project phase and collaboration type of
existing partnerships.

64
FIGURE 4.7: HIERARCHY AND VALUE CREATION OF EXISTING COOPERATION (MERCER AND TUM, 2005)
Supplier collaboration is dominated by technological collaboration from predevelopment
until module assembly, whereas OEM and supplier collaboration has a strong focus on
development and the series development until assembly of modules and systems. Joint
ventures between OEMs are dominated by technological collaboration and production
and distribution partnerships. However, the number of vehicle partnerships is increasing
continuously.
Criteria for cooperation are the attitude of the partners and their mutual trust and
empathy. However, communication is dependent on those criteria and serves as a
criterion for a successful target agreement (Spies, 2003). Figure 4.8 shows the criteria
of cooperation.
FIGURE 4.8: CRITERIA OF COOPERATION (SPIES, 2003)
Technological Collaboration (20)
Predevelopment SeriesDevelopment
Module Manufacture
ModuleAssembly
VehicleAssembly
Predevelopment SeriesDevelopment
Module Manufacture
ModuleAssembly
VehicleAssembly
Supplier&
SupplierC
olla
bora
ting
Par
tner
OEM & Supplier
OEM &
OEM
Module/System Collaboration (2)
Supplier Park (21)
Vehicle Cooperation (13)
Development Cooperation (29)
Technological Collaboration (13)
Module/System Cooperation (33)
Vehicle Partnership (8)
Technological Collaboration (26)
Production/Distribution
Collaboration (10)
Plant Operator (4)
Production/Distribution
Partnership (26)
Hierarchy/Value Creation of Existing Cooperation
( ) = Number out of 205
Cooperation
Target Agreement
Empathy
Trust
Communication
Attitude
Criteria of Cooperation

65
Success factors for cooperation are related to several aspects. One of them is the
organisation and its structure, e.g. whether it is a project focussed organisation or it
applies benefit sharing. Other aspects are strategy, employees, knowledge, culture, and
processes. According to an experienced project manager from a German car
manufacturer, the success factors are defined as shown in Figure 4.9, whereas the
OEMs, suppliers, and technology partners contribute to a value network.
FIGURE 4.9: SUCCESS FACTORS FOR COOPERATION
4.7 Automotive specific problems
The situation in automotive projects can only be improved with a holistic consideration of
all impact factors. Based on the system theory (Patzak, 1982), Pander and Wagner
developed a framework that includes a target system to describe and specify project
goals, a process system that defines activities to achieve these goals, an action system
for the organisational structure, and finally an object system that has a focus on the car
development (Wagner and Pander, 2005 p.23).
After adding socio-cultural impact factors to the model, six impact factors describe the
C3PM Model as shown in Figure 4.10.
Organisation
• Project focussed organisation
• Benefit sharing
• Self regulating elements (control cycle)
• Cross-company target agreement
Strategy
• Focus on core competencies
• Best in class communities
Employee
• Interdisciplinary work
• Change of tasks and roles
• Project collaboration
• Result responibility
Knowledge
• Know how sharing
• Continuous learning
• Partner managementCulture
• Frank culture and trust
• Cooperation and decisions by mutual consent
• Result responsibility
Processess
• Cross-company core processes
• Standardisation of core processes
• Reduction of interfaces by implementation of self regulating units
OEM
SupplierPartner
Success Factors
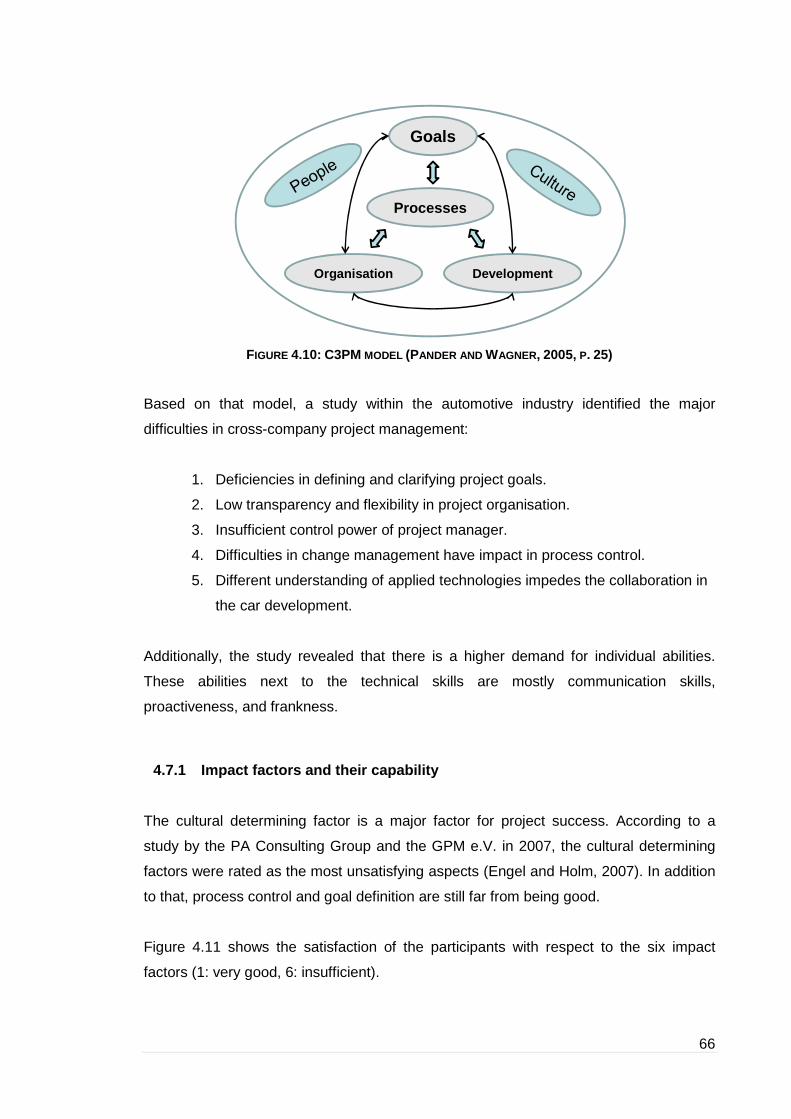
66
FIGURE 4.10: C3PM MODEL (PANDER AND WAGNER, 2005, P. 25)
Based on that model, a study within the automotive industry identified the major
difficulties in cross-company project management:
1. Deficiencies in defining and clarifying project goals.
2. Low transparency and flexibility in project organisation.
3. Insufficient control power of project manager.
4. Difficulties in change management have impact in process control.
5. Different understanding of applied technologies impedes the collaboration in
the car development.
Additionally, the study revealed that there is a higher demand for individual abilities.
These abilities next to the technical skills are mostly communication skills,
proactiveness, and frankness.
4.7.1 Impact factors and their capability
The cultural determining factor is a major factor for project success. According to a
study by the PA Consulting Group and the GPM e.V. in 2007, the cultural determining
factors were rated as the most unsatisfying aspects (Engel and Holm, 2007). In addition
to that, process control and goal definition are still far from being good.
Figure 4.11 shows the satisfaction of the participants with respect to the six impact
factors (1: very good, 6: insufficient).
Goals
DevelopmentOrganisation
Processes

67
FIGURE 4.11: SATISFACTION OF STUDY PARTICIPANTS WITH RESPECT TO I MPACT FACTORS
(WAGNER AND PANDER, 2005, P. 41)
The study by the PA Consulting Group and the GPM e.V. in 2007 revealed that 61% of
the reasons for project failure are due to communication problems and 57.3% due to
unclear requirements and goals (Engel and Holm, 2007). Figure 4.12 shows the
importance and capability of each impact factor to improve cross-company collaboration
(1: most important, 6: least important).
FIGURE 4.12: CAPABILITY OF IMPACT FACTORS TO IMPROVE CROSS -COMPANY COLLABORATION
(WAGNER AND PANDER, 2005, P. 43)
4.7.2 Ways to overcome difficulties in automotive p roject management
Automotive companies need to address the problems mentioned in the previous section
to ensure a long term and sustainable success. Several interest groups have been
formed to minimise a variety of problems. Some of them are the VDA QDX project for
quality data exchange, the Prostep iViP PDM project for product data management and
Cultural
Determining Factor
Individual Capabilities
Vehicle Development
Process Control
Project Organisation
Goal Definition
3,6
3,3
3,0
3,0
2,4
2,5
0 1,0 2,0 3,0 4,0 5,0 6,0
Cultural
Determining Factor
Individual Capabilities
Vehicle Development
Process Control
Project Organisation
Goal Definition
4,5
3,1
3,9
2,8
3,0
2,2
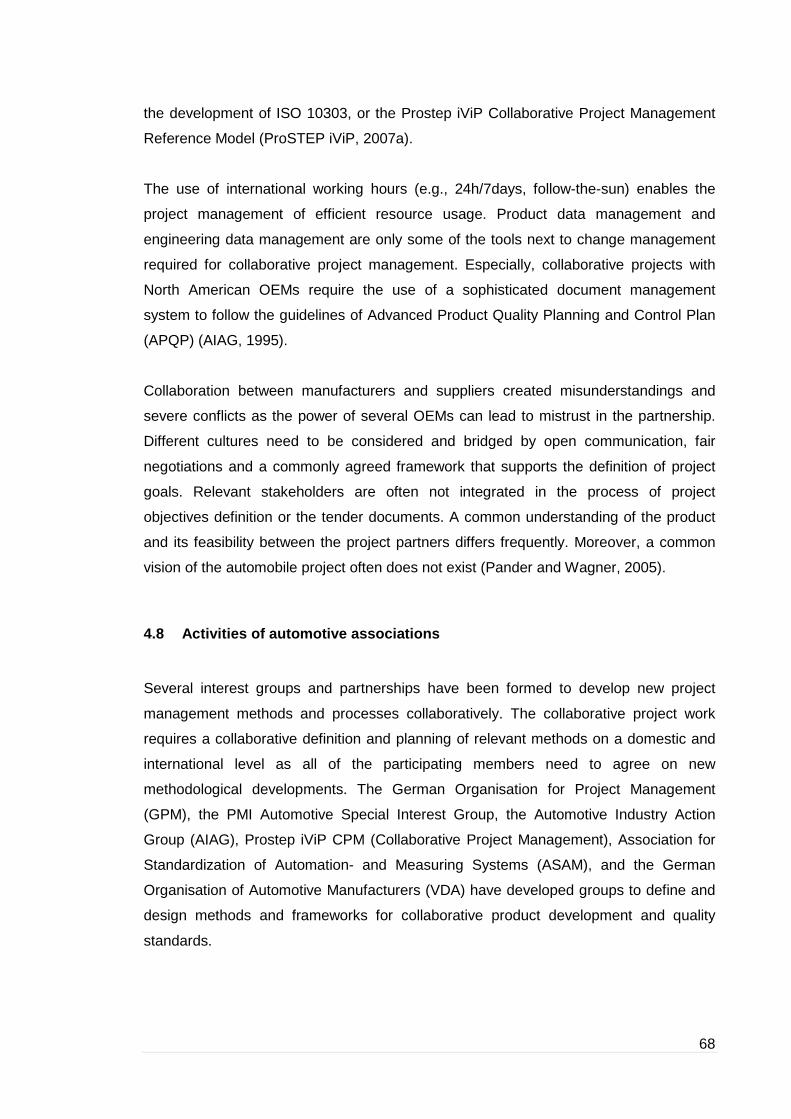
68
the development of ISO 10303, or the Prostep iViP Collaborative Project Management
Reference Model (ProSTEP iViP, 2007a).
The use of international working hours (e.g., 24h/7days, follow-the-sun) enables the
project management of efficient resource usage. Product data management and
engineering data management are only some of the tools next to change management
required for collaborative project management. Especially, collaborative projects with
North American OEMs require the use of a sophisticated document management
system to follow the guidelines of Advanced Product Quality Planning and Control Plan
(APQP) (AIAG, 1995).
Collaboration between manufacturers and suppliers created misunderstandings and
severe conflicts as the power of several OEMs can lead to mistrust in the partnership.
Different cultures need to be considered and bridged by open communication, fair
negotiations and a commonly agreed framework that supports the definition of project
goals. Relevant stakeholders are often not integrated in the process of project
objectives definition or the tender documents. A common understanding of the product
and its feasibility between the project partners differs frequently. Moreover, a common
vision of the automobile project often does not exist (Pander and Wagner, 2005).
4.8 Activities of automotive associations
Several interest groups and partnerships have been formed to develop new project
management methods and processes collaboratively. The collaborative project work
requires a collaborative definition and planning of relevant methods on a domestic and
international level as all of the participating members need to agree on new
methodological developments. The German Organisation for Project Management
(GPM), the PMI Automotive Special Interest Group, the Automotive Industry Action
Group (AIAG), Prostep iViP CPM (Collaborative Project Management), Association for
Standardization of Automation- and Measuring Systems (ASAM), and the German
Organisation of Automotive Manufacturers (VDA) have developed groups to define and
design methods and frameworks for collaborative product development and quality
standards.

69
4.8.1 The Prostep iViP CPM Reference Model
The development of project and development responsibility towards partner companies
and temporary networked structures requires a stronger connection between information
exchange and project coordination. Shorter development cycles and higher product
complexity can only be managed by an effective cooperation with partner companies.
The coordination and integration of mechanics, electronics and software becomes
increasingly detailed and causes a growing number of project partners with different
corporate cultures and development methods (Plischke and Vettermann, 2007).
The situation has initiated the project group “Collaborative Project Management (CPM)”
of the Prostep iViP Association in 2005. The objective was to develop solutions for
communication and documentation of project data, and for the control of time lines and
activities in development networks. Existing standards such as PMBoK (PMI, 2004), DIN
69000ff. VDA 4.3, the Automotive Project Management Guide, and VDA 4961 provided
the basis for a cross-company and collaborative reference model. It was considered as
essential that each partner can still apply existing and optimised internal processes
without the disclosure of core competencies. First project results were published in a
recommendation that is free for download at the association’s internet site
(www.prostep.org).
4.8.1.1 Introduction to the CPM Reference Model
The recommendation describes the project management tasks, processes, roles,
prescribed terminology, and methods to manage time, tasks and communication
collaboratively (Prostep iViP, 2007a). Next to the reference model, the project group
also developed a data exchange model that defines the data objects, which can be used
to exchange project management information between different project management
systems related to the reference model (Prostep iViP, 2007b). The reference model
aims to achieve the following objectives:
• Common agreements on collaborative aspects including documentation of
project activities, such as communication, documentation, and milestone
agreements.
• Neutral interfaces to exchange project documents, such as time plans and
activity lists.
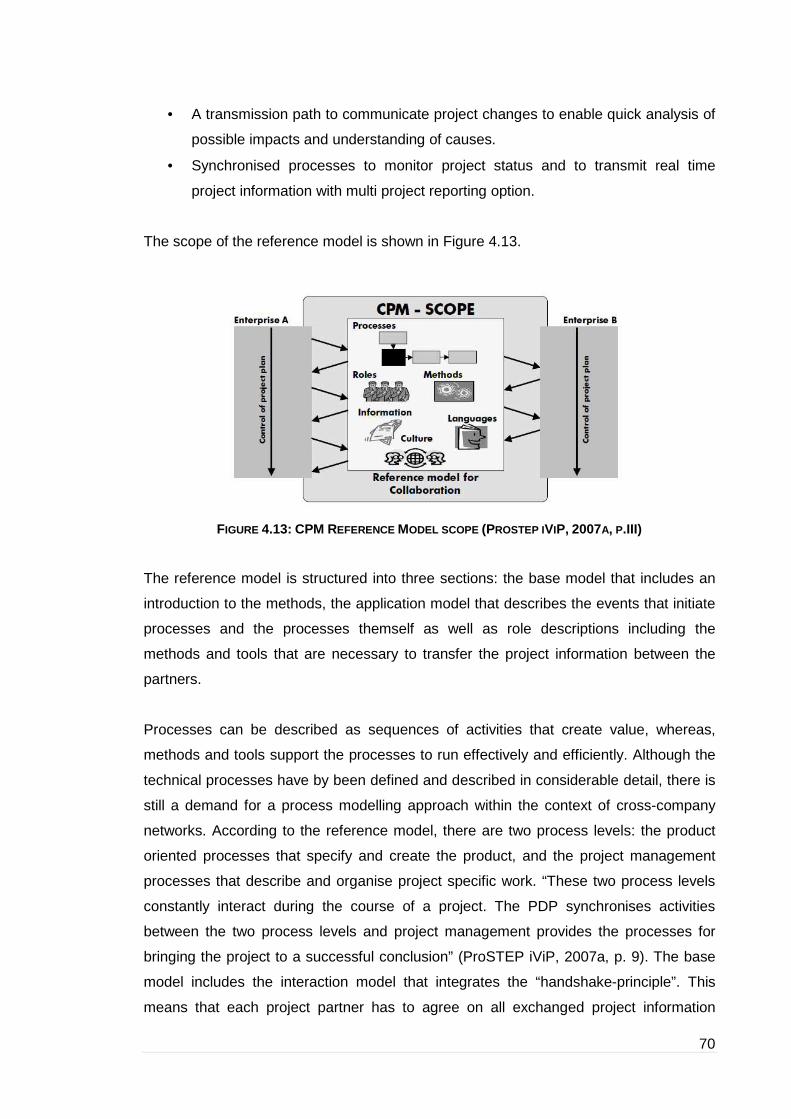
70
• A transmission path to communicate project changes to enable quick analysis of
possible impacts and understanding of causes.
• Synchronised processes to monitor project status and to transmit real time
project information with multi project reporting option.
The scope of the reference model is shown in Figure 4.13.
FIGURE 4.13: CPM REFERENCE MODEL SCOPE (PROSTEP IVIP, 2007A, P.III)
The reference model is structured into three sections: the base model that includes an
introduction to the methods, the application model that describes the events that initiate
processes and the processes themself as well as role descriptions including the
methods and tools that are necessary to transfer the project information between the
partners.
Processes can be described as sequences of activities that create value, whereas,
methods and tools support the processes to run effectively and efficiently. Although the
technical processes have by been defined and described in considerable detail, there is
still a demand for a process modelling approach within the context of cross-company
networks. According to the reference model, there are two process levels: the product
oriented processes that specify and create the product, and the project management
processes that describe and organise project specific work. “These two process levels
constantly interact during the course of a project. The PDP synchronises activities
between the two process levels and project management provides the processes for
bringing the project to a successful conclusion” (ProSTEP iViP, 2007a, p. 9). The base
model includes the interaction model that integrates the “handshake-principle”. This
means that each project partner has to agree on all exchanged project information

71
explicitly. Additionally, the relevant project terminology and cultural impacts are part of
the base model. Figure 4.14 shows the relation between these two processes.
FIGURE 4.14: RELATION BETWEEN PRODUCT DEVELOPMENT PROCESS AND PRO JECT MANAGEMENT ON
A COLLABORATIVE LEVEL (PROSTEP IVIP, 2007A, P. 9)
The application model contains all elements necessary to plan and control a CPM
project. Some of them are common milestones and synchronisation points as shown in
Figure 4.15.
FIGURE 4.15: INTERACTION CHAIN TO INTEGRATE AN ENTERTAINMENT SYST EM OF A PARTNER
(PROSTEP IVIP, 2007A, P. 22)

As shown in Figure 4.15
an internal change has an impact on the common milestones or synchronisation points
on the interaction chain.
4.8.1.2 Methods, tools a
The CPM methods describe how to apply the tools and give recommendations on an
efficient application of the processes. The three main tools of the reference model are
the interaction plan, the communicatio
a tool for time management, whereas the communication matrix facilitates the
identification of the appropriate project member to talk to for
company-internal roles to the CPM r
monitor minor deviations from the original common plan and that have an impact on one
of the project partners. The reference model also describes relevant processes and
process workflows for project plan
“initiate project”, “plan project”, “create communication matrix”, “enable milestones”,
“project team change”, “perform escalation”, or “close development project”.
includes the process description
exchange model is the fundament to extend project management systems for a CPM
application. The model is harmonised with existing standards, such as VDA QDX, OMG
PLM Services or new DIN standard for a
development. The data exchange model consists of two elements: the base data model
and the definitions regarding exchange as part of an exchange model (
FIGURE 4.16: STRUCTURE OF THE
15 coordination between the project partners is only relevant when
an internal change has an impact on the common milestones or synchronisation points
on the interaction chain.
ools and processes for cross-company project
The CPM methods describe how to apply the tools and give recommendations on an
efficient application of the processes. The three main tools of the reference model are
the interaction plan, the communication matrix, and the issue list. The interaction plan is
a tool for time management, whereas the communication matrix facilitates the
identification of the appropriate project member to talk to for a specific
internal roles to the CPM role. The issue list is a common list that is used to
monitor minor deviations from the original common plan and that have an impact on one
of the project partners. The reference model also describes relevant processes and
process workflows for project planning, execution, and control. Some of them are
“initiate project”, “plan project”, “create communication matrix”, “enable milestones”,
“project team change”, “perform escalation”, or “close development project”.
the process description for “execute escalation” as an example
exchange model is the fundament to extend project management systems for a CPM
application. The model is harmonised with existing standards, such as VDA QDX, OMG
PLM Services or new DIN standard for a project management data model that is still in
development. The data exchange model consists of two elements: the base data model
and the definitions regarding exchange as part of an exchange model (
TRUCTURE OF THE DATA EXCHANGE MODEL (PROSTEP I
72
coordination between the project partners is only relevant when
an internal change has an impact on the common milestones or synchronisation points
roject management
The CPM methods describe how to apply the tools and give recommendations on an
efficient application of the processes. The three main tools of the reference model are
n matrix, and the issue list. The interaction plan is
a tool for time management, whereas the communication matrix facilitates the
a specific topic and maps
ole. The issue list is a common list that is used to
monitor minor deviations from the original common plan and that have an impact on one
of the project partners. The reference model also describes relevant processes and
ning, execution, and control. Some of them are
“initiate project”, “plan project”, “create communication matrix”, “enable milestones”,
“project team change”, “perform escalation”, or “close development project”. Appendix A
as an example. The data
exchange model is the fundament to extend project management systems for a CPM
application. The model is harmonised with existing standards, such as VDA QDX, OMG
project management data model that is still in
development. The data exchange model consists of two elements: the base data model
and the definitions regarding exchange as part of an exchange model (Figure 4.16).
ROSTEP IVIP, 2007B, P.2)

73
4.8.1.3 Benefits of the CPM Reference Model
The reference model improves the quality of cross-company process management with
a minimum of effort due to the flexible adaptation to suit specific projects and the
development of a standard that allows traceability and repeatability. Costs and time can
be reduced and quality increased from individual elements of the model alone.
Reasons for cost avoidance are that communication errors and errors when transmitting
information between partners are avoided, errors resulting from partners having
incomplete project information are reduced, unnecessary documents are limited, and
completeness is ensured. Time can be reduced by the use of existing and proven tools
and processes, an avoidance of outlay that is required for the coordination between the
partners, and a faster problem solving. Finally, quality can be improved by a common
understanding of project management, control and collaboration, and a timely initiation
of interaction between the project partners.
4.9 Methods for process introduction
The implementation of new methods and processes also implies certain risks, e.g. the
new method or process can be incomplete or faulty when introduced to a business. An
IT solution can be a useful tool to avoid difficulties and to adjust processed accordingly.
To ensure the feasibility of process changes and to verify whether these changes can
be adopted the application of a board simulation is a possible solution and is further
described in the next section.
4.9.1 Board simulation in practice
Methods and process flows can be simulated on a board and users can learn and get
acquainted with the changes. The simulation facilitates the understanding by visualising
and also enables the users to identify mistakes or proposals for improvements in the
process flow or the method itself. Steps for optimisation are, therefore, identified before
a roll out has already taken place. This increases the efficiency of a new process
introduction. Board simulation is also useful for seminars and courses to teach new
employees before costs occur that were initiated by misinterpretations of the concept.

74
The ProSTEP iViP CPM Reference Model was also developed with the help of a board
simulation. Within several workshops, the standard was tested and verified.
4.9.2 Example: development of the ProSTEP iViP CPM Reference Model
To approve whether a standard fulfils all relevant requirements before the processes
and methods are rolled out, board simulation can be a useful approach. For the
simulation of the ProSTEP iViP CPM Recommendation (PSI 1-1), a board simulation
was developed by a company specialised on business simulators. It was tested against
the relevant processes, interrelations, objectives, expected benefits, and the methodical
tools. During the development of the simulation, many questions arose that helped to
clarify the understanding and acceptance of the users. An already existent board
simulation was adapted and the simulation was verified by several key users, mostly
OEMs, suppliers, and consultancies. Depending on the maturity of the standard, several
simulation cycles are necessary for a final evaluation and key users have to ensure that
the simulation runs without errors.
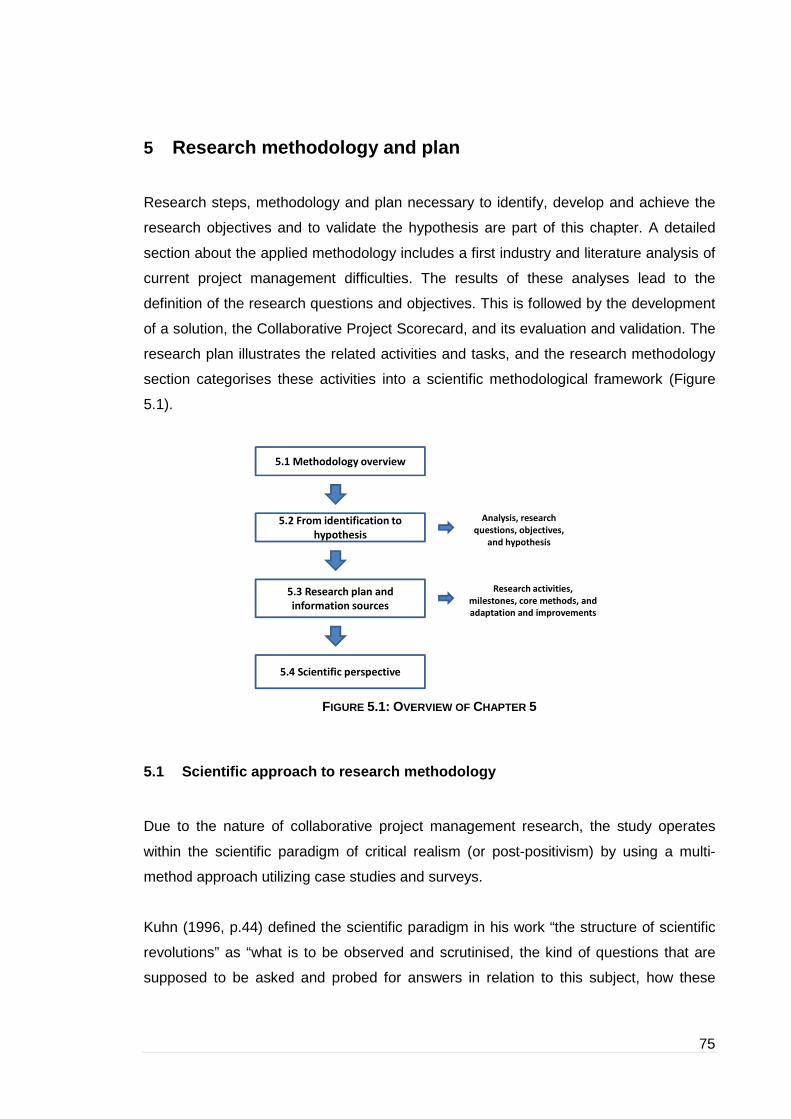
75
5 Research methodology and plan
Research steps, methodology and plan necessary to identify, develop and achieve the
research objectives and to validate the hypothesis are part of this chapter. A detailed
section about the applied methodology includes a first industry and literature analysis of
current project management difficulties. The results of these analyses lead to the
definition of the research questions and objectives. This is followed by the development
of a solution, the Collaborative Project Scorecard, and its evaluation and validation. The
research plan illustrates the related activities and tasks, and the research methodology
section categorises these activities into a scientific methodological framework (Figure
5.1).
FIGURE 5.1: OVERVIEW OF CHAPTER 5
5.1 Scientific approach to research methodology
Due to the nature of collaborative project management research, the study operates
within the scientific paradigm of critical realism (or post-positivism) by using a multi-
method approach utilizing case studies and surveys.
Kuhn (1996, p.44) defined the scientific paradigm in his work “the structure of scientific
revolutions” as “what is to be observed and scrutinised, the kind of questions that are
supposed to be asked and probed for answers in relation to this subject, how these
5.1 Methodology overview
5.2 From identification to
hypothesis
5.3 Research plan and
information sources
5.4 Scientific perspective
Analysis, research
questions, objectives,
and hypothesis
Research activities,
milestones, core methods, and
adaptation and improvements

76
questions are to be structured, how the results of scientific investigations should be
interpreted”.
Guba and Lincoln “employ Kuhn’s concept of paradigms as their foundation and
suggest that researchers adopt assumptions in the following three areas: ontology is the
fundamental assumption made about the form and nature of reality. It is concerned with
the question of what aspects of the world can be researched. Epistemology pertains to
the relationship between reality and the researcher and the methodology relates to the
process of finding out about reality; thus methodology outlines the appropriate research
tools or techniques for conducting research” (Behrend, 2004, p. 116).
Guba and Lincoln (1994) proposed four paradigms shown in the following table.
PARADIGM
ITEM Positivism Post -Positivism Critical Theory Constructivism
Ontology naive realism:
reality is real and
apprehensible
critical realism: reality
is real but only
imperfectly and
probabilistically
apprehensible;
triangulation from
many sources
required
historical realism: virtual
reality shaped by social,
political, cultural,
economic, ethnic, and
gender values;
crystallised over time
relativism: local and
specific constructed
realities
Epistemology dualists/
objectivist:
findings true
modified
dualist/objectivist
findings probably true
transactional/ subjectivist:
value-mediated findings
transactional/ subjectivist:
created findings
Methodology experiments/
surveys:
verification of
hypotheses:
chiefly
quantitative
methods
case studies/
convergent
interviewing:
triangulation,
interpretation of
research issues by
qualitative and
quantitative methods
action research in-depth interviews,
participants observation
TABLE 5.1: RESEARCH PARADIGMS (GUBA AND LINCOLN, 1994) AND (MCPHAIL AND PERRY, 2002)
Taking into account that the research used qualitative and quantitative research
methods and that the methodological approach is closely linked with own professional

77
experience and practice, the research becomes part of an action research and action
learning approach.
Coghlan (2001) identified that managers increasingly undertake action research projects
that contribute “simultaneously to basic knowledge in social science and to social action
in everyday life. High standards for developing theory and empirically testing
propositions organized by theory are not be to be sacrificed nor the relation to practice
be lost” (Coghlan, 2001, p. 50). He concludes that managers need to be aware of the
limits but also strengths of their own preunderstanding. Action research within their own
organisation is seen as an “interesting and exciting research for the development of
their own organization”. Raelin (2001) identified that traditions support the development
of the process of critical reflective practice as part of a learning experience during a
project. He illustrated the “emerging theory and the eminent practicality of engaging in
the public and critical reflective practice, especially arising from project-based learning”
(Raelin, 2001, p. 27). He encouraged the learning from that action and to bring the
stakeholders and different parties together “to generate a collective process of inquiry”.
Schoen (1983) has also identified the need for reflection that means “standing back and
learning from experience” (Crawford, 2006, p. 728). Schoen provided an approach to
understand the way managers and practitioners use reflection to achieve their
objectives in practice. This is also defined as “reflection-in-action” (Raelin, 2001, p. 19)
and means that reflection occurs in a way that “in the midst of performance one
reframes unanticipated problem situations in order to see experience differently”. As
practicing managers often deal with unforeseen situations that do not lead to a single
possibility to react, Schoen thinks that these managers need to deal with these
situations through to highly developed processes of reflection-in-action and reflection-
on-action. Crawford (2006) supported the approach and concluded that project
management education needs to address the teaching of how to become a reflective
practitioner that also is aware of recent theoretical developments and research results.
As mentioned above, this study uses qualitative (case studies/interviews) and
quantitative research methods (surveys) to gain deeper understanding of the causes
(Snow, 1993). The qualitative method uses interactive interviewing, questionnaires, and
written descriptions by participants. Results of the qualitative research will be supported
by quantitative research methods, especially by the conduction of surveys. Gable (1994)
studied the combination of several research methods for a single research project and
recommends the measuring of “objective” and quantitative distributions of outcomes.

78
Creswell and Eisenhardt suggested the application of mixed methods and case studies
for new and less developed research areas (Creswell, 2002; Eisenhardt, 1989). For the
development of methods for project planning, monitoring and control a qualitative
approach is inevitable. Yin identified research methodologies selection criteria, which
are represented in Table 5.2 (Yin, 2002).
Strategy Form of Research
Question
Requires Control
over behavioural
Events
Focus on
Contemporary
Events
Experiment How, why Yes Yes
Survey Who, what, where
how many, how much
No Yes
Archival Analysis Who, what, where,
how many, how much
No Yes/No
History How, why No No
Case study How, why No Yes
TABLE 5.2: SELECTION OF AN APPROPRIATE RESEARCH METHODOLOGY (YIN, 2002)
Generally, the approach of this research is a normative approach which tries to define
how things should be. Normative research aims at improvements, which means that it
includes an evaluation of the present state of things and also of the direction of future
development. By definition, evaluation is only possible from somebody's point of view.
Normative projects start with an informative study of the problem and then continue with
normative planning of the improvements and finally with practical action.
Modes of analysis can be hermeneutics, semiotics, or narrative and metaphor. With
respect to the case studies, content analysis, which is a form of semiotics, will be used
(Krippendorff, 1980). Within-case analysis (Miles et al., 1994) cross-case analysis
(Yin, 2002), cross-cluster analysis (Eisenhardt, 1989), and conclusion and verification
are necessary to analyse and evaluate the case studies. Miles and Huberman (1994)
categorise the analysis of qualitative data in editing, and coding, whereas coding
includes open coding, axial coding, and selective coding. This is further described in
“building an inductive theory of collaboration in virtual teams: an adapted grounded
theory approach” (Sarker, 2000).

79
5.2 Methodology overview
The applied research methodology is a multi-method approach that operates within the
scientific paradigm of post-positivism. Interviews, workshops, and surveys were
conducted to collect data and develop methods followed by a qualitative analysis of the
results. The research began with a literature review and an analysis of project
management methods and practices of a chosen automotive manufacturer including
additional interviews. As a result, the areas that needed major improvements were
identified and a possible solution, the Collaborative Project Scorecard, was developed
as a major methodological element of this research.
Workshops, surveys, and an application to a specific pilot project to obtain further
results and feedback from the industry were followed by an IT implementation, an
analysis, and a final documentation. Additionally, feedback from several publications
and presentations at conferences influenced the development of the concept during the
research project as well. Figure 5.2 shows the major steps of the research project.
FIGURE 5.2: MAJOR RESEARCH STEPS
The identified difficulties and weaknesses in project management were compared and
verified with an actual analysis of an automotive manufacturer. An existing project
management analysis that was a result of a project to improve the company’s project
management performance was extended by additional interviews and taken as a
reference to the literature review results. As already mention in Chapter 1, the concept
Literature
review
Identification of Research Need
Project Application
Development of Methodology
IT Implementation
Evaluation
Interviews,
Project
Analysis
Survey,
Workshops,
InterviewsUse Case Proof of
Concept
Documentation
Analysis
ManufacturerInterviews
2006 2007 2008
Begin of PhD
Research with manufacturer, GermanyResearch with manufacturer and
supplier, USA
Workshops
Survey
Research Steps
Operational
Methodical
Year

80
of the Balanced Scorecard that is further described in Chapter 6 was applied to project
management and extended with new integrated methods, such as the application of an
impact matrix, and its application to cross-company project management. This is
followed by a detailed adaptation of the concept to the automotive industry based on
interviews, workshops, and a survey. A research pilot project where a CPS was
developed for a cross-company project of an OEM and a supplier was the basis for an
evaluation of its benefits and limitations when developing a CPS including the appraisal
of its operation. Experiences with an IT implementation of the project results and further
extensions of the CPS concept were part of the last research steps. Extensions are a
combined approach with a collaborative project management reference model, a
performance assessment model, and a risk management approach.
5.3 From identification to hypothesis
The following sections describe how the research objectives and hypothesis were
derived from the identification of project management difficulties and weaknesses in the
automotive industry. The identification and research proposal is mainly based on
existing analyses (literature and a manufacturer analysis) and additional interviews.
5.3.1 Analysis of a manufacturer and additional int erviews
The department for product development strategy of a German automotive
manufacturer had initiated a project to improve project management effectiveness and
efficiency for internal management and with external development partners. Therefore,
in addition to the results of the literature review, the analysis results of this project and
additional interviews (members of the ProSTEP iViP CPM project, GPM e.V. Automotive
Chapter, and other experts in collaborative project management from several suppliers)
were the basis to develop the research questions and objectives. The manufacturer
analysis is based on 43 interviews, 30 of them were part of the manufacturer’s own
project management analysis based on the project experience of the project managers
during the last 2 years. The interviews about their project experience were already
documented at the time when this research project began. Figure 5.3 illustrates the
steps towards the development of the research questions, objectives, and hypothesis.
The results of 43 interviews were combined and compared with the results of the
literature review to identify the major common core difficulties and weaknesses.

81
FIGURE 5.3: STEPS TOWARDS RESEARCH QUESTIONS , OBJECTIVES , AND HYPOTHESIS
Overview of conducted interviews:
• Interviews with five project managers of the chosen manufacturer from different
departments (department of process and project management strategy, quality,
and project management IT support).
• Interviews with representatives of the GPM Automotive Project Management
Group.
• Interviews with CPM project group members (Life Cycle Engineers, Prostep AG,
Actano).
• Interviews with project managers from Bosch GmbH in Japan, and Yokogawa in
Japan and Australia.
Interview questions were addressed to the participants with relevant experience in a
certain area only. Research relevant results of the manufacturer´s 30 interviews that are
based on vehicle projects are:
• Time and resource management are often independent processes and do not
match.
• Redundant project management data storage.
• Lack of defined processes at synchronisation points, milestones, and maturity
stages.
• Differing collaboration methods with different processes and tools.
• Status of project maturity not clearly defined and evaluation often not possible.
Analysis of manufacturerbased on 30 interviews
5 additional interviewswith manufacturer‘s
representatives
2 interviews with GPM e.V. representatives
Automotive Chapter
3 interviews with ProSTEP iViP CPM
project members
3 interviews with suppliers in Japan and
Australia
Literature Review
Existing
Analysis
13 addittional interviews
Research Questions,Objectives, and
Hypothesis
Com
bining 43 Interviews
Alignm
ent of Interview R
esultsw
ith Literature Review
Verification of Literature Review

82
• Project management methods are not entirely integrated.
• Relevant key performance indicators to monitor and control project activities
collaboratively have not been entirely identified.
• Evaluation of project target attainability difficult.
• Lack of resource planning transparency.
• Lack of adequate change management for project schedules.
• Scope, risks, and resource management have different reporting cycles.
• Maturity stage control often missing.
Based on the 13 interviews with CPM project members, GPM representatives, and
Australian and Japanese suppliers the following problems have occurred in most of the
projects:
• Risk management methods of collaborative product development projects are
not sufficiently developed.
• Methods and processes for monitoring and control of time, task, risks, resources,
scope, and communication management are not entirely integrated and
synchronised sufficiently.
• Variables and characteristics to evaluate and measure performance
collaboratively have not been entirely identified.
• Project goals are not clearly defined and not aligned with business strategies.
• Stakeholder not sufficiently integrated.
• Partially defined documentation processes.
• Low project transparency and cause-and-effect relationships are often not clear
and transparent.
• Corrective action often not pre-defined and, therefore, measures taken late.
The combination and selection of the difficulties and weaknesses identified by the
manufacturer’s analysis and the additional interviews with the literature review results
determines the following core difficulties that are addressed by this research:
• Deficiencies in defining and clarifying project goals.
• Low transparency and flexibility in project organisation.
• Status of project maturity not clearly defined and evaluation difficult.
• Project goals not clearly defined and aligned with business strategies.
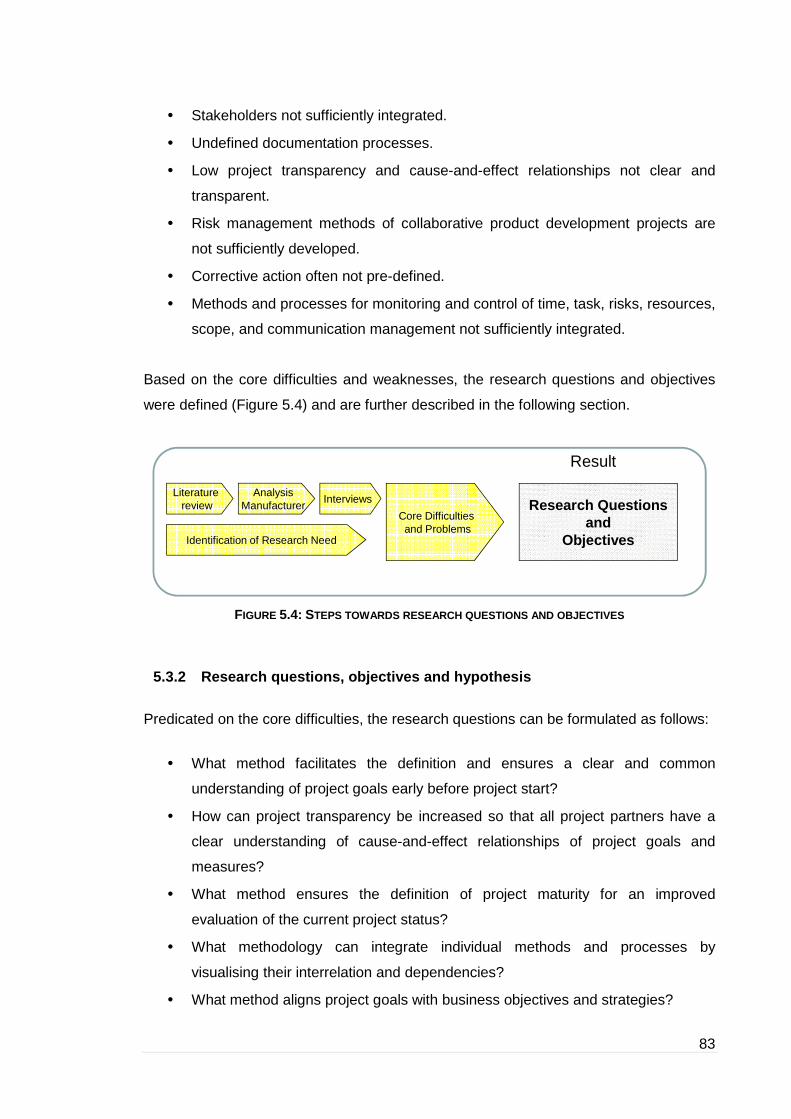
83
• Stakeholders not sufficiently integrated.
• Undefined documentation processes.
• Low project transparency and cause-and-effect relationships not clear and
transparent.
• Risk management methods of collaborative product development projects are
not sufficiently developed.
• Corrective action often not pre-defined.
• Methods and processes for monitoring and control of time, task, risks, resources,
scope, and communication management not sufficiently integrated.
Based on the core difficulties and weaknesses, the research questions and objectives
were defined (Figure 5.4) and are further described in the following section.
FIGURE 5.4: STEPS TOWARDS RESEARCH QUESTIONS AND OBJECTIVES
5.3.2 Research questions, objectives and hypothesis
Predicated on the core difficulties, the research questions can be formulated as follows:
• What method facilitates the definition and ensures a clear and common
understanding of project goals early before project start?
• How can project transparency be increased so that all project partners have a
clear understanding of cause-and-effect relationships of project goals and
measures?
• What method ensures the definition of project maturity for an improved
evaluation of the current project status?
• What methodology can integrate individual methods and processes by
visualising their interrelation and dependencies?
• What method aligns project goals with business objectives and strategies?
Literature review
Identification of Research Need
AnalysisManufacturer
Interviews Research Questionsand
Objectives
Result
Core Difficulties and Problems
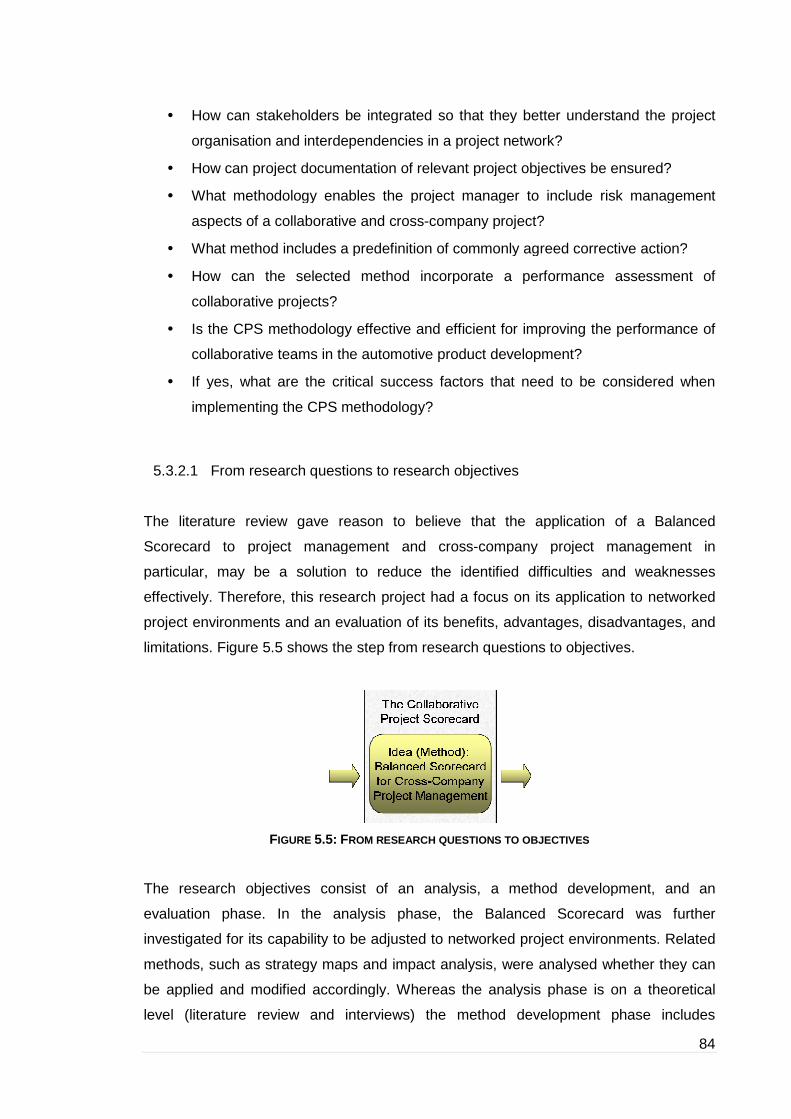
• How can stakeholders be integrated so that they better understand the
organisation and interdependencies in a project network?
• How can project documentation of relevant project objectives be ensured?
• What methodology enables the project manager to include risk management
aspects of a collaborative and cross
• What method includes a predefinition of commonly agreed corrective action?
• How can the selected method incorporate a performance assessment of
collaborative projects?
• Is the CPS methodology effective and efficient for improving the performance of
collaborative teams in the automotive product development?
• If yes, what are the critical success factors that need to be considered when
implementing the CPS methodology?
5.3.2.1 From research
The literature review gave reason to believe that the application of a Balanced
Scorecard to project management and cross
particular, may be a solution to reduce the identified difficulties and weaknesses
effectively. Therefore, this research project had a focus on its application to networked
project environments and an evaluation of its benefits, advantages, disadvantages, and
limitations. Figure 5.5
FIGURE
The research objectives consist of an analysis, a method development, and
evaluation phase. In the analysis phase, the Balanced Scorecard
investigated for its capability to be adjusted to networked project environments. Related
methods, such as strategy maps and impact analysis,
be applied and modified accordingly. Whereas the analysis phase is on a theoretical
level (literature review and interviews) the method development phase includes
How can stakeholders be integrated so that they better understand the
organisation and interdependencies in a project network?
How can project documentation of relevant project objectives be ensured?
What methodology enables the project manager to include risk management
aspects of a collaborative and cross-company project?
What method includes a predefinition of commonly agreed corrective action?
How can the selected method incorporate a performance assessment of
collaborative projects?
Is the CPS methodology effective and efficient for improving the performance of
collaborative teams in the automotive product development?
If yes, what are the critical success factors that need to be considered when
implementing the CPS methodology?
esearch questions to research objectives
The literature review gave reason to believe that the application of a Balanced
Scorecard to project management and cross-company project management in
particular, may be a solution to reduce the identified difficulties and weaknesses
e, this research project had a focus on its application to networked
project environments and an evaluation of its benefits, advantages, disadvantages, and
shows the step from research questions to objectives.
IGURE 5.5: FROM RESEARCH QUESTIONS TO OBJECTIVES
The research objectives consist of an analysis, a method development, and
evaluation phase. In the analysis phase, the Balanced Scorecard
investigated for its capability to be adjusted to networked project environments. Related
as strategy maps and impact analysis, were analysed whether they can
be applied and modified accordingly. Whereas the analysis phase is on a theoretical
level (literature review and interviews) the method development phase includes
84
How can stakeholders be integrated so that they better understand the project
How can project documentation of relevant project objectives be ensured?
What methodology enables the project manager to include risk management
What method includes a predefinition of commonly agreed corrective action?
How can the selected method incorporate a performance assessment of
Is the CPS methodology effective and efficient for improving the performance of
collaborative teams in the automotive product development?
If yes, what are the critical success factors that need to be considered when
The literature review gave reason to believe that the application of a Balanced
company project management in
particular, may be a solution to reduce the identified difficulties and weaknesses
e, this research project had a focus on its application to networked
project environments and an evaluation of its benefits, advantages, disadvantages, and
shows the step from research questions to objectives.
BJECTIVES
The research objectives consist of an analysis, a method development, and an
evaluation phase. In the analysis phase, the Balanced Scorecard was further
investigated for its capability to be adjusted to networked project environments. Related
analysed whether they can
be applied and modified accordingly. Whereas the analysis phase is on a theoretical
level (literature review and interviews) the method development phase includes

85
workshops, surveys and questionnaires to allow the integration of experience and know-
how from a wide selection of project managers and strategists.
In relation to the research questions the objectives are to analyse, develop, and
evaluate the Balanced Scorecard applied to cross-company project management to
improve the difficulties and problems of:
• Low transparency and flexibility in project organisation and problems in defining
and clarifying project goals.
• No alignment of project goals with business strategies and low stakeholder
integration.
• Insufficient integrated monitoring and control of relevant project management
areas, such as time, task, risk, resources, scope, corrective action and target
management.
• Difficult identification and evaluation of project status and no method to predefine
commonly agreed corrective action and control measures.
The evaluation phase aims to verify whether the concept reduces the weaknesses
and difficulties, and whether it also impedes or improves a cross-company project in
other areas. Figure 5.6 illustrates the three phases of the research objectives.
FIGURE 5.6: PHASES OF RESEARCH OBJECTIVES
MethodDevelopment
Method Validation
and Evaluation
Analysis
Phase
I
II
III
Research Objectives
Analyse the capabilities of the Balanced Scorecard applied to cross-company and collaborative project management to address research questions (theoretical level)
Develop, modify, and adjust method to a methodology by workshops, interviews, and surveys as information source
Validate developed methodology by applying to a project, and implementing IT solution; evaluate benefits, advantages, limitations, and disadvantages
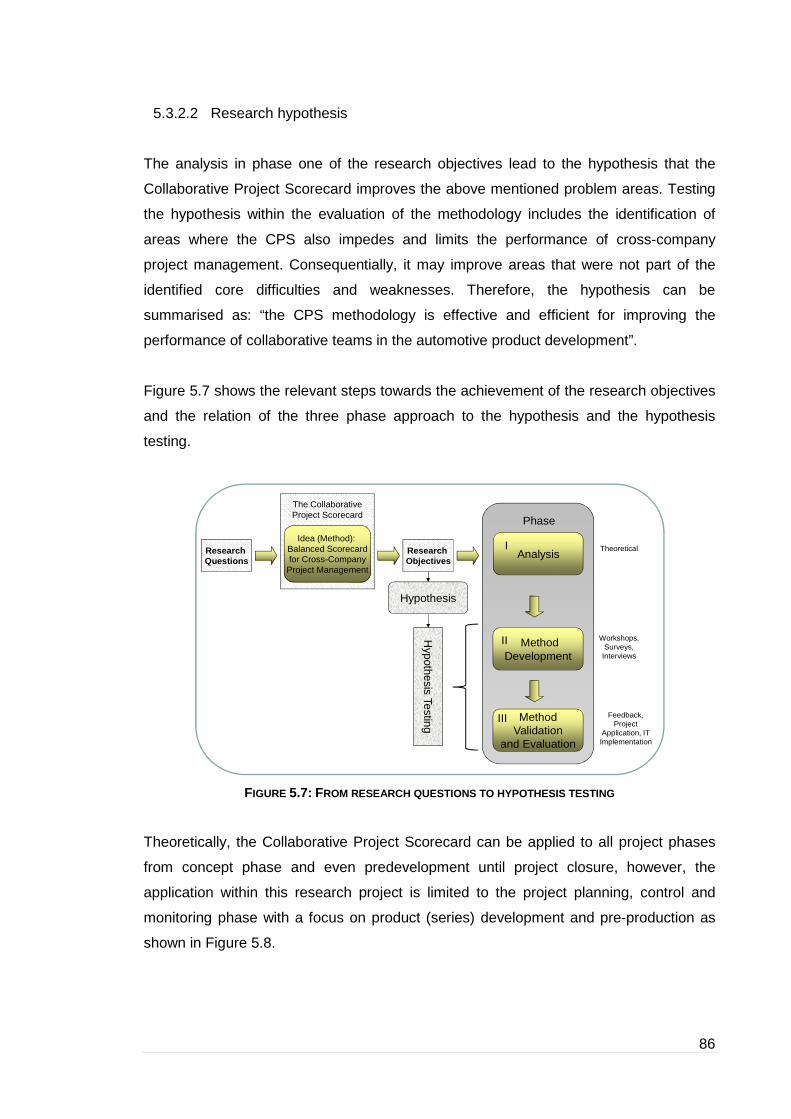
86
5.3.2.2 Research hypothesis
The analysis in phase one of the research objectives lead to the hypothesis that the
Collaborative Project Scorecard improves the above mentioned problem areas. Testing
the hypothesis within the evaluation of the methodology includes the identification of
areas where the CPS also impedes and limits the performance of cross-company
project management. Consequentially, it may improve areas that were not part of the
identified core difficulties and weaknesses. Therefore, the hypothesis can be
summarised as: “the CPS methodology is effective and efficient for improving the
performance of collaborative teams in the automotive product development”.
Figure 5.7 shows the relevant steps towards the achievement of the research objectives
and the relation of the three phase approach to the hypothesis and the hypothesis
testing.
FIGURE 5.7: FROM RESEARCH QUESTIONS TO HYPOTHESIS TESTING
Theoretically, the Collaborative Project Scorecard can be applied to all project phases
from concept phase and even predevelopment until project closure, however, the
application within this research project is limited to the project planning, control and
monitoring phase with a focus on product (series) development and pre-production as
shown in Figure 5.8.
Research Questions
MethodDevelopment
Idea (Method): Balanced Scorecardfor Cross-Company
Project Management
Hypothesis
Hypothesis Testing Method
Validationand Evaluation
Workshops, Surveys,
Interviews
Feedback, Project
Application, IT Implementation
Research Objectives
Analysis
Phase
I
II
III
Theoretical
The Collaborative Project Scorecard
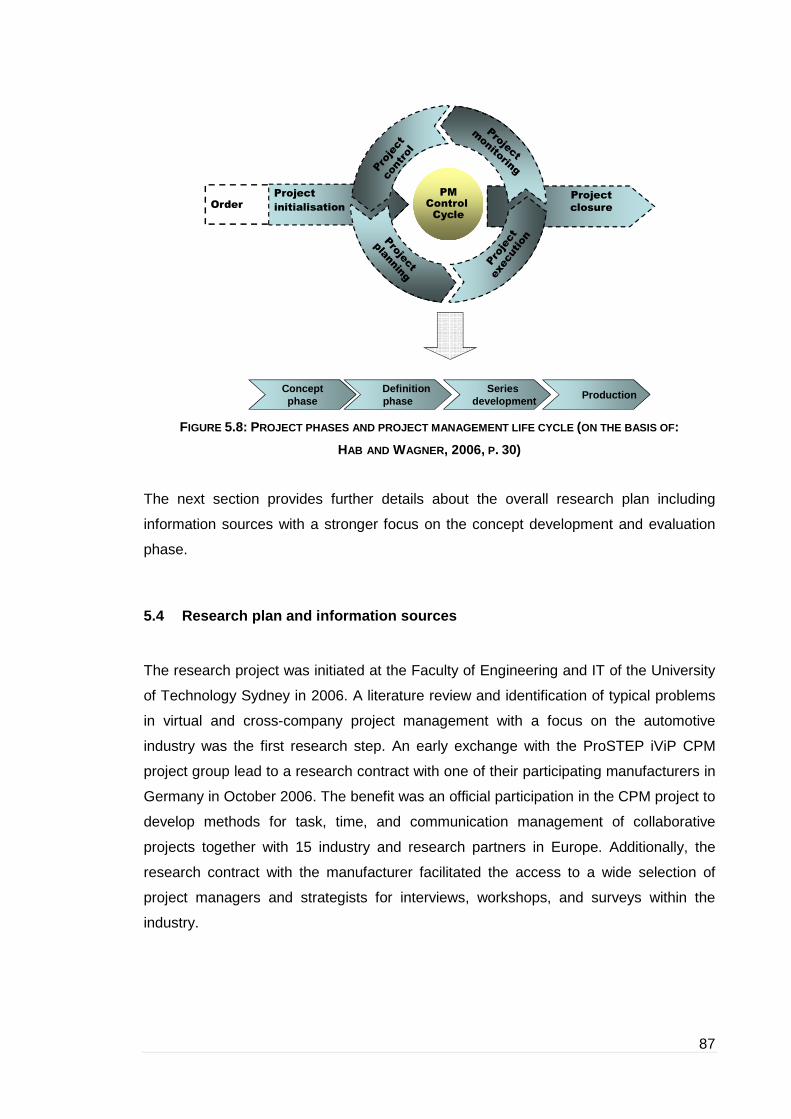
87
FIGURE 5.8: PROJECT PHASES AND PROJECT MANAGEMENT LIFE CYCLE (ON THE BASIS OF :
HAB AND WAGNER, 2006, P. 30)
The next section provides further details about the overall research plan including
information sources with a stronger focus on the concept development and evaluation
phase.
5.4 Research plan and information sources
The research project was initiated at the Faculty of Engineering and IT of the University
of Technology Sydney in 2006. A literature review and identification of typical problems
in virtual and cross-company project management with a focus on the automotive
industry was the first research step. An early exchange with the ProSTEP iViP CPM
project group lead to a research contract with one of their participating manufacturers in
Germany in October 2006. The benefit was an official participation in the CPM project to
develop methods for task, time, and communication management of collaborative
projects together with 15 industry and research partners in Europe. Additionally, the
research contract with the manufacturer facilitated the access to a wide selection of
project managers and strategists for interviews, workshops, and surveys within the
industry.
Conceptphase
Definitionphase
Seriesdevelopment Production
Order Project
closure
Project
initialisation
PMControl Cycle

88
5.4.1 Research activities on an international level
The established contacts with the German Project Management Association (GPM e.V)
Automotive Chapter was another valuable information source as two workshops for the
development of the CPS methodology were organised in 2007 at two different supplier
facilities in Germany. Access to the project management community facilitated another
survey to obtain relevant feedback and an assessment of the concept. The ProSTEP
iViP association that has a focus on the automotive industry (next to aeronautical and
aerospace organisations), and the GPM e.V. were both research partners that enriched
the outcome of this research greatly.
Other research partners, such as the Bosch GmbH in Japan and Yokogawa in Japan
and Australia, together with a five months research period at the German automobile
manufacturer’s facilities in the USA made it possible to operate the research activities
on an international level.
5.4.2 Milestones and information sources
The first major milestones of the research project were the beginning of the project in
January 2006 and the start of the research cooperation with the German manufacturer
in Munich in October 2006. Business needs were identified and research questions
developed based on the literature review, internal survey, and interviews. The doctoral
assessment took place in March 2007 and shortly after, the cooperation with the GPM
e.V. Automotive Chapter began. The two workshops were fundamental to the general
concept development. In January 2008, the research at the manufacturer’s plant in the
USA was continued and the adaptation to the business requirements of an OEM -
supplier project with an IT implementation supported the evaluation and validation of the
CPS concept. Next to the two GPM workshops, other workshops in the USA, surveys,
and additional interviews were sources of information necessary for the concept
development and evaluation. Figure 5.9 illustrates the research plan and categorises
the aspects of timeline, procedure, and information source.

89
FIGURE 5.9: RESEARCH PLAN
Within the first and second GPM e.V. workshop at Dräxlmaier Group in Vilsbiburg and
Mueller Weingarten AG in Erfurt, both German automotive suppliers, the CPS
methodology was broadened by defining the four perspectives of the CPS, by
developing a procedure model to introduce the CPS into a business, and by identifying
relevant measures for typical automotive projects, and finally, by the application to small
and medium sized businesses.
5.4.3 A variety of core methods as part of the CPS m ethodology
The application of Kaplan and Norton’s strategy map to project management (Kaplan
and Norton, 1996) and the development of the collaborative project impact matrix were
already integrated contributions of this research project before the GPM e.V. workshops
took place. Both methods are described in Chapter 7. During the research in the USA, a
CPS was developed for a specific cross-company project for the launch and change
management phase. A workshop, several interviews, and a survey were the basis for
the results presented in Chapter 8. Additionally, the integration of collaborative risk
management, the extension with a strategic framework, and the IT implementation
followed by a further evaluation were the outcome of the research in South Carolina.
Collaboration with the GPM Automotive Chapter and the ProSTEP iViP was again
February
2009
ThesisSubmission
Begin research with manufacturer,
Germany
Literature Review
Identification Business
needs
2007 2008
Masters Thesis
Doctoral Assessment
Concept Development
Begin of PhD
Validation & Evaluation
Documentation
Milestones, Time Line, and Information Sources:
Timeline
January 2006
1st GPM Workshop
2nd GPM Workshop
Workshop: Manufacturer & Supplier, USA
UTS Students
Information Source
Survey
Interviews
Procedure
Begin research with manufacturer, USA
Manufacturer, GermanyManufacturer, USA
GPM e.V.
ProSTEP iViP
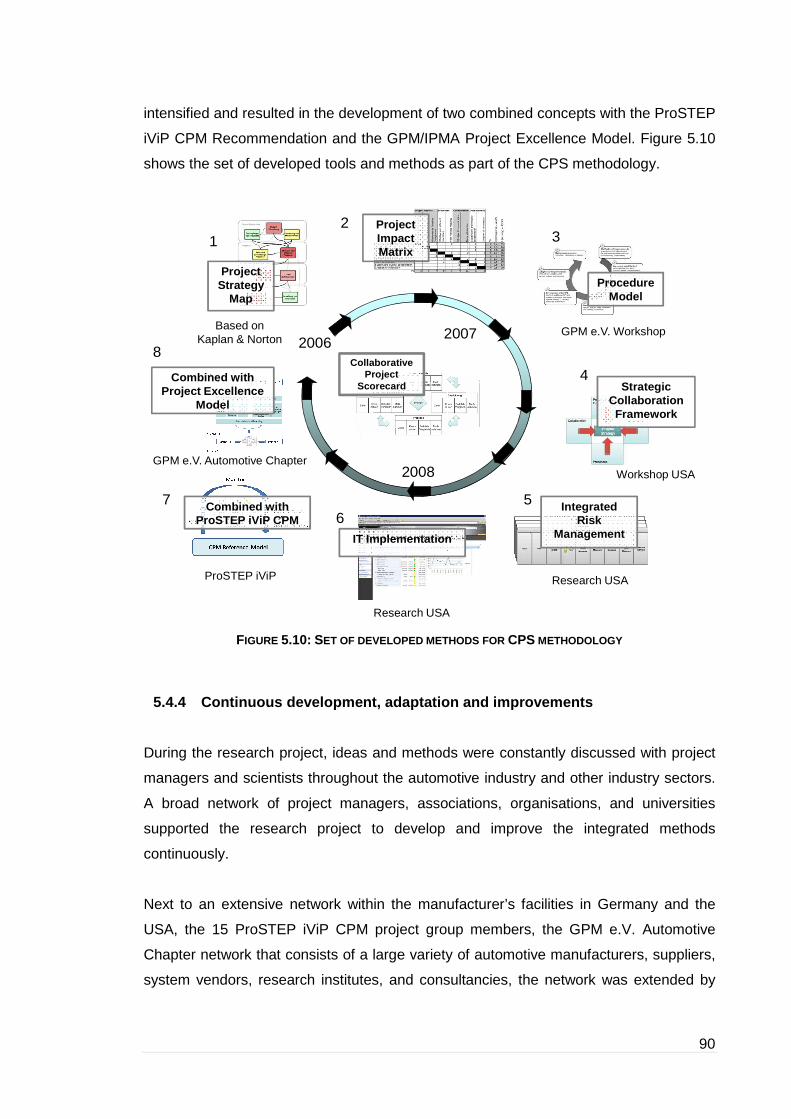
90
intensified and resulted in the development of two combined concepts with the ProSTEP
iViP CPM Recommendation and the GPM/IPMA Project Excellence Model. Figure 5.10
shows the set of developed tools and methods as part of the CPS methodology.
FIGURE 5.10: SET OF DEVELOPED METHODS FOR CPS METHODOLOGY
5.4.4 Continuous development, adaptation and improve ments
During the research project, ideas and methods were constantly discussed with project
managers and scientists throughout the automotive industry and other industry sectors.
A broad network of project managers, associations, organisations, and universities
supported the research project to develop and improve the integrated methods
continuously.
Next to an extensive network within the manufacturer’s facilities in Germany and the
USA, the 15 ProSTEP iViP CPM project group members, the GPM e.V. Automotive
Chapter network that consists of a large variety of automotive manufacturers, suppliers,
system vendors, research institutes, and consultancies, the network was extended by
Collaborative Project
Scorecard
ProjectStrategy
Map
Based on Kaplan & Norton
Project Impact Matrix
12
Procedure Model
3
GPM e.V. Workshop
Strategic Collaboration Framework
IntegratedRisk
ManagementIT Implementation
Workshop USA
Research USA
Research USA
Combined withProSTEP iViP CPM
Combined withProject Excellence
Model
4
56
7
8
ProSTEP iViP
GPM e.V. Automotive Chapter
20062007
2008

91
several University contacts, and members of project management associations
worldwide.

92
6 Balanced Scorecard and project management
In the beginning of the 1990s David Norton and Robert Kaplan developed the Balanced
Scorecard method at the Harvard University. Since then the concept has supported
businesses to translate their vision and mission into operational objectives. The driving
force is a balanced relationship between traditional measures and the most important
factors that impact future performance. The application of the Balanced Scorecard
(BSC) to project management is a strategic approach that supports the alignment of
project objectives with business strategies and goals. This chapter illustrates strategic
approaches in project management and identifies relevant applications of the Balanced
Scorecard to project management. It also includes recent study results of the BSC
application and illustrates the concept of strategy maps. Figure 6.1 shows the structure
of this chapter.
FIGURE 6.1: OVERVIEW OF CHAPTER 6
The application of a strategy map to project management is further discussed as one of
the contributions of this research project. In a next step this chapter describes the
application of a BSC to project management and the concept of a Project Scorecard
including relevant KPIs. Performance measurement with a PSC, x-engineering, and the
increasing demand for a Collaborative Project Scorecard are elements of the last
section.
6.1 Strategic approach to
project management
6.2 The BSC for strategy based
management
6.3 Managing projects with a
BSC
6.4 The Project Scorecard
Recent BSC study
results and strategy
maps
Managing by objectives
and Hoshin process
Structure, methods, KPIs, risk
management, and the PSC as
an adaptive approach
6.5 The BSC for cross-company
project management
Performance measurement, x-
engineering, and demand for a
Collaborative Project
Scorecard

93
The balanced consideration of different goals that cover the perspectives of financial
aspects, the satisfaction of the customer’s expectation and requirements, internal
business processes, and aspects related to continuous learning and development
enables a holistic view over all relevant business objectives. Strategic and sustainable
success is also ensured by monitoring and control of financial and non-financial targets.
The Balanced Scorecard is structured into the four perspectives as mentioned above
and each perspective includes related objectives, which are monitored by measurable
targets and defined indicators (Herde et al., 2001). These indicators are often called key
performance indicators (KPIs) and in some literature there is a distinction of KPIs and
key goal indicators (KGIs), whereas KGIs are more goal oriented indicators rather than
measures for performance only. Within the following chapters, only KPIs are used to
describe indicators for performance or goal achievement.
6.1 Strategic approach to project management
The education of strategy has become an important part of lectures and management
seminars worldwide, however, the enormous growth of internet facilities and “internet
euphoria” has created doubts that long term strategies are no longer implementable and
quick-wins may become the dominating philosophy of many business managers. Porter
(2001) thinks that operative efficiency has overshadowed strategic thinking of leading
managers and emphasise the importance of strategic management.
6.1.1 Managing by objectives and Hoshin Process
Management by Objectives (MbO) has its origin in the 1950s and was especially
adopted by managers in the Unites States and later in Europe. A vertical top-down and
bottom-up process approach harmonises the organisational objectives with those of the
employees. The adaptation of leading processes to definite operational goals and the
creation of an environment of target achievement and performance evaluation are the
fundamentals of this management method. Target definition, control by management,
short term consideration, top-down processes and vertical hierarchy are main aspects of
MbO. The origins of the Hoshin model are based on the Total Quality Management
(TQM) concept that is also called Management by Policy (MbP). Extension to the TQM
concepts are the gathering of all operational activities to a common vision, integration of
all stakeholders, leading managers and employees, objective development with top-

94
down and bottom-up processes, long-term and quality oriented process, and a vertical
and horizontal hierarchy. The seven steps of the Hoshin planning process are shown in
Figure 6.2.
FIGURE 6.2: SEVEN STEPS OF THE HOSHIN PLANNING PROCESS (JOLAYEMI , 2008, P. 298)
The objective development process is characterised by a definition of mission and
vision, objectives, strategies, and tactics (MOST). Compared to MbO, the vision
definition takes place in the beginning of the process and strategic goals are
implemented by vertical and horizontal hierarchical structures. The Hoshin process is
finalised by an individual target agreement and regular employee agreements on
individual objectives (Herde et al., 2001, p. 298).
6.2 The Balanced Scorecard for strategy based manage ment
The Balanced Scorecard method developed by Kaplan and Norton in 1992 is a strategic
approach and a performance management system that enables organisations to
1. EstablishOrganization Vision
2. Develop3-5 Year Plan
3. DevelopAnnual Objectives
4. Deployment / Rolldown to Departments
to develop plansincluding targets
and means
5. Implementation
6. Regular ProgressReview
monthly & quarterly
7. Annual Review
Optional
Phase 1: Well-doneStrategic Planning
Phase 2: Heart of Hoshin Planning process
Act
PlanDo
Check

95
transform a company's vision and strategy into implementation by addressing four
perspectives:
• Financial perspective (e.g., earnings per share, revenue growth, profit growth).
• Customer perspective (market share, customer satisfaction, referral rate,
customer retention, etc.).
• Business process perspective (e.g., cycle time, cost of services, speed of
services).
• Learning and growth perspective (effectiveness of change to technology and
processes, speed and frequency of changes, adaptability, employee satisfaction,
willingness to share and gain knowledge, etc.).
Figure 6.3 shows the structure of the Balanced Scorecard framework with its
perspectives and core categories.
FIGURE 6.3: BALANCED SCORECARD FRAMEWORK (KAPLAN AND NORTON, 1996, P. 9)
The objectives of a BSC are to ensure that measures support core values and practices
of the organisation, to establish performance measures and benchmarks, to assess
project health, to align measures against the project’s charter, and to establish
measures that are efficient and effective, consisting of outcome, action (performance
drivers), and diagnostic (why an outcome or action measure is at its current level).
Kaplan and Norton (2001) cite the following benefits of the Balanced Scorecard usage:
• Focusing the whole organisation on the few key aspects needed to create
breakthrough performance.
FinanceFinance
TargetsTargets MetricsMetricsTarget/Actual
Compari-son
Target/Actual
Compari-son
MeasuresMeasures
CustomerCustomer
TargetsTargets MetricsMetricsTarget/Actual
Compari-son
Target/Actual
Compari-son
MeasuresMeasures
Internal ProcessesInternal Processes
TargetsTargets MetricsMetricsTarget/Actual
Compari-son
Target/Actual
Compari-son
MeasuresMeasures
Learning & DevelopmentLearning & Development
TargetsTargets MetricsMetricsTarget/Actual
Compari-son
Target/Actual
Compari-son
MeasuresMeasures
StrategyMissionVision
StrategyMissionVision

96
• Helps to integrate various corporate programs. Such as: quality, re-engineering,
and customer service initiatives.
• Breaking down strategic measures towards lower levels, so that unit managers,
operators, and employees can see what is required at their level to achieve
excellent overall performance.
The integration of the four perspectives into one picture has made the Balanced
Scorecard method very successful. For each perspective of the Balanced Scorecard
objectives, measures, targets, and initiatives are monitored (scored):
• Objectives: major objectives to be achieved, for example, profitable growth.
• Measures: the observable parameters that will be used to measure progress
towards reaching the objective. For example, the objective of profitable growth
might be measured by growth in net margin.
• Targets: the specific target values for the measures, for example, 7% annual
decline in manufacturing disruptions.
• Initiatives: projects or programs to be initiated in order to meet the objective.
The financial perspective considers the relevant result indicators of an organisation,
typical indicators are return on investment (ROI), return on capital employed (ROCE),
economic value added, or profitability and represent the upper level objectives of all
perspectives. The customer perspective represents the strategic objectives in relation to
a customer or market segment and focuses on results such as indicators to measure
customer satisfaction, price/performance relation, quality of a service, time factor,
customer relationships, etc. The learning and development perspective, or sometimes
called learning and innovation perspective, indicates the necessary future investment
areas and it describes the infrastructure that enables the achievement of the other
perspective’s targets. Employee aspects such as motivation, flexibility, team work,
learning activities, and readiness for change are indicators of this perspective. The
internal business process perspective has a focus on the critical processes, which are
relevant for the value creation chain of a company. Key processes are measured by
productivity, cost, time, or quality indicators (Herde, 2001).

97
6.2.1 Recent Balanced Scorecard study results
A recent study by Horvath and Partners in 2005 has identified the experience and
satisfaction with the Balanced Scorecard concept of 120 companies of different industry
background in Germany, Austria, and Switzerland. This was the third study that has
validated the core findings of the two former studies in 2001/2002 and in 2003.
According to this study, the BSC has a positive impact on turnover and results, as well
as on various non-financial measures such as quality and customer satisfaction. Two
thirds of the non-governmental BSC users are convinced that the annual net income of
their company has developed better than that of the competition. Also 80% of the users
estimate that the benefits of a BSC are dramatically higher than the efforts needed to
develop and maintain the BSC. Over two thirds of the study participants think that the
BSC will be of great importance for the businesses within the next three years. 80% are
also convinced that the BSC supports the strategy implementation of a business.
Further results of the study demonstrate the importance of this fact as 70% of the
participating companies confirm that their competition implements similar strategies. The
competence to implement strategies is considered a key for a company’s success and
65% of the participants believe that their strategy implementation is one of their
strengths (Horvath and Partner, 2005). Figure 6.4 is based on the questions whether a
company implements similar strategies as their competition.
FIGURE 6.4: SIMILAR STRATEGIES AS COMPETITION
Competition Implements Similar Strategies
010203040506070
absolutelycorrect
mostlycorrect
partiallycorrect
not correct
(%)
of p
artic
ipan
ts

98
Figure 6.5 shows whether a company considers its strategy implementation as a
strengths or weakness.
FIGURE 6.5: STRATEGY IMPLEMENTATION CONSIDERED AS STRENGTH OR WE AKNESS
The participants of the survey were non-governmental private businesses. Another
result of the study is that the BSC is rather applied in earlier phases of the strategy
process than before. Earlier studies showed that strategy development happened
before a BSC implementation but with the increasing acceptance of strategy maps
based on cause-and-effect relationships. Today, the BSC has been integrated at an
earlier stage and is considered as an integrated part of a closed strategy management
process. According to Horvath and Partner (2005), the Strategy Maps are only useful for
small businesses as larger enterprises are structured into several business and
functional departments that are embedded to an overall strategy and implement their
own sub strategies derived from the overall strategy, and therefore, qualify for a BSC
application. In practice, many organisations work within a system of single Balanced
Scorecards as nearly two thirds of the study participants have implemented more than
five and one third even more than 20 BSCs. This result corresponds with the study
undertaken in 2003 with a minimal increase of the number of BSCs, which have been
operationalised. Figure 6.6 shows the number of BSCs that an organisation has
implemented (from 84 organisations).
Own Strategy Implementation: Strength or Weakness
05
101520253035404550
Strength Mainly Strength RatherWeakness
Weakness
(%) o
f par
ticip
ants

99
FIGURE 6.6: NUMBER OF BSC A SINGLE ORGANISATION HAS IMPLEMENTED
Despite of the increasing maturity of the BSC application there is still room for
improvement applying the BSC more efficiently and effectively in many organisations.
Horvath and Partner (2005) identified the following aspects as relevant steps towards an
improved application of the BSC.
• A more systematic and consequent link between strategy development
and BSC development.
• An improved integration of the strategic objectives (the objective systems
that is represented by the BSC) with the budgeting.
• A professional application of strategy maps.
• Measurement of soft facts.
• The degree of penetration of the BSC concept and
• The search of an appropriate software solution.
• An improved harmonisation of the BSC with the concept of value, quality,
and risk management.
• Alignment and a more professional selection and control of strategic
project portfolios.
6.2.1.1 The Balanced Scorecard and IT support
Horvath and Partner (2005) believe that the BSC is not a reporting system but it
includes one, therefore, they have chosen the IT support as a main focus of their study.
The BSC produces strongly focused data in relation to the strategic objectives and
Number of BSC a single Organisation has implemented
05
10152025303540
1-5 6-10 11-15 16-20 21-25 26-30 31-40 41-50 51-60 >60
(%) o
f par
ticip
ants

100
therefore, in relation to the strategy implementation. Appropriate choice of supporting
systems is an important step as the BSC includes various data and information, which
have to be managed efficiently. According to their study, 74% of the participating
organisations still work with Microsoft Excel and Access for their management tasks but
a considerable part is not satisfied with this solution. Figure 6.7 shows that only 11% are
happy with their Excel and Access solutions.
FIGURE 6.7: SATISFACTION WITH OFFICE TOOL SET FOR MANAGEMENT TAS KS
6.2.2 Strategy Maps
A Strategy Map is a visual representation of the relationships between the different
perspectives, objectives and metrics of the Balanced Scorecard. Mapping these
interrelated aspects is an effective way of providing stakeholders with a macro view of
an organisation’s strategic priority. Executive managers can easily identify whether
relevant aspects are missing, verify their assumptions and rethink priorities if necessary
(Kaplan and Bower, 2004). The Strategy Map is created by visualising the different
perspectives of the Balanced Scorecard to the left side and the main financial strategies
across at the top. Figure 6.8 shows an example of a simplified and generic Strategy
Map.
Satisfaction with Office tool set for Management Tasks
0
10
20
30
40
50
60
absolutelycorrect
mostlycorrect
partiallycorrect
not correct
(%)
of p
artic
ipan
ts

101
FIGURE 6.8: SAMPLE STRATEGY MAP
The objectives and metrics of each perspective are represented as boxes. Then the
map is developed in a downward flow by drawing the cause-and-effect linkages
between these boxes. The map shows clearly how the objectives of each perspective
influence and support the overall strategic goal (Scholey, 2005).
6.3 Managing projects based on the Balanced Scorecar d
The main focus of common and traditional scorecards used in project cockpits for
project management are mainly hard facts related to time, budget and quality. These
scorecards are suitable for quick performance measurement purposes with a clear focus
on financial performance indicators. However, they reflect neither the non-financial,
intangible world nor the total strategic alignment between project strategies and
business strategies (Norrie and Walker, 2004). The changing competitive environment
with increasing numbers of cross-functional work teams and rapid technological
developments was demanding new management methods and tools in order to keep
projects successful (Salem, 2001).
Financial
Customer
Business Processes
Learning & Development
Goal F1 Goal F2 Goal F3 Goal Fx
Goal C1 Goal C2 Goal C3 Goal Cx
Goal B1 Goal B2 Goal B3 Goal Bx
Goal L1 Goal L2 Goal L3 Goal Lx
KPI KPI ... KPI KPI ... KPI KPI ... KPI KPI ...KPI KPI ...KPI KPIKPI KPI ... KPI KPI ...KPI KPIKPI KPI ... KPI KPI ...KPI KPIKPI KPI ... KPI KPI ...KPI KPIKPI KPI ...
KPI KPI ... KPI KPI ... KPI KPI ... KPI KPI ...KPI KPI ...KPI KPIKPI KPI ... KPI KPI ...KPI KPIKPI KPI ... KPI KPI ...KPI KPIKPI KPI ... KPI KPI ...KPI KPIKPI KPI ...
KPI KPI ... KPI KPI ... KPI KPI ... KPI KPI ...KPI KPI ...KPI KPIKPI KPI ... KPI KPI ...KPI KPIKPI KPI ... KPI KPI ...KPI KPIKPI KPI ... KPI KPI ...KPI KPIKPI KPI ...
KPI KPI ... KPI KPI ... KPI KPI ... KPI KPI ...KPI KPI ...KPI KPIKPI KPI ... KPI KPI ...KPI KPIKPI KPI ... KPI KPI ...KPI KPIKPI KPI ... KPI KPI ...KPI KPIKPI KPI ...
102
6.3.1 Project team performance and strategic projec t selection
Norrie and Walker (2004) explored the concept of a Balanced Scorecard applied to
projects to improve operational performance of project teams. They conclude that the
project results can be improved by monitoring and controlling project activities more
effectively. Their study provided early evidence that the Balanced Scorecard improves
project management effectiveness. This is also because it facilitates the communication
with internal and external project stakeholders.
Norrie (2006) further investigated the BSC approach for strategic project selection and
demonstrated that the use of a strategic scoring model can enhance the
understandability of project portfolio management and improve the probability of
optimising the project selection for a project portfolio. Stewart and Mohamed (2001)
utilised the Balanced Scorecard for IT and IS performance evaluation in the construction
industry. They concluded that the BSC framework is useful to evaluate IT performance
and Stewart et al. (2007, p. 517) later applied the model and could prove that “firms
which provide reliable IT-systems that are well-supported and user-friendly will achieve
higher IT-induced performance improvement in the operational, strategic
competitiveness and benefits perspectives”.
6.3.2 Projects as mini-organisations
Stewart (2001) has also conducted research into the application of Balanced
Scorecards to project environments and identified relevant key performance indicators
(KPIs) to perform project “health checks” throughout the life cycle.
Projects can be considered mini-organisations, requiring the same clarifications and
benchmarks of the organisation. Stewart (2001) also states data must be collected
consistently and at pre-defined times. The scores should assist the project manager to:
• Monitor critical tasks.
• Assist in tracking factors that are critical to customer satisfaction.
• Observe trends across and within projects.
• Reveal variances from established controls.
• Provide early warning signals.
• Assist in planning for continuous improvement in all BSC perspectives.

103
The customer perspective looks at the market value of the project deliverable as well as
stakeholder satisfaction in the project outcome. The internal business perspective
incorporates the management plan that is developed during the planning phase and
utilises the established processes. It evaluates the scope, timelines, performance, and
costs. The financial perspective examines how the organisation looks to shareholders
and if the project outcome generates the expected revenue. The innovative and learning
perspective aims to achieve continuous improvement and innovation to the
organisation. The scorecard must be built on communication, compliance, continuous
improvement, and cooperation. A project can be considered as an organisation with a
vision, and strategies to meet project objectives (Stewart, 2001).
6.4 The Project Scorecard
Using the Balanced Scorecard for project management, the focus of project
management shifts from the traditional and financial point of view to a more holistic
view. The scorecard is then often called Project Scorecard (PSC). The PSC allows
project management not only to consider non-financial, intangible assets and related
performance indicators, but also to ensure a better strategic fit with the overall business.
Through clear cause-and-effect interrelations between the non-financial and financial
performance indicators, achievements of objectives become measurable and, therefore,
manageable (Stewart, 2001). This is a key advantage of the Project Scorecard.
Consequently, the Balanced Scorecard can be used very broadly in the project
management process, as it combines overall planning, controlling and monitoring
processes.
Using a Balanced Scorecard for projects helps the project manager and stakeholders to
check and validate strategies, goals and indicators against the previously established
expectations. Furthermore, it supports the overall understanding of the project and
hence motivation of the project team. Continuously, objectives and their level of
achievement are measured in order to control the project with corrective actions. With
periodical reviews, new findings can be implemented into the project process (Selders
and Maerkle, 2004).

104
6.4.1 Structure and organisational integration of t he Project Scorecard
The following sections illustrate the structure of the Project Scorecard in relation to
strategies, objectives, and processes and describe how the concept is integrated and
incorporated into an organisation.
6.4.1.1 Structure of a PSC
The Project Scorecard can be structured into three elements: levels, cause-and-effect
relationships, and indicators. The levels are business strategies, strategic project goals,
project objectives (scope, quality, time, and costs), project processes and project
potentials (team members, infrastructure, and external service provider). Figure 6.9
shows the hierarchical structure of the four levels as defined by Selders and Märkle
(2003).
FIGURE 6.9: FOUR LEVELS OF A PROJECT SCORECARD (SELDERS AND MAERKLE , 2003, P.3)
Figure 6.10 illustrates the PSC framework. In the centre of the PSC are now project
strategies that describe how the objectives can be achieved most efficiently and
effectively.
Business Strategies
Strategic Project Goals
Project Objectives
Project Processes
Project Potentials
Business Strategies
Strategic Project Goals
Project Objectives
Project Processes
ProjectPotentials
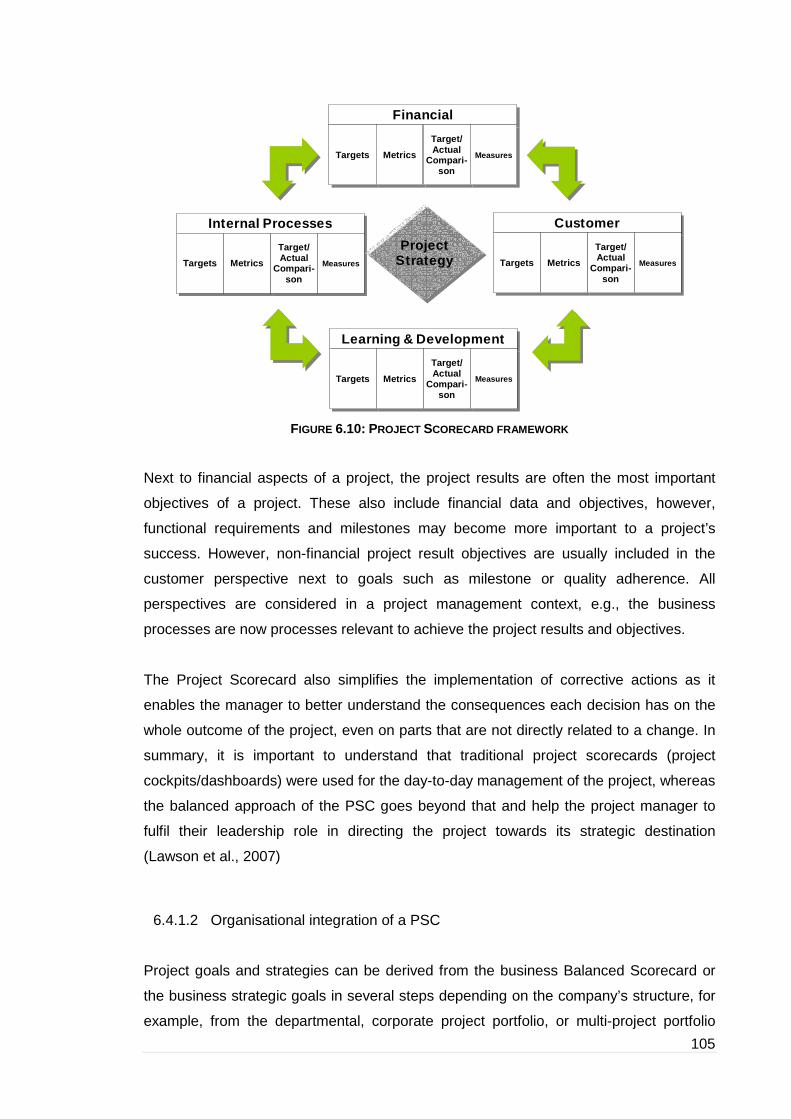
105
FIGURE 6.10: PROJECT SCORECARD FRAMEWORK
Next to financial aspects of a project, the project results are often the most important
objectives of a project. These also include financial data and objectives, however,
functional requirements and milestones may become more important to a project’s
success. However, non-financial project result objectives are usually included in the
customer perspective next to goals such as milestone or quality adherence. All
perspectives are considered in a project management context, e.g., the business
processes are now processes relevant to achieve the project results and objectives.
The Project Scorecard also simplifies the implementation of corrective actions as it
enables the manager to better understand the consequences each decision has on the
whole outcome of the project, even on parts that are not directly related to a change. In
summary, it is important to understand that traditional project scorecards (project
cockpits/dashboards) were used for the day-to-day management of the project, whereas
the balanced approach of the PSC goes beyond that and help the project manager to
fulfil their leadership role in directing the project towards its strategic destination
(Lawson et al., 2007)
6.4.1.2 Organisational integration of a PSC
Project goals and strategies can be derived from the business Balanced Scorecard or
the business strategic goals in several steps depending on the company’s structure, for
example, from the departmental, corporate project portfolio, or multi-project portfolio
FinancialFinancial
TargetsTargets MetricsMetricsTarget/Actual
Compari-son
Target/Actual
Compari-son
MeasuresMeasures
CustomerCustomer
TargetsTargets MetricsMetricsTarget/Actual
Compari-son
Target/Actual
Compari-son
MeasuresMeasures
Internal ProcessesInternal Processes
TargetsTargets MetricsMetricsTarget/Actual
Compari-son
Target/Actual
Compari-son
MeasuresMeasures
Learning & DevelopmentLearning & Development
TargetsTargets MetricsMetricsTarget/Actual
Compari-son
Target/Actual
Compari-son
MeasuresMeasures
ProjectStrategyProject
Strategy

106
objectives. Although, a BSC that is already implemented facilitates the development of a
PSC, it is not a requirement. Stewart (2001, p39) states that all projects are “built around
standard business objectives for success”, and identified the minimum measurements
included in a Balanced Scorecard. Stewart also suggests that a BSC “should be used to
measure an organisation’s project portfolio rather than an individual project”. This
statement contradicts the assumption of the proposed method. By already implementing
a BSC concept on a project level, the project portfolio manager can access the relevant
key performance indicators categorised by the four perspectives of each project and
align the project goals with the portfolio strategy using the same methodological
approach. The advantage is a more integrated management structure with standardised
reporting systems.
Figure 6.11 shows how a PSC can be derived, either from the business BSC or the
project goals.
FIGURE 6.11: DERIVATION OF A PSC (NIEBECKER ET AL., 2008A, P. 372)
6.4.1.3 Project Strategy Map and Impact Matrix Analysis
To describe the strategy of a business, a Strategy Map facilitates the visualisation of the
cause and effect relationships between business objectives (Kaplan and Norton, 1996).
Project Strategy & Objectives
Multi Project Management
Balanced Scorecard
E.g., Portfolio Scorecard
Business
Organisation
Business
Division
Projects
Business Management
Project Management
Project Scorecard
Vision
Mission
Strategy
Strategies & Objectives
Organisational Integration of the PSC

107
To identify and illustrate these relationships of a project, the concept of a Strategy Map
can be modified and, e.g., applied to a product development project.
The Project Strategy Map (PSM) is an important element of the strategic management
of organisations and projects, and the measurement of historical performance and
future prospects based on leading and lagging indicators for all functional areas is
required for an “alignment of all parts of the organisation” (Durrani et al., 2000, p. 120).
These indicators can be categorised as controllable, uncontrollable, active, and passive
variables (Raschke, 2007). As there are usually more than two KPIs that measure each
objective in the PSC, the identification of interdependencies and character of the KPIs
can facilitate the development of Project Strategy Map. An example of possible
objectives and interdependencies is shown in Figure 6.12.
FIGURE 6.12: PROJECT STRATEGY MAP EXAMPLE
A useful method is the impact matrix analysis that is further described in Chapter 7
when it is applied to the Collaborative Project Scorecard concept. The method uses a
two dimensional matrix that includes all KPIs horizontally and vertically. A number from
a scale of 0 to 3 describes whether a certain KPI has no (0) impact or strong (3)
influence on another KPI.
Financial
Customer
Internal Processes
Learning & Development
Budget Adherence
MilestoneAdherence High
Quality
ROIHigh Profit...
CustomerSatisfaction
EffectiveProcesse Efficient
Communication
ProcessAdherence
EmployeeQualifaction
TeamStatisfaction
Creation ofInnovation
...
...
...

108
The vertical sum of the numbers describes a KPI activity by an active sum, whereas the
passivity can be described horizontally by a passive sum. The product of the active sum
(AS) and passive sum (PS) is P (P=ASxPS), where as Q is the quotient of the two sums
times hundred (Q=ASx100/PS). KPIs with high values of Q are active variables that
have great impact on other variables. At the same time those variables are barely
impacted by other KPIs. KPIs on the other hand with low values of Q are rather success
variables as they cannot be controlled efficiently and are of passive character. KPIs with
high values of P are critical variables as they strongly influence but are also strongly
controlled by other KPIs. Figure 6.13 shows a generic framework of the project impact
matrix.
FIGURE 6.13: GENERIC FRAMEWORK OF THE PROJECT IMPACT MATRIX
As an example, the process indicator P1 has the highest Q value and is the variable
with the highest impact and lowest interference, whereas the development indicator D6
has only a function as an indicator and does not influence any other variable. The
financial indicator F2 has the highest value of P and is, therefore, a critical variable.
200
117
P
Developm
entP
rocessC
ustomer
Financial
DevelopmentProcessCustomerFinancial
ACTIVE
PASSIVE
F1 F2 F3 F4 F5 C1 C2 C3 C4 C5
C1
C2
C3
C4
C5
F1
F2F3
F4
F5
P1 P2 P3 P4 D1 D2 D3 D4 D5 D6
D1
D2
D3
D4
D5
D6
P1
P3
P4
P2
SUM Active
SUM Passive
*3
3 3
3
3
3 3
3
3
3 3
3
3
3 3
3
2
2
2
2
2
2
2
2
2
2
2
2
2
2
2
2
2
2
2
1
11
1
1
1
1
1
1
1
11
1
1 186
3
2 9 7 7 6 9 3 6 6 6 5 8 1 4 4 5 6 5 0
Q
566485
1257358658
1
722 42 35 36 6 36 24 30 6 12 25 56 3 20 32 30 30 40 0
140100
113
1722538
120600300100
11433805083
120
630
AS
PS
109
By applying the project impact matrix method, the interdependencies of the KPIs are
identified and evaluated, and can be represented in a Strategy Map. For a connection of
two drivers a threshold value of the related KPI intensity sum can be set to focus on the
most important dependencies.
6.4.2 Key performance indicators for project scoreca rds
Key performance indicators are essential to measure and monitor the objectives of any
scorecard. These characteristic metrics are typically used in business management to
measure the company’s performance and progress towards basic objectives and critical
success factors. They serve as a basis for critical decisions, health checks (i.e.,
comparison between target and actual), documentation and coordination of important
aspects in an organisation.
Effective KPIs are crucial for measurement and, therefore, must be generated through
an involvement of all stakeholders, agreed upon before implementation, and reflect the
overall organisation’s goals.
6.4.2.1 Examples of KPIs for a Project Scorecard
In traditional project management KPIs were used to monitor and control essential
factors that influence the “magic triangle” consisting of budget, time and quality. They
also provide a solid foundation for decision making. According to Kaplan and Norton
(1996) KPIs can be mainly divided into two types, leading indicators, which are
performance drivers, and lagging indicators, which refer to outcome measures. In order
to generate reasonable KPIs it is essential that they are relevant, definable and
quantifiable (e.g., measurable).
Additionally, a target value or corridor for each KPI has to be defined in order to
measure the degree of achievement. A useful approach is described by the acronym
‘SMART’. Each KPI needs to be specific, measurable, achievable, result-oriented and
time-oriented.
Examples of some KPIs of a traditional BSC (Papalexandris et al., 2005; Eckerson,
2006) compared to modern Project Scorecards (Salem, 2001) are listed in Table 6.1,
Table 6.2 and Table 6.3.
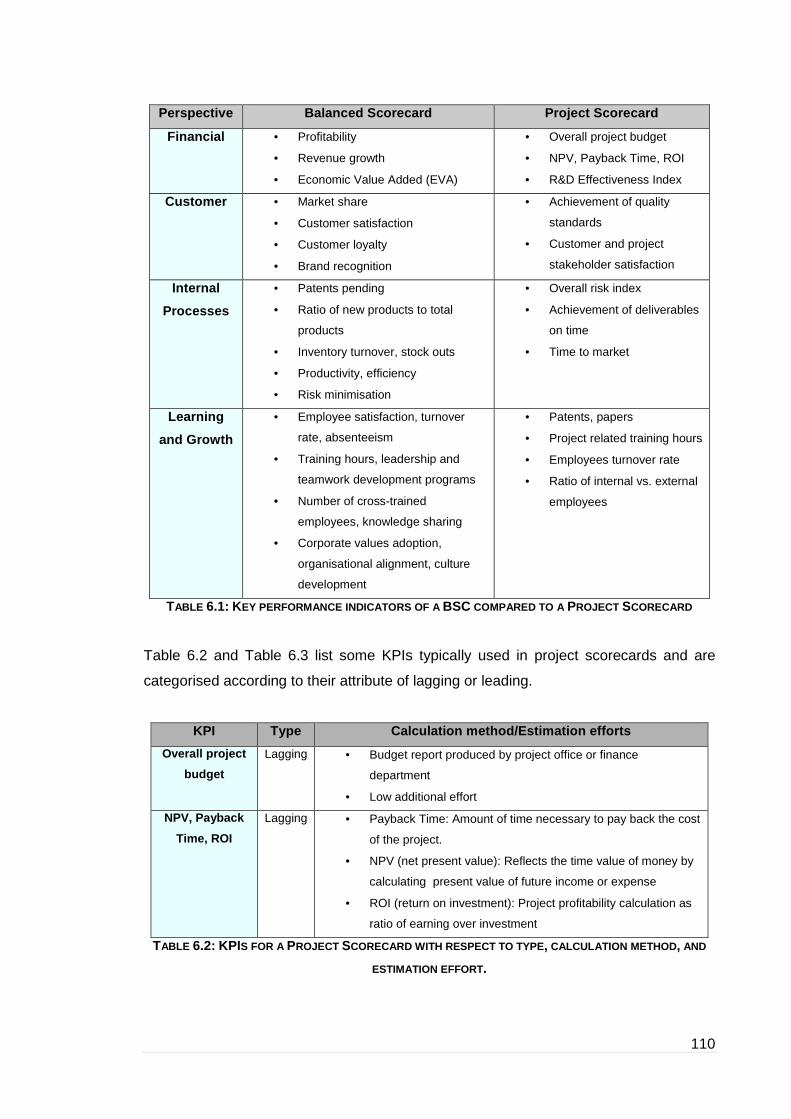
110
Perspective Balanced Scorecard Project Scorecard
Financial • Profitability
• Revenue growth
• Economic Value Added (EVA)
• Overall project budget
• NPV, Payback Time, ROI
• R&D Effectiveness Index
Customer • Market share
• Customer satisfaction
• Customer loyalty
• Brand recognition
• Achievement of quality
standards
• Customer and project
stakeholder satisfaction
Internal
Processes
• Patents pending
• Ratio of new products to total
products
• Inventory turnover, stock outs
• Productivity, efficiency
• Risk minimisation
• Overall risk index
• Achievement of deliverables
on time
• Time to market
Learning
and Growth
• Employee satisfaction, turnover
rate, absenteeism
• Training hours, leadership and
teamwork development programs
• Number of cross-trained
employees, knowledge sharing
• Corporate values adoption,
organisational alignment, culture
development
• Patents, papers
• Project related training hours
• Employees turnover rate
• Ratio of internal vs. external
employees
TABLE 6.1: KEY PERFORMANCE INDICATORS OF A BSC COMPARED TO A PROJECT SCORECARD
Table 6.2 and Table 6.3 list some KPIs typically used in project scorecards and are
categorised according to their attribute of lagging or leading.
KPI Type Calculation method/Estimation efforts
Overall project
budget
Lagging • Budget report produced by project office or finance
department
• Low additional effort
NPV, Payback
Time, ROI
Lagging • Payback Time: Amount of time necessary to pay back the cost
of the project.
• NPV (net present value): Reflects the time value of money by
calculating present value of future income or expense
• ROI (return on investment): Project profitability calculation as
ratio of earning over investment
TABLE 6.2: KPIS FOR A PROJECT SCORECARD WITH RESPECT TO TYPE, CALCULATION METHOD , AND
ESTIMATION EFFORT.

111
KPI Type Calculation method/Estimation efforts
R&D
Effectiveness
Index
Lagging • Proposed by Salem: This Index is used to assess the success
of product development efforts (used instead of ROI)
Overall Risk
Index
Leading • Outcome of Total Risk Management Process consisting of:
Risk identification, risk assessment, risk response
development, risk response control
• Usage of methods depending on project, e.g. risk severity
matrix, contingency planning, change control management
• Difficult to estimate/forecast
• Relevant due to strong linkage with time and costs
Achievement of
deliverables on
time
Leading
and
lagging
• Time related: Number of delayed days
• Quality related: Quality assessment rate, e.g. expected vs.
actual achievements
• Easy to estimate
Time to market Leading • Time from product development to its market availability
• Relevant for first-of-a kind products and their immediate
followers
• Manly influenced by overall project time, which is monitored
(e.g. by project office), low additional estimation efforts
concerning marketing
Achievement of
quality
standards
Leading
and
lagging
• Quality standards measured according to established
methods like e.g. Six Sigma or TQM
• Difficult to estimate
Customer and
project
stakeholder
satisfaction
Lagging • Customer and/or stakeholder satisfaction surveys resulting in
a customer/stakeholder satisfaction rate
• High estimation effort
Patents, papers Leading • Numbers of issued patents and papers published
• Low estimation effort
Project related
training hours
Leading • Number of training hours dedicated to project staff
• Low estimation effort, possibly HR involved
Employees
turnover rate
Leading • Number of people leaving/entering the project per quarter
• Low estimation effort, possibly HR involved
Ratio of internal
vs. external
employees
Leading • Internal HC/External HC
• Low estimation effort
TABLE 6.3: OTHER KPIS FOR A PROJECT SCORECARD WITH RESPECT TO TYPE, CALCULATION METHOD ,
AND ESTIMATION EFFORT.

112
An example of project objectives and related KPIs for an automotive product
development project is shown in Figure 6.14.
FIGURE 6.14: EXAMPLE OF OBJECTIVES AND KPIS FOR AN AUTOMOTIVE PRODUCT DEVELOPMENT
PROJECT
6.4.3 PSC application in practice
The Balanced Scorecard can be applied as a tool for effective project management. It is
suggested (Stewart, 2001) that approximately twenty suitable performance measures
from four perspectives aligned with the Business Balanced Scorecard (or Project
Management Office Balanced Scorecard) need to be chosen to build a Project
Scorecard. Stewart also suggests that the chosen measures are baselined and data
consistently obtained and grouped so that project health improvements can be
measured and monitored on a project, portfolio and company level.
A Project Scorecard can be applied to all phases of a project from initiation and planning
through execution to project closure. Stewart (2001) gives an extensive list of possible
measures and discusses the importance of several criteria for each of the four
perspectives and suggests associated benefits. Three benefits of those are the ability
Dev
elop
men
tF
inan
ces
Cus
tom
erP
roce
ss
Project BudgetIncrease of Business ValueCatgegorisation into Multi ProjectProject Management
human resources, share of sales, profitmargin, savings, ROI, expenditure
Customer Satisfaction
Adherence to SchedulesInnovation EnhancementMinimising RisksOptimisation of Project StructureQuality
Employee SatisfactionEmployee Qualication Enhancement
cost overrun , number of customer audits, changemanagement, process stability
adherence to delivery dates, lessons learned, numberof patent applications, external labour, quality indices,
duration of change management, product maturity, post processing, percentage of overhead, number of
internal audits, project risk analysis
rate of employee fluctuation, travel costs, overtime, index of professional experience, continuing
education costs

113
for the project manager to monitor critical factors, identify warning signals and take
corrective action, and therefore make continuous improvements across all perspectives.
6.4.3.1 Risk management aspects
There are benefits in applying Balanced Scorecards at a company or enterprise level to
focus risk management efforts on most relevant areas. Scholey (2006) has analysed the
application of separate scorecards for managing risk and performance at an enterprise
level and identified that it can help to simplify the scorecard design. Calandro and
Lane (2006) found that at a project level, a Project Scorecard can improve project risk
management by providing a risk management plan if all risks are identified and
managed that affect the selected KPIs. A correctly implemented Project Scorecard
facilitates and ensures consistent and regular monitoring of KPIs across all
perspectives. Regular monitoring of leading KPIs can support an earlier identification of
problems so that preventive or corrective action can be implemented more quickly. The
Project Scorecard is a useful method that can assist the project manager to address
risks in a systematic and structured way with an understanding of how risks affect key
strategic objectives.
6.4.3.2 Balanced and Project Scorecards for supply chain management
In supply chain management, several companies often work collaboratively in
manufacturing products and services for consumption. Intercompany collaboration
requires managers and companies to work together as a team with their supply chain
partners. The companies realise the downstream implications of upstream process
improvements or problems. A car manufacturing plant can be brought to a halt due to
production or quality problems with fastener supplies. Performance measurement
systems need to be effective and provide mutual benefit to all partners in their efforts to
optimise their processes and to satisfy customer needs. Supply chain management
systems aim to decrease costs and risks, increase the speed to market, and ensure
quality and value for the final consumer. The implementation of a Balanced Scorecard
approach to supply chain management can assist partnering companies to align their
efforts to support an overall strategy. Each company can adapt a Balanced Scorecard to
their activities and suppliers can share KPIs with other interfacing or affected suppliers
upstream or downstream in order to improve the overall quality, efficiency and reliability

114
of the supply chain. Brewer (2001) suggests that Balanced Scorecards are implemented
most effectively into supply chain management when considering the following steps:
• Vision and strategy formulation.
• Selecting agreed measures (KPIs), which are consistent with strategy.
• Linking and communicating the measures.
• Driving managers to achieve the desired results by establishing accountability,
setting rates of improvement, creating action plans and using the Balanced
Scorecard KPIs to review performance.
6.4.4 The Project Scorecard concept as an adaptive approach
A Project Scorecard facilitates successful project management by ensuring that project
objectives are aligned with the overall business strategy. It enables a more holistic
approach to project management as it takes into account different perspectives and
more importantly the cause-and-effect relationships of various metrics. The Project
Scorecard gives the manager a comprehensive overview of the project status and
assists in identifying critical areas. It also allows the project manager to take immediate
action if necessary. A PSC can, however, be difficult and time-consuming to implement.
Especially, when projects are large or an immediate project start is required. It can be
challenging to find the suitable objectives and indicators to measure and requires full
commitment and involvement from each stakeholder. Successful implementation of a
PSC also needs support from upper management, as employees may be resistant to
change when established methods are altered.
6.4.4.1 Adoption of Six Sigma and management frameworks
New approaches to the Balanced Scorecard (often referred to Third-Generation
Balanced Scorecards) enable existing management processes and tools to be
enhanced (Cobbold and Lawrie, 2002). Various quality tools have, for example, been
successfully applied in conjunction with the Balanced Scorecard. These tools can also
be adopted by a PSC. Some of them are Six Sigma, the Malcolm Baldridge National
Excellence Model, the EFQM Excellence Model, and International Organisation for
Standardization (ISO) standards. Developed at Motorola in mid 1980’s, Six Sigma is a
process improvement methodology that uses statistical and other analytical measures.
Due to further development of Six Sigma applications, it now includes general business

115
activities, especially the ones that directly affect the customer (Ramberg, 2000). Modern
Six Sigma methods place emphasis more on strategic control activities such as
leadership styles and goals aimed at improving results. To be effective the Six Sigma
needs to be placed in an appropriate strategic context (Wilkund and Wilkund, 2002). Six
Sigma could be implemented with a Third-Generation Balanced Scorecard focusing on
the long-term strategic goals of the company. The necessary objectives could be
identified at a corporate level and the progress in achieving those objectives could be
derived from data generated through Six Sigma measures. This method provides a
useful linkage between strategy and quality initiatives.
The Malcolm Baldridge National Excellence Model and EFQM Excellence Model are
frameworks that are designed to assist an organisation to achieve excellence through
continuous improvement in management and processes. Both models are built on a
systematic approach to analysing and improving internal processes. The evaluation can
determine how the firm is faring against competitor firms or against baseline
assessments. A U.K energy utility firm described how efficiently it was using a
combination of EFQM Excellence Model and the Balanced Scorecard
(Anderson et al., 2004). The Balanced Scorecard was used to communicate strategic
results amongst the group and also was applied as a strategy implementation tool.
6.5 The Balanced Scorecard for cross-company project management
The application of the Balanced Scorecard to internal project management has already
been investigated (Stewart and Mohamed, 2001) and recommendations on how to
design the Project Scorecard have been provided. However, the application to cross-
company project management has not been considered in the literature yet
(Horvath, 2003).
6.5.1 A new approach to collaborative and networked project environments
The BSC has been widely used for internal project performance measurement and
monitoring, it provides a strategy focused view of the operation and project, whereas
project management provides a tactical view of the operation. Combining these two
views together creates a synergy not found in the individual views. Some of them are
that the tactics enable the fulfilment of strategy and the strategy validates the tactical

116
decisions (Alleman, 2003). There is reason to believe that the application of a Balanced
Scorecard to a collaborative, cross-company project environment has not been
considered sufficiently. One of the reasons is that its utility has not sufficiently been
analysed on a general level (Diensberg, 2001). Diensberg also concludes that the BSC
provides solutions for important problems which cannot be solved by conventional
controlling processes. Some of them are communication deficiencies, unknown project
objectives, and qualification deficiencies. O’Leary et al. (2001) concludes that we have
not understood the complexity of distributed work yet and that control versus trust is still
an opposing concept of our traditional management approach.
6.5.2 Performance measurement as a key condition fo r effective project
management
Bourgoult et al. (2002) consider the monitoring of the project stakeholders’ performance
a “critical issue” and identified that little research has been done yet. Measuring
performance is a “key condition” to ensure the effectiveness of project management and
performance management systems need to be organised that strategic goals and
objectives can be evaluated on the basis of a balanced series of metrics. They also
found that most metrics describe operational functions to plan and monitor technical
processes but soft facts such as client satisfaction are not considered sufficiently.
The more integrated consideration of a balanced choice of metrics leads to the
Balanced Scorecard for distributed projects. But the authors conclude that “it is clearly
too early in the investigation process to claim that a comprehensive list of metrics has
been, or can be, established” (Bourgault et al., 2002, p.4).
6.5.3 X-engineering requires a holistic view
Horvath (2003) has considered the Balanced Scorecard for distributed management as
part of his x-engineering approach that is related to the traditional re-engineering and
applied to a virtual corporation as defined by Byrne et al. (1993, p. 99) as “a temporary
network of independent companies – suppliers, customers, even erstwhile rivals – linked
by information technology to share skills, costs, and access to one another’s market”.
Compared to the traditional re-engineering approach, x-engineering includes a holistic
view over the whole value creation chain of a product and emphasises the development
and implementation of strategies. He sees the key to success in a precise redesign of

117
the existing process structure and the development of control measures on the basis of
the overall strategy.
6.5.4 A need for a Collaborative Project Scorecard
The Balanced Scorecard that is derived from this strategy supports x-engineering to
focus on strategically relevant objectives. Performance measurement on the other hand
enables the new designed processes to run and therefore, the “X-Balanced Scorecard”
and the “X-Performance Measurement” have to be coupled. Horvath (2003) assumes
that a network is created from a strategic idea and respectively strategic competitive
requirements. The strategic idea needs to be defined by all network partners so that the
redesign of the common value creation chain has a common basis to define strategy
related measures (control and performance related) for a network performance
management. Horvath also identified that the current literature has not discussed the
application of a BSC to distributed organisations yet but only to single organisations.
Finally, he recommends applying a BSC to a collaborative network.
Another application field of a BSC to a networked organisational environment has been
examined in the field of supply chain management. The X-Balanced Scorecard has
been further studied by Kaufmann (2004) and Zimmermann (2007). Kaufmann
concludes that the X-BSC added transparency for the partners and that upcoming
difficulty can get solved quickly and professionally, whereas Zimmermann demonstrated
with his case study that the Balanced Scorecard supported the optimisation efforts
within the value creation chain efficiently. However, he assumes that the BSC can
hardly be applied to the whole supply chain as the disclosure of objectives and data to
other partners may not be in the interest of all organisations. Although, there are only
few examples for a supply chain Balanced Scorecard, Zimmermann thinks that these
projects will become more important in the future.

118
7 The concept of the Collaborative Project Scorecard
The stronger focus on collaboration in the management of projects creates new
chances to improve a company’s efficiency and effectiveness but also leads to several
problems among the project partners. Typically, the project status and project activities
are difficult to monitor and the managers on both sides lack sufficiently integrated and
agreed control measures. More difficulties arise when project goals and relevant
processes are not adequately defined in advance. The Collaborative Project Scorecard
aims to reduce these difficulties and the concept with its methods and tools is described
in this chapter (Figure 7.1).
FIGURE 7.1: OVERVIEW OF CHAPTER 7
7.1 Introduction
The Balanced Scorecard (BSC) has been developed as a business management
system that aligns vision and strategies with operational goals. These goals are
7.1 Introduction
7.2 Structure of the CPS
7.3 CPS development procedure
7.4 Integration of CPS into
Networks
Perspectives and
definition
Goals and
characteristics of a CPS
Structure, methods, KPIs, risk
management, and the PSC as
an adaptive approach
7.5 Organisational CPS
Integration
Achieving sustainable
collaboration
Collaborative project
strategy, goal definition
and common corrective
action
7.6 CPS and portfolio &
partnership management
7.7 Collaborative project impact
matrix and project strategy
maps
7.9 Integrating soft facts

119
categorised into four perspectives: the financial, customer, internal, and learning and
growth perspective. Each perspective includes objectives, measures, targets, and
initiatives that translate a company’s vision and strategy into action (Kaplan and Norton,
1996). The implementation of strategies and business goals is often realised by
initiatives or projects on a multi or single project management level. In a further step, the
framework is also applicable to cross-company and collaborative projects where project
teams define common goals and monitor and control them collaboratively. Figure 7.2
shows how the CPS can be derived from a Project Scorecard of two project partners.
However, the CPS can be developed on the basis of mere project goals as well if one or
both of the organisations have not implemented a PSC.
FIGURE 7.2: FROM PROJECT SCORECARDS TO A CPS
This avoids misunderstandings and ambiguity of shared project goals and common
measures. Predefined corrective action supports the project managers to quickly react
on upcoming difficulties.
The project partner can be either, a supplier, another department or a joint venture
company. It is essential that all partners come together to discuss and clarify their
common project goals and strategies before the project is already in progress. The
project partners define common key performance indicators (KPIs) to measure their
project targets, and at that time they also define corrective actions. This enables them to
react faster on issues and manage risks more effectively and efficiently.
The CPS has the same function as a PSC but aims to increase project transparency
within the project members in networked structures. It also aims to increase the
Business Scorecard Business Scorecard
Project Scorecard
Collaborative Project
Scorecard
Partner A Partner B
Project Goals A Project Goals B
or or
Project Scorecard

120
efficiency of the monitoring and control of cross-company projects due to collaboratively
defined key performance indicators, project strategies, and measures while allowing
each partner to use individual internal project management processes. The project
members need to develop strategy maps and define key performance indicators
collaboratively. The KPIs can be exchanged and synchronised to build a CPS without
threatening each company’s know-how and information protection as only relevant and
predefined indicators are monitored and controlled. With this concept, the alignment to
business strategies and project goals of each partner can be assured, stakeholder
commitment ensured, and measures defined and taken collaboratively. According to the
GPM workshop results, this increases communication between the project members
and reduces the risk of misunderstandings and a lack of measures when project control
is urgent.
7.1.1 Goals of the Collaborative Project Scorecard
One goal of the Collaborative Project Scorecard is to equip the project management
with a useful cockpit, which allows them to react earlier with appropriate counter
measures. The concept supports the team to evaluate the actual project status, to
review the development of the project, and to produce forecasts by analysing leading
and lagging indicators. Especially, the understanding of coherences between all
influencing factors is a key benefit of this methodology. Implemented as an IT solution,
the CPS creates transparency of the current project status and improves the re-planning
process by monitoring the actual project status and providing an advanced forecasting.
Therefore, the CPS is assigned to a Business Intelligence methodology that does not
address financial and process goals only but it broadens the view on a project by
providing a framework for goal definition of collaboration for short and long-term
objectives. This is fundamental to identify and explore unknown business potentials,
e.g., to provide incentives in cooperative ventures.
7.1.2 Characteristics of the CPS
The CPS is characterised by its scalability, flexibility and adaptability to organisational
requirements. Figure 7.3 gives an overview of its characteristics.

121
FIGURE 7.3: CHARACTERISTICS OF THE CPS
Hab and Wagner (2006) detected that lack of collaborative team development in
projects results in severe consequences not only for the compliance with timelines,
milestones, quality, or costs but also for the collaboration climate. The CPS strengthens
this aspect and provides support to create trustful collaboration and sustainable positive
team climate across the borders of organisations.
7.2 Structure of the Collaborative Project Scorecard
First results of analytical studies of the Collaborative Project Scorecard were derived
from workshops organised by the GPM e.V. Automotive Chapter. Reasons for a more
analytical study of a cross-company scorecard concept were based on an automotive
study that revealed the insufficient clarification of project goals and problems in project
control. This causes several problems such as time delays or budget overruns. Typical
problems in the goal definition process are that goals are often defined too late in the
project stage, objectives and measures are unclear, ambiguity in common goal
understanding, and distrust between the partners (Pander and Wagner, 2005).
Within the scope of two workshops the Collaborative Project Scorecard concept was
discussed and some typical project objectives and measures were defined for an
Characteristics of the Collaborative Project Scorecard
• The CPS concept is a methodology to support the management of
cross-company projects that also includes in-house collaboration
(e.g., inter-departmental)
• It offers a framework for the definition of common goals, key
performance indicators and measures
• Additionally, the methodology provides further tools and methods to
enhance collaboration sustainably, e.g., a common risk management
or collaborative project assessment
• By monitoring the actual project status and by comprising the
relevant information about a project with a few key indicators, the
concept can be easily transferred to a Business Intelligence tool.
• The CPS is adaptable and scalable to address small, medium, and
large-sized organisations requirements
• It is extendable to existing management and business models such as
EFQM, Project Excellence, ProSTEP iViP CPM, etc.
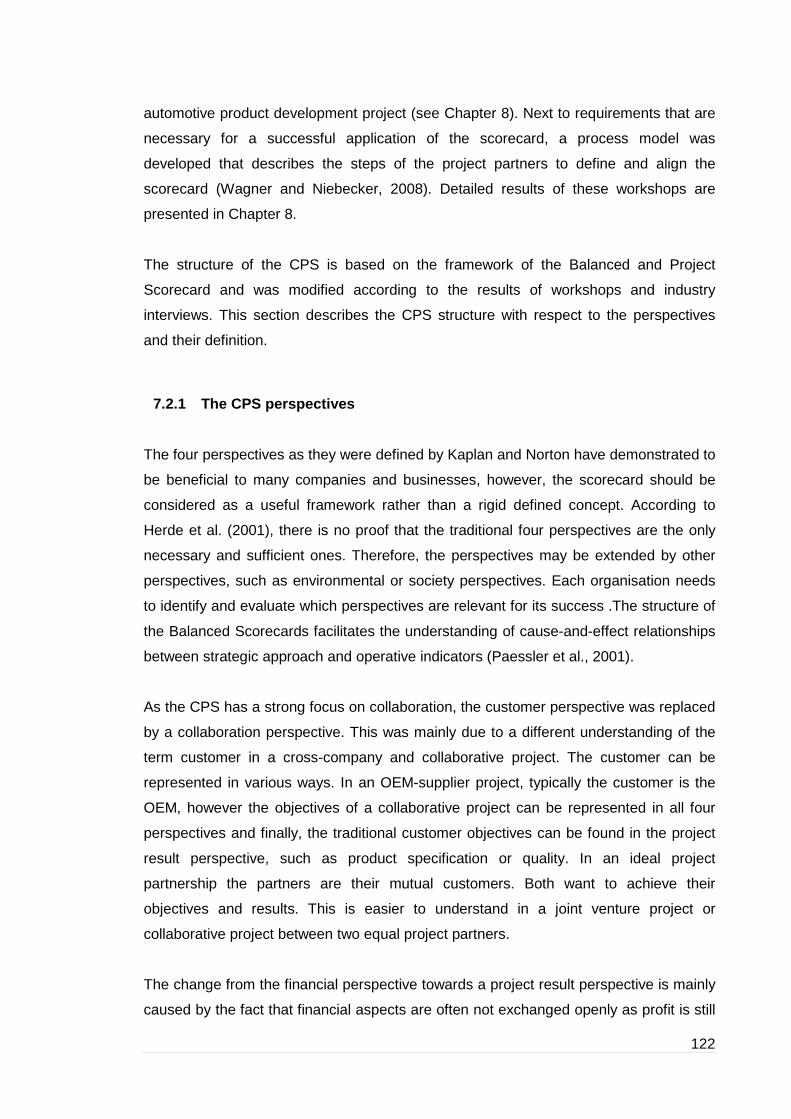
122
automotive product development project (see Chapter 8). Next to requirements that are
necessary for a successful application of the scorecard, a process model was
developed that describes the steps of the project partners to define and align the
scorecard (Wagner and Niebecker, 2008). Detailed results of these workshops are
presented in Chapter 8.
The structure of the CPS is based on the framework of the Balanced and Project
Scorecard and was modified according to the results of workshops and industry
interviews. This section describes the CPS structure with respect to the perspectives
and their definition.
7.2.1 The CPS perspectives
The four perspectives as they were defined by Kaplan and Norton have demonstrated to
be beneficial to many companies and businesses, however, the scorecard should be
considered as a useful framework rather than a rigid defined concept. According to
Herde et al. (2001), there is no proof that the traditional four perspectives are the only
necessary and sufficient ones. Therefore, the perspectives may be extended by other
perspectives, such as environmental or society perspectives. Each organisation needs
to identify and evaluate which perspectives are relevant for its success .The structure of
the Balanced Scorecards facilitates the understanding of cause-and-effect relationships
between strategic approach and operative indicators (Paessler et al., 2001).
As the CPS has a strong focus on collaboration, the customer perspective was replaced
by a collaboration perspective. This was mainly due to a different understanding of the
term customer in a cross-company and collaborative project. The customer can be
represented in various ways. In an OEM-supplier project, typically the customer is the
OEM, however the objectives of a collaborative project can be represented in all four
perspectives and finally, the traditional customer objectives can be found in the project
result perspective, such as product specification or quality. In an ideal project
partnership the partners are their mutual customers. Both want to achieve their
objectives and results. This is easier to understand in a joint venture project or
collaborative project between two equal project partners.
The change from the financial perspective towards a project result perspective is mainly
caused by the fact that financial aspects are often not exchanged openly as profit is still
123
nothing an organisations is willing to communicate to its partners from different
organisations. Therefore, the focus of this perspective is on results characterizing the
upper level objectives of a project. This is typically described by the functionality of a
product, quality standards, start of production (SOP), or even budgets that only include
costs and not prices. Figure 7.4 shows the modified CPS framework.
FIGURE 7.4: THE FRAMEWORK OF THE COLLABORATIVE PROJECT SCORECARD
7.2.1.1 Definition of the CPS perspectives
Although, the definition of the perspectives is an individual choice it is essential that all
project partners have a common understanding. During the research project in the US,
the categorisation of the project goals into the perspectives was one of the major
difficulties as everyone had a different understanding of each perspective. The common
agreement on the following definition had a positive impact on further CPS
developments as the time to categorise each goal could be minimised.
Project results and learning and development objectives have a more strategic
character than the objectives of the collaboration and process perspective. Processes
and collaboration objectives are rather operational and support the project result
objectives to be achieved.
Figure 7.5 illustrates the categorization but has to be considered as guidance only
rather than a strict regulation.
Project Results
Targets Metrics
Target/Actual
Compari-son
Measures
Collaboration
Targets Metrics
Target/Actual
Compari-son
Measures
Collaborative Processes
Targets Metrics
Target/Actual
Compari-son
Measures
Learning & Development
Targets Metrics
Target/Actual
Compari-son
Measures
CommonProject
Strategy

124
FIGURE 7.5: OPERATIONAL VERSUS STRATEGIC GOALS
Several objectives that have a development character, such as team trust or innovation,
are also related to the collaboration context. However, trust cannot be created quickly
and needs to be achieved by the help of long-term initiatives. Team satisfaction on the
other side can be achieved in a shorter time and often during the duration of the project
by organizing team workshops or increasing incentives. Therefore, objectives that are
related to development and learning are goals with long-term prospects rather than
short-term collaboration prospects (Figure 7.6).
FIGURE 7.6: SHORT VERSUS LONG TERM PROSPECTS
Project Results
DevelopmentCollaboration
ProcessesGoals with
operational
character
Goals with
strategic
character
Project Results
Processes
DevelopmentCollaboration
Goals with short-
term prospects
Goals with long-
term prospects

125
The distinction from project results and processes has been demonstrated as the
easiest task in developing a CPS. It is a process that enables the achievement of
certain project results (Figure 7.7). However, the differentiation from processes,
collaboration and development is often more difficult as there are, e.g., collaboration
processes or development processes, such as a continuous improvement process. Here
it is important to categorise every process, whether it has a collaboration or
development character, into the process perspective. Development objectives with long-
term prospects do not necessarily have a process involed. Examples are the creation of
innovation that can be measured by the number of implemented ideas or the
improvement of team trust that may be enhanced by regular project team discussions or
workshops.
FIGURE 7.7: PROJECT RESULTS VERSUS PROCESSES
The strict definition of each perspective is not crucial for the success of a CPS as long
as all relevant objectives are integrated but a clear understanding where a certain
objective needs to be placed avoids time consuming discussion during the development
in workshops and enables the project team to understand the character and impact on a
project and partnership of each objective.
Collaboration Development
Project Results
Processes
What do we
want to
achieve?
How do we
achieve the
project results?

126
7.3 CPS development procedure
The definition of a collaborative project strategy is the core of the CPS and also the first
step before the common goals are defined and further categorised into the respective
perspectives. The strategy includes the agreement on how the main objectives are
achieved and how, e.g., the time to market period can be shortened. Measure and KPIs
are then defined for each goal and target values or corridors set. Possible corrective
actions in case a target corridor cannot be achieved need to be discussed and
documented in a CPS so that the project partners can react quickly and decide, which
corrective action is optimal in the current situation. This avoids unnecessary delays
during a project and the selection of wrong actions caused by time pressure and the
need to react quickly. Figure 7.8 illustrates the procedure to develop a CPS.
FIGURE 7.8: PROCEDURE TO DEVELOP A CPS
7.3.1 Collaborative project strategy
The collaborative project strategy is the core of each project and its definition the first
stage in a beginning project partnership. Strategies can be developed in a systematic
approach that is supported by tools and checklists and that integrates the project
stakeholder sufficiently. The relation between strategy and project management can be
summarised in the following steps shown in Figure 7.9.
Common
goal
definition
Categori-
sation
into
perspectives
Define
measures
and
indicators
Define
target
values and
corridors
Define
corrective
action
ProjectStrategy

127
FIGURE 7.9: RELATION BETWEEN STRATEGY AND PROJECT MANAGEMENT (SCHELLE , 2008, P.135)
Schelle (2008) identified several deficits in aligning project management with the
business strategies, e.g., that in many maturity models such as CMMI or SPICE
business strategies are not integrated and rather isolated from the operative project
management level.
Project management has been considered as a management concept on the operative
level only and organisations separate strategic planning divisions from project
management units. The creation of portfolios may be one solution or tools such as the
Boston Matrix developed by the Boston Consulting Group. However, there is a risk that
present trends are translated to the future.
The concept of the Balanced Scorecard enables the institutionalisation of strategy
controlled project selection. Schelle (2008) compares the concept with Rietiker’s
understanding of the Chief Project Officer (Rietiker, 2006). An Office of Strategy
Management (OSM) integrates the strategic planning of the contracted units of an OSM
and translates the strategy with a BSC. The tasks of an OSM may be:
• Draft Strategy Definition
• Identify Strategic Position
• Define Alternative Environmental Conditions
• Analyze Institution (e.g., using gap analysis)
• Develop, Evaluate and Select Strategies
• Decision Phase
• Detail and Corrective Action Planning
Strategic Project Management
Define other measures
to realise strategies
• Initiate Strategy aligned projects
• Abort not strategy aligned projects
• Modify operating projects to align with strategies
• Super ordinate monitoring and control
Operative Project Management

128
• Reporting to CEO about strategic topics.
• Organisation of strategy meetings to control implemented strategies.
• Inform employees about business strategies.
• Initiate, prioritise and control projects that implement strategies.
• Agreement on projects with employee development functions and knowledge
management.
In a collaborative project both partners have to clarify their own strategies first and
select a project partner that supports their strategies best. This can be done based on
the concept of the Strategic Partnership Scorecard (SPSC) that is described in the
following sections. Once the strategic project partner is chosen for a series of projects or
for an individual project, the strategies to achieve the desired project results need to be
developed. This includes, e.g., the definition of clear project objectives, collaboration
methods, and the target agreement process.
7.3.2 From Common goal definition to corrective acti on
The collaborative target agreement process can be supported by workshops to discuss
possible target conflicts and clarify misunderstandings before a project starts. In an ideal
situation the compatibility of objectives lasts until the end of a project. Wagner (2006)
categorises the compatibility of project partners into goal competition, goal neutrality and
goal identity to measure how compatible the partners are. Wagner recommends to
discuss differences of individual goal understandings extensively and to communicate
own interests for a sustainable cooperative relationship during a project or whole
partnership.
To develop a CPS it is essential to organise workshops, tele- or video conferences to
clarify the project goals. It is important that the partners discuss all relevant goals that
support a sustainable collaboration. These include the goals of all four perspectives of a
CPS.
Figure 7.10 shows the goal finding process for a project between an OEM and a
supplier.

129
FIGURE 7.10: DEFINING COMMON GOALS
Once the project results are clear, the processes to achieve these goals need to be
defined and translated into measurable objectives. Brainstorming or the use of a
Strategic Collaborative Scorecard, a framework including generic objectives describing
a certain project partnership (see next sections), may be beneficial to achieve
agreements quickly. After all relevant goals are discussed they need to be categorised
into the perspectives using the definitions of the previous section as guidance. During
the goal definition process it is essential that each goal is measurable or can be
translated into a measurable goal. There are various possibilities for measuring goals.
KPIs or key goal indicators (KGIs) are the most common names for indicators describing
the status of a goal such as budget and time adherence or quality targets.
The next chapter discusses the indicators typically used in an automotive product
development project in more detail. Each indicator requires the setting of a target value
or target corridor. If the current value of an indicator is out of the corridor or exceeds or
falls below a fixed value corrective measures have to be taken. By applying trend
analysis, such as a milestone trend analysis or earned value methods, the future trend
of a value can be estimated and corrective action implemented before the value is out of
the desired corridor. For each indicator measures may vary, also regarding whether it is
a preventive measure due to a result from a trend analysis or it is corrective action when
Strategy Supplier
On Time
On Cost
On Quality
Learning &
DevelopmentStrategy
OEM
On Time
On Cost
On Quality
Learning &
Development
Common Project Goals
Subsidiary Goals
Competing Goals
Indifferent Goals

130
the problem has already occurred. This is also part of an integrated risk management
further described in Chapter 13. Figure 7.11 shows the framework that can be used to
integrate preventive and corrective measures to evaluate and avoid risks.
FIGURE 7.11: RISK MANAGEMENT AS AN INTEGRATED PART OF THE CPS
A more detailed figure and description of the CPS risk management can be found in
Chapter 13.
7.4 Integration of the CPS into project networks and environments
A CPS can be applied between two or more companies in a networked collaboration
environment of several project partners. The Collaborative Project Management
Reference Model developed by the ProSTEP iViP Association uses a similar approach
to apply methods for task, communication, and time management in product
development projects (ProSTEP iViP, 2007a). The model is based on the assumption
that a collaborative project management model is applied between two project partners
only but as often as required.
7.4.1 Reducing relationships to one-to-one partnersh ips
Typically, an OEM has several suppliers that work together for a specific project. These
can involve hundreds of different suppliers and coordination may become complex and
intransparent quickly. If one can think of four or five project partners working with one
CPS together and providing designated information for the defined objectives it can
become difficult with hundreds. Figure 7.12 shows how the CPS may be used if all
partners work with the same scorecard. This also implies that an OEM may be informed

131
about the goals and contribution of the sub suppliers. However, this information could
be hidden for selected project partners.
FIGURE 7.12: A SINGLE CPS FOR ALL PROJECT PARTNERS
The reduction to one-to-one relationships may become important when many partners
are involved. Similar as proposed in the ProSTEP iViP Reference Model the reduction
to one-to-one CPS relationships is shown in Figure 7.13.
FIGURE 7.13: REDUCTION TO ONE-TO-ONE CPS RELATIONSHIPS
One-to-one partner relationships facilitate the application of a CPS by reducing its
complexity. Some networks with more than two partners may be replaced by one-to-one
relations but also combined with a centralised, collaborative CPS. The central CPS
includes all relevant information shared by all project partners, and the one-to-one CPS
only includes KPIs and strategies between two partners not relevant to the other
participants.
OEM
Supplier
1
Supplier
n
...
Sub
Supplier
1
Sub
Supplier
n...
Supplier
2
OEM
...
Supplier
1
Supplier
2
Supplier
n...
...
Sub
Supplier
1
...Sub
Supplier
n
...

132
In a joint venture project the project partners operate on an equal level, the CPS can be
applied as shown between two suppliers or sub suppliers. For example, an OEM can
work together with its supplier (tier 1, tier 2, or tier n) but also with other OEMs. It is
conceivable that if one CPS is deployed between many partners that each one-to-one-
partnership creates its own isolated controlling system.
Figure 7.14 illustrates possible network constellations for the application of a CPS.
FIGURE 7.14: POSSIBLE NETWORK CONSTELLATIONS FOR THE INSTALLATION OF A CPS
While the creation of a network of multiple (one-to-one) Collaborative Project
Scorecards over several steps in the supply chain is likely to be the most transparent
variant, the implementation of a single integrated system for the whole network, which is
managed by the OEM, has the best prerequisites for optimising the value creation
network. If a CPS is applied between different divisions or departments within an
organisation, the CPS relationships are similar to those between an OEM and supplier
or between two equal partners depending on the hierarchical position of a department.
[…]
[…]
Different hierarchy levels
(vertical collaboration)
Same hierarchy levels
(horizontal collaboration)
1 - 1
1 - n
[…]
n - m
[…]
Car Manufacturer Supplier, R&D Partner

133
7.5 Organisational integration of a CPS
The organisational integration of the CPS and the derivation from business strategies of
each organisation and project partner is shown in Figure 7.15.
FIGURE 7.15: DERIVATION OF A CPS FROM A BSC AND PSC
The PSC is derived from the Business Scorecard (e.g., BSC) and the CPS is then
developed based on the common goals of a chosen cross-company project. Although,
Figure 7.15 shows an ideal situation, it cannot be assumed that every company has
already adopted a BSC for their business management or a project scorecard for
internal project management that is based on and derived from a Balanced Scorecard.
Therefore, a CPS can also be developed on the basis of project goals only. Both
companies typically define their individual project strategies and goals first and then
identify and consolidate common strategies and goals with their partner. The following
sections describe the experience and theoretical contribution to the CPS methodology
that was based on the collaborative project between the OEM and the supplier in the
USA. Therefore, it includes theory derived from practice.
7.5.1 Creating a common vision and a strategic frame work
Together with an OEM and a supplier in the USA, a project specific CPS was developed
for a new vehicle launch. Twelve participants of each company defined common goals,
measures, and corrective action for the launch and change management of a new
Business Scorecard Business Scorecard
Project Scorecard
Collaborative Project Scorecard
Partner A
Project Goals A Project Goals B
or or
Project Scorecard
Partner B

134
model of a vehicle with respect to the integration of a certain part that has to be
manufactured and delivered by the supplier. In several individual interviews and
discussions of the CPS concept with project managers from the quality, logistics,
procurement, sales, and management department the relevant steps for a successful
scorecard introduction were extended.
Chapter 9 describes the results in more details, however, one of the main findings was
that it is beneficial to create a strategic partnership framework first that includes a
collaborative vision. The vision is then translated into strategic objectives categorised
into the four perspectives. The assumption was that most of the project goals in a
certain project are not unique and there are some basic objectives the partners can find
in all of their common projects. Typically, the Strategic Collaborative Scorecard is a
result of past project experience of the partners. Detailed research results can be found
in Chapter 9.
Figure 7.16 shows a Strategic Collaborative Scorecard (SCS) that includes strategic
project goals shared between an OEM and a supplier and provides a fundamental
framework to derive project and project phase specific goals.
FIGURE 7.16: STRATEGIC COLLABORATIVE SCORECARD (OEM-SUPPLIER)
The SCS is then applied to a specific project and supports the team in finding the
relevant project goals and measures more efficiently. Afterwards, the CPS may be
applied to every project phase, from the concept to the series production by periodically
updating the project goals and KPIs within a phase or from one phase to another. Figure
7.17 illustrates the steps and structure of the strategic framework and the project
specific CPS.
E.g., OEM BSC E.g., Supplier BSCStrategic
Collaborative
Scorecard
Strategic Project Goals A Strategic Project Goals B
Partner A Partner B

135
FIGURE 7.17: STRATEGIC SCORECARD AND CPS APPLICATION
The goals agreed in the SCS need to be translated into project specific goals and
measured with key performance indicators. The definition of corrective measures on
discrepancies of an actual project status from defined targets or target corridors is the
final step to complete the CPS development.
7.6 The CPS for project portfolio and partnership ma nagement
Project partners may not only have a common vision regarding a single or a multiple of
projects, they may also share a vision on a strategic partnership level. The partners
define their strategic goals in a Strategic Partnership Scorecard (SPSC) that is derived
from a common set of their individual Balanced Scorecards. As each partner usually
operates a project portfolio the SPSC facilitates the identification of an optimal partner
for a specific portfolio that is further defined in a SCS (Figure 7.18).
Business Scorecard Business Scorecard
Project Scorecard
Collaborative Project Scorecard
Project Goals A Project Goals B
or or
Project Scorecard
Strategic Collaborative Scorecard
Partner A Partner B

136
FIGURE 7.18: THE STRATEGIC PARTNERSHIP SCORECARD
7.7 The project impact matrix and strategy map
A method to map networked and complex coherences, interdependencies and
dynamics in project management was developed to identify active and passive
variables, as well as their controllability to identify and evaluate cause-and-effect
relationships (Raschke, 2007). This method can be modified and applied to a BSC, PSC
and CPS to develop strategy maps. This section illustrates how the collaborative project
impact matrix can be developed based on an impact matrix analysis.
7.7.1 The collaborative project impact matrix analy sis
An impact matrix relates each project variable with the other variables in regard to its
impact intensity on those variables. An intensity scale from 0 (no impact) to 3 (great
impact) quantifies the intensity to be able to estimate the activity, passivity or criticality of
a variable. The impact matrix for Project Scorecards was already described in Chapter 6
and, therefore, the application to a CPS is part of this section. The active variables (high
values of Q) have the greatest impact on other variables and are the least open to
Business Scorecard
Project Portfolio Scorecard
Business Scorecard
Project Scorecard
Collaborative Project Scorecard
Partner A
Project Goals A Project Goals B
or or
Strategic Collaborative Scorecard
Strategic Partnership Scorecard
Project Scorecard
Project Portfolio Scorecard
Partner B

137
influence or able to be influenced. Project control with critical variables (high values of
P) is difficult as they have great impact but are highly open to influence or able to be
influenced and could cause a series of unforeseen reactions. Variables with low values
of Q are merely indicators for success rather than control variables as they have low
impact on other variables but are strongly influenced.
In a collaborative project the strategy map can be developed based on a Collaborative
Project Impact Matrix (CPIM) that uses the framework and perspectives of a CPS. The
result is a Collaborative Project Strategy Map (CPSM) that visualises the relevant
interdependencies of common and shared goals. Similar to the Project Impact Matrix the
Collaborative Project Impact Matrix (CPIM) consists of indicators with respect to their
perspectives (Figure 7.19).
FIGURE 7.19: FRAMEWORK OF THE COLLABORATIVE PROJECT IMPACT MATRIX (CPIM)
Figure 7.19 shows the framework of the CPIM for two objectives of each perspective
only.
An example of a CPIM for an automotive cross-company project with arbitrary objectives
is shown in Figure 7.20.
PR1 PR2 CP1 CP2 C1 C2 LD1 LD2 PS Q
PR1
PR2
P1
P2
C1
C2
LD1
LD2
AS
P
PR: Project Results, CP: Collaborative Processes, C: Collaboration, LD: Learning & DevelopmentPS: Passive Sum, AS: Active SUM, Q=ASx100/PS, P= ASxPS
Affected by
Active Im
pact

138
FIGURE 7.20: CPIM EXAMPLE
As a result of the GPM workshops and the workshop at the BMW production facility in
South Carolina, it is recommended to develop a CPSM first and then verify and adapt
the CPSM with a CPIM. The CPIM also facilitates the selection of relevant
interdependencies as some may not have sufficient impact intensity to be effective in
operation. Additionally, it can be avoided to invest effort to control KPIs with low Q
values as they have nearly no impact on other KPIs. Therefore, the method supports the
avoidance of unnecessary tasks and costly efforts.
7.7.2 Developing a collaborative project strategy ma p
The first step to build the strategy map is to define the drivers based on at least two or
more KPIs. Interdependencies of the KPIs are then evaluated with the impact matrix
analysis. As an example, the driver “employee satisfaction” may be controlled by the
“rate of employee fluctuation” and “overtime”, whereas the “rate of employee fluctuation”
also influences the driver “customer satisfaction”. Leading and lagging indicators can
be identified by evaluating their interdependencies. The development of a Collaborative
Project Strategy Map (CPSM) is an essential part of the project planning process and
should be discussed with all project members in a CPS kick-off meeting together with
the relevant KPIs and drivers. After a carefully designed CPSM, measures can be
defined based on cause-and-effect relationships for efficient project control. The CPSM
is a graphical representation of the CPIM. The P and Q values give an indication about
the impact intensity of each objective. This can be represented by the thickness of an

139
arrow or a scaled number value. An example of a CPSM without intensity evaluation is
shown in Figure 7.21.
FIGURE 7.21: EXAMPLE OF A COLLABORATIVE PROJECT STRATEGY MAP (CPSM)
Examples of objectives and related KPIs are also shown in this figure. A sustainable
trustful collaboration may facilitate the communication between partners and increase its
effectiveness as project members are familiar with each other and do not avoid
confrontation. An effective communication ensures that everyone understands the
relevant processes that are necessary to stay within the planned budget.
7.8 Integrating soft facts for sustainable collabor ation
Key Performance Indicators are the central elements to monitor the objectives of a
scorecard as they quantify the progress towards common objectives. Kaplan and
Norton (1992) identified risks when a company uses indicators to monitor its
performance and status. The measurement system strongly affects the behaviour of
managers and employees.
An indicator is an abstract representation of the reality and if it does not fit with the real
business, it may lead to undesirable employee deviance. Additionally, cross-company
teams that are managed with a scorecard system are highly influenced by the defined
Sustainable trustful collaboration
Effective communication
Effective and efficient processes
Budget Adherence
Objectives
No. of escalations
% attendance standard meetings
“Collaboration Index”
Survey result
No. of process deviations
KPIs
cost of processes
development costs
Sum of special expenses
Response time
Development
Project Result
Collaboration
Processes
Team
Satisfaction
Sustainable Trustful
Collaboration
Consistent &
High Quality
Effective and efficient
processes
Effective communi-
cation
High Process Maturity and
Reliability
Milestone & Timeline
Compliance
Budget Adherence
Creation of
Innovation

140
metrics and measures. In the CPS, the dependencies between hard facts such as costs,
schedule deviation or the number of defect parts per million and soft facts, e.g., mutual
trust or team satisfaction become evident. This section describes how soft facts can be
quantified and measured continuously. Soft facts are a key to success for a sustainable
collaboration. Open and frank communication and mutual trust are relevant to create
transparency. Transparency on the other hand enables the team to identify difficulties
and future problems early so that preventive measures rather than mere corrective
measures can be taken. Soft facts can be broken down into several dimensions.
Bennis (1999) divides trust in care, competence, reliability, authenticity and frankness.
This is relevant as everyone may have a different understanding of trust. The aim is to
translate a soft fact into measurable hard facts to obtain objective results when a soft
fact needs to be measured. As an example, Figure 7.22 shows a template how to
measure trust in a project team survey.
FIGURE 7.22: TEMPLATE TO MEASURE PROJECT TEAM TRUST
141
Frost and Sullivan (2006, p. 4), e.g., developed a “collaboration index”. This index
measures how collaborative an organisation is, whereas collaboration is composed of
collaboration capability and collaboration quality. A translation into a collaboration index
that measures how collaborative a project team is may facilitate the identification of
weaknesses for a long-term project team and partnership improvement. This index can
then be integrated into a CPS.

142
8 The CPS for automotive projects
The analysis of advantages, benefits, disadvantages and limitations requires an
application of the CPS concept to an operational level of project management. As the
way projects are managed may vary from each industry sector, the automotive industry
was chosen as an exemplary sector to develop and extend the CPS methodology. The
framework based on the Balanced Scorecard needs an adaptation to the automotive
environment and, therefore, a practical approach to develop and extend the concept by
the help of workshops and interviews with project managers from the automotive
industry. This chapter gives further insight into the results of two workshops that were
organised with the GPM e.V. Automotive Chapter and illustrates the results of an
industry survey (Figure 8.1).
FIGURE 8.1: OVERVIEW OF CHAPTER 8
8.1 Introduction
The adaptation of the CPS concepts to the automotive environment requires the
identification of project goals and KPIs for a cross-company project. The first GPM
workshop was organised on 17th July 2007 in Vilsbiburg, Germany, and included the
definition of the CPS perspectives, the relevant KPIs to measure typical project goals,
and a discussion about the introduction and implementation of a CPS to an
organisation. During the workshop a questionnaire was distributed to collect more data
and information relevant to the CPS methodology. The next GPM workshop took place
on 4th October 2007 in Erfurt and had a focus on KPIs relevant to small and medium-
sized businesses, a procedure model that describes relevant steps necessary to
synchronise the project partners, and further details about the success factors to
introduce a CPS to an organisation.
8.1 Introduction
8.2 Concept adaptationWorkshop Vilsbiburg &
Erfurt
Industry surveys and
results
Overview of activities

143
The two workshops were followed by two more automotive industry surveys. Further
details about the results are presented in the following sections. To validate the
theoretical results a use case between an automotive OEM and a chosen supplier was
identified and the CPS concept applied to a selected project with a focus on the launch
and change management phase followed by a workshop questionnaire (Chapter 9).
Figure 8.2 shows the steps towards the CPS automotive adaptation.
FIGURE 8.2: DEVELOPMENT STEPS TOWARDS AN AUTOMOTIVE CPS
8.2 Concept adaptation to automotive environment
A major criterion for the development of a CPS is the integration of differing and
ambiguous perceptions and project goals. According to the workshop participants of the
GPM e.V. Automotive Chapter, the CPS is most beneficial when applied between two
different organisations such as between an OEM and a supplier, or in joint ventures.
However, the application to inter-departmental and geographically dispersed divisions
and project teams within an organisation may also improve internal collaboration.
The consideration of aspects of the “magic triangle” does not satisfy the concept of the
BSC as room for improvement can especially be found in the potential of collaboration,
communication and efficient use of innovation, learning, and development goals. These
are important extensions to the “magic triangle” and are enablers to achieve efficiency
and effectiveness in cross-company and collaborative projects. Therefore, it is essential
to identify and describe room for improvement and to ascertain related goals with your
partners. An effective way to accomplish this is by the means of workshops, either in
real presence (preferably) or virtually using video conferencing.
Next to large enterprises, small and medium-sized organisations rely on the most
relevant measures and indicators to preserve manageability and understandability.
According to the workshop participants, the CPS should include the following four
perspectives:
GPM
Workshop
Vilsbiburg
GPM
Workshop
Erfurt
Workshop
Questionnaire
2007 2008
1st Survey 2nd Survey
USE Case: OEM
and Supplier
17.07.2007 04.10.2007 January to May 2008
Workshop
Questionnaire

144
• Project Results.
• Collaborative Processes.
• Collaboration.
• Learning and Development (Innovation/Potentials).
The first perspective covers the agreed result goals between the partners, the second
one the processes related goals to achieve these results and their performance, and the
third one focuses on collaboration aspects between the partners, such as efficient
communication, quick problem resolution, or team satisfaction. The fourth perspective
addresses the potentials for a continuous development in a project partnership. This
may include the employee (qualification, motivation, etc.) as well as the development of
new processes and the integration of cultural aspects.
The experience from workshops has demonstrated to be most beneficial to the CPS
development as there was enough time to introduce the participants to the CPS concept
and to discuss relevant questions. Therefore, the two GPM workshops have contributed
greatly to the concept adaptation to the automotive environment.
Comparatively, the two industry surveys have not been as beneficial as previously
expected as most participants were not able to contribute to the new concept due to a
lack of understanding that could not be sufficiently reduced by a detailed concept
introduction in the beginning of the survey. Nevertheless, the major results that could
contribute to the concept were integrated. The next sections present the workshop and
survey results that were most relevant to the CPS methodology.
8.2.1 First workshop results Vilsbiburg
The workshop took place in Vilsbiburg on 17th July 2007. After a presentation of the
CPS concept and framework, three work groups were formed to develop relevant
attributes of the CPS structure. The participants were composed of 25 project managers
with an average of 10 years project management experience in the automotive industry.
They represented car manufacturers (OEMs), suppliers, consultancies, and universities.
145
8.2.1.1 Work group results
The first work group discussed the relevant dimensions and perspectives of a CPS.
Regarding the perspectives, it was found necessary to cover the “magic triangle” of
quality, cost, and time first. However, as mentioned before the coverage of these three
aspects was considered as insufficient. Learning and development aspects are key
drivers to sustainable success and need to be monitored and controlled as well. In a
collaborative project, the goals of two or more project partners may be conflicting.
Therefore, it is important to integrate also conflicting goals to assure the understanding
of each partners’ objectives before initiating the project. This should not only be
represented in the project goals but also in the point views of all participating partners
and, therefore, should already take place in the definition process. The integration of
stakeholder commitment by defining values and target corridors for strategic project
goals is often neglected but it is a requirement of the CPS.
The collaborative monitoring of processes and their maturity has priority but also
innovation and safe-guarding of continuity of learning and development aspects are
relevant for a successful collaboration. In addition to that, a maturity level of
collaboration in the collaboration perspective was identified as key success factor. The
traditional financial perspective was considered as a controversial one as the discussion
on prices may result in a protective and non productive attitude. Therefore, the project
results that include objectives describing product maturity and quality numbers are more
beneficial in a project partnership. However, the definition and monitoring of budgets
and costs was seen as non critical and even essential elements of a scorecard.
The second work group discussed relevant KPIs for a collaborative project. The project
result perspective includes objectives that define the desired outcome of the
collaborative project in terms of a product, assuming collaboration is part of a product
development project. Next to product maturity, the product costs and target costs are
relevant objectives that need to be achieved. Typically, the costs are structured into
several budget costs such as development, manufacturing, labour, logistics, or material
costs.
Other objectives that were identified are time related, e.g., milestones adherence, or
feature related, e.g. feature adherence and stability, as well as its feasibility. Regarding
the process perspective the following additional indicators were identified:

146
• Change index.
• Time adherence (delivery/implementation).
• Error life cycle time.
• Frequency of errors.
• Risk management/common indicators.
• Risk matrix (amount of loss/probability).
• Proposals to improve quality.
• Test rates.
The learning and development perspective should also include a fluctuation rate at
communication interfaces, adherence to agreed reflection loops, and a common lessons
learned indicator that may be created based on previous lessons learned workshops.
The third work group discussed the introduction and implementation of a CPS and
identified the following success factors:
• Learning of BSC and CPS method required.
• Integrate top management.
• Develop coaching.
• Clarify what we want to achieve with a CPS (targets, benefits, etc.).
• Kick-off meeting (external).
• Align goals with business goals (BSC-PSC-CPS).
• Bottom-up or top-down strategy.
• Learning by doing.
• Pilot project beneficial.
• Frankness of project partners.
• Create transparency.
8.2.1.2 Feedback results
At the end of the workshop a questionnaire was handed out (included in Appendix B)
and 10 of the 25 questionnaires were returned. All participants were from organisations
with more than 1000 employees and a turnover greater than 250 Million Euros.

147
The most relevant results are shown in the following figure, whereas only answers to
questions of which 50% or more of the participants chose a similar answer were taken.
Figure 8.3 shows the results of the questionnaire.
FIGURE 8.3: WORKSHOP QUESTIONNAIRE RESULTS VILSBIBURG JULY 2007
8.2.2 Second workshop results Erfurt
The second GPM e.V. Automotive Chapter workshop took place in Erfurt, Germany, on
4th October 2007. 20 project managers from the automotive industry (OEMs, suppliers,
consultancies, and universities) participated and were grouped into three work groups
after an initial presentation of the last workshop results and an update of the CPS
concept development.
The first work group discussed further KPIs relevant to small and medium-sized
organisations and the additional KPIs were identified with a focus on time, costs, and
quality (Figure 8.4).
Control of projects by:
Key performance indicators: 80%
Controlling division: 100%
Software for project management:
SAP: 100%
MS-Project: 100%
Excel: 100%
Application of a Balanced Scorecard in
the organisation:
Yes: 0%
No: 100%
Experience with a Project Scorecard:
Yes: 0%
No: 100%
Strengths and Weaknesses of a PSC:
Strengths:
Support for project manager: 100%
Weaknesses:
Identification of KPIs: 50%
Relevance of an IT implementation:
Very high: 50%
High: 50%
Other: 0%
Benefits of a PSC compared to effort:
Very high: 50%
Average: 50%
Other: 0%

148
FIGURE 8.4: 2ND WORKSHOP RESULTS GROUP I
8.2.2.1 CPS development and adaptation procedure model
Requirements for a successful CPS operation are that the effort is kept at a minimum
and that both partners are cooperative and support each other in providing relevant
information. The second work group developed relevant steps that are necessary for a
CPS adaptation between the project partners. Figure 8.5 shows the developed
procedure model.
Time and milestones:• Adherence to milestones and delivery dates
• Different time prioritisation with tolerances respectively
• Time effectual risks
Costs:• Part price
• Cost effectual changes (risk/benefit sharing model)
• Development and tool costs
• Cost effectual risks
Quality:• Product maturity (Fulfilment of tender specification document,
• Approval status, PPM-rate)
• Process maturity (post processing effort, error life cycle time,
complaint rate, special approval status)
• Delivery adherence and loyalty
• System maturity and risks
• RPZ indicator (FMEA)

149
FIGURE 8.5: PROCEDURE MODEL TO ADAPT AND CHANGE A CPS
The procedure model begins with the clarification of the requirements and the demand
of a CPS. This includes the identification of its benefits, the clarification of goals and a
common understanding, as well as the emphasis of the CPS dimensions. The second
step is the definition of its contents and culture. The exchange of values and their

150
agreement is as important as the development of a common ground on the project
manager level. Integrating the stakeholders and top management helps to achieve a
sustainable commitment of all project stakeholders during the project. A collection of all
relevant KPIs and measures needs to be followed by a collaborative selection and
prioritization of indicators but also methods to measure them. The third step is the
development of common rules and guidelines. Trust, communication, confidentiality,
information exchange, procedures of change and escalation with respective tolerances
dominate step three. The fourth step is the assignment of relevant contact persons and
the definition of roles by taking into account the existing project specific reporting
structures, usually defined by the steering committee. The fifth step is the
documentation of those guidelines and the approval of commitment by signatures.
When these five steps are completed, the development process of the CPS can begin.
This is defined by the sixth step and includes the design of the CPS and its layout, the
reporting intervals of the common KPIs, a selection of a possible software solution to
implement the concept and the choice of an appropriate database and data storage
location. Once this done, the CPS can be approved and implemented in a kick-off
meeting. The workshop participants recommend an initial pilot project to gain more
insight into the methodology first and to be able to train and coach successive projects.
This is the seventh step and also includes necessary reviews and the definition of the
responsibility the project managers have. The final step is the evaluation of the concept
and a continuous improvement of the methodology by lessons learned, which can be
done in special workshops.
8.2.2.2 Introducing a CPS to an organisation
The third work group discussed the success factors relevant to introduce a CPS to an
organisation. A comprehension and understanding of the exigency is the most essential
task before beginning an implementation according to the participants. The following
guidelines were compiled:
• Avoidance of technical terms related to the BSC.
• Create a win-win situation.
• Frankness of both sides regarding processes, failures, etc.
• Clarification of terminology.
• Create comparability and reproducibility of goals and measures.
• Determine benefits compared to effort.
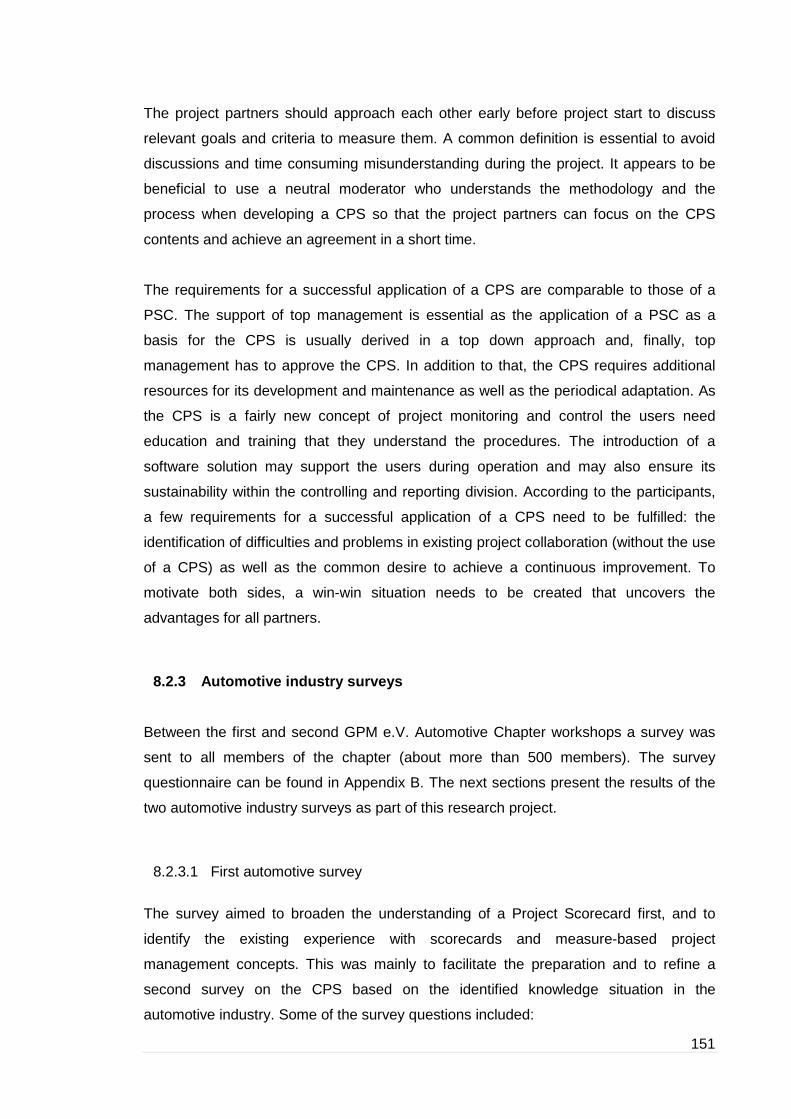
151
The project partners should approach each other early before project start to discuss
relevant goals and criteria to measure them. A common definition is essential to avoid
discussions and time consuming misunderstanding during the project. It appears to be
beneficial to use a neutral moderator who understands the methodology and the
process when developing a CPS so that the project partners can focus on the CPS
contents and achieve an agreement in a short time.
The requirements for a successful application of a CPS are comparable to those of a
PSC. The support of top management is essential as the application of a PSC as a
basis for the CPS is usually derived in a top down approach and, finally, top
management has to approve the CPS. In addition to that, the CPS requires additional
resources for its development and maintenance as well as the periodical adaptation. As
the CPS is a fairly new concept of project monitoring and control the users need
education and training that they understand the procedures. The introduction of a
software solution may support the users during operation and may also ensure its
sustainability within the controlling and reporting division. According to the participants,
a few requirements for a successful application of a CPS need to be fulfilled: the
identification of difficulties and problems in existing project collaboration (without the use
of a CPS) as well as the common desire to achieve a continuous improvement. To
motivate both sides, a win-win situation needs to be created that uncovers the
advantages for all partners.
8.2.3 Automotive industry surveys
Between the first and second GPM e.V. Automotive Chapter workshops a survey was
sent to all members of the chapter (about more than 500 members). The survey
questionnaire can be found in Appendix B. The next sections present the results of the
two automotive industry surveys as part of this research project.
8.2.3.1 First automotive survey
The survey aimed to broaden the understanding of a Project Scorecard first, and to
identify the existing experience with scorecards and measure-based project
management concepts. This was mainly to facilitate the preparation and to refine a
second survey on the CPS based on the identified knowledge situation in the
automotive industry. Some of the survey questions included:
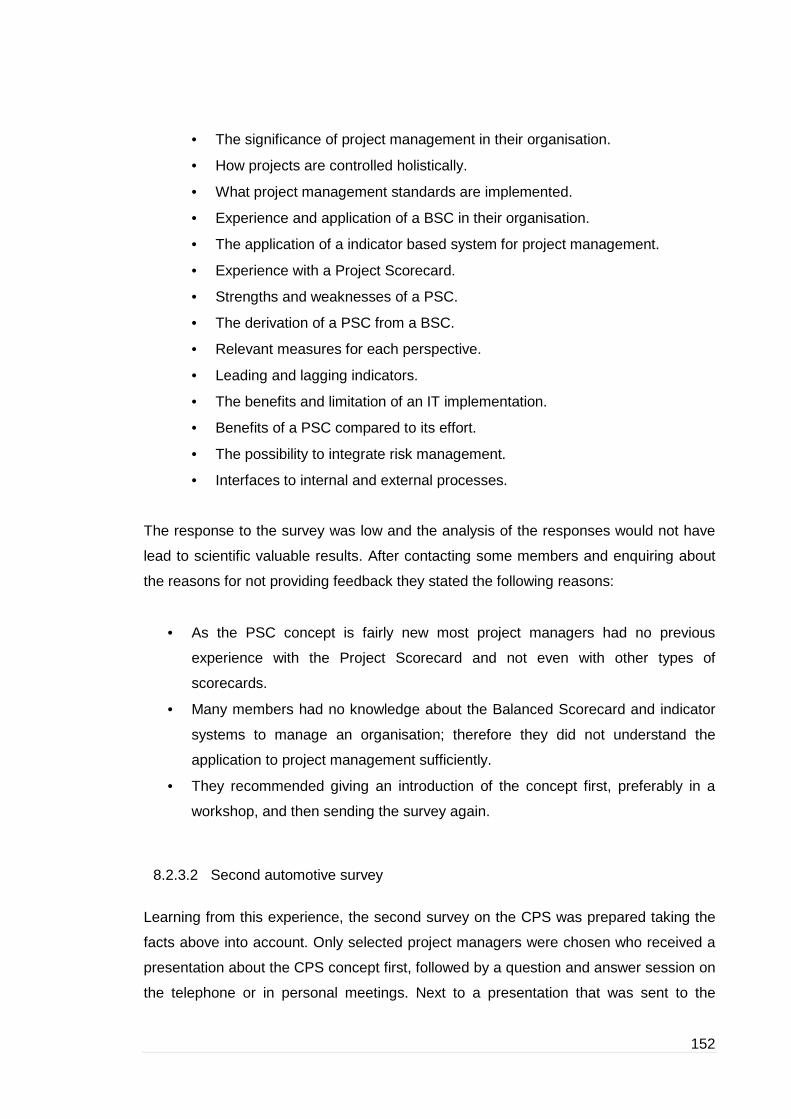
152
• The significance of project management in their organisation.
• How projects are controlled holistically.
• What project management standards are implemented.
• Experience and application of a BSC in their organisation.
• The application of a indicator based system for project management.
• Experience with a Project Scorecard.
• Strengths and weaknesses of a PSC.
• The derivation of a PSC from a BSC.
• Relevant measures for each perspective.
• Leading and lagging indicators.
• The benefits and limitation of an IT implementation.
• Benefits of a PSC compared to its effort.
• The possibility to integrate risk management.
• Interfaces to internal and external processes.
The response to the survey was low and the analysis of the responses would not have
lead to scientific valuable results. After contacting some members and enquiring about
the reasons for not providing feedback they stated the following reasons:
• As the PSC concept is fairly new most project managers had no previous
experience with the Project Scorecard and not even with other types of
scorecards.
• Many members had no knowledge about the Balanced Scorecard and indicator
systems to manage an organisation; therefore they did not understand the
application to project management sufficiently.
• They recommended giving an introduction of the concept first, preferably in a
workshop, and then sending the survey again.
8.2.3.2 Second automotive survey
Learning from this experience, the second survey on the CPS was prepared taking the
facts above into account. Only selected project managers were chosen who received a
presentation about the CPS concept first, followed by a question and answer session on
the telephone or in personal meetings. Next to a presentation that was sent to the

153
participants, an additional introduction to the concept including examples based on
previous experience was included in the survey.
The survey was available in German and English language and located online using the
tool SurveyMonkey (www.surveymonkey.com) that is accessible with a standard internet
browser. The survey started in October 2007 and was online until February 2008.
8.2.3.3 Results of the second survey
During that time 20 of the 30 chosen project members participated in the survey. The
survey questionnaire can be found in Appendix B including the introduction. The most
relevant questions with respect to the CPS concept were about:
• The application of a BSC in their organisation.
• Type of indicator system to control their organisation.
• Experience with PSC or project cockpit.
• KPIs to monitor and control project based BSC with respect to project phase.
• The proposed perspectives of the CPS.
• Indicators to measure collaboration and communication in a project partnership.
• Advantages of CPS IT implementation.
• CPS benefits compared to efforts.
• Significance of CPS for risk and quality management in projects.
• Indicators to monitor project risks and quality.
• General risks and opportunities with a CPS.
The questions were dominantly of qualitative nature and a summary of the introductory
question results is shown in Table 8.1. The results are based on 20 participants from
Germany (15), USA (2), Japan (2), and Australia (1) with an average experience of 10
years in project management (question 9).

154
TABLE 8.1: INTRODUCTORY QUESTION RESULTS (QUESTION 1-6)
Question 7 targeted the application of project management tools and indicator systems
to control projects. 50% of the participants stated that they use MS Office and Excel for
their project management control with individual solutions and indicator methods such
as the traffic light definition (red/amber/green lights). The use of SEP gate reviews and a
definition of synchronisation points for a certain project status such as defined by the
specification document were stated by 25%. In a rating from 1 (satisfied) to 5
(unsatisfied) the participants rated their satisfaction of the existing systems. The results
are shown in Figure 8.6 (question 8). The information given in the following figures is
given in the percentage of responses. That means, for example, 37% of the participants
rated the satisfaction of existing project management tools with “2”, where “1” means
entirely satisfied, and “5” means not satisfied. The information is relevant to identify,
whether new tools are required.
No Question Choice Answer (%)
1 Language of participants
German 73%
English 27%
2 Number of employees in
organisation
Less than 500 25%
More than 1000 75%
3 Size of organisation
(Mio Euro)
Less than 50 25%
More than 250 75%
4
Type of organisation
OEM 50%
Consulting Firm 40%
Supplier 20%
5 Holistic Control of
Organisation
Multi Project Management 71%
Controlling Department 10%
Program Management 57%
6
Application of a BSC in
Organisation
In whole organisation 33%
On business division level 50%
Project management level 5%
No BSC 33%

155
FIGURE 8.6: SATISFACTION OF EXISTING PROJECT MANAGEMENT TOOLS FOR INFOR MATION EXCHANGE
The next questions had a focus on the CPS concept itself. An important aspect is the
evaluation of a project partnership and collaboration maturity based on indicators
(question 10). The following suggestions were made:
• Measure collaboration based on maturity of electronic data interchange (EDI)
connection of electronic data exchange.
• Milestone adherence with respect to the achievement of common milestones to
evaluate effectiveness and efficiency of collaboration.
• Degree of defined common processes (e.g., according to CMMI).
• Flexibility of possible process adaptations (e.g., building blocks can be shifted
towards project partners without threatening the own process).
• Number of complaints.
• Goal accomplishment.
• Milestone compliance.
• Meeting frequency (appropriate attendance and involvement).
• Innovation.
• Premise stability (e.g., volumes, lead time, specified suppliers).
• Shared consequences.
Communication (question 11) may be measured by the definition of a corporate
language KPI, honesty, proactivity, punctuality, information not withheld, official
documentation, e-mail, phone, and one-to-one personal meetings. One aspect of
communication is the reachability of a contact person. Proposed measures are the
degree of participation in common meetings, and the time of responds to enquiries
(question 12).
Advantages of a CPS software implementation were the increase of transparency and
the controllability, the strategy communication of common achieved results, the creation
satisfied unsatisfied
1 2 3 4 5
0% 37% 37% 13% 13%
1 2 3 4 5
0% 37% 37% 13% 13%
Satisfaction of existing project
management tools

156
of a common picture and that the comparability of previous or parallel projects is
facilitated. Additionally, the effort to maintain the CPS decreases and the access to real
time information is enhanced (question 13).
In a rating from 1 (very high) to 5 (very low) the advantages over effort of a CPS
implementation and maintenance was rated at 2 from 100% of the participants (Figure
8.7 and question 14).
FIGURE 8.7: BENEFITS OF A CPS COMPARED TO ITS EFFORTS
In some interviews with project managers of OEMs and suppliers the issue of
transparency was seen as a very critical aspect of a CPS. Some suppliers thought that
they are already too transparent to their customers with respect to their existing
processes, competitive advantages, or project status information. However, the impact
of a CPS on project transparency was generally rated positive in the survey. Figure 8.8
shows the correspondent results.
FIGURE 8.8: IMPACT OF CPS ON PROJECT TRANSPARENCY
The understanding of project goals, and especially common project goals, was rated to
be improved by the application of a CPS. 100% of the project members rated the
improvement of a better and clearer understanding of project objectives for project
members and stakeholders by a CPS as “high” (rating ranged from “high improvement”
to “no improvement”). With respect to an improved alignment of project objectives with
business strategies and objectives the results are similar (Figure 8.9).
very high very low
1 2 3 4 5
0% 100% 0% 0% 0%
1 2 3 4 5
0% 100% 0% 0% 0%
Benefits of CPS compared to efforts
too high positive impact
1 3 5
0% 66% 33%
1 3 5
0% 66% 33%
Impact of CPS on project
transparency
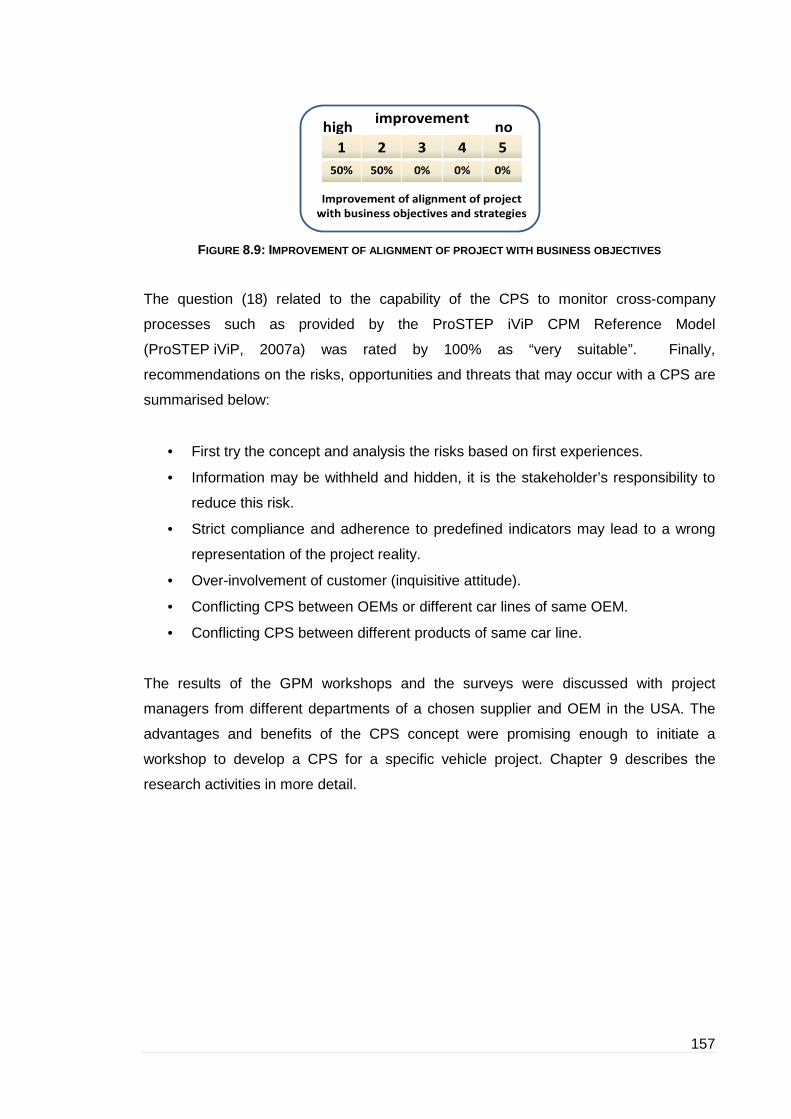
157
FIGURE 8.9: IMPROVEMENT OF ALIGNMENT OF PROJECT WITH BUSINESS OBJECTIVES
The question (18) related to the capability of the CPS to monitor cross-company
processes such as provided by the ProSTEP iViP CPM Reference Model
(ProSTEP iViP, 2007a) was rated by 100% as “very suitable”. Finally,
recommendations on the risks, opportunities and threats that may occur with a CPS are
summarised below:
• First try the concept and analysis the risks based on first experiences.
• Information may be withheld and hidden, it is the stakeholder’s responsibility to
reduce this risk.
• Strict compliance and adherence to predefined indicators may lead to a wrong
representation of the project reality.
• Over-involvement of customer (inquisitive attitude).
• Conflicting CPS between OEMs or different car lines of same OEM.
• Conflicting CPS between different products of same car line.
The results of the GPM workshops and the surveys were discussed with project
managers from different departments of a chosen supplier and OEM in the USA. The
advantages and benefits of the CPS concept were promising enough to initiate a
workshop to develop a CPS for a specific vehicle project. Chapter 9 describes the
research activities in more detail.
high no
1 2 3 4 5
50% 50% 0% 0% 0%
1 2 3 4 5
50% 50% 0% 0% 0%
Improvement of alignment of project
with business objectives and strategies
improvement

158
9 The CPS for an automotive supplier and OEM
The results from the GPM e.V. workshops, surveys, and interviews have contributed to
the CPS methodology and were derived from theoretical assumptions, personal
experience, and knowledge of the participating project managers. To apply the concept
to an automotive project for evaluating the experience when developing a CPS with a
project partner a supplier of the OEM in the USA was chosen. A supplier in Germany
was already interested in the application of a PSC and later a CPS in a pilot project.
One of its production plants in South Carolina is a major supplier for the OEM and also
has a production facility in the same state.
This chapter includes the criteria for a project partner selection and describes the
relevant steps of the CPS development. Team briefing and the choice of the project
phases is followed by the identification of common strategies. Within the CPS workshop,
the strategic collaborative project scorecard and the related strategy map was
developed and then applied to the launch and change phase of the chosen project
(Figure 9.1).
FIGURE 9.1: OVERVIEW OF CHAPTER 9
Finally, the results were analysed and evaluated in the last section of this chapter. The
eight step approach of the research pilot project is shown in Figure 9.2.
Expectations, goals and workshop
agenda
9.1 Project partner selection 9.2 Team briefing
9.3 Choice of project phase9.4 Defining project strategies
9.5 CPS workshop9.6 Strategic collaborative
project scorecards and strategy
map
9.7 CPS for change and launch
management
9.8 Results and workshop
questionnaire
Benefits, barriers, efforts and
conclusion

159
FIGURE 9.2: EIGHT STEP APPROACH OF THE RESEARCH PILOT PROJECT IN THE USA
The start of production (SOP) of a new series model was planned for 2010 and the
supplier was nominated to deliver the wire harness for the model. Both project partners
agreed on developing a CPS for this collaborative project in a first step and then decide
upon its final application. Due to the limited time frame of this research the research
project with the supplier had a focus on the development as part of the planning process
of a CPS. Based on that, it was possible to use real project data and to evaluate
whether the concept development is feasible for that type of project. As the launch
phase of the project was planned for 2010 the evaluation during the CPS operation was
out of the time line of this research project.
9.1 Project partner selection criteria (step 1 to 2 )
For a first application of the CPS the research project should be of a simple structure,
therefore, it is limited to a one-to-one partner relation between an OEM and a supplier.
The project goals were to gain experience with the CPS methodology, to identify
potential areas of application and to identify benefits and limitations. For the choice of a
project partner three main criteria were considered as important. Primarily, the supplier
Choice of
supplier and OEM
for pilot research
project
Selection
Criteria
Intensive briefing of CPS
concept
• Individual presentations
• Group presentations and
discussions
Identification
of project
phases
OEM and
supplier in the
USA and choice
of vehicle
project
Two individual and
initial workshops at
supplier and OEM
site
• Definition of own
project strategies
and objectives
Common workshop
to develop CPS
Discussion of results
Development and
implementation of IT
solution
Continuous interviews with managers
1 23
45
6
7 8
Continuous interviews with managers to obtain feedback and information

160
should be a major project partner of the OEM that delivers non-trivial parts of the
vehicle. The supplier should deliver a critical module in a just-in-sequence (JIS) or just-
in-time (JIT) concept and it should deliver their products standardised and synchronised
with the production line in the plant. Secondly, the partnership between the OEM and
the supplier should be characterised by mutual trust. Mutual trust is the basis for
frankness, which is important to discuss all relevant aspects of the CPS openly.
Additionally, the partner should be proficient in his own processes. The criteria are
shown in Figure 9.3.
FIGURE 9.3: CRITERIA FOR A PROJECT PARTNER TO DEVELOP A CPS IN A PILOT PROJECT
These criteria apply to this first research project only as the concept can be transferred
to the whole collaboration network of the OEM or supplier in a later step. It is important
to gain experience with this methodology before critical partners get involved. This
avoids some of the threats identified in the survey before, e.g. withholding of relevant
project information. The fulfilment of the criteria mentioned above by the chosen
supplier, their long tradition of trustful collaboration with the OEM, and their cooperation
in previous similar research projects within the GPM as well as their willingness and
enthusiasm to support this research project were an excellent starting position of the
CPS development. The cooperation between the two companies can be characterised
as a vertical, operative collaboration. The supplier is also a development partner of the
OEM and areas of cooperation are, e.g., research and development or production. The
supplier delivers high quality interior equipment and the main wire harness of two of the
vehicles produced by the OEM in the US.
Supplier is proficient in his processes and deploys
advanced management approaches
Partnership is characterized by
mutual trust
Tier 1 – Supplier, who delivers non-trivial
parts or modules “just-in-sequence” or “just-
in-time”
Criteria

161
9.2 Briefing and discussing the CPS concept (step 3)
Before the research pilot project was started, several meetings and interviews were
organised to ensure that everyone understands the CPS concept and to find out to
which degree the two project partners were willing to collaborate and accept the open
and frank discussion in a workshop. Although, it was reckoned with resistance of both
parties to exchange sensitive data, it was positive that both sides showed willingness to
talk and exchange thoughts with their project partner. The long tradition of project
collaboration, a similar business culture, and mutual respect for the partner’s
sustainable success in their business were preconditions that facilitated the project
execution.
9.3 Choice of project phase (step 4)
The application of the CPS begins in the concept phase where the CPS itself is
developed and it ends with the end of production of a vehicle. Therefore, the CPS is
scalable and adaptable to all project phases but best results are expected when a CPS
is applied continuously from project initiation (concept phase) until production (Figure
9.4).
FIGURE 9.4: APPLICATION OF A CPS TO EACH PROJECT PHASE
The development of the CPS takes place in the concept and definition phase where
project objectives and measure are defined for the subsequent phases. As objectives
differ significantly from phase to phase it was important to focus on one or two phases
only to limit the scope of the pilot research project. The series development of the wire
harness was already in progress for the chosen vehicle project, therefore, the launch
and production phase that includes a continuous change management were selected.
Figure 9.5 shows the launch management phase that starts after the series
development and before the SOP. During the production phase a continuous change
management is required that can be monitored and controlled with a CPS.
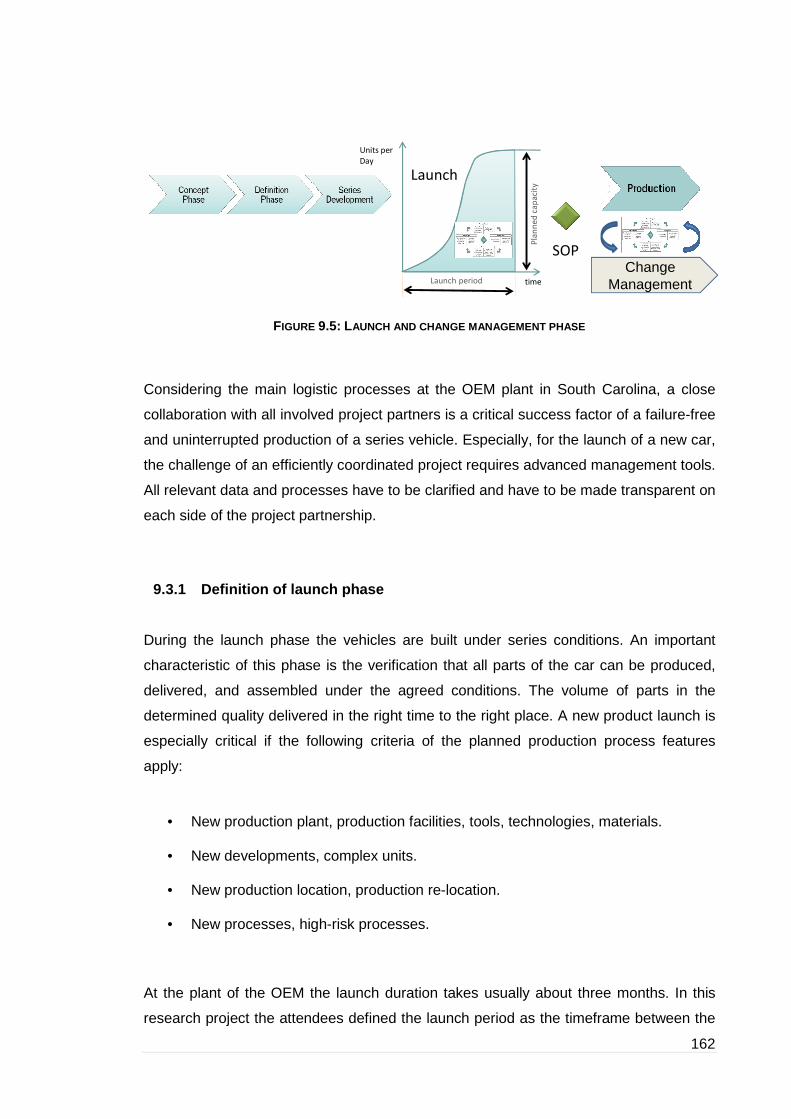
162
FIGURE 9.5: LAUNCH AND CHANGE MANAGEMENT PHASE
Considering the main logistic processes at the OEM plant in South Carolina, a close
collaboration with all involved project partners is a critical success factor of a failure-free
and uninterrupted production of a series vehicle. Especially, for the launch of a new car,
the challenge of an efficiently coordinated project requires advanced management tools.
All relevant data and processes have to be clarified and have to be made transparent on
each side of the project partnership.
9.3.1 Definition of launch phase
During the launch phase the vehicles are built under series conditions. An important
characteristic of this phase is the verification that all parts of the car can be produced,
delivered, and assembled under the agreed conditions. The volume of parts in the
determined quality delivered in the right time to the right place. A new product launch is
especially critical if the following criteria of the planned production process features
apply:
• New production plant, production facilities, tools, technologies, materials.
• New developments, complex units.
• New production location, production re-location.
• New processes, high-risk processes.
At the plant of the OEM the launch duration takes usually about three months. In this
research project the attendees defined the launch period as the timeframe between the
Units per
Day
Launch period time
Pla
nn
ed
ca
pa
city
SOPChange
Management
Launch
163
first activities in the OEM production plant until the SOP. Typical tasks of the operational
launch management are concentrated on the launch phase and include the
development of an open points list (LOP), list of missing parts, quality reports, and daily
management meetings. Strategic launch management is not limited to the launch period
only but it deals with all activities in the run-up to the launch, which are necessary to call
attention on deficiencies of the product maturity and includes the monitoring of the
milestones adherence in particular.
The expectations of the OEM towards its supplier are:
• To achieve process capability and guarantee for all characteristics that affect
customer requirements.
• To furnish proof that the manufacturing process is able to produce the required
numbers at the required quality level with the planned staffing and machine
capacities.
• Proof that the process chain is able to achieve the required quality.
Before the research project was initiated several interviews with managers from the
supplier and OEM addressed the identification of typical difficulties and challenges
during the launch process. Some of them are:
• Demand for continuous reduction of the launch time and timely and efficient
communication.
• Synchronisation of the start-ups of production all over the supply network.
• Scheduling variance and unpredictability for logistical planning.
• Quality variances and variance of planned and short-term demand.
• Availability of parts and change management.
• Insecure production processes.
9.3.2 Change management phase
The geometry of the wire harness requires a continuous change management during
the whole product life cycle. Each relocation of a component and module in particular in
a vehicle results in an adjustment of the harness design. Most of the changes and
requirements are made at the main branch of the OEM and also of the supplier in
164
Germany. The situation of a global information exchange and material flow demands for
advanced communication management and collaboration strategies to provide
constantly consistent and actual data. In previous projects, a simultaneous engineering
team was formed that was composed of all required experts of both organisations.
Regarding previous projects professionals from the logistics, planning, and procurement
department were interviewed to identify critical success factors of the product launch.
The following recommendations were derived from lessons learned:
• Maintain the core team from the beginning until the end of one project.
• Multiple changes and undefined responsibilities had a negative impact on the
performance of previous projects.
• Reduce fluctuation within the team members and name experts who remain
responsible for the whole project duration.
• Define project handovers if responsibilities change and keep in close proximity
with upper management.
• Define goals and measures with the supplier before project start and enforce an
open and frank communication to enhance planning.
• A lack of transparency in critical situations and the complexity of influencing
factors impede decision making.
• Simplify the project reporting and status monitoring: a new monitoring tool may
not cause additional effort but should facilitate the project planning and reporting
with an efficient workflow.
• Avoid cost intensive trouble-shooting in production and logistic processes by an
anticipatory and sustainable planning.
• Develop a corporate culture for open communication: a timely and
comprehensive information flow is often disrupted due to unclear authorization of
cross-company information transfer.
• Affirm pro-active behaviour of the suppliers and ensure an understanding of
common processes.
• Encourage pro-active communication to avoid errors and integrate the supply
network partners in the planning process as early as possible.
• Assess agreements in periodical audits on site at suppliers’ facilities.
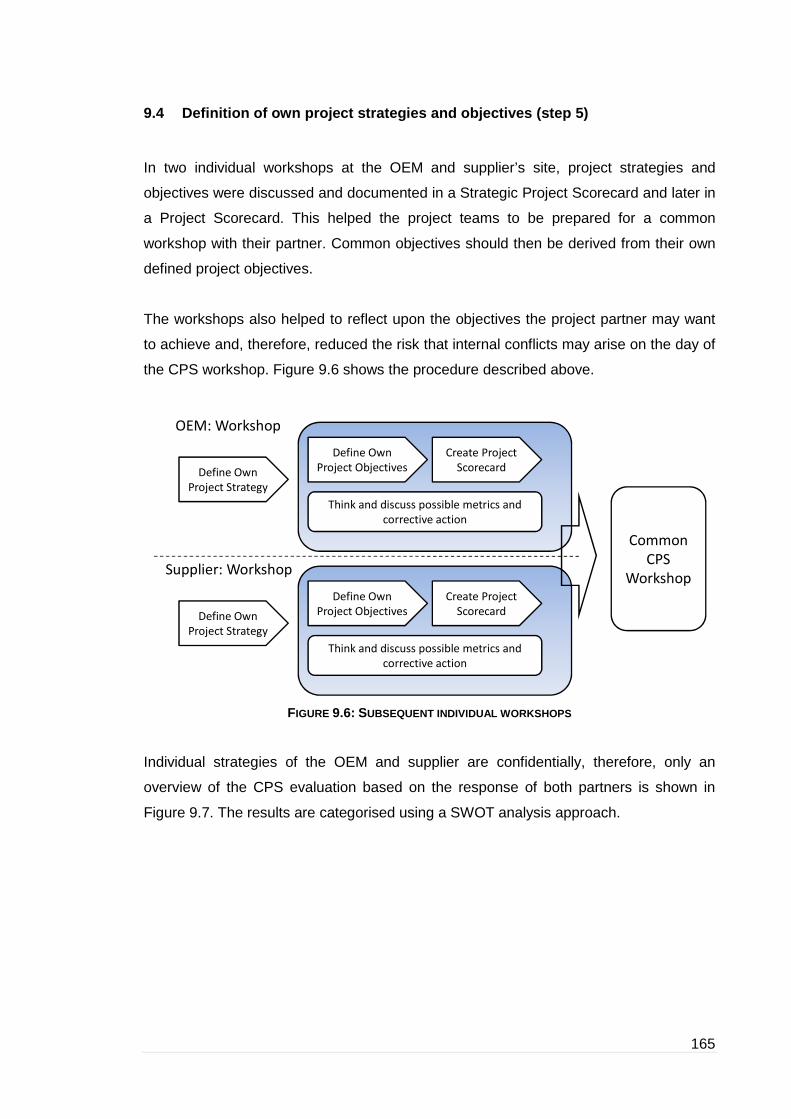
165
9.4 Definition of own project strategies and objecti ves (step 5)
In two individual workshops at the OEM and supplier’s site, project strategies and
objectives were discussed and documented in a Strategic Project Scorecard and later in
a Project Scorecard. This helped the project teams to be prepared for a common
workshop with their partner. Common objectives should then be derived from their own
defined project objectives.
The workshops also helped to reflect upon the objectives the project partner may want
to achieve and, therefore, reduced the risk that internal conflicts may arise on the day of
the CPS workshop. Figure 9.6 shows the procedure described above.
FIGURE 9.6: SUBSEQUENT INDIVIDUAL WORKSHOPS
Individual strategies of the OEM and supplier are confidentially, therefore, only an
overview of the CPS evaluation based on the response of both partners is shown in
Figure 9.7. The results are categorised using a SWOT analysis approach.
Define Own
Project Strategy
OEM: Workshop
Define Own
Project Objectives
Create Project
Scorecard
Think and discuss possible metrics and
corrective action
Define Own
Project Strategy
Supplier: Workshop
Define Own
Project Objectives
Create Project
Scorecard
Think and discuss possible metrics and
corrective action
Common
CPS
Workshop
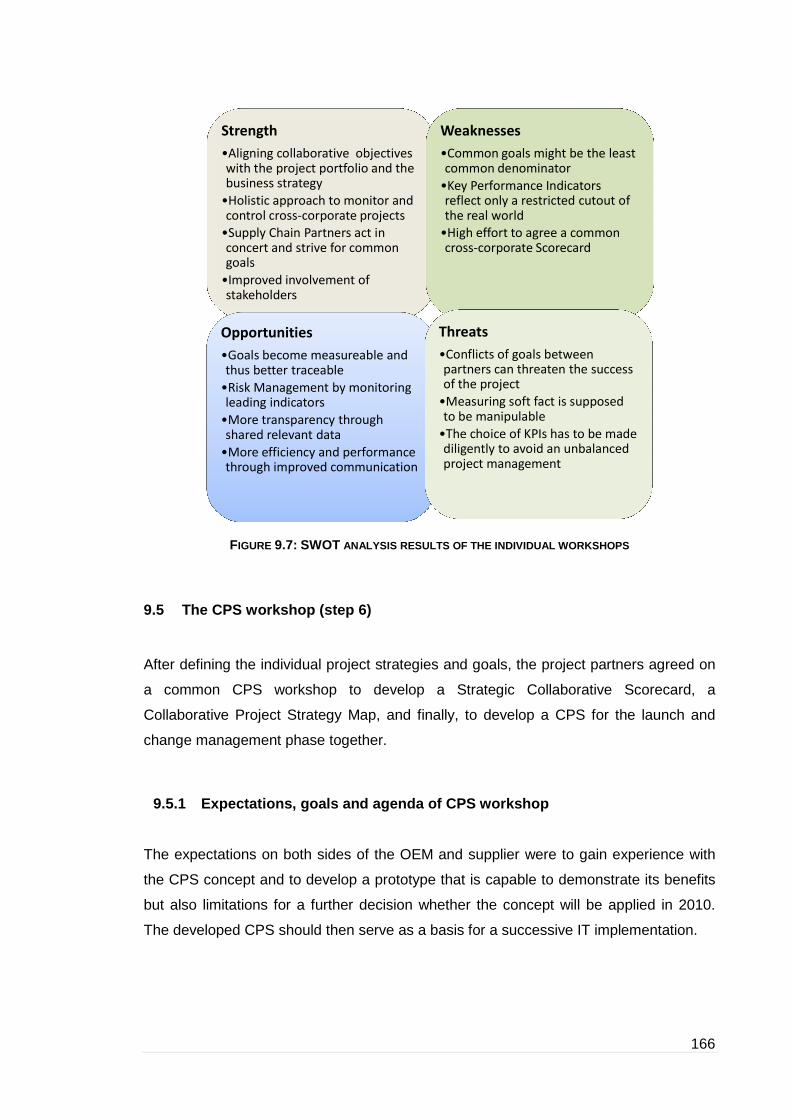
166
FIGURE 9.7: SWOT ANALYSIS RESULTS OF THE INDIVIDUAL WORKSHOPS
9.5 The CPS workshop (step 6)
After defining the individual project strategies and goals, the project partners agreed on
a common CPS workshop to develop a Strategic Collaborative Scorecard, a
Collaborative Project Strategy Map, and finally, to develop a CPS for the launch and
change management phase together.
9.5.1 Expectations, goals and agenda of CPS workshop
The expectations on both sides of the OEM and supplier were to gain experience with
the CPS concept and to develop a prototype that is capable to demonstrate its benefits
but also limitations for a further decision whether the concept will be applied in 2010.
The developed CPS should then serve as a basis for a successive IT implementation.
Strength
•Aligning collaborative objectives with the project portfolio and the business strategy
•Holistic approach to monitor and control cross-corporate projects
•Supply Chain Partners act in concert and strive for common goals
•Improved involvement of stakeholders
Weaknesses
•Common goals might be the least common denominator
•Key Performance Indicators reflect only a restricted cutout of the real world
•High effort to agree a common cross-corporate Scorecard
Opportunities
•Goals become measureable and thus better traceable
•Risk Management by monitoring leading indicators
•More transparency through shared relevant data
•More efficiency and performance through improved communication
Threats
•Conflicts of goals between partners can threaten the success of the project
•Measuring soft fact is supposed to be manipulable
•The choice of KPIs has to be made diligently to avoid an unbalanced project management

167
Goals of the CPS workshop were:
• Realistic draft of a Strategic Collaboration Scorecard (SCS) between the OEM
and supplier.
• Two Collaborative Project Scorecards for the launch and change management of
the wire harness.
• Summary of benefits, advantages, limitations, and barriers of the methodology.
It was essential that all participants were prepared with respect to an understanding of
their own processes, weaknesses, and critical success factors. The CPS workshop took
place on 11th March 2008 with 15 members (9 associates from the OEM and 6 from the
supplier). It started with an introduction and presentation of the previous results and the
workshop agenda. This was followed by the development of a SCS by all participants.
The SCS was the basis to develop the project phase specific CPS and was created by
two individual groups that were comprised of a balanced distribution of associates with
respect to their management tasks. A detailed agenda of the workshop can be found in
Appendix C.
The representatives of both organisations originated from the departments of
procurement, sales, quality, logistics, and management. The positions of the associates
were from the functions of management (42%), project management (25%), and indirect
functions (33%). The ratio between employees of the OEM and the supplier was 7:6 as
two participants were part of the CPS research team. The average number of years of
experience was 5.4 years in project management. In a first step the Strategic
Collaborative Scorecard and Collaborative Strategy Map was created on the basis of the
Balanced Scorecards of the OEM and the supplier as well as the project experience of
the participants (Figure 9.8).

168
FIGURE 9.8: DEVELOPMENT OF A SCS AND STRATEGY MAP
The previous step of creating a Strategic Partnership Scorecard as described in
Chapter 7 was skipped as the time of the workshop was limited. Therefore, the vision of
the Balanced Scorecards of both organisations were taken to create the vision of the
SCS. The objectives and strategies of the SCS derived from the project experience of
the workshop members.
In the next step, the participants were grouped into two work groups to develop a CPS
for the launch and change management phase. After one hour, the launch management
group changed to the change management and vice versa. The moderator presented
the current results to the new group and in the following hour the CPS was further
developed. Figure 9.9 shows the complete procedure of the workshop.
OEM BSC Supplier BSC
Strategic Collaboration ScorecardStrategic Collaboration Scorecard
Project Experience of
Workshop Members
Project Experience of
Workshop Members
Strategy
Map of SCS

169
FIGURE 9.9: PROCEDURE OF THE CPS WORKSHOP
9.6 The Strategic Collaborative Project Scorecard an d Collaborative Strategy
Map
The representatives of both companies came to the workshop with an understanding of
their own company strategy and with their particular collaboration tactic in mind. Given
the strategies of both companies, it was possible to identify similar principles and a
collaborative vision. The vision was defined as shown in Figure 9.10.
Group A (1h):
Launch Management CPS
Strategic Collaborative Scorecard
Group B (1h):
Change Management CPS
Group C (1h):
Launch Management CPS
Group D (1h):
Change Management CPS
Change of
work group
members
Introduction
Launch
Management
CPS
Change
Management
CPS

170
FIGURE 9.10: COMMON VISION OF THE PROJECT PARTNERSHIP
The vision represents the strategic core of the project partnership and all project
objectives should address the core. Based on this vision the typical goals in a
collaborative project were commonly identified and categorised according to the SCS
structure and perspectives (Figure 9.11).
FIGURE 9.11: THE STRATEGIC COLLABORATIVE SCORECARD
“Along with our partner, we want
to cultivate a trustful relationship
to collaboratively adapt our value
creation network to market
demands efficiently, sustainably
and with utmost flexibility for an
enduring economic success and,
therefore, for an increased
customer value.”
COMMON VISION

171
To facilitate the discussion and the agreement process, and to increase the
transparency of the interdependencies of the defined objectives, the project goals were
tagged on a plain whiteboard and structured according to the Strategy Map concept. As
a first result, the Strategic Collaboration Scorecard and the related Strategy Map were
created. The Collaborative Project Strategy Map is shown in Figure 9.12.
FIGURE 9.12: STRATEGY MAP OF THE STRATEGIC COLLABORATIVE SCORECARD
The original picture of the Collaborative Project Strategy Map can be found in
Appendix C. This was done after the workshop in consolidation with the team. Typically,
Development
Project Result
Collaboration
Processes
Creation of Innovation
Implementation of a Continuous Improvement
Process
Team Satisfaction
Sustainable Trustful
Collaboration
Consistent & High Quality
Effective and efficient
processes
Fairbenefit share
Effective and quick
implementation of new ideas & requirements
Effective communication
Achievement of necessary
transparency
Flexibility to customer demand
Profitability
Incentives
Definition of communication
and common agreement processes
High Process Maturity and
Reliability
Milestone & Timeline
Compliance
Target Volume
Budget Adherence
Common Risk Management
processes
Documentation of lessons learned,
agreements, processes
EnvironmentTimeline definition
1
2
3
3 1,2
1
2
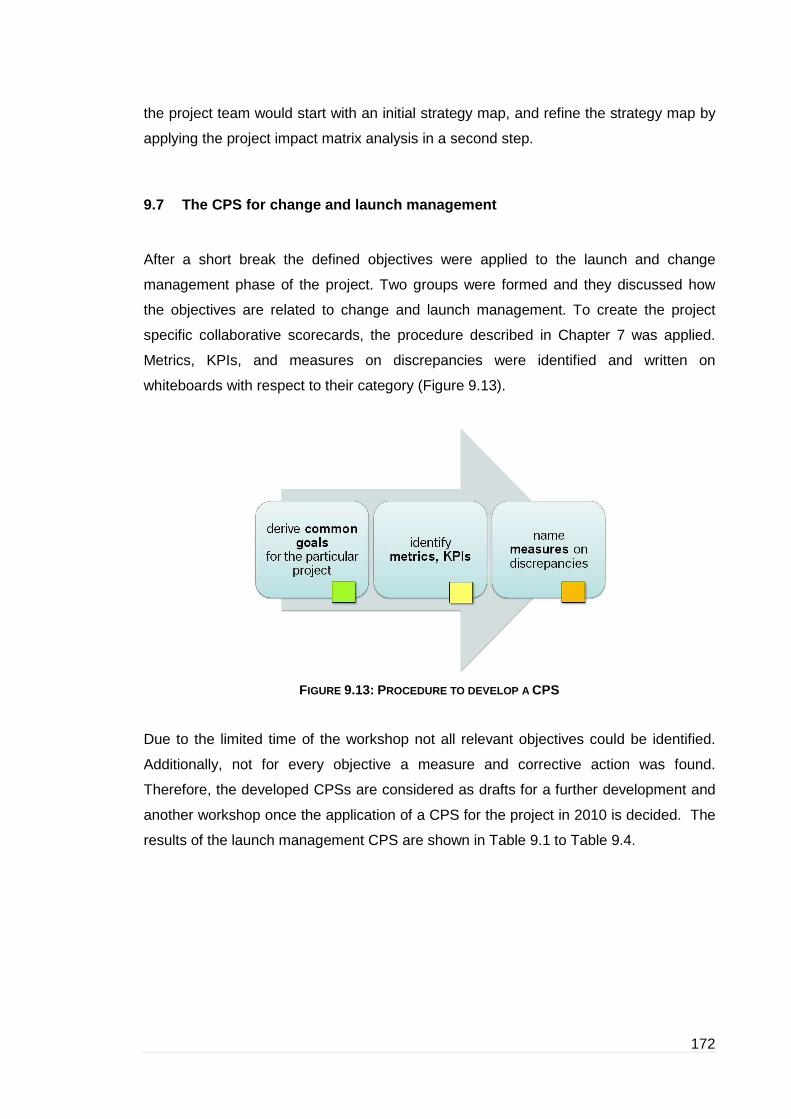
172
the project team would start with an initial strategy map, and refine the strategy map by
applying the project impact matrix analysis in a second step.
9.7 The CPS for change and launch management
After a short break the defined objectives were applied to the launch and change
management phase of the project. Two groups were formed and they discussed how
the objectives are related to change and launch management. To create the project
specific collaborative scorecards, the procedure described in Chapter 7 was applied.
Metrics, KPIs, and measures on discrepancies were identified and written on
whiteboards with respect to their category (Figure 9.13).
FIGURE 9.13: PROCEDURE TO DEVELOP A CPS
Due to the limited time of the workshop not all relevant objectives could be identified.
Additionally, not for every objective a measure and corrective action was found.
Therefore, the developed CPSs are considered as drafts for a further development and
another workshop once the application of a CPS for the project in 2010 is decided. The
results of the launch management CPS are shown in Table 9.1 to Table 9.4.

173
Project Results
Objectives Metrics Corrective Action
cost Avoidance total cost per unit per phase analysis of the root costs
< budget target Budget reports
budget adherence tracking
per launch phase
budget delta (part price, logistic
costs, dev. costs, tooling costs)
series revenue PPMs, Customer Satisfaction no revenue profitability -
alternative processes
meet target volume on time number of late cars / total cars fish bone analysis
escalation rules
high parts quality ppm quality escalation process
Checkpoints (Quality) complain reports
warranty
TABLE 9.1: PROJECT RESULTS LAUNCH MANAGEMENT CPS
Collaborative Processes
Objectives Metrics Corrective Action
SE team for information
sharing
start-up reporting; actual vs.
planned against milestone
checklist
technical date at current
level for launch process
ETA
part availability by milestone part availability for project phase
transparency of processes
and interfaces
surveys (regular basis)
responsibility matrix
process documentation
workshops
clear premises at project
start
frequency of changes in
premises
revision tracking
GAMS
effective and efficient
common processes
adherence to defined landscape regular review of processes/
effectiveness
mutual common risk
evaluation process
checklists regular reviews
timeline
TABLE 9.2 PROCESSES LAUNCH MANAGEMENT CPS
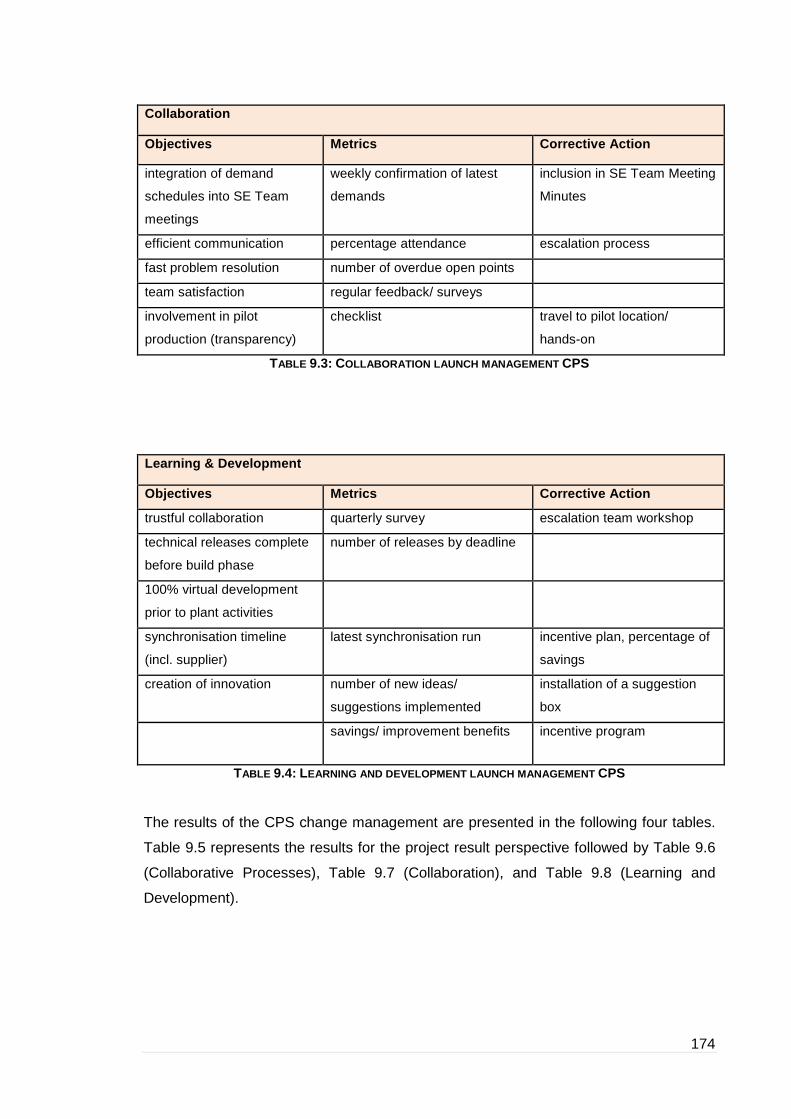
174
Collaboration
Objectives Metrics Corrective Action
integration of demand
schedules into SE Team
meetings
weekly confirmation of latest
demands
inclusion in SE Team Meeting
Minutes
efficient communication percentage attendance escalation process
fast problem resolution number of overdue open points
team satisfaction regular feedback/ surveys
involvement in pilot
production (transparency)
checklist travel to pilot location/
hands-on
TABLE 9.3: COLLABORATION LAUNCH MANAGEMENT CPS
Learning & Development
Objectives Metrics Corrective Action
trustful collaboration quarterly survey escalation team workshop
technical releases complete
before build phase
number of releases by deadline
100% virtual development
prior to plant activities
synchronisation timeline
(incl. supplier)
latest synchronisation run incentive plan, percentage of
savings
creation of innovation number of new ideas/
suggestions implemented
installation of a suggestion
box
savings/ improvement benefits incentive program
TABLE 9.4: LEARNING AND DEVELOPMENT LAUNCH MANAGEMENT CPS
The results of the CPS change management are presented in the following four tables.
Table 9.5 represents the results for the project result perspective followed by Table 9.6
(Collaborative Processes), Table 9.7 (Collaboration), and Table 9.8 (Learning and
Development).

175
Project Results Objectives Metrics Corrective Action
profitability
quantity of technical changes per
time period prioritise
budget adherence
budget:
development costs, logistics
costs, part price, scrap, rework
monitor business plan
timeline compliance time to implementation "business plan" for technical
changes
no obsolete material costs for obsolete material
high quality
low warranty cost or customer
complaints
defect limits
low ppm, low 0-km defects
quality approval before
implementation
no rework rework costs
TABLE 9.5: PROJECT RESULTS CHANGE MANAGEMENT CPS
Processes
Objectives Metrics Corrective Action
all changes documented and
validated
no of changes, no of changes
validated
process efficiency response time (less than 10
days), priority index
clear definition of processes
low risk due to optimal risk
management
business plan process - impact
on risk assessment
core SE-team
establish and maintain
change management team
communication efficiency meet one time per week,
meeting minutes
attendance statistics
meeting frequency, LSV
lessons learned meeting
before every phase
no of lessons learned meetings
incentives partnership - supplier rating audit (e.g. LOG)
TABLE 9.6: PROCESSES CHANGE MANAGEMENT CPS

176
Collaboration
Objectives Metrics Corrective Action
transparency team feedback process flow, clear roles and
responsibilities
team satisfaction fluctuation of project team
members
survey
regular workshops
contact list
on-time delivery 100% missed shipment, expedite and
PFA costs
definition of expectations response time (less than 10
days)
no escalations no of escalations audit
TABLE 9.7: COLLABORATION CHANGE MANAGEMENT CPS
Learning & Development
Objectives Metrics Corrective Action
new ideas (product and
process)
no of new ideas implemented
savings, and cost avoidance
innovation workshop (regular
basis)
sustainable trusting
collaboration
feedback survey regular review KPIs
time line definition adherence to project timing plan compare project development
and timing plan
flexibility to customer
demand
KOVP Adherence
fair benefit share number of QUAKO ideas GAMS, QUAKO
TABLE 9.8: LEARNING AND DEVELOPMENT CHANGE MANAGEMENT CPS
The findings of the second session of the workshop are based on brainstorming and
previous experience of the participating associates and make no claim to be entirely
complete. Additionally, the target values and corridors could not be disclosed due to
confidentiality reasons.

177
9.8 Discussion of results and workshop questionnaire (step 7)
The final session of the workshop was a discussion about the results and the
consequences for the CPS concept. Benefits, advantages, limitations and barriers were
identified and summarised. A questionnaire was handed out and completed before the
workshop ended. The questionnaire can be found in Appendix C. Question 4 addressed
the evaluation of the CPS impact on collaboration. The scale ranged from “too much
overhead work” (1) to “effective impact” (5). The overall average rating was 4.25. Thus,
the feedback was generally positive. The following aspects in the next section
summarise the statements of the attendants (question 5). The statements were divided
into two categories: “benefits” and “barriers and efforts” of the CPS concept.
9.8.1 Benefits of the CPS concept
Benefits identified during the research pilot project were:
• Reinforces the needs and expectations of both companies.
• Opens up opportunities for collaboration improvements.
• Alignment of the whole team to the agreed common goals.
• Communication between supplier and OEM improved with workshops like this.
• Good exercise to meet and discuss goals and measures directly with supplier.
• It is beneficial that all are together in a workshop to talk about common goals.
• Approach helps to coordinate and the synchronisation of the daily business of
both companies.
• The implementation and use of a tool could lead to more transparency, e.g., by
monitoring premises.
• KPIs could be a driver for the core team.
• Improved planning, and the clarification of dependencies between goals
facilitates the identification of cost lead factors. That holds team members
accountable to their cost targets.
• The scorecard approach brings everybody into an overall picture.
• Defining common goals could avoid mistakes and unnecessary tasks.
178
• Review of the scorecard once a year: framework discussion makes it transparent
to upper management.
9.8.2 Barriers and efforts of the CPS concept
The following is a list of barriers and efforts necessary to develop, implement, and
maintain the CPS.
• Concerns about integration into existing reporting systems: is the CPS user
friendly? Not a burden? Can it be used to facilitate the core team meetings?
• It was difficult to find KPIs for what we do. This could be a barrier when the CPS
should become more detailed.
• Difficult to translate soft facts in measurable hard facts.
• Installation and maintenance of the system could be difficult.
• Predefinition of the categories lead to laborious assignment of goals into
perspectives.
• Who is the champion within the organisation, who will drive the project?
• Key to success will be regular ongoing review of agreed goals.
• Capacity requirement for maintaining the CPS.
• Periodical meetings would be necessary and beneficial.
• The OEM will have to train its suppliers to use and maintain this new system.
• Big effort estimated for maintenance of the scorecard due to continuous changes
of collaboration.
• Do this new approach and the related system cause additional overhead work?
9.8.3 Conclusion of research pilot project in the USA
The following conclusion of the research pilot projects is based on the interviews and
statements of the project members after the workshop.

179
Generally, the CPS supports the creation of mutual trust within the partnership and
creates transparency with respect to agreements on objectives, responsibilities,
processes, the actual performance and the success of collaboration. Therefore, it
contributes to the avoidance and reduction of complexity in the project environment. It
can serve as the basis for an incentive system and for an enhanced supplier selection
system on the basis of continuous benchmarking. It discloses cause and effect
dependencies of common goals and uncovers conflicts of concurrent objectives in
project partnerships. The CPS also provides a forecasting solution through its related
tools, e.g. the Project Impact Matrix and Strategy Map. By understanding coherences of
the goal related network, leading indicators can be identified. Their impact can be
preventive in the future by initiating counter measures timely. The concept also reduces
the risk of projects through an integrated countermeasure and risk management and
serves as basis for a cross-company and continuous improvement process.
The CPS concept quantifies the subjective perception of a mature and trustful
collaboration and transforms it into measurable hard facts by supporting a holistic view
over supplier selection. However, there is resistance that needs to be overcome. The
introduction of a new collaboration wide controlling system creates resistance not only
within the cross-company team of an OEM but also within the project members of a
supplier unwilling to apply the concept. The key to success is to convince upper
management of both partners and to demonstrate that the benefits may be
overshadowed by the limitations and efforts. Project members who are strongly involved
with operational tasks often ignore the impact of a strategic tool. In the contrary, they
consider a new strategic tool as mere additional effort until they understand its impact.
Benefits of the CPS methodology identified by project members of the OEM and
supplier in the USA are that it opens up opportunities for collaboration improvements
and aligns the whole team to the agreed common goals. It improves communication
between the OEM and supplier, and the clarification of dependencies between goals
facilitates the identification of cost lead factors. That holds team members accountable
to their cost targets. Defining common goals could avoid mistakes and unnecessary
tasks. On the other hand, it is difficult to find KPIs for what we do and to translate soft
facts in measurable hard facts. The installation and maintenance of an IT system could
be difficult and the training of project members to use and maintain the new system
leads to additional effort. Key to success will be a regular ongoing review of agreed
goals, measures and corrective action.
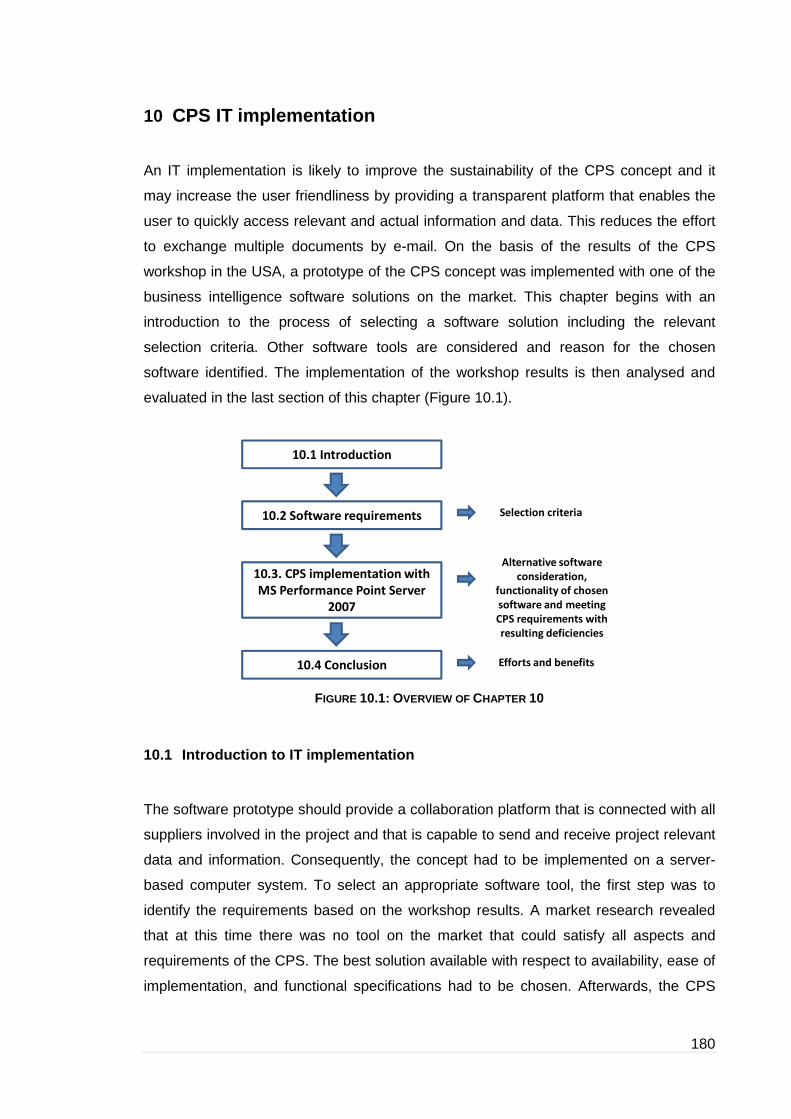
180
10 CPS IT implementation
An IT implementation is likely to improve the sustainability of the CPS concept and it
may increase the user friendliness by providing a transparent platform that enables the
user to quickly access relevant and actual information and data. This reduces the effort
to exchange multiple documents by e-mail. On the basis of the results of the CPS
workshop in the USA, a prototype of the CPS concept was implemented with one of the
business intelligence software solutions on the market. This chapter begins with an
introduction to the process of selecting a software solution including the relevant
selection criteria. Other software tools are considered and reason for the chosen
software identified. The implementation of the workshop results is then analysed and
evaluated in the last section of this chapter (Figure 10.1).
FIGURE 10.1: OVERVIEW OF CHAPTER 10
10.1 Introduction to IT implementation
The software prototype should provide a collaboration platform that is connected with all
suppliers involved in the project and that is capable to send and receive project relevant
data and information. Consequently, the concept had to be implemented on a server-
based computer system. To select an appropriate software tool, the first step was to
identify the requirements based on the workshop results. A market research revealed
that at this time there was no tool on the market that could satisfy all aspects and
requirements of the CPS. The best solution available with respect to availability, ease of
implementation, and functional specifications had to be chosen. Afterwards, the CPS
10.1 Introduction
10.2 Software requirements
10.3. CPS implementation with
MS Performance Point Server
2007
Selection criteria
Alternative software
consideration,
functionality of chosen
software and meeting
CPS requirements with
resulting deficiencies
10.4 Conclusion Efforts and benefits
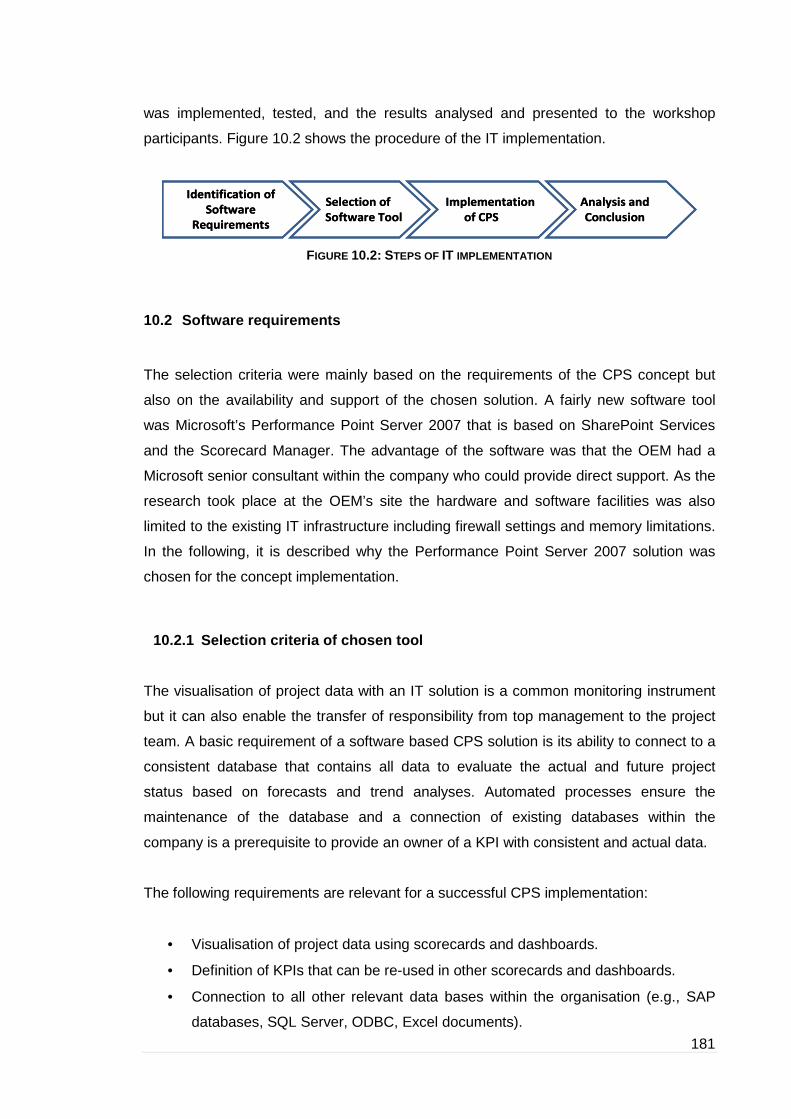
181
was implemented, tested, and the results analysed and presented to the workshop
participants. Figure 10.2 shows the procedure of the IT implementation.
FIGURE 10.2: STEPS OF IT IMPLEMENTATION
10.2 Software requirements
The selection criteria were mainly based on the requirements of the CPS concept but
also on the availability and support of the chosen solution. A fairly new software tool
was Microsoft’s Performance Point Server 2007 that is based on SharePoint Services
and the Scorecard Manager. The advantage of the software was that the OEM had a
Microsoft senior consultant within the company who could provide direct support. As the
research took place at the OEM’s site the hardware and software facilities was also
limited to the existing IT infrastructure including firewall settings and memory limitations.
In the following, it is described why the Performance Point Server 2007 solution was
chosen for the concept implementation.
10.2.1 Selection criteria of chosen tool
The visualisation of project data with an IT solution is a common monitoring instrument
but it can also enable the transfer of responsibility from top management to the project
team. A basic requirement of a software based CPS solution is its ability to connect to a
consistent database that contains all data to evaluate the actual and future project
status based on forecasts and trend analyses. Automated processes ensure the
maintenance of the database and a connection of existing databases within the
company is a prerequisite to provide an owner of a KPI with consistent and actual data.
The following requirements are relevant for a successful CPS implementation:
• Visualisation of project data using scorecards and dashboards.
• Definition of KPIs that can be re-used in other scorecards and dashboards.
• Connection to all other relevant data bases within the organisation (e.g., SAP
databases, SQL Server, ODBC, Excel documents).
Identification of
Software
Requirements
Selection of
Software Tool
Implementation
of CPS
Analysis and
Conclusion
Identification of
Software
Requirements
Selection of
Software Tool
Implementation
of CPS
Analysis and
Conclusion

182
• Visualisation of a Strategy Map based on project objectives defined in the
scorecards.
• Definition of interdependencies between KPIs and objectives based on the
Strategy Map.
• Definition of target values and corridors for each KPI.
• Connecting multiple KPIs to one objective.
• Easy creation of charts and figures for project analysis.
• Illustration and calculation of forecasts based on trend analysis (e.g., milestone
trend analysis, earned value method).
• Linking counter measures to KPIs and project objectives.
• Rights management: each user has different rights to access only user relevant
data.
• Scalability of scorecards: creation of portfolio and program scorecards based on
the company BSC and further creation of project scorecards aligned with
portfolio scorecards.
• Reporting system that produces adjustable and scalable management reports
and automated sending of these reports (e.g., by e-mail).
• Workflow capability.
The following figure (Figure 10.3) shows the requirements on the workflow
capability.
FIGURE10.3: WORKFLOW CAPACITY REQUIREMENTS
• Process data
• Calculate KPIs
• Do plausibility checks
• Trouble-shooting
• Manage access authorization
• Manage roles and rules
• Manage restrictions
• Realize data supply
•Monitor KPIs
•Alert and show measures
•Illustrate coherences
•Generate customized
reporting
• Commit common project goals
• Deduce goals for each perspective of the Scorecard
• Agree metrics how to measure those goals
• Define actions to achieve the goals
Report & Act
Agree & Define
Authorize & Supply
Data
Processing & Analyze

183
The first step is to agree on common goals and categorise them into the relevant
perspectives. Metrics to monitor and action to control the goals are also part of one step
that is followed by an authorisation and data supply procedure. It is essential to
establish rights management that allows access to certain data for selected personal
only. It should also provide smart data processing, visualisation, analysis tools,
automated plausibility checks, and trouble-shooting capability.
To implement the defined specifications of the project team, the system should offer
tools, which allow a design of dynamic, multi-dimensional databases. The management
of access authorisation, rules, user profiles, roles and restrictions is necessary to ensure
a proper application of the tool.
A prerequisite for collaboration is a shared database to which all project partners have
access. An IT based CPS has to be accessed by associates of different organisations
and requires a shared system that may be internet-based with a strict security concept.
Some questions arise quickly regarding the hardware architecture of the system. The
physical location of the server where the application is installed and how the server can
be protected from unauthorised access are only a few of significant questions
(Figure 10.4).
FIGURE 10.4: SHARED DATA BETWEEN OEM AND SUPPLIER TO CREATE KPIS
Besides the basic concept of existing scorecard systems the CPS requires a continuous
and partially automated counter measure management, integrated risk management,
project status in real time, advanced forecasting, and the aspects mentioned above
such as the project strategy map and impact matrix.
OEM
SupplierShared
data
base
F(x, y, z)
KPIs

184
10.3 CPS implementation with MS Performance Point 20 07
Considering the selection criteria and aspects related to access and support, the
implementation of the consolidated CPS workshop results took place on a research lab
server using the software Microsoft Performance Point Server 2007. This section
describes the functionality of the tool briefly and illustrates the implementation results.
The following figure (Figure 10.5) shows the architecture of the lab environment and its
connection to the OEM internal and external network, such as supplier networks.
FIGURE 10.5: ARCHITECTURE OF LAB ENVIRONMENT FOR CPS IMPLEMENTATION
10.3.1 Alternative software consideration and limit ations
The Business Intelligence (BI) solution market is broad and many software companies
sell customised tools that are specified and adjusted to the customer’s requirements and
demand. The selection of Microsoft Performance Point Server 2007 was not only made
on the basis of its functionality with respect to the CPS concept but also on the
possibility of its availability to the OEM and its IT infrastructure and lab environment as
Internet
OEM Lab
Environment
External Network
OEM Network
FW
InIW InITInPM
PPS
Switch
RO
CL
ExIW ExITExPM
RO
Lab
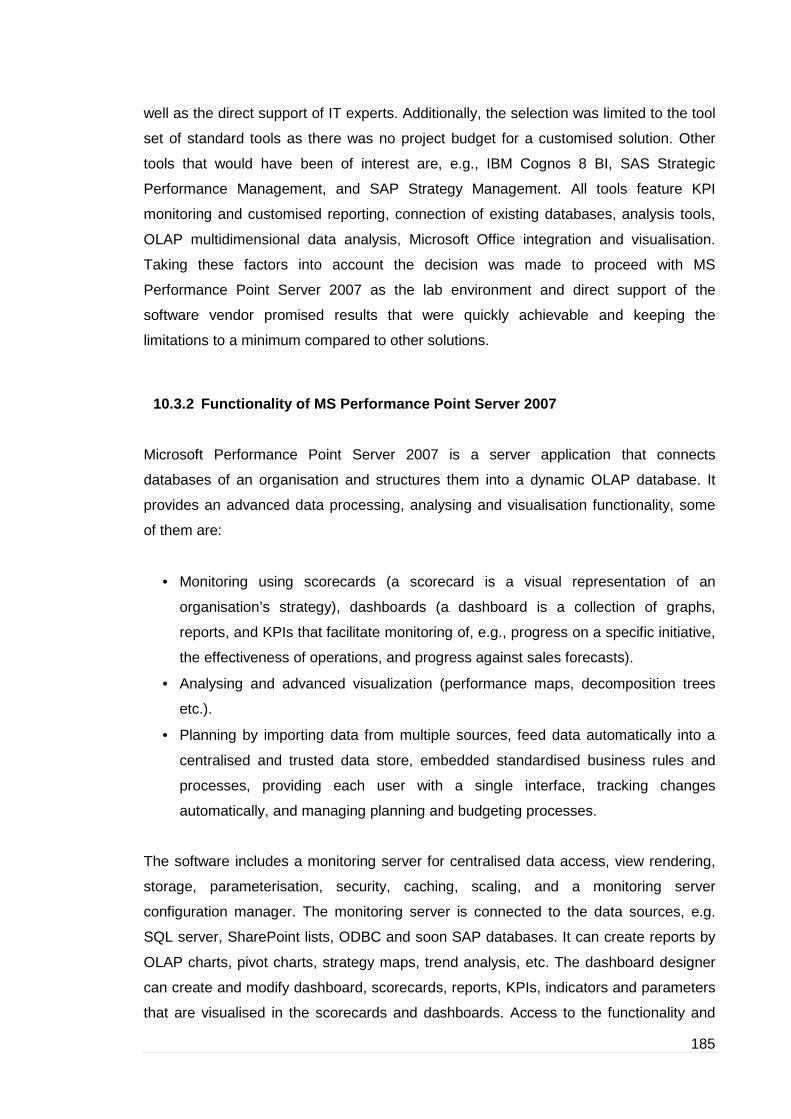
185
well as the direct support of IT experts. Additionally, the selection was limited to the tool
set of standard tools as there was no project budget for a customised solution. Other
tools that would have been of interest are, e.g., IBM Cognos 8 BI, SAS Strategic
Performance Management, and SAP Strategy Management. All tools feature KPI
monitoring and customised reporting, connection of existing databases, analysis tools,
OLAP multidimensional data analysis, Microsoft Office integration and visualisation.
Taking these factors into account the decision was made to proceed with MS
Performance Point Server 2007 as the lab environment and direct support of the
software vendor promised results that were quickly achievable and keeping the
limitations to a minimum compared to other solutions.
10.3.2 Functionality of MS Performance Point Server 2007
Microsoft Performance Point Server 2007 is a server application that connects
databases of an organisation and structures them into a dynamic OLAP database. It
provides an advanced data processing, analysing and visualisation functionality, some
of them are:
• Monitoring using scorecards (a scorecard is a visual representation of an
organisation’s strategy), dashboards (a dashboard is a collection of graphs,
reports, and KPIs that facilitate monitoring of, e.g., progress on a specific initiative,
the effectiveness of operations, and progress against sales forecasts).
• Analysing and advanced visualization (performance maps, decomposition trees
etc.).
• Planning by importing data from multiple sources, feed data automatically into a
centralised and trusted data store, embedded standardised business rules and
processes, providing each user with a single interface, tracking changes
automatically, and managing planning and budgeting processes.
The software includes a monitoring server for centralised data access, view rendering,
storage, parameterisation, security, caching, scaling, and a monitoring server
configuration manager. The monitoring server is connected to the data sources, e.g.
SQL server, SharePoint lists, ODBC and soon SAP databases. It can create reports by
OLAP charts, pivot charts, strategy maps, trend analysis, etc. The dashboard designer
can create and modify dashboard, scorecards, reports, KPIs, indicators and parameters
that are visualised in the scorecards and dashboards. Access to the functionality and
186
visualisation is managed by an internet browser. The following figure (Figure 10.6)
shows the interaction of the system components.
FIGURE 10.6: SYSTEM COMPONENTS OF THE MS PERFORMANCE POINT SERVER 2007
(MICROSOFT, 2007)
10.3.3 Meeting the CPS requirements
The central monitoring server accepts data input via a connection to external data
sources so that suppliers, e.g., KPI owners, are able to provide relevant data
automatically by connecting to databases or by updating Excel sheets. The dashboard
designer helps the system administrator to customise the processing of data. It also
includes functions to develop personalised scorecards, dashboards and reports.
The functionality of the software theoretically covers many requirements to successfully
apply the tool to a cross-company project. However, recent experience of the OEM has
shown that during the roll out of such a system, many issues have not been considered
and lead to difficulties and delays in its application. Therefore, a proof of concept is
typically necessary to ensure a problem free introduction of a software tool. Additionally,
187
several open issues with respect to technical requirements need clarification. Some of
them are:
• A blueprint of a comprehensive security concept is required that satisfies the
demands of the OEM IT security standards.
• Proof if relevant databases of OEM and suppliers’ networks can be connected
factually.
• System proof that it can perform well under stress of a typical amount of daily
server requests.
Together with Microsoft a first draft of a CPS was implemented to be able to
communicate the workshops results visually and functionally.
10.3.3.1 Identified deficiencies of the system
It was not possible to realise a counter measure management as required by the CPS
concept (installation of automated emails or alert messages on a defined status of a KPI
to the KPI owner. The messages should include agreed counter measures, a
visualisation of the cause and effect relationships, and a feedback form). The possibility
to conduct team surveys is essential due to the demand to measure soft facts in
collaborative projects. However, surveys can only be carried out with SharePoint lists
only. Therefore, the user friendliness is not expected to encourage these surveys
sustainably. CPS risk management has similar restrictions as the counter measure
management.
A connection of textual information to key performance indicators is not feasible and the
tool does not support any automated processes. A SWOT analysis and impact matrix
could not be implemented without additional effort as the software only provides the
integration of the MS Visio 2007 software. This enables the user to create SWOT
analysis and strategy maps visually but not as an integrated and interrelated function.
The process to create a strategy map is laborious as every strategy map of each
dashboard needs to be drawn manually.
Figure 10.7 shows a partial screenshot of the implemented CPS concept and shows the
project result perspective.

188
FIGURE 10.7: SCREENSHOT OF CPS IMPLEMENTATION
For example, if the system user clicks on “PPM”, the software creates a graphical plot of
the recent PPM values as shown in Figure 10.8.
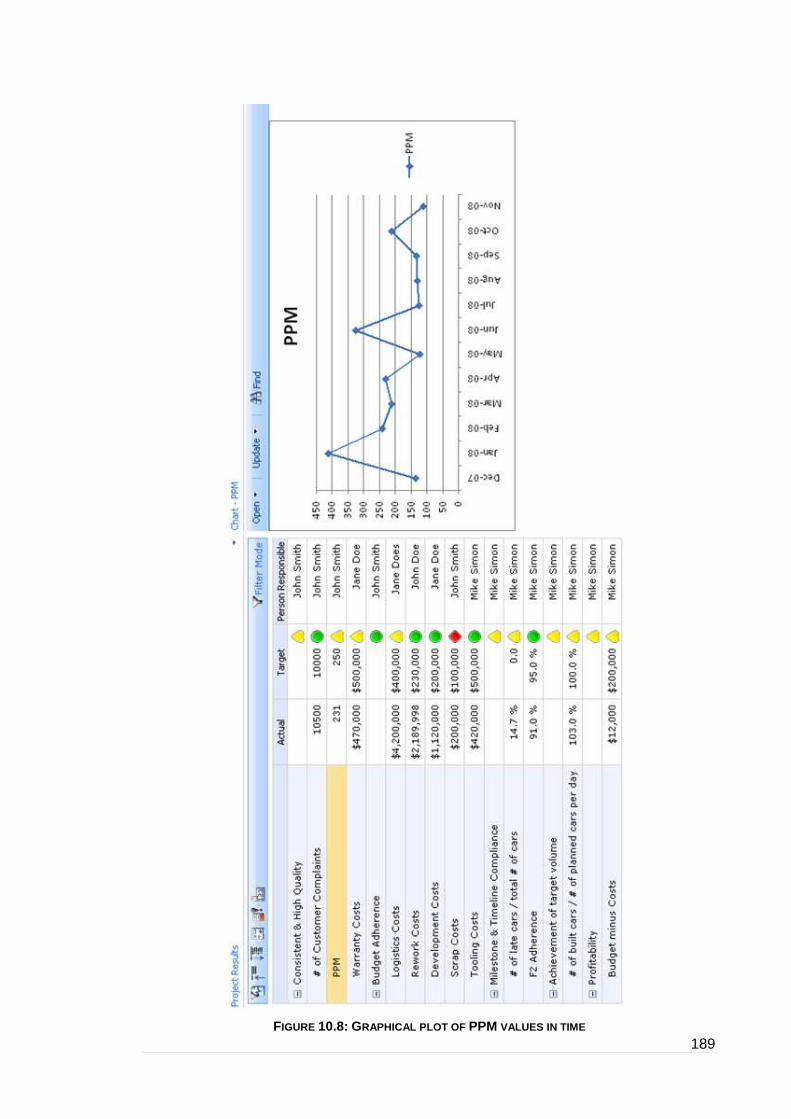
189
FIGURE 10.8: GRAPHICAL PLOT OF PPM VALUES IN TIME

190
10.4 Conclusion
The development of a visual representation of the CPS for launch and change
management was achievable and included the integration of common agreed goals,
implemented key performance indicators with actual and targeted values, a logical
connection of the KPI and the KPI owner, and the plot of different diagrams and other
textual content. It was not accomplishable to realise a dynamic and event driven counter
measure management, risk management or the implementation of lessons learned. The
software provided no solution for an application of an impact matrix. A SWOT analysis
and a Project Strategy Map could be created graphically by integrating MS Visio but
without dynamic functionality. Furthermore, the software did not feature advanced
forecasting or trend analysis. Figure 10.9 lists the advantages and disadvantages of the
tool.
FIGURE 10.9: ADVANTAGES AND DISADVANTAGES OF SELECTED TOOL FOR CPS CONCEPT
A performance and stress test was not done as the connection to real project data could
not be achieved due to the lack of an established security concept that impeded the
connection to all relevant OEM and supplier databases. The feedback of the CPS
workshop participants was positive with regard to the software implementation as it
increases transparency and facilitates the exchange of project relevant information and
data analyses. The term positive is related to the fact the an IT implementation
automates and standardises the relevant processes, such as KPI reporting and data
analyses. This is further supported by the possibility to connect the IT solution to already
existing data bases and to establish a rule and role management. However, the
selected tool does not fully satisfy the CPS requirements. This means that some
Advantages
• Connection to existing databases
• Working with consistent data• Re-use and carry over of existing KPIs
to different dashboards
• Rules and roles management
• Intuitive navigation through database• Useful integrated analysing tools
Disadvantages
• Effort to implement one single KPI is high (1-2h, if database is available)
• High planning functionality but considerable effort
• No dynamic strategy map as it has to be designed for each dashboard
• Excel add-in necessary for each client who uses Performance Point reports and forms
• Extension of the CPS with integrated measure and risk management not included in standard software
• Several errors occurred during installation and operation

191
requirements could not be met, some of them are that next to a workflow management,
a corrective action management, risk management, and a dynamic representation of a
strategy map was not possible. For a future CPS project another tools is highly
recommended based on the facts mentioned above. Nevertheless, the efforts and
benefits of an IT implementation in general could be analysed and are presented in the
next section.
10.4.1 Efforts and benefits of an IT implementation
The CPS workshop participants rated the application of an IT implementation as
beneficial and some even as a key to success. However, it is essential that the solution
does not create overhead work and does not duplicate existing reporting and monitoring
systems. Consequently, there is a challenge in the IT community to develop a tool that
finds broad acceptance in daily project management operations.
There is a higher effort in the beginning of the implementation process as the
connection to all databases needs to be established, rights management defined, the
KPIs defined and created. However, this is mainly an initial effort that can be considered
as front loading compared to the long term benefits. Those are the possibility to carry-
over already defined KPIs and rely on consistent databases as well as a transparent
workflow management. The efforts and benefits are shown in Figure 10.10 and based
on the experience and appraisal of the workshop members.
FIGURE 10.10: CHRONOLOGICAL EVALUATION OF EFFORTS AND BENEFITS OF AN IT IMPLEMENTATION
Efforts• Connection of
existing data• Rights
management• Maintenance of the
PP Server by IT• Maintenance of the
scorecard by project partners
• Configuration of KPIs
Benefits• Carry-over of KPIs• Consistent database• Customized views on
one database• Linking already
running systems• No maintaining of
another system necessary
• Transparent workflow management
• Measure and risk management integration
EffortsBenefits
First project and pilots After several projects within same project partnership

192
11 Integrating a collaborative management model into t he CPS
The Collaborative Project Scorecard aims to reduce difficulties in a cross-company
project by providing a framework for a strategic approach to project collaboration that is
linked with the strategies and objectives of an organisation. The ProSTEP iViP CPM
Reference Model (ProSTEP iViP 2007a) on the other hand, provides a set of processes
and tools to manage time, tasks, and communication on an operational level. This
chapter presents a combined concept based on the CPS and the ProSTEP iViP CPM
Reference Model and demonstrates how the reference model supports the CPS by
creating useful measures as a key to success for an efficient and effective collaboration.
Figure 11.1 gives an overview of this chapter that starts with an introduction to the
integrated approach. In the second section it is described how the model and the CPS
concept can be combined to create operational KPIs that can be strategically monitored
by the CPS.
FIGURE 11.1: OVERVIEW OF CHAPTER 11
The last section includes a discussion of its benefits and disadvantages and further
recommendations.
11.1 Introduction
Cross-company teams have become increasingly important for the success of product
development projects. Although, the use of virtual teams is not entirely new, the demand
and opportunities for an efficient management have increased due to improved
communication technologies (Gierhardt 2001). The growth of virtual project
11.1 Introduction
11.2 The ProSTEP iViP Reference
Model for operational and
strategic KPIs
11.3 Conclusion
KPIs based on tools and
processes of the
reference model
Combining the
processes and tools for
operational KPIs

193
environments requires the development of new methods to manage barriers due to
distance of project teams but also due to cultural aspects (Kahn 2005). Projects with
geographically dispersed team members have emerged in order to reduce costs and the
duration of projects while still being able to control the quality and scope of the projects
accordingly (Rad 2003). The CPS and the CPM Reference Model were both developed
due to recently identified difficulties in the management of automotive projects. Both
concepts can be jointly applied for higher efficiency in project collaboration. Benefits,
advantages but also limitations and barriers were identified that need to be considered
for a sustainable and successful adoption of the concepts.
The shift of project and development responsibility towards partner companies and
temporary networked structures requires a stronger connection between information
exchange and project coordination. Shorter development cycles and higher product
complexity can only be managed by an effective cooperation with partners. The
coordination and integration of mechanics, electronics and software become
increasingly detailed and lead to a growing number of project partners with different
corporate cultures and development methods (Plischke et al., 2007). The situation has
initiated the project group “Collaborative Project Management (CPM)” of the ProSTEP
iViP association in 2005 that consisted of 15 industry partners mostly from the
automotive industry. The objective was to develop solutions for communication and
documentation of project data, and for the control of time lines and activities in
development networks.
The software implementation of the ProSTEP iViP CPM Data Exchange Model,
published as “Collaborative Project Management (CPM) – Data Exchange Model” (PSI
1-2), and its processes and tools is a prerequisite for a successful application to daily
collaborative project management. Within the CPM project group several system
vendors developed tool specific solutions to demonstrate how the processes and tools
can be integrated into existing project management software with little modifications.
The solutions were presented to different users with positive feedback. On the basis of
an application scenario, the selected users were convinced that the CPM procedure
model can improve collaboration considerably assumed it is integrated into a system
(Boy et al., 2008).
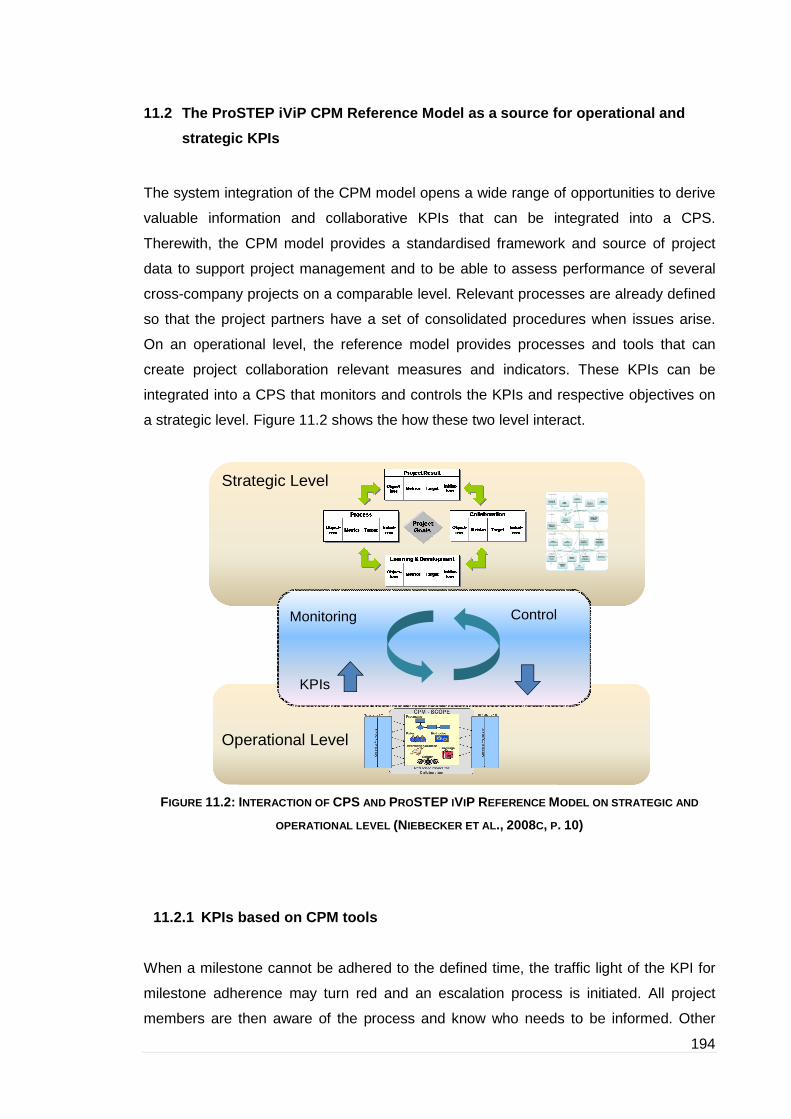
194
11.2 The ProSTEP iViP CPM Reference Model as a source for operational and
strategic KPIs
The system integration of the CPM model opens a wide range of opportunities to derive
valuable information and collaborative KPIs that can be integrated into a CPS.
Therewith, the CPM model provides a standardised framework and source of project
data to support project management and to be able to assess performance of several
cross-company projects on a comparable level. Relevant processes are already defined
so that the project partners have a set of consolidated procedures when issues arise.
On an operational level, the reference model provides processes and tools that can
create project collaboration relevant measures and indicators. These KPIs can be
integrated into a CPS that monitors and controls the KPIs and respective objectives on
a strategic level. Figure 11.2 shows the how these two level interact.
FIGURE 11.2: INTERACTION OF CPS AND PROSTEP IVIP REFERENCE MODEL ON STRATEGIC AND
OPERATIONAL LEVEL (NIEBECKER ET AL., 2008C, P. 10)
11.2.1 KPIs based on CPM tools
When a milestone cannot be adhered to the defined time, the traffic light of the KPI for
milestone adherence may turn red and an escalation process is initiated. All project
members are then aware of the process and know who needs to be informed. Other
Operational Level
Strategic Level
KPIs
Monitoring Control

195
project result relevant information, such as common milestones and synchronisation
points are included in the CPM interaction chain, and the number of points in the issue
list with red traffic lights indicates whether the synchronisation points or milestones can
be met and can, therefore, serve as an indication of the project status. Figure 11.3
indicates how possible KPIs can be created based on the CPM tools.
FIGURE 11.3: KPIS BASED ON CPM TOOLS FOR PROJECT RESULT PERSPECTIVE
A possible KPI for the project status is the number of project changes that are monitored
on the basis of the project change process. Deviations from this process indicate
whether the project partner complies with the defined processes or not. It is a KPI of the
process perspective of the CPS. A deviation is initiated by a change with a related
interaction task. The issues are a source to define corrective action for the deviations
from the CPS targets. The CPM model supports the CPS in the area of time, task, and
communication management and creates opportunities for integrating collaborative risk
management.
Project Result
Targets Metrics
Target/Actual
Compari-son
Measures
Collaboration
Targets Metrics
Target/Actual
Compari-son
Measures
Processes
Targets Metrics
Target/Actual
Compari-son
Measures
Evolution & Development
Targets Metrics
Target/Actual
Compari-son
Measures
Interaction
Chain
Issue List
CPM Tools
� Milestone deviations
� number of open points
� number of red traffic lights
in issue list

196
11.2.2 KPIs based on CPM processes
There are more than ten processes defined in the CPM reference model that can serve
as a source of the KPI for process deviations. As an example, project role changes can
have an impact on the team satisfaction and, therefore, the KPI is a leading indicator to
measure collaboration and also long-term goals, such as team trust, which can be found
in the development perspective. CPM processes have an impact on all four perspectives
of the CPS but on the process perspective in particular. Figure 11.4 shows the creation
of KPIs based on CPM processes for the process perspective.
FIGURE 11.4: CREATION OF KPIS FOR THE PROCESS PERSPECTIVE BASED ON CPM PROCESSES
Role changes may also influence the project result perspective directly as a new team
member needs time to get familiar with the project. This may be a threat for the
achievement of the next milestone.
11.2.3 Combining CPM processes and tools for operatio nal KPIs
Next to the CPM processes, the provided tools can be integrated into the scorecard as
mentioned in the previous section. The communication matrix not only assigns the
project members relevant for an escalation but also for particular project tasks. This
facilitates the definition of the responsible persons to deliver certain KPIs and also the
Project Result
Targets Metrics
Target/Actual
Compari-son
Measures
Collaboration
Targets Metrics
Target/Actual
Compari-son
Measures
Processes
Targets Metrics
Target/Actual
Compari-son
Measures
Evolution & Development
Targets Metrics
Target/Actual
Compari-son
Measures
ProSTEP iViP CPM processes
included in the Reference
Model:
Project change, role change,
escalation, etc.
KPIs based on CPM processes:
� time to respond on required handshakes
� number of open handshakes
� Etc.
CPM Processes
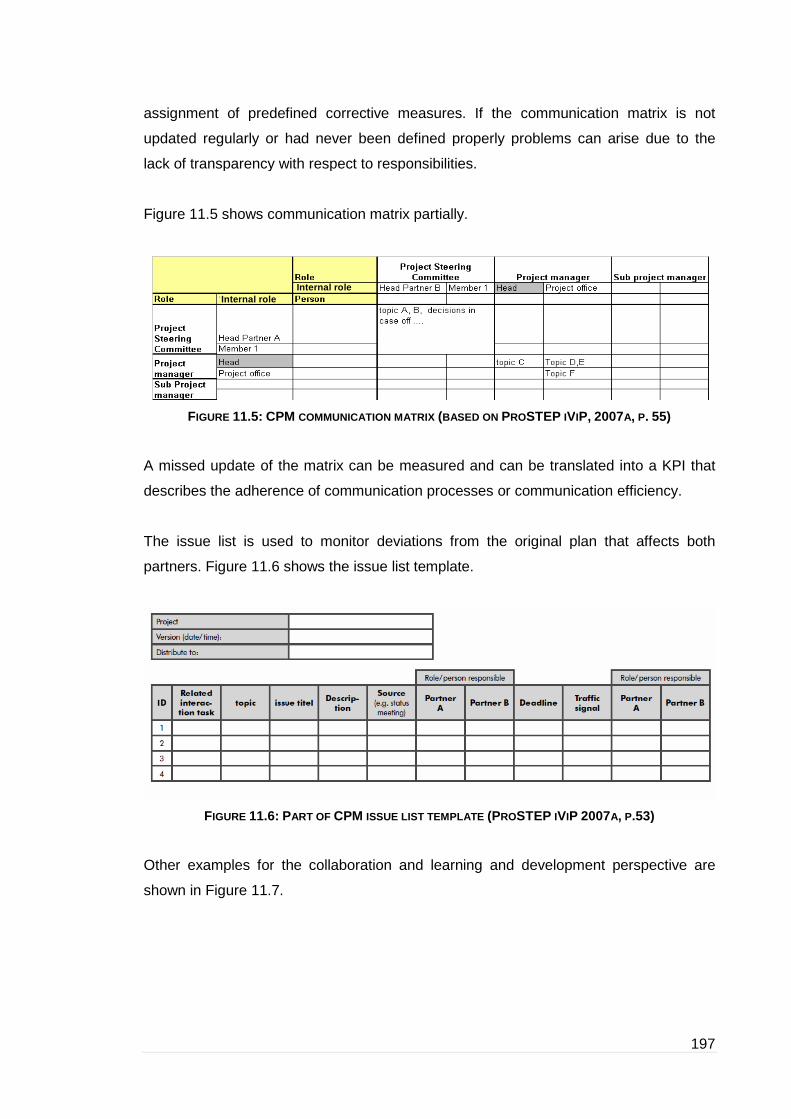
assignment of predefined corrective measures. If the communication matrix is not
updated regularly or had
lack of transparency with respect to responsibilities.
Figure 11.5 shows communication matrix partially.
FIGURE 11.5: CPM
A missed update of the matri
describes the adherence of communication processes or communication efficiency.
The issue list is used to monitor deviations from the original plan that affects both
partners. Figure 11.6 s
FIGURE 11.6: P
Other examples for the
shown in Figure 11.7.
Internal role
assignment of predefined corrective measures. If the communication matrix is not
had never been defined properly problems can arise due to the
lack of transparency with respect to responsibilities.
communication matrix partially.
CPM COMMUNICATION MATRIX (BASED ON PROSTEP IV
the matrix can be measured and can be translated into
describes the adherence of communication processes or communication efficiency.
The issue list is used to monitor deviations from the original plan that affects both
shows the issue list template.
PART OF CPM ISSUE LIST TEMPLATE (PROSTEP IVIP
Other examples for the collaboration and learning and development
Internal role
197
assignment of predefined corrective measures. If the communication matrix is not
defined properly problems can arise due to the
VIP, 2007A, P. 55)
x can be measured and can be translated into a KPI that
describes the adherence of communication processes or communication efficiency.
The issue list is used to monitor deviations from the original plan that affects both
P 2007A, P.53)
evelopment perspective are

198
FIGURE 11.7: EXAMPLES OF KPIS BASED ON CPM FOR COLLABORATION AND LEARNING &
DEVELOPMENT
11.3 Comments on the integrated approach
The identification of possible risks related to the defined corrective actions and to the
identified leading indicators is facilitated by an existing collaborative system and
predefined processes that project managers can monitor and control in real time and
with consistent and consolidated data. First results and feedback of the CPS and the
CPM model has been obtained and there is reason to belief that both concepts have
great impact on the efficiency and effectiveness of future collaborative project
management. However, the barriers and limitations need to be considered carefully and
further pilot projects are necessary to investigate the benefits and opportunities the
combined concepts can create in more detail.
The ProSTEP iViP CPM Reference Model supports the CPS in providing collaboration
relevant KPIs and standardised tools for communication, time, and task management. A
software implementation of the data model is a prerequisite for its success and a basis
to produce data that are integrated into a CPS. Both concepts have been developed
recently within the automotive industry and require further pilot projects to obtain more
knowledge about their impact on cross-company project management.
Project Result
Targets Metrics
Target/Actual
Compari-son
Measures
Collaboration
Targets Metrics
Target/Actual
Compari-son
Measures
Processes
Targets Metrics
Target/Actual
Compari-son
Measures
Evolution & Development
Targets Metrics
Target/Actual
Compari-son
Measures
Targets KPI Target Measures
Team Satisfaction
� No of role changes
� No of project changes
tbd. � Minimise role changes� Team workshops
Effective Communication
� Adherence to communication matrix
� No of escalations
Tbd. � Increase no of team meetings
� Organise social events
... � ... ... � ...
Collaboration
Targets KPI Target Measures
Team Trust � No of role changes
� No of escalations
tbd. � Minimise role changes� Team workshops
.. �.. .. �..
Project Result
Targets Metrics
Target/Actual
Compari-son
Measures
Collaboration
Targets Metrics
Target/Actual
Compari-son
Measures
Processes
Targets Metrics
Target/Actual
Compari-son
Measures
Development
Targets Metrics
Target/Actual
Compari-son
Measures
Learning & Development

199
12 Assessing performance of cross-company projects
The assessment of cross-company and collaborative projects based on a project
assessment model is fundamental to improve collaboration sustainably. Combined with
a CPS, it supports the identification of common project goals and need for action to
achieve high collaborative project performance. In the following, the CPS and a project
assessment model predicated on the Project Excellence Award of the German Project
Management Association (GPM e.V.) is described and it is demonstrated how both
concepts can be linked for an efficient project management and performance
assessment of cross-company projects. Figure 12.1 shows the structure of this chapter.
FIGURE 12.1: OVERVIEW OF CHAPTER 12
12.1 Assessment of collaborative projects based on project excellence criteria
A project performance assessment based on a maturity model supports the project
manager to improve subsequent projects by identifying need for action and by learning
from previous mistakes and a structured evaluation of problem zones. The European
Foundation for Quality Management (EFQM) developed a framework to assess an
organisation based on nine criteria, which are categorised into “enablers” (what does an
organisation) and “results” (what achieves an organisation). The developed criteria
reflect a consensus of the formerly participating companies in respect to best practices.
The framework was based on existing standards such as the Deming Price or the
Malcolm Baldrige National Quality Award (Hakes, 2007). The Project Excellence Award,
assigned by the German Project Management Association (GPM e.V.), is based on the
EFQM model and provides a benchmarking of individual projects. Strengths and
weaknesses of project teams are identified and compared to other projects so that
future project work can be improved and optimised. Structured into nine criteria and 22
sub criteria, the model assesses room for improvement to increase project quality
12.1 Assessment of
collaborative projects based on
project excellence
12.2 Comments on performance
assessment using the CPS
Mapping assessment
criteria with a
Collaborative and
Project Scorecard
Continuous
improvement of project
partnerships

200
continuously (GPM, 2008). The nine criteria are shown in Figure 12.2 and categorised
with respect to the EFQM model into project management (“enablers” – how an
organisation achieves results) and project results (“results” – what an organisation
wants to achieve), whereas innovation and learning is implemented in successive
projects based on the assessment results.
FIGURE 12.2: FRAMEWORK OF THE PROJECT EXCELLENCE MODEL (IPMA, 2008)
12.1.1 Mapping the assessment criteria and sub crit eria with the Project
Scorecard
The results of the project assessment are translated into additional project objectives
and measures, which focus on identified weaknesses to perform better in subsequent
projects. These measures are derived from the model’s criteria so that the related goals
are monitored and controlled more effectively and project performance is increased.
The integration of these goals and measures into a PSC or a CPS enables the project
manager to quickly assess the current status of his project with respect to all relevant
objectives including those contributing to project excellence. The nine criteria are
mapped with the perspectives of the scorecard and project goals categorised
accordingly. Figure 12.3 shows the mapping of the Project Excellence Model with a
Project Scorecard.
Project result
Innovation & Learning
Project management
Project
ObjectivesProcess
Leadership
People
Resources
Customer Results
People Results
Results of Other
Parties Involved
Key
Performance
and Project
Results

201
F
IGU
RE
12.3: MA
PP
ING
OF
THE
PR
OJE
CT
SC
OR
EC
AR
D P
ER
SP
EC
TIV
ES
WIT
H T
HE
PR
OJE
CT
EX
CE
LLEN
CE
MO
DE
L
Project result
Innovation & Learning
Project management
ProjectObjectives
Process
Leadership People
Resources
Customer Results
People Results
Results of Other Parties Involved
Key Performance and Project
Results
Project Result
Object-ives Metrics Target Initiat-
ives
Customer
Object-ives Metrics Target Initiat-
ives
Process
Object-ives Metrics Target Initiat-
ives
Learning & Development
Object-ives Metrics Target Initiat-
ives
ProjectGoals

202
Each scorecard perspective includes several objectives that are aligned with the Project
Excellence (PE) criteria and sub criteria. Table 12.1 includes examples of how the
Project Scorecard perspectives and objectives are mapped with the PE criteria.
PSC
Perspective
PSC Objective PSC Metrics PE Criteria PE Sub Criteria
Project Result budget
adherence
development
& production
costs
key performance
and project
results
budget
Process process
transparency
no of process
deviations
process communicate
process changes
Customer quick response
to customer
demands
response time
to change
requests
Customer
Results
support:
frequency of
contacts
Learning &
Development
employee
qualification
no of
seminars and
trainings
people continuous
learning
TABLE 12.1: MAPPING OF PSC OBJECTIVES WITH PROJECT EXCELLENCE CRITERIA
In the development stage of a PSC, the Project Excellence Model criteria can already be
considered and translated into PSC objectives and measures. This supports the project
leaders to monitor and control project excellence at an early stage and to change the
focus during the project if deviations to PE criteria occur. This consequentially leads to
higher project performance as defined by the Project Excellence Model. When a project
is completed and assessed, the identified difficulties are translated into new goals and
adopted in a modified Project Scorecard. The updated scorecard helps the project
leaders to monitor and control their weaknesses more effectively in next projects (Figure
12.4).

203
F
IGU
RE
12.4: INT
EG
RA
TIO
N O
F P
RO
JEC
T E
XC
ELLE
NC
E A
SS
ES
SM
EN
T IN
TO
A P
RO
JEC
T S
CO
RE
CA
RD
(NIE
BE
CK
ER
ET A
L., 2008B, P. 4)
Modified goals and basis to identify
monitoring focus
Integration of new goals and measures based on assessment results
Modified Project Scorecard
Project cycle Assessment
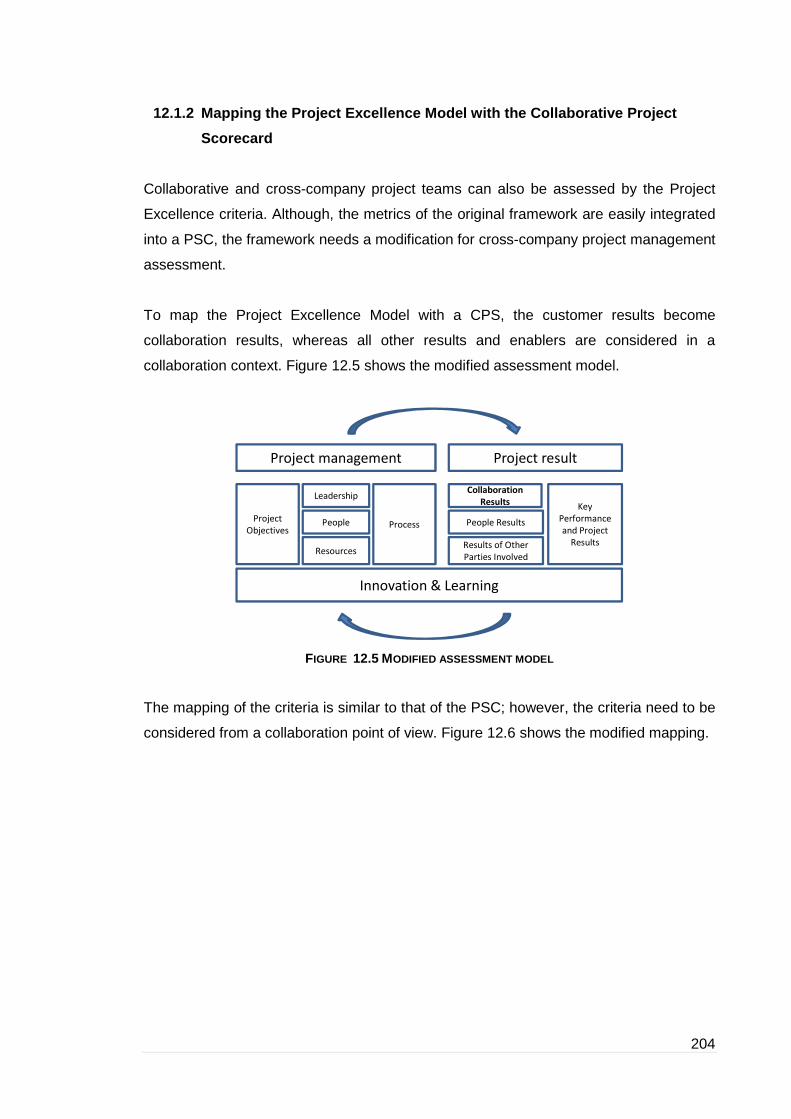
204
12.1.2 Mapping the Project Excellence Model with th e Collaborative Project
Scorecard
Collaborative and cross-company project teams can also be assessed by the Project
Excellence criteria. Although, the metrics of the original framework are easily integrated
into a PSC, the framework needs a modification for cross-company project management
assessment.
To map the Project Excellence Model with a CPS, the customer results become
collaboration results, whereas all other results and enablers are considered in a
collaboration context. Figure 12.5 shows the modified assessment model.
FIGURE 12.5 MODIFIED ASSESSMENT MODEL
The mapping of the criteria is similar to that of the PSC; however, the criteria need to be
considered from a collaboration point of view. Figure 12.6 shows the modified mapping.
Project result
Innovation & Learning
Project management
Project
ObjectivesProcess
Leadership
People
Resources
Collaboration
Results
People Results
Results of Other
Parties Involved
Key
Performance
and Project
Results
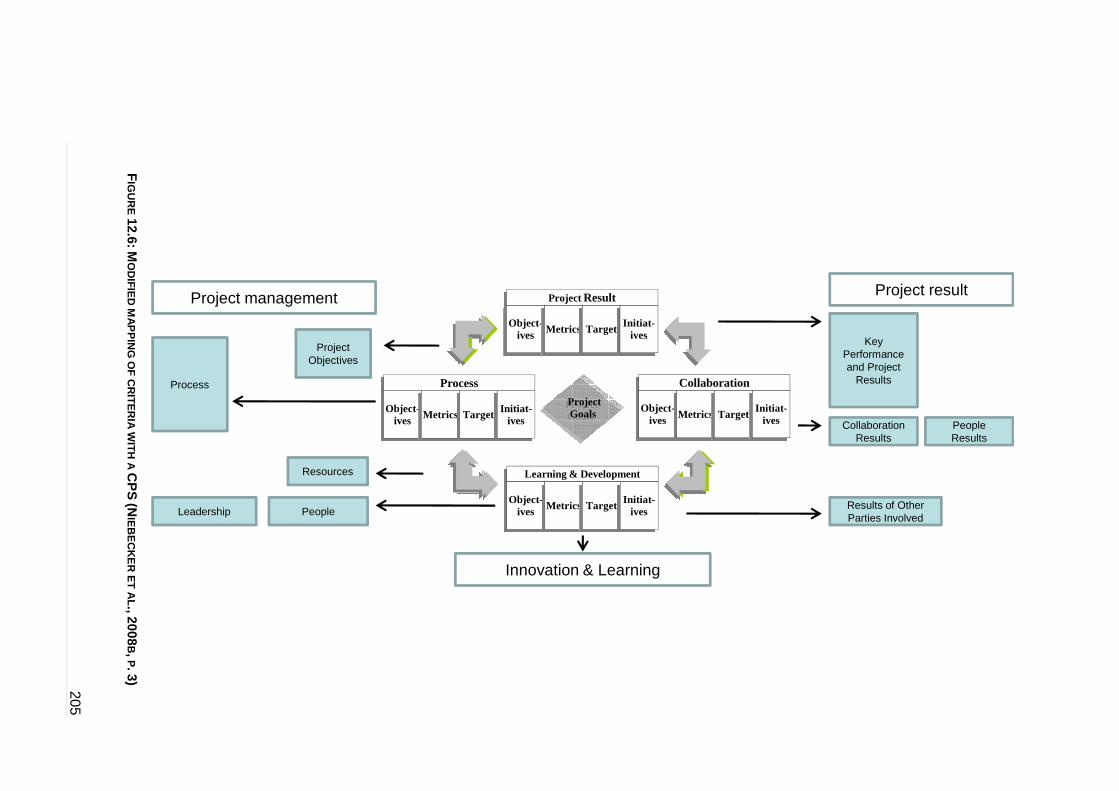
205
F
IGU
RE
12.6: MO
DIF
IED
MA
PP
ING
OF
CR
ITE
RIA
WIT
H A
CP
S (N
IEB
EC
KE
R E
T A
L., 2008B, P. 3)
Project result
Innovation & Learning
Project management
ProjectObjectives
Process
Leadership People
Resources
Collaboration Results
People Results
Results of Other Parties Involved
Key Performance and Project
Results
Project Result
Object-ives Metrics Target Initiat-
ives
Collaboration
Object-ives Metrics Target
Initiat-ives
Process
Object-ives Metrics Target Initiat-
ives
Learning & Development
Object-ives Metrics Target Initiat-
ives
ProjectGoals

206
The integration of the identified criteria into the subsequent CPS within an individual
partnership enables the project members to achieve high level of project performance
on a collaborative level assuming that the selected criteria of the Project Excellence
model lead to high project performance as well.
Figure 12.7 shows how the integrated criteria can be re-assessed for another similar
project within the same project partnership.
FIGURE 12.7: INTEGRATING COLLABORATIVE PROJECT ASSESSMENT RESULTS INTO A CPS
(NIEBECKER ET AL., 2008B, P. 5)
The Project Excellence Model already provides a fundamental framework with criteria
that are relevant to achieve high project management maturity and excellence in a
partnership. Especially, long-term partnerships are likely to profit from the assessment
results as changes and improvements can be implemented step by step. Additionally,
the assessment model can help to identify the quality of a certain project partner on a
structured and comparable level. If relevant criteria are already monitored and controlled
from the beginning of a project, the project manager can evaluate objectively whether
the project partner fulfils the necessary requirements or not. Early interaction and control
helps to avoid project failure, and early identification of certain weaknesses in project
excellence can lead to a reorientation towards possible future project partners. The
Partner A
Project #1
Project #2
Partnership 1
Partner B
Partner A Partner B
Project #n…
Integration of new objectives
and measures based on
identified weaknesses
Assessment of cross-company
project facilitated by already
integrated PE related measures

207
greatest challenge is the right choice of appropriate criteria that need to be monitored
during a project. Too many sub criteria may hinder the project manager to focus on the
main objectives and project results, whereas too few may not contribute to a great
change towards improvement.
Table 12.2 shows examples how CPS objectives are mapped with the Project
Excellence criteria in a collaboration context.
CPS
Perspective
CPS
Objective
CPS Metrics PE Criteria PE Sub Criteria
Project
Result
adherence to
SOP
milestone
adherence
key performance
and project
results
cycle times
Process process
adherence
no of
process
deviations
Process milestone control
Collaboration effective
communication
response
time to
enquiries
collaboration
Results
acceptance of
mutual
expectations
Learning &
Development
create
innovation
no of
implemented
ideas
People innovative
strategies for work
organisation and
methods to improve
operations
TABLE 12.2: MAPPING OF CPS OBJECTIVES WITH PROJECT EXCELLENCE CRITERIA
Collaboration has been identified as a key driver of business performance and impacts
several drivers of performance variably. A collaboration index that measures how
collaborative an organisation is has been developed for a research study and includes
the components “collaboration capability” and “collaboration quality”. The study
demonstrated that the collaboration index contributes 36% to a business’ performance
(Frost and Sullivan, 2008). An extension of the PE Model to assess performance of
collaboration objectives can be based on the collaboration index used in this study.
Collaboration capability such as technological aspects and culture of openness, and
collaboration quality that describes the nature and extent of collaboration as well as how
effectively the capabilities are applied, are relevant dimensions of collaborative project
management. Recent studies demonstrate that collaboration is becoming increasingly
important to a company’s success. A commonly defined and recognised standard to

208
assess cross-company projects and collaboration appears to be necessary to evaluate
performance and identify own and mutual weaknesses. The integration of relevant
collaboration criteria identified by the industry and recent studies to an existing model
that already provides a profound set of project management assessment criteria should
be the next step to collaborative success.
12.2 Remarks on CPS performance assessment
Performance assessment of cross-company projects is fundamental to identify strengths
and weaknesses in a partnership and the early integration of criteria that support the
achievement of high project management maturity levels is a prerequisite to monitor and
control cross-company projects effectively.
Clearly and commonly defined long and short-term goals measured by a balanced
choice of leading and lagging indicators as well as hard and soft facts are the key to a
sustainable project partnership. The Collaborative Project Scorecard is a new concept
that helps the project manager to clarify and define common project goals in advance,
and supports the agreement on common metrics and corrective action when problems
occur. To ensure that the right goals to achieve high project performance are targeted, a
standardised assessment model based on the Project Excellence Model provides
relevant criteria and sub criteria to assess how efficient and effective project
management is carried out and helps the team to identify their own performance status
at an early stage. This chapter demonstrated how the Collaborative Project Scorecard is
combined with a modified Project Excellence Model. To obtain optimal results in project
performance, the interactive application of both concepts requires a project partnership
with successive projects and the monitoring and control of long-term goals with
commonly agreed measures.
The CPS with integrated Project Excellence criteria enables the project manager to
focus on the project goals including excellence related goals more effectively and
ensures the alignment of these goals with business strategies. The assessment at the
end of each project is fundamental to compare several project partners objectively and
facilitates a transparent implementation of initiatives for improvements. Therefore, not
only collaboration can be assessed but also internal weaknesses or those of the
partner. Collaboration capability may be one of the dimensions that need a greater
focus. With this in mind, the assessment of supplier performance and the identification

209
of the best strategic partners are other options accomplishable with the combined
concepts. However, the selection of appropriate criteria applicable to a partnership and
the correct mapping with the CPS objectives is an effort that should not be neglected.
Careful selection and consequent monitoring is a key to success for all project partners.
Taking into account that there is no industry wide standard to assess cross-company
projects, it is recommended to start an interdisciplinary discussion about the
development of an assessment standard to achieve higher project performance for all
project partners and to facilitate the introduction and application of a measure based
scorecard such as the CPS that improves communication and goal definition.

210
13 Collaborative project risk management with a Collab orative
Project Scorecard
Uncertainty and unpredictability in project management has caused delays and high
costs in a high number of projects due to an insufficient consideration of risk
management. The monitoring and control of possible and known project risks lead to the
development of methods and processes to minimise project failures and to develop
strategies to avoid costly measures for risk prevention. Risks are not only considered as
threats but also as opportunities that can have a positive effect on project results
(Jaafari, 2001). This chapter illustrates how the Collaborative Project Scorecard can
support an integrated approach to risk management in project partnerships. The chapter
begins with an introduction to general project risk management and with a focus on the
automotive industry in the second section. This is followed by an analysis of the
Balanced Scorecard and Project Scorecard approach to risk. The structure of this
chapter is shown in (Figure 13.1).
FIGURE 13.1: OVERVIEW OF CHAPTER 13
Finally, the application of CPS concept is discussed and a possible approach illustrated.
13.1 Introduction to project risk
management
13.2 Project risk management in
the automotive industry
13.3 Balanced Scorecard
approach to risk
13.4 Risk management with
project scorecards
13.5 Collaborative project risk
management with a CPS

211
13.1 Introduction to project risk management
Project risk management has become a fundamental discipline in most of the industry
sectors worldwide. Especially, the IT industry experienced the impact of risks on their
projects where only 28% of all software development projects were rated as successful
according to a report of the Standish Group in 2004. Typically, IT project risks have an
impact on costs, time, and performance of a project, and a list of 92 risk factors has
been identified and ranked according to their severeness (Tesch et al., 2007). With
respect to project performance, the six dimensions of software project risks are
organisational environmental risk, user risk, requirements risk, project complexity risk,
planning and control risk, and team risk (Wallace et al., 2004). Another example is the
construction industry where high risk exposure due to a rapidly changing environment
strongly influences the profitability of construction projects. Results are schedule delays
and cost overruns that could have been avoided with an integrated risk management
and an early risk identification and assessment (Zayed et al., 2008).
A survey with 50 project managers revealed that 85% of their projects had an integrated
risk management and most of the participants were unhappy about the insufficient
application of risk management in their projects. Seventy percent of the identified risks
are discussed in a status meeting but only 45% of those risks are communicated to
other project members. As a result only 5% of the project managers have considered
risk management in their budgets (Volland, 2006). Therefore, risk management needs to
have more attention and the development of new methods and processes requires a
consequent application. Whereas, the identification of risks is the first step, a realistic
forecasting of project costs, demand and other impacts is also important and was
identified as a major source of risks. Bent Flyvbjerg observed that there have been no
improvements in forecasting accuracy and analysed the potentials and barriers of a new
method that uses reference class forecasting (Flyvbjerg, 2006).
13.2 Project risk management in the automotive indu stry
Automotive projects are typically characterised by high risk exposure due to a high
number of parallel processes in the supply chain and product development. Recently
the likelihood of those risks has been further increased due to a growing complexity of
the supply chain and the development partner network.

212
The high demand for innovations to stay competitive has caused the production of
immature products and a high number of product recalls (Hab and Wagner, 2006).
Typical risks in the automotive industry are:
• Economical risks (currency risks, bankruptcy of suppliers, credit worthiness of
customers, transport risks).
• Technical risks (new tools, immature technical components, process instability).
• Interpersonal risks (employees are not qualified, team conflicts).
• Milestone/Time risks (milestones not achieved, late SOP).
• Socio-cultural risks (moral concept, cultural conflicts).
• Act of nature beyond control (flooding, thunderstorm, strike, terror).
• Political risks (impact of interest groups, import restrictions, new laws and
regulations).
In the policy towards risk the top management defines the fundamental view of a
company’s risk philosophy. It includes the structure of the philosophy, the principal
readiness to assume risk with respect to the business objectives, the quantification of
risk related objectives, and the documentation in a risk management handbook. In
general, risk management in the automotive industry consists of a risk analysis, risk
measures, and control of success. The risk analysis is structured into risk identification
(identification of possible risks, consequences of risks, risk causes) and risk evaluation
(incidence rate, measure of damages), whereas risk measures include risk avoidance,
risk mitigation, risk transfer, and risk acceptance. Control of success is defined by a
continuous monitoring of risk measures, comparison to policy towards risk objectives,
and transparency of risk costs. The risk management process supports the
identification, evaluation and avoidance of risks, wherein preventive measures are
highly relevant for a project’s success.
The foundation of the risk process is the risk analysis that evaluates technical,
commercial, and organisational risks with respect to probability and impact on costs and
deadlines. The checklists for a systematic identification of risks include the product
structure, project structure, and milestone plans.

213
The identified risks and measures may then have an impact on project organisation, as
wells as the cost, milestone, and activity planning and are shown in Figure 13.2
(Schuh, 2000).
FIGURE 13.2: RISK MANAGEMENT PROCESS IN THE AUTOMOTIVE INDUSTRY (SCHUH, 2000, P. 181).
For an analysis of technical risks in the product development phase of a project, the
Failure Mode and Effect Analysis (FMEA) is the most common and accepted method.
The process FMEA of production processes has been further developed to a
development FMEA that describes the whole vehicle development process and extends
the traditional project risk management with vehicle development specific aspects
(Figure 13.3).
FIGURE 13.3: DEVELOPMENT PROCESS FMEA AS AN EXTENSION TO TRADITIONAL PROCESS FMEA
Risk identification
Risk analysis
Risk measures
Project structure plan
Product structure plan
Milestoneplan
Project organisation
Costplanning
Activity planning
Processstructuring
Risk analysis & evaluation
Measure toMinimise risks
Structuring of development process:
�Integration to process landscape
�Tasks, dependencies, interfaces
�Quality gates
�…
Identification of incidents:
�Performance loss
�Technology change
�Loss of supplier
�…
Definition of measures for risk mitigation:
�Preventive
�Reactive (fall back strategies)
�…

214
There is a variety of different methods applied during the risk management process. The
execution of risk management is supported by risk check lists that include also project
phase related risk aspects. Already in the offer phase, a project manager needs to
analyse possible risks and evaluate probability and impact. These two criteria allow the
manager to categorise risks into three types: A (high), B (moderate), and C (low) risks.
Another method, for example, is the Strengths, Weaknesses, Opportunities, and Threats
(SWOT) analysis (Hill, 1997). Whereas, the SWOT analysis usually supports strategic
decisions, it can also help to improve a project during the life cycle by identifying implied
chances and opportunities of risks that may higher the performance of project results.
The early definition and agreement of requirements has a great impact on risks during a
project. Unfortunately, requirements with project partners and suppliers are often
defined very late or not all. This may appear beneficial to a manufacturer in the
beginning as requirements change can be done without costly change requests but
typically the planning quality and development quality decrease due to a limited time to
implement changes at later stages of the project (Bullinger et al., 2003). Next to higher
costs and time it also increases potential risks and strains the relationship of the project
partners. An early agreement of requirement specifications in a tender document
reduces the change effort during the product development phase. However, in addition
to an early defined requirements specification, the definition of commonly agreed project
goals is essential to avoid conflicts and inefficiency during the project.
Strategic and operational goals need to be translated into measurable goals that enable
the project manager to evaluate the status and to take necessary measures. Due to the
complexity of vehicle projects, the technical goals and requirements are structured into
product components and functions, often supported by the Quality Function Deployment
(QFD) method that determines the project goals in a two stage process: the goal
identification and the goal agreement process (Akao, 2004). The QFD translates
consumer requirements into company requirements at each project stage. During the
goal identification process, the “House of Quality” can be applied to relate customer
requirements with product specification (technical) and market requirements
(comparison of competition). On the basis of lists, tables and matrixes, the project goal
catalogue is created and translated into technical requirements during the goal
agreement process. This catalogue can then be used to do a FMEA for a more detailed
analysis.

215
13.3 A Balanced Scorecard approach to risk
The improvement of forecasting methods and risk processes needs greater attention;
however, their company-wide and consequent application is a prerequisite for a
sustainable success. To implement business strategies, the Balanced Scorecard (BSC)
has been demonstrated as an effective and efficient method since its development in
the 1990s (Kaplan et al., 2004). A balanced choice of indicators that indicate a future
development (leading) and those that are based on past results (lagging) together with
financial and non-financial measures provides a fundamental framework for a short- and
long-term goal achievement. Additionally, strategy maps increase the transparency of a
business by visualising cause-and-effect relationships of the strategic goals. Since the
introduction of the Balanced Scorecard, its application has been extended to various
disciplines and purposes. An example is the Sustainability Balanced Scorecard that
translates the sustainability visions and strategies into action and integrates
environmental and social aspects into the core management of companies (Bieker,
2002). The integration of risk management into a BSC for a value orientated control
system demonstrated the improvement of efficiency, quality and acceptance of both
systems, the control and risk management system. When KPIs and corrective actions
are defined for a BSC, managers already discuss the possible causes that may impact
future plans. As a result, leading indicators and risks for the risk management system
are already identified (Gleissner, 2002). The BSC concept has been applied to project
management and demonstrated that performance of project teams can be improved
(Norrie et al., 2004).
13.4 Risk management with a Project Scorecard
Due to globalisation and an increasing competition on the international market, project
management experiences a change towards a complex network of project partners
where project teams are geographically dispersed and cross-company projects become
more relevant for achieving better performance, saving project costs and time. Next to
these benefits, there are a number of difficulties project managers have to face when
they manage projects in such collaboration networks. Barriers of communication, low
transparency of project structures, and an ambiguous understanding of project goals are
some of the problems that need to be solved. Especially, the management of
collaborative risks and the establishment of commonly defined risk processes are
essential and have not been addressed sufficiently until today. The integration of project
216
risk management into a Project Scorecard and a Collaborative Project Scorecard has
similar benefits as already identified by Gleissner’s (2002) combined risk management
and BSC concept. On the basis of the automotive industry, this section illustrates how
project risk management can be integrated into a CPS and it demonstrates how
collaborative projects risks can be mitigated by a more effective and efficient monitoring
and control, a consequent risk management application, and the early identification and
assessment of possible risks.
13.5 Collaborative project risk management with a CPS
Planning, monitoring and control of project risks have not been considered sufficiently in
cross-company projects. This is mainly because the number of partnerships and
complexity of networks have increased steadily without an appropriate adaptation of
project management methods and processes. Today, many project managers know that
project risk management is not considered sufficiently when they begin a project with
one of their partners. A reason, for example, is that they do not know what methods to
apply or how to integrate collaborative project risk management into their existing
process landscape. When implementing a Collaborative Project Scorecard, possible
risks are already considered in the planning and concept phase of a project. Risks are
formulated into measurable indicators that may impact a certain project goal, and with
leading and lagging indicators, the future development of a risk or opportunity can be
analysed and evaluated. Corrective action is already defined for each measure, and
with the help of predefined quality gates, the impact on project progress can be
evaluated at an early stage of a project. Figure 13.4 illustrates the concept of CPS risk
management.

217
FIGURE 13.4: RISK MANAGEMENT WITH A COLLABORATIVE PROJECT SCORECARD
Collaborative risk management can be incorporated within the scale of the CPS
methodology. The framework of each perspective needs an extension of risk
management categories. The analysis of risk before any measures are taken is
essential for the identification and evaluation of preventive and corrective counter
measures. The identification of risk that may still occur after the execution of counter
measures is part of the counter measure evaluation procedure. An optional “lessons
learned” category may be useful for future projects and similar risk events. The risks the
project teams are aware of increase during the risk identification process. After defining
preventive risk counter measures the risks may become less effective on the project
team’s awareness. However, when some preventive counter measures do not minimise
the risks the corrective counter measures have to be taken to minimise the risks.
Nevertheless, there are usually always risks that cannot be controlled. Figure 13.5
shows a systematic relation between awareness of risk occurrences and the CPS risk
management procedure.
Risk identification
Risk analysis
Risk measures
Risk identification
Risk analysis
Risk measuresRisk
identificationRisk
analysisRisk
measures
Translate into measurable indicator and define measures
Monitor and analyse risks
Execute measures
…

218
FIGURE 13.5: RISK OCCURRENCE AND CPS RISK MANAGEMENT PROCEDURE
Preventive counter measures can only be defined if the project members are aware of
the related risks. Some risks may occur without any early indication and counter
measure need to be identified, evaluated, and commonly agreed during the risk
occurrence. The following figure shows how the CPS framework can be extended with
the additional risk management categories (Figure 13.6).
FIGURE 13.6: CPS RISK MANAGEMENT CATEGORY EXTENSION
The costs for preventive and corrective counter measures are relevant for the evaluation
process. Some risk measures may cost more than the financial loss of the related risk.
Risk identification(before counter measures)
Preventive
counter
measures
Awareness of risk
occurrences
time
Corrective
counter
measures
Risk after
counter
measures
Probability of risk
occurrences
Probability of further
risk occurrences
Real risks
Risks team are aware of
Continuous risk identification
Unexpected risk
occurrence
Learning and Development
Goal KPI
Actual
/
Target
Counter Measures
Risks
before
Measure
Preventive
Measures
Corrective
Measures
Risk after
Measures
Costs for
Measures
Costs for
Measures
Lessons
Learned
Collaboration
Goal KPI
Actual
/
Target
Counter Measures
Risks
before
Measure
Preventive
Measures
Corrective
Measures
Risk after
Measures
Costs for
Measures
Costs for
Measures
Lessons
Learned
Processes
Goal KPI
Actual
/
Target
Counter Measures
Risks
before
Measure
Preventive
Measures
Corrective
Measures
Risk after
Measures
Costs for
Measures
Costs for
Measures
Lessons
Learned
Project Results
Goal KPI
Actual
/
Target
Counter Measures
Risks
before
Measure
Preventive
Measures
Corrective
Measures
Risk after
Measures
Costs for
Measures
Costs for
Measures
Lessons
Learned
Risk Management Extension
Project Results
Goal KPI
Actual
/
Target
Counter Measures
Risks before
measure
Preventive measures
Corrective measures
Risk after measures
Costs for measures
Costs for measures
Lessons learned
Costs for risks
Costs for risks

219
Additionally, not every preventive measure can eliminate the risk completely but limit
and reduce the probability of its occurrence. The experience with implemented
preventive and corrective measures regarding effectiveness and (cost) efficiency should
be documented in the “lessons learned” category of the CPS. This enables the
continuous improvement of the combined risk and measure management approach.
Whenever certain internal risks of a project partner organisation have influence on the
other partner’s business and project it should be included in the CPS to create
transparency at the interfaces and to create reliability, accountability but also trust on
both sides.

220
14 Conclusion
Cross-company project management has become a vital discipline for success in the
automotive industry as an increasing number of project partners and project
partnerships are necessary to decrease development and production costs, increase
quality, and shorten product life-cycles. However, the quick move towards project
partnerships has also caused difficulties as traditional project management methods
haven’t had a sufficient focus on a cross-company or collaborative application. This
chapter is a conclusion about this research project and begins with a summary of the
identified difficulties in automotive collaborative project management. In a next step, the
Balanced Scorecard approach to project management is evaluated and illustrated why
the Collaborative Project Scorecard was chosen as a main element of the concept. This
is followed by a conclusion of the research steps (see also Figure 5.6) and results from
workshops, surveys, interviews and the pilot project in the USA. The concept extensions
as illustrated in Figure 5.10 are then discussed and final remarks and recommendation
on future research can be found in the last section (Figure 14.1).
FIGURE 14.1: STRUCTURE OF CHAPTER 14
14.1 Difficulties in automotive collaborative projec t management
Project failure due to unclear requirements, project goals, and communication problems
have become some of the greatest problems in the automotive industry. Deficient
14.1 Difficulties in automotive
collaborative project
management
14.2 Balanced Scorecard
approach to project
management
14.3 Research steps towards the
research objectives
14.4 Final remarks and
recommendation
Workshops, surveys,
interviews, pilot project,
concept extensions

221
management is also one of the reasons that caused an increased number of product
recalls in the last years. The growing number of project partners has also lead to lower
transparency in the project organisations due to higher complexity in the project
structures. This also impedes the integration of relevant stakeholders as well as the
status measurement of a project. The process of finding common goals and a mutual
understanding of the partners’ objectives has become more difficult and often ends in an
ambiguous definition of project objectives. A lack of collaborative risk management and
predefined corrective and preventive measures and corrective action together with
problems in communication are some of the main reasons for projects to fail. The
demand for new concepts that improve these deficiencies in a collaborative and cross-
company project environment was the reason to develop a concept based on the
Balanced Scorecard. The framework has already been successful when applied to
business and single project management, and therefore, it was promising enough to
begin deeper research into its cross-company application.
14.2 The Balanced Scorecard approach to collaborativ e project management
The Balanced Scorecard developed by Kaplan and Norton has had widespread
acceptance through their set of books and papers. The BSC has already been used in
project management applications by Wendy Stewart (2001), Stewart and
Mohammed (2001), Stewart (2007), Derek Walker and James Norrie (2004), and
Norrie (2006). The extension to their work is the collaborative and cross-company
approach of the BSC concept, the Collaborative Project Scorecard. The CPS is a new
method to monitor and control cross-company projects by aligning collaborative project
objectives with the project portfolio and business strategies of each company. The
application of an impact matrix to identify the key measures and how they are related is
one of the contributions to the traditional concept that facilitates the development of a
project and collaborative project strategy map.
14.3 Steps towards an achievement of the research o bjectives
The core difficulties were identified with a combined approach of a literature review and
additional interviews with project managers (see also Figure 5.7) from an OEM and
project members of the ProSTEP iViP Collaborative Project Management project. The
research project took mainly place at an OEM site in Germany and the US. The initial
222
idea of applying a Balanced Scorecard to a cross-company project environment was
followed by two workshops of the German Project Management association Automotive
Chapter. Within the scope of these two workshops the CPS concept was applied
specifically to automotive projects and the feedback of 30 senior project managers was
integrated. Their feedback was a valuable contribution to the concept as their
experience of approximately 10 years in project management helped to identify relevant
key performance indicators and project objectives, as well as the relevant requirements,
benefits, and limitations. Results can be found in section 8.2.
14.3.1 Initial workshop results
According to the appraisal of the workshop participants (see also section 8.2.1 and
8.2.2), the one-off effort to implement a CPS may be outweighed by measurable targets
with higher controllability, improved monitoring and control of project status,
performance and maturity, improved communication and transparency between the
project teams, and an increased integration of stakeholders. An online survey and
feedback from the two workshops mainly contributed to the detailed development of the
concept including a procedure model that describes how to introduce the CPS to an
organisation. Typical automotive project objectives and measures as well as advantages
and limitations of the concept were identified. As a main result the participants were
convinced that the CPS supports a project manager to increase transparency, monitor
and control the proper objectives, and integrates all relevant stakeholders. However, an
IT implementation is necessary for an efficient and effective application.
14.3.2 Evaluation by applying to a vehicle project
After the CPS concept was developed it was evaluated by an application to a pilot
project. Further concept development and evaluation took place in South Carolina USA
in a cross-company project between the OEM and a major supplier to develop and
manufacture a wire harness of a chosen vehicle (production launch in 2010). The result
was the development of a Strategic Collaborative Scorecard and two Collaborative
Project Scorecards for the launch and change management project phase. Several
interviews and individual workshops at the OEM’s and supplier’s site were followed by a
joint workshop to identify common project goals, measures, corrective action and a
Collaborative Project Strategy Map. Some of the results were that the CPS reinforced
the needs and expectations of both companies, it opened up opportunities for

223
collaboration improvements and it created an alignment of the whole team to the agreed
common goals. On the other hand, concerns about integration into existing reporting
systems came up, and it was sometimes difficult to find KPIs for what they do.
In addition, it was also difficult to translate soft facts in measurable hard facts and the
OEM will have to train its suppliers to use and maintain the new system. The results of
the pilot project were implemented in a tool using Microsoft Performance Point Server
2007. The application of an IT implementation was rated as beneficial for the users and
KPI reporting responsible, however it is essential that the solution does not create
overhead work and does not duplicate existing reporting and monitoring systems. A high
effort to create the system and to incorporate KPIs was estimated in the beginning but
once typical KPIs are defined they can be carried over to other projects with their
specific values. Other advantages were the capability of workflow management and the
visualisation of strategy maps.
14.3.3 Concept extensions
The CPS concept was then extended (as shown in Figure 5.10) by an integration of a
collaborative project management reference model to create operational KPIs, and a
performance assessment model that enables the project manager to evaluate
performance of a cross-company project by integrating relevant criteria into a CPS. The
integration of a CPS with collaborative project management processes supports the
project manager to standardise relevant project tasks and to create operational KPIs
that can be strategically controlled by a CPS. The integration of leading indicators
enables a collaborative and preventive risk management so that problems can be
solved before they occur. The ProSTEP iViP CPM Reference Model supports the CPS
in providing collaboration relevant KPIs and standardised tools for communication, time,
and task management. Performance assessment of cross-company projects is
fundamental to identify strengths and weaknesses in a partnership and the early
integration of criteria that support the achievement of high project management
performance levels is a prerequisite to monitor and control cross-company projects
effectively and efficiently. To ensure that the right goals to achieve high project
performance are targeted, a standardised assessment model based on the Project
Excellence Model provides relevant criteria and sub criteria to assess how efficient and
effective project management is carried out. To obtain optimal results in project
performance, the interactive application of both concepts requires a project partnership

224
with successive projects and the monitoring and control of long-term goals with
commonly agreed measures. However, the selection of appropriate criteria applicable to
a partnership and the correct mapping with the CPS objectives is an effort that should
not be neglected. Careful selection and consequent monitoring is a key to success for
all project partners.
Finally, the CPS concept was extended by a risk management framework. The analysis
of risk before project start is essential for the identification and evaluation of preventive
and corrective counter measures. The identification of risk that may still occur after the
execution of counter measures is part of the counter measure evaluation procedure. It is
important to include risks in the scorecard to continuously monitor and control them
accordingly. However, risk management of technical risks should not be included in a
project management scorecard; therefore, a technical risk analysis such as FMEA is still
required.
14.4 Final remarks and recommendation on future res earch
The application of a CPS to other project phases such as series development is
necessary to evaluate the concept’s ability for all project phases of an automotive
project. As the CPS concept is scalable and adaptable it should also be considered to
be applied to other industry sectors as it promises improvement wherever cross-
company or collaborative project teams are involved. This also includes its application to
inter-departmental projects or projects between two OEMs or two suppliers. When more
than two partners are involved it is recommended to focus on one-to-one relationships
to maintain transparency and to be able to clearly assign KPI reporting responsibilities.
The selection of the right objectives and KPIs is one of the most difficult parts when
developing a CPS as only a focus on the most relevant objectives will help to achieve
the desired project goals efficiently. To achieve these objectives the right measures
need to be chosen that enable the project manager to monitor and control a certain
objective holistically and not only an aspect of it. The choice of these KPIs and
objectives can become a competitive advantage of a project partnership. Although, the
concept can be applied to any type of project it should be decided carefully when it is
beneficial to a project partnership. Larger and more complex projects may benefit more
from an increased transparency than less complex ones where transparency cannot be
increased significantly. Finally, the alignment with and connection to existing project
portfolio management is an important step to increase the concept’s effectiveness to

225
overall business performance. A continuous reporting structure from the project to
portfolio and business level is feasible and enables the organisation to implement its
strategy with fewer limitations due to an improved strategic and operational alignment.

226
15 Appendix A
15.1 Capability maturity model integration
The Capability Maturity Model Integration (CMMI) is a model for improving and
appraising the performance of development organisations by providing organisations
with the essential elements of effective processes. It is an improvement of CMM, which
was originally commissioned by the American Department of Defence to qualify
software vendors’ capabilities. Today, it is a method to guide process improvement
initiatives, not only for software development but also for many related fields such as
systems engineering, product acquisition, team management, research and
development. Five levels of organisational maturity are defined, whereas each level
represents a coherent set of best practices that organisations are expected to
implement to achieve continuous improvement. Each maturity level is concerned with
process areas (PA), which can be considered as detailed checklists describing the
goals, activities, and the artefacts created and maintained to satisfy the requirements for
a specific part of the overall development process. There are 25 process areas that are
categorised into each maturity level (Chrissis et al., 2006) listed in Figure 15.1.
FIGURE 15.1: CMMI PROCESS AREAS AND MATURITY LEVELS
Appraisals of organisations using the CMMI model must conform to the requirements
defined in the Appraisal Requirements for CMMI (ARC) document. Appraisals focus on
Maturity Level 1: No specific process area for this level
Maturity Level 2: Requirements Management, ProjectPlanning, Project Monitoring and Control, SupplierAgreement Management, Measurements andAnalysis, Process and Product Quality Assurance,Configuration Management
Maturity Level 3: Requirements Development,Technical Solution, Verification, Validation, ProductIntegration, Organizational Process Focus,Organizational Process Definition, OrganizationalTraining, Integrated Project Management for IPPD,Integrated Supplier Management, Risk Management,Decision Analysis and Resolution, IntegratedTeaming, Organizational Environment for Integration
Maturity Level 4: Quantitative Project Management,Organizational Process Performance
Maturity Level 5: Causal Analysis and Resolution,Organizational Innovation and Deployment
227
identifying improvement opportunities and comparing the organisation’s processes to
CMMI best practices. Appraisal teams use a CMMI model and ARC-conformant
appraisal method to guide their evaluation of the organisation and their reporting of
conclusions. The appraisal results are used (e.g., by a process group) to plan
improvements for the organisation. There are three different classes of appraisals, class
A, B, and C. All CMMI models contain multiple process areas with one to four goals.
They are called specific goals and practices, as they describe activities that are specific
to a single process area. An additional set of goals and practices applies across all of
the process areas; this set is called generic goals and practice (Goldenson and
Gibson, 2003).
15.2 Projects in controlled environments (Prince2)
Prince 2 (Projects in Controlled Environments) is a widely used project management
method that navigates a project manager through all the essentials for running a
successful project. Prince2 is a process based approach to project management and
capable of tailoring and scaling to suit specific projects types and sizes. In this
methodology, each process is completed and defined with its inputs and outputs, as are
the specific objectives that have to be achieved and the activities that are to be carried
out. Prince2 results from the previous Prince method, which was originally developed in
1989 by the Central Computer and Telecommunications Agency (CCTA) as a standard
for Information Technology (IT) project management in the UK. Prince2 was released in
1996 as a basic project management methodology and then has become increasingly
accepted by many organisations worldwide (OGC, 2005). The characteristics of Prince2
are that it has a focus on business validation, classifies organisation structure with
respect to the project management team, it is a product-based planning approach, it has
an emphasis on dividing the project into manageable and controllable stages, has
flexibility to be applied at a level appropriate to the project, and can be tailored and is
generic and simple to follow.
Prince2 is a structured approach to project management. It provides a method for
managing projects within a clearly defined framework. It describes procedures to
coordinate people and activities in a project, how to design and supervise the project,
and what to do if the project has to be adjusted if it doesn’t develop as planned. Each
process is specified with its key inputs and outputs and with specific goals and activities

228
to be carried out, which gives an automatic control of any deviations from the plan.
Divided into manageable stages, the method enables an efficient control of resources.
On the basis of close monitoring the project can be carried out in a controlled and
organised way. Being a structured methodology widely recognised and understood
Prince2 provides a common language for all participants in the project. The various
roles and responsibilities involved in a project are fully described and are adaptable to
suit the complexity of the project and skills of the organisation. Prince2 is a process
driven project management method and advocates product based planning which
means that the first task when planning is to identify and analyse products. Once the
activities required to create these products are identified then it is possible to estimate
the effort required for each and then schedule activities into a plan. Prince2 may be
considered as inappropriate for small projects, due to the work required in creating and
maintaining documents, logs and lists. This is often a misunderstanding of the scalability
that Prince2 offers because of the various roles and responsibilities involved
(OGC, 2005).
15.3 The V-Modell XT
“The V-Modell is a process model for planning and executing projects. The V-Modell
improves project transparency, project management and the probability of success by
defining concrete practices with associated results and responsible Roles. The V-Modell
XT is a further development of the V-Modell 97” (V-Modell, 2007, p. 1-4).
The V-Modell XT is a process model (“V” stands for the German word
“Vorgehensmodell”), and “XT” stands for extended tailoring and means that the
methodology is usable to handle projects of all kinds and sizes (Birowicz, 2005). The V-
Modell XT focuses on “who” has to do it, “what” has to be done, “when” it needs to be
done, “how” it has to be done, and “using what” to do it. There are three different types
of projects according to the V-Modell XT:
• The customer project starts with the project proposal that initiates the project,
and then defines the requirements and the tender process to find a supplier for
the required solution (V-Modell XT, 2007, pp. 3-17 – 3-19).
• The supplier project is initiated by evaluating the tender documents that support
with the customer's bidding process and the decision to submit a bid (V-Modell
229
XT, 2007, pp. 3-19 – 3-21).
• The organisation specific V-Modell project shortens the process of tailoring for
future projects by adjusting the V-Modell XT to that specific organisation's needs
(V-Modell XT, 2007, pp. 3-21 - 3-23).
A baseline set of system requirements then supports system design. The hardware and
software are implemented at the bottom of the “V”, and the components of the system
are then integrated and verified in iterative fashion on the right. Ultimately, the
completed system is validated to measure how well it meets the user’s needs. Thus time
proceeds from left to right in the V-Modell. The “V” diagram is punctuated by a series of
major milestones where the output of the previous step is reviewed and the customer
and project team determine whether the project is ready to move to the next step in the
process. The project moves forward only if the criteria for the decision point have been
satisfied
15.4 International Organisation for Standardization (ISO)
There are numerous standards of physical products, consortium and single firms and all
of them produced by International Organisation for Standardization (Seaver, 2001). The
International Organisation for Standardization (ISO) is a worldwide set of collected
standard organisations from 157 different countries. In addition, ISO can be seen as a
non-governmental organisation which has created a connection between the public and
is more authoritative rather than other non-governmental organisation due to its
capability to arranging standards that mostly become important rules either through
agreements or national standards.
15.4.1 ISO 9000 family
One of the main responsibilities of ISO is the improvement of the 9000 standard series
which is directed to integrate the quality perspective into business routine (Guinee,
2002). The ISO 9000: 2000 approaches the systems of management, which is used by
organisation to create, assemble, distribute and support the productions of all general
product divisions such as hardware, software and services. The ISO standards supply
quality management conduction, quality guarantee need or contributing technology for
management system of an organisation (Seaver, 2001).

230
15.4.1.1 ISO 9001
A reconsideration of the 1987 standard is ISO 9001:1994. This prepares direction to
quality management and quality certainty for all fields and industries. ISO 9001:1994
demands corporations to prove and apply their operations for objective, product and
management product quality (Guinee, 2002). An inadequate design would be an
important reason for lack of products quality.
ISO 9001 comprises an established, authentic and broad assay of a plan to appraise
the need for design and the ability of the design to supply these requisites and to
analyse the problem and purpose the solutions. The latest version is ISO 9001:2000
quality management system (QMS) which is an international quality framework. ISO
9001, quality systems-model applies for quality certainty in design advancement,
product, establishment and servicing (Guinee, 1996).
According to Peach (1997), there are five fundamental operating assumptions, which
determine the needs in ISO 9001:
• Categorise the way of organisation quality assurance.
• Constantly follow actions. In other word, do what you say.
• Document what you accomplished.
• Analyse the results against requirements and values for quality.
• Take action on discrepancies and act when results are inadequate.
15.4.2 Earned value management
According to AS4817 “project performance measurement using Earned Value outlines
the principles and requirements for implementing Earned Value Management (EVM). A
major feature of using EVM for measurement purposes is the unique way it integrates
the cost, schedule, and technical aspects of a program. An EVM system will result from
the application of the specified requirements integrating planning, scheduling,
budgeting, work authorization, accounting and managerial control” (AGDF, 2006, p.1).
What Earned Value Performance Measurement (EVPM) does is measuring the status of
the project, measuring progress of a project against the baseline and forecasting the
future performance. Finally, it assists the project manager to report the cost and
schedule performance and to analyse the variances between planned and actual

231
progress. EVMP is a useful method to monitor the cost and time of a project as it can
forecast the performance of the project during the project takes place. The project
manager can determine the condition of the project whether it is on schedule, behind
schedule or under budget.
15.5 Process workflow “execute escalation”
FIGURE 15.2: PROCESS WORKFLOW “ EXECUTE ESCALATION ” (PROSTEP IVIP 2007A, P. 51)
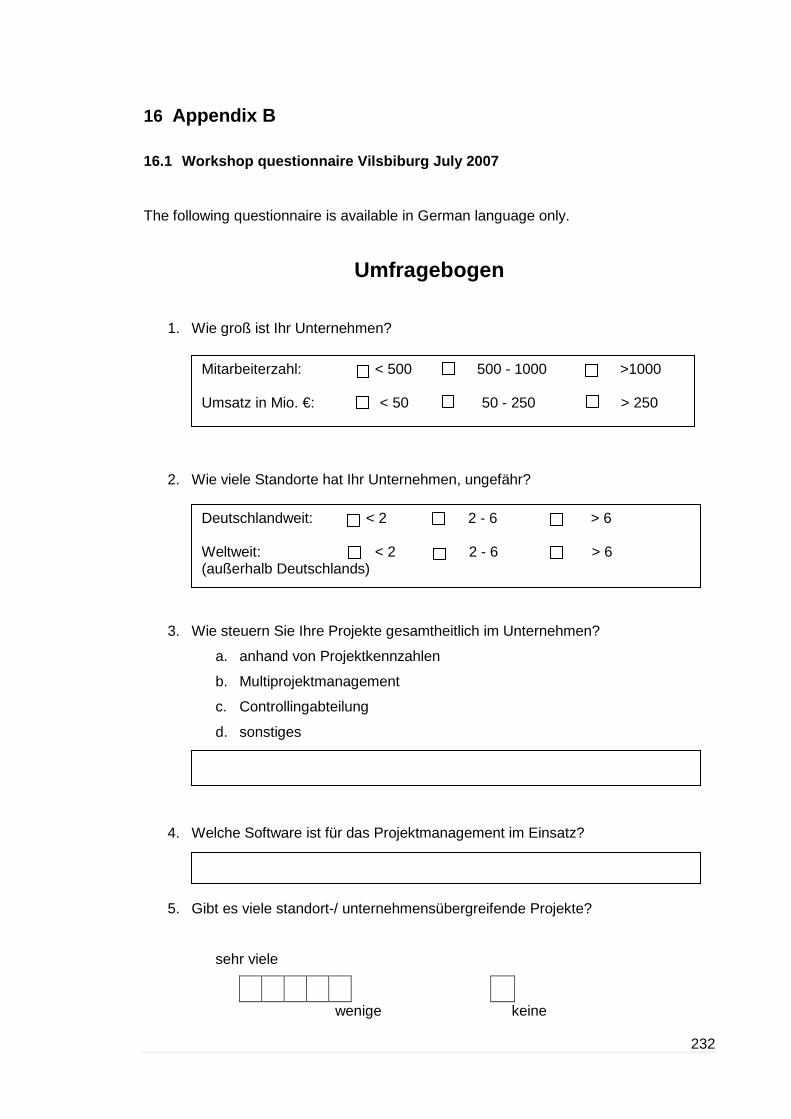
232
16 Appendix B
16.1 Workshop questionnaire Vilsbiburg July 2007
The following questionnaire is available in German language only.
Umfragebogen
1. Wie groß ist Ihr Unternehmen?
2. Wie viele Standorte hat Ihr Unternehmen, ungefähr?
3. Wie steuern Sie Ihre Projekte gesamtheitlich im Unternehmen?
a. anhand von Projektkennzahlen
b. Multiprojektmanagement
c. Controllingabteilung
d. sonstiges
4. Welche Software ist für das Projektmanagement im Einsatz?
5. Gibt es viele standort-/ unternehmensübergreifende Projekte?
sehr viele
wenige keine
Mitarbeiterzahl: < 500 500 - 1000 >1000 Umsatz in Mio. €: < 50 50 - 250 > 250
Deutschlandweit: < 2 2 - 6 > 6 Weltweit: < 2 2 - 6 > 6 (außerhalb Deutschlands)

233
6. Wo in Ihrem Unternehmen wird eine Balanced Scorecard verwendet?
a. Unternehmensweit
b. Geschäftsbereichsebene
c. andere : ________________________________
d. keine
7. Benutzen Sie in Ihrem Unternehmen bereits ein Kennzahlensystem im Bereich
Projekt Management? Wenn ja, wie zufrieden sind Sie damit?
sehr
überhaupt nicht keine im Einsatz
8. Welches Kennzahlensystem ist im Einsatz?
9. Welche Erfahrungen haben Sie zum Thema Project Scorecard bereits
gesammelt?
10. Wo sehen Sie die Stärken bzw. Schwächen einer Project Scorecard?
gute Erfahrungen: schlechte Erfahrungen: keine:
(Projektcockpit, etc.)
Stärken: Schwächen:
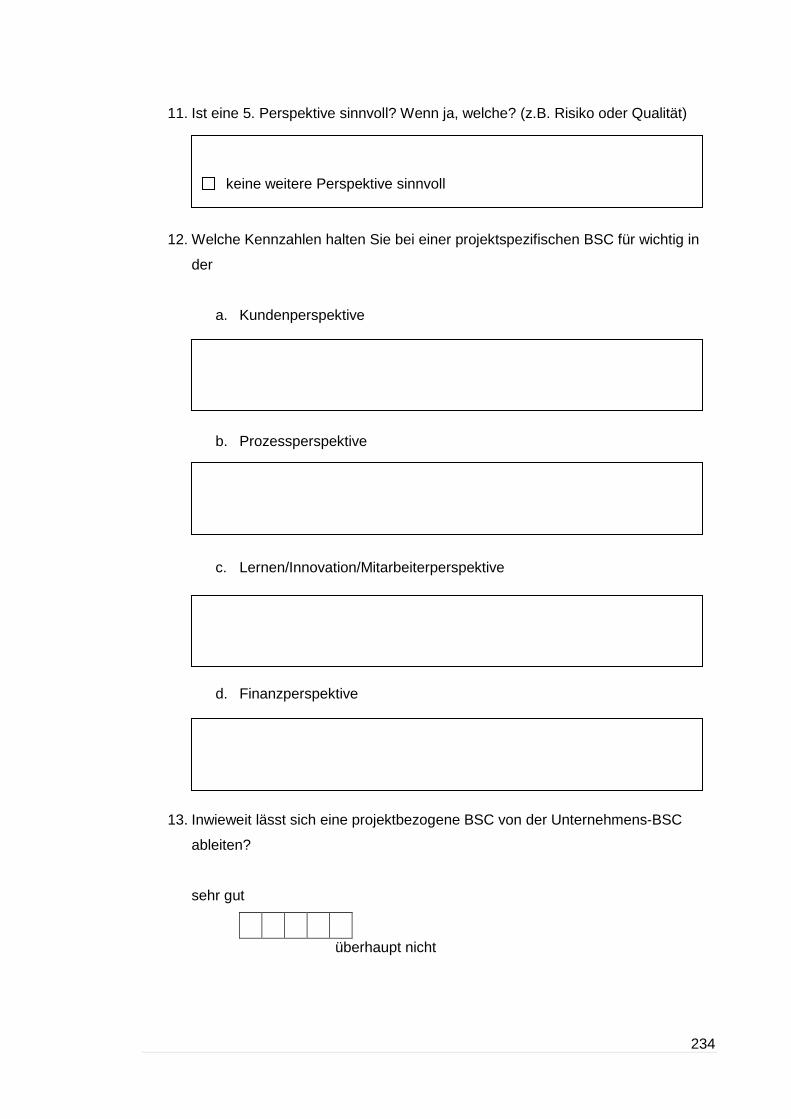
234
11. Ist eine 5. Perspektive sinnvoll? Wenn ja, welche? (z.B. Risiko oder Qualität)
12. Welche Kennzahlen halten Sie bei einer projektspezifischen BSC für wichtig in
der
a. Kundenperspektive
b. Prozessperspektive
c. Lernen/Innovation/Mitarbeiterperspektive
d. Finanzperspektive
13. Inwieweit lässt sich eine projektbezogene BSC von der Unternehmens-BSC
ableiten?
sehr gut
5 4 3 2 1
überhaupt nicht
keine weitere Perspektive sinnvoll
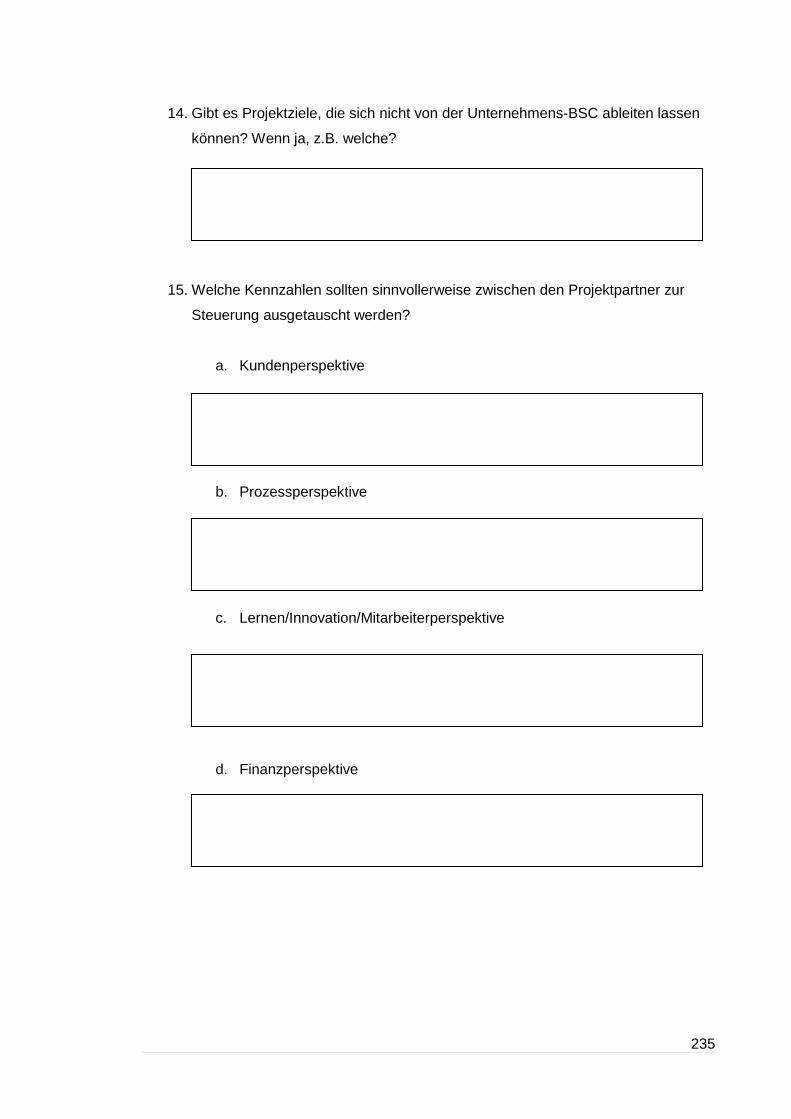
235
14. Gibt es Projektziele, die sich nicht von der Unternehmens-BSC ableiten lassen
können? Wenn ja, z.B. welche?
15. Welche Kennzahlen sollten sinnvollerweise zwischen den Projektpartner zur
Steuerung ausgetauscht werden?
a. Kundenperspektive
b. Prozessperspektive
c. Lernen/Innovation/Mitarbeiterperspektive
d. Finanzperspektive

236
16. Welche dieser Kennzahlen können dabei als Frühindikatoren („leading“)
verwendet werden?
17. Welche Unterschiede gibt es zwischen den Partnerprojekten OEM und Zulieferer
sowie zwischen „gleichgestellten“ Projektpartnern (z.B. verteilte Projekte einer
Firma an verschiedenen Standorten weltweit)
18. Für wie wichtig halten Sie eine IT-Implementierung zur Nachhaltigkeit der PSC?
sehr wichtig
5 4 3 2 1
unwichtig
19. Wie hoch sehen Sie den Nutzen einer PSC im Vergleich zum Aufwand?
sehr hoch
5 4 3 2 1
sehr gering
20. Für wie geeignet halten Sie die PSC zum Risikomanagement von
unternehmensübergreifenden Projekten?
sehr gut
5 4 3 2 1
überhaupt nicht
a. bezüglich Projektziele b. bezüglich der zu verfolgenden Kennzahlen (z.B. aus Know-how
Schutz Gründen)
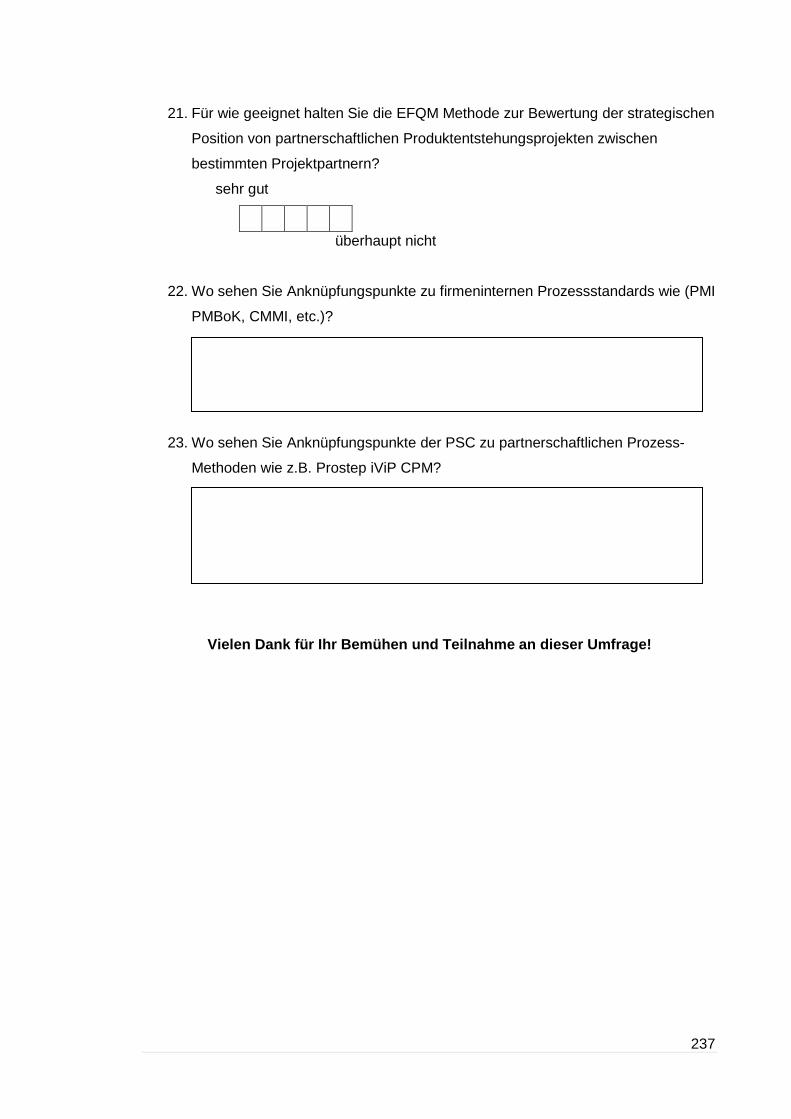
237
21. Für wie geeignet halten Sie die EFQM Methode zur Bewertung der strategischen
Position von partnerschaftlichen Produktentstehungsprojekten zwischen
bestimmten Projektpartnern?
sehr gut
5 4 3 2 1
überhaupt nicht
22. Wo sehen Sie Anknüpfungspunkte zu firmeninternen Prozessstandards wie (PMI
PMBoK, CMMI, etc.)?
23. Wo sehen Sie Anknüpfungspunkte der PSC zu partnerschaftlichen Prozess-
Methoden wie z.B. Prostep iViP CPM?
Vielen Dank für Ihr Bemühen und Teilnahme an dieser Um frage!

238
16.2 Project Scorecard survey questionnaire (GPM)
The following survey questionnaire is available in German language only.
Umfrage zur Anwendung der Balanced Scorecard
im Rahmen von unternehmensübergreifenden Projekten
Sehr geehrte Damen und Herren,
die Fachgruppe „Automotive-Projektmanagement“ der GPM Deutsche Gesellschaft für
Projektmangement e.V. führt in Zusammenarbeit mit der Hochschule Darmstadt sowie
den Unternehmen BMW Group und Dräxlmaier eine Untersuchung zur Anwendung der
Balanced Scorecard (BSC) im Rahmen von unternehmensübergreifenden Projekten
durch.
Mit diesem Fragebogen sollen relevante Informationen über die generelle Verbreitung
der Balanced Scorecard in Unternehmen sowie im Projektgeschäft und deren
Anwendung auf unternehmensübergreifende Projekte ermittelt werden. Wenn Sie über
entsprechende Erfahrungen verfügen würden wir uns über eine Beantwortung des
Fragebogens sehr freuen!
Ziel der unternehmensübergreifend abgestimmten Scorecard („Collaborative Project
Score-card“) ist, einen Konsens zwischen den beteiligten Partnern bezüglich der
gemeinsamen Ziele zu erreichen und damit bessere Voraussetzungen für eine
erfolgreiche Zusammenarbeit im Rahmen von unternehmensübergreifenden Projekten
zu schaffen.
Ansprechpartner für die Befragung sind:
Herr Klaus Niebecker: [email protected]
Jeder Teilnehmer dieser Umfrage bekommt nach Abschluss der Untersuchung eine
Zusammenfassung der Ergebnisse zugeschickt.

239
Selbstverständlich werden die Informationen vertraulich behandelt. Es werden keine
personenbezogenen Daten weiter veröffentlicht, noch auf einzelne Aussagen
verwiesen.
Vielen Dank für Ihre Mühe und Interesse!
Anmerkungen, Kommentare oder Verbesserungsvorschläge bzgl. dieser Umfrage:
______________________________________________________________________
______________________________________________________________________

240
1. In welcher Branche ist Ihr Unternehmen tätig?
2. Wie groß ist Ihr Unternehmen?
3. Wie viele Standorte hat Ihr Unternehmen, ungefähr?
4. Welche Bedeutung hat Projektarbeit für Ihr Unternehmen?
sehr groß
wenig keine
5. Wie steuern sich Ihre Projekte gesamtheitlich im Unternehmen?
a. anhand von Projektkennzahlen
b. Multiprojektmanagement
c. Controllingabteilung
d. sonstiges
6. Welche PM-Standards verwenden Sie in Ihrem Unternehmen und durch welche
Software werden diese eventuell unterstützt?
Mitarbeiterzahl: < 500 500 - 1000 >1000 Umsatz in Mio. €: < 50 50 - 250 > 250
Deutschlandweit: < 2 2 - 6 > 6 Weltweit: < 2 2 - 6 > 6 (außerhalb Deutschlands)

241
7. Werden PM-Standards in Projekten auch aktiv angewandt?
sehr oft
selten nie
8. Gibt es viele standort-/ unternehmensübergreifende Projekte?
sehr viele
selten keine
9. Wo in Ihrem Unternehmen wird eine Balanced Scorecard verwendet?
Unternehmensweit
Geschäftsbereichsebene
andere : ________________________________
keine
10. Benutzen Sie in Ihrem Unternehmen bereits ein Kennzahlensystem im Bereich
Projektmanagement? Wenn ja, wie zufrieden sind Sie damit?
sehr
überhaupt nicht keine im Einsatz
11. Welche Erfahrungen haben Sie zum Thema Project Scorecard bereits
gesammelt?
gute Erfahrungen: schlechte Erfahrungen: keine

242
12. Welches System ist im Einsatz?
13. Wo sehen Sie die Stärken bzw. Schwächen einer Project Scorecard?
14. Ist eine 5. Perspektive sinnvoll? Wenn ja, welche? (z.B. Risiko oder Qualität)
15. Welche Kennzahlen halten Sie bei einer projektspezifischen BSC für wichtig in
der
a. Kundenperspektive
b. Prozessperspektive
c. Lernen/Innovation/Mitarbeiterperspektive
keine weitere Perspektive sinnvoll
Stärken: Schwächen:
(Projektcockpit, etc.)

243
d. Finanzperspektive
16. Inwieweit lässt sich eine projektbezogene BSC von der Unternehmens-BSC
ableiten?
sehr gut
5 4 3 2 1
überhaupt nicht
17. Gibt es Projektziele, die sich nicht von der Unternehmens-BSC ableiten lassen
können? Wenn ja, z.B. welche?
18. Welche Kennzahlen sollten sinnvollerweise zwischen den Projektpartner zur
Steuerung ausgetauscht werden?
a. Kundenperspektive
b. Prozessperspektive
c. Lernen/Innovation/Mitarbeiterperspektive

244
d. Finanzperspektive
19. Welche dieser Kennzahlen können dabei als Frühindikatoren („leading“)
verwendet werden?
20. Welche Unterschiede gibt es zwischen den Partnerprojekten z.B. OEM und
Zulieferer sowie zwischen „gleichgestellten“ Projektpartnern (z.B. verteilte
Projekte einer Firma an verschiedenen Standorten weltweit)
21. Für wie wichtig halten Sie eine IT-Implementierung zur Nachhaltigkeit der PSC?
sehr wichtig
5 4 3 2 1
unwichtig
22. Wie hoch sehen Sie den Nutzen einer PSC im Vergleich zum Aufwand?
sehr hoch
5 4 3 2 1
sehr gering
c. bezüglich Projektziele d. bezüglich der zu verfolgenden Kennzahlen (z.B. aus Know-how
Schutz Gründen)

245
23. Für wie geeignet halten Sie die PSC zum Risikomanagement von
unternehmensübergreifenden Projekten?
sehr gut
5 4 3 2 1
überhaupt nicht
24. Wo sehen Sie Anknüpfungspunkte zu firmeninternen Prozessstandards?
25. Welche unternehmensübergreifende Prozessmethoden/-standards sind Ihnen
bereits bekannt und wird in Ihrem Unternehmen angewandt? (z.B. VDA, Prostep
iViP)
26. Gibt es in unternehmensübergreifenden Projekten gemeinsame Strategien?
Wenn ja, wie bewerten Sie diese und leiten den Handlungsbedarf ab (z.B.
anhand einer Methode wie EFQM)?
Vielen Dank für Ihr Bemühen und Teilnahme an dieser Um frage!
(z.B. Terminplan, Produktreifegrad, etc.)
bekannt: in Anwendung:

246
16.3 Collaborative Project Scorecard survey question naire (online)
The online survey was available in English and German language. This section shows
the English questionnaire only.
The Balanced Scorecard: A Method for Cross-Company Project
Management
Collaboration within networked project environments increases constantly. Due to the
high complexity of cross-company project structures, project management faces new
challenges. Unclear project objectives, insufficient project control, and mistrust between
team members are some of the common project management problems, which need to
be solved, and management methods adapted to the new requirements.
The Balanced Scorecard, originally designed for business management, has resulted in
the following advantages:
- Measurable business targets due to defined indicators
- Identify relevant cause-and-effect relationships of business objectives
- Reduction of complexity in project control
- Integration of stakeholders
- Improved management of measures
- Integration of non financial indicators to increase business potentials
To benefit from the advantages of a Balanced Scorecard next to strategic business
control, it is essential to apply its concept down to the project management level. At the
moment, this has already taken place with the use of “Project Cockpits” in many
enterprises. The Project Cockpit is a concept that allows the manager to monitor all
project related key performance indicators with one system. The implementation of the
Balanced Scorecard method on a project level can be achieved with a Project
Scorecard, which facilitates the alignment of project objectives with business targets and
a company’s vision, and a balanced selection of indicators ensures that all relevant
project aspects are considered.

The University of Technology in Sydney and the University of Applied Sciences in
Darmstadt currently investigates the application of a cross
the Collaborative Project Scorecard for cross
collaboration with the
Association (GPM e.V.), two workshops have already shown the significance of this
topic. As the method is a new approach without any prior experience
to contribute to the further development of this concept.
The Balanced Scorecard replaces the traditional
approach to control a business with financial
indicators only. The business targets are represented
in the four perspectives of finances, client, processes,
and employees, and are based on selected key
performance indicators. The project objectives in a
Project Scorecard are derived from the business targets and are measured with key
performance indicators, which are categorised according to the four perspectives. Due
to the increasing number of cross
and cross-company project scorecard, the Collaborative Project Scorecard (CPS),
stands to reason. In a CPS, the selected internal key performance indicators (KPIs) are
synchronised with the project partners and ne
collaboratively. The following figure illustrates the derivation of the CPS from a
Balanced Scorecard and a Project Scorecard.
First experiences could be gained from two workshops organised by the GPM in July
and October 2007. Some of the results were the modification of the four traditional
Business Scorecard
Partner A
Project Goals A
Project Scorecard
The University of Technology in Sydney and the University of Applied Sciences in
Darmstadt currently investigates the application of a cross-company project scorecard,
the Collaborative Project Scorecard for cross-company project management. In
collaboration with the Automotive Chapter of the German Project Management
Association (GPM e.V.), two workshops have already shown the significance of this
topic. As the method is a new approach without any prior experience
to contribute to the further development of this concept.
The Balanced Scorecard replaces the traditional
approach to control a business with financial
indicators only. The business targets are represented
in the four perspectives of finances, client, processes,
and employees, and are based on selected key
mance indicators. The project objectives in a
Project Scorecard are derived from the business targets and are measured with key
performance indicators, which are categorised according to the four perspectives. Due
to the increasing number of cross-company projects, the extension to a collaborative
company project scorecard, the Collaborative Project Scorecard (CPS),
stands to reason. In a CPS, the selected internal key performance indicators (KPIs) are
synchronised with the project partners and new KPIs generated, and then controlled
collaboratively. The following figure illustrates the derivation of the CPS from a
Balanced Scorecard and a Project Scorecard.
First experiences could be gained from two workshops organised by the GPM in July
October 2007. Some of the results were the modification of the four traditional
Business Scorecard Business Scorecard
Project Scorecard
Collaborative Project Scorecard
Partner A
Project Goals A Project Goals B
or or
Project Scorecard
Partner B
247
The University of Technology in Sydney and the University of Applied Sciences in
company project scorecard,
company project management. In
of the German Project Management
Association (GPM e.V.), two workshops have already shown the significance of this
topic. As the method is a new approach without any prior experiences, this survey aims
Project Scorecard are derived from the business targets and are measured with key
performance indicators, which are categorised according to the four perspectives. Due
projects, the extension to a collaborative
company project scorecard, the Collaborative Project Scorecard (CPS),
stands to reason. In a CPS, the selected internal key performance indicators (KPIs) are
w KPIs generated, and then controlled
collaboratively. The following figure illustrates the derivation of the CPS from a
First experiences could be gained from two workshops organised by the GPM in July
October 2007. Some of the results were the modification of the four traditional
Business Scorecard
Project Goals B
Partner B

248
perspectives, and the identification of relevant KPIs for collaborative projects. The
following two perspectives were modified:
Finances ► Project Results
Costumer ► Collaboration
In a collaborative project, the common project results are more important than the
financial goals only as these are mainly dependent on the type of partnership (joint
venture, OEM/Supplier, etc.). Additionally, the client is not always in the main focus of
collaboration and is rather represented in all four perspectives.
The aim of the method is to increase the project transparency of cross-company
projects and to provide a basis for communication by defining common goals, processes
and strategies. Another advantage of the CPS is that measures are defined in advance
and in agreement with all participating partners, which is likely to avoid project delays
when certain KPIs exceed a predefined value.
The concept of a CPS (including relevant KPIs and perspectives) is the main focus of
this survey.
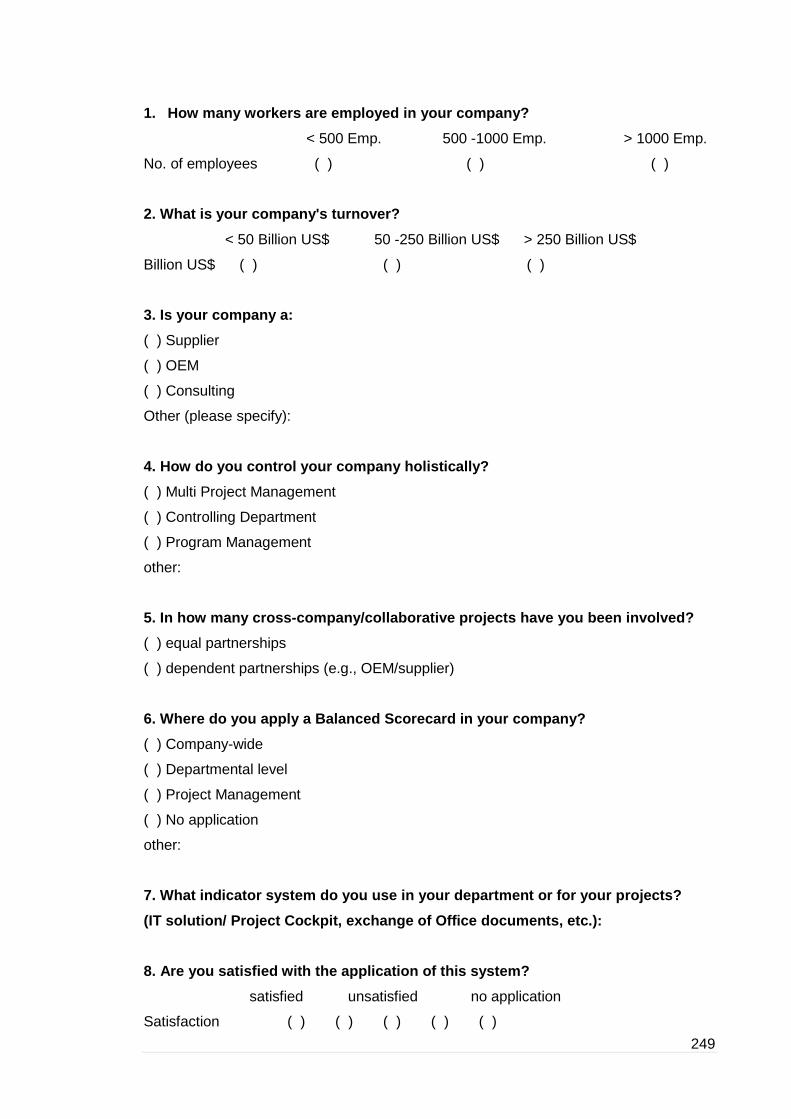
249
1. How many workers are employed in your company?
< 500 Emp. 500 -1000 Emp. > 1000 Emp.
No. of employees ( ) ( ) ( )
2. What is your company's turnover?
< 50 Billion US$ 50 -250 Billion US$ > 250 Billion US$
Billion US$ ( ) ( ) ( )
3. Is your company a:
( ) Supplier
( ) OEM
( ) Consulting
Other (please specify):
4. How do you control your company holistically?
( ) Multi Project Management
( ) Controlling Department
( ) Program Management
other:
5. In how many cross-company/collaborative projects have you been involved?
( ) equal partnerships
( ) dependent partnerships (e.g., OEM/supplier)
6. Where do you apply a Balanced Scorecard in your c ompany?
( ) Company-wide
( ) Departmental level
( ) Project Management
( ) No application
other:
7. What indicator system do you use in your departm ent or for your projects?
(IT solution/ Project Cockpit, exchange of Office do cuments, etc.):
8. Are you satisfied with the application of this s ystem?
satisfied unsatisfied no application
Satisfaction n ( ) ( ) ( ) ( ) ( )
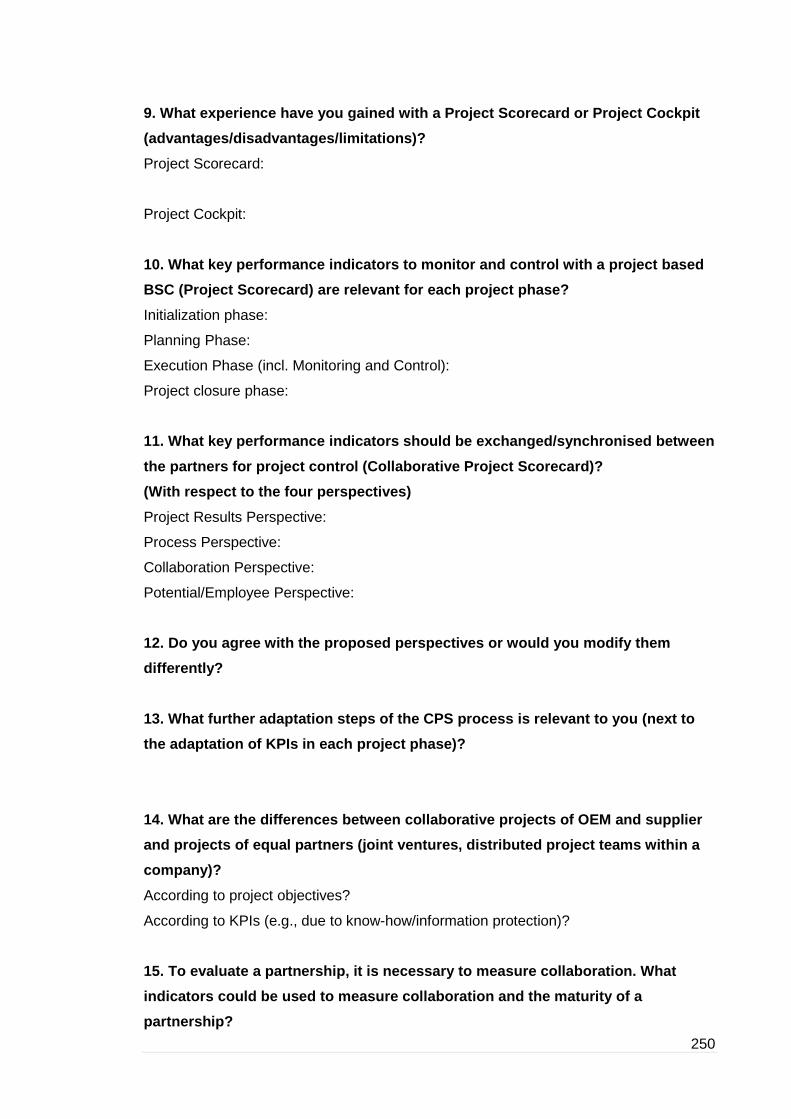
250
9. What experience have you gained with a Project S corecard or Project Cockpit
(advantages/disadvantages/limitations)?
Project Scorecard:
Project Cockpit:
10. What key performance indicators to monitor and control with a project based
BSC (Project Scorecard) are relevant for each project phase?
Initialization phase:
Planning Phase:
Execution Phase (incl. Monitoring and Control):
Project closure phase:
11. What key performance indicators should be excha nged/synchronised between
the partners for project control (Collaborative Proj ect Scorecard)?
(With respect to the four perspectives)
Project Results Perspective:
Process Perspective:
Collaboration Perspective:
Potential/Employee Perspective:
12. Do you agree with the proposed perspectives or w ould you modify them
differently?
13. What further adaptation steps of the CPS process is relevant to you (next to
the adaptation of KPIs in each project phase)?
14. What are the differences between collaborative projects of OEM and supplier
and projects of equal partners (joint ventures, dis tributed project teams within a
company)?
According to project objectives?
According to KPIs (e.g., due to know-how/information protection)?
15. To evaluate a partnership, it is necessary to m easure collaboration. What
indicators could be used to measure collaboration a nd the maturity of a
partnership?

251
16. A focus of the CPS is to improve communication. How would you define
indicators to measure the quality of communication between project partners?
7. A possible way to define communication is by the reachability of project
members. How would you define the indicator measure reachability?
8. What is the best type of partnership for an appl ication of a CPS in your
opinion?
( ) OEM and supplier
( ) Joint Ventures
( ) equal project partners
( ) cross-departmental projects
other reasons:
9. What is the advantage of a CPS software solution?
10. How important is the incorporation of the CPS met hod into a software solution
to ensure its sustainability?
very important unimportant ensure sustainability:
( ) ( ) ( ) ( ) ( )
11. How do you estimate the advantages/benefits of a CPS compared to the effort
of implementation and maintenance?
very high very low
Benefits compared to effort ( ) ( ) ( ) ( ) ( )
12. Do you think that the transparency of your proje ct may become too high with
a CPS; or does it have a positive impact on your pro ject collaboration?
too high acceptable positive impact
Project transparency ( ) ( ) ( ) ( ) ( )
Comments:
13. Do you think a CPS is adequate to manage risks of cross-company projects?
very adequate not adequate
Adequacy ( ) ( ) ( ) ( ) ( )

252
14. What key performance indicators are relevant fo r a collaborative monitoring
and control of project risks?
15. Do you think a CPS is adequate to manage quality aspects of cross-company
projects?
very adequate not adequate
Adequacy n ( ) ( ) ( ) ( ) ( )
16. What key performance indicators are relevant fo r a collaborative monitoring
and control of quality aspects?
17. What risks, opportunities, and threats may occu r with a CPS?

253
17 Appendix C
17.1 Agenda of the CPS workshop 11th March 2008
1.00 – 1.15 Warm-up: round of introduction and prospects All
1.15 – 1.45 The Concept of a Collaborative Project Scorecard;
Procedure and Goal Definition for the Workshop
Researcher of
OEM #1+2
1.45 – 2.30 Development of a Strategic Collaboration Framework
between OEM and supplier
All
2.30 – 2.45 Short Break - coffee and snacks All
2.45 – 4.45 Creation of a CPS for the
Launch (Moderation:
Manager of Supplier,
Researcher of OEM #1)
Creation of a CPS for
Change Management
(Moderation: Manager
Supplier, Researcher of OEM
#2)
Group Work
2.45 - 3.45 Group A:
2 Supplier and 3 OEM
representatives
Group B:
4 OEM and 2 supplier
representatives
3.45 - 4.45 Group C:
4 OEM and 2 supplier
representatives
Group D:
2 Supplier and 3 OEM
representatives)
Short Break All
4.45 - 5.00 Presentation of Results "Change" Moderator
Change
5.00 - 5.15 Presentation of Results "Launch" Moderator
Launch
5.15 – 6.00 Discussion: Pros and Cons, Potential and Business Impact
of the Methodology
All
TABLE 17.1: USA WORKSHOP AGENDA

254
17.2 Original Strategy Map of the Strategic Collabor ative Scorecard (whiteboard)
FIGURE 17.1: STRATEGY MAP CPS WHITEBOARD

255
17.3 CPS workshop questionnaire
The following is the questionnaire that was handed out after the CPS workshop in South
Carolina.
The Collaborative Project Scorecard (CPS)
ITRC, 11th March 2008
Questionnaire
1. What is your current position?
a. Management ( )
b. Project Management ( )
c. Indirect function ( )
2. Are you working for a
a. Supplier ( )
b. OEM ( )
3. Years of project management experience:
a. _____________
4. What is your appraisal to improve collaboration with a common Balanced Scorecard
(CPS)?
Effective impact
5 4 3 2 1
No impact too much overhead work
5. Your feedback to this workshop:

256
Bibliography
AIAG (1995), “Advanced Product Quality Planning & Control Plan (APQP)”, Automotive
Industry Action Group, 1st edition.
AGDF (2006), “Defence supplement to AS4817-2006 – project performance
measurement using earned value”, Australian Government, Department of Defence,
Defence Material Organisation, document version 1.0, Australia.
Akao, Y. (2004), “QFD: quality function deployment - integrating customer requirements
into product design”, Productivity Press, New York.
Akhilesh, K. and Prasad, K. (2002), “Global virtual teams: what impacts their design and
performance?”, Team Performance Management, An International Journal, vol. 8, no.
5/6.
Alleman, G. (2003), “Using balanced scorecard to build a project focused IT
organisation”, Balanced Scorecard Conference Oct 28-30 2004, IQPC, San Francisco.
Andersen H, Lawrie G and Savic N (2004), “Effective quality management through third-
beneration balanced scorecard”, International Journal of Productivity and Performance
Management, vol. 53, No. 7, pp. 634-645.
Australian Government Department of Defence (2006), “Defence supplement to
AS4817-2006 – project performance measurement using earned value”, Defence
Material Organisation, document version 1.0, Australia.
Behrend, F. (2005), “The socio-cultural challenge of effective knowledge management in
virtual project environments”, University of Southern Queensland, Faculty of Business,
Australia.
Bennis, W. (1999), “Old dogs, new tricks: on creativity and collaboration”, Executive
Excellence Publishing.
Bergheim, S. (2005), „Globale Wachstumszentren 2020 – Formel-G für 34
Volkswirtschaften“, Aktuelle Themen 313, Deutsche Bank Research, Frankfurt.

257
Bieker, T. and Waxenberger, B. (2002), “Sustainability balanced scorecard and
business ethics – using the BSC for integrity management”, paper presented at the 10th
International Conference of the Greening of Industry Network, Göteborg, Sweden.
Birkhofer, H. (2000), „Skriptum zur Vorlesung Produktentwicklung“, Technische
Universität Darmstadt, Germany.
Birowicz, U. (2005), “Evaluating standard software with V-Modell XT, a case study”, The
University of Liverpool, UK.
Bourgault, M., Lefebvre, E., Lefebvre, L., Pellerin, R. and Elia, E. (2002), “Discussion of
metric for distributed project management: preliminary findings”, Proceedings of the 35th
Hawaii Conference on System Sciences, HICSS-35`02, IEEE, USA.
Brewer, P. and Speh, T. (2001), “Adapting the balanced scorecard to supply chain
management”, Supply Chain Management Review, vol. 5, no. 2, pp. 48-56.
Bullinger, H., Kiss-Preussinger, E. and Spath, D. (2003), „Automobilentwicklung in
Deutschland – wie sicher in die Zukunft? Chancen, Potenziale und
Handlungsempfehlungen fuer 30 Prozent mehr Effizienz“, Fraunhofer IRB, Stuttgart.
Byrne, J., Brandt, R. and Port, O. (1993), “The virtual corporation”, Business Week, 8th
February, pp. 98-102.
Calandro, J. and Lane, S. (2006), “Insights from the balanced scorecards”, Measuring
Business Excellence, vol. 10, no. 3, pp. 31-40.
Chao, G. and Moon, H. (2005), “The cultural mosaic: a metatheory for understanding
the complexity of culture”, Journal of Applied Psychology, vol. 90, no. 6, pp. 1128-1140.
Chen, F., Romano, N., Nunamaker, J. and Briggs, R. (2002), “A collaborative project
management architecture”, Proceedings of the 36th Hawaii International Conference on
System Sciences (HICSS’03), USA, pp. 12.
Chrissis, M., Konrad, M. and Shrum, S. (2006), “CMMI: guidelines for process
integration and product improvement”, SEI series in software engineering, Addison
Wesley, Boston, USA.

258
Cobbold, I. and Lawrie, G. (2002), “The development of the balanced scorecard as a
strategic management tool”, Proceedings of the PMA2002, Boston.
Coghlan, D. (2001), “Insider action research projects: implications for practising
managers”, Management learning, vol. 21, no 1, pp. 49-60
Connaughton, S. and Shuffler, M. (2007), “Multinational and multicultural distributed
teams”, Small Group Research, vol. 38, no.3, pp. 387-412.
Crawford, L., Morris, P., Thomas, J. and Winter, M. (2006), “Practitioner development:
from trained technicians to reflective practitioners”, International journal of project
management, vol. 24, pp. 722-733.
Creswell, J. (2002), “Research design: qualitative, quantitative, and mixed methods
approaches”, 2nd edition, Sage Publications.
Daenzer, W. and Huber, F. (1997), “Systems Engineering, Methodik und Praxis“, 9.
Auflage, Verlag Industrielle Organisation, Zürich, Switzerland.
Diensberg, C. (2001), “Balanced Scorecard und House of Quality“, Schriftenreihe des
Bundesinstituts für Berufsbildung, Bundesinstittut für Berufsbildung, Heft 53, Bertohld
Schobert, Bonn.
DIN 69901 (1987), “Projektmanagement, Begriffe“, German institute for standardization.
Dixius, D. (1998), “Simultane Projektorganisation – Ein Leitfaden fuer die Projektarbeit
im Simultaneous Engineering“, Springer, Berlin, Germany.
Ebel, B., Hofer, M. and Al-Sibal, J. (2004), “Automotive Management – Strategie und
Marketing in der Automobilwirtschaft,“ Berlin, Springer Verlag.
Eckerson, W. (2006), “Performance dashboards: measuring, monitoring, and managing
your business”, John Wiley and Sons Inc., Hoboken, New Jersey.
Eigner, M. and Stelzer, R. (2004), “Produktdatenmanagementment-Systeme – Ein
Leitfaden fuer Product Development und Life Cycle Management”, Springer, Berlin,
Germany.

259
Eisenhardt, K. (1989), “Building theories from case study research”, Academy of
Management Review, vol. 14, no. 4, pp. 532-550.
Engel, C. and Holm, C. (2007), “Ergebnisse der Projektmanagement Studie 2007 –
Schwerpunkt Kosten und Nutzen von Projektmanagement“, gemeinsame Studie der
GPM Deutsche Gesellschaft fuer Projektmanagement e.V. und PA Consulting Group,
Germany.
Evaristo, R. and van Fenema, P. (1999), “A typology of project management:
emergence and evolution of new forms”, International Journal of Project Management,
vol. 17, no. 5, pp. 275- 281.
FAST-2015 (2004), “Future Automotive industry Structure (FAST) 2015 – die neue
Arbeitsteilung in der Automobilindustrie“, Studie von Mercer Management Consulting un
den Fraunhofer-Instituten IPA und IML in VDA – Materialien zur Automobilindustrie, no.
32, Germany.
Flyvbjerg, B. (2006), “From nobel prise to project management: getting risks right”,
Project Management Journal, vol. 37, no. 3, pp. 5-15.
Gable, J. (1994), “Integrating case study and survey research methods: An example in
information systems”, European Journal of Information Systems, vol. 3, no. 2, pp. 112-
126.
Gessner, C. (2001), „Package feutrues fuer die Kommunkation in den fruehen Phasen
der Automobilentwicklung“, Dissertation, TU Berlin, Germany
Gharajedaghi, J. (1999), “Systems thinking – managing chaos and complexity”,
Butterworth-Heinemann, Boston.
Gierhardt, H. (2001), “Global verteilte Produktentwicklungsprojekte – Ein
Vorgehensmodell auf der operativen Ebene“, Dissertation, Technische Universitaet
Muenchen, Germany.
Gleissner, W. (2002), “Risikomanagement und Balanced Scorecard im Kontext
wertorientierter Managementsysteme”, Future Value Group AG, 05/2002, Germany.

260
Goldenson, D. and Gibson, D. (2003), “Demonstrating the impact and benefits of CMMI:
an update and preliminary results”, CMU/SEI-2003-SR-009, Software Engineering
Institute. Special report, Pittsburgh, USA.
Goldratt, E. (1997), “Critical Chain: a business novel”, North River Press, USA.
Goldratt, E. (1999), “Theory of constraints”, North River Press, USA.
Gordon, G. (2006), “Uniform maker sews up success with scorecard”, Quality Progress,
vol. 39, no. 10, pp. 37-42.
GPM (2008), “Der Deutsche Project Excellence Award“, GPM Deutsche Gesellschaft für
Projektmanagement e.V., viewed 1st October 2008, http://www.gpm-
ipma.de/docs/fdownload.php?download=GPM_Award-Broschure_final.pdf.
Gray, C. and Larson, Ee (2000), “Project management: the managerial process”, 1st
edition, Irwin, McGraw-Hill, Boston.
Gray, C. and Larson, E. (2002), “Project management: the managerial process”, 2nd
edition, McGraw-Hill, Irwin.
Guba, E. and Lincoln, Y. (1994), “Competing paradigms in qualitative research”,
Handbook of Qualitative Research, Denzon and Lincoln, Sage, Thousand Oaks.
Guinee, J. (2002), “Handbook of lifecycle assessment: pperation guide to ISO
standards”, Kluwer Academic Publisher, The Netherlands.
Hab, G. and Wagner, R. (2005), “Projektmanagement in der Automobilindustrie –
Herausforderungen in einer dynamischen Branche“, projectMANAGEMENT, edition
3/2005, Germany.
Hab, G. and Wagner, R. (2006), “Projektmanagement in der Automobilindustrie –
Effizientes Management von Fahrzeugprojekten entlang der Wertschoepfungskette“,
Gabler, 2nd edition, Germany
Hakes, C. (2007), “The EFQM Excellence Model to assess organisational performance -
a management guide (best practice)”, 1st edition, Van Haren Publishing, Netherlands.

261
Hass, K. (2007), “The blending of traditional and agile project management”, PM World
Today, May 2007, vol. 9, issue 5, pp. 1-8.
Herde, H., Kirchner, L. and Paessler, K. (2001), “Von der Balanced Scorecard zur
Business-Excellence-Scorecard – Erfahrungen mit Methoden und Werkzeugen zur
systematischen Strategieentwicklung und –umsetzung auf Basis des EFQM-Modells“,
Holger Luczak, Lehrstuhl fuer Arbeitswissenschaften der RWTH Aachen, 3rd edition,
Aachen, Germany.
Hill, T. and Westbrook, R. (1997), “SWOT analysis: it’s time for a product recall”,
International Journal of Strategic Management, Long Range Planning, vol. 30, issue 1,
pp. 46–52.
Hofmann, J., Rollwagen, I. and Schneider, S. (2007), “Deutschland im Jahr 2020 –
Neue Herausforderungen für ein Land auf Expedition“, Aktuelle Themen 382, Deutsche
Bank Research, Frankfurt.
Herzog, V. (2001), “Trust building on corporate collaborative project teams”, Project
Management Journal, vol. 32, no 1, pp. 28-37.
Horvath, P. (2003), “X-Engineering – Ohne Balanced Scorcard und Performance
Measurement nicht wirksam”, Controlling, Edition 07/08 2003, Verlage C.H. Beck,
Vahlen, Germany.
Horvath and Partner (2005), Balanced Scorecard Studie 2005, Germany.
Hrebiniak, L. (2005), “Making strategy work: leading effective execution and change,
Upper Saddle River, New Jersey.
Humphrey, W. (2002), “Winning with software, an executive strategy”, Addison-Wesley.
IPMA (2008), “Moving winners forward – IPMA international project excellence award”,
International Project Management Association, Switzerland.
Jaafari, A. (2001), “Management of risk, uncertainties and opportunities on projects:
time for a fundamental shift”, International Journal of Project Management, Vol. 19, pp.
89-101.

262
Jaafari, A. (2003), “Project management in the age of complexity and change”, Project
Management Journal, December 2003, vol. 34, no. 4, PMI, USA, pp. 47-57.
Janulil, E., Kuhlang, P., Piff, R., 2005, Projektmanagement und Prozessmessung – Die
Balanced Scorecard im projektorientierten Unternehmen, Erlangen.
Jonsson, N., Novosel, D., Lillieskold, J. and Eriksson, M. (2001), “Successful
management of complex, multinational R&D projects”, Proceedings of the 34th Hawaii
International Conference on Systems Sciences, Volume 8, January 3-6, Maui, HI, USA:
IEEE Computer Society Press, pp. 8044.
Kahn, K. (2005), “PDMA handbook of new product development”, Second Edition, John
Wiley and Sons.
Kaplan, R. and Norton, D. (1996), “Translating strategy into action: the balanced
scorecard”, Boston, Massachusetts, USA, Harvard Business School Press.
Kaplan, R. and Norton, D. (2001), “The strategy focused organisation – how balanced
scorecard companies thrive in the new business environment”, Harvard Business
School Press, Boston, USA.
Kaplan, R. and Norton, D. (2004), “Strategy maps, converting intangible assets into
tangible outcomes”, Harvard Business School Publishing Corporation, Boston,
Massachusetts, USA.
Kaplan, R. and Bower, M. (2004), “Five questions about strategy maps”, Harvard
Management Update, vol. 9, no. 11, p. 3.
Kaufmann, L. (2004), “X-BSC – Measuring the performance of truly strategic supplier
relationships”, Practix – Good Practices in Purchasing & Supply Chain Management,
CAPS Research, Tempe, AZ, USA.
Kerzner, H. (2003), “Project Management: a systems approach to planning, scheduling,
and controlling”, Wiley, 8th edition, USA.
Kuhn, T. (1996), “The structure of scientific revolutions”, 3rd edition, Chicago and
London, University of Chicago Press.

263
Kuehnel, W. and Pinnels, J. (2002), “Projekt, Vertrag und Claim“, VFMA, Frankfurt a. M.,
Germany.
Kurek, R. (2004), “Erfolgsstrategien für Automobilzulieferer – Wirksames Management
in einem dynamischen Umfeld“, Berlin, Springer.
Krippendorff, K. (1980), “Content analysis: An introduction to its methodology”, Sage
Publications, Beverly Hills.
Lawson R, Stratton W and Hatch, T. (2007), “Scorecards and dashboards – partners in
performance”, CMA Management, December/January issue accessed on 25th
September 2007 via CMA Management Web Side,
http://www.managementmag.com/index.cfm/ci_id/7355/la_id/1.htm.
Leung, K., Bhagat, R, Buchan, N. Erez, M. and Gibson, C. (2005), “Culture and
international business: recent advances and their implications for future research”,
Journal of International Business Studies, vol. 36, pp. 357-378.
Lindemann, U., and Reichwald, R. (1998), “Integriertes Aenderungsmanagement“,
Springer, Berlin, Germany.
Mabin, V. and Balderstone S. (2000), “The world of the theory of constraints: a review of
the international literature”, St Lucie Press, Boca Raton, FL, APICS Series on
Constraints Management, pp. 11-12.
Malone, T. (2004), “The future of work: how the new order of business will shape your
organisation, your management style, and your life”, Harvard Business School Press,
USA.
Mayer, M. (1998), “The virtual edge: embracing technology for distributed project team
success”, Newtown Square, Project Management Institute, USA.
McDonough, E., Kahn, K. and Griffin, A. (1999), “Managing communication in global
product development teams,” IEEE transactions on Engineering Management, vol. 46,
no. 4, p. 375-386

264
McPhail, J. and Perry, C. (2002), “Study book: research methodology”, University of
Southern Queensland, Toowoomba, Australia.
Mercer Consulting and Technische Universität München (2005), “Studie Management
von Unternehmensnetzwerken“, Munich, Germany.
Microsoft (2007), “Performance Point Server 2007”, viewed 1st December 2007,
<http://office.microsoft.com/en-us/performancepoint/FX101680481033.aspx>.
Miles, M. and Huberman, A. (1994), “Qualitative data analysis”, Sage Publications,
Thousand Oaks, California.
Moore, J. (1996), “ISO 12207 and related software life-cycle standards”, Institute of
Electrical and Electronics Engineers (IEEE), Accessed 16 April 2008,
<http://www.acm.org/tsc/lifecycle.html>.
Nidiffer, K. and Dolan, D. (2005), “Evolving distributed project management”, Systems
and Software Consortium, IEEE Software, September/October 2005, vol. 22, pp. 63-72.
Niebecker, K., Eager, D. and Kubitza, K. (2008a), “Improving cross-company project
management performance with a collaborative project scorecard”, International Journal
of Managing Projects in Business, Emerald Group Publishing Limited, vol. 1, no. 3, p.
368-386.
Niebecker K., Eager, D., Wagner, R. and Kubitza, K. (2008b), “Efficient project
management and performance assessment of cross-company projects with a
collaborative project scorecard, Proceedings of the IPMA World Congress, 9th-12th
November 2008, International Project Management Association, Rome, Italy.
Niebecker, K., Eager, D., Kubitza, K. and Plischke, D. (2008c), “Integrating a
collaborative management model into a project scorecard for efficient cross-company
project management, Proceedings of the AIPM Conference, 12th – 15th October 2008,
Australian Institute of Project Management, Canberra, Australia.
Norrie, J. (2006), “Improving results of project portfolio management in the public sector
using a balanced strategic scoring model”, Thesis for the degree of Doctor of Project

265
Management (DPM), Royal Melbourne Institute of Technology, School of Property,
Construction and Project, Management, Design and Social Context, RMIT University
Norrie, J. and Walker, D. (2004), “A balanced scorecard approach to project
management leadership”, Project Management Journal, PMI, vol. 35 no. 4, pp. 47-56.
Nunamaker, J., Romano, N. and Briggs, R. (2000), “A framework for collaboration and
knowledge management," Proceedings of the 34th Hawaii International Conference on
System Sciences, Maui, HI, USA: IEEE Computer Society Press, vol. 1, pp. 1060.
Office of Government Commerce (2005), “Prince2 manual (managing successful
projects with PRINCE2)”, 5th edition, Great Britain, The Stationery Office, UK.
O’Leary, M., Orlikoski, W. and Yates, J. (2002), “Distributed work over the centuries:
trust and control in the Hudson’s Bay company”, in Hinds, P., and Kiesler, S., Distributed
Work, Cambridge, MA, MIT Press. pp. 48.
Paessler, K. and Roesler, D. (2001), „Balanced-Scorecard-unterstuetzte Fuehrungs-
und Anreizsysteme“, Industrie Management, edition 4, p. 18-22.
Pander, S. and Wagner R. (2005), “Unternehmensübergreifende Zusammenarbeit in der
Automobilentwicklung – durch erfahrungsgeleitete Kooperation die Grenzen der
Planbarkeit überwinden“, Mering, Rainer Hampp Verlag.
Papalexandris, A., Ioannou, G., Prastacos, G. and Sonderquist, K. (2004), “An
integrated methodology for putting the Balanced Scorecard into action”, European
Management Journal, vol. 23, no. 2, pp. 214-227.
Peach, R. (1996), “The ISO 9000 handbook”, 3rd sub edition, McGraw-Hill, USA.
Plischke, D. (2004), “Entwicklungspartnerschaften und –kooperationen –
Herausforderung an die IT-Integration“, Arbeitswelten Gestalten, no. 1,
ProduktDatenJournal, Germany.
Plischke, D. and S. Vettermann (2007). “Automobil-Hersteller und Zulieferer: Neue
CPM-Empfehlung für eine optimierte Kooperation“, special edition 12/2007, München,
Projekt Magazin.

266
Project Management Institute (2004), “A guide to the project management body of
knowledge (PMBOK Guide)”, 3rd edition, Four Campus Boulevard, Newtown Square,
PA, USA.
Porter, M. (2001), “Anderssein ist alles“, Wirtschaftswoche 12/2001, pp. 124-126.
Prasad, B. (1996), “Concurrent engineering fundamentals”, Volume I: Integrated Product
and Process Organisation, Prentice Hall PTR, Upper Saddle River, New Jersey.
Prikladnicki, R., Nicolas, A. and Evaristo, J. (2004), “Global software development in
practice lessons learned”, Journal of software process improvement and practice,
Special Issue: Global Software Development: Growing Opportunities, Ongoing
Challenges, vol. 8, issue 4, pp. 267–281.
Project Management Institute (2001), “The PMI project management fact book”, 2nd
edition, Project Management Institute, Newton Square, Pennsylvania
Rad, P. and Levin, G. (2003), “Achieving project management success using virtual
teams”, J. Ross, USA
Raelin, J. (2001), “Public reflection as the basis of learning”, Management learning, vol.
32, no. 1, pp. 11-30.
Ramberg, J. (2000), “Six sigma: fad or fundamental?”, viewed on 8th September 2007,
www.qualitydigest.com/may00/html/sixsigmapro.html.
Rietiker, S. (2006), “Der neunte Schluessel – vom Projektmanagement zum
projektbewussten Management“, Berlin 2006
Rietiker, S. (2008), “Projektbewusstes Management“, projektManagement aktuell,
1/2008, pp. 23-31
Romano, N., Chen, F. and Nunamaker, J. (2002), “Collaborative project management
software”, Proceedings of the 35th Hawaii International Conference on System
Sciences, IEEE, vol. 1., pp. 20.
Salem, S. (2001), “New product development balanced scorecard’, IEEE International
Engineering Management Conference 2001, pp. 110-112.
267
Sandstroem, J. and Toivanen, J. (2002), “The problem of managing product
development engineers: can the balanced scorecard be an answer?”, International
Journal of Production Economics, vol. 78, no. 1, pp. 79-90.
Saynisch, M. (2004), “Results of the research programme beyond frontiers of traditional
project management”, paper at the 18th IPMA World Congress, June 2004, Budapest,
Hungary.
Saynisch, M. (2006), “Projekt-, Konfigurations-, und Collaborations Management –
Prozesse und Arbeitsstrukturen“, projektManagementaktuell, TUEV Verlag, Koeln,
Germany, edition 4, pp. 23-31.
Saynisch, M. (2007), “A radical redefining of PM for mastering complex projects: the
project management 2nd order (PM-2)”, paper for the ICAN Conference 2007, November
29th and 30th, Sydney, Australia.
Sarker, S., Lau, F. and Sahay, S. (2000), “Building an inductive theory of collaboration
in virtual teams: an adapted grounded theory approach”, Proceedings of the 33rd
Hawaii International Conference on System Sciences.
Schelle, H. (2008), ”Projektmanagement und Unternehmensstrategie”, Advanced
Project Management, Reinhard Wagner, Berlin, Germany
Schoen, D. (1983), „The reflective practitioner – how professionals think in action“,
Aldershot, UK, BasiAshgate Arena.
Scholey, C. (2005), “Strategy maps: a step-by-step guide to measuring, managing, and
communicating the plan”, Journal of Business Strategy, vol. 26, no. 3, pp. 12-19 .
Scholey, C. (2006), “Risk and the balanced scorecard', CMA Management, vol. 32, pp.
32-35.
Schuh, G. (2000), „Leitfaden kooperative Modulentwicklung – Abschluss-dokumentation
im Projekt VIA-OK“, Aachen, WZL, RWTH Aachen.
268
Seaver, M. (2001), “Implementing ISO 9000:2000, Gower, UTS Library, view on 15th
April 2008, http://site.ebrary.com.ezproxy.lib.uts.edu.au/lib/utslibrary/Doc?id=10047167.
Selders, M. and Maerkle, L. (2003), “Project scorecard: Mehr Transparenz fuer
strategische Projekte”, Projekt Magazin, Vol. 20 No. 1.
Selders, M. and Maerkle, L (2004), “Project Scorecard - Weiterentwicklung der
Balanced Scorecard fuer strategische Projekte”, viewed on 23rd September 2007,
http://www.competence-site.de/projektmanagement.nsf/artikel.html.
Software engineering Institute (2008), “ISO/IEC 15504”, Carnegie Mellon University,
view on 16th April 2008, http://www.sei.cmu.edu/cmmi/faq/15504-faq.html. SME Training
on Configuration Management (2000), “IBW”, viewed on 16th April 2008,
http://esamultimedia.esa.int/docs/industry/SME/Configuration/Section_1-CM.pdf.
Snow, C. (1993), ”The two cultures”, Cambridge University Press.
Sosa, M., Eppinger, S., Pich, M., McKendrick, D. and Stout, S. (2002), “Factors that
influence technical communication in distributed product development: an empirical
study in the telecommunications industry”, IEEE transactions on Engineering
Management, vol. 49, no. 1, pp. 45-58.
Spies, E. (2003), “Effektiv kooperieren“, Beltz, Germany.
Standish Group (1999), “Chaos: a recipe for success”, The Standish Group
International, Report 1999
Stewart, R. (2007), “IT enhanced project information management in construction:
Pathways to improved performance and strategic competitiveness”, Automation in
Construction, vol. 16, pp. 511-517.
Stewart, R. and Mohamed, S. (2001), “Utilizing the balanced scorecard for IT/IS
performance evaluation in construction”, Construction Innovation, vol. 1, pp. 147-163.
Stewart, W. (2001), ”Balanced scorecard for projects”, Project Management Institute,
vol. 32 no 1, pp. 38-53.

269
Tesch, D., Kloppenborg, T. and Frolick, M. (2007), “IT project risk factors: the project
management professionals perspective”, The Journal of Computer Information Systems,
vol. 47, issue 4, pp. 61-69.
Thompson, A. and Strickland A (2001), “Crafting and executing strategy: Text and
Readings”, 12th edition, McGraw-Hill, Boston.
Turner, J. (2000), “Do you manage work, deliverables or resources?”, International
Journal of Project Management, vol. 18, no. 2, pp. 83-84.
VDA (2003), “Sicherung der Qualitaet vor Serieneinsatz“, Band 4.3, VDA, Frankfurt
Ministry of the Interior (2007), “Fundamentals of the V-Modell” V-Modell XT 1.21, as
issued by the Federal Ministry of the Interior (BMI), viewed on 18th March 2005,
http://www.kbst.bund.de/cln_012/nn_945224/Content/Service/English/english__dokume
nts.html__nnn=true#doc839152bodyText3.
Volland, A. (2006), “Befragung zur Anwendung von Risikomanagement in Projekten,
Projekt Management und Qualitätssicherung“, Ergebnisse einer Umfrage von pmqs.de
durchgeführt im März 2006, PMQS, Rodgau, Germany.
Wagner, R. (2005), “Towards a global understanding of project management in
automotive industry”, Proceedings of the 19th IPMA World Congress, 13-16 November
2005, New Delhi, India.
Wagner, R. (2009), „Automotive project management – more lessons to learn!“, Project
Perspectives, The annual publication of International Project Management Association,
vol. XXXI, pp. 74-78.
Wagner, R. and Niebecker, K. (2008), “Die Collaborative Project Scorecard (CPS) als
zentrales Tool zur Steuerung unternehmensübergreifender Projekte“,
projektMANAGEMENT aktuell, 2nd edition, Nuernberg, Germany.
Wallace, L., Keil, M. and Rai, A. (2004), “How software project risk affects project
performance: an investigation of the dimensions of risk and an exploratory model”,
Decision Sciences, Vol. 35, Issue 2, pp. 289-321.
270
Walther, J. (1997), “Group and interpersonal effects in computer-mediated international
collaboration”, Human Communication Research, v. 23, pp. 342-369.
Warkentin, M. and Beranek, P. (1999), “Training to improve virtual team
communication”, Information Systems Journal, vol. 9, no 4, pp. 271-289.
Weaver, P. (2007), “The origins of modern project management” Proceedings of 4th
annual PMI College of Scheduling Conference, 15-18 April 2007, Mariott Pinnacle
Downtown, Vancouver, Canada.
Weinstein, I. (2004), “The business case for managed services for videoconferencing -
understanding the scope, benefits, and justification of managed service offerings”, white
paper, Wainhouse Research, November 2004.
Whitty, S., Schulz, M. (2007), “The impact of puritan ideology on aspects of project
management”, International Journal of Project Management, 25(1), p. 10-20.
Wiklund, H. and Wiklund, P. (2002), “Widening the six sigma concept: an approach to
improve organisational learning”, Total Quality Management, vol. 13, no. 2, pp. 233-239.
Wildemann, H. (2004a), “Entwicklungstrends in der Automobil- und Zuliefer-industrie –
Empirische Studie“, TCW, Muenchen, Germany.
Wildemann, H. (2004b), “Entwicklungspartnerschaften in der Automobil- und
Zulieferindustrie“, Ergebnisse einer Delphistudie, Germany.
Wolf, M., Mlekusch, R. and Hab, G. (2006), “PM-Live – Instrumente, Verfahren und
Kooperationen als Garanten des Projekterfolgs“, 6th edition, Expert, Renningen,
Germany.
Yin, R. (2002), “Case study research: design and methods”, Applied Social Research
Methods Series, 3rd edition, Sage Publications.
Zayed, T., Amer, M. and Pan. J. (2008), “Assessing risk and uncertainty inherent in
chinese highway projects using ahp”, International Journal of Project Management, Vol.
26, pp. 408-419.

271
Zimmermann, K. (2007), “Supply Chain Balanced Scorecard – Eine Fallstudie aus der
Automobilindustrie”, Supply Chain Management, vol 1. 2007, pp. 23-29.