Embed Size (px)
Citation preview

BC Ministry of Energy and Mines 79
CollaboraTive inTeragenCy waTer proJeCTs in briTisH Columbia: inTroduCTion To THe norTHeasT briTisH Columbia
aquiFer proJeCT and sTreamFlow modelling deCision supporT Tool
Dave Wilford1, Adrian S. Hickin2, Allan Chapman3, Jillian Kelly4, Ed P. Janicki2, Ben Kerr5, Chelton van Geloven6, Tarik Dessouki7, Katherine Henry8, Kirsten Heslop9, Dirk Kirste10, Marilyne
McCarville6, Kevin Ronneseth7, Matt Sakals1, Mike Wei7
AbstrActAllocation of water to domestic, agricultural and industrial uses that is mindful of environmental requirements requires knowledge of the surface and below-ground water resources. The allocation of water in northeastern British Columbia has recently become significant due to demands associated with the development of the unconventional shale gas resource through hydraulic fracturing.
To address the lack of surface water information in northeast British Columbia, a streamflow modelling project has been initiated to provide information to government agencies and water licence applicants. Groundwater aquifers in the Montney gas play area are being described using traditional and geophysical investigation techniques.
The projects involve provincial and federal government agencies, the British Columbia Oil and Gas Commission, Simon Fraser University, private well owners and the oil and gas industry. This paper provides an overview of these projects.
Wilford, D., Hickin, A.S., Chapman, A., Kelly, J., Janicki, E.P., Kerr, B., van Geloven, C., Dessouki, T., Henry, K., Heslop, K., Kirste, D., McCarville, M., Ronneseth, K., Sakals, M. and Wei, M. (2012): Collaborative interagency water projects in British Columbia: introduction to the Northeast British Columbia Aquifer Project and Streamflow Modelling Decision Support Tool; in Geoscience Reports 2012, British Columbia Ministry of Energy and Mines, pages 79-89.
1British Columbia Ministry of Forests, Lands and Natural Resource Operations, Smithers, British Columbia; [email protected]
2British Columbia Ministry of Energy and Mines, Victoria, British Columbia
3British Columbia Oil and Gas Commission, Victoria, British Columbia
4British Columbia Ministry of Environment, Nanaimo, British Columbia
5Foundry Spatial, Victoria, British Columbia
6British Columbia Ministry of Forests, Lands and Natural Resource Operations, Prince George, British Columbia
7British Columbia Ministry of Environment, Victoria, British Columbia
8Consultant, Dawson Creek, British Columbia
9British Columbia Ministry of Environment, Prince George, British Columbia
10Simon Fraser University, Burnaby, British Columbia
Key words: Water, Groundwater, Hydrogeology, Aquifer, Water wells, Observation wells, Montney gas play, Shale gas, Unconventional gas, Northeast British Columbia Aquifer Project, Hydrology Modelling and Decision-Support Tool, Groundbirch paleovalley

80 Geoscience Reports 2012
inTroduCTion
Water is a valued resource in British Columbia and there are a variety of stakeholders concerned with its sustainable use. The Northeast British Columbia Aquifer Project and Streamflow Modelling Decision Support Tool Project are two interagency collaborative initiatives directed at un-derstanding water source options for industrial, domestic, agricultural and environmental use in British Columbia’s traditional oil and gas development region. These projects are a collaboration of the British Columbia Ministry of Forests, Lands and Natural Resource Operations (FLNRO), the British Columbia Ministry of Environment (MoE), the British Columbia Ministry of Energy and Mines (MEM), the British Columbia Oil and Gas Commission (OGC), Si-mon Fraser University (SFU), Geoscience BC (GBC) and the Geological Survey of Canada (GSC).
Shale gas development is a substantial contributor to British Columbia’s energy inventory and development is increasing in the Horn River Basin, the Liard Basin, the Cordova Embayment and the Montney gas play area (Fig. 1). To develop this unconventional shale gas resource, gas wells are stimulated through hydraulic fracturing, whereby the relatively impermeable shale is fractured, providing a conduit for the gas to flow from the rock to the wellbore. Hydraulic fracturing requires substantial quantities of wa-ter (Johnson, 2012); therefore, secure water supplies could be a limiting factor in development. Industry, the public and various levels of government are seeking sufficient information to appropriately manage these resources. Two collaborative projects have been initiated to begin address-ing ground- and surface-water sustainability: the Northeast British Columbia Aquifer Project and the Streamflow Mod-elling Decision Support Tool.
Northeast British Columbia Aquifer Project
Surface Streamflow Modelling Decision Support Tool Project
!
!
!
!
!
!
!!
!
!
!
!
!
!
!
!
!
!
!
!
!
!
StudyArea
Liard Basin
Horn River Basin
Cordova Embayment
Montney PlayArea
Pe tit ot R ive r
P in e R ive r
L ia rdR
iv er
Ke
ch
ika
Riv
er
H ay R ive r
Be
at ton
Rive
r
C h inch a g a R ive r
Pro p he t R ive r
Ha
lfwa
yR
ive
r
Mu
sk
wa
Riv
er
Fin
lay
Riv
er
Fo
rtN
els
on
R ive r
F on ta s R ive r
W ap iti R iv er
Bea ve r R
ive r
S ika n ni C hie f R ive r
Co
al
Riv
er
Mu
r ray
Riv
er
Sm
ok
yR
ive
r
No
tik
ew
inR
ive
r
Hy
lan
dR
ive
rS
tikin
eR
ive
r
Liar d
Riv
er
Pe
ti to
tR
ive
r
Fort Nelson
Fort St. John
Dawson Creek
Figure 1. The Northeast British Columbia Aquifer Project is being conducted in the Dawson Creek area within the Montney gas play area (red box). The Streamflow Modelling Decision Sup-port Tool Project is being conducted across northeast British Columbia (purple polygon).

BC Ministry of Energy and Mines 81
norTHeasT briTisH Columbia aquiFer proJeCT
This project is in the process of exploring groundwater aquifers in the Montney gas play area from two different, but complementary, perspectives. One component of the project focuses on traditional groundwater investigations using groundwater wells to determine stratigraphy, water chemistry, water table elevations and fluctuations over time, and the hydraulic characteristics of aquifers. Each drilled well provides a one-dimensional view of aquifers. Interpo-lating between a series of wells allows for a more extensive description of an aquifer. The second component of the project investigates aquifers using geophysical techniques to delineate the geological units that define the aquifers. A series of lines are run across the landscape enabling a two-dimensional delineation of subsurface aquifers. Interpolat-ing between a series of lines allows for a three-dimensional description of the aquifers. Hydraulic characteristics of the aquifers and the subsurface calibration of the geophysics are determined using groundwater wells (this is where the two approaches are complementary—in fact, essential). The project includes four components: 1) a well water sur-vey, 2) expansion of the British Columbia Observation Well Network, 3) the geological framework of the Groundbirch paleovalley and 4) a groundwater level (GWL) interface data update. In the following sections, we introduce each of these components.
Water well survey
Basic water well information and water chemistry are essential for understanding groundwater systems. A survey of more than 100 water wells in the study area was initiated with the objective of having at least one sample well per 20 km2. The survey involved several steps: updating well records for the area, establishing contact with well owners and undertaking well sampling and measurement.
Well records for the area are not complete; in some cases information was lacking, whereas in other cases the wells had not been used. Where well logs were available, the information was not of consistent quality. These data are critical for understanding the hydrogeology of the area and were verified or added during discussions with well owners (depth of well, depth to water at time of drilling, geology and type of aquifer).
Establishing contact with the well owners was chal-lenging. Many individuals were only home at night, result-ing in long days for team members. Some individuals were suspicious of any research to do with their groundwater, whereas others had already participated in other well water sampling projects sponsored by the industry. As a result, a short brochure was prepared that explained the project and provided contact information (Fig. 2). In addition, a cover
letter was prepared, specifically requesting participation in the project and stressing that the source of any groundwater information would be kept confidential.
Figure 2. A three-panel public information brochure for the Northeast British Columbia Aquifer Project was distributed to land-owners within the study area.
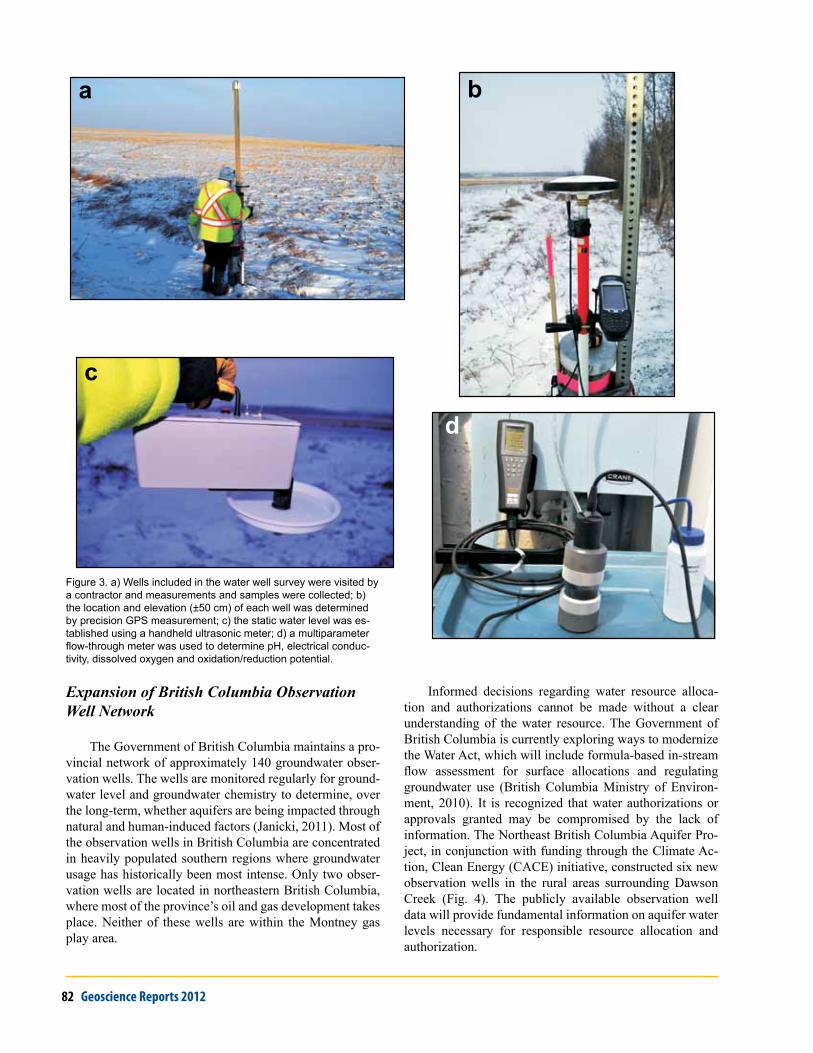
Fieldwork focused on the physical and chemical nature of water in each well (Fig. 3). Physical aspects included depth to groundwater using an ultrasonic meter (Ravensgate Sonic 200U Well Depth Sounder). The elevation of the well was established using a precision GPS unit (Magellan MobileMapper CX). A multiparameter flow-through meter (YSI Pro Plus) was used in the field to determine pH, elec-trical conductivity, dissolved oxygen and oxidation/reduc-tion potential. Samples were shipped to SFU and analyzed for anions, cations, isotopes, trace metals, alkalinity, total dissolved solids and nutrients. Given the scope of the pro-ject—to determine the physical aspects of aquifers in the study area—we are not sampling or analyzing for volatile organic compounds (VOCs, BTEX, i.e., benzene, toluene, ethylbenzene and xylenes). Well owners were asked a se-ries of questions related to level of use, historical water sampling, proximity to other water wells or oil and gas wells, land use around the well and if they were interested in potentially having their well pump tested/slug tested at a later date.
82 Geoscience Reports 2012
Expansion of British Columbia Observation Well Network
The Government of British Columbia maintains a pro-vincial network of approximately 140 groundwater obser-vation wells. The wells are monitored regularly for ground-water level and groundwater chemistry to determine, over the long-term, whether aquifers are being impacted through natural and human-induced factors (Janicki, 2011). Most of the observation wells in British Columbia are concentrated in heavily populated southern regions where groundwater usage has historically been most intense. Only two obser-vation wells are located in northeastern British Columbia, where most of the province’s oil and gas development takes place. Neither of these wells are within the Montney gas play area.
Informed decisions regarding water resource alloca-tion and authorizations cannot be made without a clear understanding of the water resource. The Government of British Columbia is currently exploring ways to modernize the Water Act, which will include formula-based in-stream flow assessment for surface allocations and regulating groundwater use (British Columbia Ministry of Environ-ment, 2010). It is recognized that water authorizations or approvals granted may be compromised by the lack of information. The Northeast British Columbia Aquifer Pro-ject, in conjunction with funding through the Climate Ac-tion, Clean Energy (CACE) initiative, constructed six new observation wells in the rural areas surrounding Dawson Creek (Fig. 4). The publicly available observation well data will provide fundamental information on aquifer water levels necessary for responsible resource allocation and authorization.
a b
c
d
Figure 3. a) Wells included in the water well survey were visited by a contractor and measurements and samples were collected; b) the location and elevation (±50 cm) of each well was determined by precision GPS measurement; c) the static water level was es-tablished using a handheld ultrasonic meter; d) a multiparameter flow-through meter was used to determine ph, electrical conduc-tivity, dissolved oxygen and oxidation/reduction potential.

BC Ministry of Energy and Mines 83
The six observation wells were constructed in Novem-ber 2011 and will be equipped with water-level monitoring equipment. Production capability and basic aquifer param-eters (transmissivity, hydraulic conductivity, etc.) will be determined during the upcoming field season. Water sam-ples will also be collected, analyzed and included with the water well survey (described above).
regional Hydrogeology
Mapping completed by the MoE (Berardinucci and Ronneseth, 2002) indicates the presence of several uncon-solidated aquifers of limited extent overlying more wide-spread bedrock aquifers. The unconsolidated aquifers are mapped as confined sand and gravel of glacial or preglacial age (Hickin and Best, 2012), whereas the bedrock aquifer is identified as the Kaskapau Formation of Upper Cretaceous age (Glass, 1990). At surface, and overlying the aquifers, is a thick layer of impermeable clay. Vulnerability of aquifers in the area has been classified as low to moderate using the British Columbia Ministry of Environment Aquifer Clas-sification System (Lowen, 2011). A review of water well records on the MoE website indicates that the likely source of groundwater for water wells in the study area is from bedrock aquifers, although the presence of suitable aquifer materials, such as gravel, is reported at shallower depths in some locations. The observation well drilling program included completing wells in both shallow unconsolidated
and deeper bedrock aquifers, depending on geological con-ditions.
loCaTion seleCTion
Six observation well locations were selected using the following criteria:• within the Montney play trend and in proximity to re-
cent shale gas activity;• within a vulnerable aquifer(s) as mapped by the MoE;• access along a British Columbia Ministry of Transpor-
tation and Infrastructure road rights-of-way;• south of the Peace River within a MoE priority area for
new observation wells;• a good chance of water production based on nearby
water well records;• reasonable depth to bedrock so that no individual well
would be overly expensive; and• establishment of three wells within a single aquifer so
groundwater flow and gradient can be determined.Figure 4 shows the location of the observation wells.
The observation well at location 6 was selected to test the aquifer potential of the Groundbirch paleovalley and was expected to be deeper than the other five observation wells (Hickin, 2011). This well had polyvinyl chloride (PVC) casing installed and was logged with downhole geophysical
6
2
3
5
4
1
Rice R
d.
Wanglar Rd.
Rd.275
Rd.271
Rd.269
Rd.261
Rd.255
Rd.212
Rd.267
Rd.265
Rd.214
Braden Rd.
Parkland Rd.
Rd. 216
Rd.245 R
d.243
Rd. 214
Rd. 212
Sweetwater RoadR
d.229
Rd.239
Rd.237
Rd.235
Rd.245A
Rd.227
Rd.225
Rd.223 R
d.221R
d.219R
d.217R
d.215R
d.213R
olla Rd.
Rd. 218
Rd. 220 Rd. 220
Triangle Rd.
Coldstream Creek Rd.
Highway 97
Hig
hway
52
Hig
hway
2
Alaska Highw
ay
Pouce Coupe
Dawson Creek
KISKATINAW RIVER
PINE RIVER
PEACE RIVER
DAWSON CREEK
DOE CREEK
CO
AL C
REE
K
SEPT
IMU
S C
REE
K
SHEEP CREEK
STEWART CREEK
TREM
BLAY
CRE
EK
WINDY CREEK
MURRAY RIVER
BUFFALO
CREEK
BISSETTE CREEK
TUP
PE
R R
IVE
R
FAVELS CREEK
CEN
TUR
ION
CR
EEK
SIX
MIL
E CREE
K
LIVINGSTONE CREEK
RAI
NFO
RD
CR
EEK
ROLLA CREEK
WALLACE CREEK
STEWART LAKE
TOMS LAKE
RAT LAKE
SUNDANCE LAKES
93P/16
93P/1593P/14
93P/0993P/1093P/11
94A/03 94A/02 94A/01
93P/13
93P/12
94A/04
590000
590000
605000
605000
620000
620000
635000
635000
650000
650000
665000
665000
680000
680000
6170
000
6170
000
6185
000
6185
000
6200
000
6200
000
6215
000
6215
000
BritishColumbia
Roads
Hwy_Freeway
Rail Line0 4,600 9,200 13,800 18,4002,300
Meters
Scale 1:250,000
Observation Well Site Locations
Figure 4. All of the new observation wells were constructed in the rural area around Dawson Creek.

84 Geoscience Reports 2012
instruments. The results will be correlated with a ground-based geophysical program designed to characterize the paleovalley (see below; Hickin and Best, 2012).
drilling and CompleTion
The six observation wells were drilled in late Novem-ber and early December 2011 using an air-rotary drilling rig (Fig. 5) with a casing hammer. Drilling began with either an auger or an oversized bit of 19 cm (7.5 in.; water-well drill-ing operations use Imperial units). After roughly 3 m (10 ft.) of penetration, steel casing was pounded into the ground with the casing hammer. Drill cuttings were collected from the end of a discharge hose every 3 m (10 ft.) and logged.
resulTs
All wells recovered water but locations 1, 4 and 6 were particularly productive, based on informal measurements using a stopwatch and a bucket. Location 3 was drilled considerably deeper than expected in order to intersect the water table. Only location 6, which was drilled within the interpreted Groundbirch paleovalley, encountered a small volume of groundwater in a gravel bed of indeterminate extent at roughly 40 m (130 ft.) of depth. In this same well, a more significant aquifer was intersected at the bedrock sediment interface at approximately 80 m.
All wells were screened in bedrock and were con-structed with a surface seal with a minimum of 4.5 m (ap-proximately 15 ft.) in length. Bedrock generally consists of weathered carbonaceous shale with interbeds of siltstone and fine-grained sandstone. Water is likely contained within both the thin sandstone interbeds and secondary pore space created by weathering and jointing.
Geological framework of the paleovalley
Delineation of the geological framework within the Groundbirch paleovalley will aid in modelling the hydro-geology of the unconsolidated aquifers within this feature. This will be achieved by integrating three geophysical surveys with other geological datasets. A downhole electro-magnetic and gamma survey was conducted in the recently drilled 85 m deep British Columbia observation well, con-structed with a nonconductive casing (location 6 described above; Fig. 4). The detailed geology provided from this well was used to calibrate the other surveys. A ground-based time-domain electromagnetic survey was conducted in February 2012 and a shallow seismic reflection survey is anticipated to be carried out in the spring of 2012. These surveys will provide 2D sections across the paleovalley. This information will be augmented with field data from
Figure 5. In November 2011, six new water observation wells were drilled along on road rights-of-way using an air rotary water well drilling rig with a casing hammer.
After bedrock was encountered, the remainder of the hole was drilled open-hole. After reaching total depth of the borehole, a 12.7 cm (5 in.) PVC liner was inserted from the bottom of the borehole to near the ground surface. The lowest 6–12 m (20–40 ft.) of the liner was screened or per-forated to allow inflow of groundwater. Approximately 75 cm (2.5 ft.) of steel casing remained above ground level as a ‘stick-up’ (Fig. 6). A MoE-issued well identification plate (Table 1, well plate number) was welded onto the side of each observation well casing. The well was then devel-oped and an approximate measurement of the well yield was made using a stopwatch and bucket. Several days after drilling and completing the construction of the observation wells, the total depth and static water level were measured using a wet tape (Heron Instruments dipper-T water tape). Observation wells 1–6 have been incorporated into the MoE observation well network database and assigned well tag numbers (WTN) and observation well numbers (Table 1).
Figure 6. Following completion, approximately 1.5 m of steel casing remained above ground to mark the well. The casing was tagged with a well number and a lock cap was installed.

BC Ministry of Energy and Mines 85
an exposure of the paleovalley succession along the Cold-stream River canyon, together with water well data from the MoE’s WELLS database, the latter of which houses British Columbia’s water well information (see Hickin and Best [2012] for details on this component of the project).
Groundwater level interface data update
British Columbia’s observation wells provide data on groundwater-level fluctuations and groundwater quality information on developed aquifers in British Columbia. Water-level data from observation wells are continuously collected via instrumentation in the well. The water-level data is referenced from ground level and the data is down-loaded by regional staff. Data are checked and validated for errors and omissions before being published and stored on the groundwater level (GWL) website.
Validated groundwater data collected from the Provin-cial Groundwater Observation Well Network are available in tabular, graphical and csv formats through the GWL pub-lic interface (https://a100.gov.bc.ca/pub/gwl/). Although the central database stores unvalidated data, it is not made available through the GWL public interface. The develop-ment of satellite telemetry equipment allows for the near–real-time upload of groundwater level data from across the province, potentially providing users with timely data on the condition of more than 55 aquifers throughout British Columbia. Unfortunately, near–real-time data from obser-vation wells retrofitted with satellite telemetry equipment cannot be displayed in the GWL because it is unvalidated and thus, is not available to the public. The GWL public interface is currently being updated to include validated and unvalidated data in its outputs using support from the British Columbia Ministry of Forests, Lands and Natural Resource Operations and the British Columbia Ministry of Environment. This will allow for improved management of groundwater resources and support the Government of Brit-ish Columbia’s open-data initiative.
Hydrology modelling and deCi-sion-supporT Tool developmenT For waTer alloCaTion, norTHeasT briTisH Columbia
The British Columbia Oil and Gas Commission (OGC), with support from Geoscience BC and the British Columbia Ministry of Forests, Lands and Natural Resource Operations, is undertaking a hydrology modelling project in northeast British Columbia. This project follows a pilot project undertaken in early 2011 by Chapman and Kerr (2011). The pilot project used available gridded climate data and land cover and vegetation data within the Horn River and Liard Basin gas play areas to model discharge in several watersheds. From the success of the pilot project, it was concluded that there is utility in pursuing a monthly water-balance modelling approach. The current project is now extending and fine-tuning the hydrology modelling to all of northeast British Columbia. The objective of the project is to complete overview hydrology modelling for northeast British Columbia and to produce a GIS-based decision-support tool, which would be used to provide estimates to guide water license applicants and short-term water-use approval decisions (British Columbia Water Act, Section (8) – Short Term Water Use).
Study area
This study encompasses the area of northeast British Columbia that includes the unconventional Montney gas play area, the Liard Basin, the Horn River Basin and the Cordova Embayment, from south of Dawson Creek to the Yukon and Northwest Territories boundary in the north, and east of the Rocky Mountains (Fig. 7). The total area in Brit-ish Columbia under study is approximately 175 500 km2.
The streamflow regime is typically nival (snowmelt dominated), with a sustained cold winter period character-ized by low rates of streamflow and competent river ice, followed by a spring freshet from approximately mid-April to late June, characterized by high rates of streamflow as the winter’s accumulated snow melts. After the spring
TABLE 1. GENERAL PARAMETERS FoR SIx NEW oBSERvATIoN WELLS.
* Well data can be accessed using the Well Tag Number at the link below:http://www.env.gov.bc.ca/wsd/plan_protect_sustain/groundwater/index.html
Well locations can be found on a map using Well Tag Numbers using the following link:http://webmaps.gov.bc.ca/imf5/imf.jsp?site=wrbc
Location Well Plate
Well Tag Easting Northing
Number Number* (NAD83) (metres) (feet) (metres) (feet) (metres) (feet) (metres) (feet) litres/second US gallons/minute (metres) (feet)
1 31673 104707 626795 6188502 31.7 104 6.1 20 ‐ ‐ 25.6‐31.7 84‐104 2.3 30 19.6 64
2 31674 104708 633333 6189602 25.6 84 13.7 45 ‐ ‐ 18.6‐24.7 61‐81 1.5 20 5.2 17
3 31676 104709 659162 6198993 91.4 300 18.3 60 ‐ ‐ 79.2‐91.4 260‐300 0.02 0.25 57.3 188
4 31677 104710 673846 6196989 65.6 84 8.5 28 ‐ ‐ 18.2‐24.4 60‐80 2.3 30 surface surface
5 31675 104711 664182 6187977 48.8 160 21.3 70 ‐ ‐ 42.7‐48.8 140‐160 0.4 5 19.2 63
6 31672 104712 628709 6180490 85.3 280 79.9 262 40.8 134 73.8‐79.9 242‐262 0.75 10 21.9 72
* Well data can be accessed using the Well Tag Number at the link below:http://www.env.gov.bc.ca/wsd/plan_protect_sustain/groundwater/index.htmlWell locations can be found on a map using Well Tag Numbers using the following link:http://webmaps.gov.bc.ca/imf5/imf.jsp?site=wrbc
Estimated Well Yield Table 1. General parametres for six new observation wells
Total Depth Depth to Bedrock Depth to Uphole Aquifer
Screened Interval Static water level below ground

86 Geoscience Reports 2012
10FA002
10FB00510ED009
10ED003
10ED007
10ED006
10ED004
10BE009
10BE007
10BE011
10BE010
10BE00410CD003
10CD001
10CD006
10CC001
10CC002
10CA001
10CD005
10CD004
10CB001
07FA00307FA005
07FC003
07FC002
07FA006
07FA001
07FB008
07FC001
07FD004
07FD009
07FD01307FD011
07FD001
07FD00707FD015
07FB01107FB001
07FB00207FB003
07FB004
07FB007 07FB005
07FB006 07FB009
07GD002
07GD001
07GD00307GD004
07GC001
07GC002
07JF004
07OA001 07OC001
07OB006
07OB004
CORDOVA
EMBAYMENT
HORN
RIVER
BASIN
LIARD
BASIN
MONTNEY
TREND
B R I T I S H
CO LUMB I A
A L B E R TA
Y U KON
NO R T HWE S T
T E R R I TO R I E S
GRANDE PRAIRIE
PEACE RIVER
HIGH LEVEL
ENTERPRISE
FORT PROVIDENCE
YELLOWKNIFE
FORT SIMPSON
FORT
NELSON
PINK
MOUNTAIN
HUDSON’S
HOPE
DAWSON
CREEK
FORT
ST. JOHN
HYDROLOGICAL MODELLING, NORTHEAST BC
07FA003 Water Survey of Canada Hydrometric Station
Community
River / Lake
Road
BC Unconventional Gas Play
0 40 80
kilometres
BC Albers, NAD 83
N
Study area
Figure 7. There are more than 55 hydrometric stations throughout northeast British Columbia and adjacent Northwest Territories and Alberta.

BC Ministry of Energy and Mines 87
freshet period, river levels generally recede slowly through the summer and autumn until the winter freeze. Frontal or convective storm systems bring varying amounts of rain from late spring to autumn, often resulting in temporary increases in river levels and discharge, and occasionally producing flooding (which is randomly distributed in the watersheds within the study area).
Data
The water balance model takes a ‘conservation of mass approach’ and follows a concept originally applied by Solo-mon et al. (1968) and Moore et al. (2011). Key inputs to the model for northeast British Columbia are monthly and annual precipitation and temperature grids from the Cli-mateWNA program (Wang et al., 2012), which are derived from the PRISM methodology (Daly et al., 2008); grid-ded evapotranspiration data produced by the Consultative Group for International Agricultural Research (CGIAR); land cover and vegetation mapping from Natural Resources Canada and the Province of British Columbia; and hydro-metric data from the Water Survey of Canada.
Actual evapotranspiration data produced by CGIAR modelling accounts for water availability using a modi-fied Hargreaves (Trabucco and Zomer, 2010) approach and takes climate inputs from the WorldClim database—a 1 km gridded climate surface representing the time period of 1950–2000 (Hijmans et al., 2005; Trabucco and Zomer, 2010). Within the CGIAR data, evapotranspiration is ad-justed according to soil moisture content factors and as-sumes agronomic land cover. Evapotranspiration values were obtained from several sources (Chapman, 1988, Spit-tlehouse, 1989; Liu et al., 2003; Barr et al., 2007) and were adjusted within the model.
Model calibration
Estimates of monthly and annual runoff were derived using the simple continuity equation: Q = P–ET, where Q = annual runoff (mm), P = annual precipitation (mm) and ET = annual evapotranspiration (mm). Exploratory spatial data analysis was a large component of this work, and as such the end result will be a product that represents the hydrol-ogy of northeast British Columbia as effectively as possible given available data.
The results of the annual runoff modelling were calibrated against hydrometric data collected by the Water Survey of Canada. A total of 55 hydrometric stations were selected for calibration. Not included were gauges on very large drainages (e.g., Peace River, Liard River), lake outlet stations or stations on drainages with manmade controls. The stations are located in British Columbia, western Al-berta and the southern Northwest Territories and in several
cases the watersheds cross provincial/territorial borders. Although the objective of this work was only to create es-timates for ungauged drainages in British Columbia, these transborder stations and stations wholly located in adjacent jurisdictions provided critical representation of portions of British Columbia that are ungauged.
Significant variability and error exists in the natural processes represented by all components of the model and the hydrometric data to which model results are compared. A multivariate regression technique was used to remove some modelling error. Results for the annual runoff mod-elling indicate a median error of 3.7%, with 78% of the calibration basins having estimates within ±20% of the measured mean annual runoff. A statistical model was then used based on a multivariate regression technique to dis-tribute the modeled annual runoff to individual months of the year. In general, the monthly runoff modelling is quite good, with hydrograph fits that are visually accurate (Fig. 8) and with reasonable statistics (median Nash-Sutcliffe ef-ficiency = 0.90, with 58% of the calibration basins having Nash-Sutcliffe efficiency statistics of greater than 0.90).
Project workshop
A workshop was held on January 11, 2012 to review and comment on the modelling approach and the proposed decision support tool. Participating in the workshop were scientists, managers and operational staff from provincial ministries (FLNRO, MEM and MoE), a federal ministry (Environment Canada–Water Survey of Canada), industry (Nexen, Esso and Conoco-Philips), Geoscience BC, FOR-REX, the OGC and academia (The University of British Columbia and University of Victoria). The objectives of the workshop were to receive scientific and operational input on the model and tool, gauge support for the approach in using the model and tool, and to communicate the project to stakeholders. This was a successful workshop with fully engaged discussion and constructive suggestions presented.
Summary
The hydrology modelling approach outlined in this paper is yielding consistent and reliable estimates of an-nual and monthly runoff for rivers in northeast British Columbia. The modelling is not yet complete and further enhancements based on workshop input are being tested. Included in the enhancement is the ability to locate a point of interest on a river and generate runoff data for that point based on the upstream watershed. This multipoint ability within a watershed will allow for point-specific identifica-tion of water availability. It is anticipated that the modelling will be completed by early 2012.

88 Geoscience Reports 2012
BeattonRiver –07FC001
Area: 16,059 km2
North Peace, BCAnnual Gauge1961-present
Box plot showsmonthly runoff (mm)
0
10
20
30
40
50
60
70
80
90
100
mm
07FC001
Mean
Model - stat adj
Model - final
Graham River –07FA005
Area: 2,139 km2
North Peace, BCAnnual Gauge1981-present
Box plot showsmonthly runoff (mm)
0
50
100
150
200
250
mm
07FA005
Mean
Model - stat adj
Model - final
Moberly River –07FB008
Area: 1,522 km2
South Peace, BCAnnual Gauge1980-present
Box plot showsmonthly runoff (mm)
0
20
40
60
80
100
120
140
160
mm
07FB008
Mean
Model - stat adj
Model - final
BougieCk –10CD004
Area: 334 km2
N. Rocky MtnFoothills,Muskwawshd., BCAnnual Gauge1981-present
Box plot showsmonthly runoff (mm)
0
20
40
60
80
100
120
140
160
180
200
mm
10CD004
Mean
Model - stat adj
Model - final
Steen River –07OB004
Area: 2,598 km2
NW AlbertaSeasonal Gauge (8 mo)1974-present
Box plot showsmonthly runoff (mm)
0
10
20
30
40
50
60
70
80
mm
07OB004
Mean
Model - stat adj
Model - final
Grayling River –10BE011
Area: 1,760 km2
Liard Basin, BCAnnual Gauge1983-1995
Box plot showsmonthly runoff (mm)
0
20
40
60
80
100
120
140
160
180
200
mm
10BE011
Mean
Model - stat adj
Model - final
Jan Feb Mar Apr May Jun Jul Aug Sep Oct Nov Dec
Jan Feb Mar Apr May Jun Jul Aug Sep Oct Nov Dec
Jan Feb Mar Apr May Jun Jul Aug Sep Oct Nov DecJan Feb Mar Apr May Jun Jul Aug Sep Oct Nov Dec
Jan Feb Mar Apr MayJun Jul Aug Sep Oct Nov Dec
Jan Feb Mar Apr MayJun Jul Aug Sep Oct Nov Dec
Figure 8. Several examples show how the modelled data fits the average monthly discharge measured at the hydrometric stations. The blue plots on the bottom left of each example show modelled precipitation (mm) and modelled actual evapotransporation (AET). The pie chart shows the proportion of each vegetation cover category within the watershed (the pie size is proportional to the table provided and is read from the 12 o’clock position clockwise).

BC Ministry of Energy and Mines 89
aCKnowledgmenTs
The projects described in this report have received funding from Geoscience BC; the British Columbia Minis-try of Forests, Lands and Natural Resource Operations; the British Columbia Ministry of Energy and Mines; the British Columbia Ministry of Environment; and the Oil and Gas Commission. Additional funding has been provided by the Climate Action, Clean Energy (CACE) Fund. The projects have benefitted from the cooperative approach shown by all participants and the principal authors thank everyone involved for their collaboration. Water wells were drilled by Cariboo Water Well Drilling Limited.
reFerenCes
Barr, A.G., Black, T.A., Hogg, E.G., Griffis, T.J., Morgenstern, K., Kljun, N., Theede, A. and Nesic, Z. (2007): Climatic con-trols on the carbon and water balances of a boreal aspen for-est, 1994–2003; Global Climate Biology, Volume 13, pages 561–576.
Berardinucci, J. and Ronneseth, K. (2002): Guide to using the BC aquifer classification maps for the protection and management of groundwater; British Columbia Ministry of Water, Land and Air Protection, 54 pages.
British Columbia Ministry of Environment (2010): British Co-lumbia’s Water Act modernization; policy proposal on British Columbia’s new Water Sustainability Act; British Columbia Ministry of Environment, 17 pages.
Chapman, A.R. (1988): The hydrology and hydrochemistry of three subarctic basins, South Indian Lake, Manitoba; MSc the-sis, Trent University, 234 pages.
Chapman, A. and Kerr, B. (2011): Development of a hydrology decision support tool; British Columbia Ministry of Energy and Mines, Unconventional Gas Technical Forum, April 6, 2011, Victoria, British Columbia, URL <http://www.empr.gov.bc.ca/OG/oilandgas/petroleumgeology/UnconventionalGas/Documents/2011Documents/A%20Chapman.pdf> [January 2012].
Daly, C., Halbleib, M., Smith, J.I., Gibson, W.P., Doggett, M.K., Taylor, G.H., Curtis, J. and Pasteris, P.P. (2008): Physiographi-cally sensitive mapping of climatological temperature and pre-cipitation across the conterminous United States; International Journal of Climatology, Volume 28, pages 2031–2064.
Glass, D.J., Editor (1990): Lexicon of Canadian Stratigraphy, Vol-ume 4, Western Canada, including Eastern British Columbia, Alberta, Saskatchewan and Southern Manitoba; Canadian So-ciety of Petroleum Geologists, 772 pages.
Hickin, A.S. (2011): Preliminary bedrock topography and drift thickness of the Montney gas play area; British Columbia Min-istry of Energy and Mines, Energy Open File 2011-1 and Geo-science BC, Report 2011-07, 2 maps, scale 1:500 000.
Hickin, A.S and Best, M.E. (2012): Stratigraphy and proposed geophysical survey of the Groundbirch paleovalley: a contribu-tion to the collaborative Northeast British Columbia Aquifer Project; in Geoscience Reports 2012, British Columbia Minis-try of Energy and Mines, pages 91-103.
Hijmans, R.J., Cameron, S.E., Parra, J.L., Jones, P.G. and Jarvis, A. (2005): Very high resolution interpolated climate surfaces for global land areas; International Journal of Climatology, Volume 25, pages 1965–1978.
Janicki, E.P. (2011): British Columbia observation well net-work—groundwater level graphs; British Columbia Ministry of Environment, Report 23556, 12 pages.
Johnson, E.G. and Johnson, L.A. (2012): Hydraulic fracture wa-ter usage in northeast British Columbia: location, volumes and trends; in Geoscience Reports 2012, British Columbia Ministry of Energy and Mines, pages 41-63.
Liu, J., Chen, J.M. and Cihlar, J. (2003): Mapping evapotranspi-ration based on remote sensing: an application to Canada’s landmass; Water Resources Research, Volume 39, pages 1189–1200.
Lowen, D. (2011): Aquifer classification mapping in the Peace River region for the Montney Water Project; Lowen Hydroge-ology Consulting Ltd., File 1026, 46 pages.
Moore, R.D., Trubilowicz, J. and Buttle J. (2011): Prediction of streamflow regime and annual runoff for ungauged ba-sins using a distributed water balance model; Journal of the American Water Resources Association, doi:10.1111/j.1752-1688.2011.00595.x.
Solomon, S.I., Denouvilliez, J.P., Chart, E.J., Wooley, J.A. and Cadou, C. (1968): The use of a square grid system for com-puter estimation of precipitation, temperature and runoff; Water Resources Research, Volume 4, pages 919–929.
Spittlehouse, D.L. (1989) Estimating evapotranspiration from land surfaces in British Columbia; in Estimation of Aerial Evapotranspiration, International Association of Hydrological Sciences, Publication 177, pages 245–253.
Trabucco, A. and Zomer, R.J. (2010): Global soil water balance geospatial database; Consultive Group on International Agri-cultural Research—Consortium for Spatial Information, pub-lished online, available from the CGIAR-CSI GeoPortal, URL <http://www.cgiar-csi.org> [January 2012].
Wang, T., Hamann, A., Spittlehouse, D. and Murdock, T. (2012): ClimateWNA—high-resolution spatial climate data for west-ern North America; Journal of Applied Meteorology and Cli-matology, Volume 51, no 1, pages 16–29.