Embed Size (px)
Citation preview

GDIS2017
Fracture Characterization of Advanced 980 MPa Steels
- collaborative project between Steel Marketing Development Institute, Honda
Research America, and University of Waterloo
Cliff Butcher Jim Dykeman
University of Waterloo Honda R&D America
#GDIS | #SteelMatters 2
Project Team Steel Marketing Development: Hesham Ezzat, Dave Anderson ArcelorMittal: Steve Lynes, Tim Lim AK Steel: Kavesary Raghavan Nucor: Dean Kanelos, Andy Thompson Honda Research of Americas: Jim Dykeman, Skye Malcolm University of Waterloo: PI’s: Mike Worswick, Cliff Butcher Research Team : Jose Imbert-Boyd Armin Abedini Kenneth Cheong Sante DiCecco Sam Kim Amir Zhumagulov Taamjeed Rahmaan Kaab Omer

#GDIS | #SteelMatters 3
Overview
Background
Objective
Study Materials
Fracture Test Methodology and Results
Component Testing
Conclusions

#GDIS | #SteelMatters 4
Background
Recent evolution of Advanced High Strength Steel
Common AHSS grades and their application areas

#GDIS | #SteelMatters 5
Background
Need for Grade Diversification at 980 Strength Level
Specialized grades now exist at
the 590 and 780 MPa strength
level. (dual phase, TRIP, etc).
Expand Grades at 980 MPa for
enhanced:
- bending
- flanging
- energy absorption
Expand Options at 980 MPa

#GDIS | #SteelMatters 6
Background
Microstructures of early DP980 not optimized for bending and edge stretch
These property limitations restricted the application of DP980.
Complex part shapes and features could not be formed.
Energy absorption targets could not be meet due to fracture problems.
CONV 980YL - Increasing Strain -
Fracture of martensite Void Growth Initial
Microstructure*
*Damage in dual phase steel DP1000 (Alharbi, K)

#GDIS | #SteelMatters 7
Objectives
1. Characterize properties of various Dual Phase 980 grades selected by
Steel Marketing Development Institute (Blind Study)
2. Investigate optimized fracture testing methodology for Advanced High
Strength Steel Industrial Friendly and Efficient Methods Required
3. Perform experimental axial and bend crush experiments and assess
fracture performance

#GDIS | #SteelMatters 8
Project Structure 1. Each Supplier Submits One DP980 to SMDI Sample Bank
2. Material identification removed:
Sent to UW and Honda for Fracture Characterization from Coupons to Crash

#GDIS | #SteelMatters 9
Study Materials: Composition 980 #1
SMDI Grades Thickness (mm) Type General Composition Coating
980 Mat#1 1.2 Dual Phase C-Mn-Si Bare
980 Mat#1 1.6 Dual Phase C-Mn-Cr-Mo-Nb Zinc
980 Mat#3 1.4 Dual Phase C-Mn-Si Zinc
980 #2 980 #3
Grades represent recent optimization in processing / chemistry (but are not Gen 3 level)
Materials can generally be described as DP with fine, uniform microstructure.

#GDIS | #SteelMatters 10
Study Materials: Tensile Properties
0
100
200
300
400
500
600
700
800
900
1000
1100
1200
0.00 0.02 0.04 0.06 0.08 0.10 0.12 0.14 0.16
En
gin
eeri
ng S
tres
s (M
Pa)
Engineering Strain
SMDI MAT#1
SMDI MAT#2
SMDI MAT#3
Grade TS
(MPa)
YS
(MPa)
YS/TS
Ratio
TE
(%)
#1 L 1046 806 0.81 12.7
T 1067 787 0.74 13.5
#2 L 971 912 0.94 12.9
T 998 934 0.94 12.0
#3 L 989 776 0.78 13.8
T 1012 757 0.75 13.0
Tensile Properties - JIS Test Specimen
All grades exhibited total elongation typical of 980 level material.
Relatively high YS/TS ratios suggested all grades favor local formability.
Material #2 had unique yield point elongation behavior.

#GDIS | #SteelMatters 11
0
10
20
30
40
50
60
70
80
90
100
110
120
DP980 -
Material 1
DP980 -
Material 2
DP980 -
Material 3
JAC 980Y
Ben
d A
ng
le ( )
-V
DA
Met
ho
d
Local Ductility Properties - Hole Expansion and Bendability
Grade Hole Expansion (punched) (%)
Bend (VDA Angle)
#1 L
36 105°
T 95°
#2 L
44 102°
T 90°
#3 L
39 110°
T 95°
Performance of these grades is consistent with or above current commercial products.
VDA bend data is of growing industrial importance as means to evaluate material.
The potential use of the VDA test for fracture prediction will be elaborated on in next section
SMDI DP980’s

#GDIS | #SteelMatters 12
Characterization for Formability & Fracture
1) Material characterization at large strains and strain rates
2) Efficient method to determine forming limit strains (FLD) (Global formability)
3) Characterization in tight radius bending (Local formability/fracture)
4) Establish best practices and tests for experimental fracture characterization
*Extensive numerical characterization study pursued in tandem
Priority Focus Areas

#GDIS | #SteelMatters 13
1. Material Characterization at Large Strains
• Limited hardening data
available in tensile tests
• Inverse FE modeling used to
identify hardening at large
strains for fracture
• Hardening data becomes a
function of numerical model
assumptions... 0
200
400
600
800
1000
1200
1400
1600
0.00 0.10 0.20 0.30 0.40 0.50 0.60 0.70 0.80
Eq
uiv
ale
nt
Str
ess
(M
Pa)
Equivalent Plastic Strain
Experiment: Tension
DP980 - Material 1Transverse Direction
What is stress
level at fracture?

#GDIS | #SteelMatters 14
0
200
400
600
800
1000
1200
1400
1600
0.00 0.10 0.20 0.30 0.40 0.50 0.60 0.70 0.80
Eq
uiv
ale
nt
Str
ess
(M
Pa
)Equivalent Plastic Strain
Experiment: Converted Shear
Experiment: Tension
Holloman Model
DP980 - Material 1Transverse Direction
0.074
(MPa) 1392 p
1. Material Characterization at Large Strains
• UW developed simple method to
use tensile & shear test data to
obtain hardening to large strain
levels
• DP980 data to 60% strain!
• Not related to FE model
Methodology in Rahmaan, T., et al.,
Int. J. Impact. Eng., 2017 (in-press)
#GDIS | #SteelMatters 15
800
900
1000
1100
1200
1300
1400
0 0.02 0.04 0.06 0.08 0.1E
qu
ivale
nt
Str
ess
(M
Pa)
Eq. Plastic Strain
Exp. 0.001 s-1 Exp. 10 s-1 Exp. 100 s-1
Exp. 1000 s-1 Model: 0.001 s-1 Model: 0.10 s-1
Model: 1 s-1 Model: 10 s-1 Model: 100 s-1
Model: 1000 s-1
1000 s-1
0.001 s-1
DP980 - Material 1: Transverse Direction
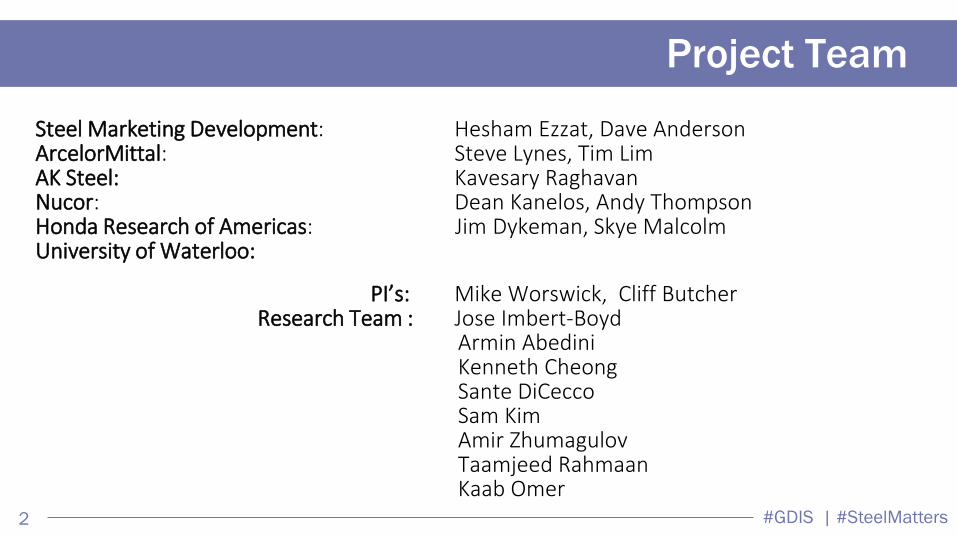
1. Material Characterization at Large Strains and Strain Rates
• Tensile characterization from
0.001 to 1000 s-1
• Scale quasi-static data obtained
to large strains for strain rates
• Efficient experimental method for
constitutive characterization
,p p QS pF

#GDIS | #SteelMatters 16
1. Material Characterization at Large Strains and Strain Rates
0
200
400
600
800
1000
1200
0.00 0.02 0.04 0.06 0.08 0.10 0.12 0.14
En
gin
eerin
g S
tress
(M
Pa
)
Engineering Strain
Experiment Average
Mesh Size: 0.1 mm
DP980 - Material 1: TD JIS Tensile Test
0
200
400
600
800
1000
0.00 0.10 0.20 0.30 0.40 0.50 0.60 0.70 0.80
Sh
ea
r S
tress
(M
Pa
)
von Mises Eq. Strain
Experiment Average
Mesh Size: 0.1 mm
DP980 - Material 1: 45 Shear Test
FE Simulations using Experimental Hardening Model and Von Mises Perform Well: Efficient

#GDIS | #SteelMatters 17
2. Global Formability – FLD Methodology
Physically-motivated FLD detection methods are needed
ISO 12004-2 Standard Method
Curve fitting of strain distributions
(arbitrary, little physical foundation)
UW Curvature Method: “Digital Finger Test” –
Detects surface discontinuity
(DiCecco et al., Exp. Mechanics. Submitted)

#GDIS | #SteelMatters 18
2. Forming Limits
Curvature provides physical upper limit
0.00
0.10
0.20
0.30
0.40
0.50
-0.20 -0.10 0.00 0.10 0.20 0.30 0.40 0.50
Majo
r T
ru
e S
train
Minor True Strain
Material: Mat 1 (TD)Thickness: 1.2 mm
Punch Speed: 0.25 mm/s
UW
Curvature
Method
Standard Method
ISO12004:2-2008
0.00
0.05
0.10
0.15
0.20
0.25
0.30
0.35
0.40
0.45
0.50
-0.20 -0.10 0.00 0.10 0.20 0.30 0.40 0.50
Majo
r T
ru
e S
train
Minor True Strain
FLD Method: UW Curvature
Mat #1: t = 1.2 mm
Mat #2: t = 1.6 mm
Mat #3: t = 1.4 mm
Comparable FLDs for Three Grades
Plane Strain Forming Limit ~ 11-14%
#GDIS | #SteelMatters 19
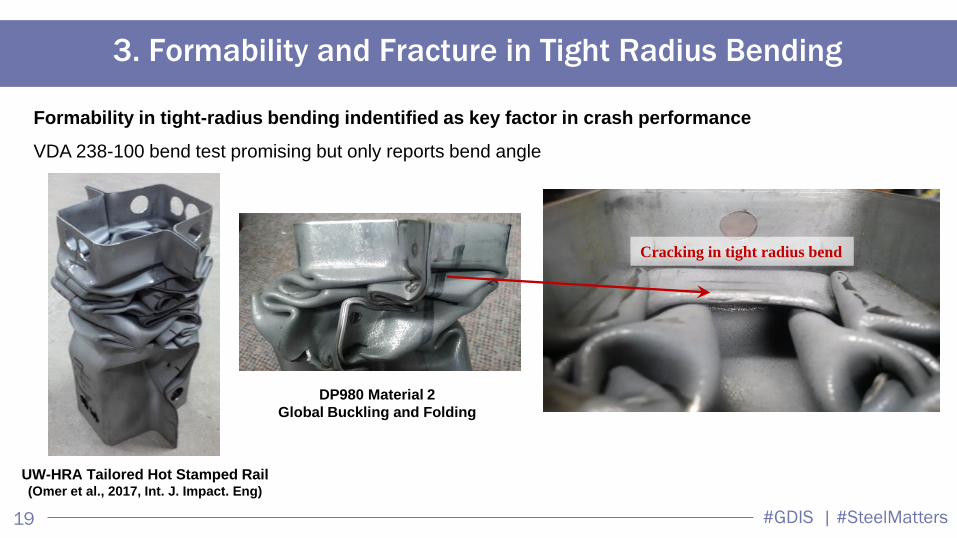
Formability in tight-radius bending indentified as key factor in crash performance
VDA 238-100 bend test promising but only reports bend angle
3. Formability and Fracture in Tight Radius Bending
UW-HRA Tailored Hot Stamped Rail (Omer et al., 2017, Int. J. Impact. Eng)
Cracking in tight radius bend
DP980 Material 2
Global Buckling and Folding

#GDIS | #SteelMatters 20
Optical VDA238-100 Test Frame
UW & HRA Developed an Inverted Bend Test for Optimal DIC Strain Measurement (IDDRG Conf., 2017)
Initial Position Full Stroke
Sufficient space for DIC access
UW’s VDA238 configuration with DIC
Punch is stationary
Rollers move down
Measure Fracture Strain & Bend Angle!

#GDIS | #SteelMatters 21
V-Bending with DIC
Measures width of specimen ( res. < 0.02 mm/pixel)
Homogeneous Strain Distribution along Width
0
1000
2000
3000
4000
5000
6000
7000
8000
0.00 0.10 0.20 0.30 0.40 0.50 0.60 0.70 0.80Lo
ad (
N)
Major True Strain
Sample 1
Sample 2
Sample 3
Sample 4
Sample 5
Sample 6
VDA
Load Drop 1
DP980: Material 2 - TD
Load vs Major Strain (Ex: 980 Mat#2)
Detect fracture using Load drop (VDA) or visual cracking
#GDIS | #SteelMatters 22
0
0.1
0.2
0.3
0.4
0.5
0.6
0.7
0.8
-0.06 -0.04 -0.02 0.00 0.02 0.04 0.06
Ma
jor
Tru
e S
tra
in
Minor True Strain
Sample 1
Sample 2
Sample 3
Sample 4
Sample 5
Sample 6
VDA
Load Drop - 1%
DP980: Material 2 - TD
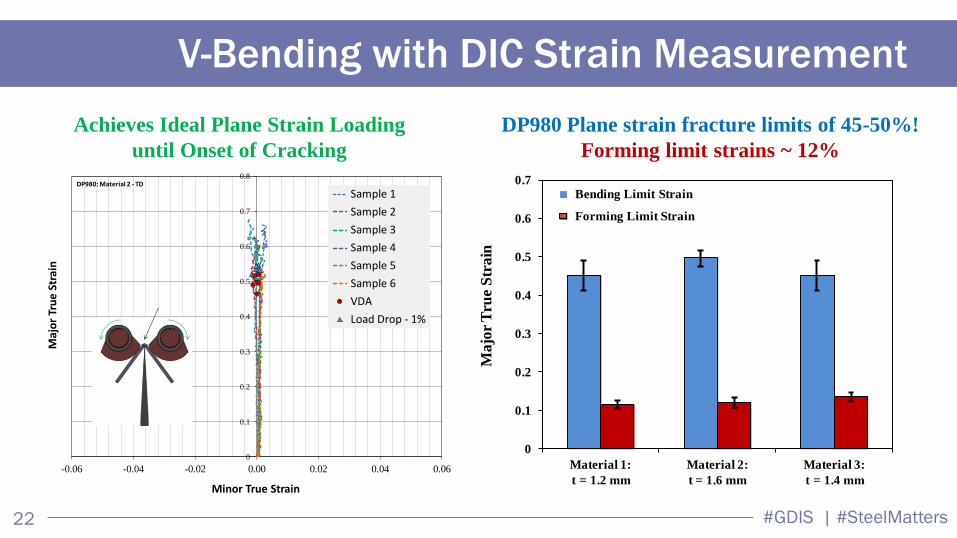
V-Bending with DIC Strain Measurement
Achieves Ideal Plane Strain Loading
until Onset of Cracking
Initial Position Full Stroke
Sufficient space for DIC access
DP980 Plane strain fracture limits of 45-50%!
Forming limit strains ~ 12%
0
0.1
0.2
0.3
0.4
0.5
0.6
0.7
Material 1:
t = 1.2 mm
Material 2:
t = 1.6 mm
Material 3:
t = 1.4 mmM
ajo
r T
rue
Str
ain
Bending Limit Strain
Forming Limit Strain

#GDIS | #SteelMatters 23
Comparison of V-Bend with Plane Strain Notch
0
0.1
0.2
0.3
0.4
0.5
0.6
0.7
-0.06 -0.04 -0.02 0.00 0.02 0.04 0.06
Ma
jor
Tru
e S
trai
n
Minor True Strain
Traditional Plane Strain
Notch Tensile Sample
V-Bend with DIC
Disagreement between tests: Notch test is lower…

#GDIS | #SteelMatters 24
Comparison of V-Bend with Plane Strain Notch
0
0.1
0.2
0.3
0.4
0.5
0.6
0.7
-0.06 -0.04 -0.02 0.00 0.02 0.04 0.06
Ma
jor
Tru
e S
trai
n
Minor True Strain
Traditional Plane Strain
Notch Tensile Sample
V-Bend with DIC
But a thickness correction on the notch resolves the difference
Conventional DIC
techniques struggle to
capture final thinning
during necking-based
failure .
Thickness measurement of Cross-Section

#GDIS | #SteelMatters 25
Comparison of V-Bend with Plane Strain Notch
0
0.1
0.2
0.3
0.4
0.5
0.6
0.7
Material 1:
t = 1.2 mm
Material 2:
t = 1.6 mm
Material 3:
t = 1.4 mm
Ma
jor
Tru
e S
tra
in
V-Bend
Plane Strain Notch: DIC + Thinning
Plane Strain Notch: DIC
Plane Strain notch provides lower bound estimate if thinning correction performed
Correction also required for plane strain dome tests
Optical V-Bend Test is Superior
1. No necking
2. Minimal to No Machining
3. Ideal plane strain loading
4. Efficient – low time per test
#GDIS | #SteelMatters 26
0.0
0.1
0.2
0.3
0.4
0.5
0.6
0.7
0.8
0.9
1.0
Hole Expansion JIS Tensile:
DIC
JIS Tensile:
DIC + Thinning
Method
JIS Tensile:
Area Measurement
Ma
jor
Tru
e S
tra
in
Material 1: DP980-TD
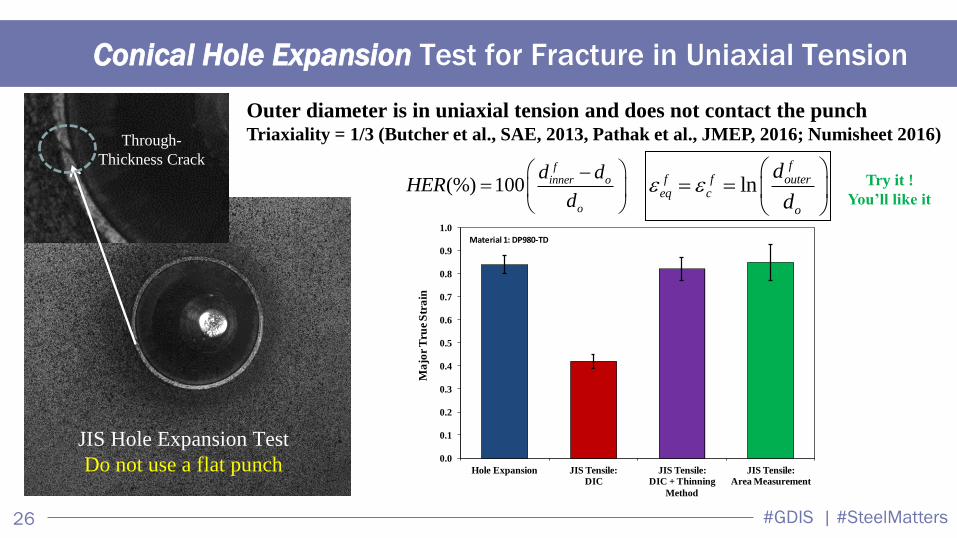
Conical Hole Expansion Test for Fracture in Uniaxial Tension
*Punch appears off-center due to the
alignment of camera.
Through-
Thickness Crack
JIS Hole Expansion Test
Do not use a flat punch
Outer diameter is in uniaxial tension and does not contact the punch Triaxiality = 1/3 (Butcher et al., SAE, 2013, Pathak et al., JMEP, 2016; Numisheet 2016)
(%) 100f
inner o
o
d dHER
d
ln
ff f outer
eq c
o
d
d
Try it !
You’ll like it

#GDIS | #SteelMatters 27
4. Fracture Characterization: 10 Test Geometries
3 Nakazima Dome Tests:
Uniaxial, Plane Strain & Biaxial
** Plane Strain **
** (V bend) **
Shear
(Mini Shear)
Intermediary Strain (3 Notch Tensiles)
Uniaxial Tension
(Hole Expansion, JIS Tensile)
FLD

#GDIS | #SteelMatters 28
4. Fracture Characterization Results
0
0.1
0.2
0.3
0.4
0.5
0.6
0.7
0.8
0.9
1
-0.7 -0.5 -0.3 -0.1 0.1 0.3 0.5
Ma
jor
Str
ain
Minor Strain
JIS
Mini-shear Smooth
Notch
Tight
Notch
Uniaxial
Dome
Plane Strain
Dome
Biaxial Dome
Plane Strain
Notch
V-bend (Plane strain) ( 0, 0.45 )
Hole Expansion (Uniaxial tension)
( -0.44, 0.87)
• Conflicting limits provided by different specimen types if thinning correction not applied
Min. of 4 Tests can describe
the fracture locus
Four Relatively Simple Tests:
1. Mini-shear
2. Hole expansion (reamed)
3. V-Bend
4. Biaxial/Bulge

#GDIS | #SteelMatters 29
4. Experimental Fracture Locus
Four tests can be used to generate physically-meaningful fracture loci
Not the product of a simulation exercise – Real material performance can be assessed
• Relatively comparable fracture loci
• Mat 2 had the lowest hardening rate,
highest hole expansion and v-bend
0.00
0.20
0.40
0.60
0.80
1.00
1.20
-0.10 0.00 0.10 0.20 0.30 0.40 0.50 0.60 0.70
Eq
. P
last
ic S
train
Stress Triaxiality
Experimental Fracture Loci: UW ModelDP980 - Transverse Direction
Material 2
Material 1
Material 3

#GDIS | #SteelMatters 30
0.0
0.2
0.4
0.6
0.8
1.0
1.2
1.4
-0.10 0.00 0.10 0.20 0.30 0.40 0.50 0.60 0.70
Eq
. P
last
ic S
tra
in
Stress Triaxiality
Experimental Fracture Loci: DP980 - Material 1: TD
0.0
0.2
0.4
0.6
0.8
1.0
1.2
1.4
-0.10 0.00 0.10 0.20 0.30 0.40 0.50 0.60 0.70
Eq
. P
last
ic S
tra
in
Stress Triaxiality
Experimental Fracture Loci: DP980 - Material 1: TD
4. Experimental Fracture Locus with Edge Effects
Sheared Edge Failure is a Uniaxial Tensile Mode:
Use Punched Hole Expansion Tests to Obtain Uniaxial Failure Strain with Sheared Edge
0
20
40
60
80
100
120
140
160
180
Material 1 Material 2 Material 3
Hole
Exp
an
sion
Rati
o (%
)
Machined Edge
Sheared Edge: 12% Clearance
DP980
Ideal Edge Condition
Sheared Edge Condition
Strong Edge Sensitivity Across Range of Tensile-Loadings
Sheared
Hole
Expansion
#GDIS | #SteelMatters 31
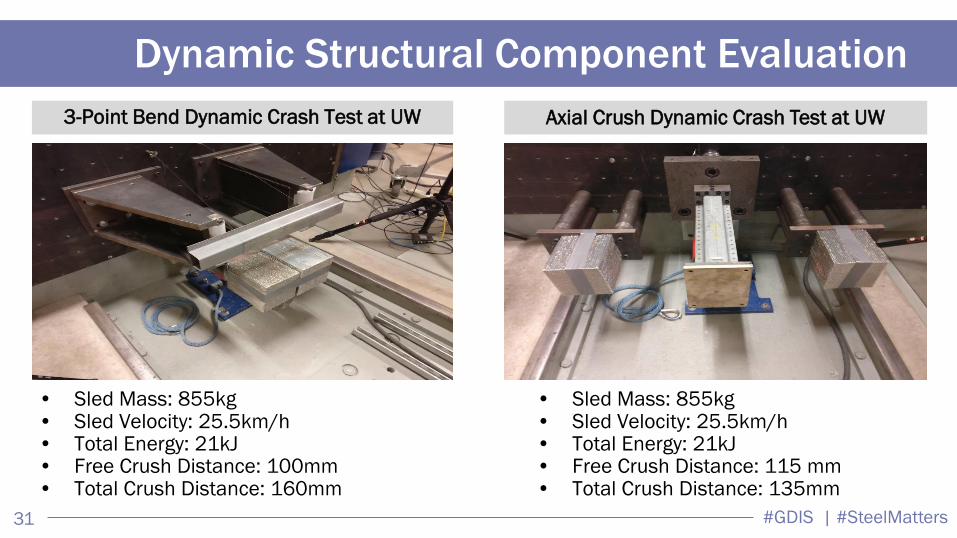
Dynamic Structural Component Evaluation
3-Point Bend Dynamic Crash Test at UW
• Sled Mass: 855kg • Sled Velocity: 25.5km/h • Total Energy: 21kJ • Free Crush Distance: 100mm • Total Crush Distance: 160mm
Axial Crush Dynamic Crash Test at UW
• Sled Mass: 855kg • Sled Velocity: 25.5km/h • Total Energy: 21kJ • Free Crush Distance: 115 mm • Total Crush Distance: 135mm

#GDIS | #SteelMatters 32
Dynamic 3-Point Bend Test at UW

#GDIS | #SteelMatters 33
Dynamic 3-Point Bend Test Results
980 #1 980 #2
980 #3
Minimal Cracking for the 3 Grades

#GDIS | #SteelMatters 34
Dynamic 3-Point Bend Test Results: Mat. 2
Minor cracking not detected in load response 980 #2
0
0.2
0.4
0.6
0.8
1
1.2
1.4
1.6
1.8
0
5
10
15
20
25
30
35
0 0.02 0.04 0.06 0.08 0.1
Ene
rgy
Ab
sorb
ed
[kJ]
Forc
e [k
N]
Displacement [m]
DP980 - Material 2
T1
T2
T3
Average

#GDIS | #SteelMatters 35
Dynamic Axial Crush Test: Material 1
Material #1: t = 1.2 mm

#GDIS | #SteelMatters 36
Dynamic Axial Crush Test: Material 3
Material #3: t = 1.4 mm

#GDIS | #SteelMatters 37
Dynamic Axial Crush Test: Material 3
0
2
4
6
8
10
12
14
16
18
20
0
20
40
60
80
100
120
140
160
180
0 0.05 0.1 0.15 0.2
Ene
rgy
Ab
sorb
ed
[kJ]
Forc
e [k
N]
Displacement [m]
Mat 3: Dynamic Axial Crush
T1T2T3T4Average
First
Fold
Second
Fold
Lateral
fold

#GDIS | #SteelMatters 38
Dynamic Axial Crush Test Results
Material #1: t = 1.2 mm Material #2: t = 1.6 mm Material #3: t = 1.4 mm
Relatively Good
Performance for 3 Grades
Repeatable Energy
Absorption
Material 3 had highest
spot weld strength and
strain rate sensitivity
#GDIS | #SteelMatters 39
Conclusions
Efficient and Accurate Experimental Methodologies Established for Characterization
of AHSS
1. Method to experimentally obtain hardening to large strains and strain rates
2. New FLD detection algorithm: Curvature-based
3. Optical V-Bend developed: Ideal plane strain test
4. Four tests required to efficiently obtain fracture locus for a material
As with FLD’s, Use 4 Industrially Friendly Tests to Construct Fracture Locus to
Compare Material Performance Accounts for Edge Condition
New model to use four tests for rapid FE model implementation Next GDIS

#GDIS | #SteelMatters 40
For More Information
Jim Dykeman
Honda Research America
Cliff Butcher
University of Waterloo