Embed Size (px)
Citation preview
WHO/BS/2011.2175
ENGLISH ONLY
EXPERT COMMITTEE ON BIOLOGICAL STANDARDIZATION
Geneva, 17-21 October 2011
Collaborative Study to Establish a World Health Organization
International Standard for Hepatitis E Virus RNA for Nucleic Acid
Amplification Technology (NAT)-Based Assays
Sally A. Baylis
1, Saeko Mizusawa
2, Yoshiaki Okada
2, Kay-Martin O. Hanschmann
1
1Paul-Ehrlich-Institut,
Paul-Ehrlich-Strasse 51-59, D 63225 Langen, Germany 2National Institute of Infectious Diseases,
4-7-1, Gakuen, Musashimurayama, Tokyo 208-0011, Japan
© World Health Organization 2011 All rights reserved. Publications of the World Health Organization are available on the WHO web site (www.who.int)
or can be purchased from WHO Press, World Health Organization, 20 Avenue Appia, 1211 Geneva 27, Switzerland (tel.:
+41 22 791 3264; fax: +41 22 791 4857; e-mail: [email protected]).
Requests for permission to reproduce or translate WHO publications – whether for sale or for noncommercial distribution –
should be addressed to WHO Press through the WHO web site:
(http://www.who.int/about/licensing/copyright_form/en/index.html).
The designations employed and the presentation of the material in this publication do not imply the expression of any
opinion whatsoever on the part of the World Health Organization concerning the legal status of any country, territory, city
or area or of its authorities, or concerning the delimitation of its frontiers or boundaries. Dotted lines on maps represent
approximate border lines for which there may not yet be full agreement.
The mention of specific companies or of certain manufacturers’ products does not imply that they are endorsed or
recommended by the World Health Organization in preference to others of a similar nature that are not mentioned. Errors
and omissions excepted, the names of proprietary products are distinguished by initial capital letters.
All reasonable precautions have been taken by the World Health Organization to verify the information contained in
this publication. However, the published material is being distributed without warranty of any kind, either expressed or
implied. The responsibility for the interpretation and use of the material lies with the reader. In no event shall the World
Health Organization be liable for damages arising from its use. The named authors alone are responsible for the views
expressed in this publication.

WHO/BS/2011.2175
Page 2
Summary The aim of the collaborative study was to evaluate candidate standards for hepatitis E virus
(HEV) RNA for use in nucleic acid amplification technology (NAT)-based assays. The candidate
standards consisted of lyophilized preparations of genotype 3a and genotype 3b HEV strains,
obtained from blood donors, diluted in human plasma. The genotype 3a HEV strain has been
developed as the candidate World Health Organization International Standard and the genotype
3b strain has been developed as the candidate Japanese National Standard. Coded duplicate
samples of the two virus strains were distributed to the participating laboratories; genotype 3a
HEV (Sample 1 and Sample 2) and genotype 3b HEV (Sample 3 and Sample 4). Each laboratory
assayed the samples on 4 separate occasions and the data were collated and analyzed at the Paul-
Ehrlich-Institut. Twenty-four laboratories from 10 countries participated in the study. Data were
returned by twenty-three laboratories using both qualitative and quantitative assays. All assays
were able to detect both candidate standards. It is proposed that the genotype 3a strain be
established as the 1st International Standard for HEV RNA with a unitage of
250,000International Units per ml. On-going real-time and accelerated stability studies of the
proposed International Standard are in progress.
Introduction Hepatitis E virus (HEV) is a non-enveloped single stranded RNA virus belonging to the
Hepeviridae family (Purcell and Emerson, 2008; Meng, 2010). In developing countries HEV is a
major cause of acute hepatitis, transmitted by the faecal-oral route and associated with
contamination of drinking water. In industrialized countries, HEV infection is being more
frequently reported and whilst some cases are imported after travel to endemic areas,
autochthonous cases are also increasing and infection with HEV appears more prevalent than
originally believed (Ijaz et al., 2009). Prospects for control of HEV infection are encouraged by
recent efforts in vaccine development (Shrestha et al., 2007; Zhu et al., 2010). Four main
genotypes, representing a single serotype, of HEV infect humans. Genotype 1 viruses are found
mainly in Africa and Asia and genotype 2 in Africa and Central America. Genotype 3 and 4
viruses are generally less pathogenic, although some exceptions have been reported, particularly
for genotype 4; these genotypes infect not only humans, but also animals including swine, wild
boar and deer. While genotype 4 strains are restricted to parts of Asia, genotype 3 viruses are
found throughout the world. Zoonotic transmission of HEV occurs, either by consumption of
contaminated meat and meat products, or by contact with infected animals (Purcell and Emerson,
2010). An alternative route of transmission is by transfusion of blood components with reports
from several different countries including, for example, the UK, France and Japan (Boxall et al.,
2006; Colson et al., 2007; Matsubayashi et al, 2004; Matsubayashi et al., 2008). Studies in Japan
and China have identified acute HEV infections in blood donors confirmed by the detection of
HEV RNA (Guo et al., 2010; Sakata et al., 2008).
It is now recognized that, in some countries at least, HEV infection is underreported, and where
other causes of acute hepatitis have been excluded, HEV infection should be considered (Waar et
al., 2005). The diagnosis of HEV infection is based upon the detection of specific antibodies
(IgM and IgG), however there are issues concerning the sensitivity and specificity of these
assays (Bendall et al., 2010; Drobeniuc et al., 2010). Analysis of HEV RNA using nucleic acid
amplification techniques (NAT) is also used for diagnosis and can identify active infection and
help to confirm serological results (Huang et al., 2010).
Infection with HEV may be particularly severe during pregnancy and in individuals with existing
liver disease. Chronic HEV infection is an emerging problem amongst solid organ transplant
recipients (Kamar et al., 2008; Legrand-Abravanel et al., 2010). In chronically infected patients,
viral loads are monitored to investigate the efficacy of antiviral treatment (Haagsma et al., 2010;
WHO/BS/2011.2175
Page 3
Kamar et al, 2010a; Kamar et al., 2010b) and effects of reduction of immunosuppressive therapy
(Kamar et al., 2010c).
Several NAT assays have been reported for the detection of HEV RNA in serum and plasma or
faecal samples, including conventional reverse transcriptase polymerase chain reaction (RT-
PCR) as well as real-time RT-PCR, and reverse transcription-loop-mediated isothermal
amplification (Lan et al., 2009). The NAT tests include generic assays developed for the
detection of HEV genotypes 1-4 (Jothikumar et al., 2006; Gyarmati et al., 2007). A recent study
organized by the Paul-Ehrlich-Institut (PEI) on behalf of the World Health Organization (WHO),
investigated the performance of HEV NAT assays in an international study (Baylis et al., 2011).
Dilution panels of different HEV strains were blinded and tested by laboratories with experience
in detection of HEV RNA. The results of the study demonstrated wide variations in assay
sensitivity (100-1000 fold, for the majority of assays). The proposal by the PEI to prepare a
standard for HEV RNA for use in NAT-based assays was endorsed by the WHO Expert
Committee on Biological standardization (ECBS) in 2009 (WHO/BS/09.2126) and following the
initial study, two virus strains were selected for further development as a candidate International
Standard for the WHO and a candidate Japanese National Standard in collaboration with the
National Institute of Infectious Diseases (NIID) in Japan. The viral strains being developed as
standards are genotype 3a and 3b HEV strains, which were equally well detected in the initial
study and belong to genotype 3 which is widely distributed. The strains are both derived from
blood donors with sufficient titres of HEV RNA to prepare standards of good potency. The aim
of the present study is to establish the respective standards and demonstrate their suitability for
use, evaluate the potency and assign an internationally agreed unitage.
Preparation of bulk materials After the initial proficiency/strain evaluation study (Baylis et al., 2011), two HEV strains were
selected for the preparation of the candidate WHO International Standard and the candidate
Japanese National Standard. The samples were kindly provided by Keiji Matsubayashi from the
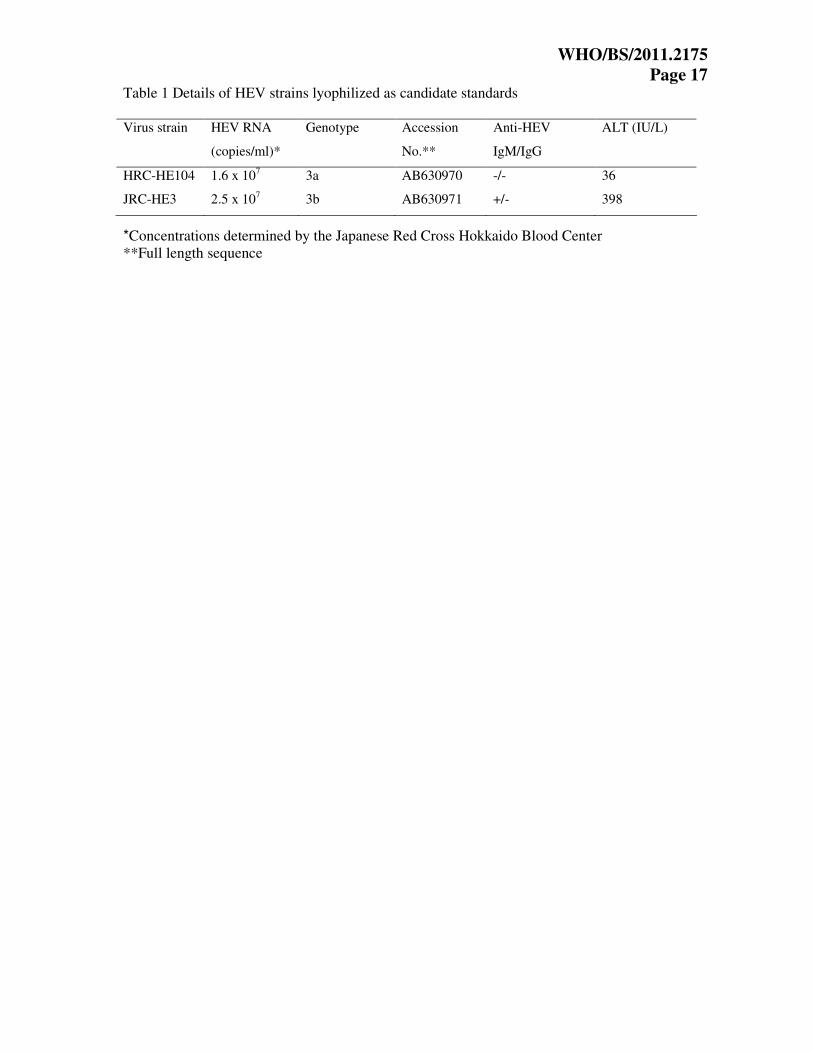
Japanese Red Cross Hokkaido Blood Center. The genotype 3a HEV strain HRC-HE104 was
used to prepare the candidate WHO standard. The genotype 3b HEV strain JRC-HE3 was used
to prepare the candidate Japanese National Standard. Characterization of the virus strains is
shown in Table 1. The target concentration for the two bulk preparations was approximately 5.5
log10 HEV RNA copies/ml based upon the concentrations reported in the initial study (Baylis et
al., 2011) and the concentrations determined by the Japanese Red Cross Hokkaido Blood Centre.
The two virus strains tested negative for HIV-1/2 RNA, HBV DNA and HCV RNA using the
Cobas TaqScreen MPX test (Roche Molecular Systems Inc., Branchburg, USA).
For the preparation of the candidate WHO standard bulk, 131 ml of the HEV strain HRC-HE104
were mixed with 2015 ml of plasma. For the preparation of the candidate Japanese National
Standard bulk, 30 ml of the HEV strain JRC-HE3 were mixed with 1070 ml of plasma. The bulk
preparations were cooled (4-8°C) until processing (~18 hours later). The respective preparations
were diluted using pooled citrated plasma which had been used in the initial HEV collaborative
study (Baylis et al., 2011). The plasma was centrifuged and filtered twice before use. The plasma
diluent tested negative for anti-HEV IgG and IgM (Ulrich Mohn, Mikrogen GmbH, Neuried,
Germany, personal communication) and tested negative for HEV RNA (data not shown) and
HIV-1/2 RNA, HBV DNA and HCV RNA, testing was performed as described above. In
addition, the plasma was negative for HBsAg, anti-HCV, anti-HBc and anti-HIV-1/2.
The filling and lyophilization was performed by an ISO 13485:2003 accredited Swiss company.
For processing, 0.5 ml volumes were dispensed into 4 ml screw-cap glass vials. Rubber seals
were then placed on top of the filled vials before loading into the freeze drier (CHRIST Epsilon
2-25 D) for lyophilization. After freeze-drying the vials were sealed with screw caps and vials
stored at -20°C.

WHO/BS/2011.2175
Page 4 For the candidate WHO standard, 4256 vials were lyophilized; the coefficient of variation of the
fill volume was 1.1%. In the case of the candidate Japanese National Standard, 2154 vials were
lyophilized; the coefficient of variation of the fill volume was 1.0%. In both cases, measurements
were made for a total of 26 vials. For analysis of residual moisture, vials filled with 0.5 ml
volumes of plasma diluent were distributed throughout the freeze-drier. Residual moisture was
0.73%, as determined by testing of 12 vials (Karl Fischer analysis). The freeze-drying process
did not affect the HEV RNA titre of the lyophilized samples when compared to aliquots of the
respective bulk preparations which were stored at -80°C (data not shown).
Vials of the candidate WHO standard are held at the Paul-Ehrlich-Institut, Paul-Ehrlich-Straße
51-59, D-63225 Langen, Germany. The vials are kept at -20°C with continuous temperature
monitoring.
All manufacturing records are held by PEI and are available on request by the ECBS.
Collaborative study
The collaborative study comprised 24 laboratories from 10 countries. The participants in the
collaborative study who returned data are listed in Appendix 1.
The samples analysed in the study were labelled as Sample 1, Sample 2, Sample 3 and Sample 4.
Sample 1 and Sample 2 were replicates of the candidate WHO standard; and Sample 3 and
Sample 4 were replicates of the candidate Japanese National Standard. The collaborative study
materials were shipped to participants at ambient temperature.
Participants were asked to test the panel using their routine assay for HEV RNA, testing the
samples in four separate assay runs, using fresh vials of each sample for each run. Where
laboratories performed quantitative tests, they were requested to report results in copies/ml,
testing samples in the linear range of the assay. In the case of qualitative assays, participants
were requested to assay each sample by a series of one log10 dilution steps, to obtain an initial
estimate of an end-point. For the three subsequent assays, they were requested to assay half-log10
dilutions around the end-point estimated in their first assay. Participants reported diluting the
materials using plasma, water or phosphate buffered saline. Data sheets and a method form were
provided so that all relevant information could be recorded.
Statistical Methods
Quantitative Assays
Evaluation of quantitative assays was restricted to dilutions in the range between 0.0 log10 and -
2.5 log10 where the assays of most participants seem to produce comparable data. For
comparison of laboratories, the replicate results of each laboratory, corrected for the dilution
factor, were combined as arithmetic mean of log10 copies/ml. Furthermore these estimates were
combined to obtain an overall estimation for each sample by means of a mixed linear model with
laboratory and (log) dilution as random factors.
Qualitative Assays The data from all assays were pooled to give series of number positive out of number tested at
each dilution. For each participant, these pooled results were evaluated by means of probit
analysis to estimate the EC50 i.e. the concentration at which 50% of the samples tested were
positive (for assays where the change from complete negative to complete positive results
occurred in two or fewer dilution steps , the Spearman-Kaerber method was applied for EC50
estimation). The calculated end-point was used to give estimates expressed in log10 NAT-
detectable units/ml after correcting for the equivalent volume of the test sample.

WHO/BS/2011.2175
Page 5
Relative potencies Potencies of Samples 2, 3 and 4, for the quantitative assays, were estimated relative to Sample 1
using parallel line analysis of log transformed data. In the case of the qualitative assays, the
relative potencies were determined using parallel line analysis of probit transformed data.
The statistical analysis was performed with SAS®/STAT software, version 9.2, SAS System for
Windows. Estimation of end-point dilution and relative potencies were done with CombiStats
Software, version 4.0, from EDQM/Council of Europe.
Stability studies
Stability of the candidate WHO standard is under continuous assessment, through both real-time
and accelerated thermal degradation stability studies. Vials of the candidate WHO standard have
been stored at -20°C (the normal storage temperature) and -80°C (to provide a baseline if there is
any suggestion of instability at higher temperatures). For the accelerated thermal degradation,
vials have been incubated at +4°C, +20°C, +37°C and +45°C for up to 4 months. After
incubation at the respective temperatures, the contents of the vials were reconstituted in 0.5 ml of
nuclease free water and analysed by real-time PCR (Jothikumar et al., 2006).
Data Received
Data were received from a total of 23 participating laboratories; one laboratory failed to
complete the study within the specified time frame. Data from 20 qualitative and 14 quantitative
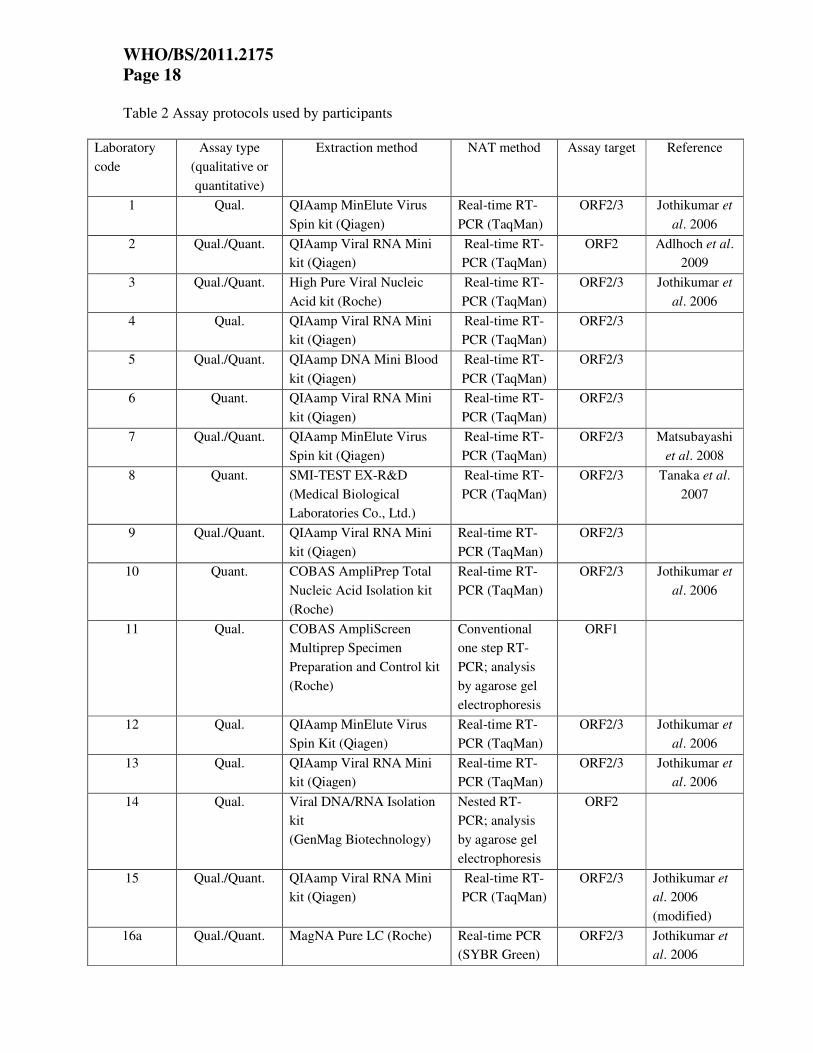
assays were reported. The types of assays used by participants are listed in Table 2; all assays
were developed in-house. The assays used by participants were mainly based upon real-time
PCR, although some conventional PCR methods were also used.
For the purposes of data analysis, each laboratory has been referred to by a code number
allocated at random and not representing the order of listing in Appendix 1. Where a laboratory
performed more than one assay method, the results from the different methods were analyzed
independently, as if from separate laboratories, and coded, for example, laboratory 16a and
laboratory 16b. In the case of 9 assays, quantitative values were reported covering the linear
range of the respective assays; in addition, further dilutions have been performed allowing end-
point determination. These data have been analysed separately and the number of estimates
therefore exceeds the number of assay sets returned by the participants.
Results
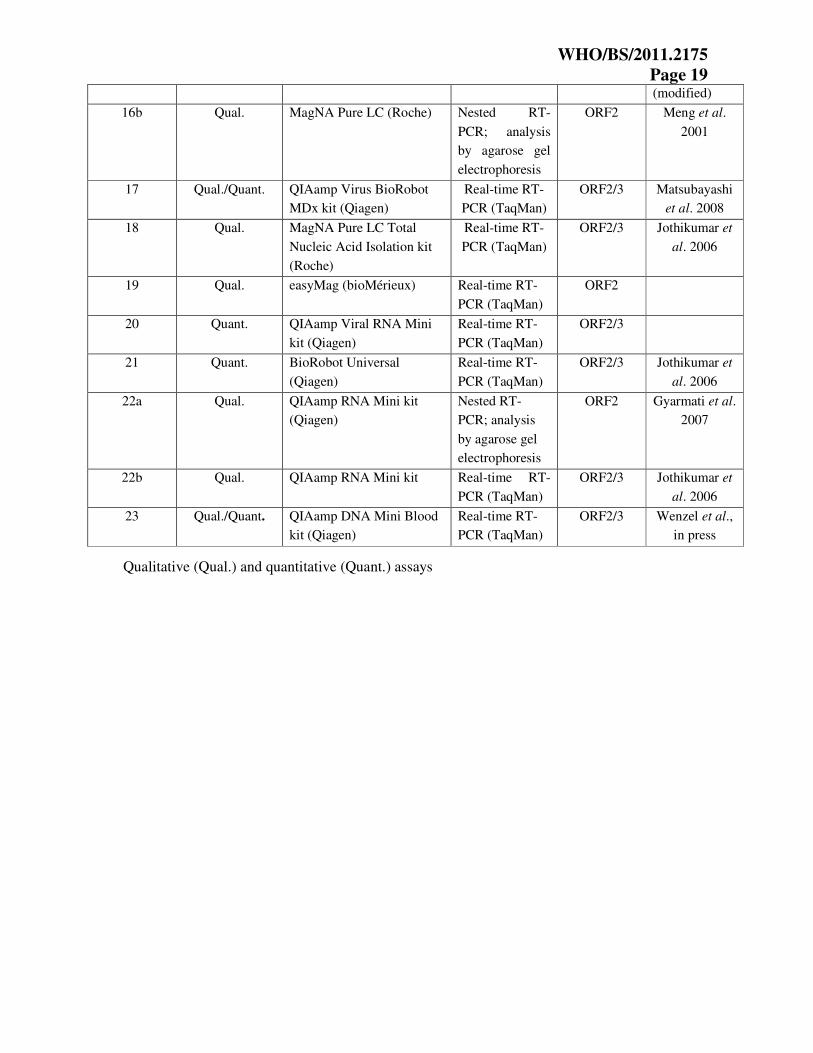
Quantitative Assay Results
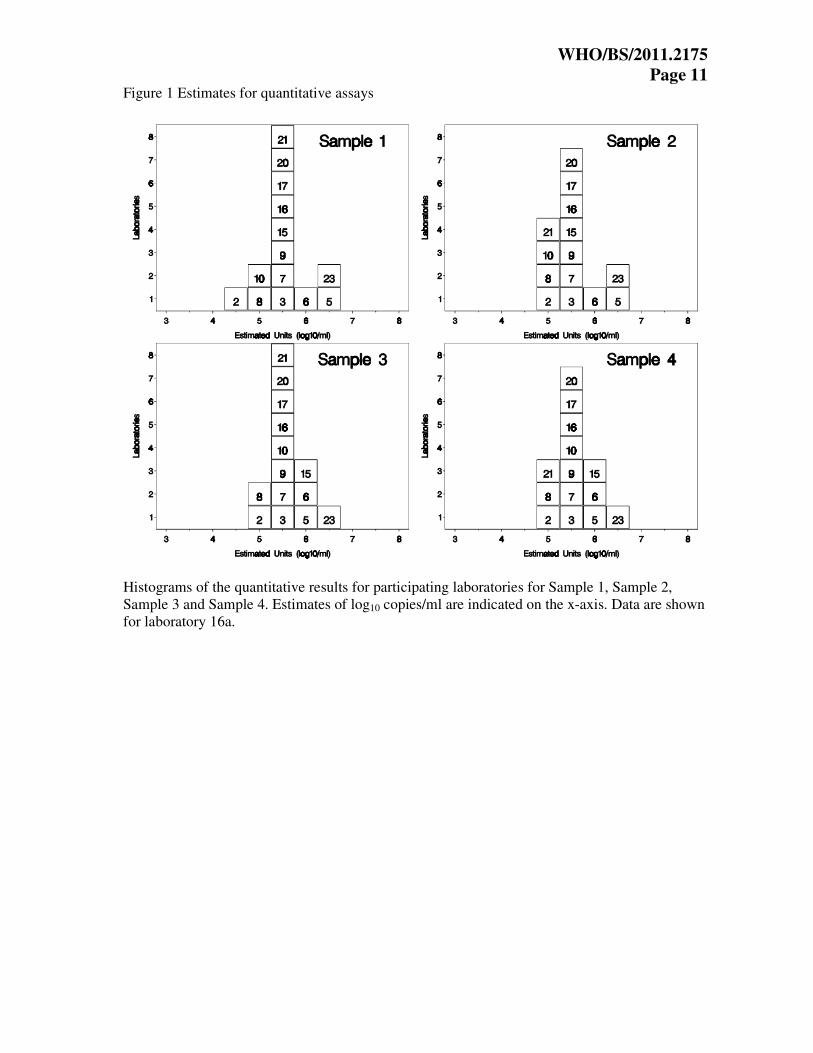
Initially evaluation of quantitative assays was performed without removing any outlying data;
subsequently the data was restricted to a range between 0.0 log10 and -2.5 log10 where
reproducible results were obtained across dilutions. The laboratory mean estimates in copies/ml
(log10) are shown in histogram form in Figure 1. Each box represents the mean estimate from an
individual laboratory, and is labelled with the laboratory code number. The individual laboratory
means are given in Table 3. The relative variation of the individual laboratory estimates is
illustrated by the box-and-whisker plots in Figure 2.
Qualitative Assay Results The NAT-detectable units/ml (log10) for the qualitative assays are shown in histogram form in
Figure 3. Each box represents the mean estimate from an individual laboratory and is labelled
with the laboratory code number. The individual laboratory means are given in Table 4. From
Figure 3, it can be seen that the estimates of NAT detectable units/ml (log10) from the qualitative
WHO/BS/2011.2175
Page 6 assays are more variable than the quantitative assays, reflecting the different sensitivities of the
various assays. This observation is not unexpected and is in line with other studies.
Determination of Overall Laboratory Means The overall means for the laboratories performing quantitative assays are shown in Table 5a. The
means for both Sample 1 and Sample 2, replicates for the candidate WHO standard, are 5.58
log10 and 5.60 log10 copies/ml HEV RNA respectively, which demonstrates excellent agreement
between the replicate samples. The candidate Japanese National Standard showed identical mean
results of 5.66 log10 copies/ml HEV RNA for replicate Samples 3 and 4. The combined mean
values for the replicate samples are shown in Table 5b.
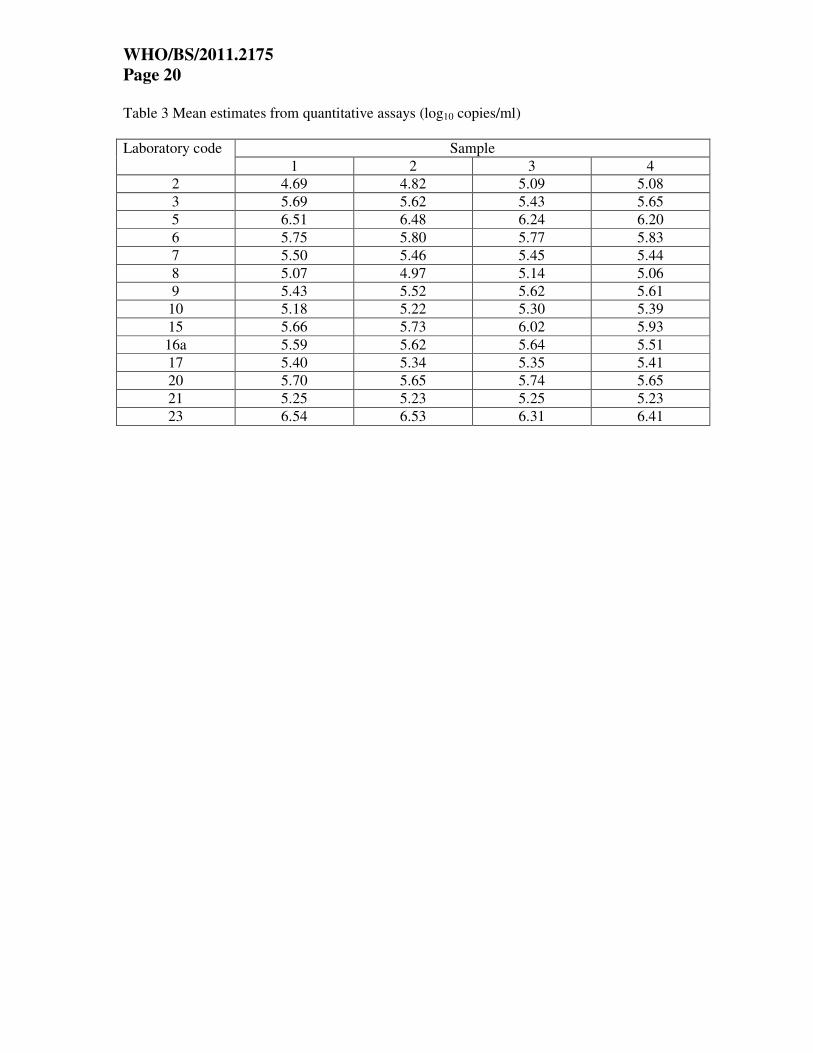
The overall means for the qualitative assays are shown in Table 6a; there is good agreement
between the duplicate samples as seen previously for the quantitative assays. The combined
mean values for the replicate samples are shown in Table 6b. The qualitative assays show 0.3
log10 lower mean estimates than the quantitative assays.
Relative Potencies Based upon the data from both qualitative and quantitative assays, the candidate WHO standard
was estimated to have a potency of 5.39 log10 units/ml (95% confidence limits 5.15 – 5.63). This
value was estimated with a combined end-point evaluation of qualitative and quantitative
(restricted to dilutions in the range of 0.0 log10 to - 2.5 log10) data by means of a mixed linear
model.
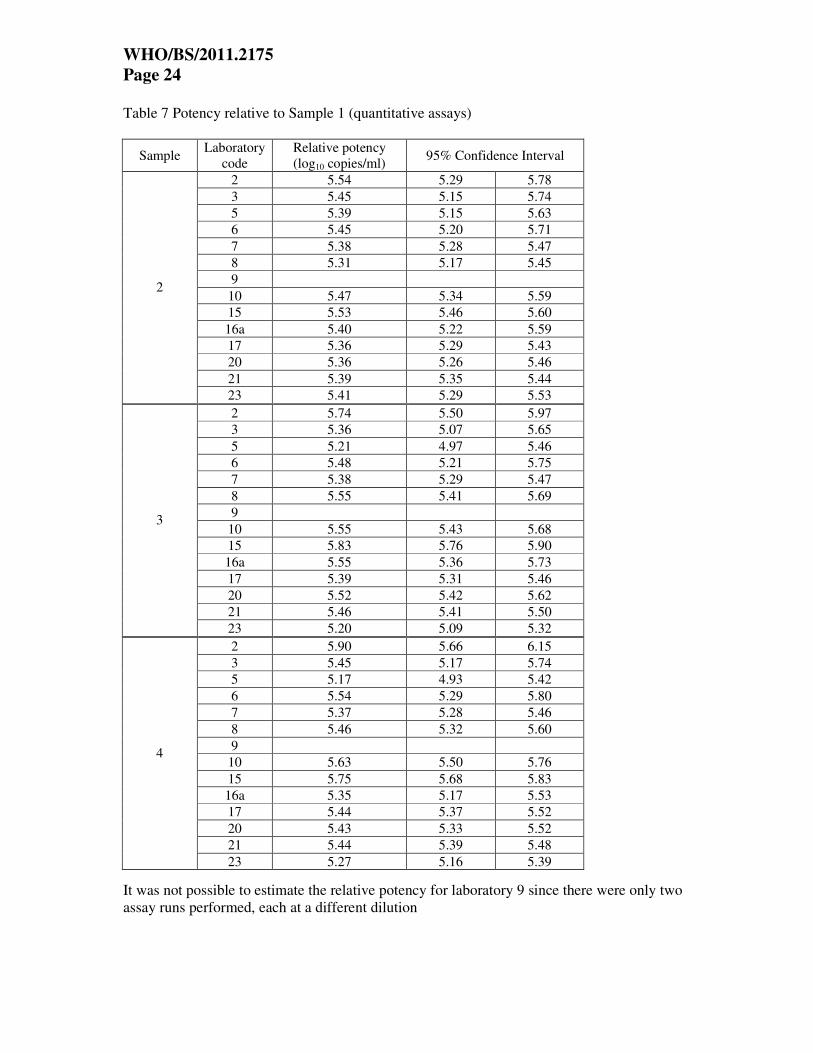
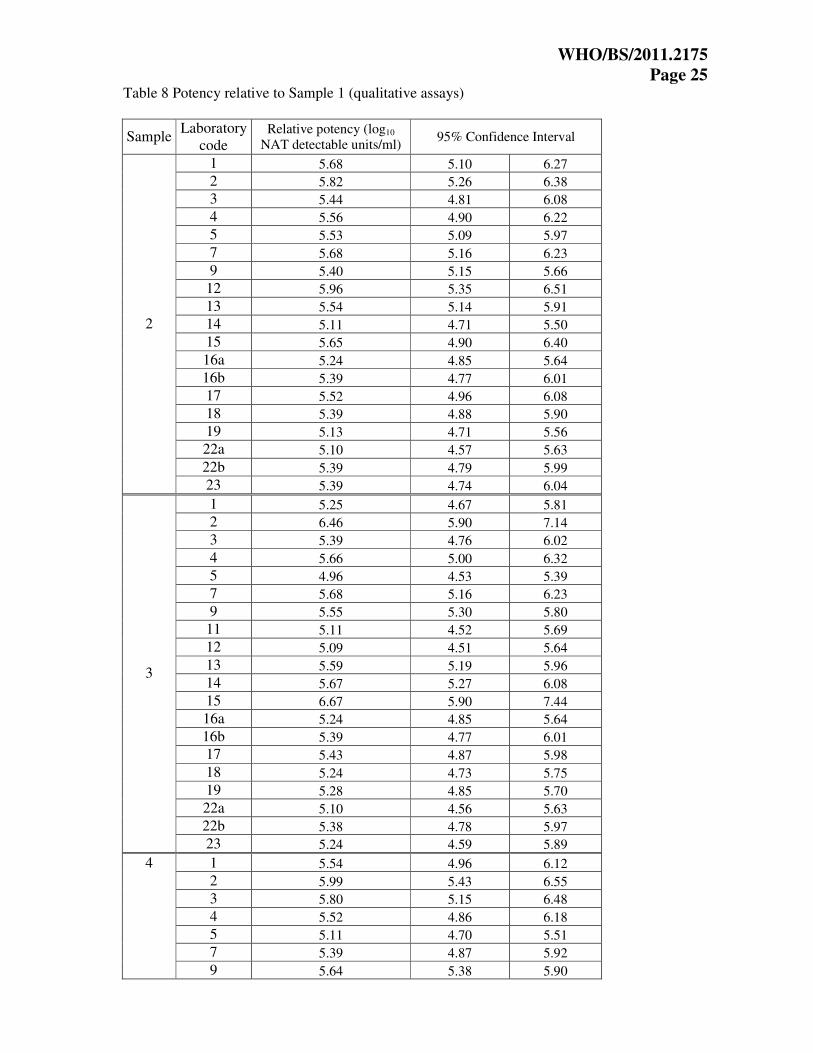
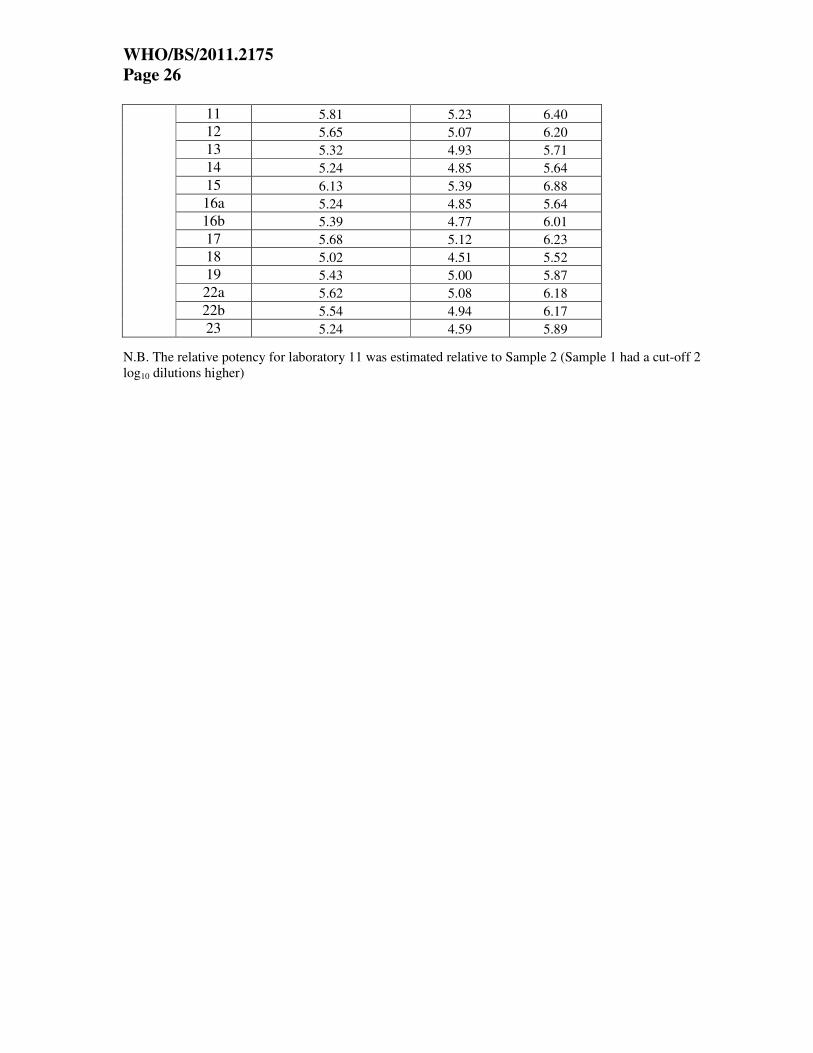
The potencies of Samples 2, 3 and 4 were calculated relative to Sample 1, taking the value of
Sample 1 as 5.39 log10 units/ml. The relative potencies are shown in Tables 7 and 8 for the
quantitative and qualitative assays, respectively. For the quantitative data from laboratory 9, no
potency was estimable since there was only one dilution tested for each sample. The data is
plotted in histogram form (Figures 4-6). The data demonstrate that expressing the results as
potencies relative to Sample 1, as a standard with an assumed unitage of 5.39 log10 units/ml
gives a marked improvement in the agreement between the majority of methods and laboratories.
These data provide some evidence for commutability of the candidate standard for evaluation of
HEV from infected individuals, since Samples 1 and 2 represent a different strain of HEV
compared to Samples 3 and 4.
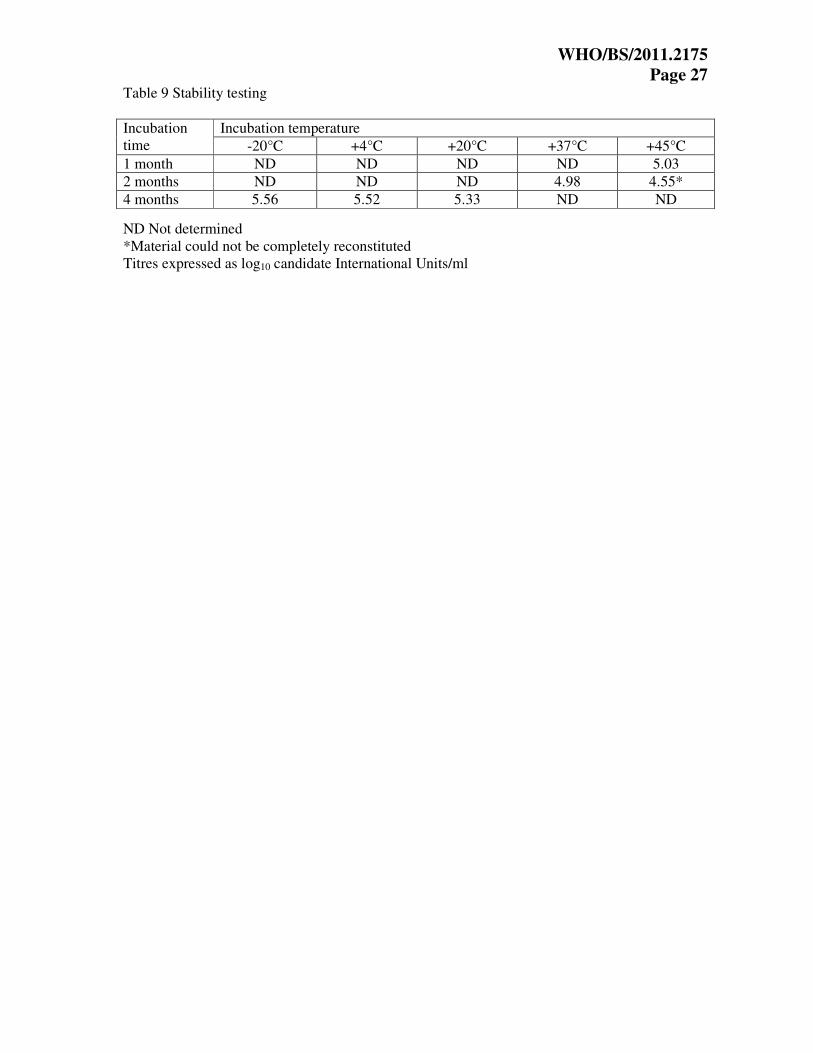
Results of Stability Studies Vials of the candidate WHO standard were incubated at +4°C, +20°C, +37°C and +45°C for up
to four months and tested by real-time PCR for HEV RNA. The heat-treated vials were assayed
concurrently with vials that had been stored at -20°C and at -80°C. All samples were tested in
duplicate and were compared to a standard curve prepared using vials of the candidate WHO
standard stored at -80°C.
There was no evidence of instability of the samples stored at -20°C when compared to samples
stored at -80°C. After 4 months incubation at +20°C a small loss of titre was observed.The
observed drop in titre at higher temperatures (+37°C and +45°C) may be related to problems
with reconstitution of the samples rather that actual degradation and has previously been
observed for some other preparations, particularly for RNA viruses formulated in pooled plasma.
The potency of the reconstituted material, after freezing and thawing, has not been investigated.
Further stability studies (both real-time and accelerated) are on-going and will be communicated
to the WHO.
All raw data for the collaborative study and stability analysis are held by PEI and are available
on request by the ECBS.
WHO/BS/2011.2175
Page 7
Conclusions In this study, a wide range of quantitative and qualitative assays were used to determine the
suitability and evaluate the HEV RNA content of the candidate standards. Although the methods
used by the study participants were all developed in-house, the majority of assays were able to
detect the two HEV strains consistently. Based upon the data from the qualitative and the
quantitative assays, the candidate WHO standard was estimated to have a potency of 5.39 log10
units/ml. Since the unitage assigned to the 1st WHO standard of a preparation is essentially
arbitrary, for practical purposes, the candidate International Standard has been assigned a unitage
of 250,000 International Units/ml. Since there was only a negligible difference in the overall
means for the candidate Japanese National Standard compared to the WHO preparation, the two
materials have therefore been assigned the same value i.e. 250,000 International Units/ml. In the
case of the quantitative assays, laboratories reported values in HEV RNA copies/ml. The
participants used plasmid DNA containing HEV sequences, synthetic oligonucleotides and in
vitro transcribed HEV RNA to control for copy number. In some cases laboratories used HEV-
containing plasma which had been calibrated against in vitro transcribed HEV RNA. Another
laboratory prepared standard using stool-derived virus, the titre of which was determined by end-
point dilution and analysis by Poisson distribution. No standard method or common quantitation
standard material was used, and this is reflected in the variation observed for the quantitative
results, with a variation in the order of 2 log10, which were improved by expressing the results
against Sample 1 as a common standard. In the case of the qualitative assays, the variation in
NAT-detectable units was at least 3 log10, and again expressing potencies relative to Sample 1
improved the agreement between the different laboratories and methods.
The collaborative study materials have been dispatched at ambient temperature, replicating the
intended shipping conditions. Initial accelerated thermal degradation analysis indicates a
reduction in the levels of HEV RNA at higher incubation temperatures. On-going studies on the
real-time stability under normal storage conditions as well as studies concerning thermal
degradation are in progress.
The standard will be of value for comparison of results between laboratories, determination of
assay sensitivities and for validation. It is anticipated that the standard will find application in
clinical laboratories, particularly hepatitis reference laboratories performing diagnosis and
monitoring HEV viral loads in chronically infected transplant patients, research laboratories,
blood and plasma centres which implement HEV NAT screening, regulatory agencies and
organizations developing HEV vaccines as well as manufacturers of diagnostic kits.
Each vial of the HEV RNA standard contains the lyophilized residue of 0.5 ml of HEV RNA
positive plasma. Predictions of stability indicate that the standard is stable and suitable for long-
term use when stored as directed in the accompanying proposed “Instructions For Use” data
sheets for the panel (Appendix 2).
Recommendations Based upon the results of the collaborative study, it is proposed that the genotype 3a HEV strain
(Samples 1 and 2, in this study) should be established as the 1st International Standard for
hepatitis E virus RNA and be assigned a unitage of 250,000 International Units/ml. The standard
has been given the code number 6329/10; 3800 vials are available to the WHO and custodian
laboratory is the Paul-Ehrlich-Institut.
WHO/BS/2011.2175
Page 8
Comments from participants
After circulation of the draft report for comment, replies were received from all participants. The
majority of the comments were editorial in nature and the report has been amended accordingly.
All participants were in agreement with the conclusions of the report.
One participant commented on the possible incorrect estimation of the viral load by the
participants who used DNA standards (synthetic oligonucleotides or plasmid DNA) due to lack
of control for reverse transcription of virus RNA into cDNA. This might be better controlled
using in vitro transcribed RNA or a virion-based preparation.
Another participant remarked that many laboratories have used the same method, showing quite
different sensitivities, possibly due to differences in extraction and amplification/detection
reagents and instrumentation and its set up.
Acknowledgements The viraemic HEV donations used to prepare the candidate standards were generously provided
by Keiji Matsubayashi of the Japanese Red Cross Hokkaido Blood Center. We thank all the
laboratories who took part in the study and Roswitha Kleiber and Christine Hanker-Dusel for
assistance.
References Adlhoch, C., M. Kaiser, G. Pauli, J. Koch, and H. Meisel. 2009. Indigenous hepatitis E virus
infection of a plasma donor in Germany. Vox Sang. 97:303-308.
Baylis, S. A., K. M. Hanschmann, J. Blümel, and C. M. Nübling; on behalf of the HEV
Collaborative Study Group. 2011. Standardization of hepatitis E virus (HEV) nucleic acid
amplification technique (NAT)-based assays: an initial study to evaluate a panel of HEV strains
and investigate laboratory performance. J. Clin. Microbiol. 49:1234-1239.
Bendall, R., V. Ellis, S. Ijaz, R. Ali, and H. Dalton. 2010. A comparison of two commercially
available anti-HEV IgG kits and a re-evaluation of anti-HEV IgG seroprevalence data in
developed countries. J. Med. Virol. 82:799-805.
Boxall, E., A. Herborn, G. Kochethu, G. Pratt, D. Adams, S. Ijaz, and C. G. Teo. 2006.
Transfusion-transmitted hepatitis E in a 'nonhyperendemic' country. Transfus. Med. 16:79-83.
Colson, P., C.Coze, P. Gallian, M. Henry, P De Micco, and C. Tamalet. 2007. Transfusion-
associated hepatitis E, France. Emerg. Infect. Dis. 13:648-649.
Drobeniuc, J., J. Meng, G. Reuter, T. Greene-Montfort, N. Khudyakova, Z. Dimitrova, S.
Kamili, and C. G. Teo. 2010. Serologic assays specific to immunoglobulin M antibodies against
hepatitis E virus: pangenotypic evaluation of performances. Clin. Infect. Dis. 51:e24-27.
Guo, Q. S , Q. Yan, J. H. Xiong, S. X. Ge, J. W. Shih, M. H. Ng, J. Zhang, and N. S. Xia. 2010.
Prevalence of hepatitis E virus in Chinese blood donors. J. Clin. Microbiol. 48:317-318.
WHO/BS/2011.2175
Page 9
Gyarmati, P., N. Mohammed, H. Norder, J. Blomberg, S. Belák, and F. Widén. 2007. Universal
detection of hepatitis E virus by two real-time PCR assays: TaqMan and Primer-Probe Energy
Transfer. J. Virol. Methods. 146:226-235.
Haagsma, E. B., A. Riezebos-Brilman, A. P. van den Berg, R. J. Porte, and H. G. Niesters. 2010.
Treatment of chronic hepatitis E in liver transplant recipients with pegylated interferon alpha-2b.
Liver Transpl. 16:474-477.
Huang, S., X. Zhang, H. Jiang, Q. Yan, X. Ai, Y. Wang, J. Cai, L. Jiang, T. Wu, Z. Wang, L.
Guan, J. W. Shih, M. H. Ng, F. Zhu, J. Zhang, and N. Xia. 2010. Profile of acute infectious
markers in sporadic hepatitis E. PLoS One. 5(10):e13560.
Ijaz, S., A. J. Vyse, D. Morgan, R. G. Pebody, R. S. Tedder, and D. Brown. 2009. Indigenous
hepatitis E virus infection in England: more common than it seems. J. Clin. Virol. 44:272-276.
Jothikumar, N., T. L. Cromeans, B. H. Robertson, X. J. Meng, and V. R. Hill. 2006. A broadly
reactive one-step real-time RT-PCR assay for rapid and sensitive detection of hepatitis E virus. J.
Virol. Methods 131:65-71.
Kamar, N., J. Selves, J. M. Mansuy, L. Ouezzani, J. M. Péron, J. Guitard, O. Cointault, L.
Esposito, F. Abravanel, M. Danjoux, D. Durand, J. P. Vinel, J. Izopet, and L. Rostaing. 2008.
Hepatitis E virus and chronic hepatitis in organ-transplant recipients.
N. Engl. J. Med. 358:811-817.
Kamar, N., L. Rostaing, F. Abravanel, C. Garrouste, L. Esposito, I. Cardeau-Desangles, J. M.
Mansuy, J. Selves, J. M. Peron, P. Otal, F. Muscari, and J. Izopet. 2010a. Pegylated interferon-
alpha for treating chronic hepatitis E virus infection after liver transplantation. Clin. Infect. Dis.
50:e30-33.
Kamar, N., L. Rostaing, F. Abravanel, C. Garrouste, S. Lhomme, L Esposito, G Basse, O
Cointault, D Ribes, M. B. Nogier, L. Alric, J. M. Peron, and J. Izopet. 2010b. Ribavirin therapy
inhibits viral replication on patients with chronic hepatitis e virus infection. Gastroenterology
139:1612-1618.
Kamar, N., F. Abravanel, J. Selves, C. Garrouste, L. Esposito, L. Lavayssière, O. Cointault, D.
Ribes, I. Cardeau, M. B. Nogier, J. M. Mansuy, F. Muscari, J. M. Peron, J. Izopet, and L.
Rostaing. 2010c. Influence of immunosuppressive therapy on the natural history of genotype 3
hepatitis-E virus infection after organ transplantation. Transplantation 89:353-360.
Lan X., B. Yang, B. Y. Li, X. P. Yin, X. R. Li, and J. X. Liu. 2009. Reverse transcription-loop-
mediated isothermal amplification assay for rapid detection of hepatitis E virus. J. Clin.
Microbiol. 47:2304-2306.
Legrand-Abravanel, F., N. Kamar, K. Sandres-Saune, C. Garrouste, M. Dubois, J. M. Mansuy, F.
Muscari, F. Sallusto, L. Rostaing, J. Izopet. 2010. Characteristics of autochthonous hepatitis E
virus infection in solid-organ transplant recipients in France. J. Infect. Dis. 202:835-844.
Mallet; V., E. Nicand, P. Sultanik, C. Chakvetadze, S. Tessé, E. Thervet, L. Mouthon, P. Sogni,
and S. Pol. 2010. Brief communication: case reports of ribavirin treatment for chronic hepatitis
E. Ann. Intern. Med. 153:85-89.
WHO/BS/2011.2175
Page 10 Matsubayashi, K., Y. Nagaoka, H. Sakata, S. Sato, K. Fukai, T. Kato, K. Takahashi, S. Mishiro,
M. Imai, N. Takeda, and H. Ikeda. 2004. Transfusion-transmitted hepatitis E caused by
apparently indigenous hepatitis E virus strain in Hokkaido, Japan. Transfusion 44:934-940.
Matsubayashi, K., J. H. Kang, H. Sakata, K. Takahashi, M. Shindo, M. Kato, S. Sato, T. Kato, H.
Nishimori, K. Tsuji, H. Maguchi, J. Yoshida, H. Maekubo, S. Mishiro, and H. Ikeda. 2008. A
case of transfusion-transmitted hepatitis E caused by blood from a donor infected with hepatitis
E virus via zoonotic food-borne route. Transfusion 48:1368-1375.
Meng, J., X. Dai, J. C. Chang, E. Lopareva, J. Pillot, H. A. Fields, and Y. E. Khudyakov. 2001.
Identification and characterization of the neutralization epitope(s) of the hepatitis E virus.
Virology 288:203-211.
Meng, X. J. 2010. Recent advances in Hepatitis E virus. J. Viral. Hepat. 17:153-161.
Purcell, R. H., and S. U. Emerson. 2008. Hepatitis E: an emerging awareness of an old disease. J.
Hepatol. 48:494-503.
Purcell, R. H., and S. U. Emerson. 2010. Hidden danger: the raw facts about hepatitis E virus. J.
Infect. Dis. 202:819-821.
Sakata, H., K. Matsubayashi, H. Takeda, S. Sato, T. Kato, S. Hino, K. Tadokoro, and H. Ikeda.
2008. A nationwide survey for hepatitis E virus prevalence in Japanese blood donors with
elevated alanine aminotransferase. Transfusion 48:2568-2576.
Shrestha, M. P., R. M. Scott, D. M. Joshi, M. P. Mammen, G. B. Thapa, N. Thapa, K. S. Myint,
M. Fourneau, R. A. Kuschner, S. K. Shrestha, M. P. David, J. Seriwatana, D. W. Vaughn, A.
Safary, T. P. Endy, and B. L. Innis. 2007. Safety and efficacy of a recombinant hepatitis E
vaccine. N. Engl. J. Med. 356:895-903.
Tanaka, T., T. Masaharu, E. Kusano, and H. Okamoto. 2007. Development and evaluation of an
efficient cell-culture system for Hepatitis E virus. J. Gen. Virol. 88:903-911.
Waar, K., M. M. Herremans, H. Vennema, M. P. Koopmans, and C. A. Benne. 2005. Hepatitis E
is a cause of unexplained hepatitis in The Netherlands. J. Clin. Virol. 33:145-149.
Wenzel, J. J, J. Preiss, M. Schemmerer, B. Huber, A. Plentz, and W. Jilg. Detection of hepatitis
E virus (HEV) from porcine livers in Southeastern Germany and high sequence homology to
human HEV isolates. J. Clin. Virol. in press; DOI number 10.1016/j.jcv.2011.06.006
Zhu, F. C., J. Zhang, X. F. Zhang, C. Zhou, Z. Z. Wang, S. J. Huang, H. Wang, C. L. Yang, H.
M. Jiang, J. P. Cai, Y. J. Wang, X. Ai, Y. M. Hu, Q. Tang, X. Yao, Q. Yan, Y. L. Xian, T. Wu,
Y. M. Li, J. Miao, M. H. Ng, J. W. Shih, and N. S. Xia. 2010. Efficacy and safety of a
recombinant hepatitis E vaccine in healthy adults: a large-scale, randomised, double-blind
placebo-controlled, phase 3 trial. Lancet 376:895-902.
WHO/BS/2011.2175
Page 11
Figure 1 Estimates for quantitative assays
Histograms of the quantitative results for participating laboratories for Sample 1, Sample 2,
Sample 3 and Sample 4. Estimates of log10 copies/ml are indicated on the x-axis. Data are shown
for laboratory 16a.

WHO/BS/2011.2175
Page 12 Figure 2 Box and whisker plots of the quantitative data (log10 copies/ml)

WHO/BS/2011.2175
Page 13
Figure 3 Estimates for qualitative assays
Histograms of the qualitative results for participating laboratories for Sample 1, Sample 2,
Sample 3 and Sample 4. Estimates of log10 NAT-detectable units/ml are indicated on the x-axis.
In the case of laboratory 11, data for Sample 1 have been omitted due to a 2 log10 higher cut-off.
WHO/BS/2011.2175
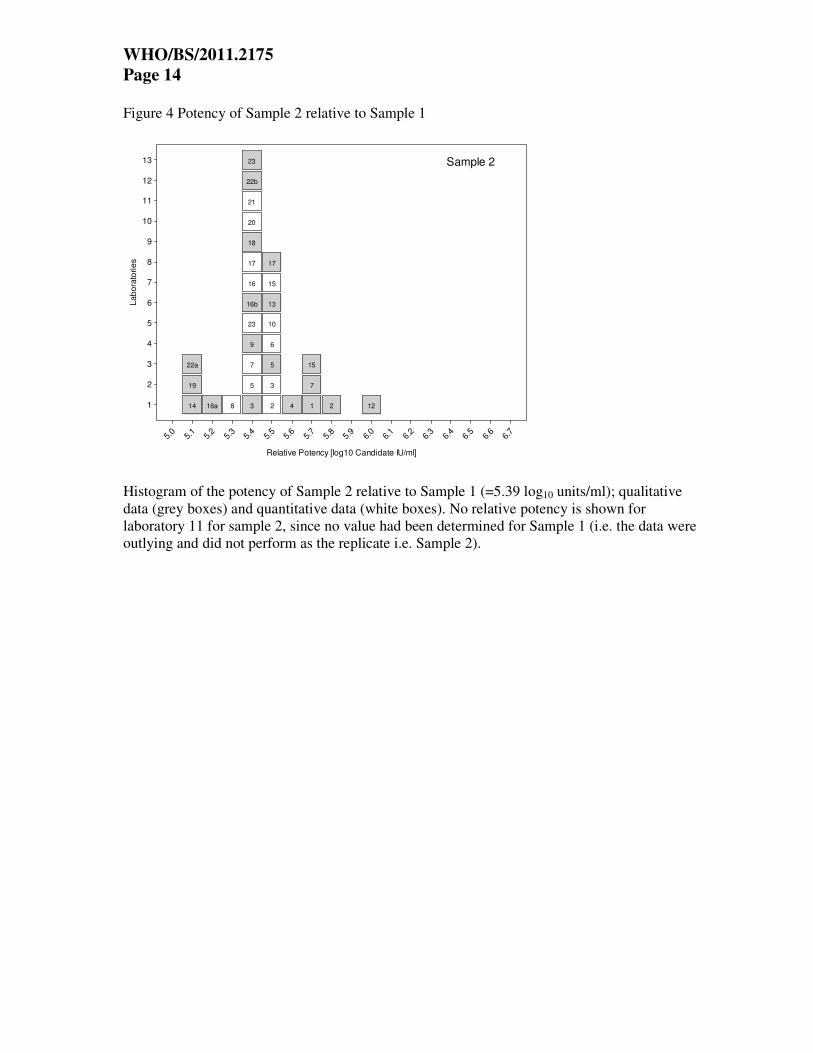
Page 14 Figure 4 Potency of Sample 2 relative to Sample 1
L
ab
ora
torie
s
1
2
3
4
5
6
7
8
9
10
11
12
13
Relative Potency [log10 Candidate IU/ml]
5.0
5.1
5.2
5.3
5.4
5.5
5.6
5.7
5.8
5.9 6.0
6.1
6.2 6.3
6.4
6.5
6.6
6.7
14
19
22a
16a 8 3
5
7
9
23
16b
16
17
18
20
21
22b
23
2
3
5
6
10
13
15
17
4 1
7
15
2 12
Sample 2
Histogram of the potency of Sample 2 relative to Sample 1 (=5.39 log10 units/ml); qualitative
data (grey boxes) and quantitative data (white boxes). No relative potency is shown for
laboratory 11 for sample 2, since no value had been determined for Sample 1 (i.e. the data were
outlying and did not perform as the replicate i.e. Sample 2).
WHO/BS/2011.2175
Page 15
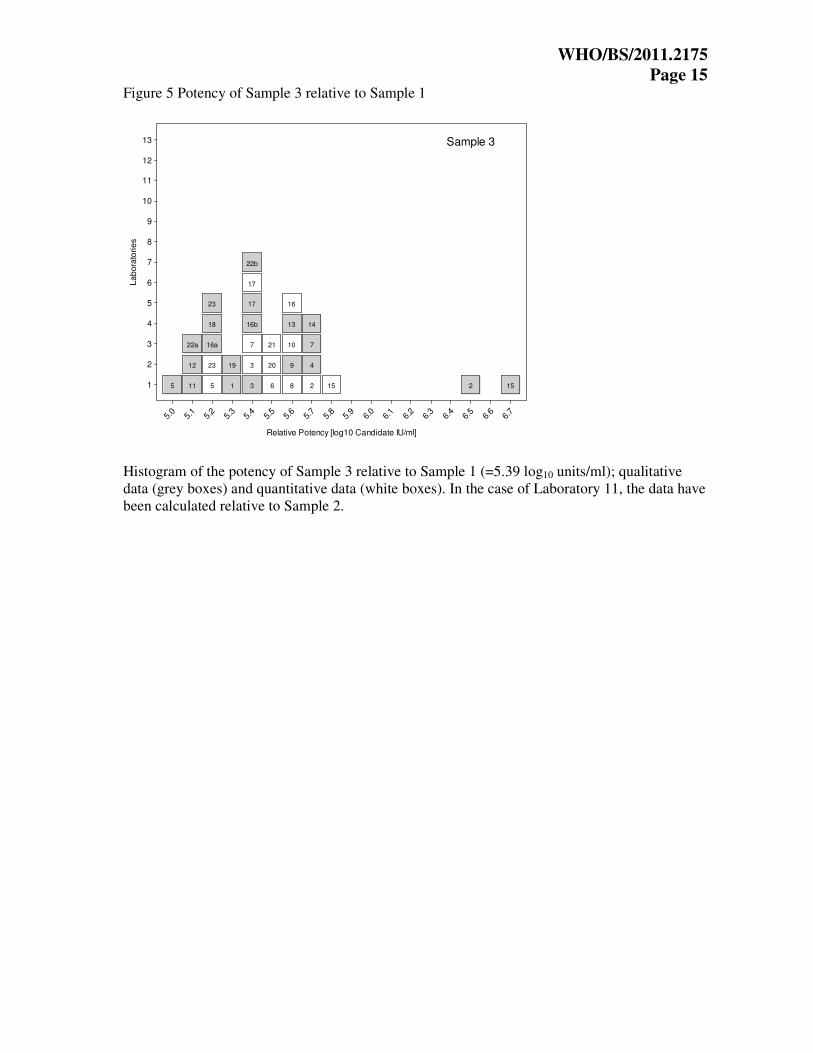
Figure 5 Potency of Sample 3 relative to Sample 1
Lab
ora
torie
s
1
2
3
4
5
6
7
8
9
10
11
12
13
Relative Potency [log10 Candidate IU/ml]
5.0
5.1
5.2
5.3
5.4
5.5
5.6
5.7
5.8
5.9 6.0
6.1
6.2 6.3
6.4
6.5
6.6
6.7
5 11
12
22a
5
23
16a
18
23
1
19
3
3
7
16b
17
17
22b
6
20
21
8
9
10
13
16
2
4
7
14
15 2 15
Sample 3
Histogram of the potency of Sample 3 relative to Sample 1 (=5.39 log10 units/ml); qualitative
data (grey boxes) and quantitative data (white boxes). In the case of Laboratory 11, the data have
been calculated relative to Sample 2.

WHO/BS/2011.2175
Page 16 Figure 6 Potency of Sample 4 relative to Sample 1
L
ab
ora
torie
s
1
2
3
4
5
6
7
8
9
10
11
12
13
Relative Potency [log10 Candidate IU/ml]
5.0
5.1
5.2
5.3
5.4
5.5
5.6
5.7
5.8
5.9 6.0
6.1
6.2 6.3
6.4
6.5
6.6
6.7
18 5 5
14
16a
23
23
13
7
7
16b
16
17
19
20
21
1
3
4
6
8
22b
9
10
22a
12
17
3
11
15
2 2 15
Sample 4
Histogram of the potency of Sample 4 relative to Sample 1 (=5.39 log10 units/ml); qualitative
data (grey boxes) and quantitative data (white boxes). In the case of Laboratory 11, the data have
been calculated relative to Sample 2.
WHO/BS/2011.2175
Page 17
Table 1 Details of HEV strains lyophilized as candidate standards
Virus strain HEV RNA
(copies/ml)*
Genotype Accession
No.**
Anti-HEV
IgM/IgG
ALT (IU/L)
HRC-HE104 1.6 x 10⁷ 3a AB630970 -/- 36
JRC-HE3 2.5 x 10⁷ 3b AB630971 +/- 398
*Concentrations determined by the Japanese Red Cross Hokkaido Blood Center
**Full length sequence
WHO/BS/2011.2175
Page 18 Table 2 Assay protocols used by participants
Laboratory
code
Assay type
(qualitative or
quantitative)
Extraction method NAT method Assay target Reference
1 Qual. QIAamp MinElute Virus
Spin kit (Qiagen)
Real-time RT-
PCR (TaqMan)
ORF2/3 Jothikumar et
al. 2006
2 Qual./Quant. QIAamp Viral RNA Mini
kit (Qiagen)
Real-time RT-
PCR (TaqMan)
ORF2 Adlhoch et al.
2009
3 Qual./Quant. High Pure Viral Nucleic
Acid kit (Roche)
Real-time RT-
PCR (TaqMan)
ORF2/3 Jothikumar et
al. 2006
4 Qual. QIAamp Viral RNA Mini
kit (Qiagen)
Real-time RT-
PCR (TaqMan)
ORF2/3
5 Qual./Quant. QIAamp DNA Mini Blood
kit (Qiagen)
Real-time RT-
PCR (TaqMan)
ORF2/3
6 Quant. QIAamp Viral RNA Mini
kit (Qiagen)
Real-time RT-
PCR (TaqMan)
ORF2/3
7 Qual./Quant. QIAamp MinElute Virus
Spin kit (Qiagen)
Real-time RT-
PCR (TaqMan)
ORF2/3 Matsubayashi
et al. 2008
8 Quant. SMI-TEST EX-R&D
(Medical Biological
Laboratories Co., Ltd.)
Real-time RT-
PCR (TaqMan)
ORF2/3 Tanaka et al.
2007
9 Qual./Quant. QIAamp Viral RNA Mini
kit (Qiagen)
Real-time RT-
PCR (TaqMan)
ORF2/3
10 Quant. COBAS AmpliPrep Total
Nucleic Acid Isolation kit
(Roche)
Real-time RT-
PCR (TaqMan)
ORF2/3 Jothikumar et
al. 2006
11 Qual. COBAS AmpliScreen
Multiprep Specimen
Preparation and Control kit
(Roche)
Conventional
one step RT-
PCR; analysis
by agarose gel
electrophoresis
ORF1
12 Qual. QIAamp MinElute Virus
Spin Kit (Qiagen)
Real-time RT-
PCR (TaqMan)
ORF2/3 Jothikumar et
al. 2006
13 Qual. QIAamp Viral RNA Mini
kit (Qiagen)
Real-time RT-
PCR (TaqMan)
ORF2/3 Jothikumar et
al. 2006
14 Qual. Viral DNA/RNA Isolation
kit
(GenMag Biotechnology)
Nested RT-
PCR; analysis
by agarose gel
electrophoresis
ORF2
15 Qual./Quant. QIAamp Viral RNA Mini
kit (Qiagen)
Real-time RT-
PCR (TaqMan)
ORF2/3 Jothikumar et
al. 2006
(modified)
16a Qual./Quant. MagNA Pure LC (Roche) Real-time PCR
(SYBR Green)
ORF2/3 Jothikumar et
al. 2006
WHO/BS/2011.2175
Page 19
(modified)
16b Qual. MagNA Pure LC (Roche) Nested RT-
PCR; analysis
by agarose gel
electrophoresis
ORF2 Meng et al.
2001
17 Qual./Quant.
QIAamp Virus BioRobot
MDx kit (Qiagen)
Real-time RT-
PCR (TaqMan)
ORF2/3 Matsubayashi
et al. 2008
18 Qual. MagNA Pure LC Total
Nucleic Acid Isolation kit
(Roche)
Real-time RT-
PCR (TaqMan)
ORF2/3 Jothikumar et
al. 2006
19 Qual. easyMag (bioMérieux) Real-time RT-
PCR (TaqMan)
ORF2
20 Quant. QIAamp Viral RNA Mini
kit (Qiagen)
Real-time RT-
PCR (TaqMan)
ORF2/3
21 Quant. BioRobot Universal
(Qiagen)
Real-time RT-
PCR (TaqMan)
ORF2/3 Jothikumar et
al. 2006
22a Qual. QIAamp RNA Mini kit
(Qiagen)
Nested RT-
PCR; analysis
by agarose gel
electrophoresis
ORF2 Gyarmati et al.
2007
22b Qual. QIAamp RNA Mini kit Real-time RT-
PCR (TaqMan)
ORF2/3
Jothikumar et
al. 2006
23 Qual./Quant. QIAamp DNA Mini Blood
kit (Qiagen)
Real-time RT-
PCR (TaqMan)
ORF2/3 Wenzel et al.,
in press
Qualitative (Qual.) and quantitative (Quant.) assays
WHO/BS/2011.2175
Page 20 Table 3 Mean estimates from quantitative assays (log10 copies/ml)
Sample Laboratory code
1 2 3 4
2 4.69 4.82 5.09 5.08
3 5.69 5.62 5.43 5.65
5 6.51 6.48 6.24 6.20
6 5.75 5.80 5.77 5.83
7 5.50 5.46 5.45 5.44
8 5.07 4.97 5.14 5.06
9 5.43 5.52 5.62 5.61
10 5.18 5.22 5.30 5.39
15 5.66 5.73 6.02 5.93
16a 5.59 5.62 5.64 5.51
17 5.40 5.34 5.35 5.41
20 5.70 5.65 5.74 5.65
21 5.25 5.23 5.25 5.23
23 6.54 6.53 6.31 6.41

WHO/BS/2011.2175
Page 21
Table 4 Mean estimates from qualitative assays (log10 NAT detectable units/ml)
Sample Laboratory code
1 2 3 4
1 5.76 6.05 5.62 5.91
2 4.42 4.85 5.49 5.02
3 5.35 5.40 5.35 5.76
4 6.20 6.37 6.47 6.33
5 4.70 4.84 4.27 4.42
7 5.34 5.62 5.62 5.34
9 5.02 5.03 5.18 5.26
11 4.00 3.72 4.42
12 4.91 5.48 4.61 5.18
13 5.51 5.66 5.71 5.44
14 4.71 4.43 5.00 4.57
15 6.11 6.36 7.42 6.87
16a 5.32 5.17 5.17 5.17
16b 4.74 4.74 4.74 4.74
17 5.39 5.52 5.42 5.67
18 5.13 5.13 4.98 4.76
19 5.68 5.42 5.56 5.71
22a 5.21 4.92 4.91 5.44
22b 4.53 4.53 4.52 4.68
23 5.76 5.76 5.60 5.60
Laboratory 11, sample 1, omitted due to 2 log10 higher cut-off

WHO/BS/2011.2175
Page 22
Table 5a Overall mean estimates from quantitative assays (log10 copies/ml)
Sample n mean sd lowercl uppercl median min max cv_geo
1 123 5.58 0.29 5.32 5.85 5.46 4.36 6.85 98%
2 125 5.60 0.28 5.33 5.87 5.46 4.43 6.69 94%
3 124 5.66 0.20 5.40 5.93 5.50 4.49 6.63 77%
4 125 5.66 0.20 5.40 5.93 5.48 4.64 6.77 76%
n – number of dilutions analysed (in linear range), sd – standard deviation, lowercl/uppercl –
95% confidence limits for the mean, cv_geo – geometric coefficient of variation [%]
Table 5b Combined mean estimates from quantitative assays (log10 copies/ml)
Candidate n mean sd lowercl uppercl median min max cv_geo
WHO 248 5.59 0.30 5.33 5.86 5.46 4.36 6.85 99%
NIID 249 5.66 0.20 5.40 5.93 5.48 4.49 6.77 76%
Combined data for Samples 1 and 2, replicate samples of the candidate IS (WHO); combined
data for Samples 3 and 4, replicate samples of the candidate Japanese National Standard (NIID)
WHO/BS/2011.2175
Page 23
Table 6a Overall means of estimates from qualitative assays (log10 NAT detectable units/ml)
Sample n mean sd
Lower
cl
Upper
cl median min max cv_geo
1 19 5.25 0.51 5.01 5.50 5.32 4.42 6.20 150%
2 20 5.26 0.62 4.97 5.56 5.29 4.00 6.37 179%
3 20 5.27 0.79 4.90 5.64 5.27 3.72 7.42 226%
4 20 5.31 0.64 5.02 5.61 5.30 4.42 6.87 183%
n – number of tests, lowercl/uppercl – 95% confidence limits for the mean, cv_geo – geometric
coefficient of variation [%]
Table 6b Combined means of estimates from qualitative assays (log10 NAT detectable units/ml)
Candidate n mean sd lowercl uppercl median min max cv_geo
WHO 39 5.26 0.56 5.08 5.44 5.32 4.00 6.37 163%
NIID 40 5.29 0.71 5.07 5.52 5.30 3.72 7.42 202%
Combined data for Samples 1 and 2, replicate samples of the candidate IS (WHO); combined
data for Samples 3 and 4, replicate samples of the candidate Japanese National Standard (NIID)
WHO/BS/2011.2175
Page 24 Table 7 Potency relative to Sample 1 (quantitative assays)
Sample Laboratory
code
Relative potency
(log10 copies/ml) 95% Confidence Interval
2 5.54 5.29 5.78
3 5.45 5.15 5.74
5 5.39 5.15 5.63
6 5.45 5.20 5.71
7 5.38 5.28 5.47
8 5.31 5.17 5.45
9
10 5.47 5.34 5.59
15 5.53 5.46 5.60
16a 5.40 5.22 5.59
17 5.36 5.29 5.43
20 5.36 5.26 5.46
21 5.39 5.35 5.44
2
23 5.41 5.29 5.53
2 5.74 5.50 5.97
3 5.36 5.07 5.65
5 5.21 4.97 5.46
6 5.48 5.21 5.75
7 5.38 5.29 5.47
8 5.55 5.41 5.69
9
10 5.55 5.43 5.68
15 5.83 5.76 5.90
16a 5.55 5.36 5.73
17 5.39 5.31 5.46
20 5.52 5.42 5.62
21 5.46 5.41 5.50
3
23 5.20 5.09 5.32
2 5.90 5.66 6.15
3 5.45 5.17 5.74
5 5.17 4.93 5.42
6 5.54 5.29 5.80
7 5.37 5.28 5.46
8 5.46 5.32 5.60
9
10 5.63 5.50 5.76
15 5.75 5.68 5.83
16a 5.35 5.17 5.53
17 5.44 5.37 5.52
20 5.43 5.33 5.52
21 5.44 5.39 5.48
4
23 5.27 5.16 5.39
It was not possible to estimate the relative potency for laboratory 9 since there were only two
assay runs performed, each at a different dilution
WHO/BS/2011.2175
Page 25
Table 8 Potency relative to Sample 1 (qualitative assays)
Sample Laboratory
code Relative potency (log10
NAT detectable units/ml) 95% Confidence Interval
1 5.68 5.10 6.27
2 5.82 5.26 6.38
3 5.44 4.81 6.08
4 5.56 4.90 6.22
5 5.53 5.09 5.97
7 5.68 5.16 6.23
9 5.40 5.15 5.66
12 5.96 5.35 6.51
13 5.54 5.14 5.91
14 5.11 4.71 5.50
15 5.65 4.90 6.40
16a 5.24 4.85 5.64
16b 5.39 4.77 6.01
17 5.52 4.96 6.08
18 5.39 4.88 5.90
19 5.13 4.71 5.56
22a 5.10 4.57 5.63
22b 5.39 4.79 5.99
2
23 5.39 4.74 6.04
1 5.25 4.67 5.81
2 6.46 5.90 7.14
3 5.39 4.76 6.02
4 5.66 5.00 6.32
5 4.96 4.53 5.39
7 5.68 5.16 6.23
9 5.55 5.30 5.80
11 5.11 4.52 5.69
12 5.09 4.51 5.64
13 5.59 5.19 5.96
14 5.67 5.27 6.08
15 6.67 5.90 7.44
16a 5.24 4.85 5.64
16b 5.39 4.77 6.01
17 5.43 4.87 5.98
18 5.24 4.73 5.75
19 5.28 4.85 5.70
22a 5.10 4.56 5.63
22b 5.38 4.78 5.97
3
23 5.24 4.59 5.89
1 5.54 4.96 6.12
2 5.99 5.43 6.55
3 5.80 5.15 6.48
4 5.52 4.86 6.18
5 5.11 4.70 5.51
7 5.39 4.87 5.92
4
9 5.64 5.38 5.90
WHO/BS/2011.2175
Page 26
11 5.81 5.23 6.40
12 5.65 5.07 6.20
13 5.32 4.93 5.71
14 5.24 4.85 5.64
15 6.13 5.39 6.88
16a 5.24 4.85 5.64
16b 5.39 4.77 6.01
17 5.68 5.12 6.23
18 5.02 4.51 5.52
19 5.43 5.00 5.87
22a 5.62 5.08 6.18
22b 5.54 4.94 6.17
23 5.24 4.59 5.89
N.B. The relative potency for laboratory 11 was estimated relative to Sample 2 (Sample 1 had a cut-off 2
log10 dilutions higher)
WHO/BS/2011.2175
Page 27
Table 9 Stability testing
Incubation temperature Incubation
time -20°C +4°C +20°C +37°C +45°C
1 month ND ND ND ND 5.03
2 months ND ND ND 4.98 4.55*
4 months 5.56 5.52 5.33 ND ND
ND Not determined
*Material could not be completely reconstituted
Titres expressed as log10 candidate International Units/ml
WHO/BS/2011.2175
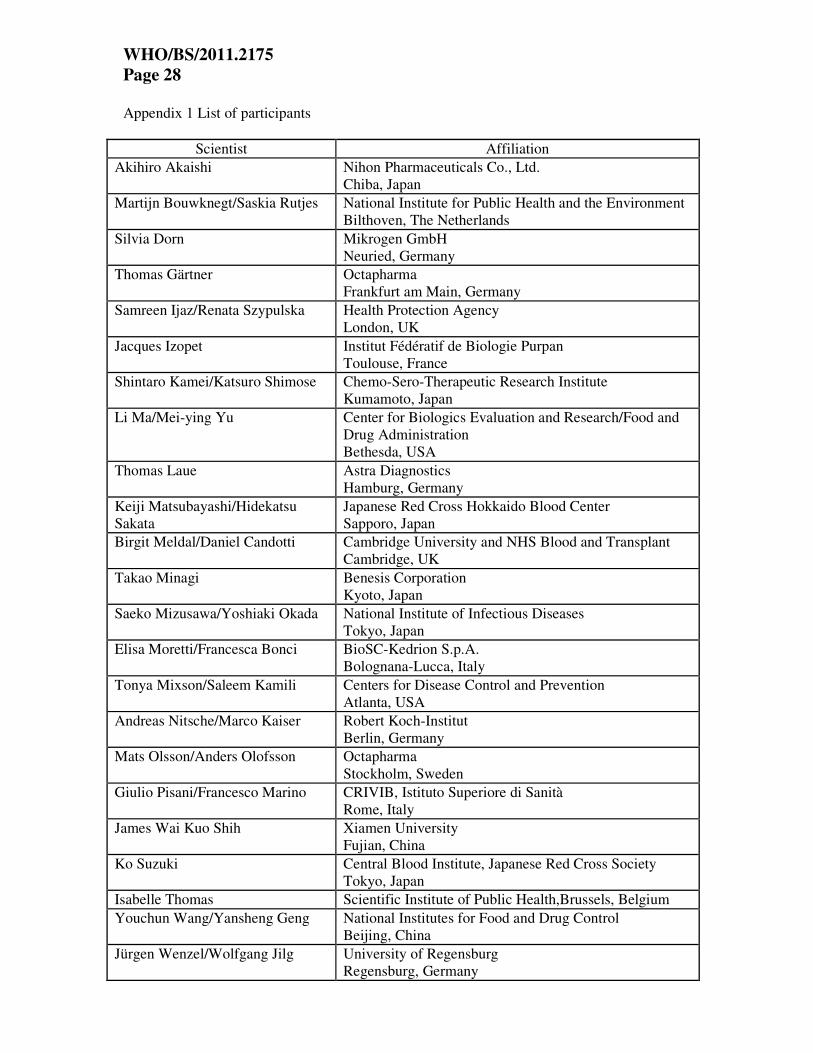
Page 28 Appendix 1 List of participants
Scientist Affiliation
Akihiro Akaishi Nihon Pharmaceuticals Co., Ltd.
Chiba, Japan
Martijn Bouwknegt/Saskia Rutjes National Institute for Public Health and the Environment
Bilthoven, The Netherlands
Silvia Dorn Mikrogen GmbH
Neuried, Germany
Thomas Gärtner Octapharma
Frankfurt am Main, Germany
Samreen Ijaz/Renata Szypulska Health Protection Agency
London, UK
Jacques Izopet Institut Fédératif de Biologie Purpan
Toulouse, France
Shintaro Kamei/Katsuro Shimose Chemo-Sero-Therapeutic Research Institute
Kumamoto, Japan
Li Ma/Mei-ying Yu Center for Biologics Evaluation and Research/Food and
Drug Administration
Bethesda, USA
Thomas Laue Astra Diagnostics
Hamburg, Germany
Keiji Matsubayashi/Hidekatsu
Sakata
Japanese Red Cross Hokkaido Blood Center
Sapporo, Japan
Birgit Meldal/Daniel Candotti Cambridge University and NHS Blood and Transplant
Cambridge, UK
Takao Minagi Benesis Corporation
Kyoto, Japan
Saeko Mizusawa/Yoshiaki Okada National Institute of Infectious Diseases
Tokyo, Japan
Elisa Moretti/Francesca Bonci BioSC-Kedrion S.p.A.
Bolognana-Lucca, Italy
Tonya Mixson/Saleem Kamili Centers for Disease Control and Prevention
Atlanta, USA
Andreas Nitsche/Marco Kaiser Robert Koch-Institut
Berlin, Germany
Mats Olsson/Anders Olofsson Octapharma
Stockholm, Sweden
Giulio Pisani/Francesco Marino CRIVIB, Istituto Superiore di Sanità
Rome, Italy
James Wai Kuo Shih Xiamen University
Fujian, China
Ko Suzuki Central Blood Institute, Japanese Red Cross Society
Tokyo, Japan
Isabelle Thomas Scientific Institute of Public Health,Brussels, Belgium
Youchun Wang/Yansheng Geng
National Institutes for Food and Drug Control
Beijing, China
Jürgen Wenzel/Wolfgang Jilg University of Regensburg
Regensburg, Germany
WHO/BS/2011.2175
Page 29
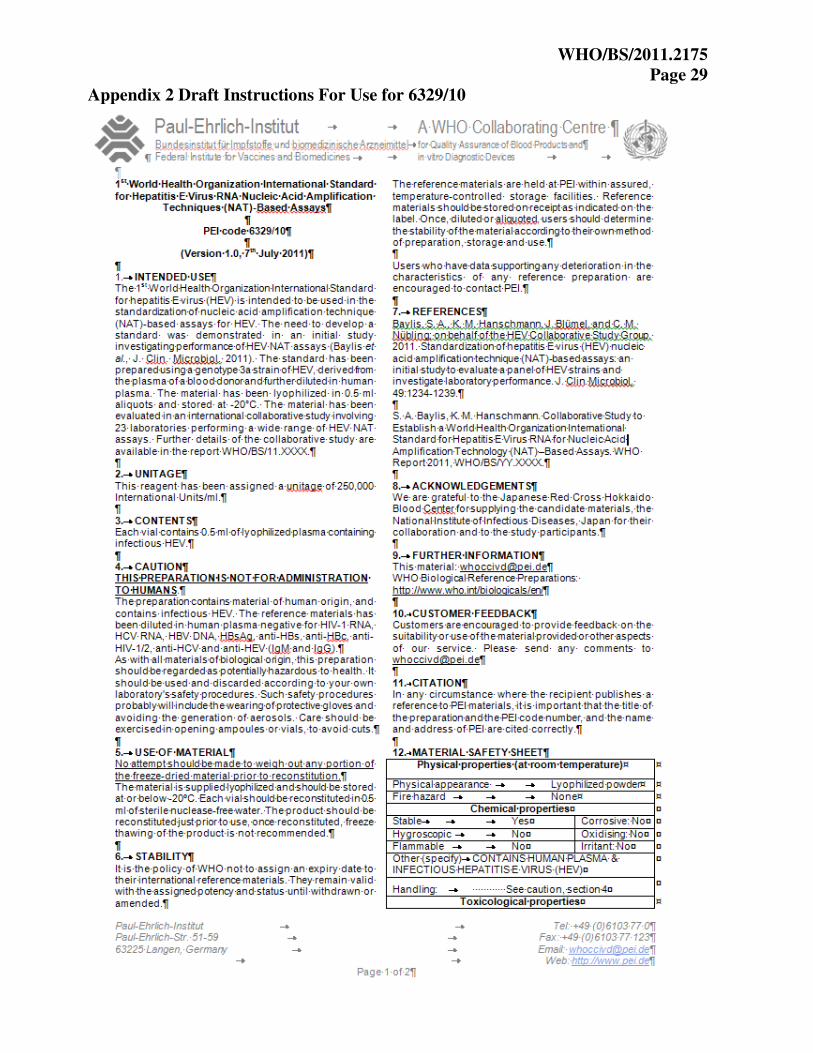
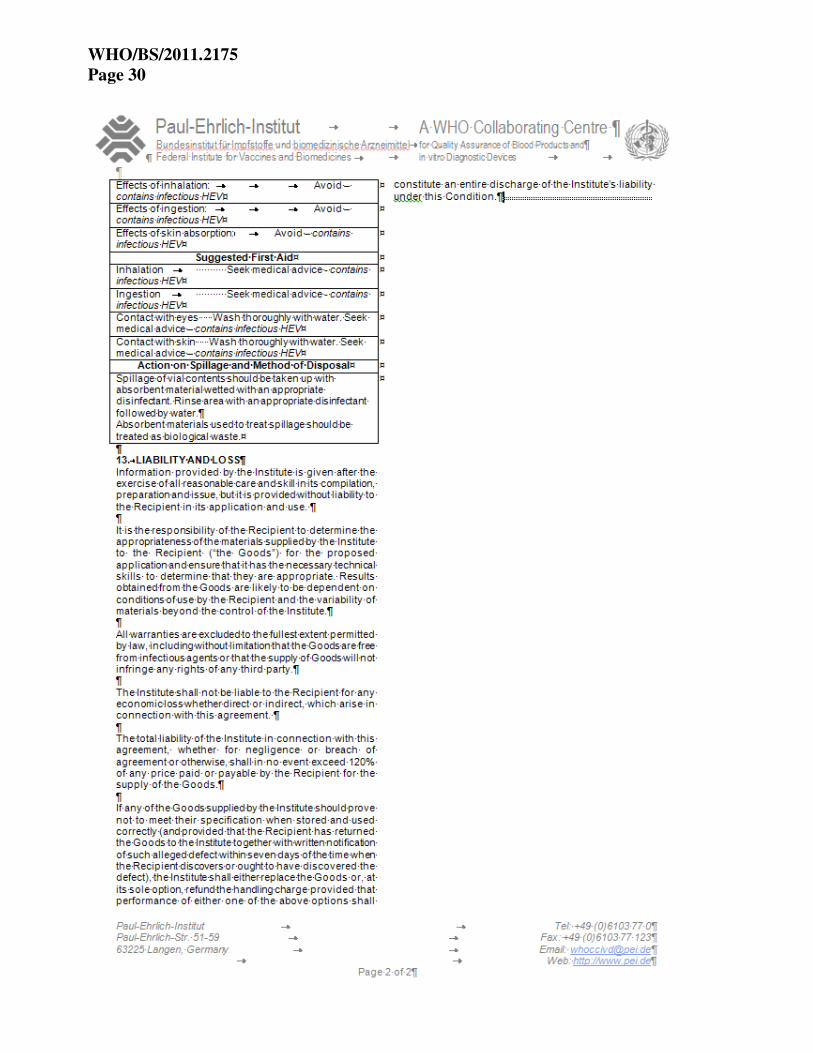
Appendix 2 Draft Instructions For Use for 6329/10
WHO/BS/2011.2175
Page 30