Embed Size (px)
Citation preview

Proceedings of the Annual Stability Conference
Structural Stability Research Council Orlando, Florida, April 12-15, 2016
Collapse Analyses on Spirally Welded Tapered Tubes using EC3 Generated Imperfections
Abdullah Mahmoud1, Shahabeddin Torabian2, Angelina Jay3, Fariborz Mirzaie4, Andrew T. Myers5, Eric Smith6, Benjamin W. Schafer7 Abstract This paper is a part of an ongoing numerical and experimental study on steel spirally welded tapered tubes applicable to wind turbine towers. Such tubes are usually thin-walled and are known to be sensitive to different types of geometric imperfections and boundary conditions. The European Standard on the Strength and Stability of Metal Shells EN 1993-1-6:2007, has organized design of hollow shelled structures into three classes: Excellent, High, and Normal (designated A, B, and C, respectively) according to the quality of manufacturing and construction. EN 1993-1-6 allows shell finite element models to be used to determine capacity, a general method with great potential but unique challenges for the analyst/engineer. Adopting numerically generated imperfection patterns and magnitudes according to EN 1993-1-6, a set of material and geometric nonlinear shell finite element analyses has been performed on spirally welded tapered tubes recently tested under flexure at the STReSS Lab at Northeastern University. A comparison between the numerical models with different levels of imperfections and the tested specimens in terms of moment-rotation response, stiffness, and failure modes has been utilized to propose a modeling protocol for thin-walled tapered tubes using generated imperfections based on the design specification. The potential to use the modeling protocol to extend the test results to different sizes of the tubes and different load combinations resembling the loading conditions in the wind turbine tubes are discussed. 1. Introduction Imperfections in circular cylindrical shells have been recognized as a dominant factor in reducing buckling strength (Hutchinson 1971). According to specific tolerance limits of imperfections systematically measured on site or at workshop, Eurocode EC3 (European Standard on the Strength and Stability of Metal Shells EN 1993-1-6:2007) classifies shelled structures to be either Excellent (Class A), High (Class B), or Normal (Class C) (EN 1993-1-6:2007). The code specifies 1 Graduate Research Assistant, Dept. of Civil Engineering, Johns Hopkins University, [email protected] 2 Assistant Research Professor, Dept. of Civil Engineering, Johns Hopkins University, [email protected] 3 Graduate Research Assistant, Dept. of Civil and Env. Eng., Northeastern University, [email protected] 4 Graduate Research Assistant, Dept. of Civil and Env. Eng., Northeastern University, [email protected] 5 Assistant Professor, Dept. of Civil and Environmental Engineering, Northeastern University, [email protected] 6 President, Keystone Tower Systems, [email protected] 7 Professor, Dept. of Civil Engineering, Johns Hopkins University, [email protected]
2
three types of imperfections to be measured to specify the quality of the structure. The imperfections are categorized as dimples (inward and outward bumps), accidental eccentricities (at the edges of the welded plates), and out-of-roundness (ovalization of cross-sections). These types of imperfections are classified separately and the lowest fabrication tolerance quality governs the classification of the entire shell for design purposes. Measurements should be undertaken on the unloaded structure and preferably with the operational boundary conditions. Eurocode EC3 (EN 1993-1-6) is one of the first codes in civil engineering that provides an almost completely analysis-based design option (Rotter 2011). Although buckling design by global numerical (e.g. shell finite element) models benefits from the evolution of computational analysis, it is still a complex analysis to perform. Accordingly, EC3 requires several types of numerical analyses at different levels of complexity to ensure the numerical methods themselves are not barriers to obtaining accurate results. In this paper, imperfection patterns and magnitudes according to EC3 (i.e. EN 1993-1-6) have been utilized to perform a set of material and geometric nonlinear finite element analyses (known, in EC3 language, as a Geometric and Materially Nonlinear Analysis on the Imperfect structure or GMNIA) on the spirally welded tapered tubes recently tested under flexure at the STReSS lab at Northeastern University. The results are compared with test results in terms of moment-rotation response, stiffness, and failure modes. The imperfection pattern is adopted from a Linear Buckling Analysis (LBA) to provide the buckled geometry; and the imperfection magnitude is scaled according to each quality class in EC3 to determine the sensitivity of the tubes to the magnitude of imperfection. The numerical results are compared to test results to validate the models and a modeling protocol is set forth for thin-walled tapered tubes that includes recommendations for the mesh size, modeling of the imperfection, modeling of the material, the type of solver, and analysis step size. This modeling protocol may enable extensions of the test results to tubes with different sizes and load combinations. 2. Summary of the experimental program Experimental work on steel spirally welded thin-walled tapered cylinders was carried out at the STReSS lab at Northeastern University. The test rig consists of two parallel actuators connected to two heavy cross beams. The crossbeams are connected to the end plate of the specimens and transfer monotonic moment applied by hydraulic actuators (see Figure 1). The loading protocol was designed to keep the moment equal at both ends of the tube. Before placing the specimen in the rig, the tested specimens were welded to two 4 in. (102 mm) thick end plates. The end plates are connected to the crossbeams by pre-tensioned high strength bolts which are in turn connected to the actuators and pins. The crossbeams rotate about pins placed at either end, one of which is free to move longitudinally. Eight tapered spirally welded tubes were tested and are studied in this paper to validate the shell finite element models presented in this paper. The dimensions of the specimens were measured (See Fig. 2 and Table 1) and coupon tests (as summarized in Table 3) were completed to get the actual dimensions and material properties of each of the specimens. The spiral specimens are manufactured from steel sheets that are 12 in. [305 mm] wide. The maximum and minimum diameter, height, thickness and angle of tapering listed in Table 1 are the measured dimensions of tested specimens and are used as the initial geometry in the numerical models presented herein.
3
Figure 1: Schematic showing the experimental set-up for large scale bending tests on tapered spirally welded tubes
(Jay et al. 2016). The designation of the specimens (for example SW-325-120°) refer to spirally welded (SW) maximum D/t ratio (325) and angle of placement of the cross weld to the maximum compression at the minimum diameter end (120°). 3. Finite element modeling Failure of thin-walled cylindrical shell structures is often controlled by elastic or elastic-plastic buckling failure modes. Yielding before buckling may occur in stocky cylinders, but other than highly localized yielding it is not expected to be substantial for large diameter applications such as wind turbine towers. A cylindrical shell under different loading conditions may show quite different buckling behavior (Chen 2011). In the following sections, details of the collapse GMNIA models are provided including: element and mesh details, boundary conditions, constraints, material properties, and the imperfection patterns and magnitudes. The results for one of the tested specimens, SW-325-120°, are compared in detail to the moment-rotation response of the tested specimen and the failure modes in the numerical results are compared to the observed failure modes in the experimental program. Test-to-predicted ratios for the ultimate strength and the initial stiffness of all specimens with different imperfection magnitudes aid in finding a modeling protocol for thin-walled spirally welded tubes, as discussed in the following section.

4
Figure 2: Schematic of tapered tube.
Table 1: Dimensions of the tested specimens.
Specimen
Dmax Dmin t L Dmax/t Dmin/t
Tapering angle mm mm mm m Ф
SW-230-0° 761 681 3.30 3.43 231 206 0.67° SW-305-0° 897 812 2.95 3.38 304 275 0.72° SW-325-0° 956 859 2.95 3.40 324 291 0.82°
SW-325-120° 953 870 2.95 3.39 323 295 0.70° SW-325-240° 965 867 2.97 3.36 325 292 0.84°
SW-350-0° 1048 970 3.02 3.37 347 321 0.66° SW-350-120° 1054 962 3.00 3.37 351 321 0.78° SW-350-240° 1067 966 3.02 3.36 353 320 0.86°
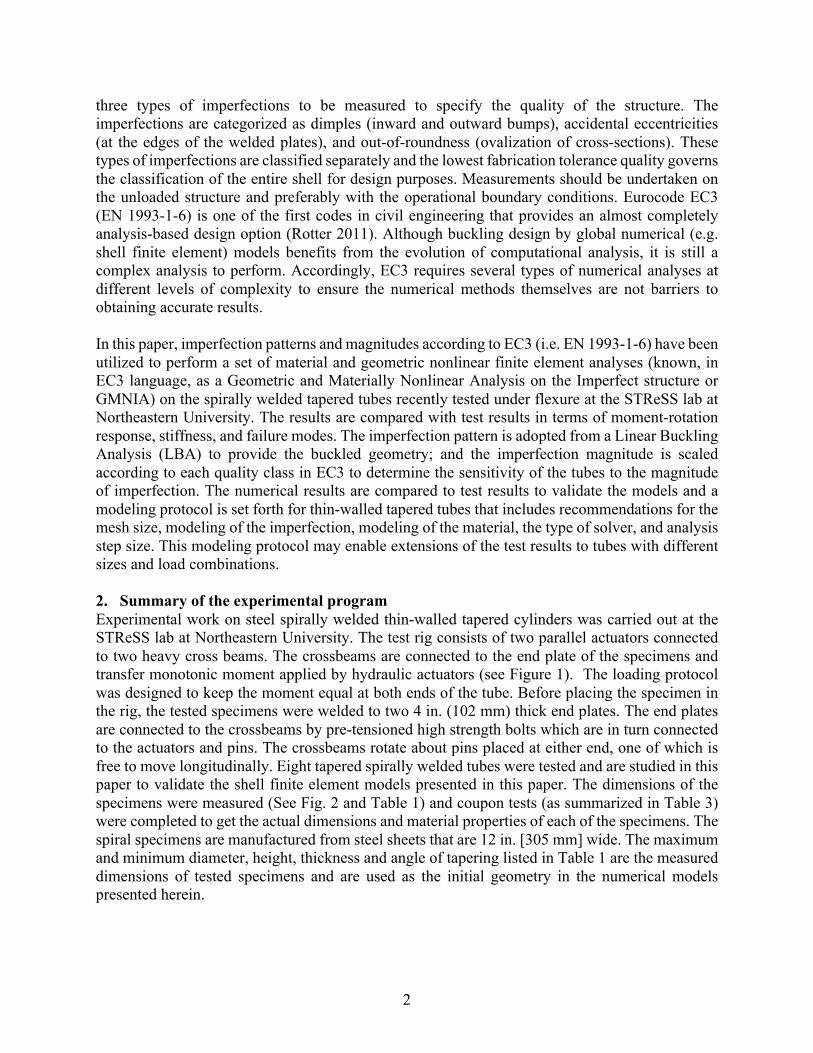
3.1 Mesh geometry The mesh geometry is created to represent all influential aspects of the geometry. The main challenges are to orient the mesh in a way that is compatible with the spiral and cross weld locations, and to provide a proper mesh for the ends, where the spiral mesh interacts with the end plates. Due to the slender geometry of such structures, the mesh geometry has an important influence on the results of the finite element models (Mahmoud et al. 2015). Accordingly, the mesh geometry has been created following a meshing protocol proposed by the authors after a comprehensive sensitivity study on the mesh geometry (Mahmoud et al. 2015) to minimize the mesh effects on the results. Using shell elements is a reasonable choice for modeling thin-walled structures, so long as through-thickness deformations and tri-axial stresses are not significant. The analysis performed herein, in ABAQUS, employs the S4R shell element (Simulia, 2013). Our previous mesh sensitivity study recommended using shell elements with a mesh size less than or equal to 0.5 𝑅𝑡 as shown in Fig. 3.
5
Figure 3: Mesh layout for Specimen SW-325-120° with detail showing mesh oriented at 6° angle of inclination.
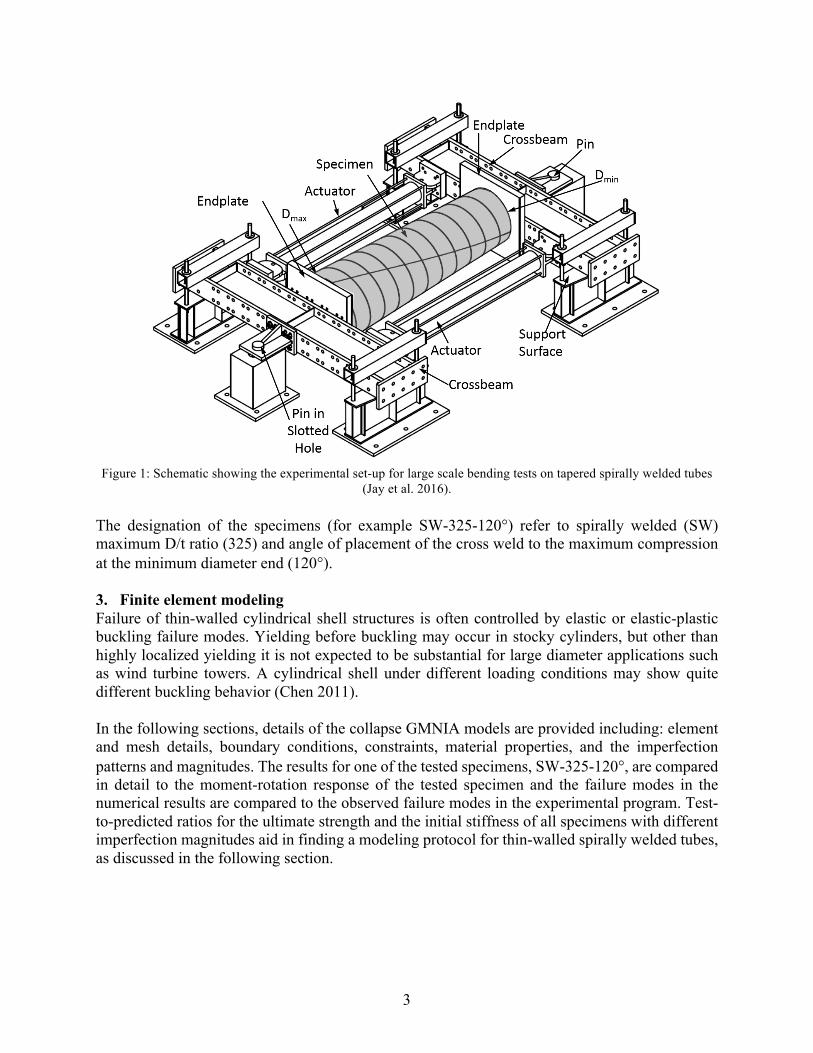
3.2 Boundary conditions and loading The boundary conditions in the numerical models are idealized in accordance with the experimental test rig. Accordingly, the nodes at either end of the tube are connected to a reference point at the center of the end’s cross-section using a multi-point constraint (MPC) that constrains all six degrees of freedom to the reference point. Using this type of constraint mimics the thick end plates in the test rig and prevents any relative deformation between the reference point and the end nodes of the model, but all end nodes are able to displace or rotate in any direction along with the reference point.
Table 2: Restraints of reference points. Control
point Location Ux Uy Uz URx URy URz
RP-1 Larger end reference point X X X
RP-2 Smaller end reference point X X X X
Figure 4: Reference points RP-1 and RP-2 and multi-point constraint and loading.
These boundary conditions also restrict ovalization of the ends (see Figure 4). The boundary conditions as summarized in Table 2 have been defined at the reference points (RP-1 and RP-2).
6
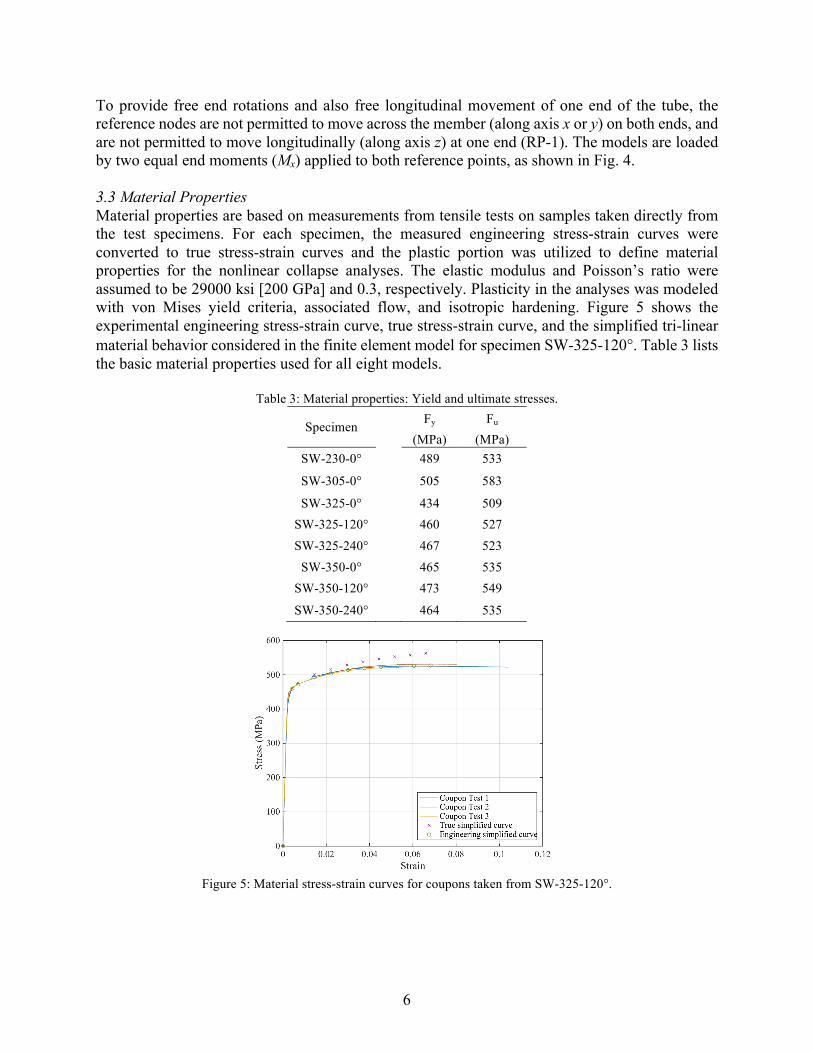
To provide free end rotations and also free longitudinal movement of one end of the tube, the reference nodes are not permitted to move across the member (along axis x or y) on both ends, and are not permitted to move longitudinally (along axis z) at one end (RP-1). The models are loaded by two equal end moments (Mx) applied to both reference points, as shown in Fig. 4. 3.3 Material Properties Material properties are based on measurements from tensile tests on samples taken directly from the test specimens. For each specimen, the measured engineering stress-strain curves were converted to true stress-strain curves and the plastic portion was utilized to define material properties for the nonlinear collapse analyses. The elastic modulus and Poisson’s ratio were assumed to be 29000 ksi [200 GPa] and 0.3, respectively. Plasticity in the analyses was modeled with von Mises yield criteria, associated flow, and isotropic hardening. Figure 5 shows the experimental engineering stress-strain curve, true stress-strain curve, and the simplified tri-linear material behavior considered in the finite element model for specimen SW-325-120°. Table 3 lists the basic material properties used for all eight models.
Table 3: Material properties: Yield and ultimate stresses.
Specimen Fy Fu (MPa) (MPa)
SW-230-0° 489 533
SW-305-0° 505 583
SW-325-0° 434 509 SW-325-120° 460 527 SW-325-240° 467 523
SW-350-0° 465 535 SW-350-120° 473 549
SW-350-240° 464 535
Figure 5: Material stress-strain curves for coupons taken from SW-325-120°.
7
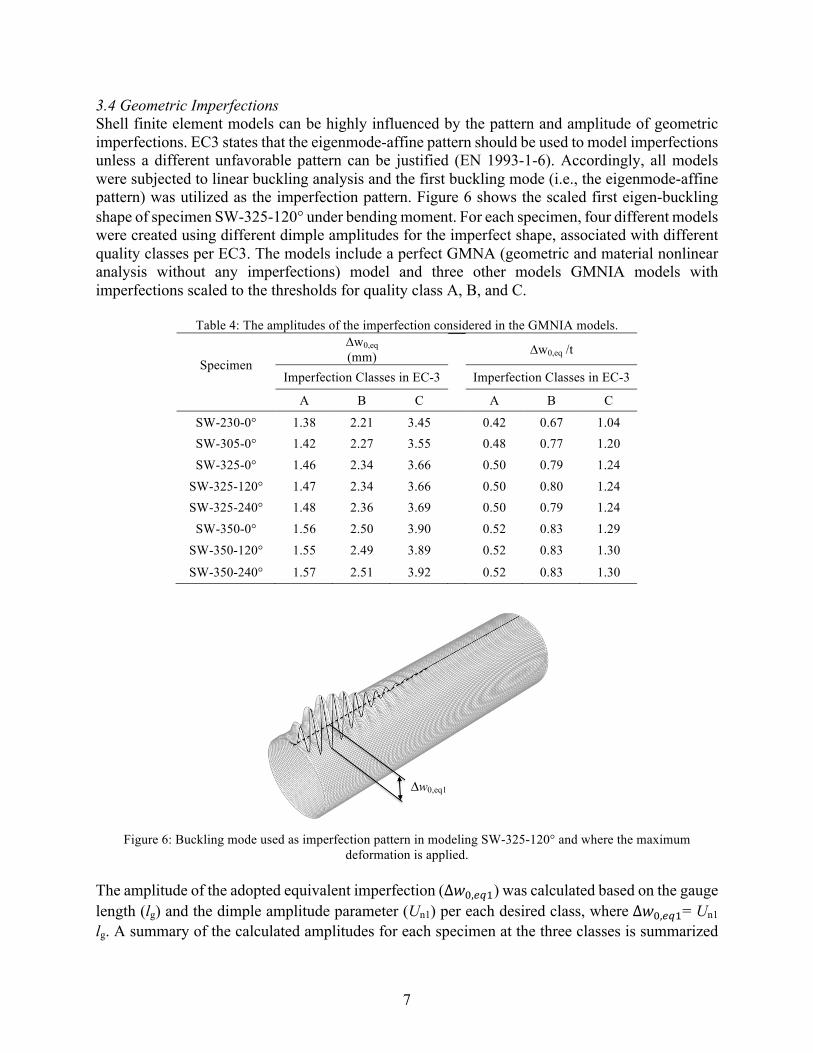
3.4 Geometric Imperfections Shell finite element models can be highly influenced by the pattern and amplitude of geometric imperfections. EC3 states that the eigenmode-affine pattern should be used to model imperfections unless a different unfavorable pattern can be justified (EN 1993-1-6). Accordingly, all models were subjected to linear buckling analysis and the first buckling mode (i.e., the eigenmode-affine pattern) was utilized as the imperfection pattern. Figure 6 shows the scaled first eigen-buckling shape of specimen SW-325-120° under bending moment. For each specimen, four different models were created using different dimple amplitudes for the imperfect shape, associated with different quality classes per EC3. The models include a perfect GMNA (geometric and material nonlinear analysis without any imperfections) model and three other models GMNIA models with imperfections scaled to the thresholds for quality class A, B, and C.
Table 4: The amplitudes of the imperfection considered in the GMNIA models.
Specimen
∆w0,eq (mm) ∆w0,eq /t
Imperfection Classes in EC-3 Imperfection Classes in EC-3 A B C A B C
SW-230-0° 1.38 2.21 3.45 0.42 0.67 1.04 SW-305-0° 1.42 2.27 3.55 0.48 0.77 1.20 SW-325-0° 1.46 2.34 3.66 0.50 0.79 1.24
SW-325-120° 1.47 2.34 3.66 0.50 0.80 1.24 SW-325-240° 1.48 2.36 3.69 0.50 0.79 1.24
SW-350-0° 1.56 2.50 3.90 0.52 0.83 1.29 SW-350-120° 1.55 2.49 3.89 0.52 0.83 1.30
SW-350-240° 1.57 2.51 3.92 0.52 0.83 1.30
Figure 6: Buckling mode used as imperfection pattern in modeling SW-325-120° and where the maximum
deformation is applied. The amplitude of the adopted equivalent imperfection (Δ𝑤(,*+,) was calculated based on the gauge length (lg) and the dimple amplitude parameter (Un1) per each desired class, where Δ𝑤(,*+,= Un1 lg. A summary of the calculated amplitudes for each specimen at the three classes is summarized
Δw0,eq1
8
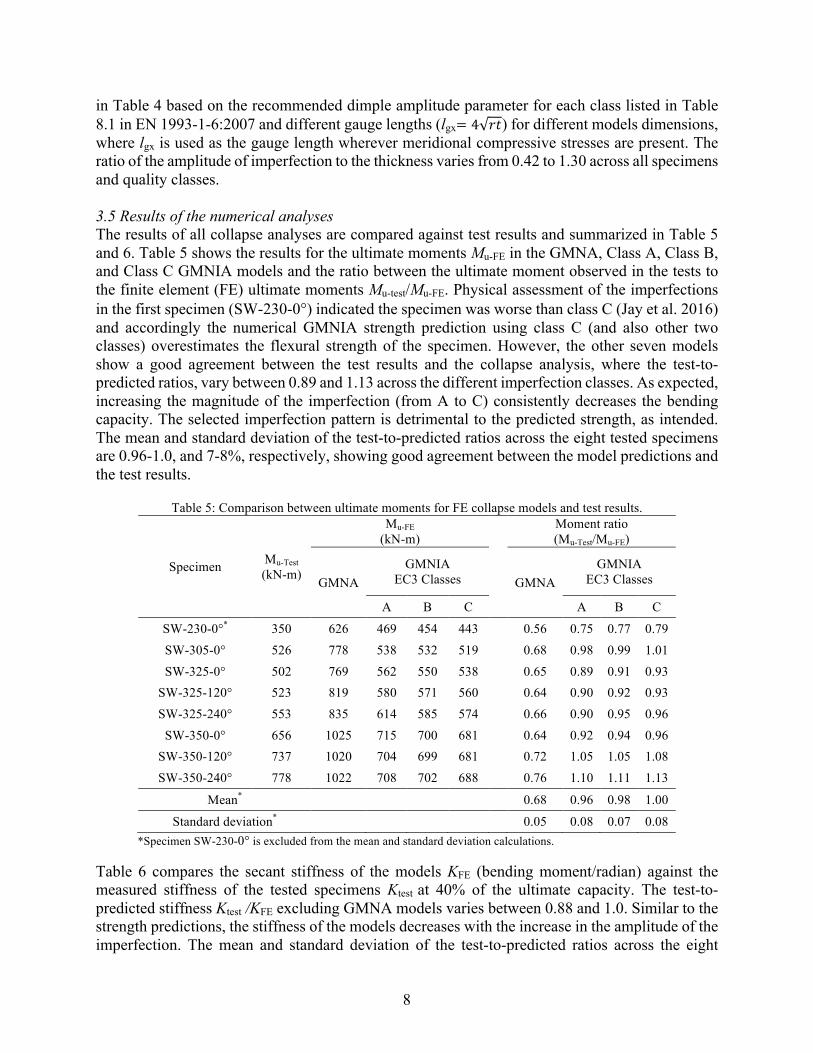
in Table 4 based on the recommended dimple amplitude parameter for each class listed in Table 8.1 in EN 1993-1-6:2007 and different gauge lengths (lgx= 4 𝑟𝑡) for different models dimensions, where lgx is used as the gauge length wherever meridional compressive stresses are present. The ratio of the amplitude of imperfection to the thickness varies from 0.42 to 1.30 across all specimens and quality classes. 3.5 Results of the numerical analyses The results of all collapse analyses are compared against test results and summarized in Table 5 and 6. Table 5 shows the results for the ultimate moments Mu-FE in the GMNA, Class A, Class B, and Class C GMNIA models and the ratio between the ultimate moment observed in the tests to the finite element (FE) ultimate moments Mu-test/Mu-FE. Physical assessment of the imperfections in the first specimen (SW-230-0°) indicated the specimen was worse than class C (Jay et al. 2016) and accordingly the numerical GMNIA strength prediction using class C (and also other two classes) overestimates the flexural strength of the specimen. However, the other seven models show a good agreement between the test results and the collapse analysis, where the test-to-predicted ratios, vary between 0.89 and 1.13 across the different imperfection classes. As expected, increasing the magnitude of the imperfection (from A to C) consistently decreases the bending capacity. The selected imperfection pattern is detrimental to the predicted strength, as intended. The mean and standard deviation of the test-to-predicted ratios across the eight tested specimens are 0.96-1.0, and 7-8%, respectively, showing good agreement between the model predictions and the test results.
Table 5: Comparison between ultimate moments for FE collapse models and test results.
Specimen Mu-Test (kN-m)
Mu-FE (kN-m) Moment ratio
(Mu-Test/Mu-FE)
GMNA GMNIA
EC3 Classes GMNA
GMNIA EC3 Classes
A B C A B C
SW-230-0°* 350 626 469 454 443 0.56 0.75 0.77 0.79 SW-305-0° 526 778 538 532 519 0.68 0.98 0.99 1.01 SW-325-0° 502 769 562 550 538 0.65 0.89 0.91 0.93
SW-325-120° 523 819 580 571 560 0.64 0.90 0.92 0.93 SW-325-240° 553 835 614 585 574 0.66 0.90 0.95 0.96
SW-350-0° 656 1025 715 700 681 0.64 0.92 0.94 0.96 SW-350-120° 737 1020 704 699 681 0.72 1.05 1.05 1.08 SW-350-240° 778 1022 708 702 688 0.76 1.10 1.11 1.13
Mean* 0.68 0.96 0.98 1.00
Standard deviation* 0.05 0.08 0.07 0.08 *Specimen SW-230-0° is excluded from the mean and standard deviation calculations.
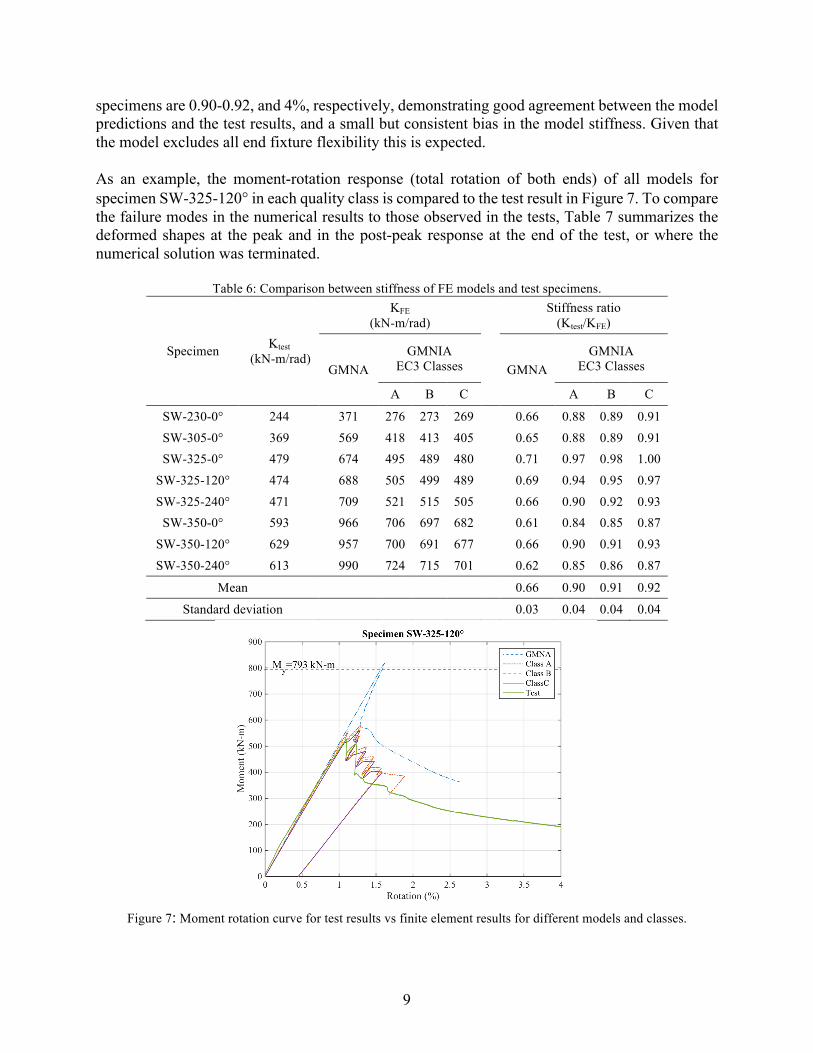
Table 6 compares the secant stiffness of the models KFE (bending moment/radian) against the measured stiffness of the tested specimens Ktest at 40% of the ultimate capacity. The test-to-predicted stiffness Ktest /KFE excluding GMNA models varies between 0.88 and 1.0. Similar to the strength predictions, the stiffness of the models decreases with the increase in the amplitude of the imperfection. The mean and standard deviation of the test-to-predicted ratios across the eight
9
specimens are 0.90-0.92, and 4%, respectively, demonstrating good agreement between the model predictions and the test results, and a small but consistent bias in the model stiffness. Given that the model excludes all end fixture flexibility this is expected. As an example, the moment-rotation response (total rotation of both ends) of all models for specimen SW-325-120° in each quality class is compared to the test result in Figure 7. To compare the failure modes in the numerical results to those observed in the tests, Table 7 summarizes the deformed shapes at the peak and in the post-peak response at the end of the test, or where the numerical solution was terminated.
Table 6: Comparison between stiffness of FE models and test specimens.
Specimen Ktest
(kN-m/rad)
KFE (kN-m/rad)
Stiffness ratio (Ktest/KFE)
GMNA GMNIA
EC3 Classes GMNA
GMNIA EC3 Classes
A B C A B C
SW-230-0° 244 371 276 273 269 0.66 0.88 0.89 0.91 SW-305-0° 369 569 418 413 405 0.65 0.88 0.89 0.91 SW-325-0° 479 674 495 489 480 0.71 0.97 0.98 1.00
SW-325-120° 474 688 505 499 489 0.69 0.94 0.95 0.97 SW-325-240° 471 709 521 515 505 0.66 0.90 0.92 0.93
SW-350-0° 593 966 706 697 682 0.61 0.84 0.85 0.87 SW-350-120° 629 957 700 691 677 0.66 0.90 0.91 0.93 SW-350-240° 613 990 724 715 701 0.62 0.85 0.86 0.87
Mean 0.66 0.90 0.91 0.92
Standard deviation 0.03 0.04 0.04 0.04
Figure 7: Moment rotation curve for test results vs finite element results for different models and classes.

10
Table 7: Comparison between the deformed shapes from the tests and finite element analyses at peak and at post-
buckling. Peak Post-buckling
Test
Class A
Class B
Class C
4. Conclusions In this study, the EC3 design method using GMNIA buckling analysis has been compared to experimental results and a modeling protocol has been proposed for modeling steel tapered spirally welded tubes using generated imperfections. The generated imperfection pattern using the first mode of buckling under uniform bending moments and implementing different classes of imperfection magnitudes, per different quality classes, showed reasonable agreement with test results in terms of strength and stiffness, where the mean and standard deviation of test-to-predicted ratios for strength with quality class C were (1.0 and 0.08) and for stiffness were (0.92 and 0.04), respectively.

11
Acknowledgement The authors gratefully acknowledge the financial support of the US National Science Foundation through grant CMMI-1334122 and CMMI-1334489. Any opinions, findings, and conclusions or recommendations expressed in this material are those of the authors and do not necessarily reflect the views of the National Science Foundation. Additionally, the authors acknowledge the support from Northeastern University’s Laboratory for Structural Testing of Resilient and Sustainable Systems (STReSS Lab) at the George J. Kostas Research Institute for Homeland Security. References BS EN 1993-1-6:2007 (2007) “Eurocode 3 Design of steel structures Part 1-6: Strength and Stability of Shell
Structures” Chen L. (2011) “Buckling of Circular Steel Cylindrical Shells under Different Loading Conditions” PhD Thesis, The
University of Edinburgh. Hutchinson J. W. et al. (1971) “Effect of a local axisymmetric imperfection on the buckling behavior of a circular
cylindrical shell under axial compression”, AIAA journal, 48-52 Jay A. et al (2016) “The Effect of Geometric Imperfections on the Flexural Buckling Strength of Tapered Spirally
Welded Steel Tubes”, SSRC Annual Stability Conference Proceedings. Mahmoud A. et al. (2015) “Modeling protocols for elastic buckling and collapse analysis of spirally welded circular
hollow thin-walled sections”, SSRC Annual Stability Conference Proceedings. Rotter J.M. and Schmidt H. (2013) “Buckling of Steel Shells European Design Recommendations - 5th Edition” ECCS
– European Convention for Constructional Steelwork Rotter J.M. (2011) “The New Framework for Shell Buckling Design and the European Shell Buckling
Recommendations Fifth Edition”, Journal of Pressure Vessel Technology, Vol. 133, 011203-(1-9) Simulia. (2013). ABAQUS 6.13. (www. Simulia.com).