Embed Size (px)
Citation preview
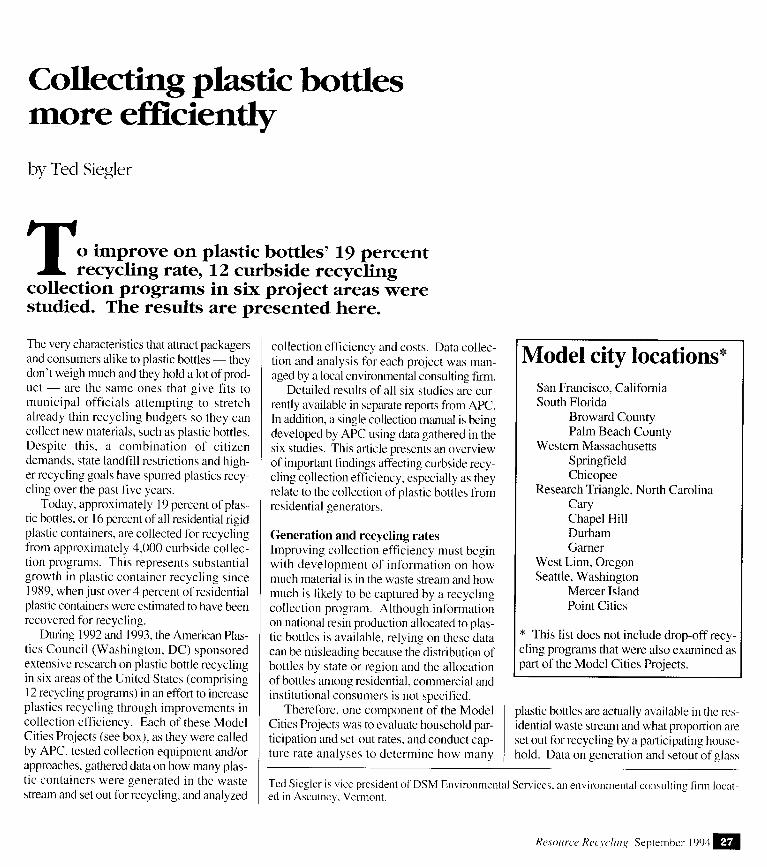
Collecthg plastic bottles more efficiently
by Tecl Siegler
T o improve on plastic bottles’ 19 percent recycling rate, 12 curbside recycling
collection programs in six project areas were studied. The results are presented here.
The very characteristics that attract packagers and consumers alike to plastic bottles - they don’t weigh much and they hold a lot of prod- uct - are the same ones that give fits to municipal officials attempting to stretch already thin recycling budgets so they can collect new materials, such as plastic bottles. Despite this, a combination of citizen demands, state landfill restrictions and high- er recycling goals have spurred plastics recy- cling over the past five years.
Today, approximately 19 percent of plas- tic bottles. or 16 percent of all residential rigid plastic containers, are collected for recycling from approximately 4,000 curbside collec- tion programs. This represents substantial growth in plastic container recycling since 1989, when just over 4 percent of residential plastic containers were estimated to have been recovered for recycling.
During 1992 and 1993, the Ameritan Plas- tics Council (Washington, DC) sponsored extensive research on plastic bottle recycling in six areas of the United States (comprising 12 recycling programs) in an effort to increase plastics recycling through improvements in collection efficiency. Each of these Model Cities Projects (see box), as they were called by APC, tested collection equipment and/or approaches, gathered data on how many plas- tic containers were generated in the waste stream and set out for recycling. and analyzed
collection efficiency and costs. Data collec- tion and analysis for each project was man- aged by a local environmental consulting firm.
Detailed results of al1 six studies are cur- rently available in separate reports from APC. In addition, a single collection manual is being developed by APC using data gathered in the six studies. This article presents an overview of important findings affecting curbside recy- cling collection efficiency, especially as they relate to the collection of plastic bottles from residential generators.
Generation and recycling rates Improving collection efficiency must begin with development of information on how much material is in the waste stream and how much is likely to be captured by a recycling collection program. Although information on national resin production allocated to plas- tic bottles is available, relying on these data can be misleading because the distribution of bottles by state or region and the allocation of bottles among residential, commercial and institutional consumers is not specified.
Therefore, one component of the Model Cities Projects was to evaluate household par- ticipation and set-out rates, and conduct cap- ture rate analyses to determine how many
Model City locations* San Francisco, California South Florida
Broward County Palm Beach County
Western Massachusetts Springfield Chicopee
Research Triangle, North Carolina CarY Chape1 Hill Durham Garner
West Linn, Oregon Seattle, Washington
Mercer Island Point Cities
’ This list does not include drop-off recy- :ling programs that were also examined as )art of the Model Cities Projects.
plastic bottles am actually available in the res- idential waste stream and what proportion are set out for recycling by a participating house- hold. Data on generation and setout of glass
Ted Siegler is vice president of DSM Environmental Services. an environmental conwlting firm locat- ed in Ascutney. Vermont.

containers and aluminum and steel cans were also collected, which provide a useful addi- tion to the data on these materials that other trade associations, municipalities and private haulers may have developed.
Participation t-ates were detined as the per- cent of households on a given route setting out recyclables at least one time during a month. Set-out rates were defined as the per- cent of households on a given route setting out recyclables on a single collection day. Capture rates were defined as the weight of designated materials recovered, divided by the weight of the total designated materials available. For al1 of the Model Cities Proj- ects, “available” was defined as the total amount of material placed at the curb for recy- clin& (in the set-out bin or bag) and placed at the curb for disposal (in the trash can or bag) for a collection time period of equal duration.
It is important to note here that the data presented in this article represent averages and that there are variations among regions of the country in the use of plastic bottles and, therefore, in the quantities potentially avail- able for recycling. For example, different areas of the country prefer milk in polycoat- ed paperboard containers, HDPE jugs or retumable glass milk jugs.
Total household generation ’ Table 1 presents data on total household dis-
W Table 1 - Recyclable containers potentially available per household (1)
,- Bottle bill states MA OR
CA Aver, IWANoJo-bottle$ill “;,-,
(pounds oer vear) -2 Y (pounds per vear) -Q Cr
Al1 plastic bottles 29 30 15 25 10.5 26 37 42 35 12.3
Glass con- tainers 122 183 193 166 70.8 253 180 171 201 70.5
Aluminum cans 2 6 7 5 2.1 20 14 16 17 6.0
Steel cans 50 42 25 39 16.6 32 N.A. N.A. 32 ll.2 Total
containers 203 261 239 234 100.0 330 230 228 285 100.0
N.A. = Not applicable. (1) Totals may not add up due to rounding. Source: Ameritan Plastics Council, 1994.
posal of plastic bottles and other recyclable households in states with and without bever- containers. The term “disposal” is used age container deposit or redemption systems because bottles returned for deposit or to a (hereafter called “bottle bill states” and “non- buy-back center were not included in these bottle bill states”) because of the impact on studies. Data presented in Table 1 are based aluminum, glass and soda PET bottle discards on sorting al1 household waste placed at the associated with deposit laws. (For the pur- curb for disposal and recycling from over pose of this study, California has been includ- 1,000 sample households in the six Model ed as a bottle bill state, even though the Cal- Cities Projects. In most cases, disposal rates ifornia system differs from the more tradi- for a single route are based on a sample of tional container deposit systems in place in approximately 1 OO households. Oregon and Massachusetts.)
Table 1 presents the data separately for As Table 1 illustrates, household contain-
M.A.700 SERIES GRANULATORS... HEAVYWEIGHTS THAT ARE RUGGED ENOUGH
To TAKE ON ANY SCRAP Reliable construction of M.A. Granulators assures trouble- free operations and longer life because they are designed for handling post consumer plastic reclamation as well as ordinary plant scrap.
Standard features include air purged bearings, solid 4 140 forged steel rotor and replaceable bed blade inserts.
The rotor bearing journals are heat treated to a high degree for strength and durability
while effective cleaning is made possible by machining the interna1 surfaces to an exceptionally smooth finish.
For granulators with a reputation of quality and reliability, these rugged
heavyweights are unbeatable.
. ..@om indi,,iduul components to complete rvcyling systems. L-~ L ~ , ‘Ii Open High Shear Applications:
Open Steep Angle Applications: ~_ A i M,A, INDUmRIES, ING. = = = ss e E available in 3 or 5 knife rotor
available in 3 or 5 knife rotor Pip. pívj~le, .sheet.,film.
g ,ez 1 Quality Products Through Creative Research Thick .scction pipe. sheet. molding trim. ri~yid umtainers. tire shreddings. and
the~mofo~niin,s s<.,-a,, and ji’he~. i / P.0. Box 2322,303 Dividend Drive, Peachtree City, GA 30269 linht pqirys up to 112” thi<,kne.ss.
(404) 487-7761 Fax (404) 487-2710 Telex 54-2685 Circle 120 on RR service card

er discards in states with bottle bills average 234 pounds per year of plastic bottles, alu- minum-and steel cans, and glass containers, either as solid waste or recyclables; in non- -bottle bill states, total discards average 285 pounds per year. Due to other packaging vari- ables among the states, the 5 1-Pound differ- ence cannot necessarily be assumed to be con- tainers diverted via the deposit system. Other nonpackaging variables, such as the preva- lence of buy-back recycling centers, may con- tribute to this difference as well.
Plastic represents approximately 1 1 per- cent by weight or 25 pounds per year per household of total recyclable containers in the waste stream in bottle bill states and 13 percent or 35 pounds per year per household in non-bottle bill states.
Composition of the plastic hottle stream Table 2 illustrates the composition of plastic bottles in the household waste stream. Twenty-two pounds, or approximately 90 per- cent, of the plastic bottles in the average bot- tle bill state household waste stream are two resins: PET (3.4 pounds) and HDPE (18.8 pounds). PVC bottles represent, on average, 0.5 pounds per year, or 2.2 percent of plastic bottles.
The remaining resin types (PP, LDPE, PS des representing the majority of these other and other) account for only 0.6 pounds per bottles. year, or 2.3 percent, with polypropylene bot- The difference between bottle bill and non-
bottle bill states is especially significan1 when the composition of plastic bottles is compared. In non-bottle bill states, soda PET bottles are
It’s simple. Smaller, higher density bales nquk less storage, shipping and handling. And yield greater profit. That’s what the 2646 Plastics Baling System . fi-om Frontier is al1 about.
Every 30 minutes, this economical system produces bales so compact, you can load in excess of 45,000 lbs. on a 48’ trailer.
the 2646 System’s newly patented technology enables it ( trates ( ptastics]or tess tnan 1 qiro. - to generate the throughput of much larger, more expensive systems.
To leam more about this exciting new dimension in recycling, give us a call at (3 12) 6264050.
& COMPANY
Rugged and Reliable n
MODEL 102 AUTOMATIC WIRE TYER
HIGHER PRODUCTION SPEED LOWER OPERATING COSTS
Designed specifically for the recycling, solid waste and
non-ferrous industries. For more information, contact
the leaders in wire tying technology:
GERRARD WIRE PRODUCTS 13350 N. E. Whitaker Way
Portland, OR 97230 (503) 252-9009
Circle 206 on RR service card Circle 7 on RR service card
Rrsource Reqrling September 1994E)3
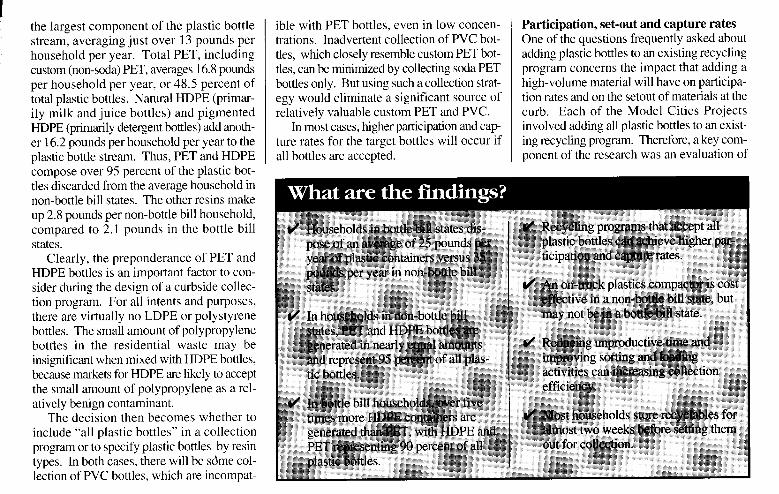
the largest component of the plastic bottle stream, averaging just over 13 pounds per household per year. Total PET, including custom (non-soda) PET, averages 16.8 pounds per household per year, or 48.5 percent of total plastic bottles. Natural HDPE (primar- ily milk and juice bottles) and pigmented HDPE (primarily detergent bottles) add anoth- er 16.2 pounds per household per year to the plastic bottle stream. Thus, PET and HDPE compose over 95 percent of the plastic bot- tles discarded from the average household in non-bottle bill states. The other resins make up 2.8 pounds per non-bottle bill household, compared to 2.1 pounds in the bottle bill states.
Clearly, the preponderance of PET and HDPE bottles is an important factor to con- sider during the design of a curbside collec- tion program. For al1 intents and purposes, there are virtually no LDPE or polystyrene bottles. The small amount of polypropylene bottles in the residential waste may be insignilicant when mixed with HDPE bottles, because markets for HDPE are likely to accept the small amount of polypropylene as a rel- atively benign contaminant.
The decision then becomes whether to include “al1 plastic bottles” in a collection program orto specify plastic bottles by resin types. In both cases, there will be sdme col- lection of PVC bottles, which are incompat-
ible with PET bottles, even in low concen- trations. Inadvertent collection of PVC bot- tles, which closely resemble custom PET bot- tles, can be minimized by collecting soda PET bottles only. But using such a collection strat- egy would eliminate a significant source of relatively valuable custom PET and PVC.
In most cases, higher participation and cap ture rates for the target bottles will occur if al1 bottles are accepted.
Participation, set-out and capture rates One of the questions frequently asked about adding plastic bottles to an existing recycling program concerns the impact that adding a high-volume material will have on participa- tion rates and on the setout of materials at the curb. Each of the Model Cities Projects involved adding al1 plastic bottles to an exist- ing recycling program. Therefore, a key com- ponent of the research was an evaluation of
COMPREHENSIVE - DRYING SYSTEMS SO
WE GUARANTEE PROCESS PERFORMANCE
Check out The Carrier Advantage in
l Vibrating or Stationaty RESIN-PELLET PROCESSING: Dewater, Dty, Cool,
Screen or Feed RECYCLING PLASTICS: Dry PET and HDPE to exact
specs - no melting or fusing CRYSTALLIZE PET in the same unit.
Vibrating Equipment, /nc.
circle 405 on RR service card
m Resource Recycling September 1994
pre- and post-plastic collection participation and set-out rates.
Participation rates. Although participa- tion rates of 80 to 90 percent are often referred to in the recycling literature, before plastics recycling collection was introduced, mea- sured monthly participation rates in five of tbe six Model Cities Projects averaged 63 per- cent, ranging from a low of 60 to a high of 70 percent.
Adding al1 plastic bottles to a recycling program appeared to increase monthly par ticipation in recycling by an average of 8 per- centage points. Post-plastic monthly partic- ipation rates averaged 7 1 percent and ranged from a low of 65 to a high of 75 percent, when measured approximately six to nine months after plastics recycling collection began.
At least three factors may have played a role in the observed increase in participation
ir rates associated with the addition of plastic bottle collection. First, some households began recycling as a result of adding plastics to the list of recyclables collected. Second, there was substantial publicity about the addi- tion of plastic bottles to each of the recycling programs. It is likely that this publicity spurred at least a temporary increase in over- al1 recycling participation by some house- holds. Third, the set-out rate increased due to the introduction of plastic bottles (see below). Thus, some households setting out recyclables less frequently than once a month now set out recyclables during the month and thus were counted as monthly participants.
Set-out rates. Although monthly partic- ipation is one important indicator of the suc- cess of a curbside recycling collection pro- gram, information on the number of house- holds actually setting out recyclables on any given collection day determines the volume of material, and therefore truck capacity, as well as the number of stops that must be made on-route. Normally, either truck capacity or the number of stops is the limiting factor in the design of collection routes.
It was anticipated that adding al1 plastic bottles would increase the number of times per month that a household would set out recyclables, because collecting more materi- als for recycling means using more room to store them between pickups. Set-out rates were analyzed for 12 separate collection pro- grams within the six Model Cities Projects. Five of the programs involved bi-weekly col- lection and seven involved weekly collection.
Pre-plastic collection set-out rates were measured in two of the five bi-weekly pro- grams and six of the seven weekly programs. Set-out rates were measured in al1 12 pro- grams after plastics collection was initiated. The average increase in set-out rates was 8 percentage points for the weekly programs and 5 percentage points for the two bi- weekly programs where both pre- and post- plastics collection rates were measured.
There are two observations that can be made about set-out rates measured in the Model Cities Projects. First, the average post- plastic set-out rate for the live bi-weekly pro-
grams was ll percentage points higher than for the seven weekly programs. The average set-out rate for the five bi-weekly programs was 59 percent, ranging from 43 to 72 per- cent of al1 households on the route. The aver- age set-out rate for weekly collection pro- grams was 48 percent, ranging from 22 to 67 percent of al1 households.
Second, while it was anticipated that adding plastics would fil1 set-out containers too soon, when a second set-out bin or mesh or plastic bags specifically for plastics were provided to households, in most cases resi- dents continued to use the single set-out con- tainer, and simply increased the frequency of their setouts. Often, if there was more recy- clable material than would fit in the collec- tion container, the extra materials were placed in a paper or plastic grocery bag next to the set-out container.
Capture rates. Not al1 of the material gen- erated in a household will be set out for recy- cling collection. To determine capture rates for each type of container, household waste placed at the curb for disposal and recycling was sorted for representative routes within each Model Cities Project. Table 3 presents the range of capture rates observed across the six Model Cities Projects.
As illustrated in Table 3, glass containers showed the highest capture rates, averaging 80 percent. Capture rates for steel and alu- minum cans were similar, averaging 68 per- cent and 7 1 percent, respectively. Plastic bot- tles, the “new kid on the block,” had the low-
,f 12 yeur old Rvan &ant _--- _-_- --f ---- -- ----- S Two - -- _ - --aa -- mn
save,
l Five 30 foot Trees ~“,, , , 0 1500 Kilowatts of Electricity
l 3 1/2 Cubic Yards of Landfill Space, and.. l Reduce Air Pollution by 19 Ibs.
unti/ ít becomes an Amerícan padme! TWO-SORO” Universal Recycling Container for...
l Manual Co-Mingle Curbside l ApartmentsKondos (where gen- Collection erators deposit recyclables into 1
. Semi-Automated Co-Mingle larger recycling containers with- Curbside Co-Collection in common recycling areas)
l Semi-Automated 3 SorI Co-Mingle l School Classrooms Curbside Collection . Offices and Work Environments
Call l-800-328-4577 for your authorized local dealer. See you at the NRC Show -1
Circle 250 on RR service card
Resource Recycling September 1994 m

est capture rate, averaging 55 percent, but nat- ural HDPE capture rates at 70 percent were comparable to those for steel and aluminum.
It was observed during the sorting that con- tainers generated outside of the kitchen area were less likely to be recovered for recycling. It is also important to note that capture rates for the lighter weight aluminum and plastic containers are probably understated because the weight of liquids and food wastes on the sides of these containers when pulled from the trash increased the estimated weight of the nonrecycled containers compared to the clean containers set out for recycling. Lighter weight materials are affected more signifi- cantly by this contamination factor than are heavier weight materials.
Calculating truck requirements Table 4 illustrates the use of set-out and cap- ture rates to estimate recycling truck require- ments, based on a 1 ,OOO-household route, assuming weekly collection of glass con- tainers, steel and aluminum cans, al1 plastic bottles and some mix of paper (e.g., newspa- pers and white paper).
Recycling of paper was studied only peripherally in the Model Cities Projects. Paper volumes vary widely, depending on the type of paper collected (e.g., old newdpapers VS. old corrugated containers) and demo-
n Table 3 - Average measured capture rates for recyclable containers
Average capture rate Bottle bill states Non-bottle bill states [% of total available] (% ranpe) (% range)
Glass containers 80 Steel cans 68 Aluminum cans 71 Al1 plastic bottles 55 HDPE natural 70 HDPE pigmented 39 PET soda 60 PET custom 48 PVC 39 Al1 other plastic bottles 20
77-88 56-93 60-88 53 (1) 69-84 56-85 39-65 50-66 55-87 70-72 21-47 41-56 37-61 60-75 27-56 47-61 13-44 51-54 lo-18 17-39
(1) Steel cans were collected in only two of the non-bottle bill Model Cities Projects and were no1 reported separately from aluminum in one of those two projects.
Source: Ameritan Plastics Council, 1994.
graphics (e.g., substantially more old news- papers are generated in Washington, DC than in Burlington, Vermont). Observations in six Model Cities Projects were that paper occu- pied approximately two-thirds of a truck’s usable capacity in bottle bill states and around one-half of a truck’s capacity in non-bottle bill states. For illustrative purposes in Table 4, it is assumed that 10 cubic yards are avail- able for bottles and cans on a standard 30- cubic-yard truck.
In Table 4, weekly generation rates observed in the six Model Cities Projects were divided into averages for bottle bill and non-bottle bill states. These weekly generation rates were multiplied by observed average capture rates for each material and then by the number of weeks of accumulated material set out at the curb by a participating household.
Analyses of the number of times a partic- ipating household actually placed its set-out container at the curb for recycling during the
WASTE PAPER STARCART
thenextgeneration
CALLFORlOURFREECA'G4LX)GUE
15400 OLD SIMCOE RD. PORT PERRY, ONTARIO CANADA L9L 1 L8
PLASTICS INC- FAX (905) 985-0265
Templete systems: Bale feeder, Metal separation, Pre-grinder, Conveyors, Aspirators, Washer/Dryer, Granulator, Box filling station, Dust collector
For conversion of contaminated thermoplastics into clean, dly flake.
Assures high quality, post-consumer resin.
PlastiCycle Industries, Inc. 1500 Galloway St. Eau Claire, WI 54703 (715) 835-3233 Fax (715) 833-2464
Circle 243 on RR service card Circle 392 on RR service card
m Resourcr Reqcling September 1994

W Table 4 - Determining truck requirements for weekly collection of recyclable containers (1)
7 Quantity of material per stop Weeks of
1 r Number of stops Total Set-outl I
Truck requirements I
Weekly generation Capture material households rate (2)
Density (3)
Daily route volume rate (4) accumulated on-route 0 0 (7) (8‘)
Glass containers 3.19 3.86 0.80 1.8 Steel cans 0.75 0.62 0.68 1.8 Aluminum cans 0.10 0.33 0.71 1.8 Al1 plastic bottles 0.47 0.68 0.56 1.8 HDPE natural 0.24 0.23 0.70 1.8 HDPE pigmented 0.12 0.08 0.39 1.8 PET soda 0.02 0.25 0.60 1.8 PET custom 0.05 0.07 0.48 1.8 PVC 0.01 0.01 0.29 1.8 Al1 other 0.03 0.04 0.20 1.8
Total truck volume requirements 17.1 23.8
l,ooO 0.48 396 5.6 6.7 1,000 0.48 128 3.4 2.8 LooO 0.48 50 1.2 4.0 Looo 0.48 33 6.9 10.2 1,000 0.48 30 4.8 4.6 LooO 0.48 40 1.0 0.7 l,ooO 0.48 35 0.3 3.7 LOOO 0.48 35 0.6 0.8 1,000 0.48 35 0.1 0.1 1.000 0.48 35 0.1 0.2
(1) The daily route volume allocated for each material is determined by multiplying the factors of weekly generation, capture rate, weeks of material accumulated, total households on-route and set-out rate, then dividing that result by specific material density.
(2) Pounds per household in a bottle bill state. (3) Pounds per household in a non-bottle bill state. (4) Percent of generated material set out for recycling. (5) Percent of al1 households setting out recycling containers on any given collection day. (6) Average pounds per cubic yard observed in the six Model Cities Projects. (7) Uncompacted cubic yards in a bottle bill state. (8) Uncompacted cubic yards in a non-bottle bill state. Source: Ameritan Plastics Council,,l994.
Is Post Consumer Scrap Becoming a Waste Problem?
Slow Speed, High Torque Shredders for primary size reduction. Handles fibrous or bulky 9
objects including engineered plastics, automotive i parts, wood pallets, lathe turnings, medical waste
~ mi 1 l ,’ ~
d ~
and production destruction. Available with 10 to 300 HP motors.
!J Jz
Medium and Heavy Duty Central Granulators designed to handle larger parts including 55 gallon HDPE drums, pre-shredded tires with beadlwire, furniture, heavy wall pipe and chunks of plastic. Available with 60 to 250 HP motors.
Beside-the-Press Granulators for runners and plastic parts of all types including engineered plastics. Available with 5 to 40 HP motors.
251 Welton Street l Hamden, CT 06517 l 203-787-3575 l Fax 203-787-1492
Grcle 139 on RR service card
Resource Recycling September 1994m

month were carried out on weekly routes in set-out container at the curb for collection. three of the Model Cities Projects. On aver- This is because for weekly collection pro- age, 1.8 weeks’ Worth of material was set out grams, an average of only 3 1 percent of the at the curb each time a household placed the participating households set out their con-
tainer every week. Another 23 percent set it out three times per month, 22 percent two times per month, and 24 percent once per month.
In my opinion . . . 1s collection cost per ton al1 that matters? If given only the high per-ton costs for plas- each type of packaging material by the (see Table 5) to achieve this, significantly tics recycling collection, a municipal offi- weight of the empty packaging provides a greater quantities of glass and steel must be cial might tind it difficult to justify collect- ratio of pmduct delivered per pound of pack- collected from each household. ing plastics for recycling when the avoided aging. The table illustrates that on average, For this reason, if a municipality is will- disposal cost is substantially less. Howev- a Pound of the lightest packaging material, ing to collect glass, steel and aluminum pack- er, at least one important argument can be plastic, delivers 17.5 times as much product aging for recycling, then from the standpoint made for including plastics in a curbside to the household as a Pound of glass, the of the household served by the progmm, col- recycling program. heaviest packaging material. lection of plastic bottles makes economic
According to the 1992 Council of State When recycling collection costs are allo- sense. Ted Siegler Governments/Tellus Institute Packaging cated on a per-household basis or on the basis Stiy prepared for the Council of State Gov- of product de- ernments and the U.S. Environmental Pro- livcrcd t. thc Per bousebold and per container recycling COkCtiOn cosh tection Agency, “‘Ihe lightest-weight pack- household, costs age, per unit of delivered end product, is gen- for each of the Product delivered Collection cost per Collection cost erally the lowest-impact product.” For this packaging ma- per Pound of container (12 02. per household reason, it is important to analyze how much terials are simi- packaeing (oz.) container) (cents) per month (cents of each packaging material is being gener- lar. Although, ated by the average household. $;“;;Y$g gpm 275 / 1.1 24
Data were collected in each of the six 30 1.8 32 Model Cities Projects to quantify the deliv- for glass or steel Plastic 527 1.7 39 ery of product (e.g., soda, milk) per Pound are significantly Steel 99 2.1 21 of each packaging material. Diviùing the less than for plas- sum of the quantity of product delivered in tic or aluminum, Source: American Plastics Council, 1994.
You’re in a business where every dollar counts. Th& especially true when it comes to capital equipment invest- ment. If you don’t have the best machinery, you won’t be getting the best ROI.
That’s why you may
foam or bottle flake. The
The system’s unique dual diameter extruder is
the small diameter plasticising section provide an
economical operation. Of course, there’s
much more. Your Davis-Standard
, representative
want to check into Davis-Standards Scrapper” Serles.. . extruders designed to reprocess your scrap better. nents to minimize or elimi-
not, want not.
@ Davis-Standard’ Whether you’re reprocess nate the labor intensive func- Dwmn of Crompton B Knowks Corporat~on
ing scrap material directly from the roll, low or high bulk density granulated material,
tions of shredding, grinding and densification. The large diameter feed section, and
RECYCLE/RECLAIM SYSTEMS #l Extrusion Dr., Pawcatuck, CT06379 USA
(203) 599-l 010 Telex 966455 FAX (203) 599-2952
No One Beats Us in Extrusion
Circle 223 on RR service card
m Resmrce Recycling September 1994
Once the amount of recyclable material in the average set-out container has been deter- mine& it can be multiplied by the average number of households on the route setting out recyclables on any given collection day. As previously discussed, the average was 48 per- cent for weekly programs and 59 percent for bi-weekly programs. Finally, to determine how much volume must be handled by the recycling truck during the day, the pounds of recyclable material can be converted to cubic yards based on average observed uncom- pacted densities.
As illustrated by Table 4, on a route of 1,000 households, an average of 17.1 cubic yards of uncompacted bottles and cans would be collected in a bottle bill state and 23.8 cubic yards of material in a non-bottle bill state. The daily route volumes calculated in Table 4 demonstrate three important points.
First, when plastics compactors are not used, al1 plastic bottles require about 40 percent of the truck capacity devoted to bottles and cans in a bottle bill state, and 43 percent of bottle and can capacity in a non-bottle bill state.
Second, while there are significantly more PET bottles in a non-bottle bill state, there are equally significant increases in glass bottles and aluminum cans.
Third, while a plastics compactor can sig- nificantly reduce truck space allocated to plas- tic in a non-bottle bill state, it is of only mar- ginal value in a bottle bill state. This is because the average 1 .O- to 1.5cubic-yard capacity compactors available on the market occupy between 2.6 and 2.9 cubic yards of truck capacity (based on the outside dimen- sions of the compactor), saving only about four cubic yards of truck capacity in a bottle bill state, but 7.5 cubic yards of space in a non-bottle bill state.
In the example shown in Table 4, with 10 cubic yards of truck capacity available for al1 bottles and cans in a bottle bill state, a sav- ings of four cubic yards of capacity would not be enough to avoid a second trip to a proc- essing facility during the day. But because more materials are collected in a non-bottle bill state, a plastics compactor would enable the recycling collection vehicle to avoid going to a processing facility to unload a third time.
Allocating the curbside collection workday Improving collection efficiency will require improvements in two broad areas of collection time. First, the amount of unproductive time, when the driver and truck are not occupied with actually collecting recyclables, must be minimized. Second, ways must be found to improve the efficiency of collecting (Le., sort- ing and loading) recyclables once on-route.
Trucks were followed and timed through- out the entire workday on 15 routes in the Model Cities Projects. The results are con- sistent and illustrate a key factor in improv- ing collection effciency. On average, actu-
r
al collection of recyclables is responsible for only 68 percent of a typical seven-hour day (see Figure 1). The remainder of the day is spent in the yard (8 percent), traveling to and from the route (8 percent) and traveling to and from and unloading material at the mate- rials processing facility (16 percent). Thus, an average of 2.5 hours per day are spent on unproductive collection activities, leaving only 4.5 hours for collection of recyclables on-route.
It should be noted here that the workday ranged from a low of 3.7 hours to a high of 10.6 hours across 15 timed routes. When workdays for each route within each Model
City were averaged, however, the results con- sistently fell within an average of seven hours, excluding time spent at lunch and on breaks.
Allocating on-route time. During each of the Model Cities Projects, a significant amount of effort was expended on analyzing on-route collection activities carefully. Col- lection vehicles were followed on 49 routes throughout the on-route collection day, and al1 activities were timed.
These activities included distance and trav- el time between stops, and the amount of time spent on each separate collection activity, including trips to the curb, throws of materi- al, trips to the truck with the set-out contain-
HAllCO ORIGINAL KING OF LIVE FLOORS
t’s the HALLCO ORIGINAL that fit-st got things going. And now everyone’s trying to claw their way into the action. But it still
pays to go with the original. As one customer recently told us, he’s made 8 to 10 trips a day for the past 8 years, and the floor just keeps on purring. Ready for maximum payload, maximum durability?
Go with the floor that gets roars of approval.
HALLCO FLOOR SYSTEMS s-‘_
Circle 12 on RR service cm-d
Resource Recycling September 1994m

n Figure l- Average values of major workday activities - 15 programs
Yard time 8%
Collection 68%
Source: Ameritan Plastics Council, .1994. n Collecting bottles and cans took another
Automatic Plastic Bottle Sorting
The BottleSort@ System
5000 Pound per hour multi-resin BottleSorP System
The BottleSorP system provides state-of-the-art automatic plastic bottle identification and sorting of whole or baled plastic bottles. Our infrared and x-ray sensing systems ignore dirt and labels. The modular design BottleSorP provides sorting of PVC, PET, natural HDPE, and mixed-color
HDPE. Color sorting of resins is also available with an advanced vision system. With over 20 process lines installed, MSS is the world leader in multi-resin automated bottle sortation. Also be sure to investigate our 10,000 Pound per hour debaling and declumping system.
LGNETIC o--. -ATION
YSTEbfS, Inc.
3738 Keystone Avenue Nashville, Tennessee 372 ll
Phone: (615) 781-2669 Fax: (615) 781-2923
er and operation of truck equipment, includ- ing plastics compactors. The data were ana- lyzed using ordinary less squares regression analyses; researchers concluded that it is pos- sible to model collection activities.
Differences in data collection and report- ing make it difficult to simply present the results. However, data from four of the Model Cities Projects are similar enough so that some generalizations can be drawn that are impor- tant to improving collection efficiency. Among them: n Driving between stops averaged 14 per-
cent of on-route collection time. n Collecting paper took an average of 27
percent of collection time.
22 percent of on-route collection time. W Getting on and off the truck and walking
between the curb and the truck accounted for 37 percent of on-route collection time.
n Using a plastics compactor added between 4 and 10 pexcent to the on-route collection time. Important findings from the collection
analysis include the following: First, for routes collecting commingled
paper and commingled containers, average time per stop including drive time from the last stop, was 44 seconds, ranging from an average low of 30 to an average high of 54 seconds. Thus, if the truck was normally on- route collecting recyclables for 4.5 hours, between 300 and 540 stops could be made. Each additional 10 minutes that can be shaved from off-route or unproductive activities added another 10 to 15 collection stops. Al- though it might be convenient to assume that reducing lunch and break time is the key, Fig- ure 1 demonstrates that commuting to the route and driving to and unloading at the proc- essing center are key areas for increasing pro- ductive collection time.
Second, the average time per stop meas- ured on the one program collecting source- separated material was 59 seconds, showing the additional time required at the curb to indi- vidually collect and empty bins for separat- ed materials.
Third, a small fraction of the entire col- lection day is actually spent physically han- dling (sorting and dumping) recyclables. Of the 4.5 hours of a seven-hour workday that an average collection vehicle is on-route, a half-hour is spent driving between stops and 1.5 hours is spent getting on and off the truck and walking between the truck and the curb- side. This leaves only 2.5 hours out of a seven-hour day for physically handling recy- clables. This illustrates the importance of using low-entry, right-side-drive vehicles and designing the route to minimize unproduc- tive truck time such as turning around, back- ing down streets or crossing traffic to pick up recyclables.
Fourth, and most importantly, the small amount of time spent physically collecting
Circle 351 on RR service card
m Resource Recycling September 1994

materials illustrates the need to reduce the number of households passed by on the route and maximize the amount of material in the set-out container at each stop. Clearly, one way to accomplish this is to collect recyclable materials once every other week. As dis- cussed above, only 3 1 percent of the house- holds on the average weekly collection route placed their recyclables at the curb each week, even after plastics collection was added. In fact, the average set-out bin contains slight- ly less than two weeks of accumulated mate- rial, indicating that the average participating household stores recyclables for just under two weeks.
It can be argued that weekly collection increases participation rates and hence the recovery of recyclable materials. However, observations across the six projects were that other variables, such as neighborhood characteristics, were more important, with some bi-weekly programs recovering greater amounts of material than some weekly pro- grams. Some researchers argue that even if recovery is greater with weekly than bi-week- ly collection, this benefit is offset by greater expenditures of resources and increased envi- ronmental impact.
Analyzing collection costs A complete evaluation of the cost’effective- ness of adding plastics to a recycling program requires a comparison of total system costs associated with collecting plastics as solid waste and disposing of them in an incinera- tor or landfill, and total system costs associ- ated with collecting and processing that same portion of the available plastics through the recycling program. The difference in total system costs would be accounted for by: n solid waste collection savings associated
with removing a high-volume material n avoided disposal costs at a landfill or incin-
erator n lost energy sales revenue if incinerated n increased recycling collection and proc-
essing costs n additional materials sales revenue.
This type of total system cost analysis was beyond the scope of the Model Cities Proj- ects. Instead, the research focused on devel- oping detailed information on the collection component of the recycling system, which is often the largest single cost component.
Ahcating costs among materials. Costs for each of the Model Cities Projects were estimated based on fully allocated collection costs. There is no one universally agreed- upon method for allocating common costs. For all of the Model Cities Projects, costs were generally allocated as follows:
First, the amortized capital cost of collec- tion trucks and equipment was allccated based on the volume of available capacity used by each material. Thus, if al1 materials were col- lected loose, then truck costs were allocated
based on the uncompacted volume of each material collected. If a plastics compactor was used, then the amortized cost of the com- pactar and the truck capacity used by the compactor were assigned to plastics.
Second, operating costs were divided into three time components: sorting and loading; travel and unloading at a materials process- ing facility; and al1 other. These three sets of operating costs were then distributed based on the percent of truck and labor time spent on these three areas of activities.
The collection models illustrate that on average only 30 percent of the total collec- tion day is spent at the truck sorting and load-
ing bottles and cans and paper. Using the plastics compactor adds another 4 to 10 per- cent to total collection time. Therefore, this portion of the collection day can be allocat- ed to each material based on the percent of the total collection day devoted to sorting and loading this material.
Like equipment costs, delivery and unload- ing time at the processing center can be allo- cated among materials based on the volume of each material in the truck, because mate- rial volumes determine the number of trips to the processing facility.
The remaining on- and off-route activities are not directly affected by any single mate-
HAU NEW HIGH IMPACT
NOTHING FLOORS IT.
Y ou’re in a beastly business. You never know what’s going to
be thrown at you. But with HALLCO’s new HIGH IMPACT, it doesn’t matter. This tough-skinned live floor has 1/2” ridges
to resist just about any top-loaded material. Ridges help prevent leakage, too. Ready for a floor lighter than the toughest, but tougher than the lightest? Go with the floor nothing floors.
HALLCO FLOOR SYSTEMS 1 I / I mm
0 HALLCO MG. CO , INC
Circle 245 on RR sewice ca-d
Resource Recycling September 1994 m
DENSIFIERS FOR SALE
NEW 50 HP - 250 HP FOR LDPE l HDPE l PP
LLDPE . EPS DRYING CAPABILITIES ALSO
STANDARD OR CUSTOMIZED PLASTICS EQUIPMENT TO MEET YOUR NEEDS
Quality Machines Built Here
CONTACT BRUCE
PH 909-627-9807 Fax 909-627-8750 l
Circle 152 on RR sewice card
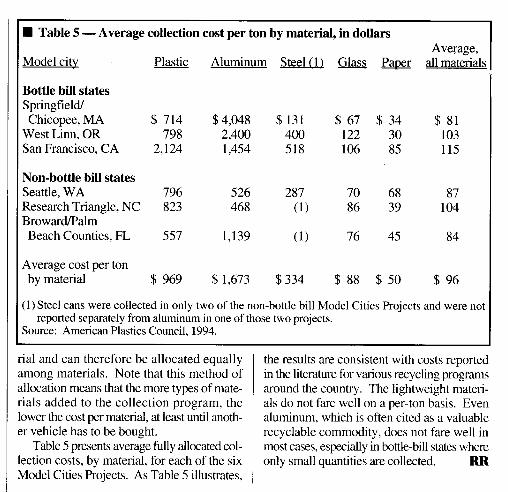
n Table 5 - Average collection cost per ton by material, in dollars Average,
Model citv Plastic Aluminum Steel(1) Glass Paper al1 materials
Bottle bill states Springfield/ Chicopee, MA $ 714 $4,048 $131 $ 67 $ 34 $ 81
West Linn, OR 798 2,400 400 122 30 103 San Francisco, CA 2,124 1,454 518 106 85 115
Non-bottle bill states
Seattle, WA 796 526 287 70 68 Research Triangle, NC 823 468 (1) 86 39 107 Broward!F’alm Beach Counties, FL 557 1,139 (1) 76 45 84
Average cost per ton by material $ 969 $ 1,673 $334 $ 88 $ 50 $ 96
(1) Steel cans were collected in only two of the non-bottle bill Model Cities Projects and were not reported separately from aluminum in one of those two projects.
Source: American Plastics Council, 1994.
ial and can therefore be allocated equally mong materials. Note that this method of llocation means that the more types of mate- ials added to the collection program, the Iwer the cost per material, at least until anoti- r vehicle has to be bought.
Table 5 presents average fully allocated col- :ction costs, by material, for each of the six 4odel Cities Projects. As Table 5 illustrates,
the results are consistent with costs reported in the literature for various recycling programs around the country. The lightweight materi- als do not fare well on a per-ton basis. Even aluminum, which is often cited as a valuable recyclable commodity, does not fare well in most cases, especially in bottle-bill states where only small quantities are collected. RR
CRUSH &S-T-ORE ALUMINUM 6EVERAGE CANS.
CANPACTOR II CRUSHES & SELF EJECTS CANTOPPER 16”wide by 34” tall by 22” deep. WeighJ 10 lbs. Nez economy lid,f;ts on existing 32 ~$lon trash and holds a 3 0 ga&n trash bag. containers including Rubbevmaidand Tuckzr. $64.95@~s S@H $29.95 plus StiH
TWO CHOICES-CANPACTOR II OR NEW CANTOPPER At last! A practica1 space-saving answer to the bulky mess of can collecting. Perfect for schools, clubs,
offices, homes, cafeterias, bars-wherever cans collect. Made of highly durable polyethylene, both the Canpactor 11 and the Cantopper are hand operated and self ejecting. Crush and store
over 400 cans with no mess. For more information cal1 l-800-622-6069.
CSL & ASSOCIATES l-800-622-6069
202 Buck Drive, Fort Walton Bach, FL 32548, 904-664-6801, FAX: 904-664-6838
Circle 326 on RR sewice card
m Resource Recycling September 1994