Embed Size (px)
Citation preview
, 1)JI. FILE C0Y4
College of Earth andMineral Sciences
DEPARTMENT OF MATERIALS SCIENCE
PENNSTATE METALLURGY PROGRAM
0"TECHNICAL REPORT DTIC
* A% ELECTOctober 1, 1987 NOV16 1987 i'
OFFICE OF NAVAL RESEARCH C~
0 Contract No. N00014-84-k-0201
IR DROPS AND THE LOCAL ELECTRODE POTENTIAL"DURING CREVICING OF IRON
Howard W. Pickering
"Department of Materials Science & EngineeringThe Pennsylvania State University
D istlibution Un , .. ,
.1
SA
0':.. .< + +, . -. i
t:•::•`+ ;-:.;•,,•.• •..•`.••`•::.;4`::`2•2••A`ppr '++•.+,,'" * .d, f ,. :+':4-::S&; .:.::.k;::::,. +•j:,'::.:+

PENN STATECollege of Earth andMineral SciencesUndergraduate MajorsCeramic Science and Engineering. Fuel Science. Metals Science and Engineering, Polymer Science;Mineral Economics: Mining Engineering, Petroleum and Natural Gas Engineering;Earth Sciences. Geosciences; Geography; Meteorology.
Graduate Programs and Fields of ResearchCeramic Science and Engineering, Fuel Science, Metals Science and Engineering, Polymer Science;Mineral Economics; Mining Engineering, Mineral Processing, Petroleum and Natural Gas"Engineering;Geochemistry and Mineralogy, Geology, Geophysics; Geography; Meteorology.
4 Universitywide Interdisciplinary Graduate Programs Involving EMS Facultyand Students
Earth Sciences, Ecology, Environmental Pollution Control Engineering, Mineral EngineeringManagement, Solid State Science.
Associate Degree ProgramsMetallurgical Engineering Technology (Shenango Valley Campus).
"Interdisciplinary Research Groups Centered in the CollegeC. Drew Stahl Center for Advanced Oil Recovery, Center for Advanced Materials, Coal ResearchSection, Earth System Science Center, Mining and Mineral Resources Research Institute, OreDeposits Research Group.
Analytical and Characterization Laboratories (Mineral ConstitutionLaboratories)Services available include: classical chemical analysis of metals and silicate and carbonate rocks;X-ray diffraction and fluorescence; electron microscopy and diffraction; electron microprobeanalysis: atomic absorption analysis; spectrochemical analysis; surface analysis by secondary ionmass spectrometry (SIMS); and scanning electron microscopy (SEM).
The Penn,,vlvania State Univertt,. in compliance vith federal and state laws. is committed to the policy that all persons shall have equal
access to program',, admission. and cmploment isithout regard to race, religion, sex. national origin, handicap, age. or status as a disabled orVietneam-era 'eteran [)irect all itfinnatia e action inquiries to the Affirmative Action Officer. Suzanne Brooks. 201 Willard Building.
"Universit, Park. PA 16802. (814) 861-(P71t .Ed K7 10127Produced h) 1h' Penn State I)cpartmcnt (I Publication%
-~~~i it- ICA * .*
SECURITY CLASSIFICATION OF THIS PAGE (Whei Data Entered)
REPORT DOCUMENTATION PAGE READ INSTRUCTIONSBEFORE COMPLETING FORM
1. REPORT NUMBER 2. GOVT ACCESSION NO. 3. R9CIPINMeMfiI
Technical Report, Oct. 2s 1987 7
4. TITLE (mad Subtitle) S. TYPE OF REPORT & PERIOD COVERED
IR DROPS AND THE LOCAL ELECTRODE POTENTIAL Technical ReportDURING CREVICING OF IRON
S. PERFORMING ORG. REPORT NUMBER
7. AUTHOR(e) I. CONTRACT OR GRANT NUMBER(a)
H. W. Pickering N00014-84-k-0201
S. PERFORMING ORGANIZATION NAME AND ADDRESS 10. PROGRAM ELEMENT. PROJECT, TASK
Metallurgy Program, 209 Steidle Building AREA & WORK UNIT NUMBERS
The Pennsylvania State UniversityUniversity Park, PA 16802
II. CONTROLLING OFFICE NAME AND ADDRESS 12. REPORT DATE
October 1, 1987"13. NUMBER OF PAGES
14. MONITORING AGENCY NAME & ADORESS(It dilletrnt from Controllng Office) IS. SECURITY CLASS. (of this report)
ISa. OECLASSI FICATION/DOWNGRADINGSCHEDULE
16. DISTRIBUTION STATEMENT (of thls Report)
I?. DISTRIBUTION STATEMENT (of the abetract entered In Block 20, It diflerent frem Report)
III. SUPPLEMENTARY NOTES
IS. KEY WORDS (Continue on reverse aide It necesmary and Identify by block number)
'20. ABSTRACT (Continue on reverse side If neeceemy mid Identify by block number)
0e In this work a traditionally misregarded point of view, a different electrodepotential within the cavity than exists at the outer surface, is shown to beof great importance for the occurrence of localized corrosion in crevices.Based on the results of this work crevice corrosion is concluded to occur dueto an electrode potential in the crevice that is in the active loop region ofthe polarization curve of the crevice electrolyte. Compositional effects werenot significantly involved since the solution did not contain CI- or otheraggressive ions and a buffer solution was used to minimize pH changes. Gas
DD , JA M73 1473 EDITION OF I NOV 65 IS OBSOLETES/N 0102"014- 6401
SECURITY CLASSIFICATION OF THIS PAGE (When Deaa Entered)
20. ABSTRACT con't.
bubble accumulation in the crevice increases the rate of crevicing and can
initiate a new crevicing action at the metal-gas-electrolyte interface even on
otherwise passivated surfaces. These results were obtained for an iron sample
containing a preexisting crevice in a buffer 0.5 M sodium acetate - 0.5 M acetic acid
solution of pH 4.6. In some experiments an inhibitor, sodium chromate, was
present in the solution in order to observe the potential variation for an
inactive crevice.
II P&MO;-
IR DROPS AND THE LOCAL ELECTRODE POTENTIALDURING CREVICING OF IRON
Alberto Valdes and Howard W. PickeringThe Pennsylvania State University
Department of Materials Science and EngineeringUniversity Park, PA 16802, USA
/ ABSTRACT
In this work a traditionally misregarded point of view, a different electrode potential within
the cavity than exists at the outer surface, is shown to be of great importance for the occurrence of
localized corrosion in crevices. Based on the results of this work crevice corrosion is concluded to
occur due to an electrode potential in the crevice that is in the active loop region of the
polarization curve of the crevice electrolyte. Compositional effects were not significantly involved
since the solution did not contain Clror other aggresive ions and a buffer solution was used to
minimize pH changes. Gas bubble accumulation in the crevice increases the rate of crevicing and
can initiate a new crevicing action at the metal-gas-electrolyte interface even on otherwise
passivated surfaces. These results were obtained for an iron sample containing a preexisting
crevice in a buffer 0.5 M sodium acetate - 0.5 M acetic acid solution of pH 4.6. In sorn
experiments an inhibitor, sodium chromate, was present In the solution in order to observe the
potential variation for an inactive crevice. - - -
- ----- "- -
VL
. . .. . ... . . ... . .. .
V!
,. ,
2
INTRODUCTION
The magnitude of the potential drop that can be obtained in restricted environments such
as pits, crevices and cracks has been an open controversy over the years. What this ongoing
controversy indicates is that present day knowledge of the chemical and electrochemical
conditions inside restricted environments is very limited and in need of more experimental study.
A common feature of all growing pits, crevices and cracks is a restricted mass and charge
transport from the cavity to the bulk solution and viceversa. This results either in the accumulation
of solid corrosion products or the entrapment of gas bubbles within the walls of the cavity, both of
which can increase the IR drop. Solid corrosion products have received a fair amount of attention,
see e.g. (1), but the effect of in-place gas bubbles, as well as solid corrosion products, on the
electrode potential in a cavity has not been examined to its due extent, despite supporting
experimental evidence, presented at the Williamsburg Conference and elsewhere, clearly
showing a possible new approach to explaining pit and crevice initiation and growth (2,3). Papers
reviewing these results have been published elsewhere (4,5) and also in this proceedings (6);
therefore, no details will be presented here.
These data, that show cavity electrode potentials quite different from the potential at the
outer passivated surface, are not consistent with traditional theories of localized corrosion. The
latter invoke composition differences in the electrolyte as the cause of localized corrosion and in
important ways ignore potential drops. Available mathematical models of localized corrosion and
* of stress corrosion cracking are also not complete since they do not predict the 103 mV potential
drops that occur for some conditions. The exception is the model by Ateya and Pickering (9) that
predicts a larger and larger potential drop as the crevice narrows; this model, developed for
hydrogen evolution under cathodic polarization conditions, can be qualitatively appplied to
localized corrosion conditions.
The experiments described in this paper are designed to study the role of IR drops on
crevice corrosion under conditions that minimize changes in composition of the crevice
electrolyte. The extent and nature of crevicing in the absence of chloride ion and gas
.... .... .6 " I N J ' N " r
3
accumulation are also investigated. Thus, the importance of large potential changes, rather than
solution composition changes, in the occurrence of localized corrosion is stressed.
EXPERIMENTAL
The material used in this work was Ferrovac-E iron. The specimens were cut from bars,
degreased, heat treated at 8000C for two hours and furnace cooled. The experiments were
carried out at pH 4.6 in a solution of 0.5M acetic acid and 0.5M sodium acetate prepared with
reagent grade chemicals and double distilled water. This is a buffer solution designed to minimize
pH changes in the crevice. Sodium chromate was added to inhibit crevicing in some experiments.
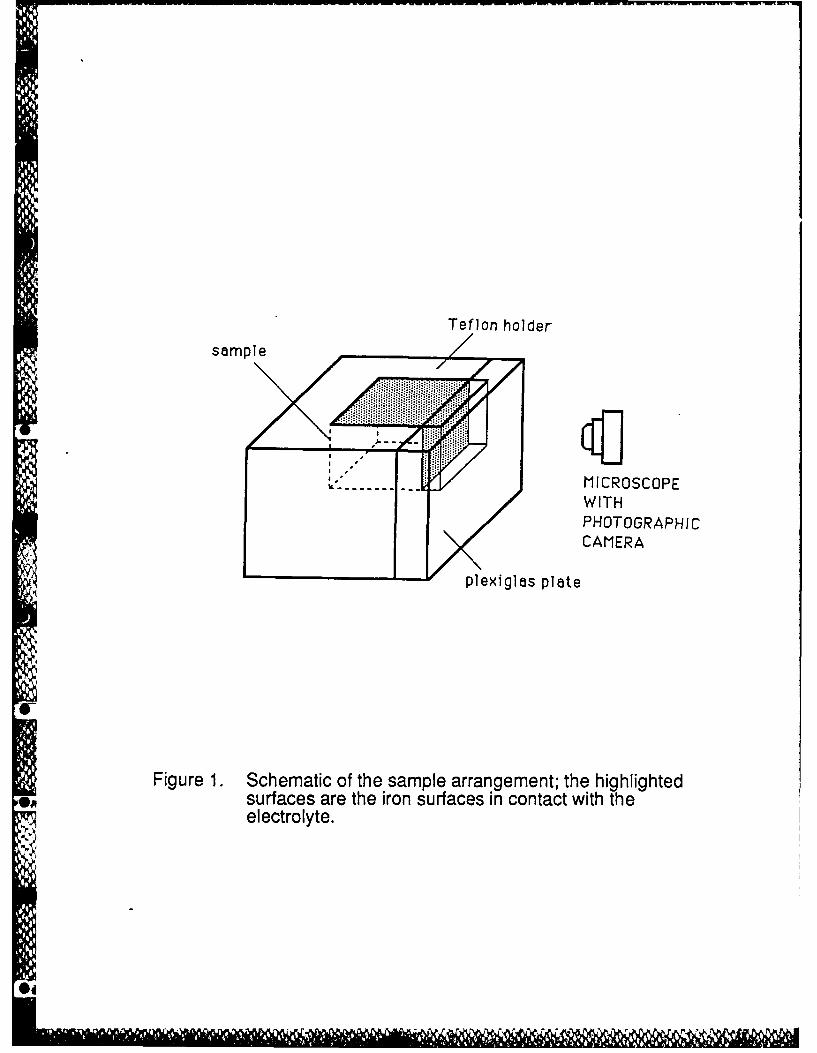
The sample arrangement is shown in Figure 1. A specimen, after polishing to a mirror-like
surface, was force fit into the TeflonTM holder and the Plexiglas plate was attached to one of its
surfaces in order to form an artificial crevice between the Plexiglas and the metal wall. The crevice
thus consisted of one metallic wall, four inert (Plexiglas) walls and one opening (5mm x 0.5 mm) to
the bulk of the solution; its depth was 10 mm. The exposed outer (top) surface was 5 mm x 20 mm
in area. Lacquer was used to eliminate crevices between the iron and Teflon.
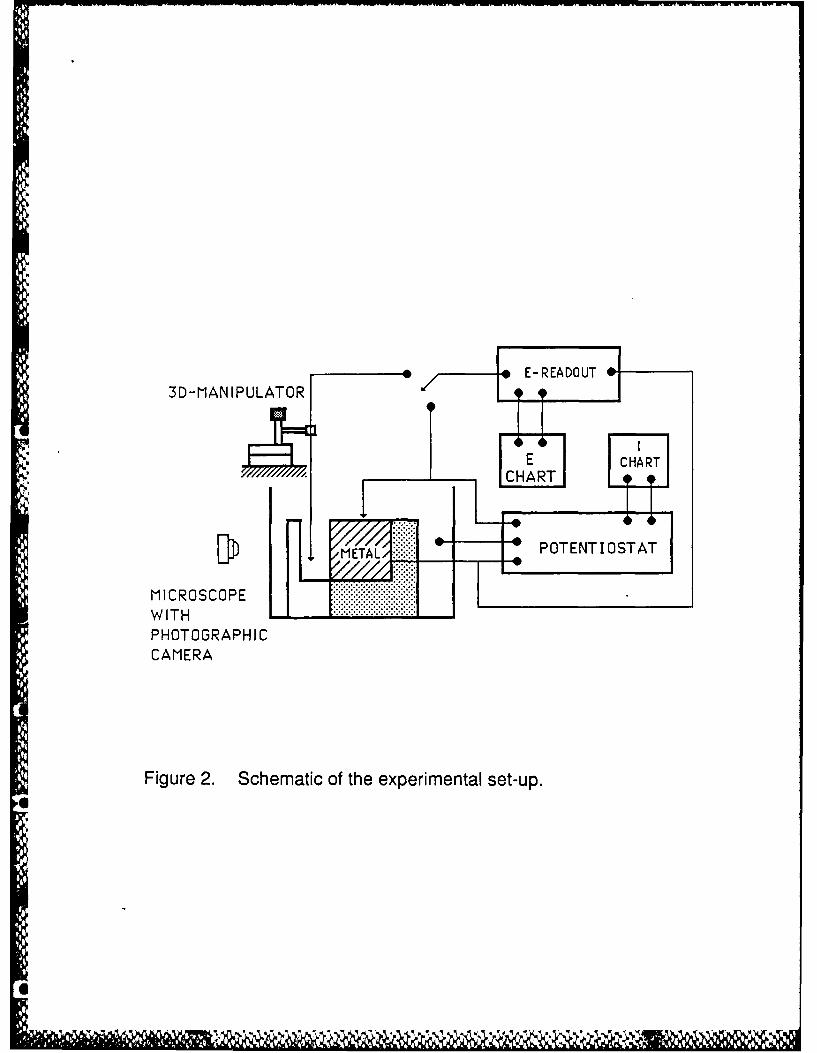
The experimental set-up used to make the measurements included a Luggin capillary
probe drawn to a diameter of less than 0.02 cm and is shown in Figure 2. The non-interference of
the Luggin capillary probe on the observed behavior was satisfied in two ways: (a) the same
experiments conducted in the absence of the probe yielded the same features of the crevicing
process and (b) the occurrence of hydrogen evolution from within the crevice proved that the
potential drop was in the range of those measured. In addition, Ateya and Pickering (9,10)
obtained reproducible results when using a Luggin measuring probe with a diameter on the order
of 0.01 cm to measure local potentials in an artificial crevice with the same dimensions as the one
used in this work. Observation of the events inside the crevice and photographic recording of
them were possible with a stereo microscope viewing the crevice through the Plexiglas plate (see
Figure 1). Luggin capillaries connected to saturated calomel electrodes (SCE) were used to
monitor the electrode potential at different positions inside the crevice and to control the (applied)
00,e.
5, "" "" V% '
4
potential on the outside (top) surface. All of the experiments were carried out under
potentiostatic control in solutions open to the atmosphere.
The experimental procedure was as follows: the sample was first placed in the empty cell
and all the necessary arrangements were made. With the sample under cathodic protection
(generally -1.0 V, SCE) the electrolyte was added; the cathodic polarization was maintained until a
constant current was reached in order to assure the removal of any air-formed film prior to the
application of the anodic polarization. Once these conditions were obtained, the test was started
by switching the potential into the passive region. In some experiments the cathodic
pretreatment was not used; in this case the potential was set in the passive region and then the
electrolyte was added. All records were time related to the moment at which the anodic
polarization was first applied. The measured current was presented as current density based on
the total exposed metal area of 1.5 cm2 (outer surface and crevice wall).
RESULTS AND DISCUSSION
Electrode Potentials In the Crevice
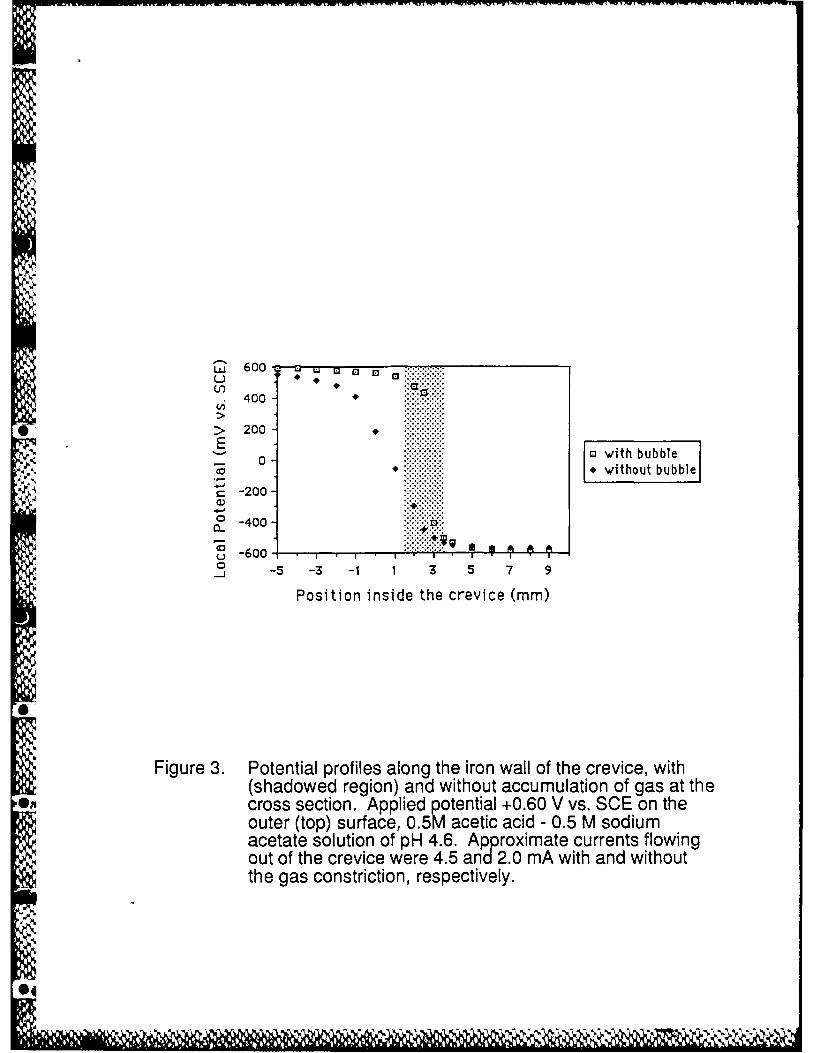
The electrode potential as a function of distance into the artificial crevice of an anodically
polarized iron sample for gas-free and gas-occupied crevices are shown in Figure 3. A decrease
in potential was found with an increase in the distance into the cavity in agreement with expected
behaviour (2-5,10,11). At the opening of the crevice, the measured electrode potential is close
to the applied potential; towards the bottom the electrode potential is at an almost constant value
of -0.57/-0.58 (SCE). The corrosion rate was observed and measured to be high in a particular
region of the negative potentials within the crevice; this is discussed below. For both gas-free
and gas-occupied crevices, a large shift in potential occurs. When the shape of the bubble
changed for any reason and did not fill completely the cross section, and even when the bubble
was dislodged, the large magnitude of the potential change in the crevice was in general the
same. The only difference was that the potential profile was more localized to the region of the
bubble for a gas filled cross section (shadowed region in Figure 3). The quasi stationary current (1
hr value ), however, was higher with the gas present, e.g., 4.5 mA cm"2 in the presence of the
5
gas vs. 2.0 mA cm"2 in the absence of the gas. Thus, even without in-place gas bubbles, large IR
drops greater than the IR* value in Figure 4, and currents that approach the maximum currents of
the active loop, produce the crevicing. Since these densities were obtained from the measured
current using the total 1.5 cm2 of exposed iron (crevice wall and outer surface), the actual
crevicing current density was roughly an order of a magnitude larger since the current was nearly
completely from a narrow band just below the active/passive boundary on the crevice wall, as
reported below.
Regarding the current flowing out of the crevice, the presence of a non-conductive
medium (gas bubble) filling the cross section has the effect of a large resistance in the path of the
current. The situation corresponds to the near isolation of the lower portion of the crevice from
the bulk solution, the only available path for current flow and mass transport in and out of the
crevice being the wedge shaped liquid regions between the bubble and the walls of the cavity (2-
5). Similarly, wedge shaped liquid regions also exist between the bubble and the outside walls of
the Luggin capillary probe when used to measure the local electrode potential underneath the
bubble. These areas together add to a very small part of the entire cross section of the cavity and,
as a result, only a very small cross sectional area is available for current flow. This reasoning is
consistent with a modeling study of reactions in crevices that shows that the IR>IR condition is
more likely met the narrower is the crevice (9).Thus, even for a very small metal dissolution rate, a
large IR can develop and cause the electrode potential in the wedge shaped region between the
* J bubble and metal (microcrevice), and also below the bubble if the bubble occupies the entire
cross section, to be below the passivation potential for the solution in the crevice (2,3). Gas
bubble constrictions were found to be necessary for the IR>IR condition (Figure 4)to be met
during pitting of iron (2,3). In Valdes' experiments on crevicing of iron reported above, a shift of
the electrode potenital to near the limiting potential was obtained without the presence of gas
constrictions because of the relatively long current path within the crevice as shown elsewhere
(6).
O4
6
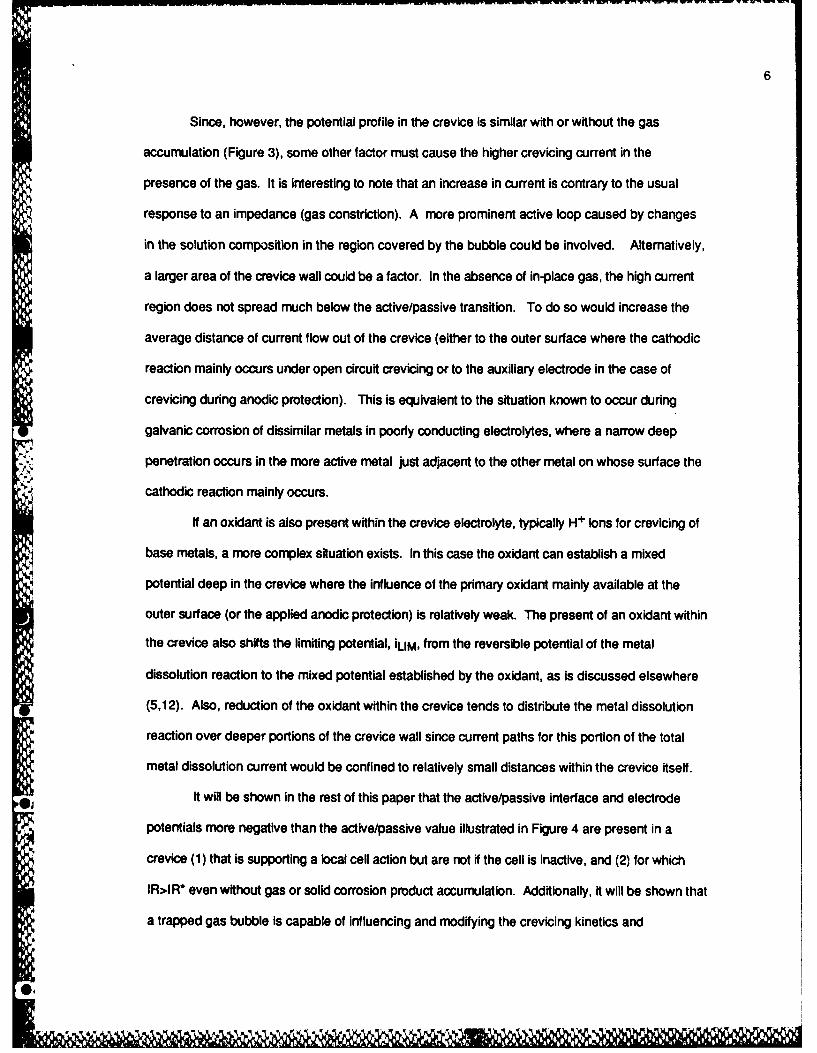
Since, however, the potential profile in the crevice is similar with or without the gas
accumulation (Figure 3), some other factor must cause the higher crevicing current in the
presence of the gas. It is interesting to note that an increase in current is contrary to the usual
response to an impedance (gas constriction). A more prominent active loop caused by changes
in the solution composition in the region covered by the bubble could be involved. Alternatively,
a larger area of the crevice wall could be a factor. In the absence of in-place gas, the high current
region does not spread much below the active/passive transition. To do so would increase the
average distance of current flow out of the crevice (either to the outer surface where the cathodic
reaction mainly occurs under open circuit crevicing or to the auxiliary electrode in the case of
crevicing during anodic protection). This is equivalent to the situation known to occur during
galvanic corrosion of dissimilar metals in poorly conducting electrolytes, where a narrow deep
penetration occurs in the more active metal just adjacent to the other metal on whose surface the
cathodic reaction mainly occurs.
If an oxidant is also present within the crevice electrolyte, typically H+ ions for crevicing of
base metals, a more complex situation exists. In this case the oxidant can establish a mixed
potential deep in the crevice where the influence of the primary oxidant mainly available at the
outer surface (or the applied anodic protection) is relatively weak. The present of an oxidant within
the crevice also shifts the limiting potential, iLIM, from the reversible potential of the metal
dissolution reaction to the mixed potential established by the oxidant, as is discussed elsewhere
(5,12). Also, reduction of the oxidant within the crevice tends to distribute the metal dissolution
reaction over deeper portions of the crevice wall since current paths for this portion of the total
metal dissolution current would be confined to relatively small distances within the crevice itself.
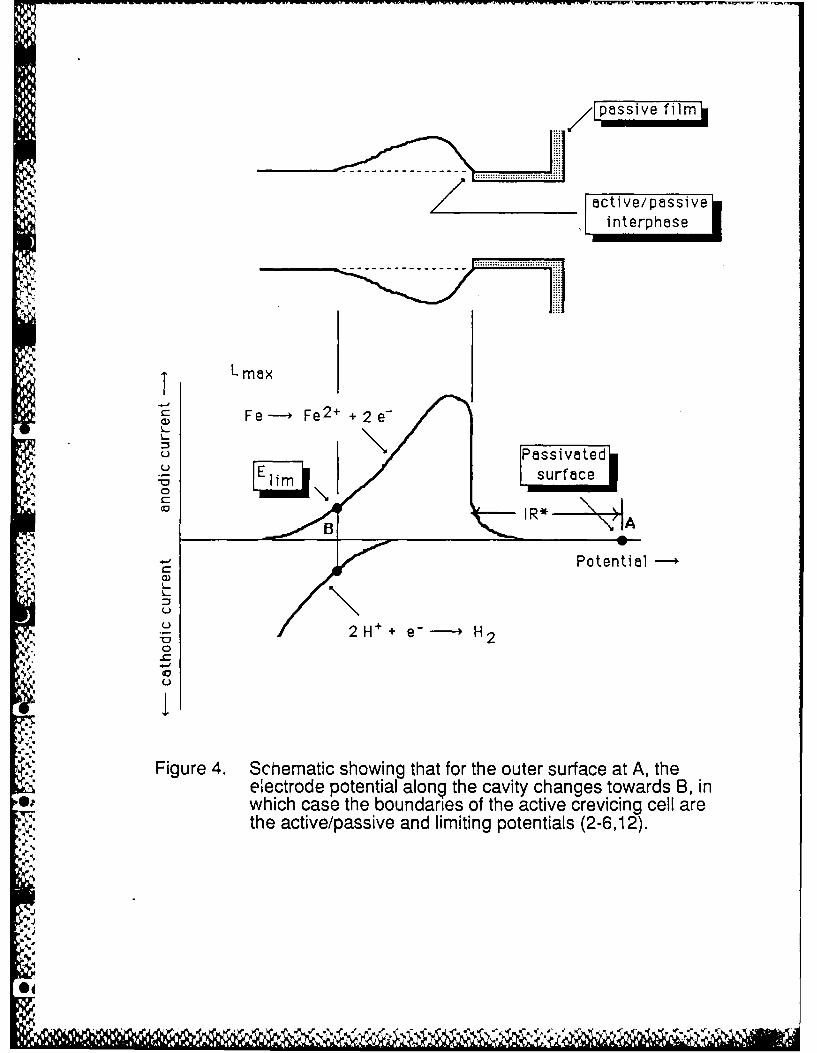
it will be shown in the rest of this paper that the active/passive interface and electrode
potentials more negative than the active/passive value illustrated in Figure 4 are present in a
crevice (1) that is supporting a local cell action but are not if the cell is inactive, and (2) for which
IR>IR° even without gas or solid corrosion product accumulation. Additionally, it will be shown that
a trapped gas bubble is capable of influencing and modifying the crevicing kinetics and
@1
V i 4
7
morphology of attack just below the active/passive interface, i.e. along the triple interface metal-
gas-electrolyte.
Finding large potential drops in restricted environments is not new, as mentioned
elsewhere in this proceedings (6). Other authors have reported them for various metals and
environments, usually attributing their findings in some way to reduced mass transport due to an
occluded corrosion cell. The nature of the occluded cell has also been clarified, being either solid
or gaseous reaction products (2,3). Explanations of largely different stable electrode potentials
along the crevice wall based on accumulated gas, advanced by previous workers (2,3,9) also can
hold in the absence of the gas. IR>IR* can exist in crevices without accumulated gas because of
the long current path, in contrast to the shorter paths in stable pitting of iron where gas or solid
constrictions have been observed to be present when the measured potential within the pit was
negative of the active/passive potential of the electrolyte in the pit (2-6). The idea, however, that
only an active condition is needed within the crevice, advanced by various workers. is not
adequate if part of the crevice wall next to the opening is passive. In this case it is clear that, in
addition, an active/passive transition is required in the polarization curve of the crevice solution.
Calculated IR drops for the crevice used in this paper and the measured currents are
easily as large as the measured IR values as shown elsewhere in this proceedings (6). This is true
even for high conductivity electrolytes. In general, for high conductivity electrolytes, the
conductivity of the crevice electrolyte is likely to be less than that of the bulk electrolyte, because
of the gas voidage in the crevice solution. As is well known, a fraction of the total quantity of
dissolved gas generated at an electrode is evolved in gaseous form directly at the electrode.
Some of these gas bubbles will grow attached to the electrode causing a bubble curtain, whereas
others will detach and move to the electrolyte phase. Of the latter, those that have the critical size
for growth will grow to become large bubbles, whereas the ones smaller than the critical size will
redissolve. It is then reasonable to expect a large population of microscopic bubbles in the liquid
phase which can be thought of as a dispersion of the evolved gas in the electrolyte. Dispersions
of gas in liquids show a decrease in the conductivity with an increase in the void fraction (13-19),
4
the reason being the increment in the proportion of the non-conducting material (gas) compared
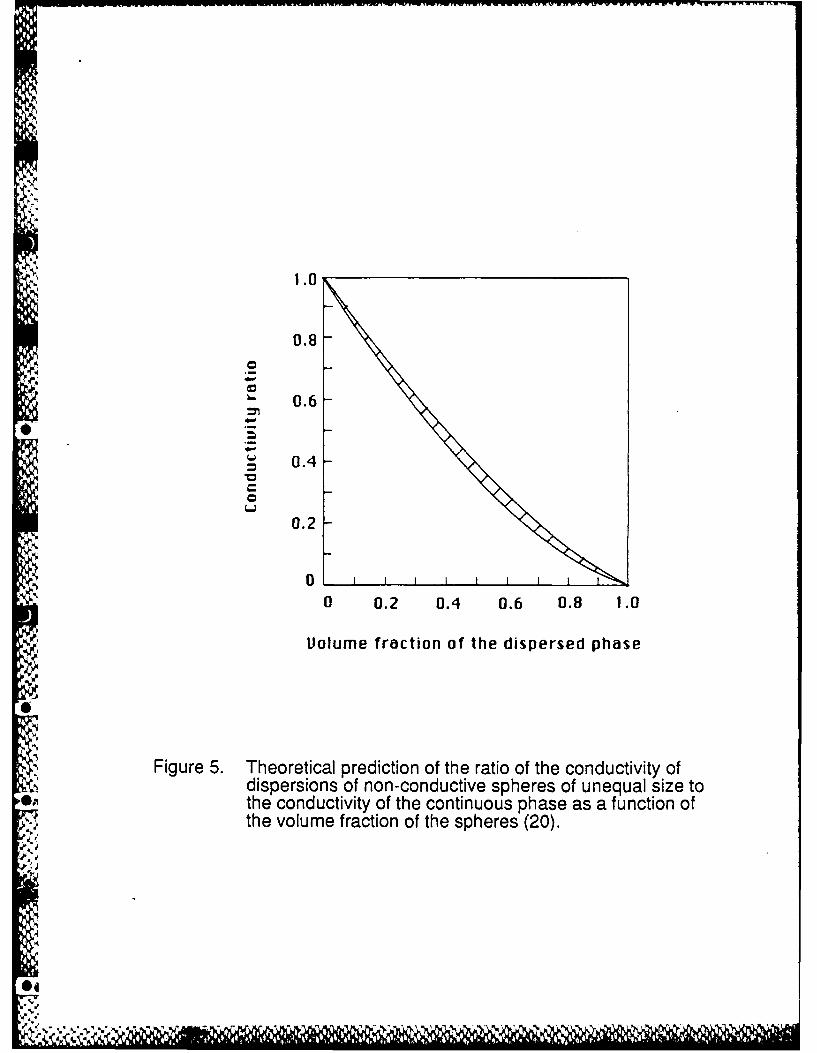
to the conducting material (electrolyte). Figure 5 illustrates the results of several theoretical
models (20) where the ratio of the conductivity of dispersions of non-conducive spheres of
unequal sLe to the conductivity of the continuous phase, is plotted versus the volume fraction of
the dispersed phase. A good agreement has been found with experimental data (20).
The hydrogen evolution occurring in the crevice during the cathodic pre-treatment was
very rapid. During such a process all sizes of bubbles grow and detach from the cavity, with a
number of them easily visible because of their size, but a large number of bubbles in the very early
stages of growth must also exist in solution. Although the volume of each bubble would be very
small, summed together they would correspond to a large gas voidage in the cavity, thereby
producing a lower solution conductivity. At the moment of switching the potential to the passive
region hydrogen evolution ceases at the outer surface due to the new electrochemical condition
,* and anodic currents commence. At the outer surface and in the outer part of the crevice wall, the
anodic current will decrease as the surface passivates but deeper in the cavity the current remains
*:• high because IR>IR*, i.e,, the electrode potential is in the active region. In addition, hydrogen
evolution was observed to continue within the crevice during anodic polarization indicating that
some regions of the crevice wall are at potentials in the region of hydrogen evolution, in which
case a low conductivity due to gas voidage is likely to exist.
"Crevlclng Morphology and Rate
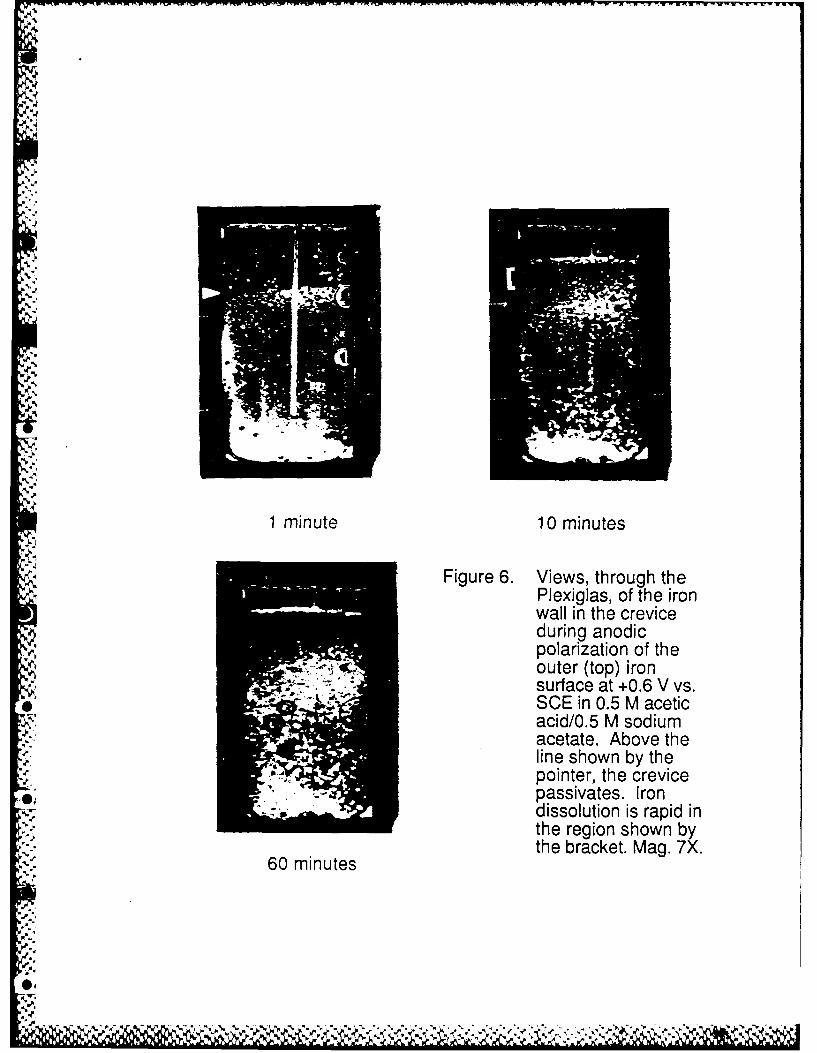
Figure 6 shows a photographic sequence of the events in a crevice after a potential in the
* passive region was applied to the outer (top) surface. In this experiment there was no significant
gas accumulation in the crevice. In a short time a line representing an active/passive interface
appeared (arrow), above which the crevice wall remained passive consistent with the measured
potential in the passive region, and below which the active state was maintained consistant with
measured potentials in the active region as described above and illustrated in Figure 4. The
occurrence of stable active dissolution below this line is evidenced by the loss of the original
metallic gloss which, on the other hand, is still observable above the interface. This active/passive
p°.
pOp
9
boundary initially moves upward as some of the already passivated surface becomes active. The
rate of metal dissolution is high in a region identified by a bracket just below the active/passive
transition in the ten minute photograph of Figure 6. Electrode potential measurements reported
in Figure 3 show this (bracket) region of the crevice wall to correspond to the high current portion
of the active loop of the polarization curve (Figure 4). With the highest dissolution rate occurring
in this region, a new crevice appears with time, as illustrated in the upper sketch in Figure 4. After
ten minutes (Figure 6) enough metal has been dissolved to make evident the start of a local
penetration (referred to as the active crevicing site) in this region of the cavity wall. After a longer
time, this new penetration is well developed and appears as a dark region due to the accumulation
of corrosion products at this location (60 minute photograph).
Subsequent examination of the crevicing in Figure 6 showed that the penetration had an
upward thrust as shown schematically in Figure 7, in accord with the imax current occurring on the
upper part of the penetration since this is where the active/passive interface is located. Figure 8
shows a long time consequence of the upward thrust of the penetration. Surface perforations
occur, producing the often observed lace-like morphology of surface penetrations around pits
and crevices (2,3,21), as the crevice penetrates the surface from underneath. Once the
penetration occurs, active dissolution ceases or slows considerably because the large IR drop that
supports the active condition vanishes the moment a new , shorter electrolyte path to the bulk
solution exists. Thus, these previously active regions now passivate, and the process repeats at
the new active/passive interface to produce another penetration and eventually many
penetrations as shown in Figure 9. This sequence of events is schematically illustrated in Figur .
10. Note that this explanation of these particular dissolution patterns is based on local potential
variations rather than on local composition variations. Composition variations, of course, exist but0O,
they are a natural consequence of the variation of local electrode potential within the crevice (3);
i.e., a new crevice solution composition arises from the corrosion products and the diffusion of
ionic species which, themselves further promote, or may even be necessary along with an
electrode potential in the active region, for the local cell action to occur, e.q., acidification and/or
0!
10
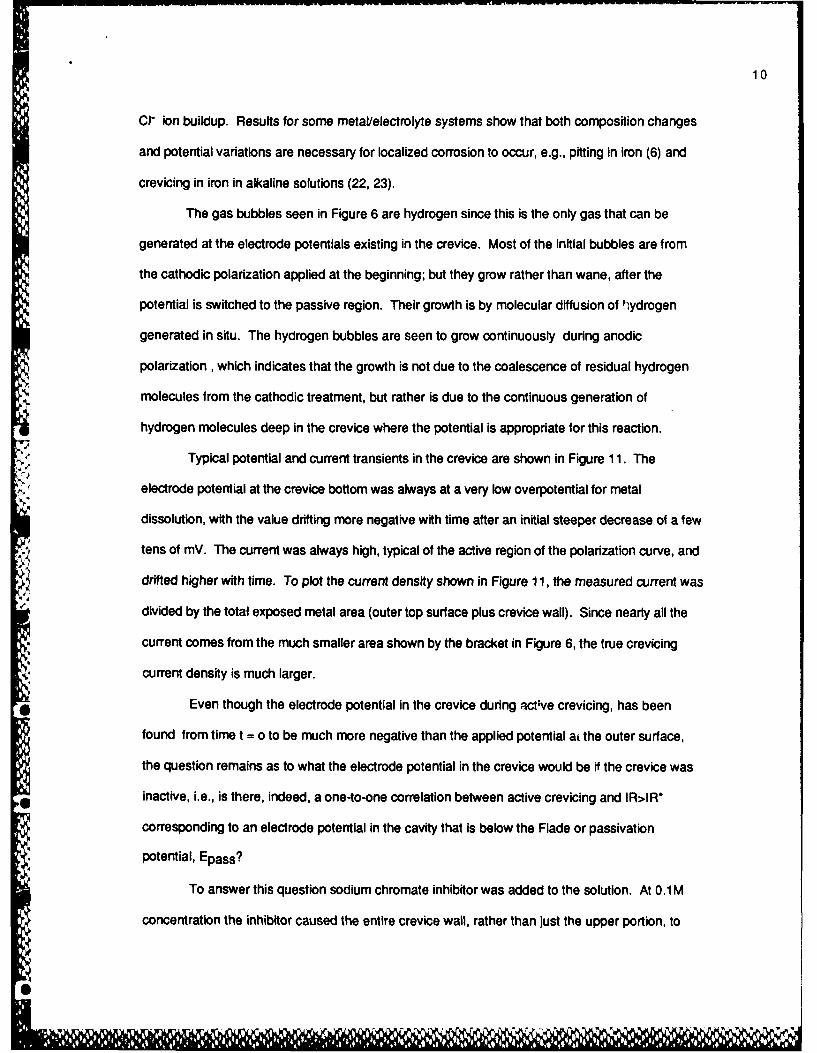
Cl" ion buildup. Results for some metal/electrolyte systems show that both composition changes
and potential variations are necessary for localized corrosion to occur, e.g., pitting in iron (6) and
crevicing in iron in alkaline solutions (22, 23).
The gas bubbles seen in Figure 6 are hydrogen since this is the only gas that can be
generated at the electrode potentials existing in the crevice. Most of the initial bubbles are from
the cathodic polarization applied at the beginning; but they grow rather than wane, after the
potential is switched to the passive region. Their growth is by molecular diffusion of '.ydrogen
generated in situ. The hydrogen bubbles are seen to grow continuously during anodic
polarization , which indicates that the growth is not due to the coalescence of residual hydrogen
molecules from the cathodic treatment, but rather is due to the continuous generation of
hydrogen molecules deep in the crevice where the potential is appropriate for this reaction.
44 "Typical potential and current transients in the crevice are shown in Figure 11. The
electrode potential at the crevice bottom was always at a very low overpotential for metal
dissolution, with the value drifting more negative with time after an initial steeper decrease of a few
tens of mV. The current was always high, typical of the active region of the polarization curve, and
Sdrifted higher with time. To plot the current density shown in Figure 11, the measured current was
divided by the total exposed metal area (outer top surface plus crevice wall). Since nearly all the
current comes from the much smaller area shown by the bracket in Figure 6, the true crevicing
current density is much larger.
Even though the electrode potential in the crevice during active crevicing, has been
found from time t = o to be much more negative than the applied potential at the outer surface,
the question remains as to what the electrode potential in the crevice would be if the crevice was
inactive, i.e., is there, indeed, a one-to-one correlation between active crevicing and IR>IR*
corresponding to an electrode potential in the cavity that is below the Flade or passivation
potential, Epass?
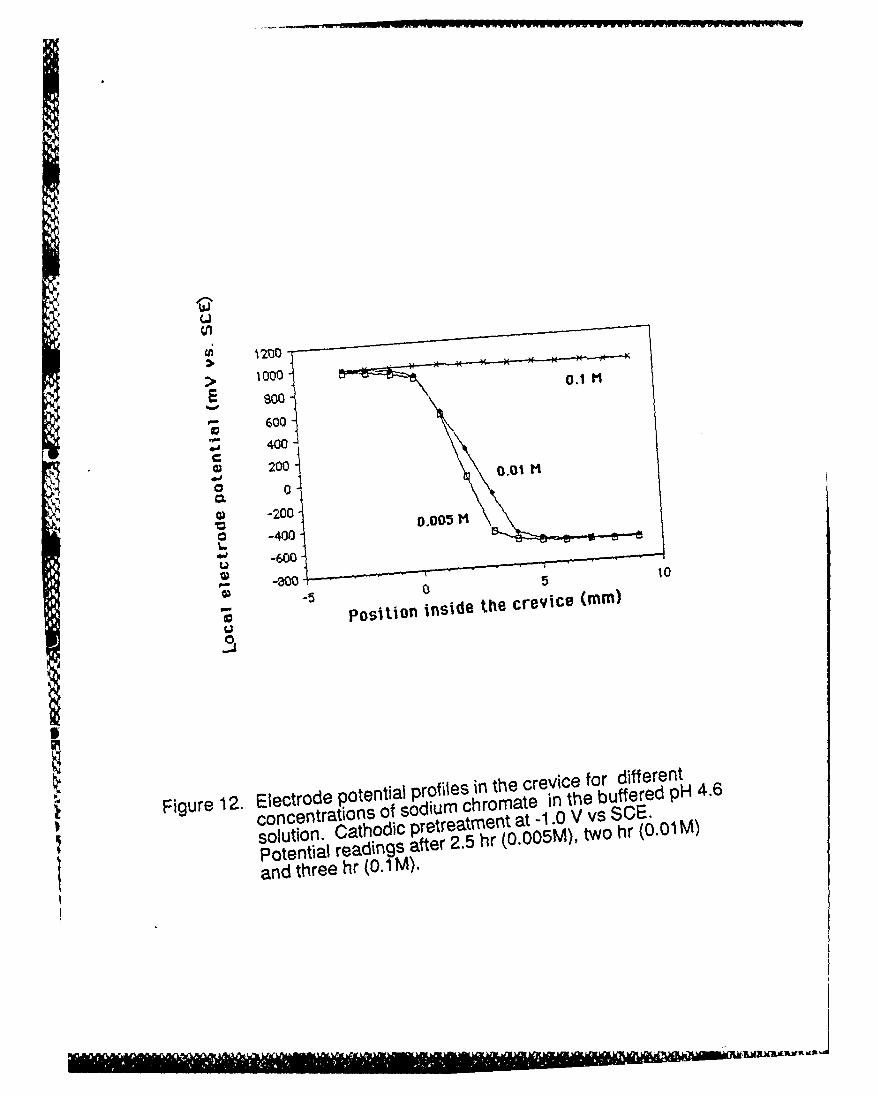
To answer this question sodium chromate inhibitor was added to the solution. At 0.1 M
concentration the inhibitor caused the entire crevice wall, rather than just the upper portion, to
I
11
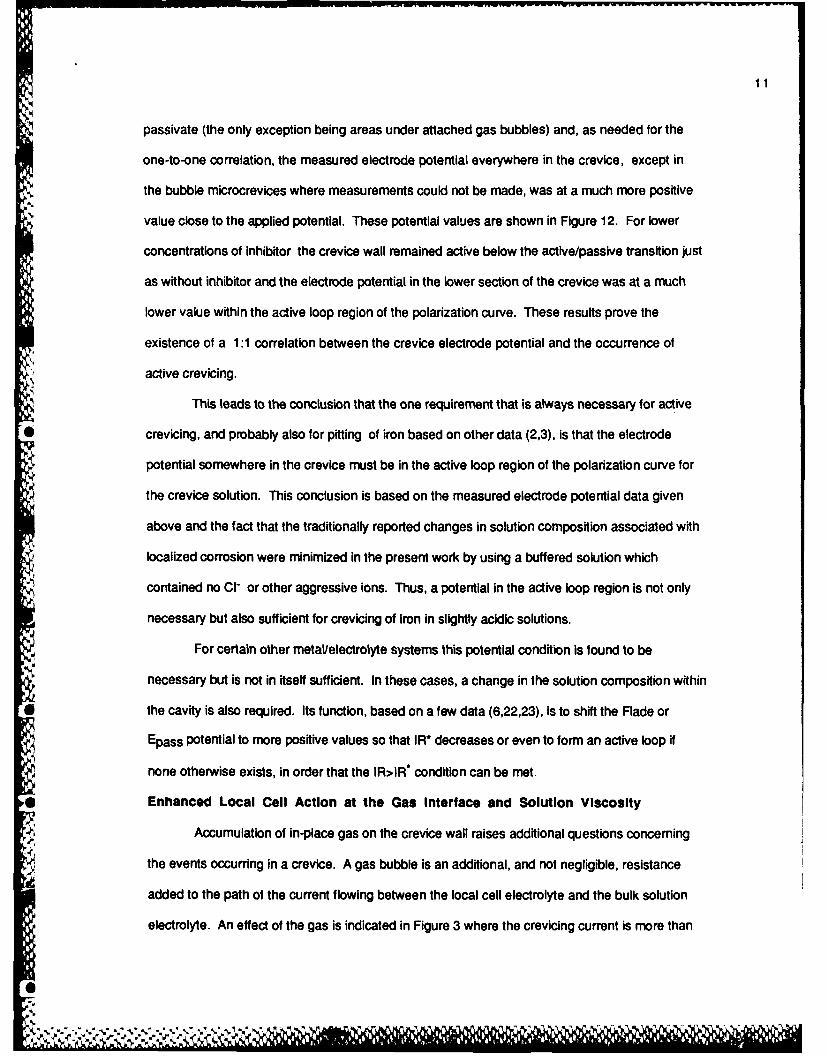
passivate (the only exception being areas under attached gas bubbles) and, as needed for the
one-to-one correlation, the measured electrode potential everywhere in the crevice, except in
the bubble microcrevices where measurements could not be made, was at a much more positive
-* value close to the applied potential. These potential values are shown in Figure 12. For lower
concentrations of inhibitor the crevice wall remained active below the active/passive transition just
as without inhibitor and the electrode potential in the lower section of the crevice was at a much
lower value within the active loop region of the polarization curve. These results prove the
existence of a 1:1 correlation between the crevice electrode potential and the occurrence of
active crevicing.
This leads to the conclusion that the one requirement that is always necessary for active
* crevicing, and probably also for pitting of iron based on other data (2,3), is that the electrode
potential somewhere in the crevice must be in the active loop region of the polarization curve for
the crevice solution. This conclusion is based on the measured electrode potential data given
above and the fact that the traditionally reported changes in solution composition associated with
localized corrosion were minimized in the present work by using a buffered solution which
contained no CI- or other aggressive ions. Thus, a potential in the active loop region is not only
necessary but also sufficient for crevicing of iron in slightly acidic solutions.
For certain other metallelectrolyte systems this potential condition is found to be
necessary but is not in itself sufficient. In these cases, a change in the solution composition within
the cavity is also required. Its function, based on a few data (6,22,23), is to shift the Flade or
Epass potential to more positive values so that IR* decreases or even to form an active loop if
none otherwise exists, in order that the IR>IR° condition can be met.
Enhanced Local Cell Action at the Gas Interface and Solution Viscosity
Accumulation of in-place gas on the crevice wall raises additional questions concerning
the events occurring in a crevice. A gas bubble is an additional, and not negligible, resistance
added to the path of the current flowing between the local cell electrolyte and the bulk solution
electrolyte. An effect of the gas is indicated in Figure 3 where the crevicing current is more than
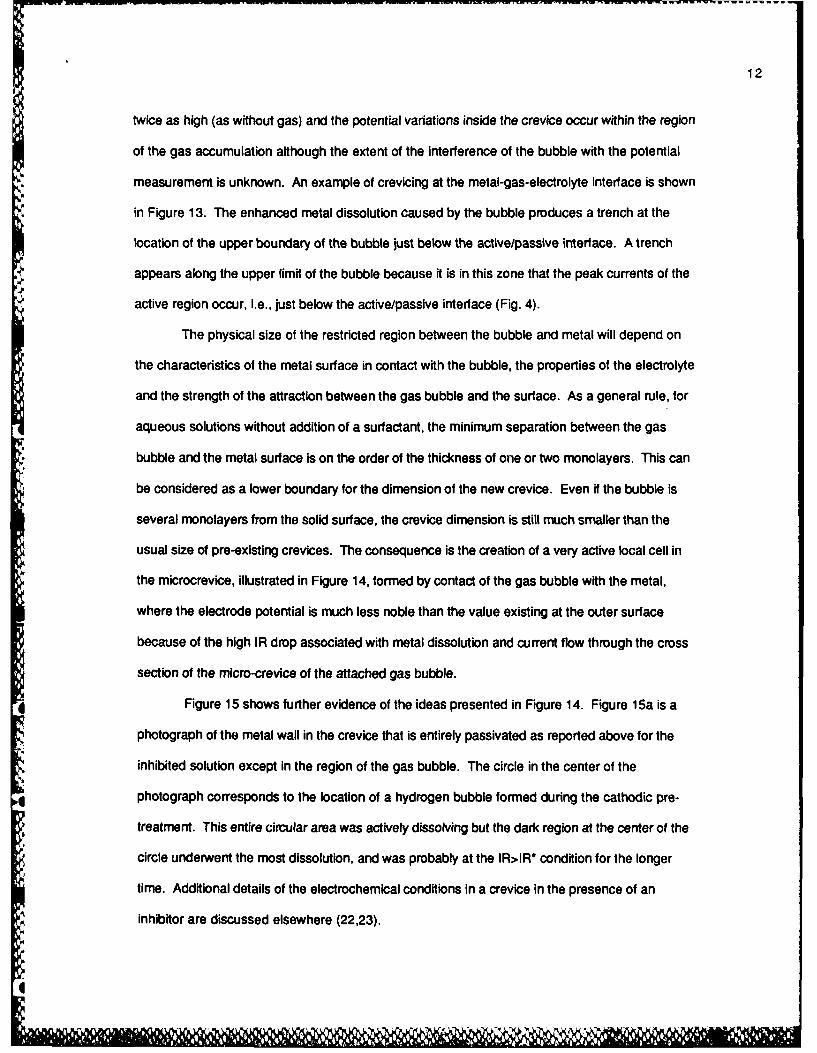
12
twice as high (as without gas) and the potential variations inside the crevice occur within the region
of the gas accumulation although the extent of the interference of the bubble with the potential
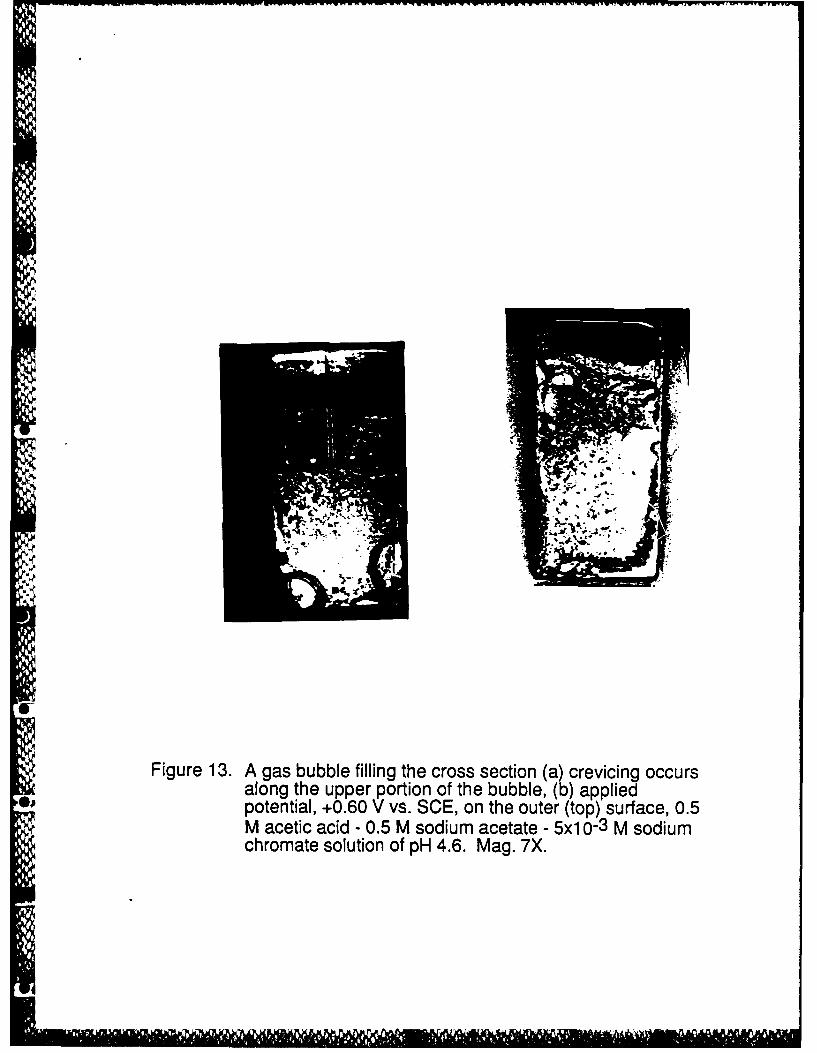
measurement is unknown. An example of crevicing at the metal-gas-electrolyte interface is shown
in Figure 13. The enhanced metal dissolution caused by the bubble produces a trench at the
location of the upper boundary of the bubble just below the active/passive interface. A trench
appears along the upper limit of the bubble because it is in this zone that the peak currents of the
active region occur, i.e., just below the active/passive interface (Fig. 4).
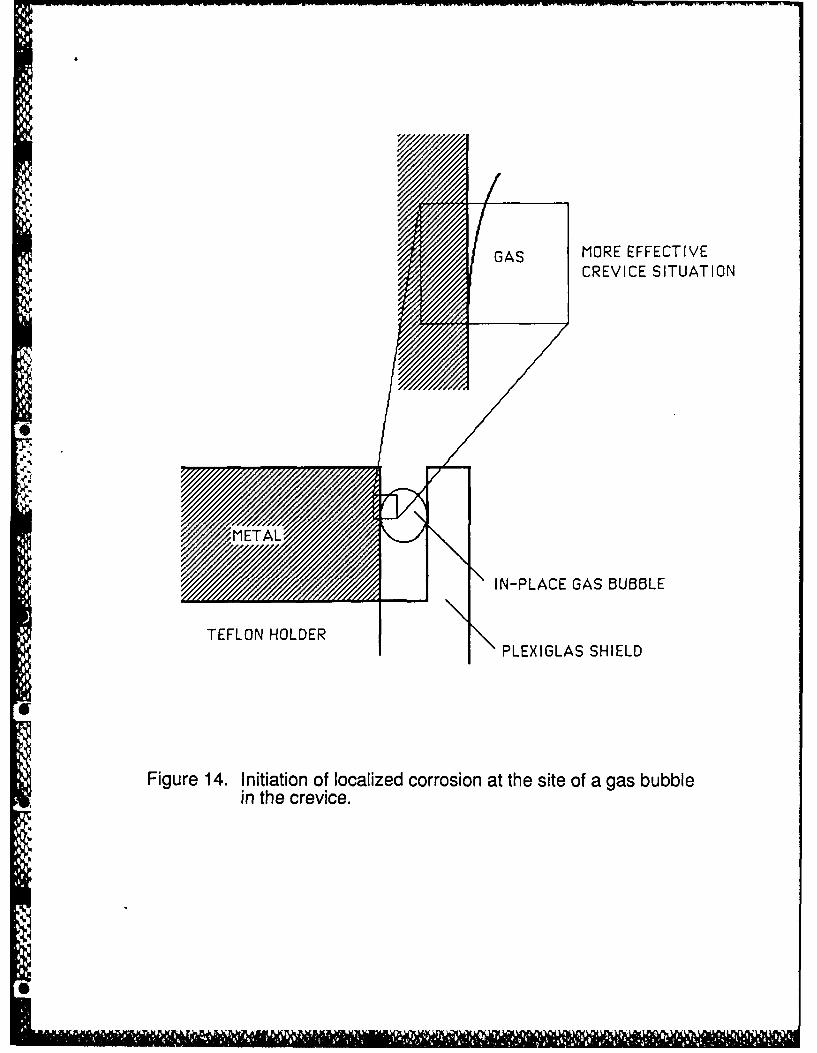
The physical size of the restricted region between the bubble and metal will depend on
the characteristics of the metal surface in contact with the bubble, the properties of the electrolyte
and the strength of the attraction between the gas bubble and the surface. As a general rule, for
aqueous solutions without addition of a surfactant, the minimum separation between the gas
Sbubble and the metal surface is on the order of the thickness of one or two monolayers. This can
be considered as a lower boundary for the dimension of the new crevice. Even if the bubble is
several monolayers from the solid surface, the crevice dimension is still much smaller than the
usual size of pre-existing crevices. The consequence is the creation of a very active local cell in
the microcrevice, illustrated in Figure 14, formed by contact of the gas bubble with the metal,
where the electrode potential is much less noble than the value existing at the outer surface
because of the high IR drop associated with metal dissolution and current flow through the cross
section of the micro-crevice of the attached gas bubble.
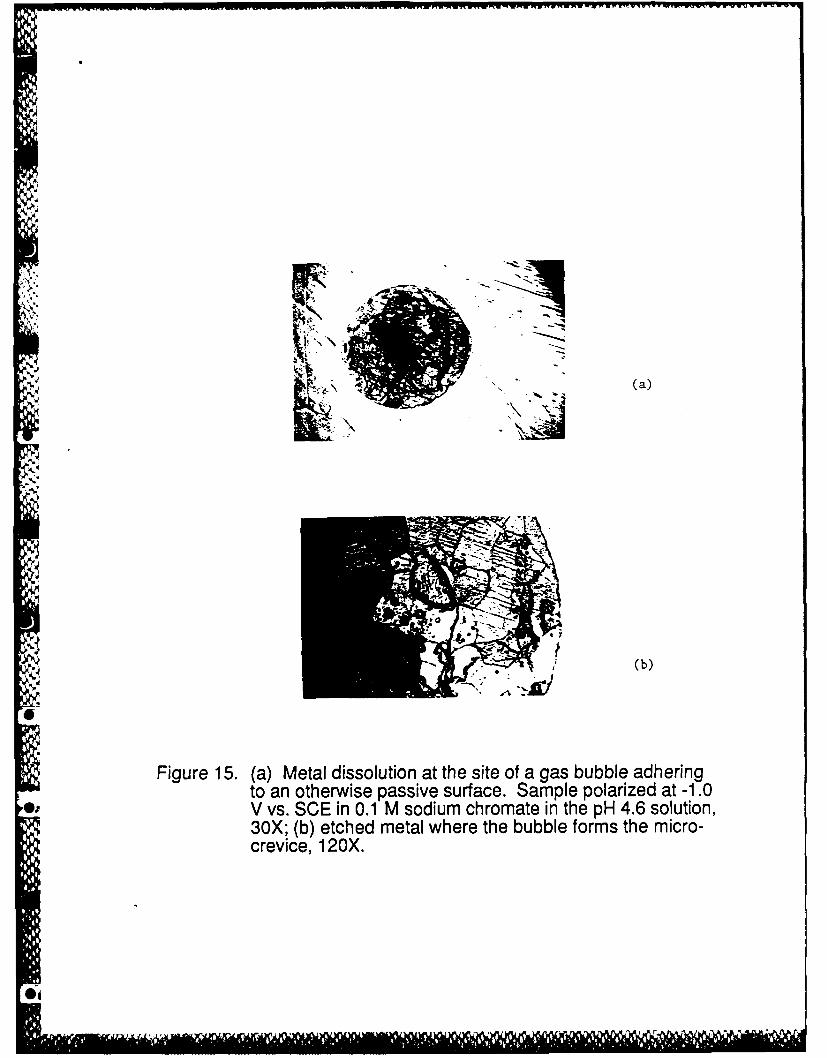
Figure 15 shows further evidence of the ideas presented in Figure 14. Figure 15a is a
photograph of the metal wall in the crevice that is entirely passivated as reported above for the
inhibited solution except in the region of the gas bubble. The circle in the center of the
photograph corresponds to the location of a hydrogen bubble formed during the cathodic pre-
treatment. This entire circular area was actively dissolving but the dark region at the center of the
circle underwent the most dissolution, and was probably at the IR>IR* condition for the longer
time. Additional details of the electrochemical conditions in a crevice in the presence of an
inhibitor are discussed elsewhere (22,23).
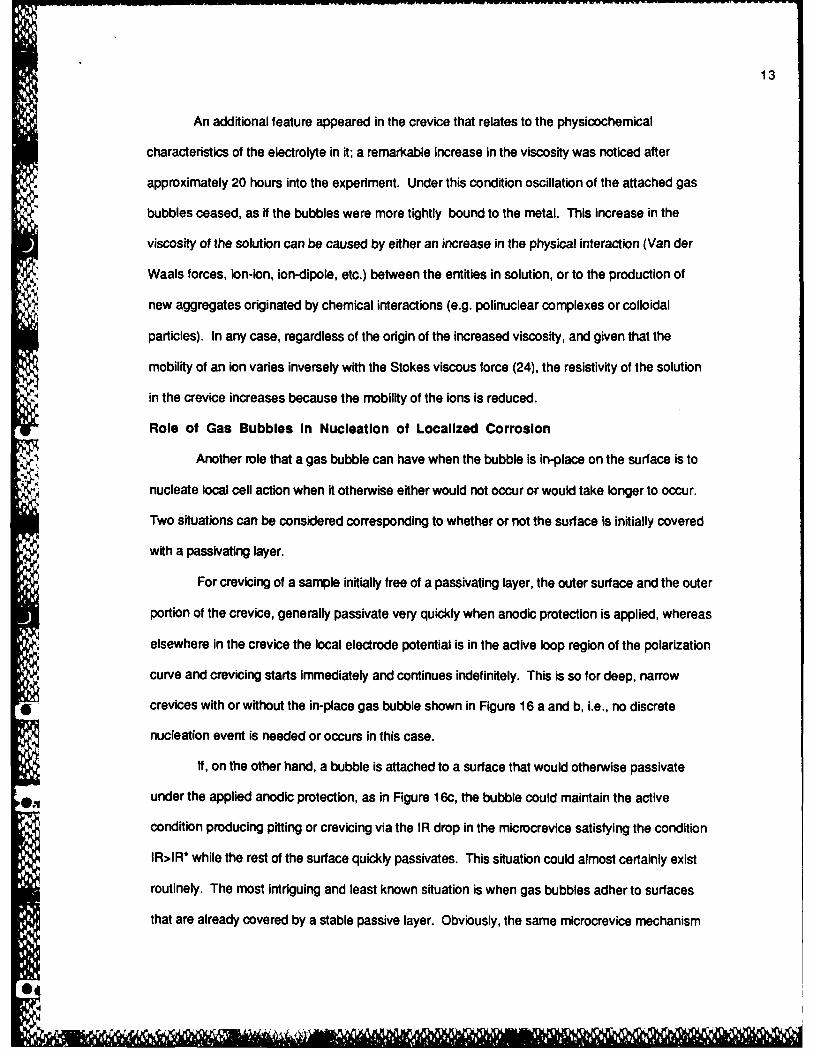
13
An additional feature appeared in the crevice that relates to the physicochemical
characteristics of the electrolyte in it; a remarkable increase in the viscosity was noticed after
approximately 20 hours into the experiment. Under this condition oscillation of the attached gas
bubbles ceased, as if the bubbles were more tightly bound to the metal. This increase in the
viscosity of the solution can be caused by either an increase in the physical interaction (Van der
Waals forces, ion-ion, ion-dipole, etc.) between the entities in solution, or to the production of
new aggregates originated by chemical interactions (e.g. polinuclear complexes or colloidal
particles). In any case, regardless of the origin of the increased viscosity, and given that the
mobility of an ion varies inversely with the Stokes viscous force (24), the resistivity of the solution
in the crevice increases because the mobility of the ions is reduced.
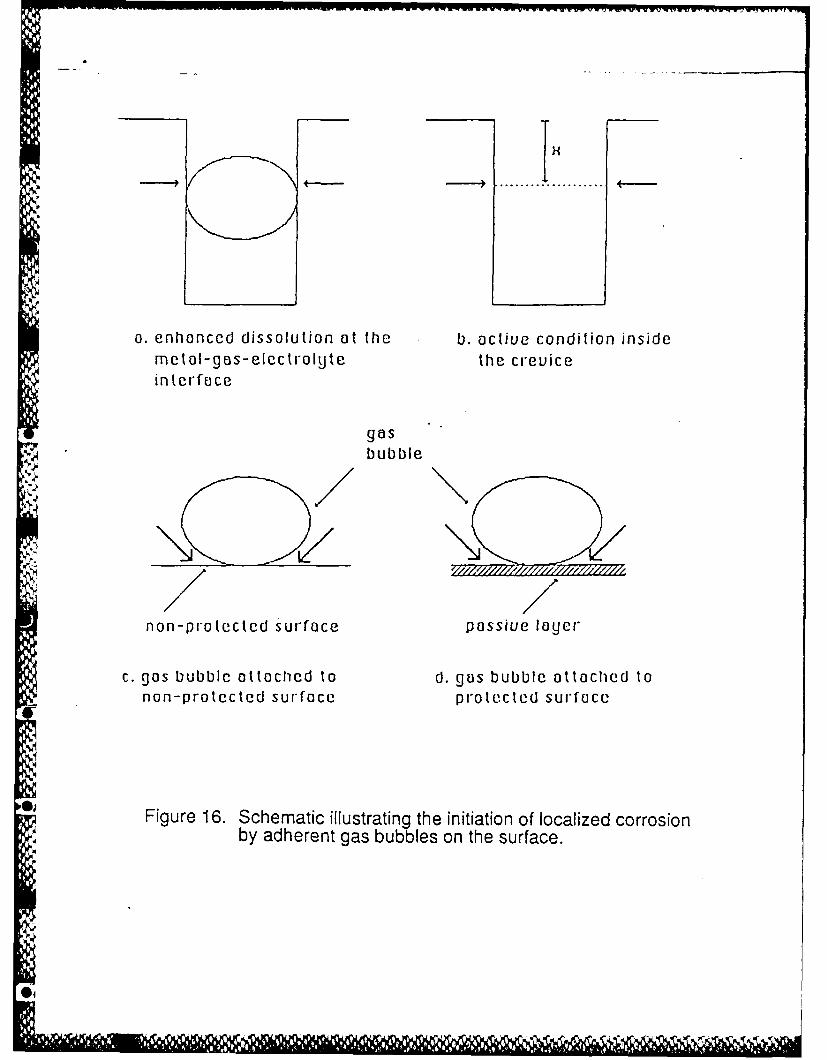
Role of Gas Bubbles In Nucleation of Localized Corrosion
Another role that a gas bubble can have when the bubble is in-place on the surface is to
nucleate local cell action when it otherwise either would not occur or would take longer to occur.
Two situations can be considered corresponding to whether or not the surface is initially covered
with a passivating layer.
For crevicing of a sample initially free of a passivating layer, the outer surface and the outer
portion of the crevice, generally passivate very quickly when anodic protection is applied, whereas
elsewhere in the crevice the local electrode potential is in the active loop region of the polarization
curve and crevicing starts immediately and continues indefinitely. This is so for deep, narrow
* crevices with or without the in-place gas bubble shown in Figure 16 a and b, i.e., no discrete
nucleation event is needed or occurs in this case.
If, on the other hand, a bubble is attached to a surface that would otherwise passivate
under the applied anodic protection, as in Figure 16c, the bubble could maintain the active
condition producing pitting or crevicing via the IR drop in the microcrevice satisfying the condition
IR>IR* while the rest of the surface quickly passivates. This situation could almost certainly exist
routinely. The most intriguing and least known situation is when gas bubbles adher to surfaces
that are already covered by a stable passive layer. Obviously, the same microcrevice mechanism
14
could produce film breakdown and pitting or crevicing but the conditions would appear to be less
favorable, i.e., the current flowing out of the microcrevice is the very small passive current so that
the microcrevice would have to be sufficiently narrow and deep so that the condition, IR>IR*, was
still met. Each of the above situations can also be envisioned if the passivating condition is
maintained by an oxidant in the bulk electrolyte rather than by anodic polarization.
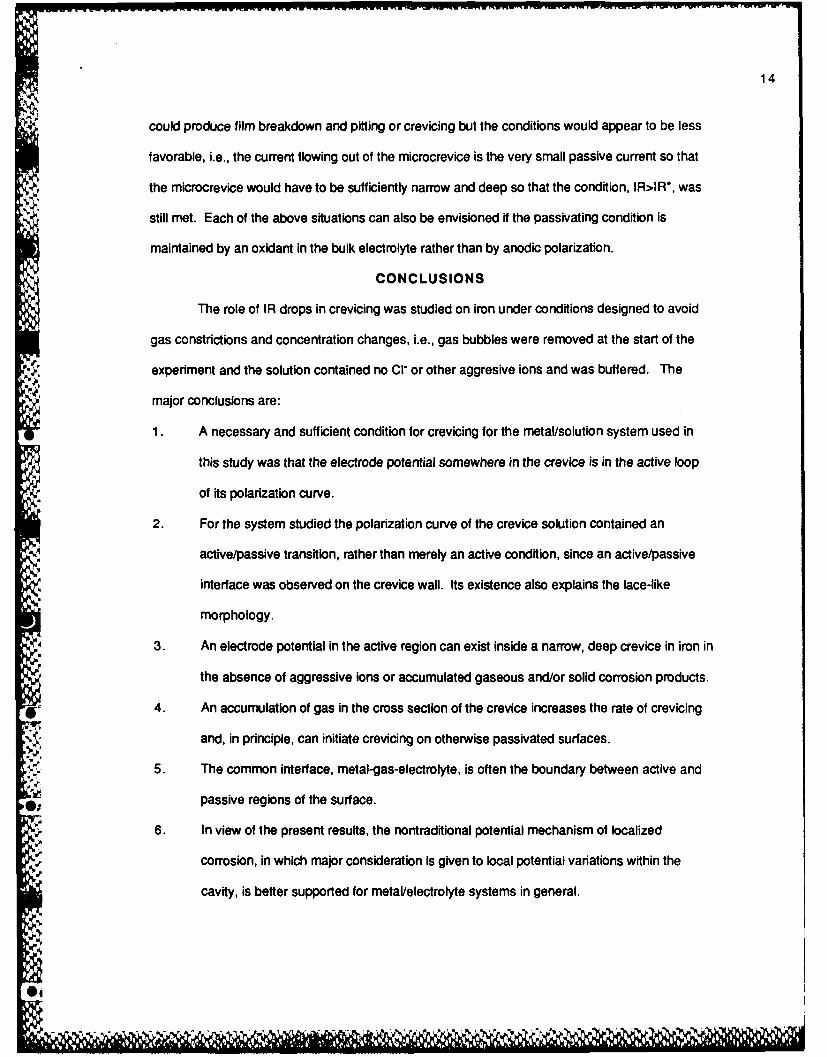
CONCLUSIONS
The role of IR drops in crevicing was studied on iron under conditions designed to avoid
gas constrictions and concentration changes, i.e., gas bubbles were removed at the start of the
"4,•_ experiment and the solution contained no Cl- or other aggresive ions and was buffered. The
major conclusions are:
1. A necessary and sufficient condition for crevicing for the metal/solution system used in
this study was that the electrode potential somewhere in the crevice is in the active loop
"of its polarization curve.
2. For the system studied the polarization curve of the crevice solution contained an
active/passive transition, rather than merely an active condition, since an active/passive
interface was observed on the crevice wall. Its existence also explains the lace-like
morphology.
"3. An electrode potential in the active region can exist inside a narrow, deep crevice in iron in
the absence of aggressive ions or accumulated gaseous and/or solid corrosion products.
4. An accumulation of gas in the cross section of the crevice increases the rate of crevicing
and, in principle, can initiate crevicing on otherwise passivated surfaces.
. 5. The common interface, metal-gas-electrolyte, is often the boundary between active and
passive regions of the surface.
C, 6. In view of the present results, the nontraditional potential mechanism of localized
,,r corrosion, in which major consideration is given to local potential variations within the
cavity, is better supported for metal/electrolyte systems in general.
4,
15
ACKNOWLEDGMENTS
Financial support by the Office of Naval Research under Contract No. N00014-84K-0201 is
gratefully acknowledged. One of us (A.V.) wishes to express his gratitude to the instituto
universitario de Tecnologia - Region Capital and to Consejo Nacional de Investigaciones
Cientificas y Tecnologicas, both in Venezuela, for the support received.
0-
I
16
REFERENCES
1. M. Pourbaix "The electrochemical Basis for Localized Corrosion" in Localized Corrosion,R. W. Staehle, et al. eds. National Association of Corrosion Engineers, Houston, Texas,P. 12, 1974.
2. H. W. Pickering and R. P. Frankenthal, "Mechanism of Pit and Crevice Propagation on Ironand Stainless Steels" in Localized Corrosion, R. W. Staehle, et al., eds., NationalAssociation of Corrosion Engineers, Houston, Texas, p. 261, 1974.
3. H. W. Pickering and R. P. Frankenthal, J. Electrochem. Soc., Vol. 119, p. 1297, (1972).
4. H. W. Pickering and A. Valdes, "A Review of the Effect of Gas Bubbles and CavityDimensions on the Local Electrode Potentials Within Pits, Crevices and Cracks" inEmbrittlement by the Localized Crack Environment, R. P. Gangloff, ed. pp 33-48.Metallurgical Society of AIME, Warrendale, PA, p. 33, 1984.
5. H. W. Pickering, Corrosion, Vol. 42, No. 3, p. 125 (1986).
6. H. W. Pickering, this proceedings, p. ?
7. D. A. Vermilyea and C. S. Tedmon, jr., J. Electrochem. Soc., Vol. 117, p. 437 (1970).
8. T. R. Beck and E. A. Greens II, J. Electrochem. Soc., Vol. 116, p. 177 (1969).
9. B. G. Ateya and H. W. Pickering, J. Electrochem. Soc., Vol. 122, p. 1018 (1975).
10. B. G. Ateya and H. W. Pickering, "Electrochemical Processes Within Cavities and theirRelation to Pitting and Cracking" in Hydrogen in Metals, I. M. Bernstein and A. W.Thompson, eds., American Society of Metals, p. 206, 1974.
11. W. D. France, Jr., and N. D. Greene, Jr., Corrosion, Vol. 24, No. 8, p. 247 (1968).
12. H. W. Pickering "The Limiting IR Voltage Within Electrolyte in Cavities during LocalizedCorrosion and Hydrogen Charging of Metals", in Corrosion and Corrosion Protection, R.P. Frankenthal and F. Mansfeld, eds., The Electrochemical Society, Pennington,N.J., p.85, 1981.
13. R. E. DeLaRue and C. W. Tobias, J. Electrochem. Soc., Vol. 106, p. 827 (1959).
14. C. W. Tobias, J. Electrochem. Soc., Vol. 106, p. 833 (1959).
"" 15. H. Vogt, Electrochimica Acta, Vol. 26, p. 1311 (1981).
16. J. A. Harrison and A. T. Kuhn, Surface Technology, Vol. 19, p. 249 (1983).
17. Bongenaar-Schlenter, et al., J. Appl. Electrochem., Vol. 15, p. 537 (1986).
18. L. J. J. Janssen and E. Barendrecht, Electrochimica Acta, Vol. 28, p. 341 (1983).
19. H. Vogt, J. Appl. Electrochem., Vol. 14 (1985).
20. P. Sides, in Modem Aspects of Electrochemistry, Vol. 18, R. E. White, J. O'M. Bockris"and B. E. Conway, eds., Plenum Press, new York, p. 303,1986.
21. J. Postlethwaite, B. Huber and D. Makepeace, CORROSION 86, Paper No. 273. NationalAssociation of Corrosion Engineers, Houston, Texas, 1986.
17
22. A. Valdes and H. W. Pickering, to be submitted to the J. Electrochemical Soc.
23. A. Valdes, Ph.D. Thesis, The Pennsylvania State University, 1987.
24. J. O'M. Bockris and A.K.N. Reddy, Modem Electrochemistry, Vol. 1, Plenum Press, NewYork, p. 47 1, 1974.
N N
16
FIGURE CAPTIONS
Figure 1. Schematic of the sample arrangement; the highlighted surfaces are the iron surfaces
in contact with the electrolyte.
Figure 2. Schematic of the experimental set-up.
Figure 3. Potential profiles along the iron wall of the crevice, with (shadowed region) andwithout accumulation of gas at the cross section. Applied potential +0.60 V vs. SCEon the outer (top) surface, 0.5M acetic acid - 0.5 M sodium acetate solution of pH4.6. Approximate currents flowing out of the crevice were 4.5 and 2.0 mA cm- 2 withand without the gas constriction, respectively.
Figure 4. Schematic showing that for the outer surface at A, the electrode potential along thecavity changes towards B, in which case the boundaries of the active crevicing cell
are the active/passive and limiting potentials (2-6,12).
SFigure 5. Theoretical prediction of the ratio of the conductivity of dispersions of non-conductive spheres of unequal size to the conductivity of the continuous phase as afunction of the volume fraction of the spheres (20).
Figure 6. Views, through the Plexiglas, of the iron wall in the crevice during anodic polarizationof the outer (top) iron surface at +0.6 V vs. SCE in 0.5 M acetic acid/0.5 M sodiumacetate. Above the line shown by the pointer, the crevice passivates. Irondissolution is rapid in the region shown by the bracket. Mag. 7X.
Figure 7. An advance of the active crevicing site, that eventually leads to penetration of thetop surface; the shadowed region shows the dissolving crevice surfaces.
Figure 8. After long times the new crevicing penetration reaches the outer (top) surface,breaking through the surface from underneath.
Figure 9. (a) Crevicing from underneath causes a network of perforations of the top surface,(b) after some time the undermined section collapses.
Figure 10. Schematic explanation of the role of IR drop in producing the lace-like morphology of"pits" sometimes observed at crevices and inclusions.
Figure 11. Potential at the bottom of a gas-free crevice and current as a function of time in tt'eaerated pH five solution. Sample cathodically pre-treated at -1.0 V vs. SCE prior toswitch to +0.6 V.
Figure 12. Electrode potential profiles in the crevice for different concentrations of sodiumchromate in the buffered pH 4.6 solution. Cathodic pretreatment at -1.0 V vs SCE.Potential readings after 2.5 hr (0.005M), two hr (0.01M) and three hr (0.1M).
Figure 13. A gas bubble filling the cross section (a) crevicing occurs along the upper portion ofthe bubble, (b) applied potential, +0.60 V vs. SCE, on the outer (top) surface, 0.5 Macetic acid - 0.5 M sodium acetate - 5x10⁻³ M sodium chromate solution of pH 4.6.
E Mag. 7X.
Figure 14. Initiation of localized corrosion at the site of a gas bubble in the crevice.
Figure 15. (a) Metal dissolution at the site of a gas bubble adhering to an otherwise passivesurface. Sample polarized at -1.0 V vs. SCE in 0.1 M sodium chromate in the pH 4.6solution, 30X; (b) etched metal where the bubble forms the micro-crevice, 120X.
19
Figure 16. Schematic illustrating the initiation of localized corrosion by adherent gas bubbles onthe surface.
4i
Teflon holder
if i
IL -------- --- MICROSCOPEWITHPHOTOGRAPHICCAMERA
plexiglas plate
Figure 1. Schematic of the sample arrangement; the highlightedsurfaces are the iron surfaces in contact with theelectrolyte.
O4
3D-MANIPULATOR
E CHART7777/77 CHART
,2,AME TAL' : -POTENTIOSTAT
MICROSCOPE :........... :
WITH -
PHOTOGRAPHIC
CAMERA
Figure 2. Schematic of the experimental set-up.
*1ýj .~ . ..a . .. ~ . II IN'
Lu 600U
400 *
> 200E
0 - ithbbl-. without bubble
- -200:
LCo -400o
U -600 ,:0-J -5 -3 -1 1 3 5 7 9
Position inside the crevice (mm)
Figure 3. Potential profiles along the iron wall of the crevice, with(shadowed region) and without accumulation of gas at the
., cross section. Applied potential +0.60 V vs. SCE on theouter (top) surface, 0.5M acetic acid - 0.5 M sodiumacetate solution of pH 4.6. Approximate currents flowingout of the crevice were 4.5 and 2.0 mA with and withoutthe gas constriction, respectively.
I l
passive film
----- ------------j ctivye/ passivye
i nterhs
1* Lmmax
Fe Fe2F 2e
L
I f m surface a
.•,. he ativepassve ad limtingpotetia te(2-,12)
2 H+ e- H202
Figure 4. Schematic showing that for the outer surface at A, theeilectrode potential along the cavity changes towards B, in
0: which case the boundaries of the active crevicing cell arethe active/passive and limiting potentials (2-6,12).
4--,
'I,,
1.0
0.8
•- 0 .
0.6
00.20
0 0.2 0.4 0.6 0.8 1.0
Volume fraction of the dispersed phase
Figure 5. Theoretical prediction of the ratio of the conductivity ofdispersions of non-conductive spheres of unequal size to
, the conductivity of the continuous phase as a function ofthe volume fraction of the spheres (20).
S.
P, L
--- 1 minute 10 minutes
•¢• !Figure 6. Views, through thePlexiglas, of the iron
wall in the crevice"during anodicpolarization of theouter (top) ironsurface at +0.6 V vs.
•4 SCE in 0.5 M aceticacid/0.5 M sodiumacetate. Above the"line shown by the"pointer, the crevice
S.-passivates. Irondissolution is rapid inthe region shown bythe bracket. Mag. 7X.
60 minutes
• 1*e

N ~ ~ ~ ~~ ~~ . . . . . .. . . .m . ... . . m • u . ... . . . . .. . . .
Figure 7. An advance of the active crevicing site, that eventuallyleads to penetration of the top surface; the shadowedregion shows the dissolving crevice surfaces.
4I
perforations
--
Figure 8. After long times the new crevicing penetration reaches theouter (top) surface, breaking through the surface fromunderneath.
S~(b)
Figure 9. (a) Crevicing from underneath causes a network ofperforations of the top surface, (b) after some time theundermined section collapses.
61 11 J11
I R*man.
rate
t=O+ ti
t 2 t3
II-
Figure 10. Schematic explanation of the role of IR drop in producingthe lace-like morphology of "pits" sometimes observed atcrevices and inclusions.
-480• 3.0
"-500'
S-2.5
> E> -520-
© -360- U
"" 60 1.0
S /a.
_ • -5600 !.
S0 10 20 30 40 60 e 70
?a•• Time after switch (min)
S~Figure 11. Potential at the bottom of a gas-free crevice and current
variation, with time in the aerated pH five solution. Samplecathodically pre-treated at -1.0 V vs. SCE prior to switch to+0.6 V.
W illi
•"" ' "TM•T•":'•'•• •' '••°•'"tt• '°OC• •
U,
*j 400
0 00 MBO
20 \0.01 tI
0
-200 0.00511
-400 -
-600-BOO5
10
-3000
"U Position inside the crevice (Mm)
Figure 12. Electrode potential profiles in the crevice for different
conentatins f odium chromate in the butfered pH 4.6concentrations of so4u cr
solution. Cathodic pretreatment at -1.0 V vs SCE.
Potential readings after 2.5 hr (0.005M), two hr (O.O1M)
and three hr (0.1 M).
!Pit
9.%
L•'AL
S~Figure 13. A gas bubble filling the cross section (a) crevicing occurs
along the upper portion of the bubble, (b) appliedet potential, +0.60 V vs. SCE, on the outer (top) surface, 0.5
S~chromate solution of pH 4.6. Mag. 7X.MS a9i ai -vu
ip
GAS MORE EFFECTIVECREVICE SITUATION
_• •MET AL"•
0 \IN-PLACE GAS BUBBLE
.TEFLON HOLDER PLEXIGLAS SHIELD
Figure 14. Initiation of localized corrosion at the site of a gas bubblein the crevice.
S,' (b)
Figure 15. (a) Metal dissolution at the site of a gas bubble adheringto an otherwise passive surface. Sample polarized at -1.0
0o V vs. SCE in 0.1 M sodium chromate in the pH 4.6 solution,30X; (b) etched metal where the bubble forms the micro-crevice, 1 20X.
.........
{ ... .. .
a. enhanced dissolution at the b. active condition insidemetal-gas-electrolyte, the creviceintIer f ace
gasbubble
non-pro tected surface passiue lager,
c. gas bubblc attached to d. gas bubble attached tonon-protectcd surface Protected surface
Figure 16. Schematic illustrating the initiation of localized corrosionby adherent gas bubbles on the surface.
I0
BASIC DISTRIBUTION LIST
Technical and Summary Reports 1985
Orzanization Code Orcanization Cooies
Defense Documentation Center Naval Air Propulsion Test CenterCameron Station Trenton, NJ 08628Alexandria, VA 22314 12 ATTN: Library
Office of Naval Research Naval Electronics LaboratoryDepartment of the Navy San Diego, CA 92152800 N. Quincy Street ATTN: Electron MaterialsArlington, VA 22217 Sciences DivisionAttn: Codes 431 3
Naval Research Laboratory Naval Missile CenterWashington, DC 20375 Materials ConsultantATTN: Codes 6000 1 Code 3312-1
6300 1 Point Mugu, CA 9204126271
Naval Air Development Center Naval Construction BattallionCode 606 Civil Engineering LaboratoryWarminster, PA 18974 Port Hueneme, CA 93043ATTN: Dr. J. DELuccia I ATTN: Materials division
Commanding Officer CommanderNaval Surface Weapons Center David W. Taylor Naval ShipWhite Oak Laboratory Research and Development CenterSilver Spring, MD 20910 Bethesda, MD Z0084ATTN: Library
Naval Oceans Systems Center Naval Underwater System CenterSan Diego, CA 92132 Newport, RI 02840ATTN: Library 1 ATTN: Libary
Naval Postgraduate School Naval Weapons CenterSMonterey, CA 93940 China Lake, CA 93555
ATTN: Mechanical Engineering ATTN: LibraryDepartment
Naval Air Systems Command NASAWashington, DC 20360 Lewis Research CenterATTN: Code 310A 1 21000 Brookpark Road
Code 5304B 1 Cleveland, OH 44135ATTN: Library
Naval Sea System Command National Bureau of StandardsWashington, DC 20362 Washington, DC 20234ATTN: Code 05R 1 ATTN: Metals Science and Stands
Division
Ceramics Glass and Solid StateScience Division
Fracture and Deformation Div.
RE/431/82/174
Naval Facilities Engineering Defense Metals and CeramicsCommand Information Center
Alexandria, VA 22331 Battelle Memorial InstituteATTN: Code 03 1 505 King Avenue
Columbus, Oh 43201
Scientific Advisor Metals and Ceramics DivisionCommandant of the Marine Corps Oak Ridge National LaboratoryWashington, DC 20380 P.O. Box XATTN: Code AX 1 Oak Ridge, TN 37380
Army Research Office Los Alamos Scientific LaboratoryP. 0. Box 12.211 P.O. Box 1663Triangle Park, NC 27709 Los Alamos, NM 87544ATTN: Metallurgy & Ceramics ATTN: Report Librarian
Program K 1
Army Materials and Mechanics Argonne National LaboratoryResearch Center Metallurgy Division
Watertown, MA 02172 P.O. Box 229ATTN: Risearch Programs Lemont, IL 60439
Office 1
Air Force Office of Scientific Brookhaven National LaboratoryResearch/NE Technical Information Division
Building 410 Upton, Long IslandBolling Air foce Base New York 11973Washington, DC 20332 ATTN: REsearch LibraryATTN: Electronics & Materials
Science Directorate
NASA Headquarters Library
Washington, DC 20546 Building 50 Room 134Lawrence Radiation Laboratory
SATTN: Code REM Berkeley, CA
Mr. Michael T. McCrackenOffice of Naval Research Resident
RepresentativeNational Academy of Sciences,
Joseph Henry Bldg.,Room 623, 2100 Pennsylvania Avenue,
' N.W.Washington, D.C. 20037 1
036
Supplemental Distribution List Jan 1985
Prof. I.M. lBerk~in Profs. G.H. Meier and F.S. Petti
Dept. of Mefrlurgy and Materials Science Dept. of Metallurgical and
Carnegie-M Ilo University Materials Eng.Pittsbur , PA 5213 University of Pittsburgh
Pittsburgh, PA 15261
Prof. H.K. Birnbaum Dr. J.R. PickensDept. of Metallurgy & Mining Eng. 1z'rtin Marietta LaboratoriesUniversity of Illinois 1450 South Rolling Rd.Urbana, lii 61801 Baltimore, MD 21227-3898
Dr. D.H. Boone Pr-f. H.W. PickeringDepartment of Mechanical Eng. Dept. ý)- Materials Science andNaval Postgraduate School Eng.Monterey, Ca 93943 The Pennsylvania State
UniversityUniversity Park, PA 16802
Dr. C.R. Crowe Prof. R. SutmmitCode 6372 Dept. of Metallurgy MechanicsN1aval Research Laboratory and Materials ScienceWashington. D.C. 20375 Michigan State University
East lansing, MI 48824
Prof. D.J. Duquette Prof. R.P. WeiDept. of Metallurgical Eng. Dept. of Mechanical EngineeringRensselaer Polytechnic Inst. and MechanicsTroy, NY 12181 Lehigh University
Bethlehem, PA 18015
Prof. J. P. Hirth Prof. A.J. ArdellDept. of Metallurgical Eng Dept. of Materials Science and EngThe Ohio State University School of Engineering & AppliedColumbus, OH 43210 •Sctnece
University of California atLos Angleles
Los Angeles, CA 90024
Dr. R.G. Kasper Prof. B.E. WildeCode 4493 Fontana Corrosion CenterNaval Underwater Systems Center Dept. of Metallurgical Eng.New London, CT 06320 The Ohio State University
116 west 19th Ave.Columbus, OH 4320
Prof. H. Leidheiser, Jr. Dr. C. R. ClaytonCenter for coatings and Surface Research Department of Materials Science
Sinclair Laboratory, Bid. No. 7 & EngineeringLehigh University State University of new York
Bethlehem, PA 18015 Stony BrookLong Island, New York 11794
Dr. F. MansfeldRockwell International - Science Center
1049 Camino Dos KiosP.O. Box 1085
a n . . .-.. . . , A .
/
Prof. Boris D. Cahan Prof. G.R. St. PierreDept. of Chemistry Dept. of Metallurgical Eng.Case Western Reserve Univ. The Ohio State UniversityCleveland, Ohio 44106 Columbus, OH 43210
Dr. K. Sadananda Prof. G. SimkovichCode 6390 Dept. of Materials Science & Eng.Naval Research Laboratory The Pennsylvania State UniversityWashington, D.C. 20375 University Park, PA 16802
Prof. M.E. Orazem Dr. E. McCaffertyDept. of Chemical Engineering Code 6310University of Virginia Naval Research LaboratoryCharlottesville, VA 22901 Washington, D. C. 20375
-', Mr. T.W. CrookerCode 6310Naval Research LaboratoryWashington, D.C. 20375
2
D! 2