Embed Size (px)
Citation preview

‘Colloids in space’: recent work and outlook for the Milano and
Montpellier Groups
G. Brambilla1, L. Cipelletti1, L. Berthier1, S. Buzzaccaro2, R. Piazza2
1L2C, Université Montpellier 2 and CNRS2Politecnico di Milano
V. TrappeFribourg University
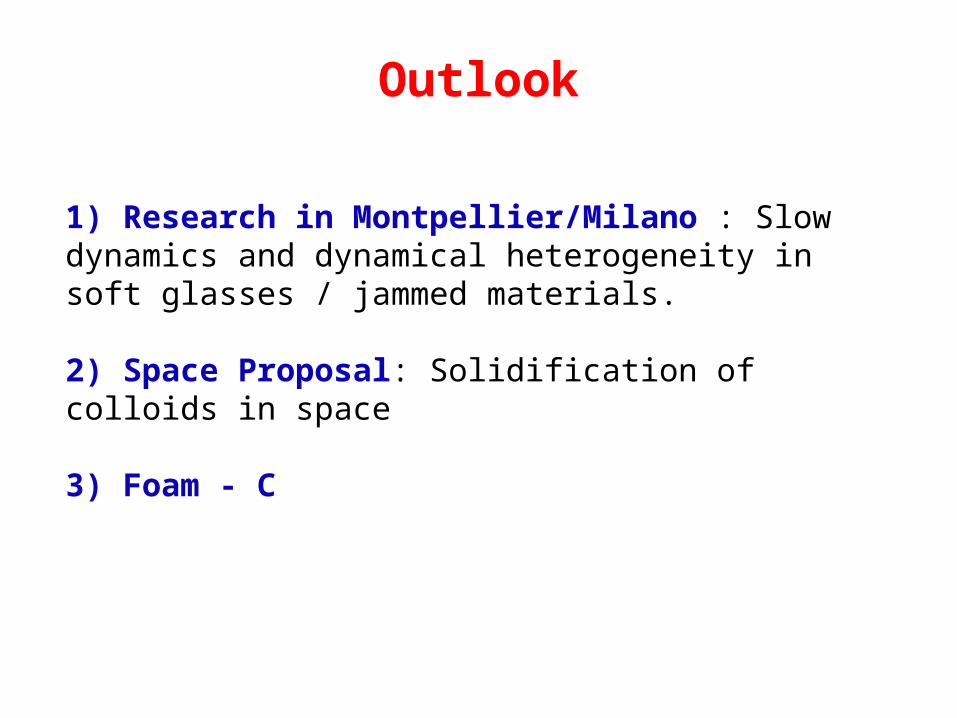
Outlook
1) Research in Montpellier/Milano : Slow dynamics and dynamical heterogeneity in soft glasses / jammed materials.
2) Space Proposal: Solidification of colloids in space
3) Foam - C
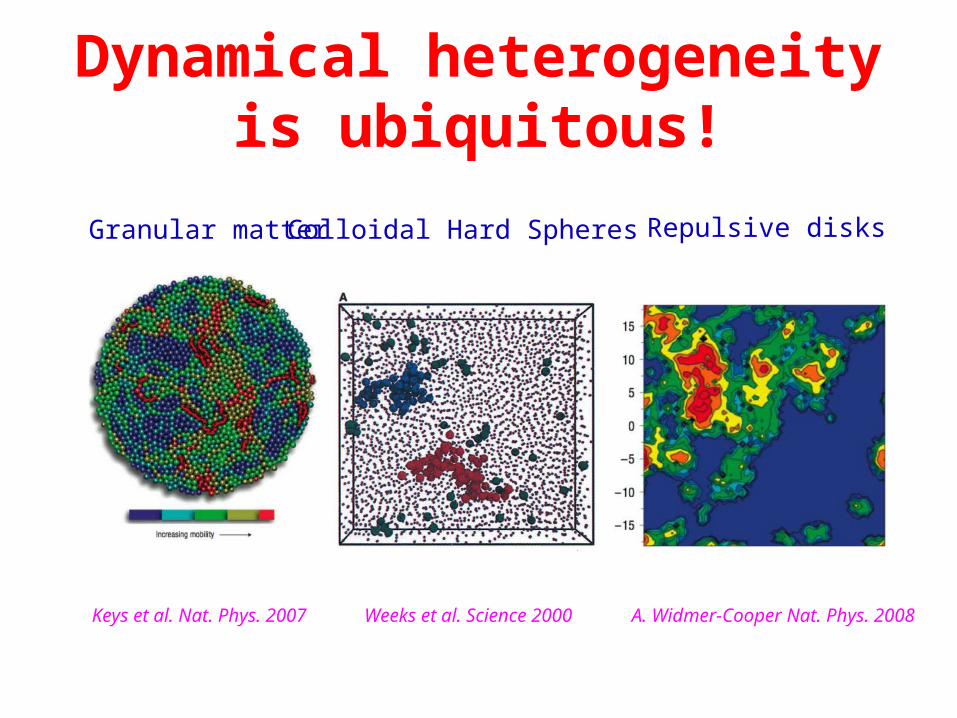
Dynamical heterogeneity is ubiquitous!
Granular matter Colloidal Hard Spheres Repulsive disks
Weeks et al. Science 2000Keys et al. Nat. Phys. 2007 A. Widmer-Cooper Nat. Phys. 2008
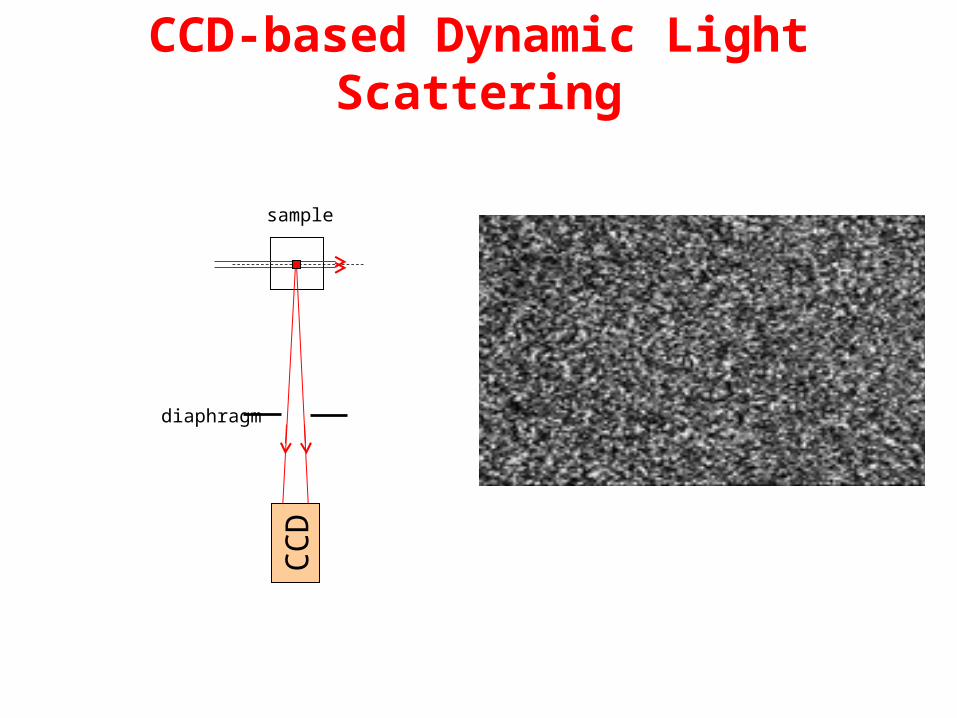
CCD-based Dynamic Light Scattering
diaphragm
sample
CC
D
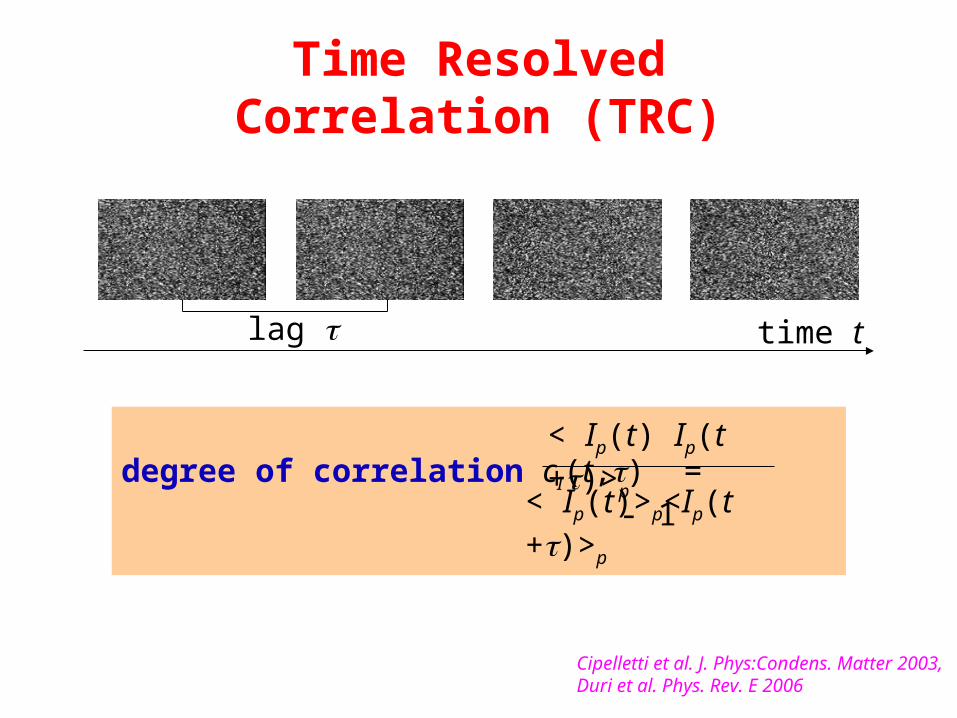
Time Resolved Correlation (TRC)
time tlag
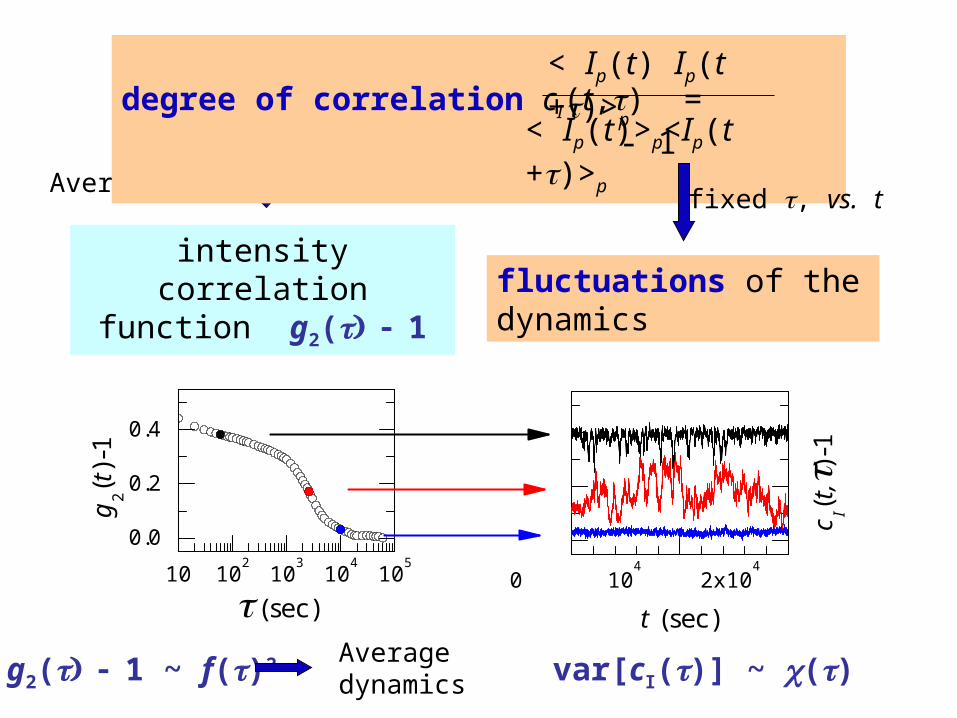
degree of correlation cI(t,) = - 1< Ip(t) Ip(t +)>p
< Ip(t)>p<Ip(t +)>p
Cipelletti et al. J. Phys:Condens. Matter 2003,Duri et al. Phys. Rev. E 2006

10 102 103 104 105
0.0
0.2
0.4
g 2(t)-
1
(sec)
intensity correlation function g2(1
Average over t
degree of correlation cI(t,) = - 1< Ip(t) Ip(t +)>p
< Ip(t)>p<Ip(t +)>p
Average dynamicsg2(1 ~ f()2
intensity correlation function g2(1
Average over t
degree of correlation cI(t,) = - 1< Ip(t) Ip(t +)>p
< Ip(t)>p<Ip(t +)>p
fixed , vs. t
fluctuations of the dynamics
c I(t,)
-1
t (sec)0 10
4 2x10
410 102 103 104 1050.0
0.2
0.4
g 2(t)-
1
(sec)
Average dynamicsg2(1 ~ f()2 var[cI()] ~ ()
10m
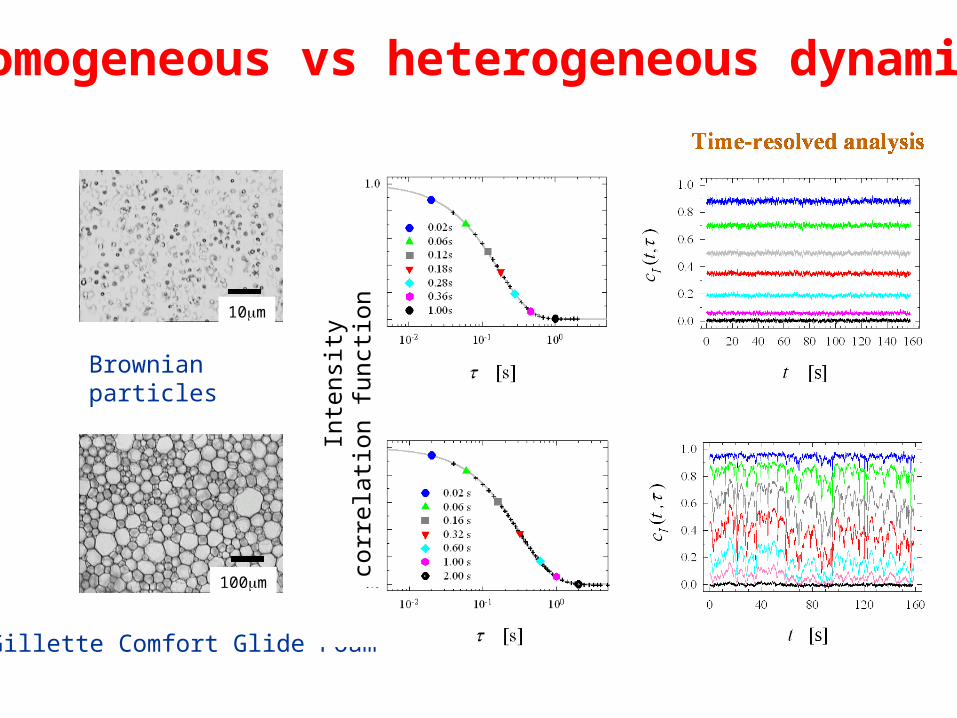
Homogeneous vs heterogeneous dynamics
100m
Gillette Comfort Glide Foam
Brownian particles
Inte
nsit
y co
rrel
atio
n fu
ncti
on
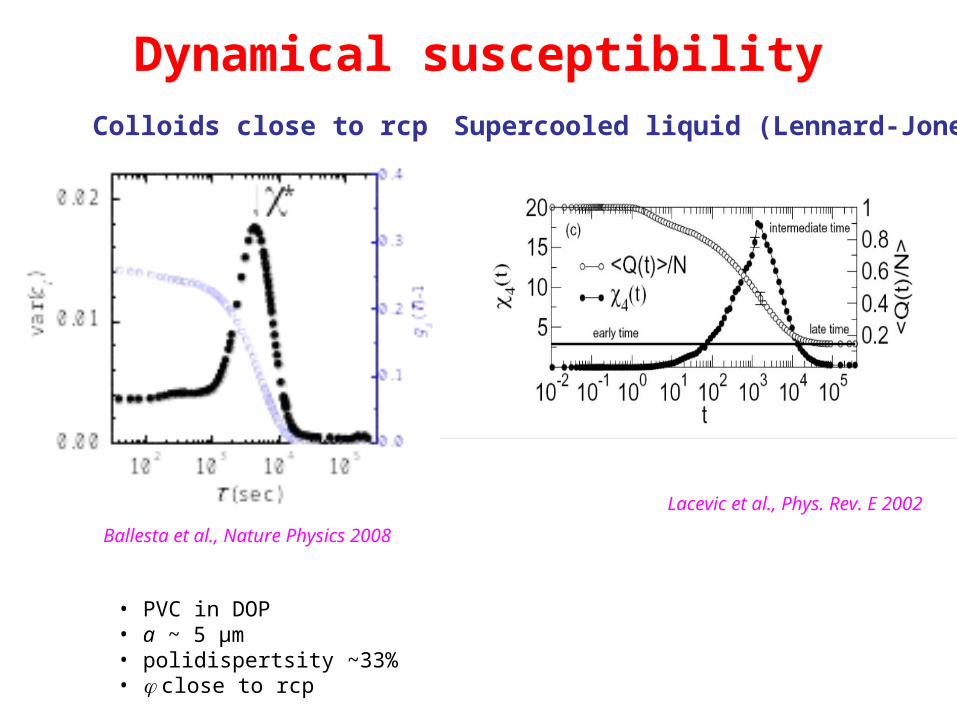
Dynamical susceptibility
• PVC in DOP• a ~ 5 µm• polidispertsity ~33%• close to rcp
Supercooled liquid (Lennard-Jones)
Lacevic et al., Phys. Rev. E 2002
Colloids close to rcp
Ballesta et al., Nature Physics 2008
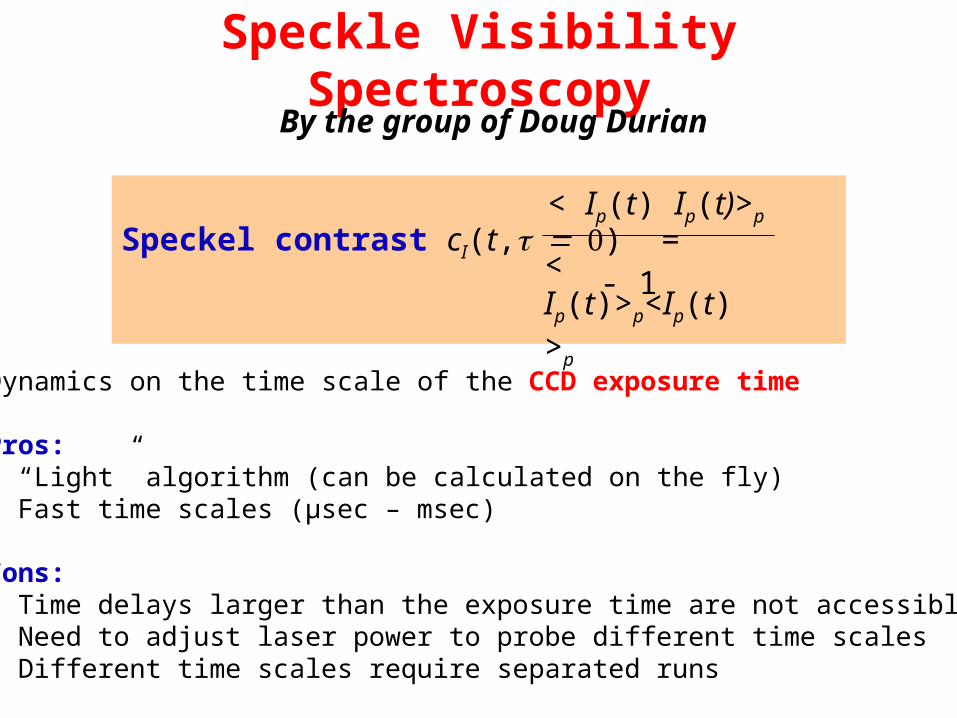
Speckle Visibility SpectroscopyBy the group of Doug Durian
Speckel contrast cI(t,) = - 1
< Ip(t) Ip(t)>p
< Ip(t)>p<Ip(t)>p
Dynamics on the time scale of the CCD exposure time
Pros:• “Light” algorithm (can be calculated on the fly)• Fast time scales (µsec – msec)
Cons:• Time delays larger than the exposure time are not accessible• Need to adjust laser power to probe different time scales• Different time scales require separated runs
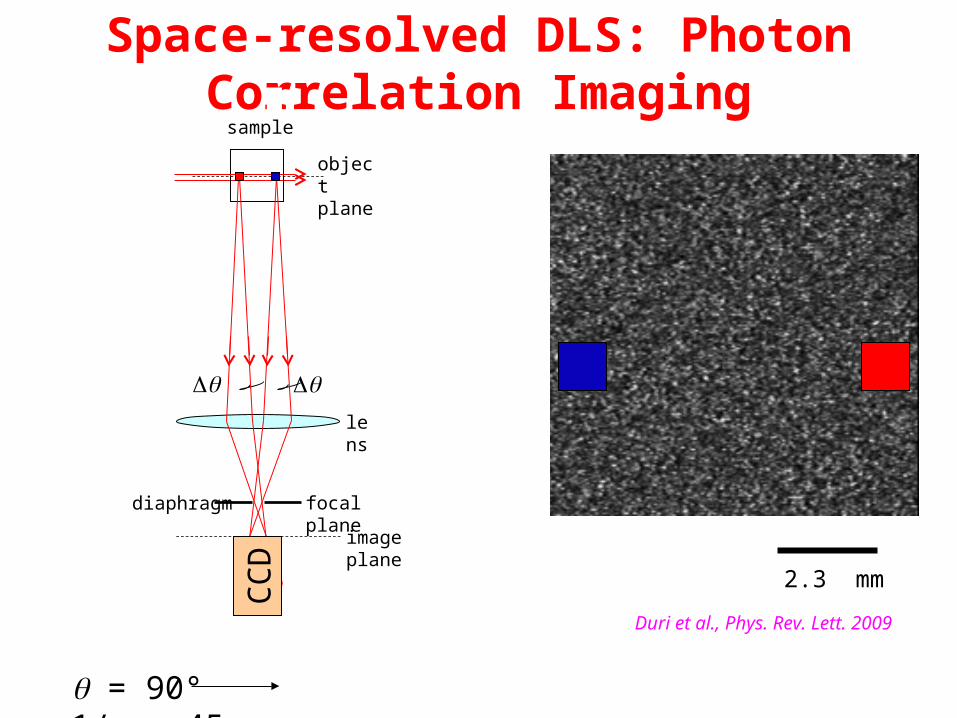
2.3 mm
Space-resolved DLS: Photon Correlation Imaging
diaphragm
lens
object plane
image plane
focal plane
CC
D
sample
= 90° 1/q ~ 45 nm
Duri et al., Phys. Rev. Lett. 2009
2.3 mm
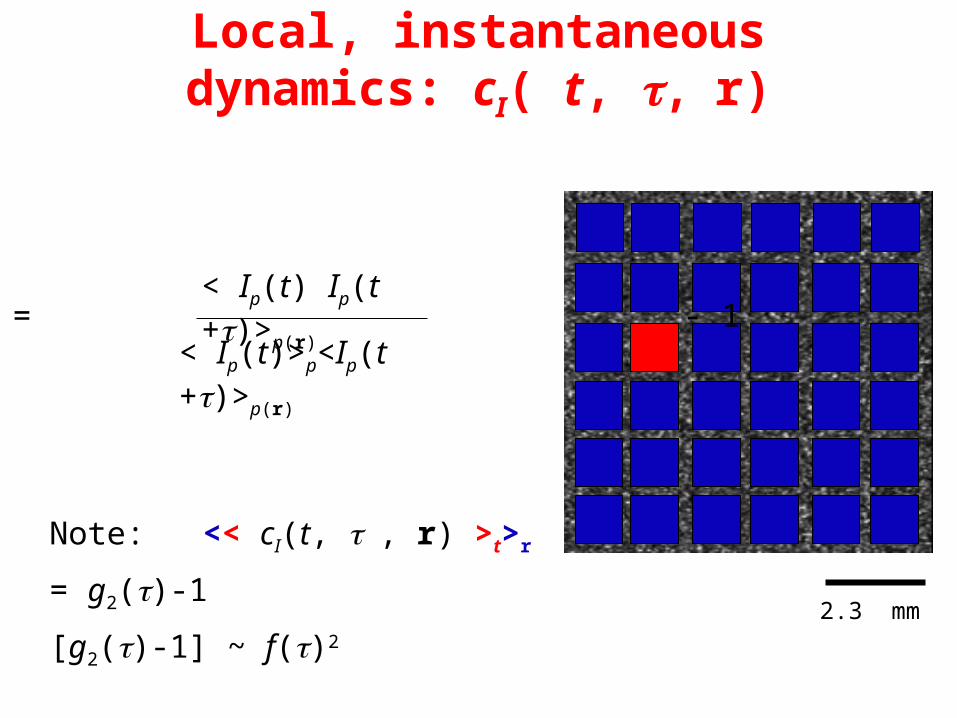
Local, instantaneous dynamics: cI( t, ,r)
< Ip(t) Ip(t +)>p(r)
< Ip(t)>p<Ip(t +)>p(r)
cI(t, , r) = - 1
Note: << cI(t, , r) >t>r = g2()-1
[g2()-1] ~ f()2
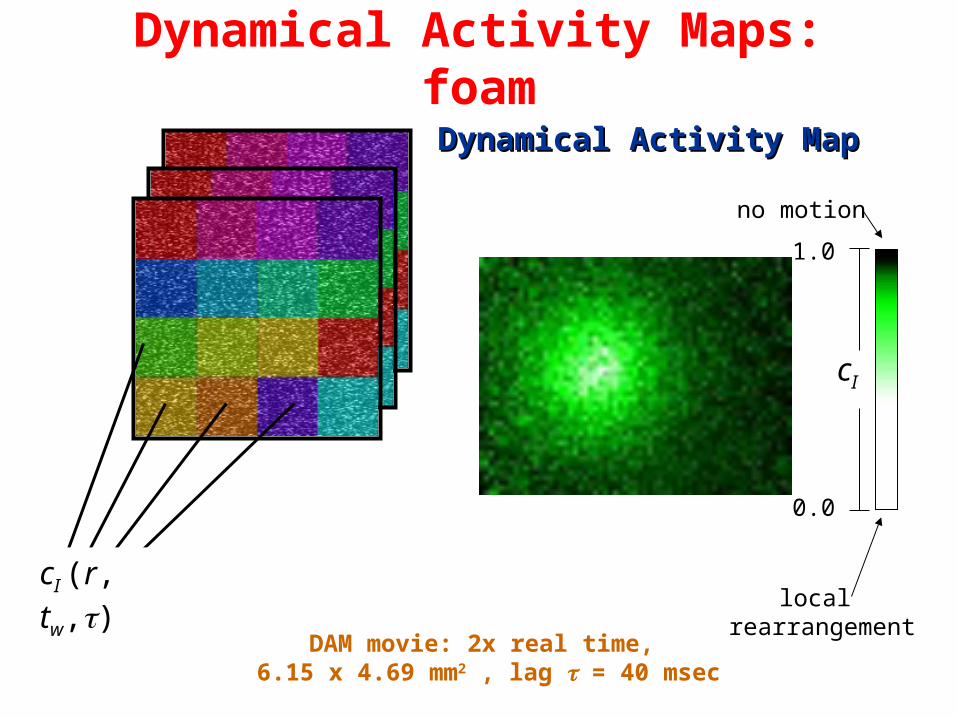
DAM movie: 2x real time, 6.15 x 4.69 mm2 , lag = 40 msec
Dynamical Activity Maps: foam
cI
0.0
1.0
Dynamical Activity MapDynamical Activity Map
cI (r, tw,)local
rearrangement
no motion
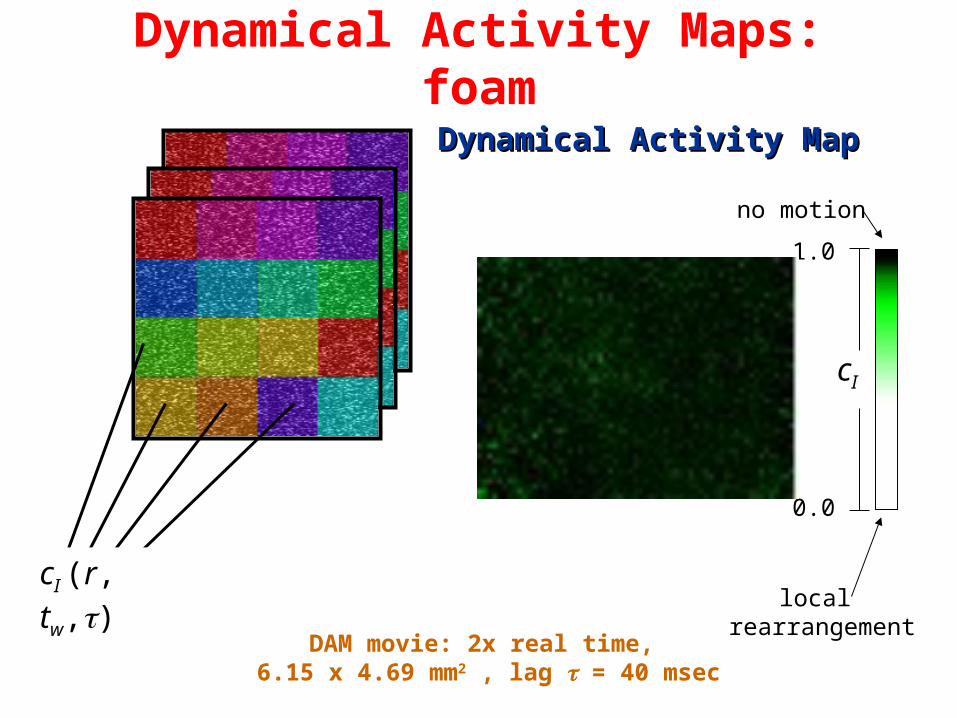
DAM movie: 2x real time, 6.15 x 4.69 mm2 , lag = 40 msec
cI
0.0
1.0
Dynamical Activity MapDynamical Activity Map
cI (r, tw,)local
rearrangement
no motion
Dynamical Activity Maps: foam
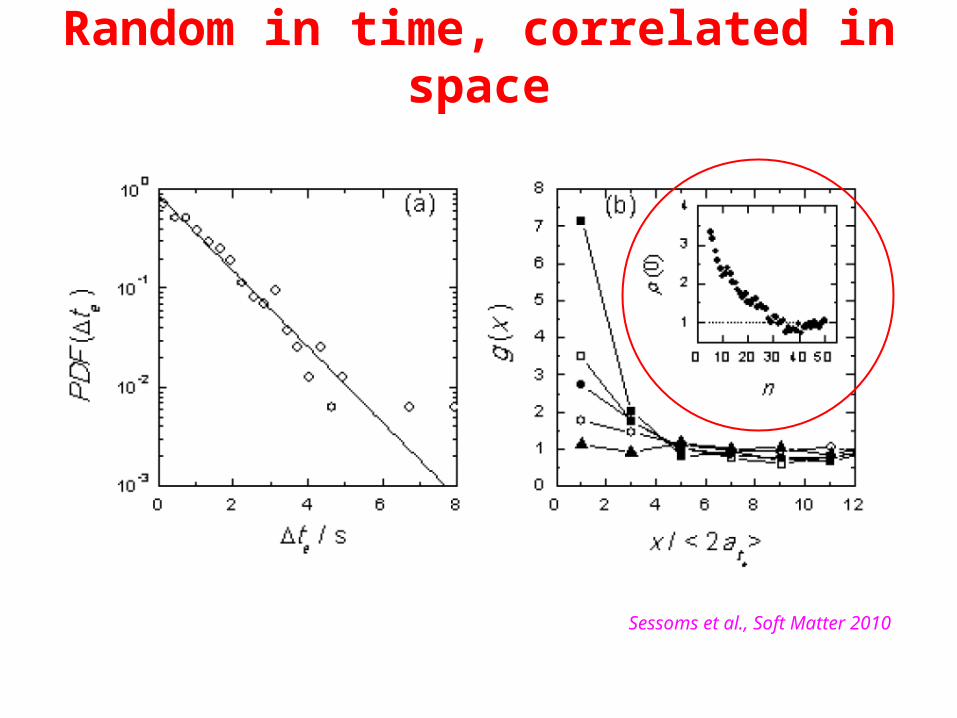
Random in time, correlated in space
Sessoms et al., Soft Matter 2010
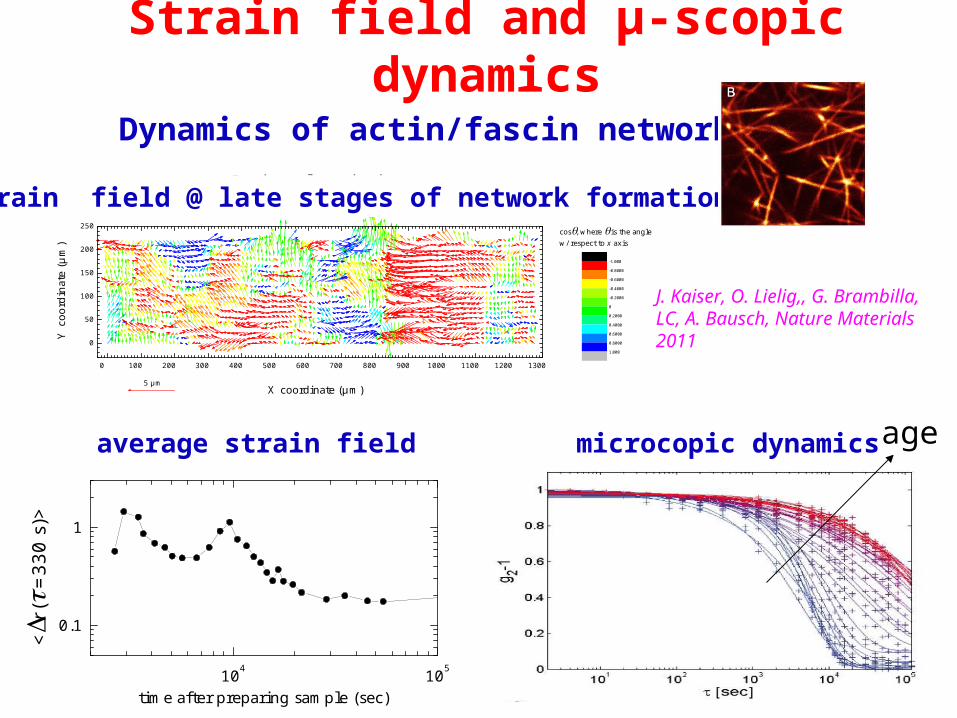
Strain field and µ-scopic dynamics
J. Kaiser, O. Lielig,, G. Brambilla, LC, A. Bausch, Nature Materials 2011
Dynamics of actin/fascin networks
0 100 200 300 400 500 600 700 800 900 1000 1100 1200 1300
0
50
100
150
200
250
Average displacement : 0.75 µmStandard deviation: 0.48 µm
cos, where is the angle w/ respect to x axis
ActinFascinJonaR0.1_night.avi: data taken fromF:\4CAMS\Jona\090220_sample4\CCD3\NightDisplacement map calculated for images 3935 and 4100 (MI00001.dat), corresponding to 10510 sec after preparing the sample.boxsize 40 pixels, average over 4 frames, time lag is 330 sec. 1 pixel = 2.2 µm
Y c
oord
inat
e (µ
m)
X coordinate (µm)5 µm
-1.000
-0.8000
-0.6000
-0.4000
-0.2000
0
0.2000
0.4000
0.6000
0.8000
1.000
During polymerization(displacement map over 330 sec)strain field @ late stages of network formation
104 105
0.1
1
<r
( =
330
s)>
time after preparing sample (sec)
ageaverage strain field microcopic dynamics
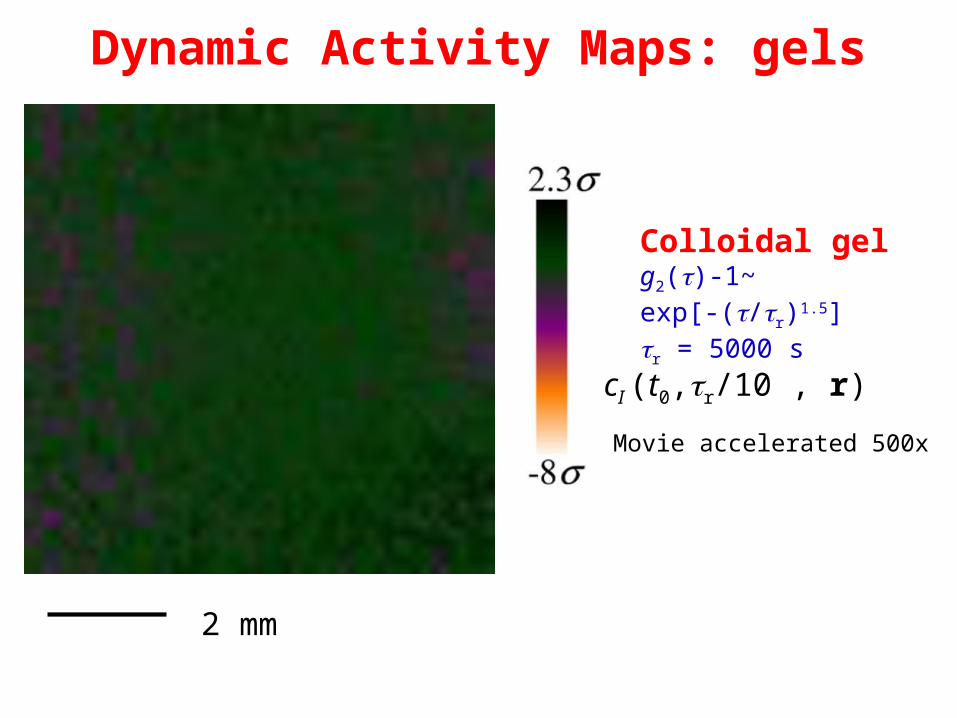
Dynamic Activity Maps: gels
Colloidal gelg2()-1~ exp[-(/r)1.5]r = 5000 s
cI (t0,r/10 , r)
Movie accelerated 500x
2 mm
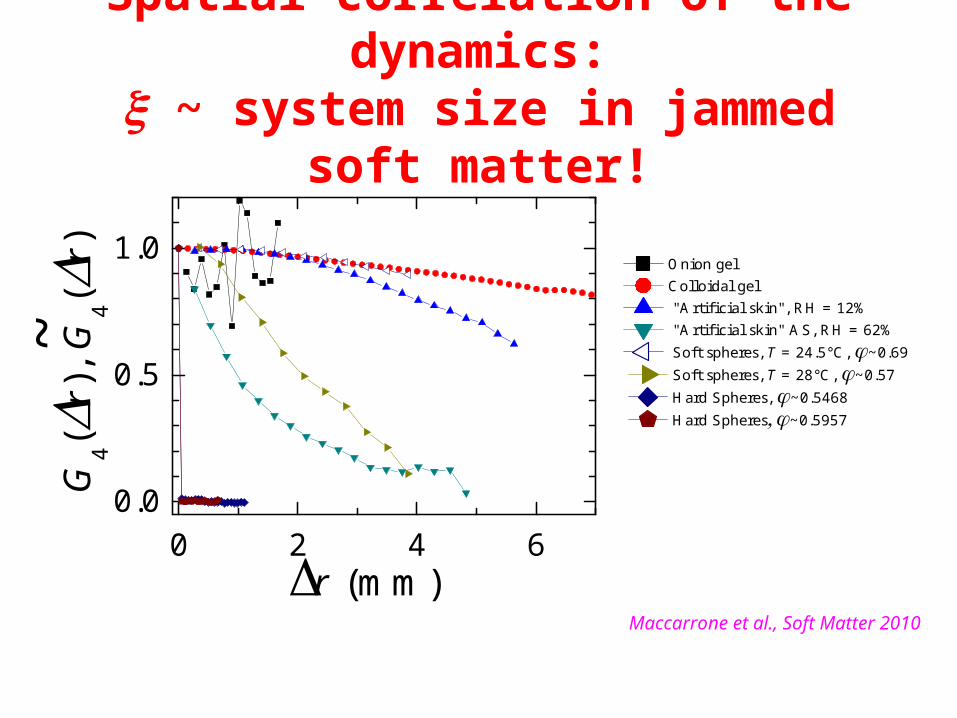
0 2 4 60.0
0.5
1.0 Onion gel Colloidal gel "Artificial skin", RH = 12% "Artificial skin" AS, RH = 62% Soft spheres, T = 24.5°C, ~0.69
Soft spheres, T = 28°C, ~0.57 Hard Spheres, ~0.5468 Hard Spheres ~0.5957
r (mm)
G4(
r), G
4(r)
~Spatial correlation of the dynamics: ~ system size in jammed soft matter!
Maccarrone et al., Soft Matter 2010
Space experiments
ESA Proposal (2004): Solidification of Colloids in space: structure and dynamics of crystal, gel, and glassy phases
Piazza (Milano), Van Blaaderen, Kegel (Utrecht), Cipelletti (Montpellier)
Motivation for µ-g: - Solid like structures -> gravitational stress transmitted over large distances.- Mixture of particles with different .- Slow dynamics -> long experiments, ISS
Space experiments
Original plan : investigate slow dynamics and DH in glassy colloidal systems (repulsive, attractive)
Difficulty: only a limited set of samples will (hopefully) be flown
Proposal: depletion force: a system with tunable (thermosensitive) attractive interactions

DEPLETION EFFECTS IN COLLOIDSADDING TO A SUSPENSION OF LARGE SPHERES
SMALLER SPHERES (POLYMERS, SURFACTANT MICELLES)…
SMALL SPHERES CANNOT ENTER HERE!
Osmotic pressure unbalance yields an ATTRACTIVE
force between colloids
U = Vexc
IF the depletant can be regarded as an IDEAL GAS
AO POTENTIAL
FORCE VIEW
Large particles subtract free volume to the small ones (which DOMINATE ENTROPY)
Small spheres gain entropy by PHASE SEGREGATION
of the large colloids
ENTROPY VIEW
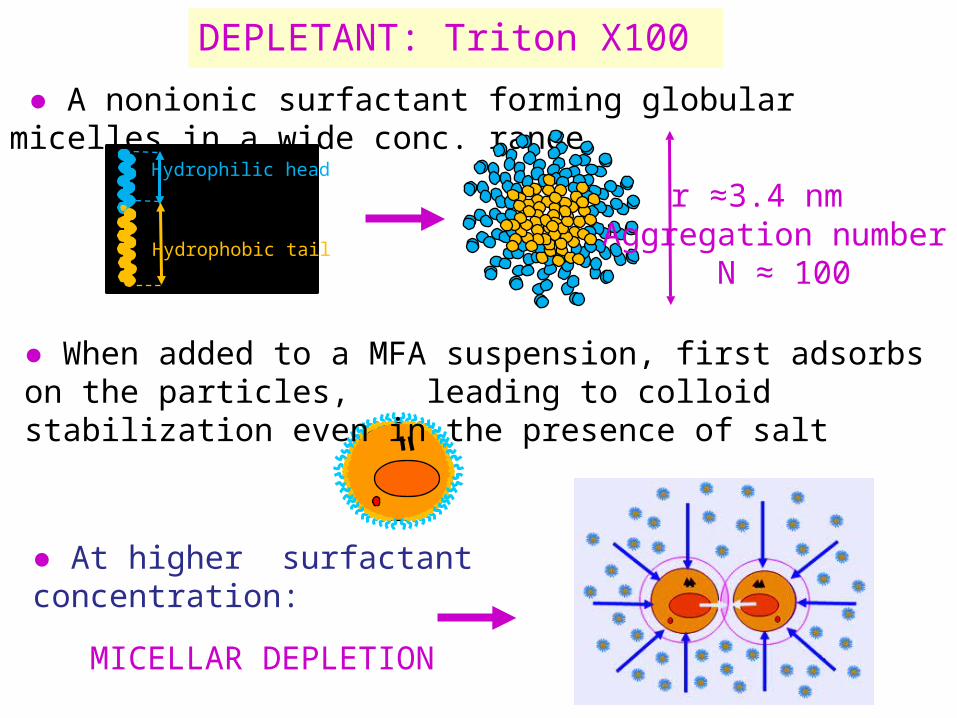
DEPLETANT: Triton X100
● When added to a MFA suspension, first adsorbs on the particles, leading to colloid stabilization even in the presence of salt
● A nonionic surfactant forming globular micelles in a wide conc. range
Hydrophilic head
Hydrophobic tail
r ≈3.4 nmAggregation number
N ≈ 100
● At higher surfactant concentration:
MICELLAR DEPLETION

0
0.05
0.10
0.15
0 0.2 0.4 0.6 0.8P
s
FLUID
SOLID
GEL
TO THE ROOTS OF GELATION
GELATION ASARRESTED SPINODAL
DECOMPOSITION
Miller & Frenkel coex. line for AHS

BIRTH OF A GELQuenching into the L-L gap:
FAST SEDIMENTATION (hours vs. months!)
A MUCH MORE EXPANDED PHASE
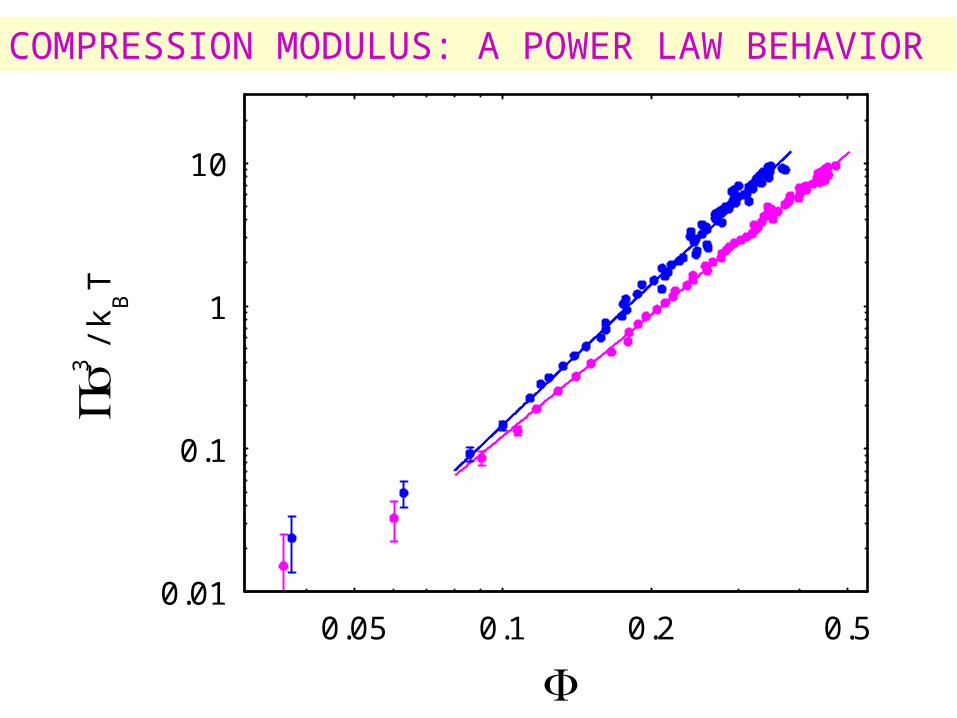
0.01
0.1
1
10
0.05 0.1 0.2 0.5
3 /
k BT
COMPRESSION MODULUS: A POWER LAW BEHAVIOR

A) COLLAPSE OF
DEPLETION GELSG. Brambilla, S. Buzzaccaro, R. P.,
L. Berthier, and L. Cipelletti
(to appear in PRL)
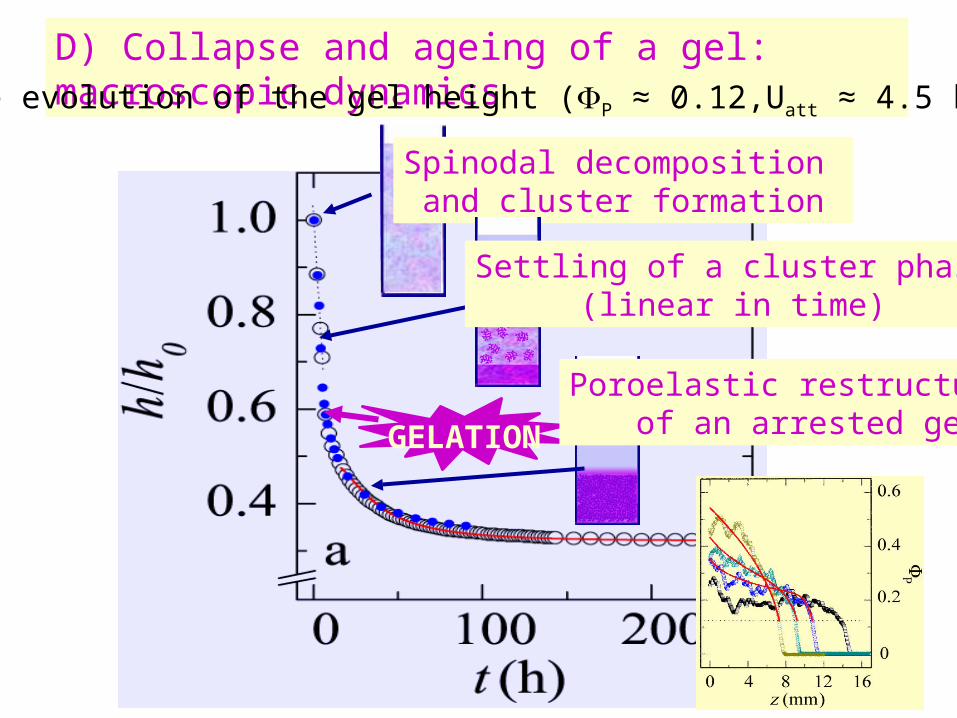
D) Collapse and ageing of a gel: macroscopic dynamics Time evolution of the gel height (P ≈ 0.12,Uatt ≈ 4.5 kBT )
Spinodal decomposition and cluster formation
Settling of a cluster phase(linear in time)
GELATION
Poroelastic restructuringof an arrested gel

THE POROELASTIC REGIME
PICTURE: A FLUID (COUNTER)FLOWING THROUGH AN ELASTIC POROUS MEDIUM
zK
gzt
)()(
● FORCE BALANCE:
PERMEABILITYGRAVITATIONAL
STRESSELASTIC
RESPONSE
● INPUT FOR NUMERICAL SIMULATIONS:EFFECTIVE COMPRESSIONAL MODULUS
IN RESPONSE TO AN APPLIED STRESS FROM STEADY-STATE PROFILE
)(K
a
i)
m)1()( 0 WITH 0 AND m CHOSEN TO FIT THE
TIME-DEPENDENCE OF THE GEL HEIGHTii)

VELOCIMETRY
● THE VELOCITY PROFILE IS ALMOST LINEAR FOR ANY SETTLING TIME, EXCEPT IN THE UPPERMOST LAYER OF THE GEL.
LOCAL SETTLING VELOCITY v(t) (AT VARIOUS SETTLING TIMES)
t =30 h
t =80 h
● A z-INDEPENDENT (BUT t-DEPENDENT)
STRAIN RATE: dzdvt /)(
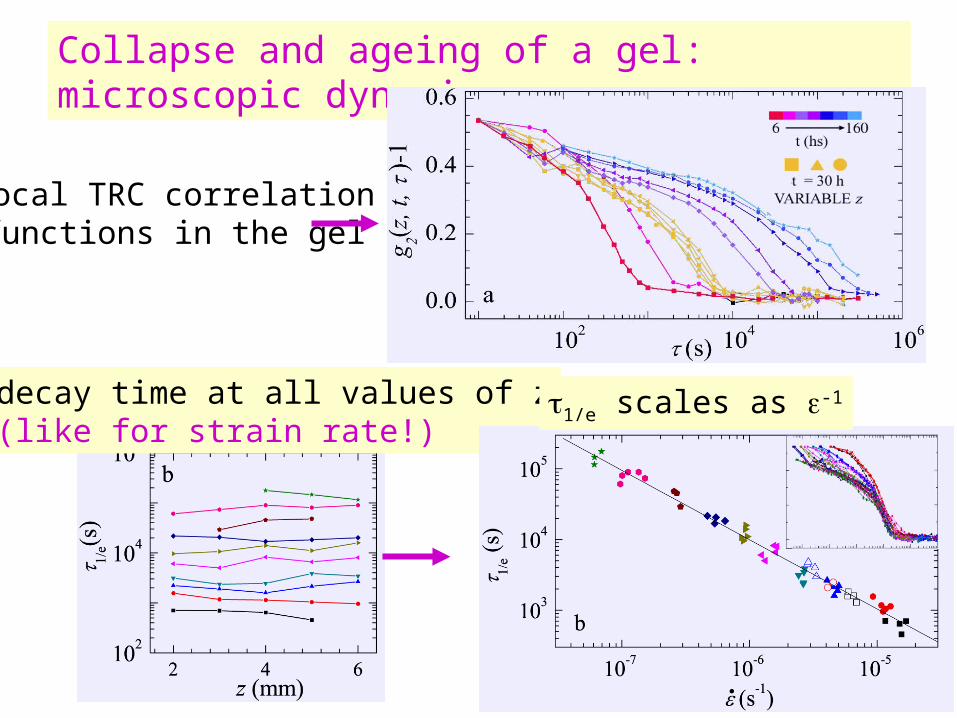
Collapse and ageing of a gel: microscopic dynamics
Local TRC correlationfunctions in the gel
SAME decay time at all values of z(like for strain rate!)
1/e scales as -1

B) CRITICAL DEPLETANTS(depletion vs. critical Casimir effect)
S. Buzzaccaro, J. Colombo, A. Parola, and R. P.Phys. Rev. Lett. 105, 198301 (2010)
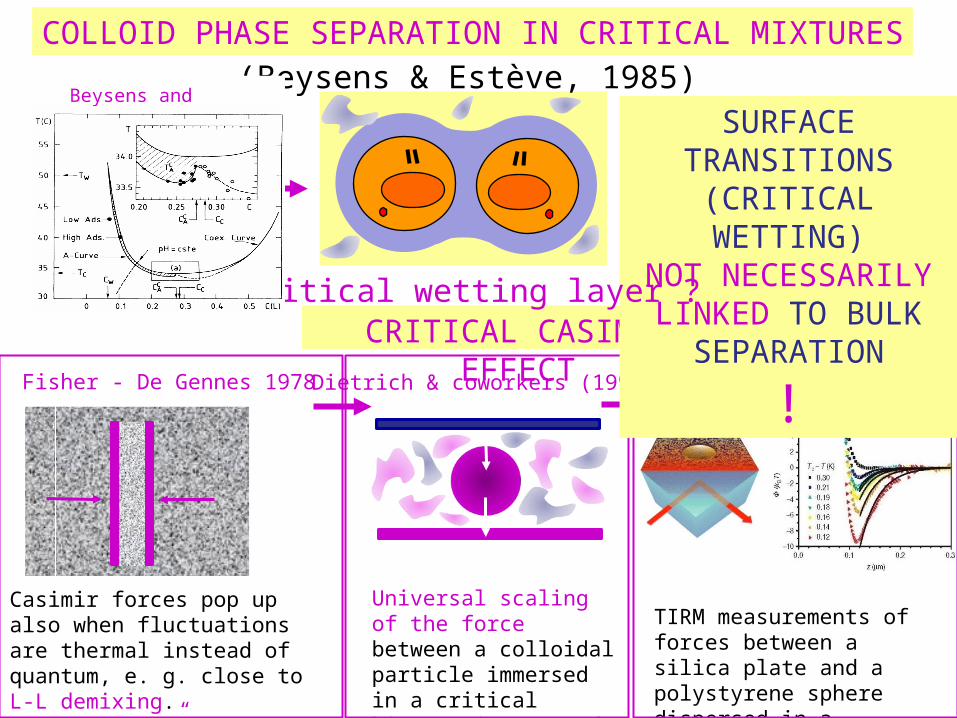
COLLOID PHASE SEPARATION IN CRITICAL MIXTURES
CRITICAL CASIMIR EFFECT
Casimir forces pop up also when fluctuations are thermal instead of quantum, e. g. close to L-L demixing.
A “depletion” of critical fluctuations!
Fisher - De Gennes 1978 Dietrich & coworkers (1998)
Universal scaling of the force between a colloidal particle immersed in a critical binary mixture and the container walls
C. Bechinger & coworkers (2008):
TIRM measurements of forces between a silica plate and a polystyrene sphere dispersed in a critical liquid mixture.
SURFACE TRANSITIONS
(CRITICAL WETTING)
NOT NECESSARILY LINKED TO BULK
SEPARATION
!
Critical wetting layer ?
(Beysens & Estève, 1985) Beysens and Esteve, 1985
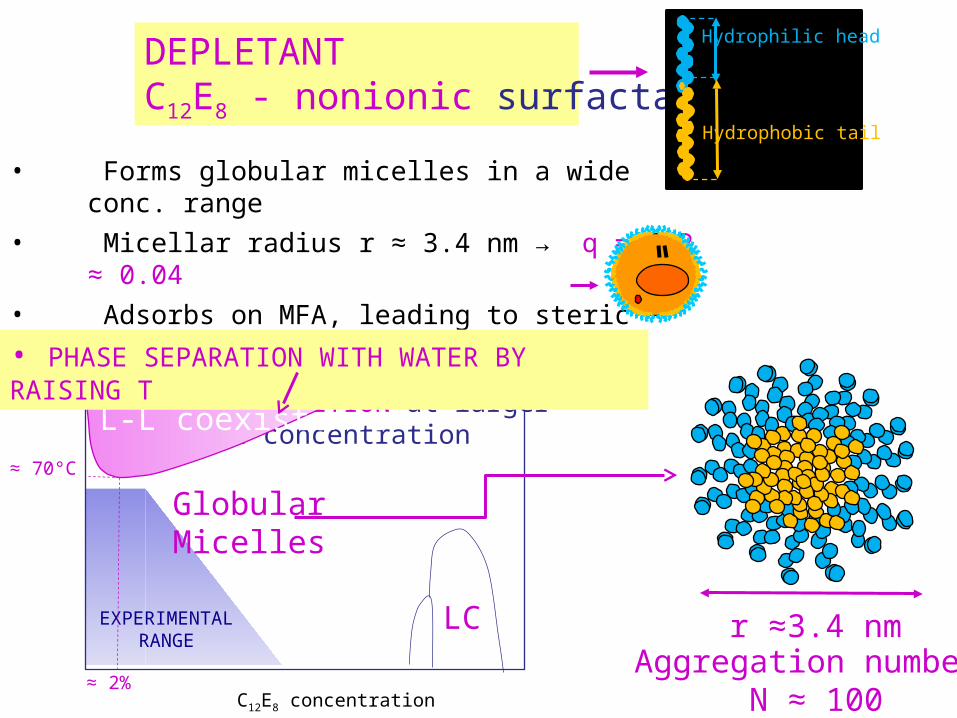
EXPERIMENTALRANGE
• Forms globular micelles in a wide conc. range
• Micellar radius r ≈ 3.4 nm → q = r/R ≈ 0.04
• Adsorbs on MFA, leading to steric stabilization
• MICELLAR DEPLETION at larger surfactant concentration
DEPLETANTC12E8 - nonionic surfactant
Hydrophilic head
Hydrophobic tail
C12E8 concentration
T
≈ 70°C
≈ 2%
L-L coexistence
LC r ≈3.4 nmAggregation number
N ≈ 100
GlobularMicelles
• PHASE SEPARATION WITH WATER BY RAISING T
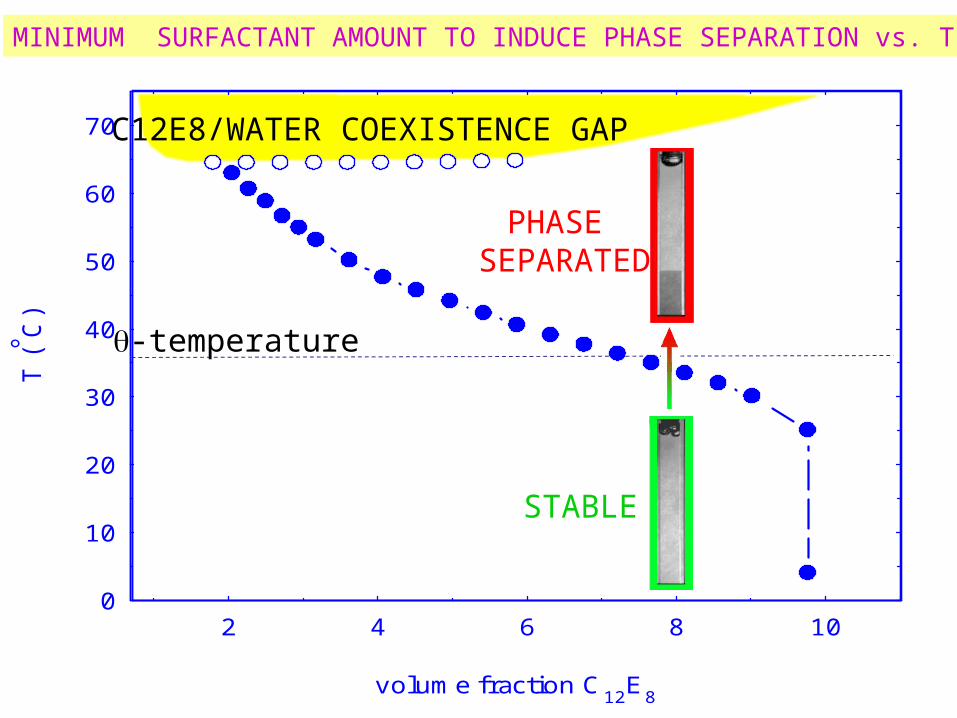
0
10
20
30
40
50
60
70
2 4 6 8 10
volume fraction C12E8
T (C
)MINIMUM SURFACTANT AMOUNT TO INDUCE PHASE SEPARATION vs. T
C12E8/WATER COEXISTENCE GAP
-temperature
STABLE
PHASE SEPARATED
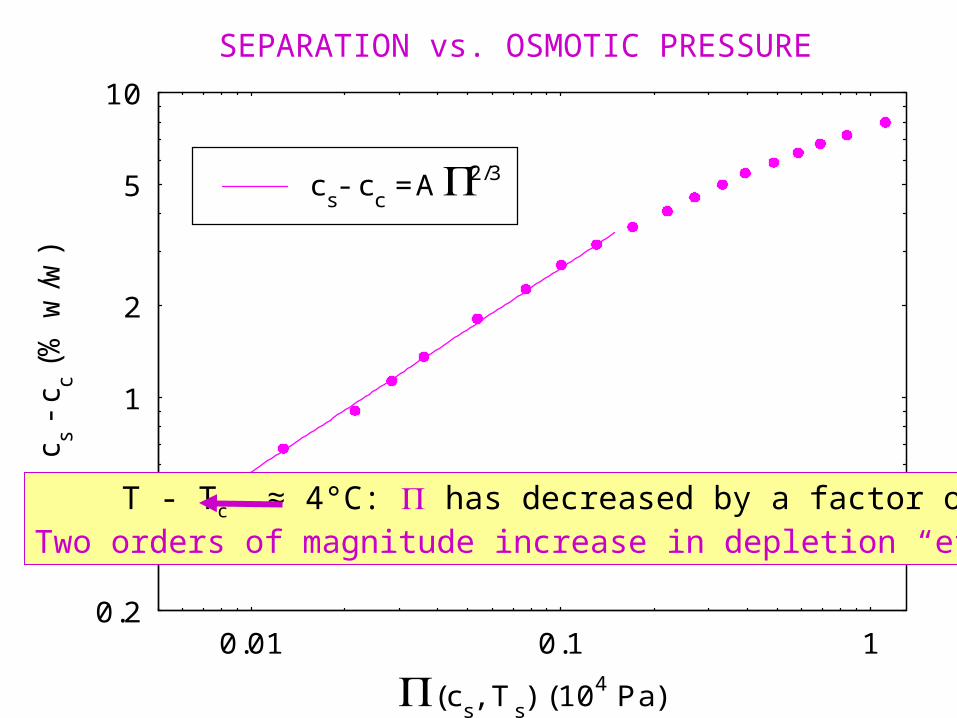
0.2
0.5
1
2
5
10
0.01 0.1 1
cs- cc =A2/3
(cs, Ts) (104 Pa)
c s - c
c (%
w/w
)SEPARATION vs. OSMOTIC PRESSURE
T - Tc ≈ 4°C: has decreased by a factor of 200.Two orders of magnitude increase in depletion “efficiency”!

0.1
1
10
1 2 5 10
csep - ccrit = a ; 1.8
(csep, Tsep) [nm]
c sep-
cc
(%)
SEPARATION POINTS vs.
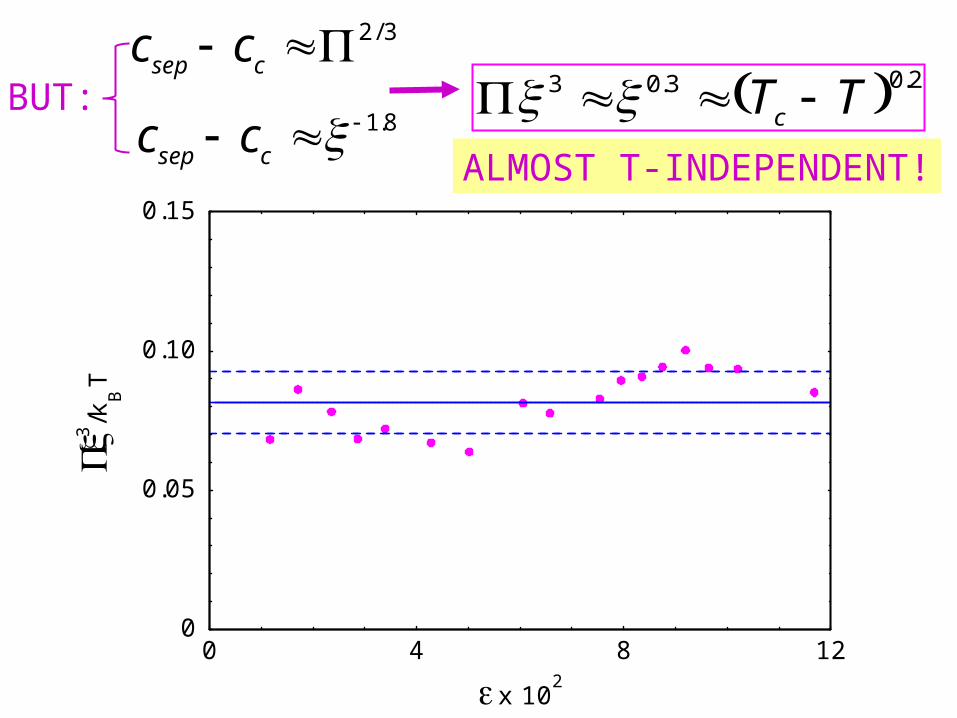
2.03.03 TTc 3/2 csep cc
8.1 csep ccBUT:
ALMOST T-INDEPENDENT!
0
0.05
0.10
0.15
0 4 8 12
x 102
3 /k
BT
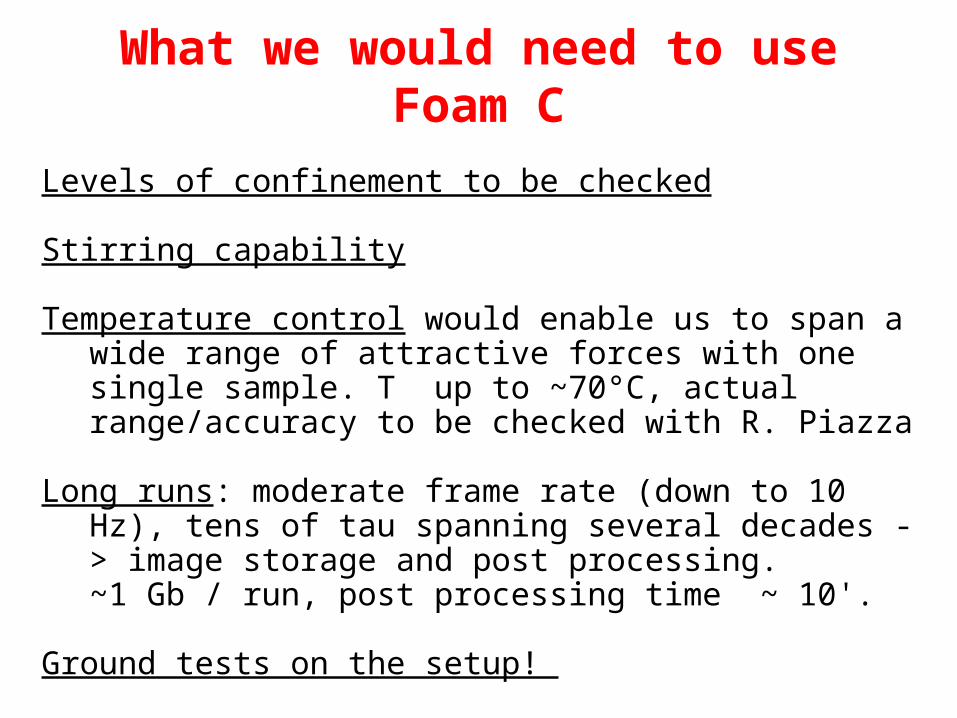
What we would need to use Foam C
Levels of confinement to be checked
Stirring capability
Temperature control would enable us to span a wide range of attractive forces with one single sample. T up to ~70°C, actual range/accuracy to be checked with R. Piazza
Long runs: moderate frame rate (down to 10 Hz), tens of tau spanning several decades -> image storage and post processing.~1 Gb / run, post processing time ~ 10'.
Ground tests on the setup!

Thanks!
Collaborators: V. Trappe (Fribourg)Students: P. Ballesta, G. Brambilla, A. Duri, D. El MasriPostdocs: S. Maccarrone, M. PiernoFunding: CNES, ESA, Région Languedoc Roussillon, ANR, MIUR.