Embed Size (px)
Citation preview

WP 2015: 16
Colonial legacy, state-building and the salience ofethnicity in Sub-Saharan Africa
Merima Ali, Odd-Helge Fjeldstad, Boqian Jiang, Abdulaziz B. Shifaz
Chr. Michelsen Institute (CMI) is an independent, non-profit research institution and a major international centre in policy-oriented and applied development research. Focus is on development and human rights issues and on international conditions that affect such issues. The geographical focus is Sub-Saharan Africa, Southern and Central Asia, the Middle East and Latin America.
CMI combines applied and theoretical research. CMI research intends to assist policy formulation, improve the basis for decision-making and promote public debate on international development issues.
Colonial legacy, state-building and the salience ofethnicity in Sub-Saharan Africa∗
Merima Ali†, Odd-Helge Fjeldstad‡, Boqian Jiang§, Abdulaziz B. Shifa‡
December 2015
Abstract
Ethnicity has received increased attention in studies of Africa’s economicand institutional development. We present evidence on the long-term effects ofBritain’s “divide-and-rule” colonial strategy that deliberately fostered ethnicrivalries to weaken and control locals. Using micro data from Sub-SaharanAfrica, we find that citizens of Anglophone (as compared to Francophone)countries are more likely to: (1) attach greater importance to ethnic identity(vis-a-vis national identity); (2) have weaker norms against tax evasion; and(3) face extortion by non-state actors. We address endogeneity concerns usingIV regression and regression-discontinuity. These results suggest that Britain’sdivide-and-rule strategy may have undermined state-building.
JEL Classification: N47, N97, O17, O55, H10Keywords: Colonial legacy; development; ethnicity; state capacity; Sub-SaharanAfrica.
∗This article was prepared with financial support from the International Center for Tax andDevelopment (www.ICTD.ac). Useful comments on earlier drafts were received from Ragnar Torvikand participants at the 2014 ICTD Annual Conference in Arusha.
†Chr. Michelsen Institute and Syracuse University.‡Chr. Michelsen Institute, International Centre for Tax and Development, and African Tax
Institute.§Syracuse University.
1

1 Introduction
The role of ethnic rivalries in the institutional and economic development of stateshas received significant attention. Higher ethnic fractionalization is found to becorrelated with slower economic growth, higher incidence of civil conflicts, weakerstate capacity and under-provision of public good (see, e.g., Mauro, 1995; Easterlyand Levine, 1997; Alesina et al., 2003; Miguel and Gugerty, 2005). The implication ofthese empirical patterns appears to be most severe in Africa due to the higher levelof ethnic fractionalization among African countries. Despite a lot of emphasis onthe detrimental impact of ethnic rivalry on the construction of national identity andstate-building (Acemoglu et al., 2014a), the legacies of colonialization in fomentingthese rivalries and undermining state-building remains poorly understood. In thisstudy, using nationally representative micro data from Sub-Saharan Africa (SSA), weexamine whether differences in occupation strategies during the colonial era adoptedby the two dominant powers, France and Britain, led to different outcomes withregard to the construction of national identity and state capacity in present-dayAfrica.
Our study is motivated by the differences in colonial strategies used by the twomajor colonial powers in Africa to control local populations. As outlined by FrederickLugard, the most prominent British colonial practitioner in Africa, Britain adoptedthe strategy of divide-and-rule where ethnic cleavages were fostered and exploited toweaken and control the local populations (Khapoya, 2010). Existing ethnic divisionswere institutionalized into the colonial power structure by subduing local chiefs. Inmany instances where there were no clear ethnic divisions, the colonial masters wentas far as inventing new “ethnic” groups and installing chiefs to govern the locals(Khapoya, 2010). In contrast, systematic exploitation of ethnic rivalries played aless prominent role in France’s control strategy (Miles, 1994). We will return to amore detailed discussion of the historical background in Section 2 below.
In this paper, we present empirical evidences on the impact of this distinctionin colonial strategy on state-building in post-colonial Africa. Our data are drawnfrom round 5 of the Afrobarometer surveys, which are nationally representative valuesurveys. Our sample covers 21 countries, consisting of twelve Anglophone and nineFrancophone states. We compare Anglophone and Francophone countries with re-spect to three outcomes that are related to ethnic rivalry and state-building.
One may expect that rivalries among ethnic groups fostered by the divide-and-rule colonial strategies would undermine the construction of shared national identity.Thus, the first outcome variable captures the salience of ethnic identity as compared
2

to national identity. The other two outcome variables capture two key aspects ofstate capacity – the “fiscal” and “public good” aspects.On the fiscal side, we look atcitizens’ attitude toward tax obligations. One way in which inter-ethnic rivalry andweak sense of nationhood hinder state-building could be by lowering the willingnessto contribute to the provision of public goods (Miguel and Gugerty, 2005). Anotherimportant aspect of state capacity is the ability of the state to provide public good.The Afrobarometer data have useful information on one of the most important publicgoods that a state is supposed to provide - the protection of citizens against extortionby non-state actors (e.g., organized gangs). The widespread prevalence of extortionby non-state actors could be considered as an indicator of the state’s inability to“monopolize violence”.
Results from the OLS regressions are consistent with the view that state-buildingin Anglophone countries is challenged by the legacy of British rule. On average,citizens in Anglophone countries tend to have a weaker sense of nationhood, are lesslikely to view tax compliance as an important obligation and are more likely to faceextortion by non-state actors.
Even though the patterns revealed by the OLS results are themselves interesting,causal interpretation requires a more robust analysis. To mitigate endogeneity con-cerns, we deploy two identification strategies. First, we construct an instrumentalvariable to instrument the likelihood that an African territory becomes a British orFrench colony. Construction of the instrument is guided by historical patterns inthe expansion of colonial territories. During the “scramble for Africa” (from the late19th to early 20th century), European colonizers moved from a few coastal areasof Africa and expanded their control inland. Their strategy was to gradually ex-pand their control by incorporating lands adjacent to their existing colonies. Dueto transportation constraints, the control of adjacent lands required less logistics.Thus, a key determining factor for whether a territory would be colonized by Franceor Britain was its distance from an existing French or British colony. We constructan instrument based on this idea, and find that it has a strong predictive power forthe probability of a territory becoming a French or British colony. We also showthat the instrument is uncorrelated with observable factors (e.g., pre-colonial levelof state centralization) that may affect the outcome variables.
In the second identification strategy, we exploit the fact that the Afrobarometerdata have a wide geographic coverage in each country. We use regression discontinuity(RD) focusing on a subset of observations that reside in areas around the bordersbetween Anglophone and Francophone countries. In our benchmark regression, weconsider observations that reside within 100 km from the borders. Given the arbitrary
3

nature of colonial borders, results from this RD analysis are expected to capture a“border effect”. The findings from both the instrumental variable regression and RDanalysis confirm the OLS results.
Our paper intersects several previous studies on ethnicity, state capacity andcolonial legacy. There has been increasing interest in the role of ethnicity. The firstset of studies, some of which are cited above, examine the effect of ethnic structure oneconomic and institutional outcomes. More recently, Hjort (2014) has show that thenegative effect of ethnic diversity can also hinder productivity within private firms.Furthermore, this negative effect worsens during periods of inter-ethnic tensions.Hjort’s findings speak to a seminal study by Leeson (2005), who argues that ethnicdiversity in itself does not lead to detrimental outcomes. Leeson discusses severalhistorical examples where pre-colonial Africans managed to establish inter-ethniccooperation through a wave of “traditional” institutions, which were latter disruptedby colonial rules.
Our paper is also related to studies on the legacy of conquests and colonialism.These studies find that the legacies could be multi-faceted, both in terms of outcomesand mechanisms. Acemoglu et al. (2001; 2002) show that the legacy of institutionalchanges left behind by colonial powers has affected current institutional and economicoutcomes. The effect depends largely on the strategies adopted by colonizers tomaximize their benefit. In a more recent study, Acemoglu et al. (2014b) show thelegacies of indirect rule practiced by Britain in Sierra Leone. Feyrer and Sacerdote(2009) find that longer colonial occupation is associated with higher current percapita GDP, and the extent of this effect varies by colonizer (e.g., larger for Dutchand British colonies than Portuguese). La Porta et al. (2008) emphasize the legalsystem that the colonizers put in place (i.e., civil versus common laws) and its impacton later institutional outcomes. Dell (2010) focuses on the long-term effect of forcedlabor. Iyer (2010) studies the legacy of direct versus indirect rule in India, and findsthat the indirect rule is associated with higher provision. Using data from Cameroon,Lee and Schultz (2012) also find similar results. Examples of other papers studyingthe long-tem effects of colonialism include Banerjee and Iyer (2005), Michalopoulosand Papaioannou (2013a; 2013b) and Huillery (2009). Both the focus and the findingsof existing studies vary, demonstrating the complexity of colonial legacy. Our paperprovides one further channel - the salience of ethnic tensions- through which coloniallegacy may affect current institutional and economic outcomes.
The remainder of the paper is organized as follows. The next section will pro-vide brief historical background about the different colonial rulings and their conse-quences. This is followed by discussion of the data and results in Sections 3 and 4.
4

The paper ends with some concluding remarks in Section 5.
2 Historical Background
Britain’s divide-and-rule colonial strategy to control local populations in Africa, firstformulated by the renowned British colonial master Lord Frederick, is characterizedby two key components.
The first component involves identifying locally powerful men from the pre-colonial power structure, such as tribal chiefs, and making them part of the colonialadministration (Crowder, 1964). In areas where identifiable tribes or tribal chiefsdid not exist, the British colonizers went as far as creating them (Khapoya, 2010).The main task of the chiefs was to control the local population and extract taxes onbehalf of their colonial masters (Mamdani, 1996). In return, the chiefs would pocketa share of the tax revenues. The chiefs would also receive British support to suppressresistance from the locals, empowering themselves over the local population (Migdal,1988; Mann and Roberts, 1991; Mamdani, 1996).
Several examples from the colonial periods illustrate the British strategy. Lugardhimself implemented divide-and-rule first in Nigeria by using local chiefs from theIslamic emirates in Northern Nigeria (Mamdani, 1996). Existing indigenous chiefswere also used in colonial administration in Buganda Kingdom (Lwanga-Lunyiigo,1987). There are also a number of cases where British colonizers created “chiefs” and“tribes”. In Tanganyika, entirely new “chiefs” and “tribes” were created by Britishcolonizers following the takeover from Germany (Khapoya, 2010). The “warrantchiefs” among the Igbos in South-Eastern Nigeria are also another examples of thosewho were appointed as local representatives of the British colonial administration(Afigbo, 1972). Before British colonial rule, the Igbos were not politically organizedas a single ethnic group; rather, they belonged to several groups that were politicallyfragmented.
A second key component of the divide-and-rule strategy was fostering and exploit-ing rivalries among ethnic groups to weaken and control the local populations. Thisstrategy primarily aimed at undermining cooperation among various ethnic groupsthat could have led to a more unified and stronger resistance against the colonialpower. Instances where colonial soldiers from selected ethnic groups were utilized toput down resistance from other ethnic groups have been widely documented acrossBritish colonies. For example, the British used the Nubians to control Akoholi fromthe early 1870s in what is now Uganda (Lwanga-Lunyiigo, 1987). The Nubians, who
5

comprised the core of the colonial army in Uganda, also helped defeat kingdoms ofother ethnic groups such as the Bunyoro and Buganda kingdoms in the 1890s, andhelped put down violence throughout Uganda (ibid). After colonizing Buganda, theBritish also used Bugandan chiefs to help govern and administer other territories thathad less centralized systems of political organization and thus were harder for theBritish to deal with directly. Britain’s colonial strategy also promoted segregationof the local population along tribal lines that undermined inter-ethnic cooperationand integration (Blanton et al., 2001).
Several historians agree that exploitation and fostering of ethnic rivalries were notthe major features of France’s colonial strategy (see, e.g., Crowder, 1964; Mamdani,1996; Miles, 1994). First, local administrative boundaries (called ‘cantons’) did notnecessarily represent specific ethnic groups, and often cut across preexisting politicalboundaries (Crowder, 1964). Thus, the local administrative boundaries in Frenchcolonies did not hinder various ethnic groups from belonging to the same politicalunit (ibid). This stands in marked contrast with the way in which Britain divided andsegregated its colonies along ethnic lines. Second, France deliberately suppressed thelocal chiefs and significantly undermined their power (Whittlesey, 1937). The chiefsin British colonies, as compared to their counterparts in French colonies, tended tohave more power in local governments.
Why the French did not follow Britain’s style of control is a matter of speculation.According to the renowned political geographer Whittlesey (1937), the deliberateweakening of traditional chiefs and the nominal power of the canton chiefs in Frenchcolonies were the result of France’s policy of centralized administration and assimila-tion of the Africans into French culture: “France is in Africa to make Frenchmen outof Africans.” Although a full-scale policy of assimilation was perhaps undesirableand impractical, the integration policy was noted in numerous incidences, such aseducation, language, and in few cases, rights of citizenship (Crowder, 1964). Educa-tion in the colonies was modeled on the French system, and the use of French wasencouraged throughout the colonies as the language of the government and commerce(Clapham, 1985). Educated natives were also allowed to assume administrative po-sitions. In a few instances, citizenship rights were granted to local educated elites,as in four cantons in Senegal (Crowder, 1964).
Miles (1994) provides an illustrative example of this distinction in British andFrench colonial rulings using a case study from Hausaland. During the pre-colonialera, the Hausa people lived under an amalgamation of loose political unions withoutany particular distinctions between the Nigerian and Nigerien sides of the border.As is the case with the arbitrary nature of many colonial borders with respect to pre-
6

colonial ethnic and political structures, the Hausa were divided between the Frenchand British colonies (present-day Niger and Nigeria, respectively) and the two regionsexperienced divergent colonial experiences. Miles (1994) notes,
Politically and administratively, the driving ethos behind French colonialpolicy in Africa was centralization: a single structure, a single hierarchy,a single set of rules. Structurally, this ethos was reflected in their pol-icy of federation: unlike the British, who treated their various coloniesthroughout West Africa as discrete administrative entities, the Frenchmerged theirs into a single Afrique Occidentale Francaise (p. 95 ).
The legacy of this distinction in colonial strategy and its impact on state-buildinghas been a subject of controversy among scholars. On the one hand, Herbst (2014)argues that colonizers lacked effective control in most part of their official territoryexcept in ports and capital cities. As a result, differences in style of colonial con-trol can only play a minor role, if any, in explaining the nature of modern AfricanStates. Herbst (2014) emphasizes that the role of colonization is limited mostly toborder demarcations (following the Berlin conference) that accelerated the forma-tion of states with clearly defined borders. The other line of literature suggests thatcolonization, and particularly the indirect rule of the British colonial administration,plays an important role in state-building in present-day Africa (see, e.g., Mamdani,1996, 2007; Blanton et al., 2001; Lange, 2004; Acemoglu et al., 2014a).
Broadly speaking, there are two possible reasons in the literature as to why thedivide-and-rule strategy may pose a lasting challenge to state-building in AnglophoneAfrica. First, an important part of state-building is the construction of national iden-tity that inculcates a sense of solidarity among fellow citizens, and historical rivalriesamong ethnic groups within a state could make it difficult to construct a strongsense of nationhood. Animosities against ethnic groups could be highly persistent(Voigtlander and Voth, 2012). Holmen (1990) notes that divide-and-rule strategiesmay have prevented the spread of national identity even after independence andinstead created “poor and unintegrated nations”. In Uganda, for example, Lwanga-Lunyiigo (1987) argues that the use of Buganda to conquer other territories “estab-lished a lasting hatred between the Baganda and a sizable chunk of the rest of Uganda– a weak premise on which to build a nation.” Badru (2010) attributes the massacreof Igbos in Nigeria’s civil war following independence to the animosity towards theIgbos that had resulted from the colonial strategy of using members of the Igbo tocontrol other populations. Mamdani (2007) argues that the deep ethnic divisions
7

created in Nigeria during colonization allowed for fragmentation of Nigeria’s politicsalong ethnic lines.
Second, the chiefs that were empowered in British colonies during the colonialera still tend to retain significant power in many Anglophone countries, which canundermine the process of building a strong central state should such a state be viewedas a threat to the chiefs’ power. If the emergence of a strong central state wouldpose a threat to locally powerful chiefs, the chiefs would have an incentive to usetheir current power to keep the state weak. For example, Badru (2010) notes that inNigeria, the national elites “found it convenient, like the British colonialists did, tomaintain the divisiveness as a means to sustaining their hold on power”. Acemoglu etal. (2014b) also describes how the unconstrained power of local chiefs in Sierra Leoneallows them to control civil society and influence both local and national governance.The power and influence of the local chiefs minimizes the incentive of the state tobroadcast its power, especially in peripheries, as this might trigger resistance fromlocal chiefs who would like to retain control.
3 Data Source and Description
Our primary data source is the most recent round of the Afrobarometer survey(Round 5), a nationally representative survey of several countries in Africa under-taken during 2011 and 2012. The survey collects data on adult citizens about theirattitudes towards democracy and governance, markets, and civil society, among othertopics. In addition, the survey also gathers data on individuals’ socio-economic char-acteristics, such as education, age, asset ownership, political participation and accessto services.
The questionnaires vary slightly across countries that some survey questions arenot asked in all countries.1 As a result, even though the Round 5 survey covers 31countries, only 21 countries have data that can serve the purposes of our analysis.We report the list of countries in our analysis along with year of colonization andname of colonizer in the appendix (Table A.4). The table also reports the number ofrespondents in the Afrobarometer survey and the survey year. We have twelve An-glophone and nine Francophone countries. Cameroon is excluded from the analysisdue to the ambiguity of its colonial status. Since both Britain and France colonizedparts of Cameroon, it is not straightforward to define Cameroon’s colonial status as
1This could partly be due to the political sensitivity of some survey questions.
8

either Anglophone or Francophone.2
The next section describes the construction of the main outcome variables usingdata in the survey (in Section 3.1), followed by a description of moments of thevariables in the analysis.
3.1 Main outcome variables
As discussed in Section 1, the empirical analysis focuses on the comparison of Anglo-phone and Francophone countries with regard to three outcomes: (1) the importanceof national identity relative to ethnic identity, (2) citizens’ view towards tax compli-ance, and (3) the prevalence of extortion by non-state actors. To this end, we focuson three variables in the Afrobarometer dataset that are considered to capture thesethree outcomes.
The first variable includes responses regarding the importance of national versusethnic identity. In the questionnaire, respondents were asked to choose among fivestatements ranked with respect to the importance of national versus ethnic identity.Taking the Kenyan generic questionnaire as an example, the survey question reads:
• Let us suppose that you had to choose between being a Kenyan and being a[member of RESPONDENT’S ethnic group]. Which of the following statementsbest expresses your feelings?
(a) I feel only Kenyan.
(b) I feel more Kenyan than a [member of RESPONDENT’S ethnic group].
(c) I feel equally Kenyan and a [member of RESPONDENT’S ethnic group].
(d) I feel more a [member of RESPONDENT’S ethnic group] than Kenyan.
(e) I feel only a [member of RESPONDENT’S ethnic group].
Using answers to this question, we construct two alternative indices to measureone’s sense of national identity. The first index, labeled National Identity Rank, as-sumes values ranging from 0 to 4, where higher values are assigned to statementscorresponding to a higher salience of national identity. The second index, labeled Na-tional Identity Binary, is a binary variable that assumes 1 if the respondent chooses
2Note, however, that British Cameroon is relatively small in terms of size comprising only 9%of the whole area of Cameroon.
9

either statement (a) or (b), i.e., if the respondent puts a higher importance on na-tional than on ethnic identity. Otherwise, National Identity Binary equals 0.
The second outcome variable focuses on the extent to which respondents view taxcompliance as an important obligation. Respondents are asked to choose among threeranked statements that reflect varying levels of compliance attitude. The genericquestion in the survey reads:
• Please tell me whether you think that not paying the taxes people owe on theirincome is:
(a) not wrong at all.
(b) wrong but understandable.
(c) wrong and punishable.
We constructed two indices to measure attitudes towards tax compliance. Thefirst variable, labeled Compliance Rank, equals 0, 1 or 2 if the respondent choosesstatement (a), (b) or (c), respectively. Thus, a higher value of Compliance Rankcaptures a stronger attitude in favor of tax compliance. We also constructed analternative binary index of compliance attitude, labeled Compliance Binary, thatequals 1 if the respondent chooses statement (c) (i.e., “wrong and punishable”).Otherwise, Compliance Binary equals 0.
Finally, the third outcome relates to the extent to which the state protects itscitizens from extortion by non-state actors. The survey asks respondents to assess theprevalence of extortion by non-state actors in their community. The survey questionreads:
• In the last year, how often have powerful people or groups other than govern-ment, such as criminals or gangs, made people in your community or neigh-bourhood pay them money in return for protecting them, their property or theirbusinesses?
(a) Never.
(b) Only once.
(c) A few times.
(d) Often.
10
Using these responses, we constructed two indices to measure the level of extortionby non-state actors. The first index, labeled Extortion Rank, equals 0, 1, 2 or 3 ifthe respondent chooses option (a), (b), (c) or (d), respectively. A higher value of“Extortion Rank” indicates a higher prevalence of extortion by non-state actors.We also constructed a binary index, labeled Extortion Binary, that equals 0 if therespondent replies “never” and 1 otherwise.
3.2 Summary statistics
Table 1 presents means and standard deviations of the variables in our analysis,both for the whole sample as well as for the Anglophone and Francophone sub-samples. The top panel includes variables sourced from the Afrobarometer survey,where respondents are the unit of analysis. To account for country-level differences,we also include some macro variables in our analysis. These are presented in thebottom panel.
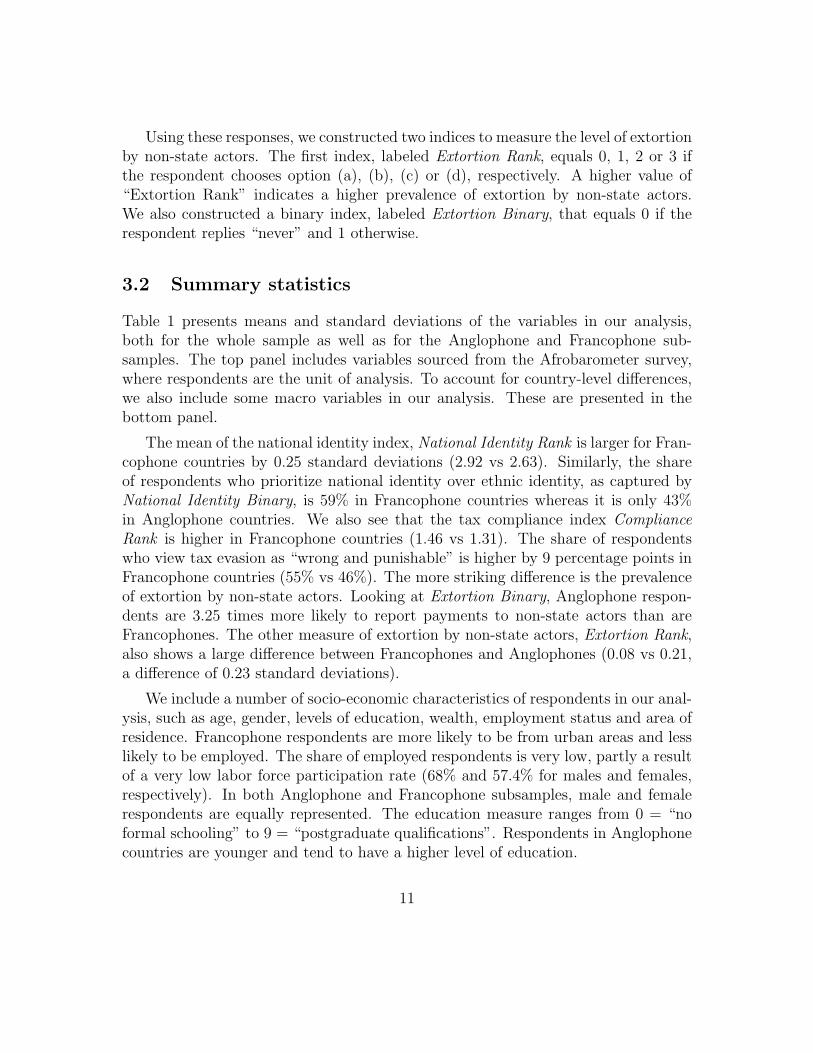
The mean of the national identity index, National Identity Rank is larger for Fran-cophone countries by 0.25 standard deviations (2.92 vs 2.63). Similarly, the shareof respondents who prioritize national identity over ethnic identity, as captured byNational Identity Binary, is 59% in Francophone countries whereas it is only 43%in Anglophone countries. We also see that the tax compliance index ComplianceRank is higher in Francophone countries (1.46 vs 1.31). The share of respondentswho view tax evasion as “wrong and punishable” is higher by 9 percentage points inFrancophone countries (55% vs 46%). The more striking difference is the prevalenceof extortion by non-state actors. Looking at Extortion Binary, Anglophone respon-dents are 3.25 times more likely to report payments to non-state actors than areFrancophones. The other measure of extortion by non-state actors, Extortion Rank,also shows a large difference between Francophones and Anglophones (0.08 vs 0.21,a difference of 0.23 standard deviations).
We include a number of socio-economic characteristics of respondents in our anal-ysis, such as age, gender, levels of education, wealth, employment status and area ofresidence. Francophone respondents are more likely to be from urban areas and lesslikely to be employed. The share of employed respondents is very low, partly a resultof a very low labor force participation rate (68% and 57.4% for males and females,respectively). In both Anglophone and Francophone subsamples, male and femalerespondents are equally represented. The education measure ranges from 0 = “noformal schooling” to 9 = “postgraduate qualifications”. Respondents in Anglophonecountries are younger and tend to have a higher level of education.
11

Table 1: Descriptive Statistics
Panel A: Individual level
Francophone Anglophone Total
mean sd mean sd mean sd(1) (2) (3) (4) (5) (6)
Nation identity rank 2.92 (1.20) 2.63 (1.12) 2.72 (1.15)Nation identity binary 0.59 (0.49) 0.43 (0.49) 0.48 (0.50)Compliance rank 1.46 (0.65) 1.31 (0.71) 1.36 (0.69)Compliance binary 0.55 (0.50) 0.46 (0.50) 0.49 (0.50)Extortion payment rank 0.08 (0.40) 0.21 (0.61) 0.17 (0.56)Extortion payment binary 0.04 (0.20) 0.13 (0.33) 0.10 (0.30)Urban 0.40 (0.49) 0.35 (0.48) 0.37 (0.48)Age 37.77 (14.40) 36.46 (14.45) 36.88 (14.45)Employment 0.20 (0.40) 0.39 (0.49) 0.33 (0.47)Education 2.37 (2.22) 3.53 (1.87) 3.16 (2.06)Male 0.50 (0.50) 0.50 (0.50) 0.50 (0.50)Wealth 0.51 (0.29) 0.47 (0.26) 0.48 (0.27)
N 9317 - 20136 - 29453 -
Panel B: Country level
West Africa 0.89 (0.33) 0.25 (0.45) 0.52 (0.51)East Africa 0.11 (0.33) 0.50 (0.52) 0.33 (0.48)Landlocked country 0.33 (0.50) 0.42 (0.51) 0.38 (0.50)Ethnic fractionalization 0.75 (0.07) 0.67 (0.21) 0.70 (0.17)Pre-colonial state centralization 0.45 (0.23) 0.64 (0.30) 0.56 (0.29)Former German colony 0.11 (0.33) 0.17 (0.39) 0.14 (0.36)
N 9 - 12 - 21 -
This table reports means and standard deviations of the variables. The top/bottom panel reportsindividual-/country-level variables. Standard deviations are in parentheses. The means and standarddeviations are reported for the whole sample as well as for Francophone and Anglophone samples.
12

We construct an individual wealth index following the standard factor analysismethod.3 The Afrobarometer data provide information on the ownership of radio,TV, car, water, latrine and type of roof material. We first implement the principal-component factoring method to find the main factors among the five items thatcapture individuals’ level of wealth. Then, we generate a wealth index as an averageof the main factors. To account for heterogeneity among countries, we do the factoranalysis for each country separately. For instance, TV, car, water and latrine are thefour main factors for Ghanaian respondents according to the principal-componentfactoring result. The individual wealth index for a Ghanaian respondent is thencalculated as the number of items owned divided by four.
The lower panel presents the country-level variables. These variables are meantto control for factors that may affect the outcome variables independently of colonialstatus though they may still be correlated with colonial status. These may includefactors like geography, ethnic composition and pre-colonial institutions.
In order to account for differences in precolonial institutions, we consider thepre-colonial centralization measure provided by Gennaioli and Rainer (2007).4 Thehierarchy data describe ethnic group centralization level in Africa before Europeancolonization. Gennaioli and Rainer (2007) use countries’ ethnic composition fromthe Soviet Atlas to calculate the share of each country’s non-European populationbelonging to centralized groups identified from Murdock data. The centralizationindex varies from 0 (non-centralized/fragmented) to 1 (centralized). We see thatAnglophone countries on average have a higher level of pre-colonial centralization.
In our regressions, we also account for the possible effect of German occupationin some African countries. One Francophone and two Anglophone countries in oursample were former German colonies (Tanzania, Namibia and Togo) prior to WorldWar I5; however, after the defeat of Germany, these countries were later transferredto Britain and France.
To account for differences in ethnic composition, we use the ethnic fractionaliza-tion index from Alesina et al. (2003). The index measures the probability that two
3Lawrence Hamilton, Statistics with STATA, 2013, Cengage: Chapter 12 (p. 337)4The data are created by matching ethnic group jurisdictional hierarchy data collected by an-
thropologist George P. Murdock and ethnic group composition data published in Atlas NarodovMira by Miklukho-Maklai Ethnological Institute in the Soviet Union in 1964.
5In addition, two Anglophone countries – Ghana and Nigeria – both had a small part of landtransferred from German ownership (British Togo joined Ghana, and British Cameroon joinedNigeria); however, the majority of the country was under British rule. Thus, these two countriesare not treated as former Germany colonies.
13
randomly selected individuals from a country belong to different ethnic groups.6 Wesee that Francophone countries have a higher level of fractionalization.
4 Empirical Results
The regression equation under consideration is:
Outcomei,e,c = β × Anglophonec +X′cΓ +X′
i,e,cΩ + εi,e,c (1)
where i indexes individuals, e ethnic groups, and c countries. Outcomei,e,c is one ofthe three individual-level outcomes: (1) the salience of national identity, (2) attitudetowards tax compliance, and (3) payment to non-state actors. These outcomes aremeasured using the variables constructed in Section 3.1. Anglophonec is a dummyfor Anglophone countries – it equals 1 for Anglophone respondents and 0 for Fran-cophones. β is our coefficient of interest – it captures the effect from Anglophonecountries. Xc and Xi,e,c are vectors of country- and individual-level controls, respec-tively. In all of the regressions, we cluster standard errors both by ethnic group andcountry.7
We will first report estimation results from OLS regressions. OLS coefficientsare interesting as they depict the correlations between the outcome variables andcolonial status; however, one can have reasonable endogeneity concerns that theOLS estimates may be biased. That is, the differences in the three main outcomesbetween Francophone and Anglophone countries, rather than being results of coloniallegacies, could be driven by some unobservable differences between the two sets ofcountries. This may, for example, be the case if Britain, with the aim of using thedivide-and-rule strategy, targeted regions that have more ethnic divisions to beginwith. France, on the other hand, with the objective of implementing a more directrule, may have focused on regions that consist of relatively homogeneous ethnicgroups. This colonial strategy would then imply that the current differences in thelevel of inter-ethnic friction between Anglophone and Francophone countries, ratherresulting from colonial legacy, might already have existed before colonization.8
6The construction of the ethnic fractionalization measure used data ranging from 1983 for Ghanaand Uganda to 2001 for Kenya; however, as also argued by the authors, group shares in ethnicfractionalization measures are generally considered to be sufficiently stable over a relatively longperiod of time.
7The ethnicity clustering is based on Murdock’s ethnographic map.8However, H. L. Hesseling documented in his book “Divide and Rule. The Partition of Africa,
14

We attempt to address endogeneity concerns using two identification strate-gies. First, using geographic variations during the “scramble for Africa,” we con-struct a novel instrument for the likelihood that an African country becomes aBritish (or French) colony. In our second identification strategy, we apply regression-discontinuity focusing on observations in areas near shared borders between Anglo-phone and Francophone countries. The results from the instrumental variable andregression discontinuity will be presented in Sections 4.2 and 4.3, respectively.
4.1 Benchmark regression results
We start with the OLS results on the salience of national versus ethnic identities. InTable 2, the dependent variable is National Identity Rank – an index ranging from 0to 4, with larger values indicating a higher sense of national identity. The first columnin the Table presents results where we only control for a set of geographic indicators.These include two region dummies, one for East and one for West Africa. The bench-mark group is Southern Africa. These controls are meant to account for differencesin location that may be correlated with the type of colonizers. For example, WestAfrica was predominantly colonized by France and East Africa by Britain. Thus, thegeographic controls help address the concern that the regional differences may affectstate-building in other ways than the colonial legacy (e.g., through differential expe-rience of slave trade). We also include a dummy for landlocked countries. Access tothe sea may affect state-building through a complex web of several possible channels.For example, sea access may help state-building by facilitating international tradeand economic integration, which in turn may encourage inter-ethnic cooperation.
We see that all of the geographic indicators in column (1) are significant. Thecoefficient on Anglophone is negative and statistically significant. As measured byNational Identity Rank, the average level of national identity in Anglophone countriesis lower by 0.53 than in Francophone countries. For comparison, this effect is about20% of the mean of National Identity Rank, which is equal to 2.72 (see Table 1).
Column (2) controls for the pre-colonial level of state centralization and ethnicfractionalization. The former variable is meant to capture the legacy of state cen-tralization during the pre-colonial era, whereas the latter controls for the effect ofethnic fragmentation on one’s sense of nationhood.9 A negative coefficient on Ethnicfractionalization is consistent with the notion that constructing national identity can
1880-1914” (p. 177-8) that the massive French occupation in West Africa was driven more by thenavy’s desire to redeem itself from past humiliation than by any strategic concern.
9See Section 3 for the construction of these variables
15

Table 2: OLS results for national identity. Dependent variable is National IdentityRank
(1) (2) (3) (4)
Anglophone −0.53∗∗ −0.52
∗∗∗ −0.49∗∗∗ −0.50
∗∗∗
(0.24) (0.17) (0.16) (0.16)
West Africa −0.29 0.11 0.18 0.18(0.26) (0.21) (0.18) (0.18)
East Africa 0.18 0.66∗∗∗
0.67∗∗∗
0.67∗∗∗
(0.14) (0.20) (0.15) (0.15)
Landlocked −0.37∗∗∗ −0.47
∗∗∗ −0.38∗∗∗ −0.38
∗∗∗
(0.13) (0.10) (0.08) (0.07)
Ethnic fractionalization −1.67∗∗∗ −1.72
∗∗∗ −1.72∗∗∗
(0.46) (0.43) (0.43)
Pre-colonial state centralization −0.40∗ −0.47
∗∗ −0.47∗∗
(0.21) (0.20) (0.20)
Former German colony 0.27∗∗
0.27∗∗
(0.12) (0.12)
Urban 0.01(0.04)
Age 0.00(0.00)
Employment 0.01(0.03)
Education 0.01(0.01)
Male 0.06∗∗∗
(0.02)
Wealth −0.06(0.09)
R-squared 0.04 0.07 0.07 0.07Observations 28967 28967 28967 28967Number of country clusters 21 21 21 21Number of ethnic clusters 316 316 316 316
Robust standard errors clustered by country and ethnic group are in parentheses. *** Significantat 1%, ** significant at 5%, * significant at 10%.
16

be a challenging task in ethnically diverse societies. Notice that the sign on WestAfrica reverses as we move from column (1) to (2). This is because West Africaon average has a higher level of fractionalization and lower level of national identity;however, even though the average national identity level is lower in West Africa, oncewe control for differences in ethnic fractionalization, this is no longer the case. Thecoefficient on Pre-colonial state centralization is negative. On the one hand, a higherlevel of centralization may enhance the sense of national identity as people share along history of cooperation within the same state. On the other hand, centralizationmay foster ethnic animosity if the central state is dominated by a powerful ethnicgroup. From the results in column (2), the latter effect seems to dominate. Thecoefficient on Anglophone remains fairly stable as we include these controls.
Some countries in our sample were former German colonies up until World WarI, and transferred to Britain and France thereafter. To account for the possibilitythat this may have affected the style of British and French rule in those countries,column (3) includes a dummy for former German colonies. We see that sense ofnational identity appears to be higher in former German colonies. The coefficient onAnglophone stays more or less the same.
Finally, column (4) includes individual socio-economic characteristics. Except forgender, no other variables show a significant coefficient, suggesting that individualcharacteristics have a less important effect on the salience of ethnic versus nationalidentity. Thus, unsurprisingly, the coefficient on Anglophone does not change signif-icantly in response to controlling for the individual characteristics.
Table 3 reports results for the second outcome – citizens’ attitude towards taxcompliance. The dependent variable is Compliance Rank. We include the same set ofcontrols that we discuss above. Unlike the results from national identity, individualsocio-economic characteristics seem to matter significantly for attitudes towards taxcompliance. Our coefficient of main interest, the coefficient on Compliance Rank, islargely insignificant; however, the signs are consistently negative across all columns.Thus, even though the lack of statistical significance means that the evidence is notconclusive, the negative signs are in line with the idea that attitudes towards taxcompliance are weaker among Anglophones. In fact, as we will see in Section 4.3,the coefficient becomes significant in alternative specifications where we attempt toaddress endogeniety concerns.
We now turn to results on the third outcome – payment to non-state actors.In Table 4, the dependent variable is Extortion Payment Rank, whose higher valueindicates a more frequent payment to non-state actors. We see that the coefficient onAnglophone is significantly positive. That is, respondents in Anglophone countries
17

Table 3: OLS results for tax compliance. Dependent variable is Compliance Rank
(1) (2) (3) (4)
Anglophone −0.03 −0.01 −0.01 −0.02(0.07) (0.07) (0.07) (0.07)
West Africa 0.12 0.12 0.13 0.14(0.13) (0.14) (0.14) (0.13)
East Africa −0.09 −0.04 −0.04 −0.03(0.13) (0.11) (0.11) (0.10)
Landlocked −0.04 −0.03 −0.02 −0.00(0.07) (0.05) (0.06) (0.06)
Ethnic fractionalization −0.36∗∗ −0.36
∗∗ −0.31∗∗
(0.16) (0.16) (0.15)
Pre-colonial state centralization −0.29∗∗∗ −0.30
∗∗∗ −0.29∗∗∗
(0.11) (0.11) (0.11)
Former German colony 0.02 0.02(0.06) (0.05)
Urban 0.08∗∗∗
(0.02)
Age 0.00∗∗∗
(0.00)
Employment −0.03(0.02)
Education 0.03∗∗∗
(0.01)
Male 0.02∗∗
(0.01)
Wealth −0.02(0.05)
R-squared 0.03 0.03 0.03 0.04Observations 28079 28079 28079 28079Number of country clusters 21 21 21 21Number of ethinic clusters 316 316 316 316
Robust standard errors clustered by country and ethnic group are in parentheses. *** Significantat 1%, ** significant at 5%, * significant at 10%.
18

report payments to non-state actors more frequently than in Francophone countries.The magnitude of this effect, at about 0.18, is also large compared to the mean ofExtortion Payment Rank in the whole sample, which stands at 0.17 (see Table 1).
As a robustness check, we run the regressions where we used the binary outcomemeasures (National Identity Binary, Compliance Binary and Extortion Payment Bi-nary) as our dependent variables. We also run alternative regression models (i.e.,OLS, probit and ordered logit). We found similar results from the robustness checks.The results from the robustness regressions are reported in the appendix (Table A.1).
To summarize, the broad picture from the above empirical patterns suggeststhat Anglophone countries appear to face a relatively difficult challenge in state-building, to the extent of the dimensions of state outcomes captured by the dependentvariables. The findings show that, in Anglophone countries, the construction ofnational identity is significantly mitigated and social norms toward tax complianceare weaker. Moreover, the state is less likely to protect its citizens from extortion bynon-state actors.
4.2 Results from instrumental variable estimates
This section presents results from the instrumental variable regressions as a firstattempt to address the endogeneity concerns that may arise in the above estimates.One needs an instrumental variable that is correlated with the likelihood that anAfrican country becomes a French or British colony, but that is not directly correlatedwith the outcome variables. Before turning to the IV regression results, we firstdescribe the construction of our instrument.
A. Construction of the instrument
To construct the instrument, we exploit the patterns of colonial expansion during themassive scramble for Africa by European powers that started in the late 19th century.Before the 1880s, European settlers mainly stayed along the African coastline, andvery few had explored inland. Then, in the early 1880s, tension among Europeanpowers increased. To avoid the looming threat of military conflict in Africa overterritorial claims, European powers held the Berlin Conference (1884-85) where theyreached a broad consensus on how to stake claims in Africa. The main outcomeof the conference was that actual control on African soil would essentially implyterritorial ownership. This outcome ushered in an era of rapid colonial expansion toinland Africa. Since controlling nearby areas was logistically less costly than distant
19

Table 4: OLS results for extortion payments. Dependent variable is Extortion Pay-ment Rank
(1) (2) (3) (4)
Anglophone 0.17∗∗
0.18∗∗∗
0.18∗∗∗
0.18∗∗∗
(0.07) (0.06) (0.05) (0.05)
West Africa 0.16∗∗
0.11 0.10 0.10(0.07) (0.08) (0.08) (0.07)
East Africa 0.11∗∗∗
0.08∗
0.08∗
0.08∗∗
(0.02) (0.04) (0.04) (0.04)
Landlocked −0.02 0.00 −0.01 −0.00(0.02) (0.03) (0.03) (0.03)
Ethnic fractionalization 0.03 0.03 0.04(0.11) (0.11) (0.10)
Pre-colonial state centralization −0.11 −0.11 −0.10(0.08) (0.08) (0.08)
Former German colony −0.02 −0.02(0.03) (0.03)
Urban 0.02(0.03)
Age −0.00∗∗
(0.00)
Employment −0.00(0.02)
Education −0.00(0.00)
Male 0.00(0.01)
Wealth 0.10∗∗
(0.04)
R-squared 0.02 0.02 0.02 0.02Observations 28384 28384 28384 28384Number of country clusters 21 21 21 21Number of ethnic clusters 316 316 316 316
Robust standard errors clustered by country and ethnic group are in parentheses. *** Significantat 1%, ** significant at 5%, * significant at 10%.
20

areas, colonial forces expanded their territory primarily by annexing areas adjacentto existing colonies.
This expansion pattern implies that whether a given African country ends upbeing a French or British colony is strongly influenced by the country’s distance fromthe nearest existing British and French colonies – a pattern that we exploit in orderto construct the instrumental variable. For each African country, we measure itsdistance from the nearest British and French colonies in the year before the countrywas colonized. We then use the ratio of these distances to predict the colonizer.For example, consider Malawi – an Anglophone country. Its colonization by Britainbegan in 1889. The nearest British colony prior to 1889 was Zimbabwe (830 kms),and the nearest French colony was Antsiranana (1675 kms). The idea is that therelative proximity of Malawi to Zimbabwe was a significant factor in Malawi endingup as a British (rather than a French) colony. For each of the countries in our sample,the distances to to nearest existing French and British colonies in the year prior tocolonization are provided in the appendix (see Table A.4).10 In all cases, we considerthe straight-line distance between the centroids of each geographic unit.
The instrumental variable, Relative Distance, is defined as:
Relative Distance =Distance to the nearest existing British colony
Distance to the nearest existing French colony
In order for the IV regression to deliver a consistent estimate, it is not enough thatthe instrument provides a significant correlation in the first stage; we also need thatthe instrument should not affect the outcome variables other than through its effecton the endogenous variable. That is, the instrument should not only be relevant, butit also needs to be exogenous.
Admittedly, as is the case with any instrument, one cannot conclusively ruleout all possible channels by which the instrument may affect the outcome variables.While aware of this caveat, we find it quite hard to imagine plausible scenarios wheredistance to the nearest existing French and British colonies is not orthogonal to fac-tors that may potentially affect the outcome variables in our analysis. Our outcomevariables, like inter-ethnic rivalries, seem to be primarily driven by domestic situa-tions within the territory such as the level of ethnic fractionalization and historicalinter-ethnic conflicts. On the other hand, the exact distances of the nearest Britishand French colonies from a territory at the time of the territory’s occupation (which
10The years of colonization are determined according to various historical sources listed in theappendix.
21

are the source of variation for our instrument) are likely to be determined by histor-ical situations that the colonizers faced in the lead-up to the conquest of the nearestcolonies. These historical situations may include, among other factors, the colonizers’military resources, the level of resistance that the colonizers had faced and difficultyof the terrain during previous conquests. For example, in 1888 (the year of Ugan-dan occupation), Britain possessed colonies much closer to Uganda than did France.Our identifying assumption is that these differences of distance are not primarily theresults of domestic situations within Uganda. Instead, they were outcomes of histor-ical factors that led Britain to occupy the southern African territories (and France tooccupy the western African territories) in the earlier years – factors that do not seemto be results of the domestic situations at the time within the Ugandan territory.Thus, it seems plausible to assume that these distance differences are orthogonal todomestic factors within Uganda and hence our outcome variables.
Moreover, in an attempt to diagnose possible violations of the exogeneity as-sumption more systematically, we regress the instrument on each of the country-levelcontrol variables to check whether there is a sign of correlation between the instru-ment and observable factors that can potentially affect the outcome variables. Table5 presents the results. We see that none of the control variables show significantcorrelation with the instrument, indicating no violation of the exclusion restriction.
B. Results
Turning to the IV regressions, Table 6 reports the results for the salience of nationalidentity. The dependent variable is National Identity Rank. We include controlvariables following the patterns in our OLS specifications in the previous tables. Inthe bottom panel, we report the first-stage coefficient on the instrument RelativeDistance and F-stat on the excluded instrument. The coefficient on the instrumenthas the expected sign and is significant. The F-stat is also fairly large.
The first column controls only for geographic variables. We see that the co-efficient on Anglophone is negative and significant, implying that the salience ofnational identity is relatively low in Anglophones and reaffirming the results fromthe OLS estimations. The second column controls for ethnic fractionalization andpre-colonial state centralization. Both of the controls enter significantly. Column (3)includes an indicator variable for whether the country was a former German colony.This control is also significant. Finally, we control for individual-level respondentcharacteristics. Notice that even though many of the controls enter significantly(particularly national-level variables), the coefficient on Anglophone remains stable
22

Table 5: Coefficient from regressions of the instrument on country characterstics.
(1) (2) (3) (4) (5) (6)
West Africa 0.39(0.33)
East Africa -0.06(0.36)
Landlocked country -0.29(0.34)
Ethnic fractionalization 1.38(0.98)
Pre-colonial state centralization -0.54(0.60)
Former German colony -0.01(0.48)
R-squared 0.07 0.00 0.04 0.09 0.04 0.00Observations 21 21 21 21 21 21
Robust standard errors are in parentheses. *** Significant at 1%, ** significant at5%, * significant at 10%.
23
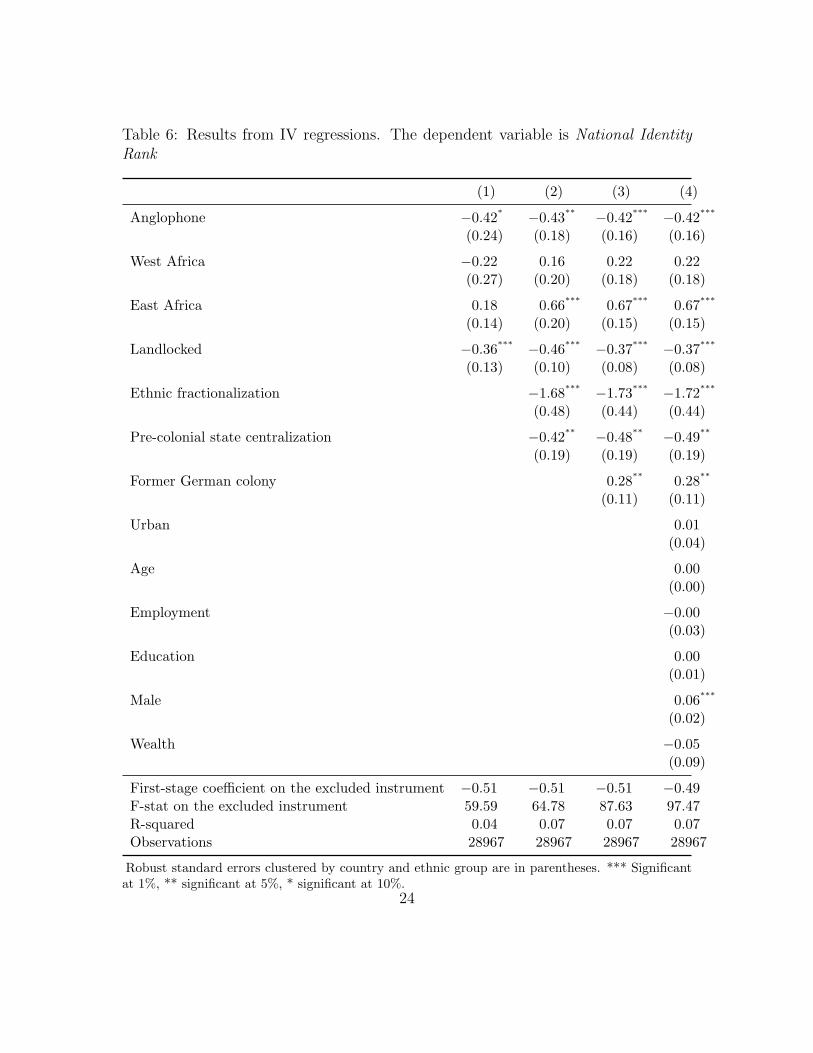
Table 6: Results from IV regressions. The dependent variable is National IdentityRank
(1) (2) (3) (4)
Anglophone −0.42∗ −0.43
∗∗ −0.42∗∗∗ −0.42
∗∗∗
(0.24) (0.18) (0.16) (0.16)
West Africa −0.22 0.16 0.22 0.22(0.27) (0.20) (0.18) (0.18)
East Africa 0.18 0.66∗∗∗
0.67∗∗∗
0.67∗∗∗
(0.14) (0.20) (0.15) (0.15)
Landlocked −0.36∗∗∗ −0.46
∗∗∗ −0.37∗∗∗ −0.37
∗∗∗
(0.13) (0.10) (0.08) (0.08)
Ethnic fractionalization −1.68∗∗∗ −1.73
∗∗∗ −1.72∗∗∗
(0.48) (0.44) (0.44)
Pre-colonial state centralization −0.42∗∗ −0.48
∗∗ −0.49∗∗
(0.19) (0.19) (0.19)
Former German colony 0.28∗∗
0.28∗∗
(0.11) (0.11)
Urban 0.01(0.04)
Age 0.00(0.00)
Employment −0.00(0.03)
Education 0.00(0.01)
Male 0.06∗∗∗
(0.02)
Wealth −0.05(0.09)
First-stage coefficient on the excluded instrument −0.51 −0.51 −0.51 −0.49F-stat on the excluded instrument 59.59 64.78 87.63 97.47R-squared 0.04 0.07 0.07 0.07Observations 28967 28967 28967 28967
Robust standard errors clustered by country and ethnic group are in parentheses. *** Significantat 1%, ** significant at 5%, * significant at 10%.
24

across columns. This is reassuring since the stability of the coefficient on Anglophone,despite inclusion of controls that enter significantly, suggests that the effect in theIV regression appears to be insulated from confounding factors.
Table 7 presents results for tax compliance. The dependent variable is ComplianceRank. As is the case with the OLS estimates, even though the signs are consistentlynegative, the tax compliance results lack statistical significance.
Table 8 reports the results for the prevalence of extortion by non-state actors.We see that the IV results reaffirm the findings from OLS regressions, namely, thatAnglophones are more likely to face extortion by non-state actors. Once again, thecoefficient on Anglophone remains stable as we include more controls.
As a robustness check, we run the IV regressions with the binary outcome mea-sures (National Identity Binary, Tax Compliance Binary and Extortion Binary) asour dependent variables, and found similar results (see Table A.2 in the appendix).
4.3 Regression Discontinuity
Turning now to the second approach to address the endogeneity, we implement re-gression discontinuity (RD) on a limited set of observations in our sample that residein areas near borders shared by Anglophone and Francophone countries. There islittle disagreement among African scholars that African borders were for the mostpart arbitrarily drawn by colonizers. As the British prime minister at the timeLord Salisbury said, “we have been engaged in drawing lines upon maps where nowhite man’s feet have ever trod; we have been giving away mountains and rivers andlakes to each other, only hindered by the small impediment that we never knew ex-actly where the mountains and rivers and lakes were.”11 Thus, the borders typicallydivided communities that belonged to relatively homogeneous groups that sharedsimilar ethnicity, political organization and agro-economic zones (see Michalopoulosand Papaioannou (2011) for more systematic evidence). This means that disconti-nuities at borders can be reasonably interpreted as “border effects,” i.e., effects ofcolonial border demarcations as opposed to, say, pre-colonial differences.
Of the twenty-one countries in our sample, nine have borders shared by an Anglo-phone and a Francophone country, all in West Africa. Three of them are Anglophonecountries (Ghana, Nigeria and Sierra Leone), and the rest are Francophone (Guinea,Cote d’Ivoire, Burkina Faso, Togo, Benin and Niger). As shown in Figure 1, there are
11Geographical Journal, vol. xxciii, Proceedings, Mar. 9, 1914.
25

Table 7: Results from IV regressions. The dependent variable is Tax ComplianceRank
(1) (2) (3) (4)
Anglophone −0.04 −0.04 −0.04 −0.05(0.07) (0.05) (0.05) (0.06)
West Africa 0.11 0.11 0.11 0.12(0.13) (0.13) (0.13) (0.12)
East Africa −0.09 −0.04 −0.04 −0.03(0.12) (0.11) (0.11) (0.10)
Landlocked −0.04 −0.03 −0.03 −0.01(0.06) (0.05) (0.06) (0.06)
Ethnic fractionalization −0.35∗∗ −0.36
∗∗ −0.31∗∗
(0.15) (0.15) (0.14)
Pre-colonial state centralization −0.29∗∗∗ −0.29
∗∗∗ −0.28∗∗∗
(0.11) (0.11) (0.10)
Former German colony 0.02 0.02(0.06) (0.06)
Urban 0.08∗∗∗
(0.02)
Age 0.00∗∗∗
(0.00)
Employment −0.03(0.03)
Education 0.03∗∗∗
(0.01)
Male 0.02∗∗
(0.01)
Wealth −0.03(0.06)
First-stage coefficient on the excluded instrument −0.51 −0.51 −0.51 −0.49F-stat on the excluded instrument 59.24 63.92 86.46 95.69R-squared 0.03 0.03 0.03 0.04Observations 28079 28079 28079 28079
Robust standard errors clustered by country and ethnic group are in parentheses. *** Significantat 1%, ** significant at 5%, * significant at 10%.
26

Table 8: Results from IV regressions. The dependent variable is Extortion Rank
(1) (2) (3) (4)
Anglophone 0.19∗∗∗
0.19∗∗∗
0.19∗∗∗
0.20∗∗∗
(0.05) (0.04) (0.04) (0.04)
West Africa 0.17∗∗∗
0.11∗
0.11∗
0.11∗∗
(0.05) (0.07) (0.06) (0.06)
East Africa 0.12∗∗∗
0.08∗
0.08∗
0.08∗∗
(0.02) (0.04) (0.04) (0.04)
Landlocked −0.02 0.00 −0.00 0.00(0.02) (0.03) (0.03) (0.03)
Ethnic fractionalization 0.03 0.03 0.04(0.10) (0.10) (0.09)
Pre-colonial state centralization −0.12 −0.11 −0.10(0.08) (0.08) (0.08)
Former German colony −0.02 −0.02(0.04) (0.03)
Urban 0.02(0.03)
Age −0.00∗∗∗
(0.00)
Employment −0.00(0.02)
Education −0.00(0.00)
Male 0.00(0.01)
Wealth 0.10∗∗
(0.04)
First-stage coefficient on the excluded instrument −0.51 −0.51 −0.51 −0.49F-stat on the excluded instrument 59.95 65.34 87.11 96.49R-squared 0.02 0.02 0.02 0.02Observations 28384 28384 28384 28384
Robust standard errors clustered by country and ethnic group are in parentheses. *** Significantat 1%, ** significant at 5%, * significant at 10%.
27

Table 9: Results from regression-discontinuity
National Identity Rank Compliance Rank Extortion Payment Rank
(1) (2) (3) (4) (5) (6)
Angolophone −0.32∗∗∗ −0.35
∗∗∗ −0.11∗∗∗ −0.11
∗∗∗0.14
∗∗∗0.15
∗∗∗
(0.06) (0.06) (0.04) (0.04) (0.03) (0.03)
Age −0.00 0.00∗ −0.00
(0.00) (0.00) (0.00)
Male 0.03 0.04∗∗
0.00(0.03) (0.02) (0.01)
Employment 0.03 −0.05∗∗
0.00(0.04) (0.02) (0.02)
Urban −0.03 0.06∗∗∗
0.01(0.04) (0.02) (0.02)
Education 0.03∗∗∗
0.01∗∗
0.00(0.01) (0.00) (0.00)
Wealth 0.11∗
0.01 0.15∗∗∗
(0.07) (0.04) (0.03)
Distance 1.30∗∗ −0.23 0.74
∗∗∗
(0.52) (0.29) (0.28)
Distance square −1.96 1.06 −1.74∗∗∗
(1.27) (0.71) (0.63)
Distance cube 1.02 −0.78∗
1.10∗∗∗
(0.87) (0.47) (0.40)
R-squared 0.15 0.16 0.08 0.09 0.08 0.08Observations 5749 5749 5600 5600 5517 5517
This table reports results from regression-discontinuity. The observations are drawn from respon-dents residing within 100 km from shared borders between Anglophone and Francophone countries.Fixed-effects for ethnic groups and border segments are included in the regressions. Robust stan-dard errors clustered by ethnic group are in parentheses.*** Significant at 1%, ** significant at 5%, * significant at 10%.
28

Figure 1: Border
six segments of shared borders among these countries.12 Using geodata, we locatedthe village of each respondent.13 In the baseline regression, we selected respondentsthat were located within 100 kilometers of the borders. We also did robustness checkswith 75 and 125 km and found similar results. Thanks to the wide geographic cov-erage of the Afrobarometer surveys within each country, we have more than 5,500observations for our analysis (in the baseline regression).
Table 9 reports results from the discontinuity regressions for national identity,tax compliance and prevalence of extortion by non-state actors. The dependentvariables are National Identity Rank, Compliance Rank and Extortion Payment Rank.In all of the regressions, we include fixed effects for each of the border segmentsto account for potential heterogeneity among different segments arising from, forexample, differences in how the borders are drawn.14 We also include fixed effects
12The shared border between Nigeria and Cameroon is excluded from our six border group. In1961, southern part of British Cameroons joined Cameroon while the northern part joined Nigeria;thus, the current border between Nigeria and Cameroon is not the original dividing line betweenFrench and British rule.
13The geodata on Afrobarometer respondents are from Kotsadam et al. (2015). We would like tothank Eivind Hammersmark Olsen for collecting the geodata and sharing it with us.
14Some borders, like the one between Ghana and Burkina Faso, may be more reflective of naturaldifferences (due to the Volta River between the two borders) than others like the Nigeria-Niger
29

for each ethnic territory. This helps account for differences in ethnic compositionsacross borders. In order to account for the possible effect of distance from the borders,we control for distance from borders. The polynomial distance terms are meant tocapture potential non-linearities in the effect of distance.
Using the binary outcome measures – National Identity Binary, Compliance Bi-nary and Extortion Payment Binary – as the dependent variables delivers similarresults (see Table A.3 in the appendix).
The results reiterate the empirical patterns that we have uncovered in the previoustables. Anglophones report a lower salience of national identity. They also reportweaker attitudes towards tax compliance, and face a higher frequency of extortionby non-state actors.15 One important pattern is that the coefficient for attitudestowards tax compliance, which was not significant in the OLS and IV regressions, isnow significant.
5 Concluding remarks
The role of ethnicity in economic and institutional development of states has receivedincreased attention in recent years. Despite the emphasis on the detrimental impactof ethnic rivalry on the construction of national identity and state-building, the role ofhistorical factors in fomenting these rivalries and undermining state-building remainspoorly understood. This paper examines the legacies of different styles of colonial rulein Africa. Our study is motivated by debates surrounding the distinction betweenthe strategies adopted by Britain and France, as well as their implications for long-term state-building in Africa. While Britain adopted the “divide-and-rule” strategy,which is argued to have fostered (and sometimes created) local ethnic rivalries, theexploitation of inter-ethnic rivalries played a less prominent role in control strategyadopted by France.
Two key features characterize the divide-and-rule strategy. The first involvesidentifying (or creating) locally powerful men from the pre-colonial power structure,such as tribal chiefs, and making them part of the colonial administration. Thesecond involves fostering and exploiting rivalries among ethnic groups to weakenand control local populations. This strategy is primarily aimed at underminingcooperation among various ethnic groups that might otherwise have led to a more
border.15There are slight variations in the number of observations across columns due to missing values
for some variables in the Afrobarometer data.
30

unified and stronger resistance against the colonial power.
Broadly speaking, there are two possible reasons in the literature as to why thedivide-and-rule strategy may pose a lasting challenge to state-building in AnglophoneAfrica. First, historical rivalries among ethnic groups within a state could make itdifficult to construct a strong sense of nationhood. Second, the chiefs that wereempowered in British colonies during the colonial era still tend to retain significantpower in many Anglophone countries, which can undermine the process of buildinga strong central state if such a state may be viewed as a threat to the chiefs’ power.These arguments contrast with the view that the distinction in colonial occupationstrategy should matter very little for post-colonial state development in Africa sincethe colonizers’ control, which tended to be limited to capitals and coastal towns, didnot appear to be strong enough to affect post-colonial institutions.
The empirical findings lend support to the hypothesis that Britain’s divide-and-rule strategy has had a lasting negative impact on state-building. We find thatcitizens in Anglophone countries tend to report a lower salience of national identity.Anglophone respondents are also less likely to view paying taxes as an importantobligation, which is a sign of weaker norms towards tax compliance. They are alsomore likely to face extortion by non-state actors, indicating the weakness of Anglo-phone states to monopolize violence. Furthermore, these results hold both in theinstrumental variable and regression discontinuity identification strategies we deployin our analysis.
In addition to highlighting the role of history in fostering inter-ethnic rivalries, theresults also suggest that policies adopted by those who control the central governmentcan either exacerbate or mitigate frictions among ethnic groups. Colonial policiesare likely to be one of the many factors that affect rivalries among ethnic groups.Thus, future research could provide valuable insights in order to identify what kindof government policies influence inter-ethnic cooperation and state-building.
References
Acemoglu, Daron, Isaias N. Chaves, Philip Osafo-Kwaako, and James A.Robinson, “Indirect Rule and State Weakness in Africa: Sierra Leone in Compar-ative Perspective,” in “African Successes: Sustainable Growth” NBER Chapters,National Bureau of Economic Research, Inc, June 2014.
, Simon Johnson, and James A. Robinson, “The Colonial Origins of Compar-
31

ative Development: An Empirical Investigation,” The American Economic Review,2001, 91 (5), 1369–1401.
, , and , “Reversal of Fortune: Geography and Institutions in the Makingof the Modern World Income Distribution,” The Quarterly Journal of Economics,2002, 117 (4), 1231–1294.
, Tristan Reed, and James A. Robinson, “Chiefs: Economic Developmentand Elite Control of Civil Society in Sierra Leone,” Journal of Political Economy,2014, 122 (2), 319 – 368.
Afigbo, A.E., The Warrant Chiefs: indirect rule in southeastern Nigeria, 1891-1929Ibadan history series, Longman, 1972.
Alesina, Alberto, Arnaud Devleeschauwer, William Easterly, SergioKurlat, and Romain Wacziarg, “Fractionalization,” Journal of EconomicGrowth, 2003, 8 (2), 155–194.
Badru, Pade, “Ethnic conflict and state formation in post-colonial Africa: a com-parative study of ethnic genocide in the Congo, Liberia, Nigeria, and Rwanda-Burundi,” Journal of Third World Studies, 2010, 27 (2), 149–172.
Banerjee, Abhijit and Lakshmi Iyer, “History, Institutions, and Economic Per-formance: The Legacy of Colonial Land Tenure Systems in India,” American Eco-nomic Review, 2005, 95 (4), 1190–1213.
Blanton, Robert, T. David Mason, and Brian Athow, “Colonial Style andPost-Colonial Ethnic Conflict in Africa,” Journal of Peace Research, 2001, 38 (4),473–491.
Clapham, Christopher ., Third World Politics: An Introduction Madison, WI:University of Wisconsin Press, 1985.
Crowder, Michael, “Indirect Rule: French and British Style,” Africa: Journal ofthe International African Institute, 1964, 34 (3), 197–205.
Dell, Melissa, “The Persistent Effects of Peru’s Mining Mita,” Econometrica, 2010,78 (6), 1863–1903.
Easterly, William and Ross Levine, “Africa’s Growth Tragedy: Policies andEthnic Divisions,” The Quarterly Journal of Economics, 1997, 112 (4), 1203–1250.
32

Feyrer, James and Bruce Sacerdote, “Colonialism and Modern Income: Islandsas Natural Experiments,” The Review of Economics and Statistics, 2009, 91 (2),245–262.
Gennaioli, Nicola and Ilia Rainer, “The modern impact of precolonial central-ization in Africa,” Journal of Economic Growth, September 2007, 12 (3), 185–234.
Herbst, J., States and Power in Africa: Comparative Lessons in Authority andControl: Comparative Lessons in Authority and Control Princeton Studies in In-ternational History and Politics, Princeton University Press, 2014.
Hjort, Jonas, “Ethnic Divisions and Production in Firms,” The Quarterly Journalof Economics, 2014, 129 (4), 1899–1946.
Holmen, Hans, State, cooperatives and development in Africa, Vol. 86, NordicAfrica Institute, 1990.
Huillery, Elise, “History Matters: The Long-Term Impact of Colonial Public In-vestments in French West Africa,” American Economic Journal: Applied Eco-nomics, 2009, 1 (2), 176–215.
Iyer, Lakshmi, “Direct versus Indirect Colonial Rule in India: Long-Term Conse-quences,” The Review of Economics and Statistics, November 2010, 92 (4), 693–713.
Khapoya, V.B., The African Experience: An Introduction, Longman, 2010.
Kotsadam, Andreas, Eivind Hammersmark Olsen, Carl Henrik Knutsen,and Tore Wig, “Mining and local corruption in Africa,” 2015.
Lange, Matthew K., “British Colonial Legacies and Political Development,”WorldDevelopment, 2004, 32 (6), 905 – 922.
Lee, Alexander and Kenneth A. Schultz, “Comparing British and French Colo-nial Legacies: A Discontinuity Analysis of Cameroon,” Quarterly Journal of Po-litical Science, 2012, 7 (4), 365–410.
Leeson, Peter T., “Endogenizing fractionalization,” Journal of Institutional Eco-nomics, June 2005, 1 (01), 75–98.
Lwanga-Lunyiigo, S., The Colonial Roots of Internal Conflict in Uganda, MakerereUniversity, Makerere Institute of Social Research, 1987.
33

Mamdani, Mahmood, Citizen and Subject: Contemporary Africa and the Legacyof Late Colonialism, Princeton, NewJersey: Princeton University Press, 1996.
, Political violence and state formation in post-colonial Africa, International De-velopment Centre, Open University, 2007.
Mann, K. and R. Roberts, Law in colonial Africa Social history of Africa, Heine-mann Educational Books, 1991.
Mauro, Paolo, “Corruption and Growth,” The Quarterly Journal of Economics,1995, 110 (3), 681–712.
Michalopoulos, Stelios and Elias Papaioannou, “The Long-Run Effects of theScramble for Africa,” Working Paper 17620, National Bureau of Economic Re-search November 2011.
and , “National Institutions and Subnational Development in Africa,” TheQuarterly Journal of Economics, 2013, 129 (1), 151–213.
and , “Pre-Colonial Ethnic Institutions and Contemporary African Develop-ment,” Econometrica, 2013, 81 (1), 113–152.
Migdal, Joel S, Strong societies and weak states: state-society relations and statecapabilities in the Third World, Princeton University Press, 1988.
Miguel, Edward and Mary Kay Gugerty, “Ethnic diversity, social sanctions,and public goods in Kenya,” Journal of Public Economics, December 2005, 89(11-12), 2325–2368.
Miles, W. F., Hausaland Divided: Colonialism and Independence in Nigeria andNiger, Ithaca and London: Cornell University Press, 1994.
Porta, Rafael La, Florencio Lopez de Silanes, and Andrei Shleifer, “TheEconomic Consequences of Legal Origins,” Journal of Economic Literature, 2008,46 (2), 285–332.
Voigtlander, Nico and Hans-Joachim Voth, “Persecution Perpetuated: TheMedieval Origins of Anti-Semitic Violence in Nazi Germany,” The Quarterly Jour-nal of Economics, 2012, 127 (3), 1339–1392.
Whittlesey, Derwent, “British and French colonial technique in west Africa,”Foreign Affairs, 1937, 15 (2), 362–373.
34

Appendix A Country details and robustness re-
gressions
Table A.4: Country details
Country (colonizer) Sample size Colony established* Nearest British/ French colony Dbri/Dfra (RD)∗∗
Benin (F) 1186 1892- 1900 Lagos (B port) / Cotonou (F port) 373 / 368 (1.01)Botswana (B) 675 1880 - 1885 South Africa / Antsiranana (F port) 863 / 3069 (0.28)Burkina Faso (F) 1000 1896 - 1919 Ghana / Mali 480 / 622 (0.77)Cote d’Ivoire (F) 2169 1886 - 1893 Ghana / Grand-Bassam (F port) 470 / 310 (1.52)Ghana (B) 2269 1821 - 1867 Cape Coast (B port) / Dakar (F port) 320 / 1908 (0.16)Guinea (F) 1004 1890 - 1898 Freetown (B port) / Conakry (F port) 336 / 319 (1.05)Kenya (B) 833 1888 - 1895 Mombasa (B port) / Antsiranana (F port) 514 / 1923 (0.27)Lesotho (B) 2069 1867 -1868 South Africa/ Antsiranana (F port) 360 / 3124 (0.12)Madagascar (F) 1126 1885 - 1896 South Africa / Antsiranana (F port) 2684 / 884 (3.04)Malawi(B) 732 1889 - 1891 Zimbabwe / Antsiranana (F port) 830 / 1675 (0.50)Mali(F) 2317 1890 - 1892 Ghana / Mauritania 1113 / 833 (1.33)Namibia(B) 1133 1915 -1915 Botswana / Congo 731 / 2441 (0.30)Niger (F) 2357 1895 - 1900 Lagos (B port) / Mali 1422 / 1436 (0.99)Nigeria (B) 2165 1879 - 1900 Lagos (B port)/ Dakar (F port) 641 / 2901 (0.22)Senegal (F) 1166 1850 - 1865 Freetown (B port) / Dakar (F port) 680 / 333 (2.04)Sierra Leone (B) 2142 1800- 1895 Freetown (B port) / Dakar (F port) 160 / 938 (0.17)Tanzania (B) 1071 1924 - 1924 Malawi / Madagascar 787 / 2004 (0.39)Togo (F) 918 1920 - 1920 Ghana / Benin 340 / 197 (1.73)Uganda (B) 871 1888 - 1894 Mombasa (B port) / Antsiranana (F port) 992 / 2420 (0.41)Zambia (B) 1132 1886 - 1890 Botswana / Antsiranana (F port) 1108 / 2403 (0.46)Zimbabwe (B) 1118 1885 - 1888 Botswana / Antsiranana (F port) 774 / 2302 (0.34)
* This column lists the periods during which control of each colony’s territory took place.
** RD ≡ Db
Df, where Db(Df ), denotes distance to nearest British (French) colony.
35

Table A.1: Results from OLS, probit and ordered logit models
Dependent variable Model Specification (1) (2) (3) (4)
National Identity Rank Ordered Logit -0.93∗∗
-0.92∗∗∗
-0.86∗∗∗
-0.88∗∗∗
(0.40) (0.29) (0.27) (0.27)
National Identity Binary OLS -0.26∗∗∗
-0.25∗∗∗
-0.24∗∗∗
-0.24∗∗∗
(0.09) (0.06) (0.06) (0.06)
National Identity Binary Probit -0.67∗∗∗
-0.66∗∗∗
-0.62∗∗∗
-0.63∗∗∗
(0.26) (0.18) (0.17) (0.17)Observations: 28967
Compliance Rank Ordered Logit -0.09 -0.04 -0.03 -0.08(0.22) (0.20) (0.20) (0.20)
Compliance Binary OLS -0.03 -0.02 -0.02 -0.03(0.06) (0.05) (0.05) (0.05)
Compliance Binary Probit -0.08 -0.05 -0.04 -0.07(0.15) (0.14) (0.13) (0.13)
Observations: 28079
Extortion Rank Ordered Logit 1.35∗∗∗
1.43∗∗∗
1.46∗∗∗
1.49∗∗∗
(0.43) (0.35) (0.35) (0.33)
Extortion Binary OLS 0.68∗∗∗
0.71∗∗∗
0.73∗∗∗
0.74∗∗∗
(0.21) (0.17) (0.17) (0.16)
Extortion Payment Binary Probit -0.67∗∗∗
-0.66∗∗∗
-0.62∗∗∗
-0.63∗∗∗
(0.26) (0.18) (0.17) (0.17)Observations: 28384
Location control Yes Yes Yes YesEthnic fraction and centralization control No Yes Yes YesFormer German colony control No No Yes YesIndividual control No No No YesNumber of country/ethnicity clusters: 21/316
This table reports estimated coefficients on Anglophone from alternative specifications. The first(second) column describes the dependent variables (regression models). The last four columns includealternative sets of controls in the regressions, which are listed in the bottom rows. Standard errors
clustered by country and ethnic group are in parentheses.∗
significant at 10%,∗∗
significant at 5%,∗∗∗
significant at 1%.
36

Table A.2: Results from IV regressions. The dependent variables are National Iden-tity Binary (Panel A), Compliance Binary (Panel B) and Extortion Payment Binary(Panel C).
Panel A: National Identity Binary
Anglophone -0.19∗
-0.19∗∗∗
-0.19∗∗∗
-0.19∗∗∗
(0.10) (0.07) (0.07) (0.06)
R-squared 0.05 0.08 0.09 0.09Observations 28967 - - -
Panel B: Tax Complaince Binary
Anglophone -0.04 -0.04 -0.04 -0.04(0.05) (0.04) (0.04) (0.04)
R-squared 0.02 0.03 0.03 0.03Observations 28079 - - -
Panel C: Extortion Payment Binary
Anglophone 0.12∗∗∗
0.12∗∗∗
0.12∗∗∗
0.12∗∗∗
(0.03) (0.02) (0.02) (0.02)
R-squared 0.02 0.03 0.03 0.03Observations 28384 - - -
Location control Yes Yes Yes YesEthnic fraction and centralization control No Yes Yes YesFormer German colony control No No Yes YesIndividual control No No No Yes
This table reports the IV regression results for three dependent variables. The listof control variables included in the regressions are provided below the coefficients.Standard errors clustered by countries and ethnic groups are in parenthesis.∗significant at 10%,
∗∗significant at 5%,
∗∗∗significant at 1%.
37

Table A.3: Results from regression discontinuity
National Identity Binary Compliance Binary Extortion Payment Binary
(1) (2) (3) (4) (5) (6)
Angolophone −0.18∗∗∗ −0.19
∗∗∗ −0.08∗∗∗ −0.08
∗∗∗0.09
∗∗∗0.09
∗∗∗
(0.03) (0.03) (0.03) (0.03) (0.02) (0.02)
Age −0.00 0.00 −0.00∗
(0.00) (0.00) (0.00)
Male 0.00 0.04∗∗∗
0.00(0.01) (0.01) (0.01)
Employment 0.01 −0.02 0.00(0.02) (0.02) (0.01)
Urban −0.02 0.03∗
0.00(0.02) (0.02) (0.01)
Education 0.01∗∗∗
0.01 0.00(0.00) (0.00) (0.00)
Wealth 0.07∗∗
0.03 0.08∗∗∗
(0.03) (0.03) (0.02)
Distance 0.49∗∗ −0.16 0.54
∗∗∗
(0.23) (0.24) (0.15)
Distance square −0.70 0.87 −1.27∗∗∗
(0.54) (0.57) (0.33)
Distance cube 0.39 −0.68∗
0.80∗∗∗
(0.36) (0.38) (0.21)
R-squared 0.19 0.19 0.08 0.09 0.10 0.11Observations 5749 5749 5600 5600 5517 5517
This table reports results from regression-discontinuity. The observations are drawn from respon-dents residing within 100 km from shared borders between Anglophone and Francophone countries.Fixed-effects for ethnic groups and border segments are included in the regressions. Robust stan-dard errors clustered by ethnic group are in parentheses.*** Significant at 1%, ** significant at 5%, * significant at 10%.
38

Appendix B Sources for determining the years of
colony establishment
Benin: Benin. Worldmark Encyclopedia of Nations. 2007. Encyclopedia.com
Botswana: Thomas Tlou & Alec Campbell, History of Botswana, 2nd edn. Gaborone:Macmillan. (1997)
Burkina Faso: [1] Klein, Martin A. Slavery and Colonial Rule in French WestAfrica. (1998) London: Cambridge University Press. [2] Lea, David; Rowe, Anna-marie.A Political Chronology of Africa (2001). Taylor & Francis.
Cote d’Ivore: Cote d’Ivore. Worldmark Encyclopedia of Nations. 2007. Encyclo-pedia.com
Ghana: James L. McLaughlin and David Owusu-Ansah. A Country Study: Ghana,Chapter 1: Historic Setting. Library of Congress Federal Research Division (Novem-ber 1994)
Guinea: Guinea. Worldmark Encyclopedia of Nations. 2007. Encyclopedia.com
Kenya: [1] The London Gazette: no. 25854. pp. 50175020. 7 September 1888. [2]Oxford Dictionary of National Biography September 2004. Oxford University Press.
Lesotho: Eldredge, EA A South African Kingdom: The pursuit of security in nineteenth-century Lesotho,1993, Cambridge University Press.
Madagascar: Helen Chapin. Library of Congress Country Studies: Madagascar.1994.Archived from the original on 1 February 2011.
Malawi: De Robeck, A Pictorial Essay of the 1898 Provisions of British CentralAfrica Nyasaland. Privately Published, N.P., 1982.
Mali: [1] Klein, Martin A. Slavery and Colonial Rule in French West Africa. (1998)London: Cambridge University Press. [2] Lea, David; Rowe, Annamarie. A PoliticalChronology of Africa (2001). Taylor & Francis.
Namibia: Namibia. Worldmark Encyclopedia of Nations. 2007. Encyclopedia.com
Niger: Niger. Worldmark Encyclopedia of Nations. 2007. Encyclopedia.com
Nigeria: [1] Helen Chapin Metz, ed. Nigeria: A Country Study. Washington: GPOfor the Library of Congress, 1991. [2] Temple, Charles Lindsay.Northern Nigeria.TheGeographical Journal(1912)40(2): 149163.
Senegal: [1] Chisholm, Hugh, ed. Faidherbe, Louis Lon Csar. Encyclopedia Britan-nica (11th ed.).(1911) Cambridge University Press. [2] Klein, M. (2007). France’s
39

African Colonies. In T. Benjamin (Ed.)Encyclopedia of Western Colonialism since1450, (Vol. 2). (pp. 493) Detroit: Macmillan Reference USA.
Sierra Leone: Christopher Fyfe, A History of Sierra Leone. London, 1962 :p 486
Tanzania: A Modern History of Tanganyika.Cambridge University Press, May 10,1979.
Togo: Togo. Worldmark Encyclopedia of Nations. 2007. Encyclopedia.com
Uganda: [1] The London Gazette: no. 25854. pp. 50175020. 7 September 1888.[2] Galbraith, John S, 1970,Italy, the British East Africa Company, and the BenadirCoast, 18881893, The Journal of Modern History 42. 4, pages 549-563
Zambia, Zimbabwe: E A Walter, (1963).The Cambridge History of the BritishEmpire: South Africa, Rhodesia and the High Commission Territories, CambridgeUniversiry Press.
40

CMI WORKING PAPERSThis series can be ordered from:
CMI (Chr. Michelsen Institute)Phone: +47 47 93 80 00 Fax: +47 47 93 80 01E-mail: [email protected]
P.O.Box 6033 Bedriftssenteret,N-5892 Bergen, NorwayVisiting address: Jekteviksbakken 31, Bergen
Web: www.cmi.no
Printed version: ISSN 0804-3639Electronic version: ISSN 1890-5048Printed version: ISBN 978-82-8062-573-0Electronic version: ISBN 978-82-8062-574-8
This paper is also available at:www.cmi.no/publications
I

Ethnicity has received increased attention in studies of Africa’s economic and institutional development. We present evidence on the long-term effects of Britain’s “divide-and-rule” colonial strategy that deliberately fostered ethnic rivalries to weaken and control locals. Using micro data from Sub-Saharan Africa, we find that citizens of Anglophone (as compared to Francophone) countries are more likely to: (1) attach greater importance to ethnic identity (vis-a-vis national identity); (2) have weaker norms against tax evasion; and (3) face extortion by non-state actors. We address endogeneity concerns using IV regression and regression-discontinuity. These results suggest that Britain’s divide-and-rule strategy may have undermined state-building.