Embed Size (px)
Citation preview

2016 DOE Solid-State Lighting R&D Workshop Feb. 2-4, 2016, Raleigh, NC
Panel: Lighting and Human Factors
Color Quality Issues – IES TM-30 and preferred color quality of lighting –
Yoshi Ohno (CIE President, IES Fellow, Ph.D.)
NIST Fellow, Sensor Science Division National Institute of Standards and Technology
Gaithersburg, Maryland USA
12016 DOE SSL R&D Workshop

Color Quality = CCT and CRI ?
CCT: Correlated Color Temperature (CIE 15, CIE S017 ILV) CRI: Color Rendering Index (CIE 13.3)
Some example This product is not acceptable.
CCT = 3050 K CRI (Ra)= 91
Why?
Too yellowish!
Duv
+
-
Normal
22016 DOE SSL R&D Workshop
CCT does not tell the whole story of chromaticity.

Color Quality = CCT and CRI ?
CCT=4000 K CCT=4000 K
CRI Ra=94 CRI Ra=78
CRI does not tell the whole story of This looks better
color rendering. (for most people)
32016 DOE SSL R&D Workshop

42016 DOE SSL R&D Workshop
• CRI is a color fidelity metric, based on Reference Illuminant. • Perception is different from color fidelity
Why perception differ from the CRI scores? CRI Ra=94
Plots of 15 CQS samples
Test light Red andon CIELAB green are(a*,b*) critical
The area Reference within such plots is called “gamut area”
CRI Ra=78
Looks better

52016 DOE SSL R&D Workshop
Ra=82Ra=82Ra=63 Ra=100 Ra=85 agree (CRI works okay) not agree
Color Gamut and Perception De-saturated Neutral (to someOver-saturated
limit)Looks poor Good Looks better
Perception and CRI Perception and CRI do
CRI test sample problem 8 test samples for Ra Saturated color samples
Ra=82
R9=-90
• Cannot catch the problems with saturated colors
• 8 samples are too few (it allows gaming)
62016 DOE SSL R&D Workshop

IES TM-30 IES Method for Evaluating Light Source Color Rendition
Two-metric system • Fidelity index Rf • Gamut index Rg
99 test samples
Latest color space and chromatic adaptation formula
Calculation tool
Improvement of CRI Ra
Information for preference
Works accurately for all colors of object
Provide details beyond Rf and Rg.
72016 DOE SSL R&D Workshop
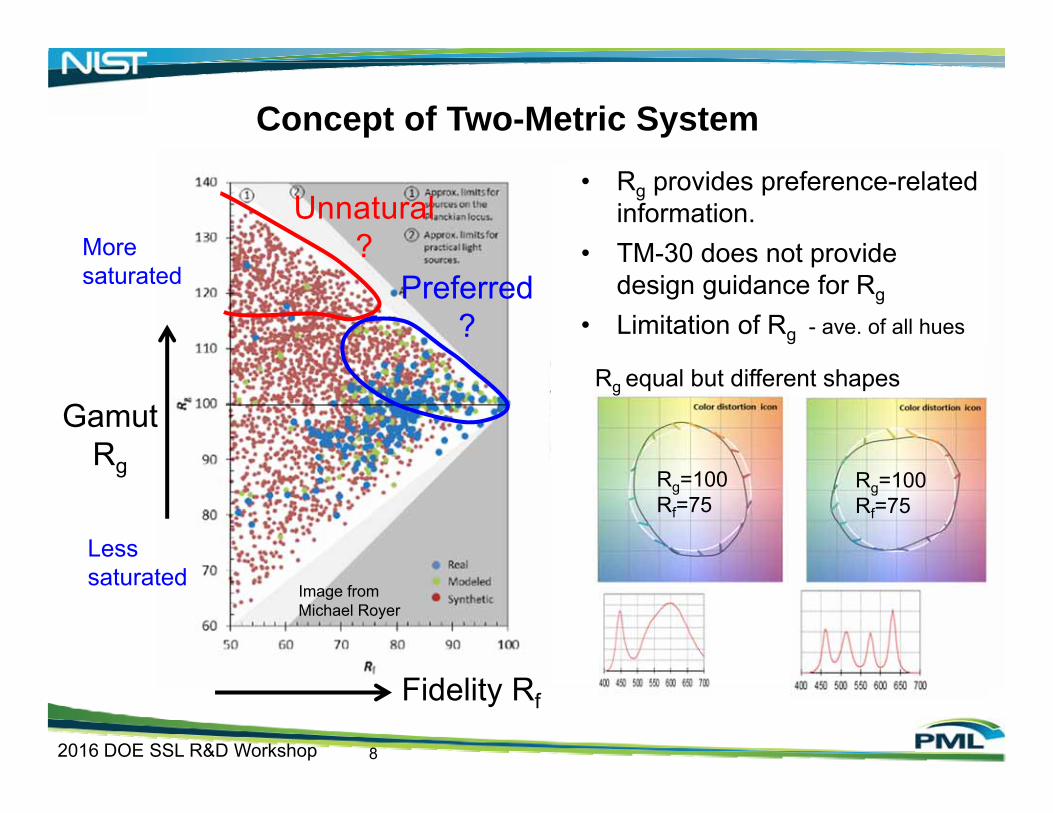
Concept of Two-Metric System
82016 DOE SSL R&D Workshop
Image from Michael Royer
Gamut Rg
Fidelity Rf
Preferred ?
Unnatural ?
• Rg provides preference-related information.
• TM-30 does not provide design guidance for Rg
• Limitation of Rg - ave. of all hues
Rg=100 Rf=75
Rg=100 Rf=75
Rg equal but different shapes
More saturated
Less saturated

Graphics for expert users Calculation Tool distributed with TM-30 purchase.
Rf-Rg Chart
Color Vector Graphic
Color Distortion Graphic
92016 DOE SSL R&D Workshop
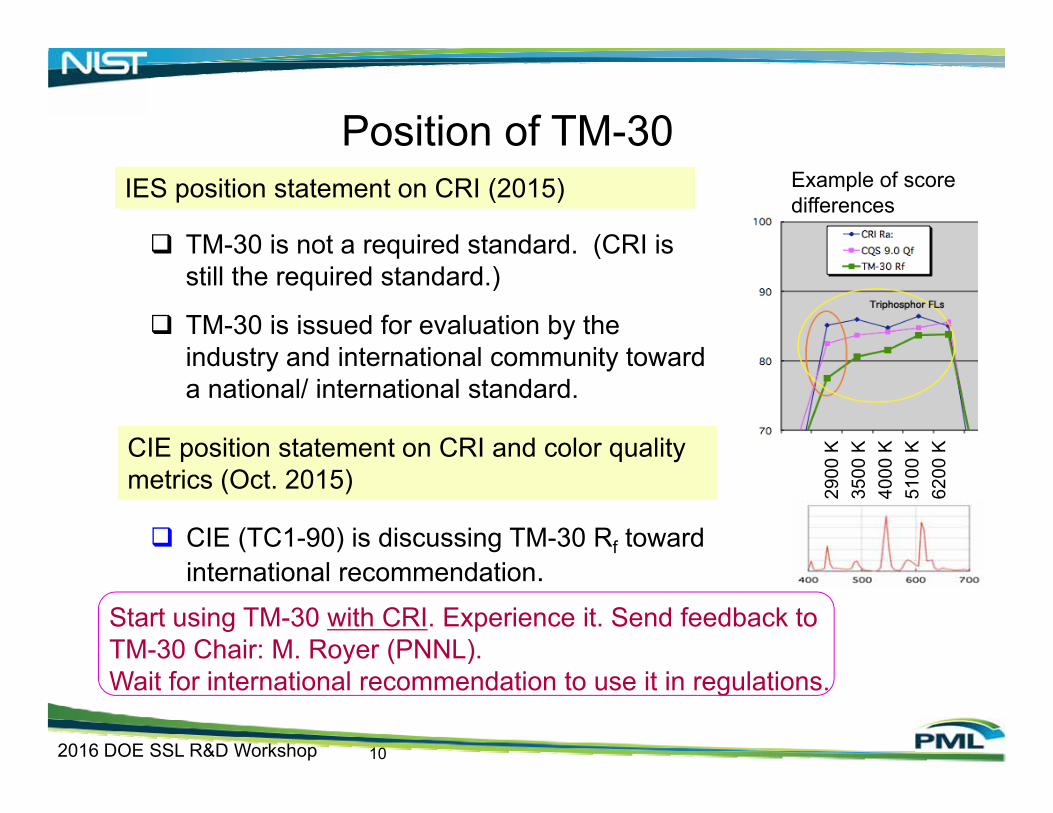
Position of TM-30 Example of score IES position statement on CRI (2015) differences
TM-30 is not a required standard. (CRI is still the required standard.)
TM-30 is issued for evaluation by the industry and international community toward a national/ international standard.
CIE position statement on CRI and color quality metrics (Oct. 2015) 29
00 K
3500
K40
00 K
5100
K62
00 K
CIE (TC1-90) is discussing TM-30 Rf toward international recommendation.
102016 DOE SSL R&D Workshop
Start using TM-30 with CRI. Experience it. Send feedback to TM-30 Chair: M. Royer (PNNL). Wait for international recommendation to use it in regulations.

112016 DOE SSL R&D Workshop
NIST Spectrally Tunable Lighting Facility

2014 Vision Experiment at NISTon preferred chroma saturation level
• 20 subjects • 3 CCTs (2700, 3500, 5000 K)
Duv= -0.015 (3500 K only) • Goal – develop a Color Preference scale
100
ab = 16
ab = -16
122016 DOE SSL R&D Workshop
Most de-saturated -80
-60
-40
-20
0
20
40
60
80
-80 -60 -40 -20 0 20 40 60 80
a*
CIELAB
b*
C*
C* Most saturated
132016 DOE SSL R&D Workshop
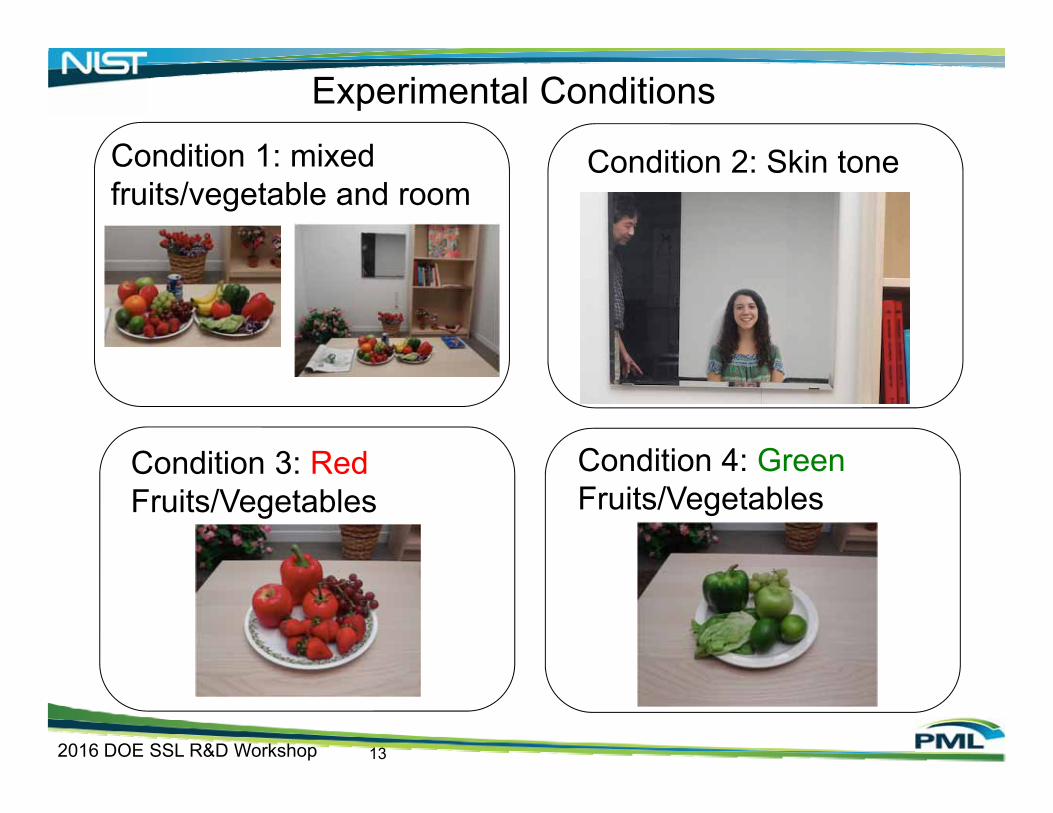
Experimental Conditions
Condition 1: mixed fruits/vegetable and room
Condition 2: Skin tone
Condition 3: Red Fruits/Vegetables
Condition 4: Green Fruits/Vegetables
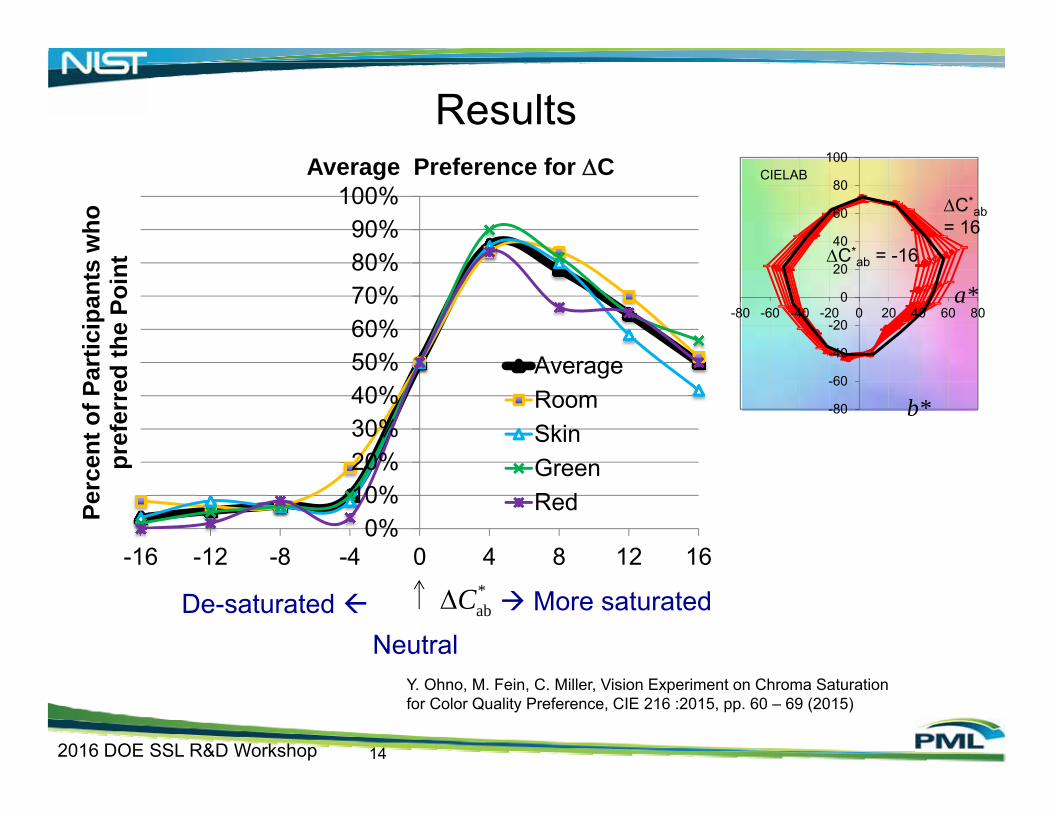
Results
0% 10% 20% 30% 40% 50% 60% 70% 80% 90%
100%
-16 -12 -8 -4 0 4 8 12 16
Perc
ent o
f Par
ticip
ants
who
pref
erre
d th
e Po
int
Average Preference for C
Average Room Skin Green Red
-80
-60
-40
-20
0
20
40
60
80
100
-80 -60 -40 -20 0 20 40 60 80 a*
CIELAB
b*
C* ab = -16
C* ab
= 16
*Cab More saturated Neutral
De-saturated
Y. Ohno, M. Fein, C. Miller, Vision Experiment on Chroma Saturation
142016 DOE SSL R&D Workshop
for Color Quality Preference, CIE 216 :2015, pp. 60 – 69 (2015)

Developing Color Preference Scale at NIST
Fidelity reference Illuminant
Preference reference Illuminant
SaturatedDe saturated
CRI Ra
General Color Preference scale
152016 DOE SSL R&D Workshop

162016 DOE SSL R&D Workshop
Chromaticity shift below Planckian Locus
People experience: Lights below Planckian locus look better.
Experiment on perceived white point by LRC (CR&A 2013)
Experiment on preferred lighting by NRC (LEUKOS 2014)
neodymium lamp

2013 Vision Experiment at NIST on Preferred and Acceptable level of Duv
• NIST STLF at ~ 300 lx. 6 Duv points at each CCT, • 18 subjects (20 to 70 yrs old) 4 CCTs,
• Viewed fruits/vegetables on the table,at total 23 points. his/her skin tone and the whole room.Total 50 spectra used.
• Adapted to each Duv point before
172016 DOE SSL R&D Workshop
judgement: which light is “more natural”.
Duv ≈ -0.015
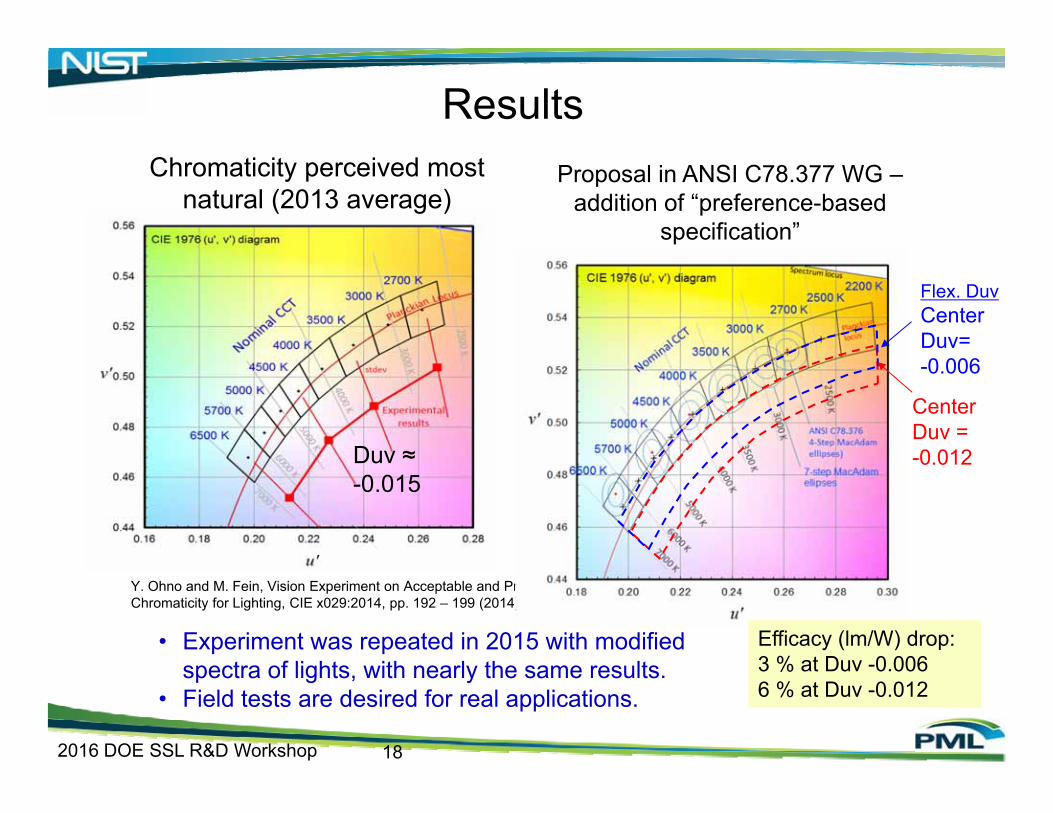
Results
Y. Ohno and M. Fein, Vision Experiment on Acceptable and Preferred White Light Chromaticity for Lighting, CIE x029:2014, pp. 192 – 199 (2014)
• Experiment was repeated in 2015 with modified spectra of lights, with nearly the same results.
Efficacy (lm/W) drop: 3 % at Duv -0.006 6 % at Duv -0.012
Chromaticity perceived most natural (2013 average)
Proposal in ANSI C78.377 WG – addition of “preference-based
specification”
Flex. Duv Center Duv= -0.006
Center Duv = -0.012
182016 DOE SSL R&D Workshop
• Field tests are desired for real applications.

Summary Color fidelity alone (as provided by CRI) is not sufficient for
perceived color quality.
TM-30 Rf (with possible modifications) to be an international recommendation by CIE.
Possibility of preferred lighting with Negative Duv sources Color-enhanced light sources These new features are penalized or not allowed in current
standards. Work in progress in ANSI and CIE.
Use of color fidelity and color preference metrics in the future.
We thank DOE for their support on NIST research on SSL metrology and color quality.
192016 DOE SSL R&D Workshop
Thank you for your attention!