Embed Size (px)
Citation preview

COLORADO
AIR QUALITY DATA REPORT
2000
Air Pollution Control Division APCD-TS-B1
4300 Cherry Creek Drive South Denver, Colorado 80246-1530
(303) 692-3100


The annual Air Quality Data Report provides the citizens of Colorado with a broad overview of the air quality picture of our state - and the picture is becoming clearer all the time. For the fifth consecutive year, no Federal air quality standards have been violated in Denver or in any front range community.
This report also allows us to demonstrate the striking improvements in air quality that have occurred
over the last decade. To see pollutant concentrations move steadily downward on graph after graph, or remain at levels well below Federal standards, shows that we have won many battles in the war on air pollution in Colorado.
While the good news is plentiful, old challenges remain. As areas of the state continue to experience
record population growth, the corresponding increases in vehicle traffic, residential and industrial construction, and demands for energy require us to continually review and refine our pollution control strategies so that we can protect our air. Reducing air pollution exposure in Colorado is a difficult task due to our altitude, topography and meteorology. The strategies that we select to reduce air pollution exposure may have significant socioeconomic impacts.
In 1997, the EPA announced some significant changes in air quality standards that present significant
new challenges to Colorado and the rest of the nation. These include a revised standard for ground-level ozone and a new standard for particulate matter that addresses “fine” particles that are 2.5 microns in diameter and smaller. This particle size fraction has been shown to have the greatest impact on our respiratory health while also contributing greatly to visibility problems. Ozone monitoring continues along the front range in areas of expected high concentration. Installation of a new network for monitoring PM2.5 statewide is now complete. “Speciation” samplers, as part of the PM2.5 network will be installed in 2001 to provide a chemical breakdown of the particles.
As always, we hope this annual report is a useful and informative document. Please let us know if you
have any comments or suggestions on how we may improve this report for 2001. Thank you for doing your part to improve our air quality in Colorado. Everyone counts and we all enjoy the benefits of cleaner, clearer skies both now and in the future.
Margie Perkins, Director Air Pollution Control Division

Cover photos (clockwise from upper left):
View of downtown Denver and foothills from web camera near Cheesman Park. (Image is available real-time at: http://apcd.state.co.us/)
PM10 particulate sampler.
Oxides of nitrogen analyzer.
Air toxics sampler.
PM2.5 particulate sampler.

i
TABLE OF CONTENTS TABLE OF CONTENTS......................................................................................................................................i-ii LIST OF FIGURES................................................................................................................................................ iii LIST OF TABLES ................................................................................................................................................. iv 1.0 INTRODUCTION
1.1 Purpose and Overview................................................................................................................ 1 1.2 Air Quality Standards ................................................................................................................ 1 1.3 Monitoring Locations and Objectives ....................................................................................... 3 1.4 Data Presented............................................................................................................................. 3
2.0 CARBON MONOXIDE
2.1 Physical Characteristics and Sources...................................................................................... 11 2.2 Standards ................................................................................................................................... 11 2.3 Health and Welfare Effects ...................................................................................................... 12 2.4 Monitoring ................................................................................................................................. 13 2.5 Data ............................................................................................................................................ 13 2.6 Summary.................................................................................................................................... 13 2.7 Historical Maximums and Trends for Colorado.................................................................... 16 2.8 Trends for the Nation ............................................................................................................... 17
3.0 OZONE
3.1 Physical Characteristics and Sources...................................................................................... 19 3.2 Health and Welfare Effects ...................................................................................................... 19 3.3 Standards ................................................................................................................................... 20 3.4 Monitoring ................................................................................................................................. 20 3.5 1-Hour Data ............................................................................................................................... 20 3.6 1-Hour Summary ...................................................................................................................... 21 3.7 1-Hour Colorado Historical Maximums ................................................................................. 24 3.8 1-Hour Trends for the Nation .................................................................................................. 24 3.9 The 8-Hour Ozone Standard.................................................................................................... 25 3.10 8-Hour Summary ...................................................................................................................... 26
4.0 NITROGEN DIOXIDE
4.1 Physical Characteristics and Sources...................................................................................... 27 4.2 Health and Welfare Effects ...................................................................................................... 27 4.3 Standards ................................................................................................................................... 28 4.4 Monitoring ................................................................................................................................. 28 4.5 Data ............................................................................................................................................ 28 4.6 Trends for Colorado and the Nation ....................................................................................... 29
5.0 SULFUR DIOXIDE
5.1 Physical Characteristics and Sources...................................................................................... 31 5.2 Health and Welfare Effects ...................................................................................................... 31 5.3 Standards ................................................................................................................................... 32 5.4 Monitoring ................................................................................................................................. 32 5.5 Data ............................................................................................................................................ 32 5.6 Trends in Colorado and the Nation......................................................................................... 33
ii
6.0 PARTICULATE MATTER (PM10) 6.1 Physical Characteristics and Sources...................................................................................... 35 6.2 Health and Welfare Effects ...................................................................................................... 36 6.3 PM10 Standards ......................................................................................................................... 36 6.4 Monitoring ................................................................................................................................. 36 6.5 PM10 Data................................................................................................................................... 37 6.6 PM10 Summary .......................................................................................................................... 37 6.7 PM10 Trends in the Nation........................................................................................................ 49
7.0 PARTICULATE MATTER (PM2.5)
7.1 Physical Characteristics and Sources...................................................................................... 51 7.2 PM2.5 Standards......................................................................................................................... 51 7.3 Monitoring and Data ................................................................................................................ 52 7.4 Nationwide PM2.5 Monitoring and Measurements................................................................. 53
8.0 LEAD
8.1 Physical Characteristics and Sources...................................................................................... 55 8.2 Health and Welfare Effects ...................................................................................................... 55 8.3 Standards ................................................................................................................................... 56 8.4 Monitoring ................................................................................................................................. 56 8.5 Data ............................................................................................................................................ 56 8.6 Trends in Colorado and the Nation......................................................................................... 58
9.0 NON-CRITERIA POLLUTANTS
9.10 Nitric Oxide, Physical Characteristics and Sources............................................................... 59 9.11 Monitoring and Data ................................................................................................................ 59 9.20 Total Suspended Particulate, Physical Characteristics and Sources.................................... 59 9.21 Health and Welfare Effects ...................................................................................................... 59 9.30 Sulfates, Physical Characteristics and Sources ...................................................................... 61 9.31 Health and Welfare Effects ...................................................................................................... 61 9.32 Monitoring and Data ................................................................................................................ 61
10.0 VISIBILITY
10.1 Physical Characteristics and Sources...................................................................................... 63 10.2 Health and Welfare Effects ...................................................................................................... 63 10.3 Standards ................................................................................................................................... 64 10.4 Monitoring ................................................................................................................................. 64 10.5 Data ............................................................................................................................................ 65 10.6 Summary.................................................................................................................................... 68
REFERENCES................................................................................................................................ 69 - 71

iii
LIST OF FIGURES Figure Title Page 1.1 Colorado Air Quality Monitors.................................................................................................................. 4 1.2 Denver Metropolitan Area Gaseous Monitors .......................................................................................... 5 2.1 National Emissions by Source Category - Carbon Monoxide ................................................................. 11 2.2 Carbon Monoxide Historical Comparisons....................................................................................... 14 - 16 3.1 1-Hour Ozone Historical Comparisons ............................................................................................... 22-23 4.1 National Emissions by Source Category – Nitrogen Dioxide.................................................................. 27 4.2 Nitrogen Dioxide Historical Comparisons............................................................................................... 29 5.1 National Emissions by Source Category - Sulfur Dioxide....................................................................... 31 5.2 Sulfur Dioxide Historical Comparisons ................................................................................................... 33 6.1 National Emissions by Source Category - PM10 ...................................................................................... 35 6.2 PM10 Historical Comparisons............................................................................................................ 41 - 49 7.1 National Emissions by Source Category - PM2.5...................................................................................... 51 8.1 National Emissions by Source Category - Lead....................................................................................... 55 8.2 Lead Historical Comparisons ................................................................................................................... 57 10.1 Denver Visibility Data ............................................................................................................................. 66 10.2 Fort Collins Visibility Data...................................................................................................................... 67

iv
LIST OF TABLES Table Title Page 1.1 National Ambient Air Quality Standards ................................................................................................... 2 1.2 Number of Monitors in Operation for 2000 .............................................................................................. 6 1.3 Monitors in Operation for 2000 ........................................................................................................... 7 - 9 1.4 Sites that had One or More Exceedance of Any Primary Standard in 2000 ............................................. 9 2.1 Estimated Health Effects Levels for Carbon Monoxide Exposure .......................................................... 12 2.2 2000 Carbon Monoxide Data Summary .................................................................................................. 13 2.3 Historical Maximum 1-Hour and 8-Hour Carbon Monoxide Concentrations in ppm ............................. 16 2.4 2000 National Ranking of Carbon Monoxide Monitors ......................................................................... 17 3.1 20001-Hour Ozone Data Summary.......................................................................................................... 21 3.2 Historical Maximum 1-Hour Ozone Concentration................................................................................. 24 3.3 2000 National Ranking of Ozone Monitors ............................................................................................ 25 3.4 2000 8-Hour Average Ozone - Data Summary ....................................................................................... 26 4.1 Estimated Health Effects Levels for Nitrogen Dioxide Exposure ........................................................... 28 4.2 2000 Nitrogen Dioxide Data Summary.................................................................................................... 28 4.3 2000 National Ranking of Nitrogen Dioxide Monitors .......................................................................... 30 5.1 Estimated Health Effects Levels for Sulfur Dioxide Exposure ............................................................... 32 5.2 2000 Sulfur Dioxide Data Summary........................................................................................................ 33 5.3 2000 National Ranking of Sulfur Dioxide Monitors ............................................................................... 34 6.1 2000 PM10 Data Summary ................................................................................................................ 39 - 41 6.2 2000 National Ranking of PM10 Monitors .............................................................................................. 49 7.1 2000 PM2.5 Data Summary....................................................................................................................... 52 7.2 2000 National Ranking of PM2.5 Monitors ............................................................................................. 53 8.1 2000 Lead Data Summary........................................................................................................................ 56 8.2 2000 National Ranking of Lead Monitors ............................................................................................... 58 9.1 2000 Nitric Oxide Data Summary............................................................................................................ 59 9.2 2000 Total Suspended Particulates Data Summary ................................................................................. 60 9.3 Statewide Historical Maximum TSP 24-hour Concentrations ................................................................. 60 9.4 2000 Sulfate Data Summary .................................................................................................................... 61 10.1 Denver Visibility Standard Exceedance Days ......................................................................................... 65 10.2 Fort Collins Visibility Standard Exceedance Days .................................................................................. 67

1
1.0 INTRODUCTION 1.1 Purpose and Overview
The Colorado Air Pollution Control Division publishes the Colorado Air Quality Data Report as a companion document to the Colorado Report to the Public. The Air Quality Data Report addresses changes in ambient air quality measured by Division monitors. The Report to the Public discusses the policies and programs designed to improve and protect Colorado's air quality.
The Air Quality Data Report is divided into chapters by pollutant or project. The first six chapters discuss those pollutants that have a national ambient air quality standard. These chapters contain: C A description of the physical characteristics and sources of the pollutant C The health and welfare effects of the pollutant C A description of the National Ambient Air Quality Standards (NAAQS) for the pollutant C Monitoring locations and objectives C Summary of 2000 data and comparisons to air quality standards C Historical comparison graphs C Trends in Colorado and the nation C Top five ranking monitors by maximum concentration of the pollutant in the nation and in Colorado
The remaining chapters discuss those pollutants that have no national standard and the special projects conducted by the Air Pollution Control Division. 1.2 Air Quality Standards
The United Sates Environmental Protection Agency (EPA) has established National Ambient Air Quality Standards for six pollutants known as "criteria" pollutants. They are carbon monoxide, ozone, nitrogen dioxide, sulfur dioxide, particulate matter and lead. In 1987, the EPA changed the particulate standard from total suspended particulate to a measurement of suspended particulate matter 10 microns in diameter and smaller (PM10). In 1997, the EPA revised the particulate matter standards to include particulate matter 2.5 microns in diameter and smaller (PM2.5). The ozone and PM10 standards were modified for concentration and averaging times. After a judicial challenge these modifications were withdrawn and the previous levels reinstated.
Table 1.1 lists the primary and secondary standards for each pollutant. The primary standards are "health effects standards”. These standards are set at levels to protect the health of the most susceptible individuals in the population: the very young, the very old and those with respiratory problems. The EPA has designed the secondary standards to protect public welfare. These are the "quality of life standards”. The levels of the secondary standards may be the same as the primary standards. All of the standards are expressed as concentration and duration of exposure. Many standards address both short- and long-term exposure. Consequently, one pollutant may have several primary standards.
The terms "violation" and "exceedance" of a standard, as used in this report, are not interchangeable. An exceedance is any single value greater than the standard. A violation occurs when the limits for both concentration and frequency of occurrence, as established in the Federal Clean Air Act and its amendments, are exceeded. The specifics for each standard are discussed in the appropriate chapters.

2
The Division also monitors for pollutants that do not have national standards established. These are the Anon-criteria@ pollutants. They include nitric oxide, total suspended particulates, cadmium, arsenic, sulfates and visibility. In addition, the Division monitors for the meteorological parameters of wind speed, wind direction, temperature and standard deviation of horizontal wind direction at 19 locations in the state.
Table 1.1
NATIONAL AMBIENT AIR QUALITY STANDARDS1
Pollutant
Averaging Time
Concentration Carbon Monoxide
Primary
1-hour*
35 ppm
Primary
8-hour*
9 ppm
Ozone**
Primary
1-hour*
0.12 ppm
Secondary
Same as primary
Nitrogen Dioxide
Primary
Annual arithmetic mean
0.053 ppm
Secondary
Same as primary
Sulfur Dioxide
Primary
Annual arithmetic mean
0.03 ppm
Primary
24-hour*
0.14 ppm
Secondary
3-hour*
0.5 ppm
Particulate (PM10)**
Primary
Annual arithmetic mean
50 µg/m3
Primary
24-hour
150 µg/m3
Particulate (PM2.5)**
Primary
Annual arithmetic mean
15 µg/m3
Primary
24-hour
65 µg/m3
Lead
Primary
Calendar quarter
1.5 µg/m3
* This concentration is not to be exceeded more than once per year. ** The 1997 8-hour ozone and PM2.5 standards and the modifications to the PM10 standard were withdrawn due to
legal challenges. The ozone and PM10 standards shown here are those that were in effect prior to the court challenges. The PM2.5 standard is the proposed standard.

3
1.3 Monitoring Locations and Objectives The objective of monitoring is to evaluate air quality to ensure the protection of public health
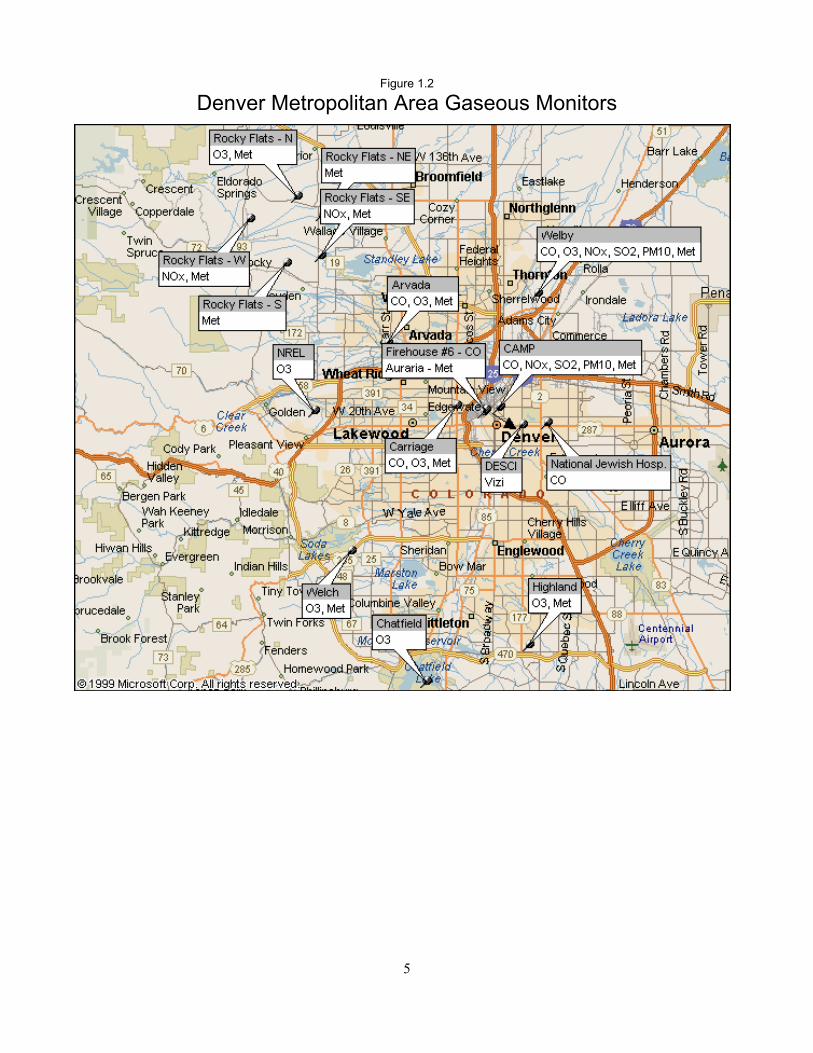
throughout the state. Air quality data are collected using two basic methods: continuous monitoring of gaseous pollutants and the periodic sampling of particulate pollutants. Table 1.2 shows the number of monitors by pollutant in operation during 2000. Table 1.3 gives the location and parameters measured at each monitoring site in operation during 2000. Air quality monitoring sites are chosen to address one or more of the following questions: C What and where are the highest concentrations of pollutants expected to occur? C What are the representative concentrations in areas of high population density? C What are the impacts of local sources on ambient pollution levels? C What is the general background level of each pollutant?
An example of a high concentration sampler is the carbon monoxide monitor at the Denver CAMP station. This monitor is located at 21st Street and Broadway in lower downtown. It measures carbon monoxide exposure to people who live and work in the Central Business District (CBD). Historically this monitor has recorded the highest carbon monoxide levels not only in Denver, but in the state. The high traffic volume in the CBD is the primary source of carbon monoxide in the area because the wintertime temperature inversions trap the carbon monoxide near the ground. The high concentrations are the product of both the traffic and the inversions.
An example of a representative concentration sampler is the carbon monoxide monitor at the Denver Carriage site. This monitor is in the center of a residential block between 23rd and 24th Avenues and Irving and Julian Streets. This location is away from major traffic corridors and industrial sources; the levels measured here represent the residential neighborhoods south of I-70 and west of the CBD.
Background monitoring has been conducted for many pollutants as well. The purpose of these monitors is to provide a base line to compare against local conditions. The Highland Reservoir site was established as a background carbon monoxide monitor for the Denver-metro area. However, the southern expansion of the Denver-metro area and development along the C-470 highway have changed the nature of the location and carbon monoxide monitoring was discontinued in 1997.
1.4 Data Presented
Data collected during 2000 are summarized in the tables at the beginning of each chapter. Historical data for the criteria pollutants are presented in the graphs in each chapter.
To be considered a valid indicator for the historical graphs, a site needs to be in operation for at least three years and have annual data recovery of 75 percent or more. Sites that do not meet the data recovery criteria in any year are considered "incomplete”. The Data Summary tables show incomplete data in parentheses ( ).
The Data Summary tables compare 2000 air quality monitoring data with all primary standards for each pollutant. Please refer to the Standards, Monitoring and Data sections of the text when interpreting the data in the tables. These sections contain specific information regarding changes in the monitoring network and explanations of the standards and attainment determinations.
The Historical Comparison graphs presented show changes in air quality data back to 1990. These graphs show trends for an area and a visual summary of previous years' data
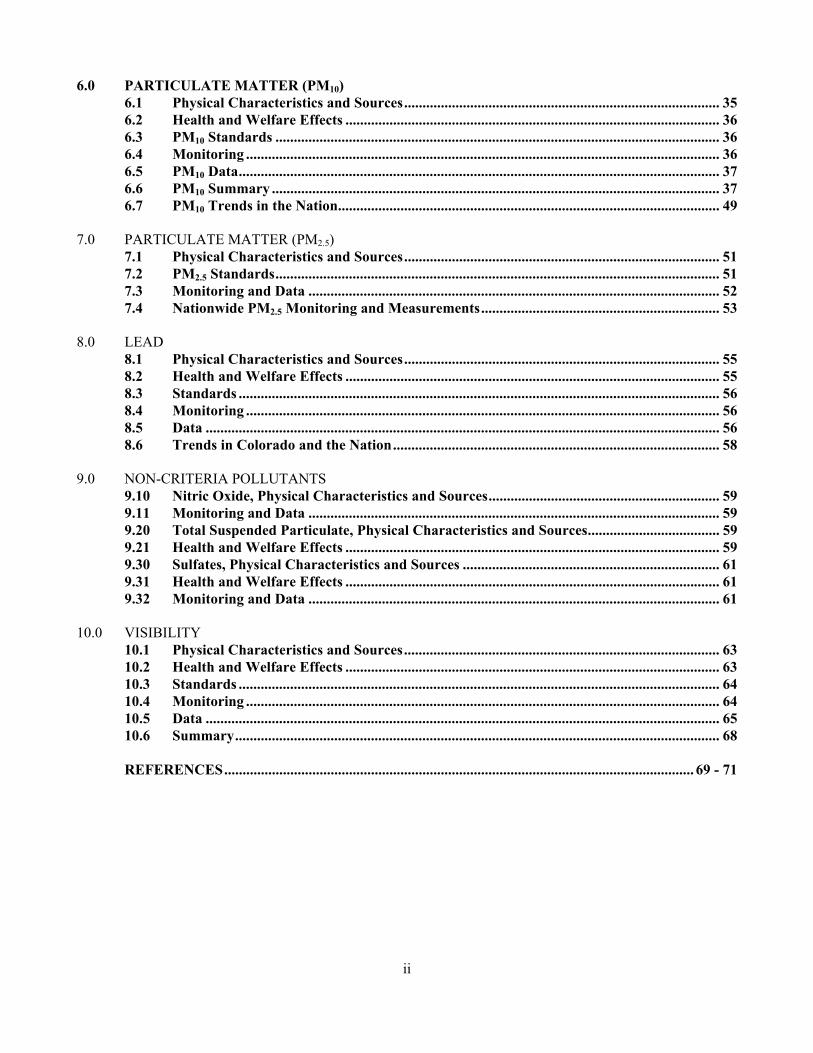
Figure 1.1 shows locations of air quality monitors outside of the Denver-metro area. Figure 1.2 shows the locations of continuous monitors within the Denver-metro counties. Table 1.4 shows those monitors that had one exceedance or more of any primary standard during 2000. This is not a listing of areas that are not in compliance with a standard. Compliance or non-compliance is a legal description that requires multiple years of data and action by both the state and federal agencies.

4
Figu
re 1
.1
Col
orad
o Ai
r Qua
lity
Mon
itors
5
Figure 1.2
Denver Metropolitan Area Gaseous Monitors

6
Table 1.2 NUMBER OF MONITORS IN OPERATION FOR 2000
Pollutant
Total
Carbon Monoxide (CO)
13
Sulfur Dioxide (SO2)
2
Nitrogen Dioxide (NO2)
4
Ozone (O3)
12
Wind Speed/Direction (MET)
19
Temperature (MET)
19
Particulate Matter <10 Microns (PM10)
51
Hourly PM10 Monitors
5
Fine Particulates (PM2.5)
20
Total Suspended Particulates (TSP)
11
Lead (Pb)
6
Arsenic and Cadmium (As and Cd)
2
Visibility (Viz)
2
7
Table 1.3
MONITORS IN OPERATION FOR 2000 X Monitors continued in 2000 + Monitors added during 2000 - Monitors discontinued during 2000 H Hourly PM10 County Site Name Location TSP Pb CO SO2 NOX O3 PM10 PM2.5 MET
Adams Adams City 4301 72nd Ave. X X X X
Globeville 5400 Washington St. X X
Brighton 22 4th Ave. X
Welby 78th Ave. & Steele St. X X X X X/H X
Alamosa Alamosa Adams State College X
Arapahoe Highland Res. 8100 S. University Blvd X X
Arapahoe Comm. College 6190 S. Santa Fe Dr. X
Archuleta Pagosa Springs 486 San Juan X + X
Boulder Boulder 2150 28th St. X
1405½ S. Foothills Rd X
2440 Pearl St. X X
Longmont 3rd Ave. & Kimbark Dr. X X
440 Main St. X
Hygiene 17024 Ute Hwy X
Delta Delta 560 Dodge St. X +
Hotchkiss 222 W. Bridge St. X
Paonia Middle School X
Denver Denver CAMP 2105 Broadway X X X X X X/H X X
Denver NJH 14th Ave. & Albion St. X
Denver Carriage 23rd Ave & Julian St. X X X
Denver Gates 1050 S. Broadway X X X
Visitor Center 225 W. Colfax Ave. X
DESCI Bldg (Viz) 1901 E. 13th Ave.
Fire House #6 1300 Blake St. X
Auraria Lot R Auraria Parkway X
Lowry AFB 8100 Lowry Blvd. +
Douglas Castle Rock 310 3rd St. X
Chatfield Res. Roxbourgh Pk Rd. X
Parker Library +
Eagle Vail 846 Forest Rd. X
Elbert Elbert Wright-Inghram Inst. X
El Paso Colorado I-25 & Uintah St. X
Springs 3730 Meadowlands X X
101 W. Costilla St. X X X X
USAFA Rd. 640 X
690 W. Hwy 24 X
Fremont Cañon City 7th Ave. & Macon St. X

8
Table 1.3 (Continued)
MONITORS IN OPERATION FOR 2000 X Monitors continued in 2000 + Monitors added during 2000 - Monitors discontinued during 2000 H Hourly PM10 County Site Name Location TSP Pb CO SO2 NOX O3 PM10 PM2.5 MET
Garfield Rifle 200 W. 3rd St. X
Parachute High School +
Glenwood Springs 806 Cooper St. X
Gunnison Crested Butte Colo. 135 & Whiterock X
Mt. Crested Butte Town Center X +
Gunnison 221 N. Wisconsin +
Jefferson Arvada W. 57th Ave & Garrison X X X
Welch 12400 W. Hwy 285 X X
NREL 20th Ave. & Quaker St. X
Rocky Flats 16600 W. Hwy 128 X X X X
11501 Indiana St. X X X
9901 Indiana St. X X X X
18000 W. Hwy 72 X X X
11190 N. Hwy 93 X X X X
Lake Leadville 510 Harrison St. X X
La Plata Durango 1060 2nd Ave. X
623 E. 5th St. X +
277 3rd Ave. X
Larimer Fort Collins 200 W. Oak St. X
708 S. Mason St. X X X
251 Edison St. X X
DMA (Viz)
Mesa Grand Junction 515 Paterson St. X X
12th St. & North Ave. X X/H X
Montrose Montrose 125 S. Townsend Rd. X
Olathe 327 4th St. X
Pitkin Aspen 420 Main St. X/H
Powers Lamar 100 2nd Ave. X
104 Parmenter St. X X
Pueblo Pueblo 211 D St. X X
Routt Steamboat 136 6th St. X X
Springs 137 10th St. X
San Telluride 333 W. Colorado Ave. X/H +
Miguel Coonskin Parking Lot X
Summit Breckenridge County Justice Center X
Silverthorne 151 4th St. -
430 Rainbow Dr. +

9
Table 1.3 (Continued)
MONITORS IN OPERATION FOR 2000 X Monitors continued in 2000 + Monitors added during 2000 - Monitors discontinued during 2000 H Hourly PM10 County Site Name Location TSP Pb CO SO2 NOX O3 PM10 PM2.5 MET
Teller Cripple Creek 209 E. Bennet Ave. X
Warren Ave. & 2nd St. X
Weld Greeley 811 15th Ave. X X
1516 Hospital Rd. X X
Platteville Platteville School X
Table 1.4
SITES WITH ONE OR MORE EXCEEDANCE OF ANY PRIMARY STANDARD IN 2000
County
Site Name
Location
PM10
Adams
Adams City
4301 E. 72nd Ave
X

10

11
2.0 CARBON MONOXIDE 2.1 Physical Characteristics and Sources
Carbon monoxide is a colorless, odorless and tasteless gas. It is the largest single fraction of pollutants found in urban atmospheres. It is produced primarily during the incomplete combustion of organic fuels used for transportation and heating. Carbon monoxide is also created during refuse and agricultural burning and as a by-product from some industrial processes.2
In Denver, the Division estimates that 86 percent of the carbon monoxide emissions are from automotive sources. An estimated three percent of Denver's carbon monoxide emissions are from woodburning stoves and fireplaces. The remainder originates from aircraft, locomotives, construction equipment, power plants and space heating.3 These numbers are similar to the nationwide emissions shown in Figure 2.1.4
In Denver, the daily concentration peaks are generally just after morning and evening rush hours. The worst problems occur where slow-moving cars congregate, such as in large parking lots or traffic jams. Carbon monoxide can temporarily accumulate to harmful levels in calm weather during autumn and winter. The problem is more severe in winter because cold weather makes motor vehicles run less efficiently and woodburning emissions from space heating are increased. In addition, on winter nights, a strong temperature inversion may develop near the ground, trapping pollutants.2 2.2 Standards
The EPA has developed two national standards for carbon monoxide. They are 35 ppm averaged over a 1-hour period and 9 ppm averaged over an 8-hour period. These values are not to be exceeded more than once
Figure 2.1

12
in a given year at any given location. A location will violate the standard with a second exceedance of either standard in a calendar year. The EPA directive requires that comparison with the carbon monoxide standards will be made in integers. Fractions of 0.5 or greater are rounded up. Thus, actual concentrations of 9.5 ppm and 35.5 ppm or greater are necessary to exceed the 8-hour and 1-hour standards, respectively.5 2.3 Health and Welfare Effects
Carbon monoxide affects the central nervous system by depriving the body of oxygen. It enters the body through the lungs, where it combines with hemoglobin in the red blood cells. Normally, hemoglobin carries oxygen from the lungs to the cells. The oxygen attached to the hemoglobin is exchanged for the carbon dioxide generated by the cell=s metabolism. The carbon dioxide is then carried back to the lungs where it is exhaled it from the body. Hemoglobin binds approximately 240 times more readily with carbon monoxide than with oxygen. In the presence of carbon monoxide the distribution of oxygen is reduced throughout the body. Blood laden with carbon monoxide can weaken heart contractions with the result of lowering the volume of blood distributed to the body. It can significantly reduce a healthy person's ability to do manual tasks, such as working, jogging and walking. A life-threatening situation can exist for patients with heart disease when these people are unable to compensate for the oxygen loss by increasing the heart rate.2
The EPA has concluded that the following groups may be particularly sensitive to carbon monoxide exposures: angina patients, individuals with other types of cardiovascular disease, persons with chronic obstructive pulmonary disease, anemic individuals, fetuses and pregnant women. Concern also exists for healthy children because of increased oxygen requirements that result from their higher metabolic rate.2
Carbon monoxide is exhausted from the body at varying rates, depending on physiological and external factors. The general guideline is that 20 to 40 percent is lost from the system after 2 to 3 hours following exposure.1 Because it takes time to remove it from the blood stream, the severity of health effects depends on both the concentration and the length of exposure. Table 2.1 displays the relationship between health effects and exposure to carbon monoxide.
Table 2.1
ESTIMATED HEALTH EFFECTS LEVELS FOR CARBON MONOXIDE EXPOSURE2
Effects
Carboxyhemoglobin
Concentration
Exposure Duration
1-Hour 8-Hour Physiological normal
0.3 to 0.7%
0 ppm
0 ppm
Possible aggravation of angina pectoris, decreased exercise capacity in angina patients and individuals with peripheral arteriosclerosis and/or atherosclerosis.
3.0%
29 to 85
6 to 18
Decreased exercise capacity in both impaired and normal subjects. Impairment of vigilance tasks in healthy experimental subjects.
3.0 to 6.5%
85 to 207
18 to 45
Linear relationship between COHb and decreasing maximal oxygen consumption during strenuous exercise in young, healthy people.
5.0 to 20%
155 to 175
33 to 170

13
2.4 Monitoring Carbon monoxide was monitored at 13 long-term locations in 2000. The monitoring locations, number
of days sampled, as well as the maximum and second maximum, 1-hour and 8-hour averages for 2000 are shown in Table 2.2. 2.5 Data
Where it is available, the historical trend graphs for this report show 10 years of monitored data. Figure 2.3 displays box plots of the 8-hour percentiles. Only sites with three or more years of data are presented in graphs. 2.6 Summary
Nine of the 13 currently operating monitors have been in operation for the past 10 years. These nine monitors have shown a significant decline in their second maximum 8-hour average concentrations. The average decline in second maximum values statewide for the past 10 years is about 4.4 percent per year. The decline in values in the Denver-metro area is even greater at 4.7 percent per year for the past 10 years. There are several reasons for this decline in carbon monoxide values. They include decreases in automotive emissions and increases in public awareness and actions to help alleviate the problem. The result is that for the fourth consecutive year the Denver-metro area did not violate the 8-hour standard.
Table 2.2
2000 CARBON MONOXIDE DATA SUMMARY
Standards 1-hour - 35 ppm * 8-hour - 9 ppm **
1-Hour 8-Hour County Location
No. of Days
Sampled Maximum
ppm 2nd Max
ppm Maximum
ppm 2nd Max
ppm
Adams Welby, 78th Ave. & Steele St. 361 4.3 4.3 3.0 2.9
Boulder Longmont, 440 Main St. 362 6.2 4.5 3.4 3.1
Boulder, 2150 28th St. 363 10.0 9.6 6.8 4.3
Denver Denver CAMP, 2105 Broadway 228 17.1 12.8 8.5 5.4
Denver NJH, 14th Ave. & Albion St. 364 8.7 7.6 4.8 4.7
Denver Carriage, 23rd Ave. & Julian St. 360 5.8 5.6 4.1 3.4
Denver Fire House #6, 1300 Blake St. 363 9.3 8.6 5.0 4.6
Jefferson Arvada, 57th Ave. & Garrison St. 356 7.1 6.2 3.9 3.8
El Paso Colorado Springs, 690 W. Hwy 24 364 8.5 8.2 5.1 4.2
Colorado Springs, I-25 & Uintah Ave. 362 5.9 5.8 3.1 3.0
Larimer Fort Collins, 708 S. Mason St. 363 9.6 7.5 4.0 3.8 Weld Greeley, 811 15th St. 363 7.0 6.6 4.6 3.8
Mesa Grand Junction, 12th St. & North Ave. 364 6.9 6.8 4.4 4.1
* Due to mathematical rounding, a value of 35.5 ppm or greater is necessary to exceed the standard. ** Due to mathematical rounding a value of 9.5 ppm or greater is necessary to exceed the standard. () Less than 75 percent data recovery.

14
Figure 2.2
CARBON MONOXIDE HISTORICAL COMPARISONS

15
Figure 2.2 (Continued) CARBON MONOXIDE HISTORICAL COMPARISONS

16
Figure 2.2 (Continued)
CARBON MONOXIDE HISTORICAL COMPARISONS
2.7 Historical Maximums and Trends for Colorado
Carbon monoxide levels have dropped dramatically in the Denver-metro area since the late 1960s. Table 2.3 shows that years with 100 or more exceedances of the 8-hour standard were common before 1976. Until the early 1980s, 8-hour concentrations of three times the level of the standard were common for the Denver CAMP monitor. In 2000, the maximum 8-hour concentration at the CAMP monitor was 8.5 ppm. In comparison, in 1966, there were 367 exceedance periods of the 8-hour standard. In 1996, 1997, 1998 and 2000 there were none. In 1999 an exceedance of the 8-hour standard was recorded at the Firehouse #6 monitor. The number of exceedances for the 1-hour standard has declined from 21 periods per year in 1973 to zero since 1990. The 1-hour yearly maximum levels have declined from more than twice the standard in the late 1960s to less than one half of the standard in 2000.
Table 2.3
HISTORICAL MAXIMUM 1-HOUR AND 8-HOUR CARBON MONOXIDE CONCENTRATIONS IN PPM6
1-Hour ppm
Location
Date
Annual
Exceedances Periods
8-Hour ppm
Location
Date
Annual
Exceedances Periods
79.0
CAMP
11-20-68
13
48.1
CAMP
12-21-73
133
70.0
CAMP
11-21-74
15
33.9
CAMP
12-28-65
197
67.0
CAMP
12-21-73
21
33.4
CAMP
12-04-81
42
65.0
CAMP
12-21-73
21
33.2
CAMP
12-23-71
188
64.9
NJH-W
11-16-79
15
33.1
CAMP
11-20-68
98

17
2.8 Trends for the Nation According to the National Air Quality and Emissions Trends Report, 1999, “Nationally, CO
concentrations decreased 36 percent during the past ten years as measured by the composite average of the annual second highest 8-hour concentration. Between 1998 and 1999, national composite average CO concentrations decreased 3 percent. Nationally, the 1999 composite average 8-hour ambient CO concentration is the lowest level recorded during the past 10 years. Nationally, carbon monoxide levels for 1999 are the lowest in the past 20 years and the air quality improvement is consistent across all regions of the country”.4
In 2000 there were ten monitors in the nation that exceeded the 8-hour standard, but only two monitors that exceeded the standard two or more times. In 1996 there were 22 monitors that exceeded the 8-hour standard and nine exceeded the standard two or more times.6
Table 2.4 lists the five highest 8-hour carbon monoxide concentrations in the nation and the state of Colorado.
Table 2.4
2000 NATIONAL RANKING OF CARBON MONOXIDE BY MAXIMUM 8-HOUR CONCENTRATION IN PPM6
Nationwide (512 Monitors)
Colorado (13 Monitors)
National Rank
City/Area
Max ppm
2nd
Max ppm
#
>9.5 ppm
Nat=l Rank
City/Area
Max ppm
2nd
Max ppm
#
>9.5 ppm
1 Calexico, CA 15.5 9.2 7 13 Denver CAMP 8.5 5.4 0
2 El Paso, TX 12.3 9.2 1 31 Boulder 6.8 4.3 0
3 Fairbanks, AK 11.5 8.9 1 100 Colo. Spgs, 690 Hwy 24 5.1 4.2 0
4 Weirton, WV 11.0 7.9 1 109 Denver Firehouse #6 5.0 4.6 0
5 Lynwood, CA 10.1 9.9 2 124 Denver NJH-E 4.8 4.7 0

18

19
3.0 OZONE 3.1 Physical Characteristics and Sources
Ozone is a highly reactive form of oxygen. At very high concentrations it is a blue, unstable gas with a characteristic pungent odor often associated with arcing electric motors, lightning storms or other electrical discharges.7 However, at ambient concentrations, ozone is colorless and odorless. Ozone concentrations at remote locations, such as the Western National Air Pollution Background Network, range from 0.02 to 0.04 ppm year-round.8
At ground level, ozone is a pollutant. Although chemically identical, ground level ozone should not be confused with the stratospheric ozone layer. The stratospheric ozone layer is found between 12 and 30 miles above the earth's surface and shields the earth from intense, cancer-causing ultraviolet radiation. Concentrations of ozone in this layer are approximately 10 to 12 ppm or more than 100 times the National Ambient Air Quality Standard for ozone. Occasionally, meteorological conditions result in stratospheric ozone being brought to ground level and this can increase concentrations by 0.05 to 0.10 ppm. This stratospheric intrusion has caused concentrations higher than the 0.12 ppm standard.8
Ozone is not emitted directly from a source as are other pollutants, but forms as a secondary pollutant. Its precursors are certain reactive hydrocarbons and nitrogen oxides, which react chemically in sunlight to form ozone. The sources for these reactive hydrocarbons are automobile exhaust, gasoline, oil storage and transfer facilities, industrial paint solvents, degreasing agents, cleaning fluids and ink solvents. High temperature combustion combines nitrogen and oxygen in the air to form oxides of nitrogen. Vegetation can also emit reactive hydrocarbons such as terpenes from pine trees, for example.
Ozone production is a year-round phenomenon. However, the highest ozone levels generally occur during the summer season when the sunlight is more intense and the meteorological conditions are more stagnant. This combination can cause reactive pollutants to remain together in an area for several days. Ozone produced under these summer stagnant conditions remains as a coherent air mass and can be transported many miles from its point of origin. 3.2 Health and Welfare Effects
Short-term exposures (1 to 3 hours) to ambient ozone concentrations have been linked to increased hospital admissions and emergency room visits for respiratory causes. Repeated exposures to ozone can make people more susceptible to respiratory infection and lung inflammation and can aggravate preexisting respiratory diseases such as asthma. Other health effects attributed to short-term exposures to ozone, generally while individuals are engaged in moderate or heavy exertion, include significant decrease in lung function and increased respiratory symptoms such as chest pain and coughing. Children that are active outdoors during the summer when ozone levels are highest are most at risk of experiencing such effects. Other at-risk groups include outdoor workers, individuals with preexisting respiratory disease such as asthma and chronic obstructive lung disease and individuals who are unusually responsive to ozone. Recent studies have attributed these same health effects to prolonged exposures (6 to 8 hours) at relatively low ozone levels during periods of moderate exertion. In addition, long-term exposure to ozone presents the possibility of irreversible changes in the lungs that could lead to premature aging of the lungs and/or chronic respiratory illnesses.8
The recently completed review of the ozone standard (by the EPA and others) also highlighted concerns with ozone effects on vegetation for which the 1-hour ozone standard did not provide adequate protection. These effects can include reduction in agricultural and commercial forest yields, reduced growth and decreased
20
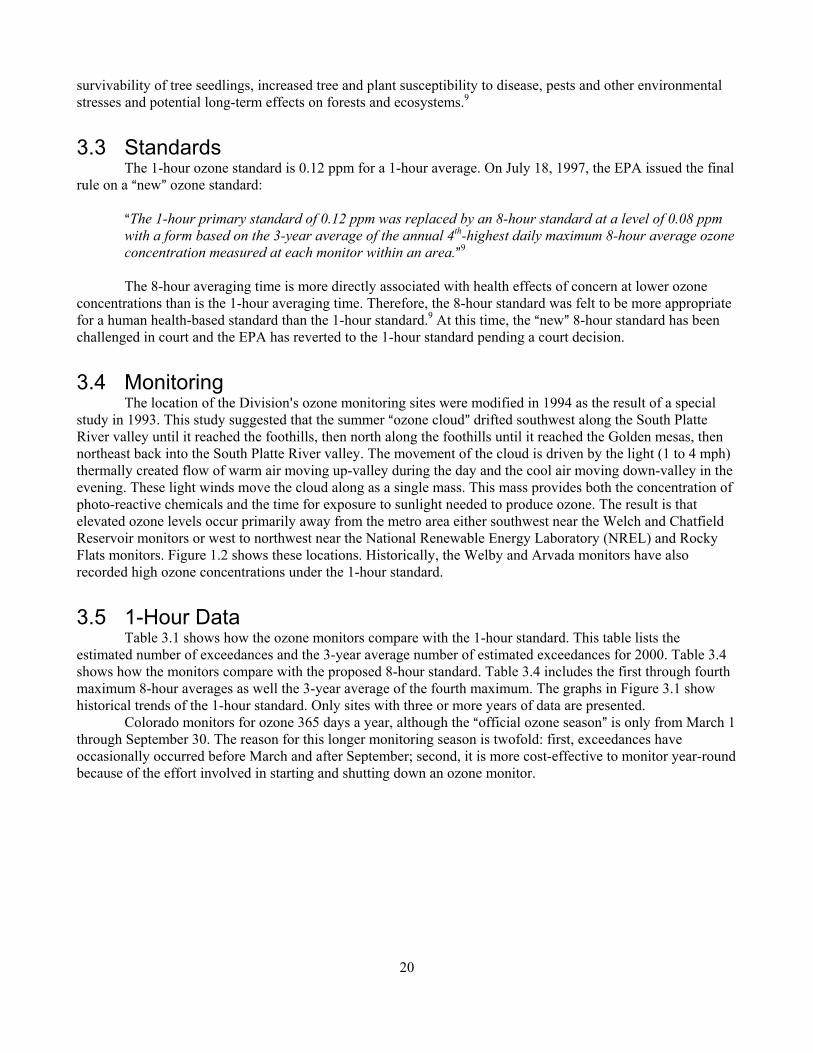
survivability of tree seedlings, increased tree and plant susceptibility to disease, pests and other environmental stresses and potential long-term effects on forests and ecosystems.9 3.3 Standards
The 1-hour ozone standard is 0.12 ppm for a 1-hour average. On July 18, 1997, the EPA issued the final rule on a Anew@ ozone standard:
AThe 1-hour primary standard of 0.12 ppm was replaced by an 8-hour standard at a level of 0.08 ppm with a form based on the 3-year average of the annual 4th-highest daily maximum 8-hour average ozone concentration measured at each monitor within an area.@9
The 8-hour averaging time is more directly associated with health effects of concern at lower ozone
concentrations than is the 1-hour averaging time. Therefore, the 8-hour standard was felt to be more appropriate for a human health-based standard than the 1-hour standard.9 At this time, the Anew@ 8-hour standard has been challenged in court and the EPA has reverted to the 1-hour standard pending a court decision. 3.4 Monitoring
The location of the Division=s ozone monitoring sites were modified in 1994 as the result of a special study in 1993. This study suggested that the summer Aozone cloud@ drifted southwest along the South Platte River valley until it reached the foothills, then north along the foothills until it reached the Golden mesas, then northeast back into the South Platte River valley. The movement of the cloud is driven by the light (1 to 4 mph) thermally created flow of warm air moving up-valley during the day and the cool air moving down-valley in the evening. These light winds move the cloud along as a single mass. This mass provides both the concentration of photo-reactive chemicals and the time for exposure to sunlight needed to produce ozone. The result is that elevated ozone levels occur primarily away from the metro area either southwest near the Welch and Chatfield Reservoir monitors or west to northwest near the National Renewable Energy Laboratory (NREL) and Rocky Flats monitors. Figure 1.2 shows these locations. Historically, the Welby and Arvada monitors have also recorded high ozone concentrations under the 1-hour standard. 3.5 1-Hour Data
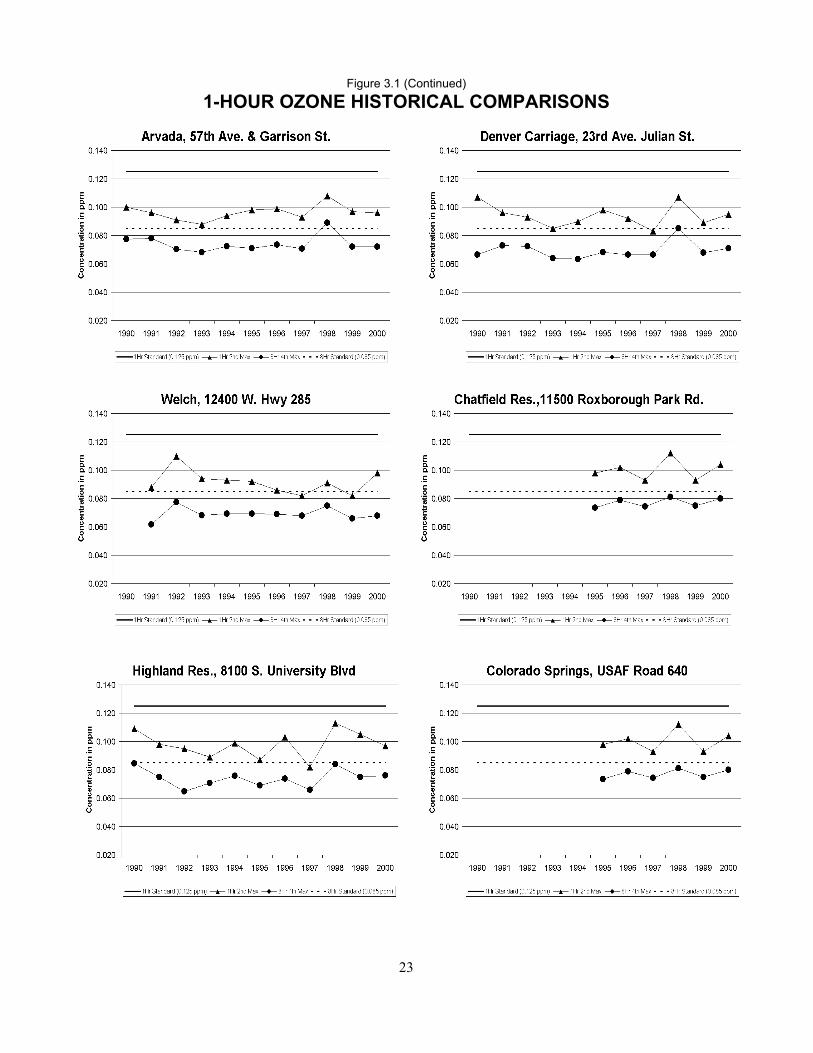
Table 3.1 shows how the ozone monitors compare with the 1-hour standard. This table lists the estimated number of exceedances and the 3-year average number of estimated exceedances for 2000. Table 3.4 shows how the monitors compare with the proposed 8-hour standard. Table 3.4 includes the first through fourth maximum 8-hour averages as well the 3-year average of the fourth maximum. The graphs in Figure 3.1 show historical trends of the 1-hour standard. Only sites with three or more years of data are presented.
Colorado monitors for ozone 365 days a year, although the Aofficial ozone season@ is only from March 1 through September 30. The reason for this longer monitoring season is twofold: first, exceedances have occasionally occurred before March and after September; second, it is more cost-effective to monitor year-round because of the effort involved in starting and shutting down an ozone monitor.

21
3.6 1-Hour Summary No monitor in the system has recorded more than one exceedance per year of the 1-hour standard in the
past ten years. Only the Chatfield Reservoir monitor has recorded an exceedance of the 1-hour standard in the past three years: 0.132 ppm on July 2, 1998. Any future exceedances of the ozone standard in Colorado will likely remain confined to the area downwind of Denver. The remainder of the state is expected to remain in compliance with the 1-hour standard for ozone.
Table 3.1
2000 1-HOUR OZONE DATA SUMMARY
Annual Exceedances County
Location Estimated
for 2000 3-year
Average
No. of Days
Sampled
Max ppm
2nd Max ppm
Adams Welby, 78th Ave. & Steele St. 0.0 0.0 359 0.080 0.076
Arapahoe Highland Reservoir 0.0 0.0 363 0.111 0.097
Boulder Boulder, 14022 Foothills Rd. 0.0 0.0 359 0.099 0.090
Denver Carriage, 23rd Ave. & Julian St. 0.0 0.0 343 0.098 0.095
Douglas Chatfield Reservoir 0.0 0.0 204 0.106 0.104
Jefferson Arvada, 57th Ave. & Garrison St. 0.0 0.0 361 0.102 0.096
NREL, 20th Ave. & Quaker St. 0.0 0.0 361 0.118 0.107
Welch, 12400 W. Hwy. 285 0.0 0.0 353 0.098 0.087
Rocky Flats, 16600 Hwy. 128 0.0 0.0 362 0.103 0.097
El Paso USAF Academy , Rd 640 0.0 0.0 357 0.088 0.088
Larimer Fort Collins, 708 S. Mason St. 0.0 0.0 351 0.095 0.090
Weld Greeley, 811 15th Ave. 0.0 0.0 353 0.093 0.093

22
Figure 3.1
1-HOUR OZONE HISTORICAL COMPARISONS
23
Figure 3.1 (Continued)
1-HOUR OZONE HISTORICAL COMPARISONS

24
3.7 1-Hour Colorado Historical Maximums Table 3.2 lists the five highest 1-hour ozone concentrations recorded in Colorado. Ozone monitoring
began in 1972 at the Denver CAMP station and eight exceedances of the standard were recorded that year. However, data before 1975 is not included in Table 3.2 because quality assurance and maintenance records are no longer available; in addition, a review of the ozone data before 1975 shows several values that are questionable because of time of day, time of year and inconsistencies with other monitors in the area.
Table 3.2
HISTORICAL MAXIMUM 1-HOUR OZONE CONCENTRATIONS10
1-Hour ppm Monitor
Date
0.223
Welby
March 3, 1978
0.197
Arvada
July 28, 1975
0.186
Children’s Asthmatic Research Institute and Hospital, 23rd Ave. & Julian St.
September 17, 1976
0.184
Arvada
June 30, 1976
0.182
Welby
August 5, 1975
3.8 1-Hour Trends for the Nation
According to the National Air Quality and Emissions Trends Report, 1999, “Over the last 20 years ozone levels have improved considerably nationwide. The rate of improvement, however, appears to have slowed recently. Some parts of the country show increases in ozone levels over the past 10 years, due largely to increased oxide of nitrogen emissions and weather conditions favorable to ozone formation”. 8
From 1980 to 1999, national 1-hour ozone levels improved 20 percent with 1980, 1983, 1988, and 1995 representing peak years for this pollutant. More recently, national 1-hour ozone levels have continued to improve but the progress has been less rapid evidenced by the 4 percent decrease from 1990 – 1999.8
The reductions in ozone levels do not affect all environments equally. Although the general pattern of ozone trends is similar across all environments, the magnitudes of the reductions differ. The decline varies from 21 percent for suburban and urban sites to 16 percent for rural sites during the period from 1988 to 1997.8
Table 3.3 lists the first five ozone monitors ranked by their maximum 1-hour concentrations and the national ranking for the top five Colorado ozone monitors. Colorado monitors have not ranked in the top 200 in the past seven years.

25
Table 3.3
2000 NATIONAL RANKING OF OZONE MONITORS BY MAXIMUM CONCENTRATIONS IN PPM11
Nationwide ( 1,052 Monitors)
Colorado ( 13 Monitors )
National
Rank
City/Area
Max ppm
2nd
ppm
Viol Days
National
Rank
City/Area
Max ppm
2nd
ppm
Viol Days
1 Houston, TX 0.225 0.168 11 282 NREL 0.118 0.107 0 2 Deer Park, TX 0.185 0.175 13 407 Highlands Res. 0.111 0.097 0 3 Chute, TX 0.185 0.136 2 516 Chatfield Res. 0.106 0.104 0 4 Upland, CA 0.184 0.172 10 574 Rocky Flats 0.103 0.097 0 5 Crestline, CA 0.176 0.174 18 615 Arvada 0.102 0.096 0
3.9 The 8-Hour Ozone Standard
In July 1997, the U.S. Environmental Protection Agency established a new ozone standard. The reasons for these changes were: A . . . to provide protections for children and other at-risk populations against a wide range of ozone induced health effects, including decreased lung function (primarily in children active outdoors), increased respiratory symptoms (particularly in highly sensitive individuals), hospital admissions and emergency room visits for respiratory causes (among children and adults with pre-existing respiratory disease such as asthma), inflammation of the lung and possible long-term damage to the lungs.@9 There were three changes to the standard: 1. The averaging period was changed from 1-hour periods to 8-hour periods. 2. The level of the standard was lowered from 0.12 to 0.08 ppm as the result of the increased averaging
time. 3. An area will attain the standard when the 4th highest daily maximum 8-hour concentration, averaged
over 3 years, is below 0.08 ppm. How will this standard affect Colorado?
Under the past standard, all of Denver and Jefferson counties and large portions of Adams, Arapahoe, Boulder and Douglas counties are classified as nonattainment. Under the new standard, no Colorado county would be out of attainment. There are several reasons for this change in attainment, the most important of which is that ozone concentrations have been declining throughout the monitoring area. In addition, daily peak concentrations in Colorado and most other Western states tend to be short-term spikes of one to three hours, while the majority of the time the levels are quite low. In coastal California and the Eastern United States, the ozone concentrations tend to buildup all day long or even across multi-day periods.
At this time, the 8-hour standard has been challenged in federal court. Until a decision is made by the court the 8-hour standard has been nullified and the 1-hour standard has been put back in effect.

26
Table 3.4
2000 8-HOUR AVERAGE OZONE DATA SUMMARY Standard
8-hour - 0.08 ppm* County
Location
1998
4th Max
1999
4th Max
2000
4th Max
3-yr Avg
of 4th Max
Adams
Welby, 78th Ave. & Steele St. 0.083 0.071 0.062 0.072
Arapahoe
Highland Reservoir 0.084 0.075 0.076 0.078
Boulder
Boulder, 1402 2 Foothills Rd. 0.089 0.075 0.072 0.078
Denver
Carriage, 23rd Ave. & Julian St. 0.085 0.068 0.071 0.074
Douglas
Chatfield Reservoir 0.081 0.075 0.080 0.078
Jefferson
Arvada, 57th Ave. & Garrison St. 0.089 0.072 0.072 0.077
NREL, 20th Ave. & Quaker St. 0.095 0.080 0.083 0.086
Welch, 12400 W. Hwy. 285 0.080 0.066 0.068 0.071
Rocky Flats, 16600 Hwy 128 0.092 0.080 0.081 0.084
El Paso
USAF Academy, Rd 640 0.062 0.064 0.070 0.065
Larimer
Fort Collins, 708 S. Mason St. 0.072 0.063 0.070 0.068
Weld
Greeley, 811 15th Ave. 0.075 0.069 0.067 0.070
* Due to mathematical rounding, a value of 0.085 or greater is necessary to exceed the
standard. 3.10 8-Hour Summary
Although the level of the proposed 8-hour standard was not exceeded in 2000, the proposed standard was exceeded at the NREL, 20th Ave. & Quaker St with a 3-year average of the fourth maximum of 0.086 ppm. A violation of the 8-hour standard occurs when the 3-year average of the annual fourth maximum value is equal to or greater than 0.085 ppm. In the ozone standard the fourth decimal place is truncated and rounding for comparison to the proposed 8-hour standard of 0.08 ppm is done from the third decimal place. Since 1998 was an exceptionally poor year for ozone, the Denver Metro Area is expected to remain in compliance with the 8-hour ozone standard in the future.

27
4.0 NITROGEN DIOXIDE 4.1 Physical Characteristics and Sources
In its pure state, nitrogen dioxide is a reddish-brown gas with a characteristic pungent odor. It is corrosive and a strong oxidizing agent. As a pollutant in ambient air, however, it is virtually colorless and odorless and can be an irritant to the eyes and throat. Oxides of nitrogen (nitric oxide and nitrogen dioxide) are formed when the nitrogen and oxygen in the air are combined in high temperature combustion.
About 44 percent of the emissions of nitrogen dioxide in the Denver area come from large combustion sources such as power plants. Almost 33 percent comes from motor vehicles, 15 percent from space heating, 3 percent from aircraft and 5 percent from miscellaneous off-road vehicles. Minor sources include fireplaces and woodstoves and high temperature combustion processes used in industrial work.12 This is generally consistent with the emissions nationally as seen in Figure 4.1.13 4.2 Health and Welfare
Effects Elevated levels of nitrogen
dioxide cause respiratory distress, degradation of vegetation, clothing and visibility, and increased acid deposition. Nitrate aerosols, which result from nitric oxide and nitrogen dioxide combining with water vapor in the air, have been consistently linked to Denver's visibility problems. Table 4.1 contains a summary of health effects experienced at various exposure levels.
Figure 4.1
28
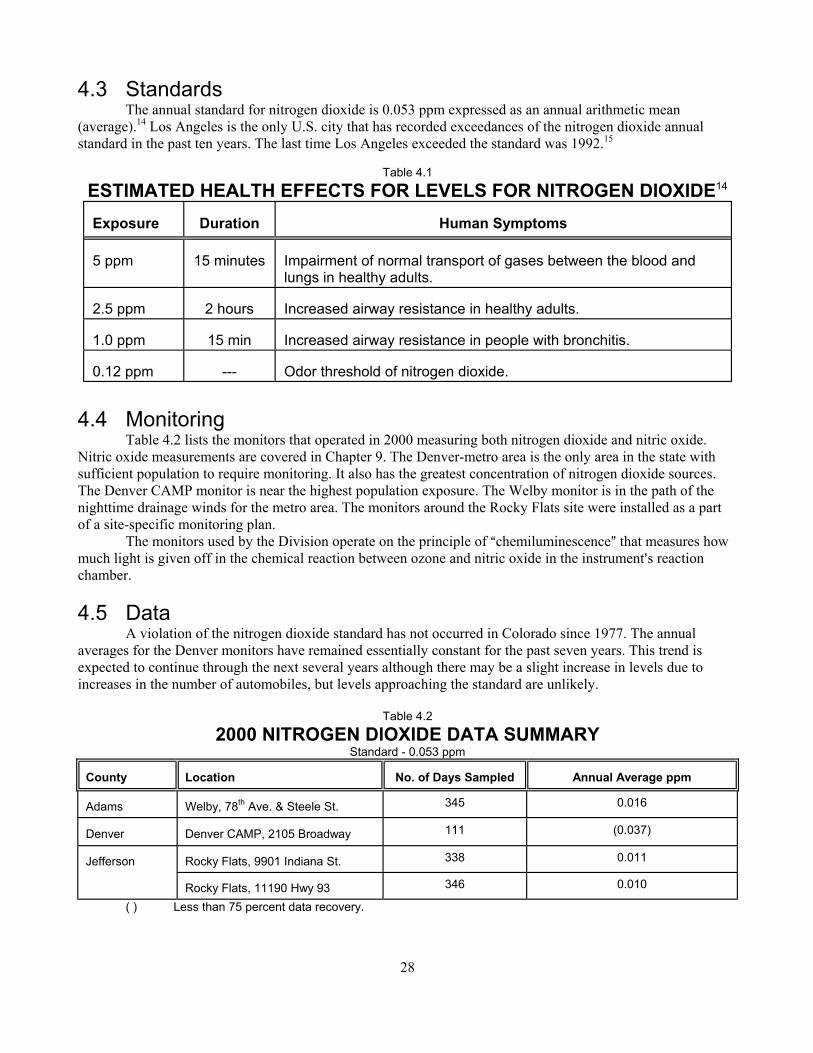
4.3 Standards The annual standard for nitrogen dioxide is 0.053 ppm expressed as an annual arithmetic mean
(average).14 Los Angeles is the only U.S. city that has recorded exceedances of the nitrogen dioxide annual standard in the past ten years. The last time Los Angeles exceeded the standard was 1992.15
Table 4.1
ESTIMATED HEALTH EFFECTS FOR LEVELS FOR NITROGEN DIOXIDE14 Exposure
Duration
Human Symptoms
5 ppm
15 minutes
Impairment of normal transport of gases between the blood and lungs in healthy adults.
2.5 ppm
2 hours
Increased airway resistance in healthy adults.
1.0 ppm
15 min
Increased airway resistance in people with bronchitis.
0.12 ppm
---
Odor threshold of nitrogen dioxide.
4.4 Monitoring
Table 4.2 lists the monitors that operated in 2000 measuring both nitrogen dioxide and nitric oxide. Nitric oxide measurements are covered in Chapter 9. The Denver-metro area is the only area in the state with sufficient population to require monitoring. It also has the greatest concentration of nitrogen dioxide sources. The Denver CAMP monitor is near the highest population exposure. The Welby monitor is in the path of the nighttime drainage winds for the metro area. The monitors around the Rocky Flats site were installed as a part of a site-specific monitoring plan.
The monitors used by the Division operate on the principle of Achemiluminescence@ that measures how much light is given off in the chemical reaction between ozone and nitric oxide in the instrument=s reaction chamber.
4.5 Data
A violation of the nitrogen dioxide standard has not occurred in Colorado since 1977. The annual averages for the Denver monitors have remained essentially constant for the past seven years. This trend is expected to continue through the next several years although there may be a slight increase in levels due to increases in the number of automobiles, but levels approaching the standard are unlikely.
Table 4.2
2000 NITROGEN DIOXIDE DATA SUMMARY Standard - 0.053 ppm
County
Location
No. of Days Sampled
Annual Average ppm
Adams
Welby, 78th Ave. & Steele St. 345 0.016
Denver
Denver CAMP, 2105 Broadway 111 (0.037)
Jefferson
Rocky Flats, 9901 Indiana St. 338 0.011
Rocky Flats, 11190 Hwy 93 346 0.010
( ) Less than 75 percent data recovery.

29
Figure 4.2
4.6 Trends for Colorado and the Nation
Nationally, the composite annual average for nitrogen dioxide concentrations decreased 10 percent from 1990 to 1999 and while the year-to-year decline was not statistically significant, the 10-year trend was significant.13
Colorado exceeded the standard in 1977 at the Denver CAMP monitor. However, levels have shown a gradual decline since then. The missing data between 1990 and 1991 are due to instrument problems and make the trend for Colorado less clear. However, the annual average has been nearly flat for the past seven years.
Annual Nitrogen Dioxide Comparison
0.000
0.010
0.020
0.030
0.040
0.050
0.060
1990 1991 1992 1993 1994 1995 1996 1997 1998 1999 2000
Con
cent
ratio
ns in
ppm
Standard Welby Denver CAMP Rocky Flats 9901 Rocky Flats 11190

30
Table 4.3
2000 NATIONAL RANKING OF NITROGEN DIOXIDE MONITORS BY ANNUAL AVERAGE CONCENTRATIONS IN PPM16
Nationwide (424 Monitors)
Colorado ( 4 Monitors)
National Rank
City/Area Ann. Avg.
1-hr Max
2nd Max
National Rank
City/Area Ann. Avg.
1-hr Max
2nd Max
1 Pomona, CA 0.044 0.140 0.124 8 Denver CAMP (0.037) 0.095 0.095
2 Burbank, CA 0.041 0.163 0.159 191 Welby 0.016 0.141 0.120
3 Elizabeth, NJ 0.041 0.117 0.116 288 Rocky Flats, 9901 Indiana St. 0.011 0.060 0.060
4 Los Angeles, CA 0.040 0.152 0.151 311 Rocky Flats, 11190 Hwy 93 0.010 0.057 0.057
5 Lynwood, CA 0.039 0.142 0.135
( ) Less than 75 percent data recovery.

31
5.0 SULFUR DIOXIDE 5.1 Physical Characteristics and Sources
Sulfur dioxide is a colorless gas with a pungent odor. It is detectable by smell at concentrations of about 0.5 to 0.8 ppm.17 It is highly soluble in water. In the atmosphere, sulfur oxides and nitric oxides are converted to "acid rain”. On a worldwide basis, sulfur dioxide is considered a major pollution problem. In the United States, as shown in Figure 5.1, sulfur dioxide is emitted mainly from stationary sources that burn coal and oil. Other sources include refineries and smelters. Significant amounts of sulfur dioxide are also emitted from natural sources such as volcanoes, which rarely contribute to the urban sulfur dioxide problem.17 5.2 Health and Welfare
Effects Sulfur dioxide can be converted in the
atmosphere to sulfuric acid aerosols and particulate sulfate compounds, which are corrosive and potentially carcinogenic (cancer-causing). Worldwide elevated sulfur dioxide and particulates have been associated with many air pollution disasters. Deaths in these disasters were due to respiratory failure and occurred predominantly, but not exclusively, in the elderly and infirm. Sulfur dioxide may also play an important role in the aggravation of chronic illnesses such as asthma. The incidence and intensities of asthma attacks increase when people with asthma are exposed to higher levels of sulfates. Table 5.1 contains a summary of the health effects for various exposure levels.

32
Table 5.1
ESTIMATED HEALTH EFFECTS LEVELS FOR SULFUR DIOXIDE EXPOSURE18
Effects
Exposure
Duration
Pulmonary function test changes from baseline have been recorded in exercising asthmatic subjects - No such changes were noted in normal subjects.
0.5 to 1.0 ppm
40 Minutes
Taste detectable in normal subjects
3 to 5 ppm
1 min
Throat and conjunctiva irritation and lacrimation in normal subjects
8 to 12 ppm
1 min
Strong eye, nose, throat and lower respiratory tract irritation in normal subjects.
50 ppm
1 min
Lowest concentration reported to cause death in humans
400 ppm
1 min
5.3 Standards
There are two primary standards for sulfur dioxide. The first is a long-term, one-year arithmetic average not to exceed 0.03 ppm. The second is a short-term, 24-hour average where concentrations are not to exceed 0.14 ppm more than once per year. The secondary standard is a 3-hour average not to exceed 0.5 ppm more than once per year.19
5.4 Monitoring
Nationwide sulfur dioxide monitoring is required in metropolitan areas with populations greater than 500,000 or where there is a potential for an exceedance of the standard. In Colorado, only the Denver-metro area has sufficient population to require monitoring. There are two monitors in the Denver-metro area. The Denver CAMP monitor is in the area of highest population exposure. The Welby monitor is in the down-valley drainage from the Denver-metro area and down-valley from the refinery area of Commerce City.
In the past, sulfur dioxide has been monitored at seven locations around the state, including the Denver-metro area, Grand Junction and Pueblo. Monitoring was reduced because levels outside Denver were rarely above the minimum detectable level for the instruments. Table 5.2 shows the values for the two sulfur dioxide monitors operating in 2000. Table 5.3 ranks Colorado monitors against those in the rest of the nation by maximum 24-hour concentration.
The monitors use Apulsed fluorescence.@ This technique measures sulfur dioxide in parts per million by measuring the amount of visible light given off, or Afluorescence,@ when sulfur dioxide is exposed to high intensity ultraviolet light. 5.5 Data
The trend of the annual average for sulfur dioxide has been nearly flat at both Welby and Denver CAMP. Table 5.3 shows that Colorado monitors rank in the lower one half to one third of the nation’s sulfur dioxide monitors.

33
Table 5.2
2000 SULFUR DIOXIDE DATA SUMMARY Standard
3-hour = 0.5 ppm 24-hour = 0.14 ppm Annual = 0.03 ppm
County
Location
No. of Days
Sampled
3-Hour 2nd Max
ppm
24-Hour 2nd Max
ppm
Annual Average
ppm Adams
Welby, 78th Ave. & Steele St. 346 0.041 0.009 0.003
Denver
Denver CAMP, 2105 Broadway 127 0.051 0.017 (0.006)
Figure 5.2
SULFUR DIOXIDE HISTORICAL COMPARISONS
5.6 Trends in Colorado and the Nation
The national average ambient concentration of sulfur dioxide has decreased 37 percent between 1987 and 1996. The emissions for the same period have decreased 12 percent. However, unlike the trend in ambient concentrations, the national trend in emissions of sulfur dioxide begins to climb again from 1995 - 1997. This reduction and subsequent increase is driven by yearly changes in the emissions from the electric utility industry.18
Trends in Annual Sulfur Dioxide
0.000
0.005
0.010
0.015
0.020
0.025
0.030
0.035
1990 1991 1992 1993 1994 1995 1996 1997 1998 1999 2000Year
Con
cent
ratio
ns in
ppm
StandardWelbyDenver CAMP

34
The trend in ambient concentrations for both of the monitors operated in the Denver-metro area has been flat-to-declining for the past 10 years. This is due to the limited number of large, coal-burning industrial sources in the area and the burning of low-sulfur coal.
Table 5.3
2000 NATIONAL RANKING OF SULFUR DIOXIDE MONITORS BY MAXIMUM 24-HOUR CONCENTRATIONS IN PPM20
Nationwide (600 Monitors)
Colorado (2 Monitors)
National
Rank
City/Area
Max ppm
2nd ppm
#>0.14 ppm
Nat=l Rank
City/Area
Max ppm
2nd ppm
#>0.14 ppm
1
Hawaii Volcanoes Natl Park, HI
0.217
0.189
2
354
Denver CAMP
0.019
0.017
0
2
Hendricks Co, IN
0.144
0.108
0
481
Welby
0.011
0.009
0
3
Warwick Co, IN
0.132
0.084
0
4
Iron Co, MO
0.121
0.099
0
5
Dunkirk, NY
0.106
0.065
0

35
6.0 PARTICULATE MATTER (PM10) 6.1 Physical Characteristics and Sources
Particulate matter is the term given to the tiny particles of solid or semi-solid material suspended in the atmosphere. Particulates can range in size from less than 0.1 microns to 50 microns. Particles larger than 50 microns tend to settle out of the air quickly and are not considered to have a health effect. Particulate matter 10 microns in diameter and smaller is considered inhalable and has the greatest health impact. This type of particulate matter is called PM10.21
Most anthropogenic (manmade) particulates are in the 0.1 to 10 micron diameter range. Particles larger than 10 microns are usually due to "fugitive dust”. Fugitive dust is wind-blown sand and dirt from roadways, fields and construction sites that contain large amounts of silica (sand-like) materials. Anthropogenic particulates are created during the burning of fuels associated with industrial processes or heating, (see Figure 6.1). These particulates include fly ash (from power plants), carbon black (from automobiles and diesel engines) and soot (from fireplaces and woodstoves). The PM10 particulates from these sources contain a large percentage of elemental and organic carbon. These types of particles play a role in both visual haze and health issues.22
Particles less than 2.5 microns in diameter, or PM2.5, are the major contributors to visibility problems because of their ability to scatter light. In Denver, the effects of this particulate pollution can be seen as the "Brown Cloud" or, more appropriately, the ADenver Haze@ because it is frequently neither brown nor an actual cloud.

36
6.2 Health and Welfare Effects According to American Lung Association=s paper The Perils of Particulates, AThe health risk from an
inhaled dose of particulate matter depends on the size and concentration of the particulate. Size determines how deeply the inhaled particulate will penetrate into the respiratory tract where they can persist and cause respiratory damage. Particles less than 10 microns in diameter are easily inhaled deep into the lungs. In this range, larger particles tend to deposit in the tracheobronchial region and smaller ones in the alveolar region. Particulates deposited in the alveolar region can remain in the lungs for long periods because the alveoli have a slow mucociliary clearance system”.21
AFine particulate pollution does not affect the health of exposed persons with equal severity. Certain subgroups of people potentially exposed to air pollutants can be identified as potentially >at risk= from adverse health effects of air borne pollutants. There is very strong evidence that asthmatics are much more sensitive (i.e., respond with symptoms at relatively low concentrations) to the effects of particulates than the general healthy population. Conversely, little scientific evidence exists that show elderly persons (greater than 65 years old) are particularly sensitive to the effects of particulate matter air pollution”.21
The welfare effects of particulate exposure may be the most widespread of all the pollutants. Because of the potential for extremely long-range transport of fine particles and chemical reactions that occur, no place on earth has been spared from the particulate pollution generated by urban and rural sources. The effects of particulates range from visibility degradation to climate changes and vegetation damage. General soiling, commonly thought to be just a nuisance, can have long-term adverse effects on building paints and other materials. Acid deposition as particulates can be detected in the most remote areas of the world.21 6.3 PM10 Standards
In July 1987, EPA promulgated National Ambient Air Quality Standards for Particulates with an aerodynamic diameter of 10 microns or less (PM10). This is a size that can be inhaled into the alveolar regions of the lungs. The standard has two forms, a 24-hour standard of 150 µg/m3 and an annual arithmetic mean standard of 50 µg/m3.23 1. The 24-hour standard is attained when the expected number of exceedances for each calendar year,
averaged over three years, is less than or equal to one. The estimated number of exceedances is computed quarterly using available data and adjusting for missing sample days.
2. The annual arithmetic mean standard is attained when the annual mean, averaged over three years is less than or equal to the level of the standard. Each annual mean is computed from the average of each quarter in the year, with adjustments made for missing sample days.
3. In both cases, a data recovery of 75 percent is needed for each calendar quarter to be considered a valid quarter of data.
The 24-hour standard was modified in by EPA in July 1997, but was subsequently nullified back to this
form in May 1999 due to a challenge in the courts. 6.4 PM10 Monitoring
In 2000, PM10 data were collected from 51 locations. These monitoring locations are listed in Table 6.1. Five locations monitored PM10 on a continuous basis. A PM10 Hi-vol is a high-volume particulate sampler that has been modified to be size selective. This change insures that only particulate matter with an aerodynamic diameter of 10 microns or less is collected on the filter. These samplers operate on the same principle as a vacuum cleaner. Air is drawn through a filter to catch the particulates the way dust is caught in a vacuum cleaner bag. In a particulate sampler, however, a calibrated volume of air is drawn through a pre-weighed filter pad for exactly 24 hours. The change in weight of the filter pad is recorded as micrograms of particulate per cubic meter of air sampled (µg/m3).

37
Figure 6.2 presents the Historical Comparison Graphs while Table 6.2 shows how Colorado PM10
monitors rank with others in the nation. These graphs show both the annual standard of 50 µg/m3 and the 24-hour standard of 150 µg/m3. 6.5 PM10 Data
In Table 6.1 the PM10 data presented are: C Days scheduled/days sampled C Annual average C 3-year annual average of measured values C 24-hour maximum C 3-year average of expected exceedances C 2000 expected exceedances
For those sites with three or more years of data, the 3-Year Annual Average is the calculation used to determine attainment of the standard, as discussed in section 6.3. It should not exceed 50 µg/m3. The 2000 annual average should be compared with the 50 µg/m3 standard to determine if there was an exceedance during 2000.
Values in the Expected 3-Year Number of 24-Hour Exceedances column are the average of the past three calendar years= expected exceedances. To attain the standard, a site's 3-year average must be less than or equal to 1.0. The 24-hour maximum can be compared with the 150 µg/m3 standard to determine if an exceedance was recorded in 2000.
Incomplete data are shown by parentheses in the tables. Each quarter of the calendar year must have 75 percent data recovery of the scheduled number of samples for a year to be considered complete. If any quarter has less than 75 percent data recovery, the calendar year is incomplete. The annual average and the 3-year annual average will, therefore, be based on incomplete data. The yearly and 3-year expected number of 24-hour exceedances will also be incomplete, since they are based on quarters that contain incomplete data. However, the standard contains a procedure to work with missing data. Values in the 3-year data column are designated as incomplete when one or more of the years that make-up the 3-year average have had less than 75 percent data recovery. Values listed as "n/a" do not have enough data to calculate the average properly.
Figure 6.2 shows the data in a graphical format. Only sites with three or more years of data are presented. 6.6 PM10 Summary
Ten areas in Colorado have recorded exceedances of the 24-hour PM10 standard since 1987. These are: 1. Denver-metro, the Adams City monitor recorded an exceedance in 1999. This was the first exceedance
in the Metro area since 1993. 2. Colorado Springs, which has not recorded an exceedance since 1993. 3. Cañon City, which has not recorded an exceedance since 1988. 4. Alamosa, which recorded its last exceedance in 1995. 5. Aspen, which has not recorded an exceedance since 1991. 6. Pagosa Springs, recorded its last exceedance in 2000 and has a 3-year expected exceedances average of
0.34 for 2000. 7. Steamboat Springs, which recorded its latest exceedance in 1996. 8. Cripple Creek, which recorded its last exceedance in 1994. 9. Lamar recorded its last exceedance that had not been attributed to a naturally occurring high-wind event
in 1992. There have been three exceedances recorded at the 100 N. 2nd Avenue monitor since then but these have all been associated with prolonged periods of drought and winds from the north and west with hourly wind averages greater than 30 mph.
10. Mount Crested Butte began operation in 1996 and in 1998 recorded one exceedance of the 24-hour standard.
38
11. Breckenridge recorded an exceedance in 2000, it operated on an every other day schedule, therefore, it’s estimated number of exceedances for 2000 was 2.94 days. Since Breckenridge had not recorded an exceedance in either 1999 or 1998 the 3-year average of exceedances for 2000 is 0.98.
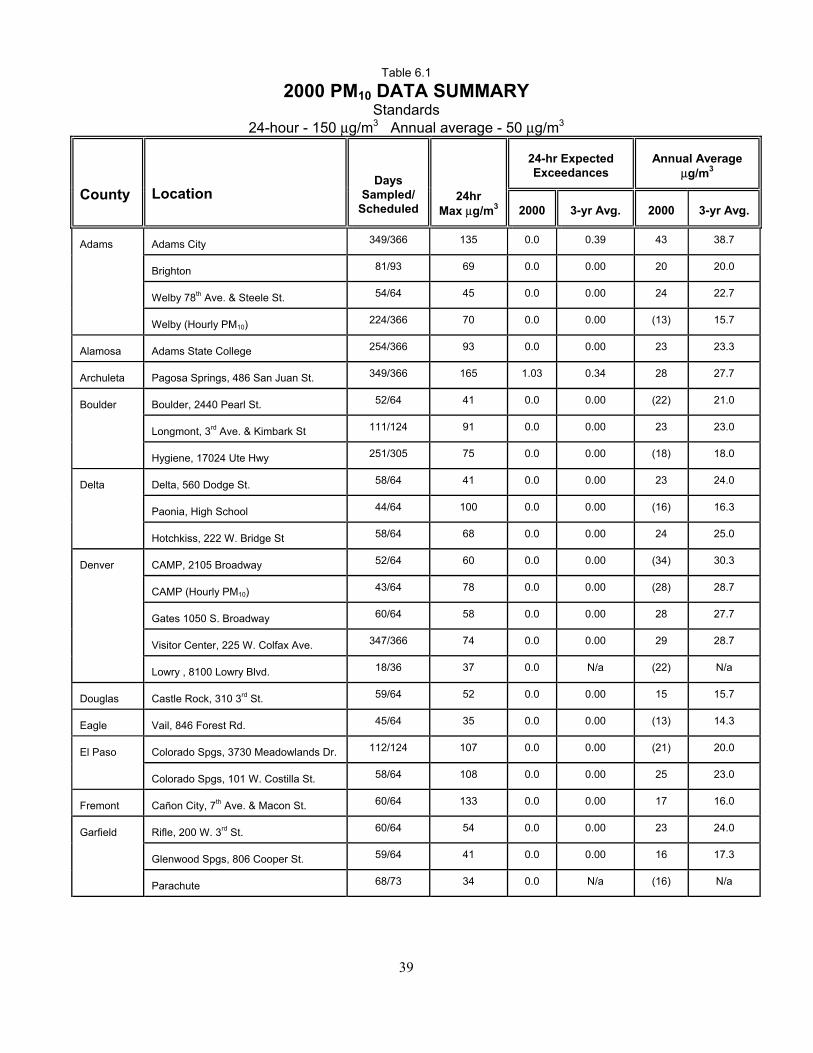
39
Table 6.1
2000 PM10 DATA SUMMARY Standards
24-hour - 150 µg/m3 Annual average - 50 µg/m3
24-hr Expected Exceedances
Annual Average
µg/m3
County
Location
Days Sampled/
Scheduled
24hr Max µg/m3
2000
3-yr Avg.
2000
3-yr Avg.
Adams
Adams City 349/366 135 0.0 0.39 43 38.7
Brighton 81/93 69 0.0 0.00 20 20.0
Welby 78th Ave. & Steele St. 54/64 45 0.0 0.00 24 22.7
Welby (Hourly PM10) 224/366 70 0.0 0.00 (13) 15.7
Alamosa
Adams State College 254/366 93 0.0 0.00 23 23.3
Archuleta
Pagosa Springs, 486 San Juan St. 349/366 165 1.03 0.34 28 27.7
Boulder
Boulder, 2440 Pearl St. 52/64 41 0.0 0.00 (22) 21.0
Longmont, 3rd Ave. & Kimbark St 111/124 91 0.0 0.00 23 23.0
Hygiene, 17024 Ute Hwy 251/305 75 0.0 0.00 (18) 18.0
Delta
Delta, 560 Dodge St. 58/64 41 0.0 0.00 23 24.0
Paonia, High School 44/64 100 0.0 0.00 (16) 16.3
Hotchkiss, 222 W. Bridge St 58/64 68 0.0 0.00 24 25.0
Denver
CAMP, 2105 Broadway 52/64 60 0.0 0.00 (34) 30.3
CAMP (Hourly PM10) 43/64 78 0.0 0.00 (28) 28.7
Gates 1050 S. Broadway 60/64 58 0.0 0.00 28 27.7
Visitor Center, 225 W. Colfax Ave. 347/366 74 0.0 0.00 29 28.7
Lowry , 8100 Lowry Blvd. 18/36 37 0.0 N/a (22) N/a
Douglas
Castle Rock, 310 3rd St. 59/64 52 0.0 0.00 15 15.7
Eagle
Vail, 846 Forest Rd. 45/64 35 0.0 0.00 (13) 14.3
El Paso
Colorado Spgs, 3730 Meadowlands Dr. 112/124 107 0.0 0.00 (21) 20.0
Colorado Spgs, 101 W. Costilla St. 58/64 108 0.0 0.00 25 23.0
Fremont
Cañon City, 7th Ave. & Macon St. 60/64 133 0.0 0.00 17 16.0
Garfield
Rifle, 200 W. 3rd St. 60/64 54 0.0 0.00 23 24.0
Glenwood Spgs, 806 Cooper St. 59/64 41 0.0 0.00 16 17.3
Parachute 68/73 34 0.0 N/a (16) N/a

40
Table 6.1 (Continued)
2000 PM10 DATA SUMMARY
24-hr Expected Exceedances
Annual Average
µg/m3
County
Location
Days Sampled/
Scheduled
24-hr
Max µg/m3 2000
3-yr Avg.
2000
3-yr Avg.
Gunnison Crested Butte 112/124 63 0.0 0.00 28 28.0
Mt. Crested Butte 321/366 89 0.0 0.42 25 31.0
Gunnison 8/9 42 0.0 N/a (20) N/a
Jefferson
Rocky Flats, 16600 Hwy 128 35/48 36 0.0 0.00 (13) 12.7
Rocky Flats, 11501 Indiana St. 60/64 33 0.0 0.00 15 14.0
Rocky Flats, 9901 Indiana St. 61/64 32 0.0 0.00 15 14.3
Rocky Flats, 18000 W. Hwy. 72 60/64 31 0.0 0.00 14 12.7
Rocky Flats, 11190 N. Hwy. 93 56/64 33 0.0 0.00 16 15.0
La Plata
Durango, 277 3rd Ave. 295/366 133 0.0 0.42 36 34.0
Durango, 623 E. 5th Ave 125/184 39 0.0 0.00 (16) 17.0
Durango, 1060 E. 2nd Ave. 134/184 51 0.0 0.00 (12) 15.3
Larimer
Fort Collins, 200 W. Oak St. 108/184 60 0.0 0.00 (17) 16.3
Fort Collins, 251 Edison Dr. 107/184 75 0.0 0.00 (19) (22.0)
Mesa
Mesa County Health Dept 59/64 44 0.0 0.00 19 (18.5)
(Grand 12th Ave & North, Stocker Stadium 58/64 47 0.0 0.00 20 20.0
Junction)
Stocker Stadium (Hourly PM10) 227/366 55 0.0 0.00 (23) 21.0
Montrose
Montrose, 125 S. Townsend Rd. 30/64 82 0.0 0.00 (23) 23.7
Olathe, 327 4th St. 92/124 104 0.0 0.00 (30) 34.3
Pitkin
Aspen, 420 E. Main St. 91/124 54 0.0 0.00 (18) 19.0
Aspen, (Hourly PM10) 286/366 78 0.0 0.00 (22) 23.3
Prowers
Lamar, 100 2nd Ave. 321/366 137 0.0 0.00 (29) 28.0
Lamar, 104 Parmenter St. 342/366 107 0.0 0.00 22 21.7
Pueblo
Pueblo, 211 D St. 111/124 75 0.0 0.00 24 24.7
Routt
Steamboat Spgs, 136 6th Ave. 337/366 98 0.0 0.00 25 25.7
() Less than 75 percent data recovery.

41
Table 6.1 (Continued)
2000 PM10 DATA SUMMARY
24-hr Expected Exceedances
Annual Average
µg/m3
County
Location
Days Sampled/
Scheduled
24-hr
Max µg/m3 2000
3-yr Avg.
2000
3-yr Avg.
San Miguel
Telluride, 333 W. Colorado Ave. 79/124 59 0.0 0.00 (22) 22.7
Telluride, (Hourly PM10) 237/366 79 0.0 0.00 (22) 23.7
Summit
Breckenridge, 501 N. Park Ave. 116/124 182 2.94 0.98 22 19.7
Silverthorne, 151 4th St. 36/48 52 0.0 0.00 (23) 22.7
Silverthorne, 430 Rainbow Drive 16/36 31 0.0 N/a (16) N/a
Teller
Cripple Creek, 209 E. Bennet Ave. 297//366 115 0.0 0.00 27 32.3
Weld
Greeley, 1516 Hospital Rd. 108/124 65 0.0 0.00 21 18.7
() Less than 75 percent data recovery.
Figure 6.2
PM10 HISTORICAL COMPARISONS
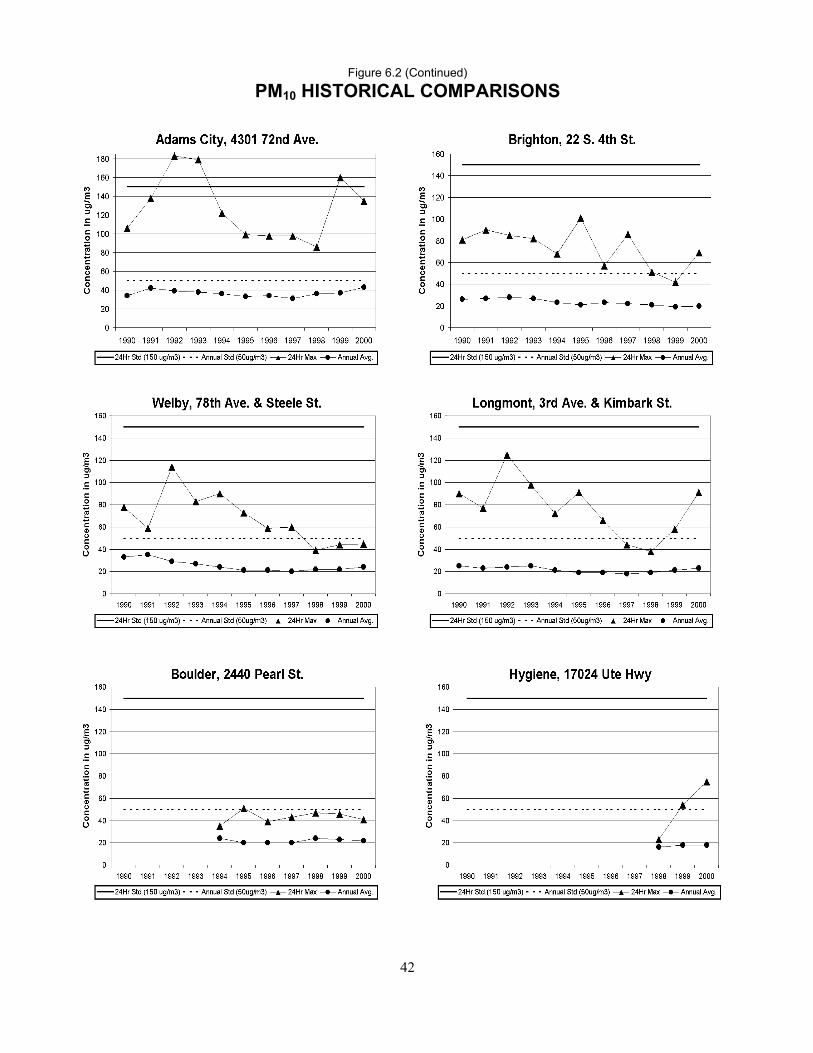
42
Figure 6.2 (Continued)
PM10 HISTORICAL COMPARISONS

43
Figure 6.2 (Continued)
PM10 HISTORICAL COMPARISONS
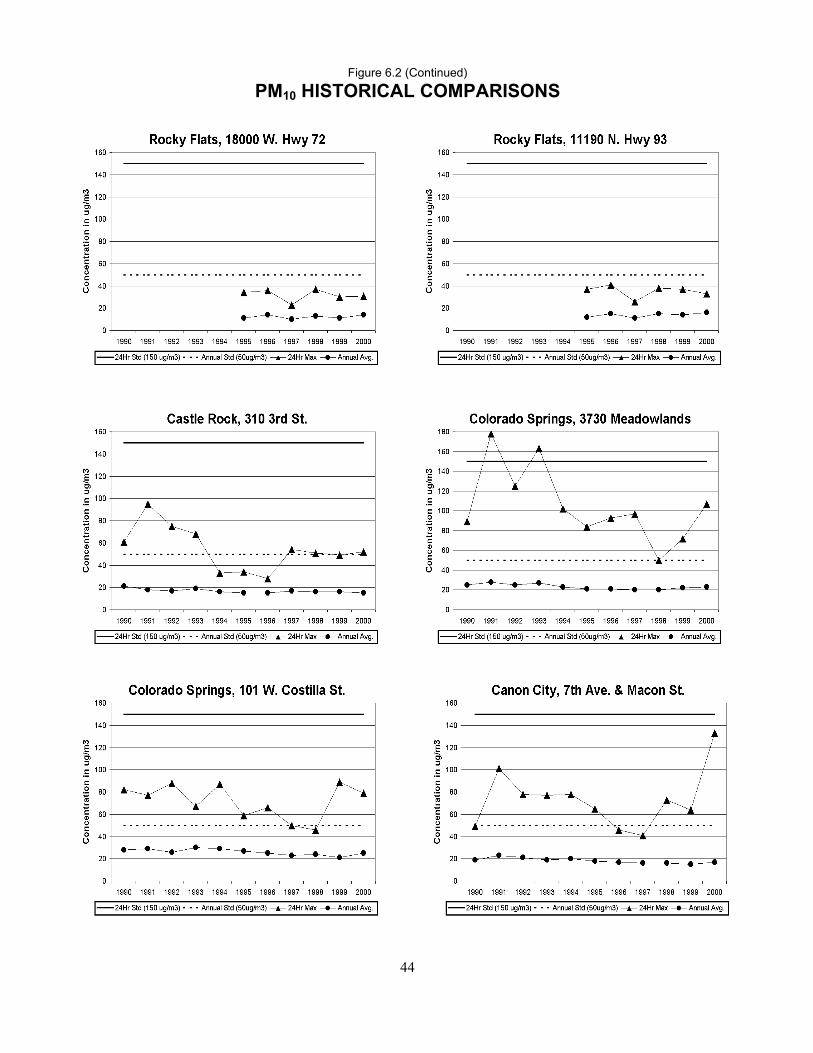
44
Figure 6.2 (Continued)
PM10 HISTORICAL COMPARISONS

45
Figure 6.2 (Continued)
PM10 HISTORICAL COMPARISONS
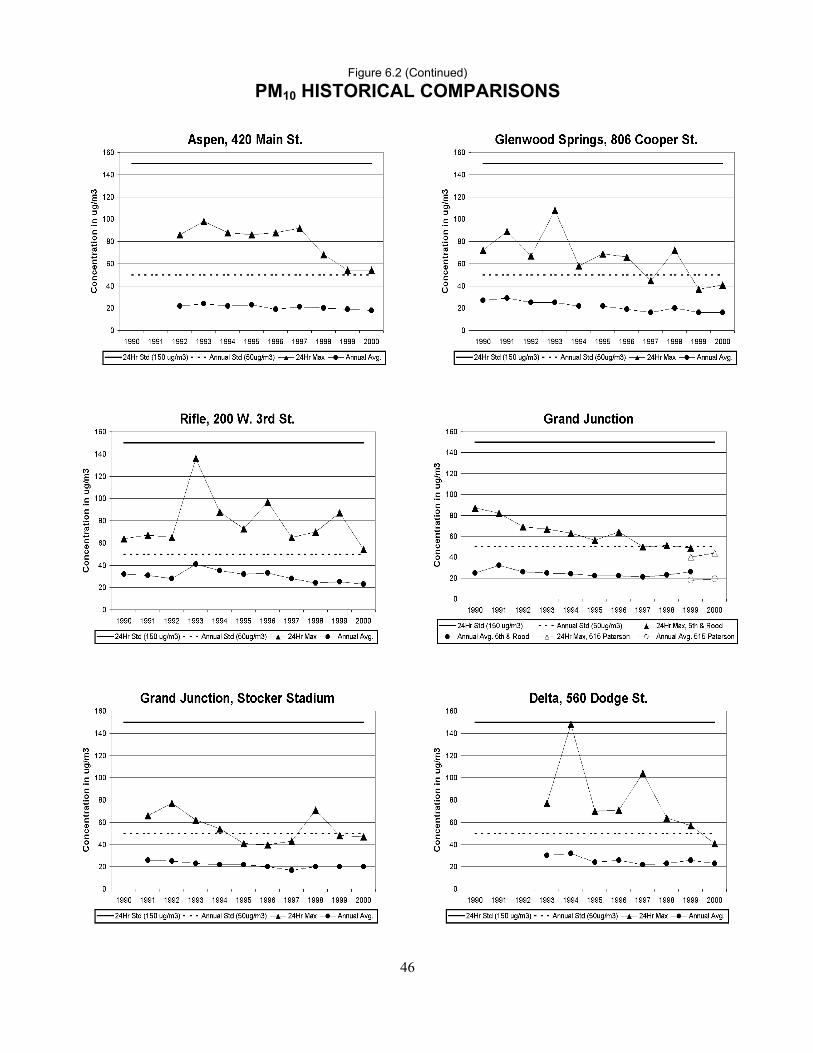
46
Figure 6.2 (Continued)
PM10 HISTORICAL COMPARISONS
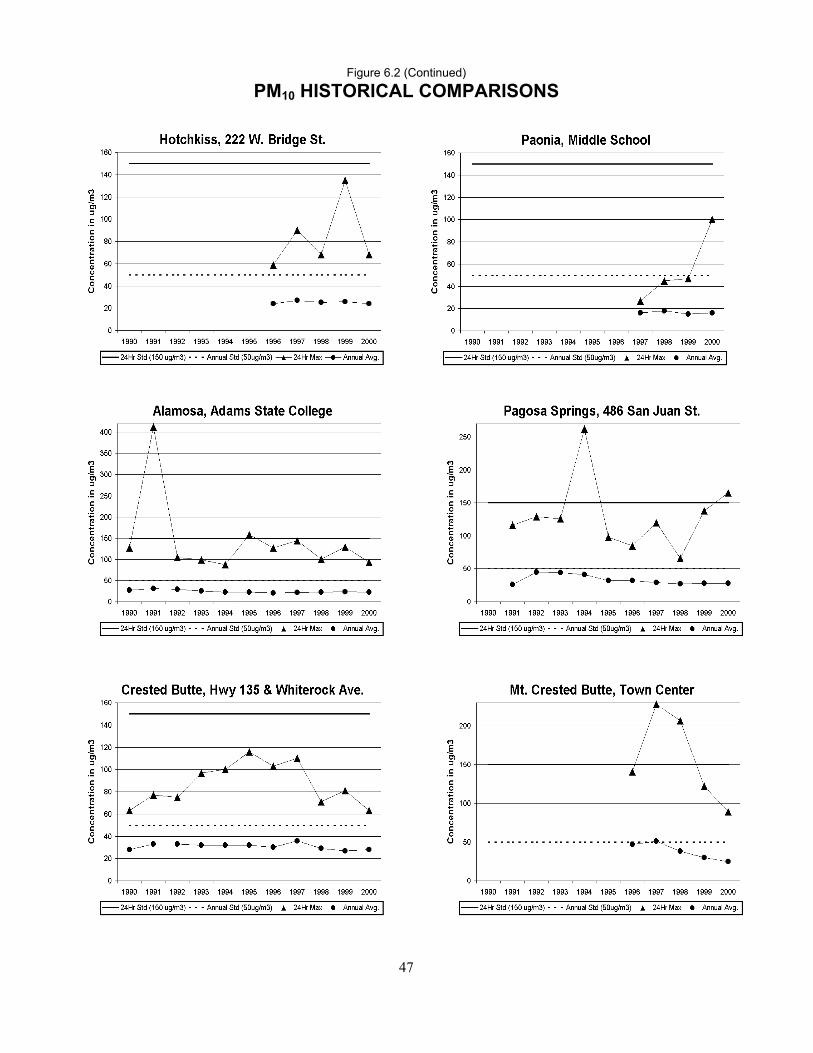
47
Figure 6.2 (Continued)
PM10 HISTORICAL COMPARISONS
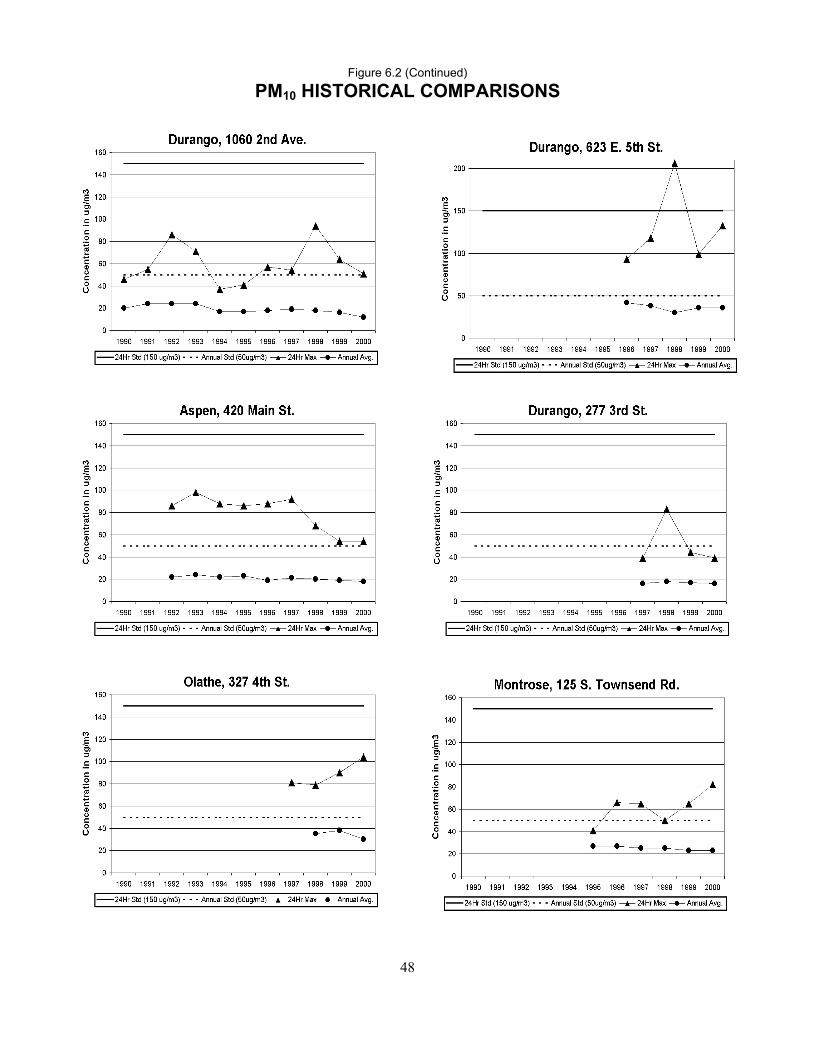
48
Figure 6.2 (Continued)
PM10 HISTORICAL COMPARISONS
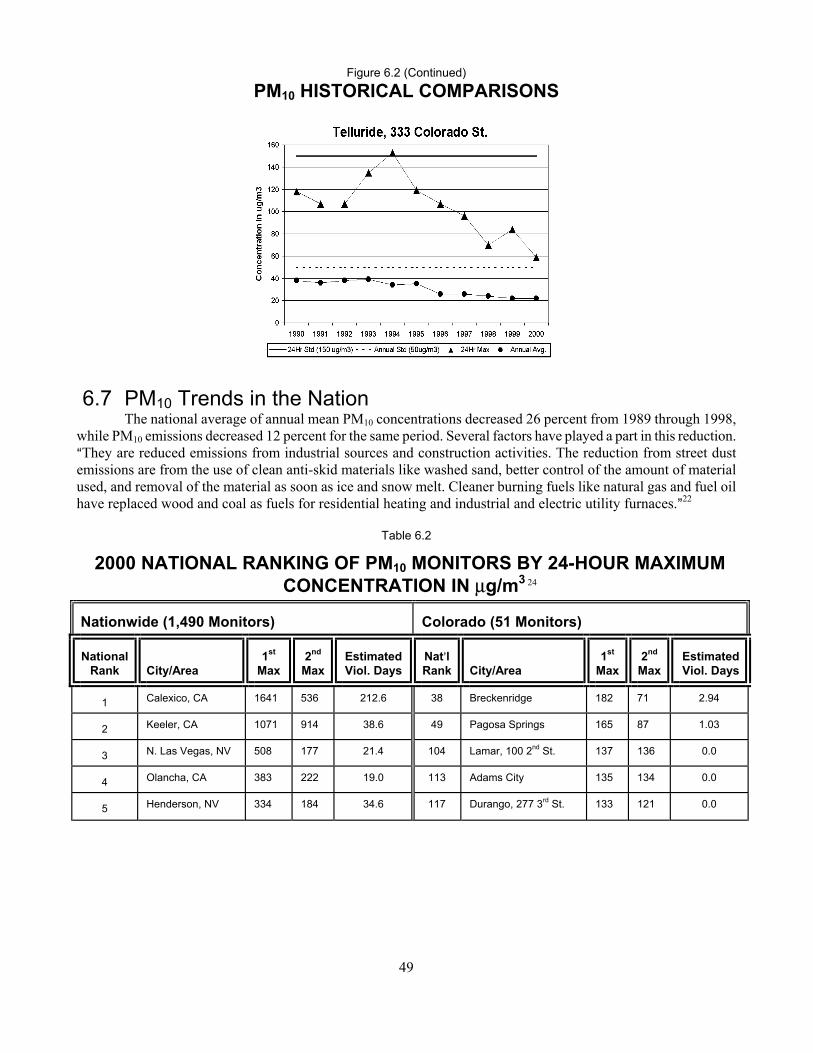
49
Figure 6.2 (Continued)
PM10 HISTORICAL COMPARISONS
6.7 PM10 Trends in the Nation
The national average of annual mean PM10 concentrations decreased 26 percent from 1989 through 1998, while PM10 emissions decreased 12 percent for the same period. Several factors have played a part in this reduction. AThey are reduced emissions from industrial sources and construction activities. The reduction from street dust emissions are from the use of clean anti-skid materials like washed sand, better control of the amount of material used, and removal of the material as soon as ice and snow melt. Cleaner burning fuels like natural gas and fuel oil have replaced wood and coal as fuels for residential heating and industrial and electric utility furnaces.@22
Table 6.2
2000 NATIONAL RANKING OF PM10 MONITORS BY 24-HOUR MAXIMUM
CONCENTRATION IN µg/m3 24 Nationwide (1,490 Monitors)
Colorado (51 Monitors)
National
Rank
City/Area
1st
Max
2nd
Max
Estimated Viol. Days
Nat=l Rank
City/Area
1st
Max
2nd
Max
Estimated Viol. Days
1 Calexico, CA 1641 536 212.6 38 Breckenridge 182 71 2.94
2 Keeler, CA 1071 914 38.6 49 Pagosa Springs 165 87 1.03
3 N. Las Vegas, NV 508 177 21.4 104 Lamar, 100 2nd St. 137 136 0.0
4 Olancha, CA 383 222 19.0 113 Adams City 135 134 0.0
5 Henderson, NV 334 184 34.6 117 Durango, 277 3rd St. 133 121 0.0

50
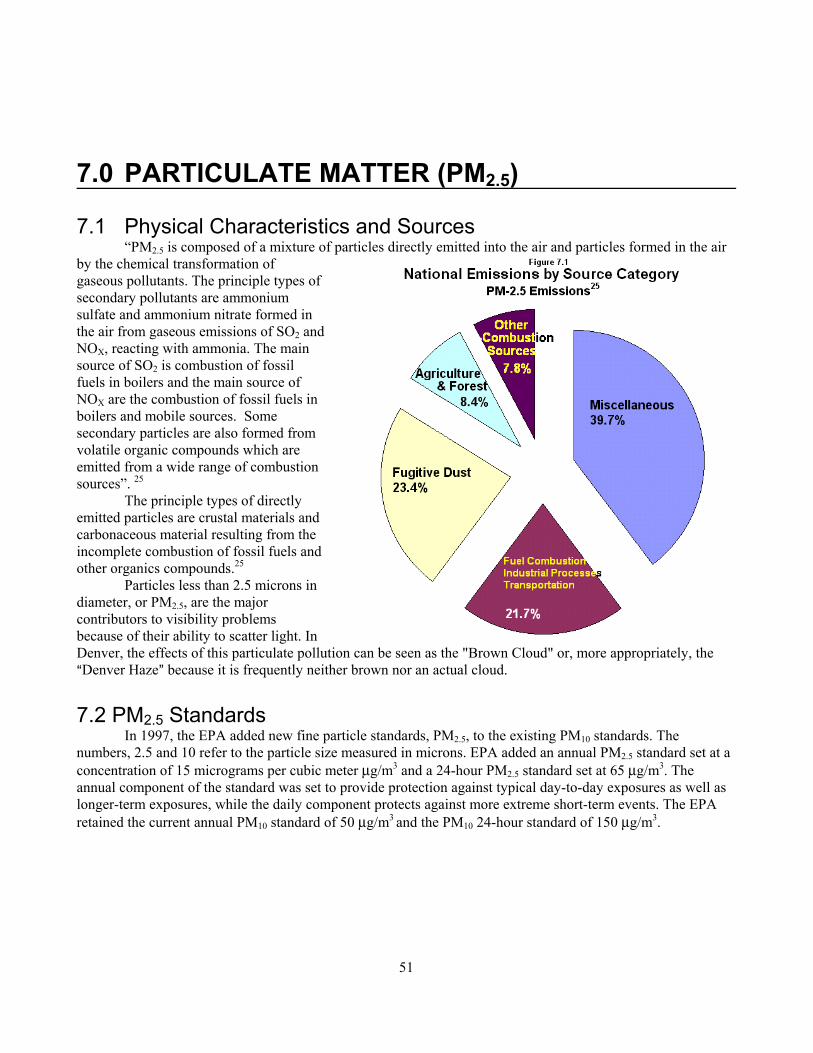
51
7.0 PARTICULATE MATTER (PM2.5) 7.1 Physical Characteristics and Sources
“PM2.5 is composed of a mixture of particles directly emitted into the air and particles formed in the air by the chemical transformation of gaseous pollutants. The principle types of secondary pollutants are ammonium sulfate and ammonium nitrate formed in the air from gaseous emissions of SO2 and NOX, reacting with ammonia. The main source of SO2 is combustion of fossil fuels in boilers and the main source of NOX are the combustion of fossil fuels in boilers and mobile sources. Some secondary particles are also formed from volatile organic compounds which are emitted from a wide range of combustion sources”. 25
The principle types of directly emitted particles are crustal materials and carbonaceous material resulting from the incomplete combustion of fossil fuels and other organics compounds.25
Particles less than 2.5 microns in diameter, or PM2.5, are the major contributors to visibility problems because of their ability to scatter light. In Denver, the effects of this particulate pollution can be seen as the "Brown Cloud" or, more appropriately, the ADenver Haze@ because it is frequently neither brown nor an actual cloud. 7.2 PM2.5 Standards
In 1997, the EPA added new fine particle standards, PM2.5, to the existing PM10 standards. The numbers, 2.5 and 10 refer to the particle size measured in microns. EPA added an annual PM2.5 standard set at a concentration of 15 micrograms per cubic meter µg/m3 and a 24-hour PM2.5 standard set at 65 µg/m3. The annual component of the standard was set to provide protection against typical day-to-day exposures as well as longer-term exposures, while the daily component protects against more extreme short-term events. The EPA retained the current annual PM10 standard of 50 µg/m3 and the PM10 24-hour standard of 150 µg/m3.

52
At this time, the new PM2.5 standards have been challenged in court and have been remanded. Thus, no PM2.5 standard is currently in effect. 7.3 PM2.5 Monitoring and Data
In 2000, six new PM2.5 special purpose monitoring sites were implemented, bringing the PM2.5 network to maturity. All of the 14 sites implemented in 1999 achieved a minimum of 75 percent data recovery in 2000, with most sites achieving 90 percent data recovery. All but one of the six new SPM sites achieved 75 percent data recovery in the quarters of 2000 they were operated; two achieved 75 percent data recovery for the year. Data summaries and graphs will be included in the 2001 data report when three years of data will be available.
Table 7.1
2000 PM2.5 DATA SUMMARY Standards
24-hour - 65 µg/m3 Annual average – 15 µg/m3 County
Location
Days
Sampled
24hr Max
µg/m3
24hr 2nd Max µg/m3
Annual Arithmetic Mean
µg/m3 Adams Adams City 118 40.4 23.2 10.80 Arapahoe Arapahoe Community Coll. 118 24.7 22.1 8.67 Archuleta Pagosa Springs 42 20.6 16.7 (6.71) Boulder Longmont 123 27.9 24.6 9.50 Boulder 124 20.9 19.4 8.14 Delta Delta 42 19.3 19.0 (7.26) Denver Denver CAMP 323 37.9 36.6 10.76 Douglas Parker 47 10.1 9.4 (5.09) Elbert Wright- Inghram Institute 113 12.1 11.9 4.00 El Paso Colorado Spgs, Meadowlands 119 17.5 15.6 6.74 Colorado Springs, RBD 120 18.0 15.1 7.54 Gunnison Mt. Crested Butte 57 15.7 14.5 5.90 San Juan Durango, 623 E. 5th Ave 53 14.6 14.5 (4.99) Larimer Fort Collins 122 26.5 20.2 8.25 Mesa Grand Junction 122 27.4 25.3 7.21 Pueblo Pueblo 118 25.3 22.1 7.85 Routt Steamboat Springs 43 17.1 16.4 (7.05) San Miguel Telluride 32 12.8 12.3 (5.95) Weld Greeley 120 35.0 28.4 8.42 Platteville 117 39.0 22.4 8.97
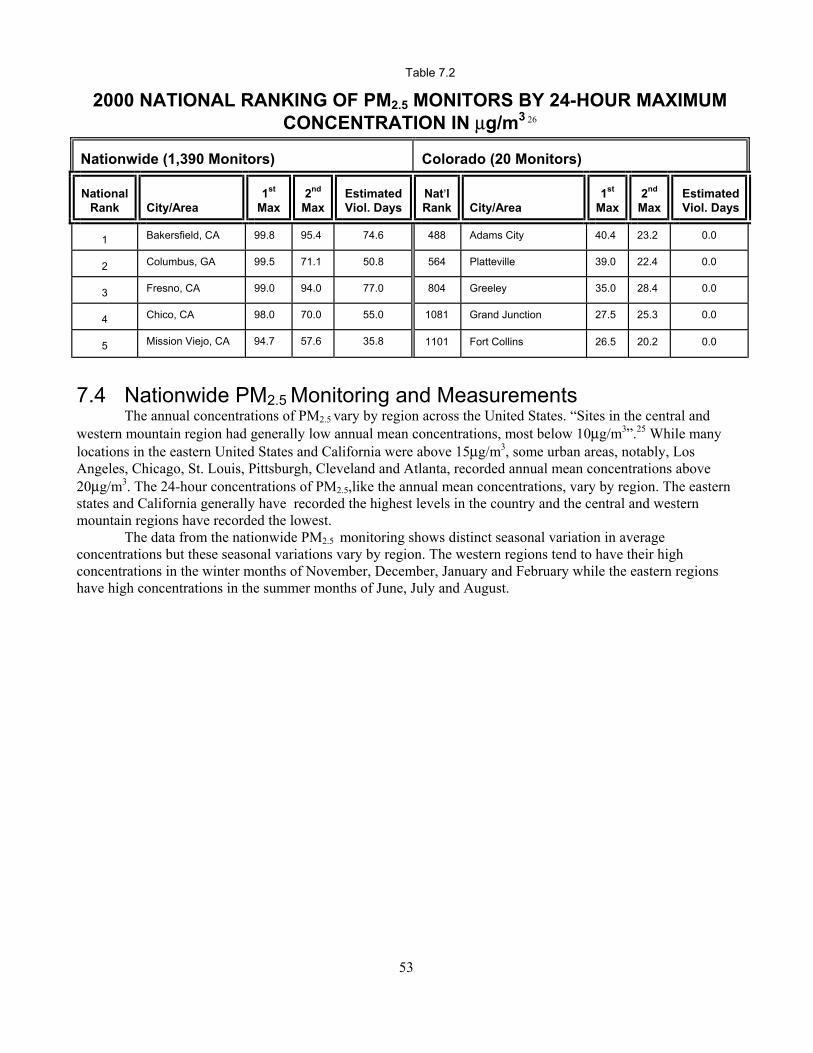
53
Table 7.2
2000 NATIONAL RANKING OF PM2.5 MONITORS BY 24-HOUR MAXIMUM CONCENTRATION IN µg/m3 26
Nationwide (1,390 Monitors)
Colorado (20 Monitors)
National
Rank
City/Area
1st
Max
2nd
Max
Estimated Viol. Days
Nat=l Rank
City/Area
1st
Max
2nd
Max
Estimated Viol. Days
1 Bakersfield, CA 99.8 95.4 74.6 488 Adams City 40.4 23.2 0.0
2 Columbus, GA 99.5 71.1 50.8 564 Platteville 39.0 22.4 0.0
3 Fresno, CA 99.0 94.0 77.0 804 Greeley 35.0 28.4 0.0
4 Chico, CA 98.0 70.0 55.0 1081 Grand Junction 27.5 25.3 0.0
5 Mission Viejo, CA 94.7 57.6 35.8 1101 Fort Collins 26.5 20.2 0.0
7.4 Nationwide PM2.5 Monitoring and Measurements The annual concentrations of PM2.5 vary by region across the United States. “Sites in the central and western mountain region had generally low annual mean concentrations, most below 10µg/m3”.25 While many locations in the eastern United States and California were above 15µg/m3, some urban areas, notably, Los Angeles, Chicago, St. Louis, Pittsburgh, Cleveland and Atlanta, recorded annual mean concentrations above 20µg/m3. The 24-hour concentrations of PM2.5,like the annual mean concentrations, vary by region. The eastern states and California generally have recorded the highest levels in the country and the central and western mountain regions have recorded the lowest. The data from the nationwide PM2.5 monitoring shows distinct seasonal variation in average concentrations but these seasonal variations vary by region. The western regions tend to have their high concentrations in the winter months of November, December, January and February while the eastern regions have high concentrations in the summer months of June, July and August.

54

55
8.0 LEAD 8.1 Physical Characteristics and Sources
Lead gasoline additives, nonferrous smelters and battery plants are the most significant contributors to atmospheric lead emissions. In 1992, transportation sources contributed 31 percent of the annual emissions; this was down significantly from 1985 when transportation accounted for approximately 85 percent of the total lead emissions. In 1999, transportation accounted for only 12.8 percent of the total lead emissions.27 The initial strategy for controlling lead in the environment was to decrease the lead content in gasoline. Refining companies have reduced the lead content of their products from as high as six grams per gallon in the early 1970s to 0.5 grams per gallon or less by July 1, 1985, and to 0.1 gram per gallon by January 1, 1986. Some manufacturers have eliminated lead entirely and others have introduced lead substitutes to prevent excess wear on valve stems and valve seats in older cars. Leaded gasoline sales have declined since the introduction of unleaded gas in 1975; the national average is less than 1 percent of gasoline sales.27 8.2 Health and Welfare Effects
Exposure to lead can occur through several pathways, including inhalation of contaminated air and ingestion of lead in food, water, soil or dust. Excessive lead exposure can cause seizures, mental retardation and/or behavioral disorders. Low doses of lead can lead to central nervous system damage. Recent studies have also shown that lead may be a factor in high blood pressure and in subsequent heart disease in middle-aged white males.27
The nervous system is most sensitive to the effects of lead. Neurologic deficits have been found in children with lead levels previously thought to cause no harmful outcomes. These effects include low IQ scores and deficits in speech, language processing, attention and classroom performance. Learning and behavioral abnormalities have been associated with lead levels of less than 25 micrograms per deciliter of blood (µg/dL).28
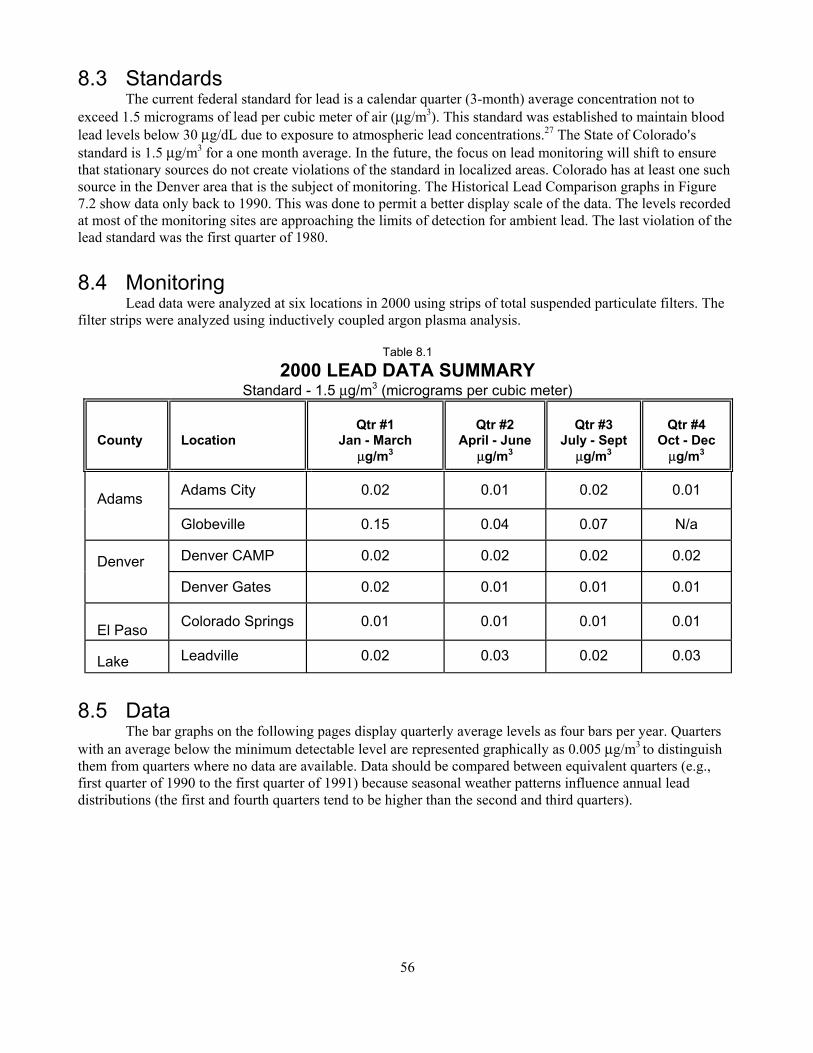
56
8.3 Standards The current federal standard for lead is a calendar quarter (3-month) average concentration not to
exceed 1.5 micrograms of lead per cubic meter of air (µg/m3). This standard was established to maintain blood lead levels below 30 µg/dL due to exposure to atmospheric lead concentrations.27 The State of Colorado=s standard is 1.5 µg/m3 for a one month average. In the future, the focus on lead monitoring will shift to ensure that stationary sources do not create violations of the standard in localized areas. Colorado has at least one such source in the Denver area that is the subject of monitoring. The Historical Lead Comparison graphs in Figure 7.2 show data only back to 1990. This was done to permit a better display scale of the data. The levels recorded at most of the monitoring sites are approaching the limits of detection for ambient lead. The last violation of the lead standard was the first quarter of 1980. 8.4 Monitoring
Lead data were analyzed at six locations in 2000 using strips of total suspended particulate filters. The filter strips were analyzed using inductively coupled argon plasma analysis.
Table 8.1
2000 LEAD DATA SUMMARY Standard - 1.5 µg/m3 (micrograms per cubic meter)
County
Location
Qtr #1
Jan - March µg/m3
Qtr #2
April - June µg/m3
Qtr #3
July - Sept µg/m3
Qtr #4
Oct - Dec µg/m3
Adams Adams City 0.02 0.01 0.02 0.01 Globeville 0.15 0.04 0.07 N/a Denver Denver CAMP 0.02 0.02 0.02 0.02 Denver Gates 0.02 0.01 0.01 0.01
El Paso Colorado Springs 0.01 0.01 0.01 0.01 Lake Leadville 0.02 0.03 0.02 0.03
8.5 Data
The bar graphs on the following pages display quarterly average levels as four bars per year. Quarters with an average below the minimum detectable level are represented graphically as 0.005 µg/m3 to distinguish them from quarters where no data are available. Data should be compared between equivalent quarters (e.g., first quarter of 1990 to the first quarter of 1991) because seasonal weather patterns influence annual lead distributions (the first and fourth quarters tend to be higher than the second and third quarters).
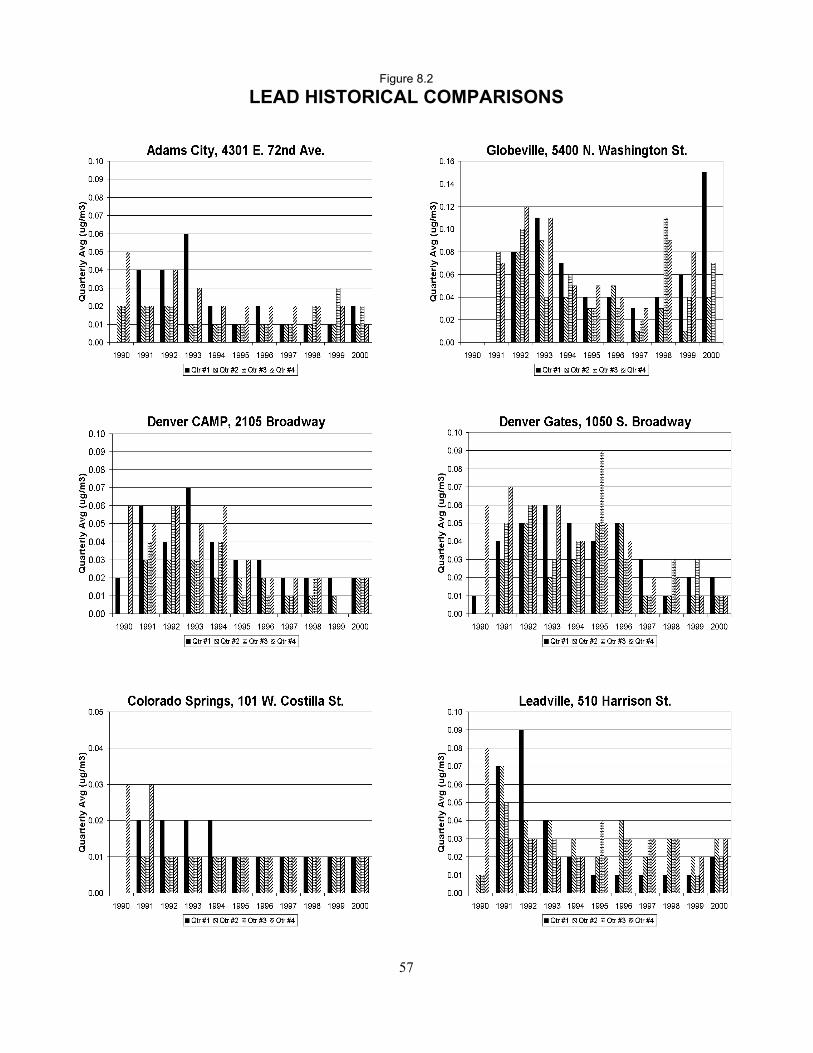
57
Figure 8.2 LEAD HISTORICAL COMPARISONS
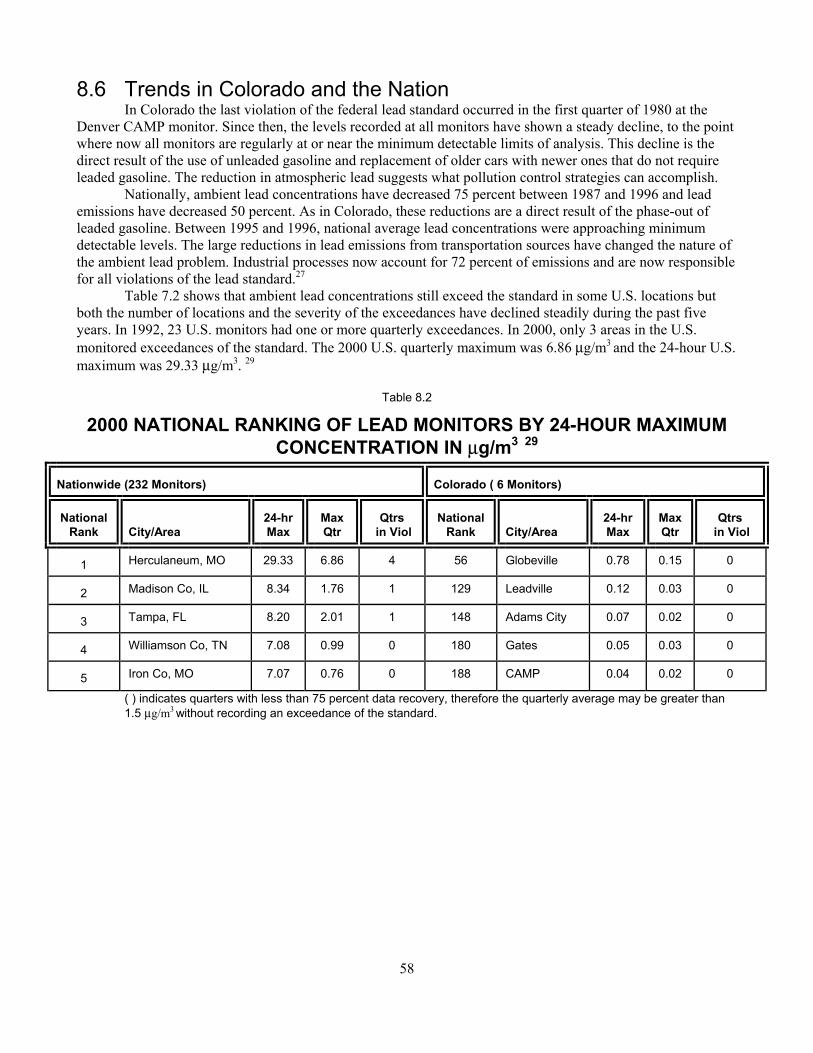
58
8.6 Trends in Colorado and the Nation In Colorado the last violation of the federal lead standard occurred in the first quarter of 1980 at the
Denver CAMP monitor. Since then, the levels recorded at all monitors have shown a steady decline, to the point where now all monitors are regularly at or near the minimum detectable limits of analysis. This decline is the direct result of the use of unleaded gasoline and replacement of older cars with newer ones that do not require leaded gasoline. The reduction in atmospheric lead suggests what pollution control strategies can accomplish.
Nationally, ambient lead concentrations have decreased 75 percent between 1987 and 1996 and lead emissions have decreased 50 percent. As in Colorado, these reductions are a direct result of the phase-out of leaded gasoline. Between 1995 and 1996, national average lead concentrations were approaching minimum detectable levels. The large reductions in lead emissions from transportation sources have changed the nature of the ambient lead problem. Industrial processes now account for 72 percent of emissions and are now responsible for all violations of the lead standard.27
Table 7.2 shows that ambient lead concentrations still exceed the standard in some U.S. locations but both the number of locations and the severity of the exceedances have declined steadily during the past five years. In 1992, 23 U.S. monitors had one or more quarterly exceedances. In 2000, only 3 areas in the U.S. monitored exceedances of the standard. The 2000 U.S. quarterly maximum was 6.86 µg/m3 and the 24-hour U.S. maximum was 29.33 µg/m3. 29
Table 8.2
2000 NATIONAL RANKING OF LEAD MONITORS BY 24-HOUR MAXIMUM CONCENTRATION IN µg/m3 29
Nationwide (232 Monitors)
Colorado ( 6 Monitors)
National
Rank
City/Area
24-hr Max
Max Qtr
Qtrs
in Viol
National
Rank
City/Area
24-hr Max
Max Qtr
Qtrs
in Viol
1 Herculaneum, MO 29.33 6.86 4 56 Globeville 0.78 0.15 0
2 Madison Co, IL 8.34 1.76 1 129 Leadville 0.12 0.03 0
3 Tampa, FL 8.20 2.01 1 148 Adams City 0.07 0.02 0
4 Williamson Co, TN 7.08 0.99 0 180 Gates 0.05 0.03 0
5 Iron Co, MO 7.07 0.76 0 188 CAMP 0.04 0.02 0
( ) indicates quarters with less than 75 percent data recovery, therefore the quarterly average may be greater than 1.5 µg/m3 without recording an exceedance of the standard.
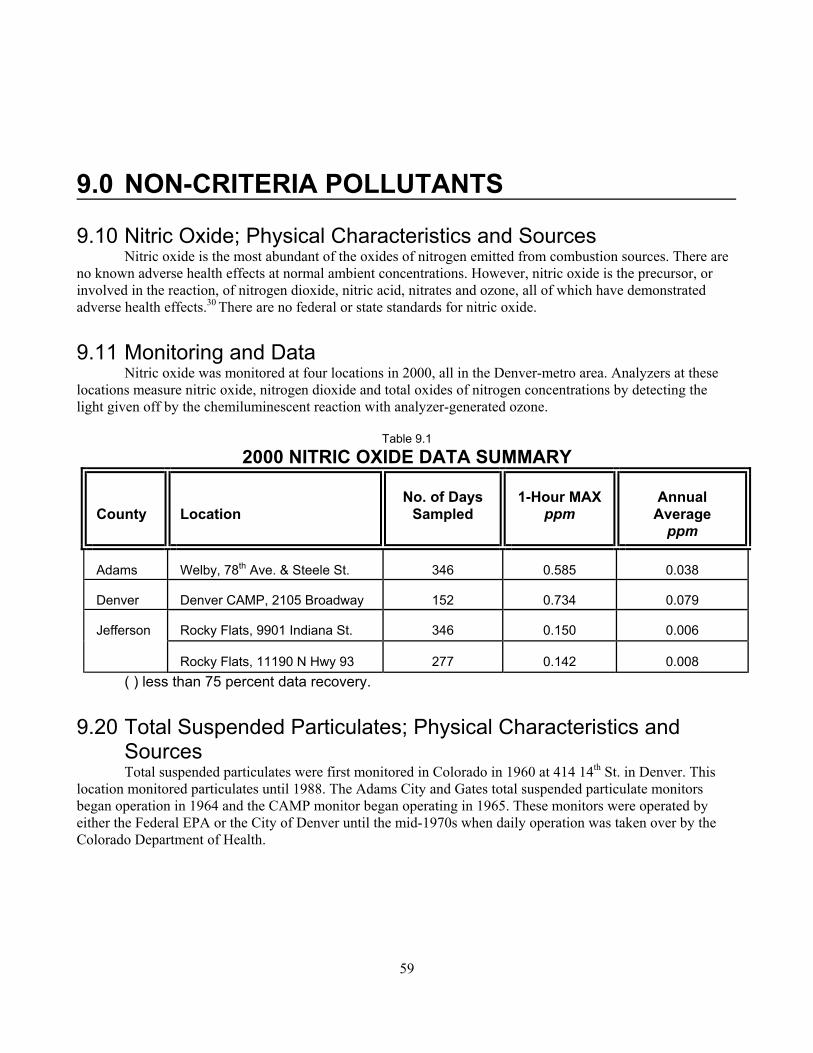
59
9.0 NON-CRITERIA POLLUTANTS
9.10 Nitric Oxide; Physical Characteristics and Sources
Nitric oxide is the most abundant of the oxides of nitrogen emitted from combustion sources. There are no known adverse health effects at normal ambient concentrations. However, nitric oxide is the precursor, or involved in the reaction, of nitrogen dioxide, nitric acid, nitrates and ozone, all of which have demonstrated adverse health effects.30 There are no federal or state standards for nitric oxide. 9.11 Monitoring and Data
Nitric oxide was monitored at four locations in 2000, all in the Denver-metro area. Analyzers at these locations measure nitric oxide, nitrogen dioxide and total oxides of nitrogen concentrations by detecting the light given off by the chemiluminescent reaction with analyzer-generated ozone.
Table 9.1
2000 NITRIC OXIDE DATA SUMMARY County
Location
No. of Days
Sampled
1-Hour MAX
ppm
Annual
Average ppm
Adams
Welby, 78th Ave. & Steele St.
346
0.585
0.038
Denver
Denver CAMP, 2105 Broadway
152
0.734
0.079
Jefferson
Rocky Flats, 9901 Indiana St.
346
0.150
0.006
Rocky Flats, 11190 N Hwy 93
277
0.142
0.008
( ) less than 75 percent data recovery. 9.20 Total Suspended Particulates; Physical Characteristics and
Sources Total suspended particulates were first monitored in Colorado in 1960 at 414 14th St. in Denver. This
location monitored particulates until 1988. The Adams City and Gates total suspended particulate monitors began operation in 1964 and the CAMP monitor began operating in 1965. These monitors were operated by either the Federal EPA or the City of Denver until the mid-1970s when daily operation was taken over by the Colorado Department of Health.

60
Particulate monitoring expanded to more than 70 locations around the state by the early 1980s. The primary standards for total suspended particulates were 260 µg/m3 as a 24-hour sample and 75 µg/m3 as an annual geometric mean. On July 1, 1987, with the promulgation of the PM10 standards, the old particulate standards were eliminated. The reason that TSP samplers are still in operation is to measure particulate sulfates, lead and other metals such as cadmium, arsenic and zinc found in particulates. Table 9.2 lists data from those total suspended particulate monitors in operation in 2000. While there are still monitors that exceed the old standards, as can be seen by comparing the current data to the historical maximums in Table 9.3, the levels have declined dramatically.
Table 9.2 2000 TOTAL SUSPENDED PARTICULATES DATA SUMMARY
County
Location
No. of Days
Sampled
*24-Hr Max
µg/m3
*24-Hr
2nd Max µg/m3
*Annual
Geometric Mean µg/m3
Adams Adams City 58 201 172 94
Globeville, 5400 N. Washington St. 118 263 227 94
Denver Denver CAMP, 2105 Broadway 48 147 141 (87)
Denver Gates, 1050 S. Broadway 58 113 112 63
El Paso Colorado Spgs, 101 W. Costilla St. 58 161 133 50
Jefferson Rocky Flats, 16600 W. Hwy #128 44 91 79 (36)
Rocky Flats, 11501 Indiana St. 49 102 96 (39)
Rocky Flats, 9901 Indiana St. 49 124 78 (35)
Rocky Flats, 1800 W. Hwy #72 52 108 84 (35)
Rocky Flats, 11190 Hwy #93 43 111 110 (49)
Lake Leadville, 510 Harrison Ave. 53 112 105 (34) * These columns should be compared to the old particulate standards of 260 µg/m3 for the 24-hr concentration or 75 µg/m3 as an annual geometric mean.
Table 9.3 STATEWIDE HISTORICAL MAXIMUM TOTAL SUSPENDED PARTICULATES
24-HOUR CONCENTRATIONS
Rank Concentration in µg/m3 Monitor Date 1
2856
Johnstown
March 2, 1974
2
1180
Denver CAMP
October 3, 1974
3
1048
Windsor
March 3, 1974
4
1033
Lamar, Power Plant, 100 2nd Ave.
March 2, 1976
5
983
Steamboat Springs, 136 6th St.
March 3, 1978

61
9.30 Sulfates; Physical Characteristics and Sources Sulfates are any of the group of compounds that contain the sulfate ion. Sulfates are generally found as
fine particulate matter with a diameter of 2.5 microns or less (PM2.5). Natural sources of sulfates include sea spray and volcanic eruptions. Sulfates can also be directly emitted from the application of fertilizers and some industrial sources. However, most sulfates are secondary particulates not directly emitted from a source but created by the oxidation of sulfur dioxide. Sulfur dioxide can be transformed into sulfate by several atmospheric chemical reactions. These various reactions involve water vapor, ozone, hydrocarbons, peroxides or free radicals. Atmospheric sulfates usually exist as sulfuric acid or ammonium sulfate.31 9.31 Health and Welfare Effects
Health impacts are associated with acidic sulfate aerosols. In laboratory studies, short-term exposures of 100 µg/m3 of sulfuric acid, a level at the extremely high end of the ambient concentrations, have been shown to cause respiratory impairment in some healthy adults and no effect in others. Some studies have shown decreased lung function in exercising adolescent asthmatics, while other studies have shown no adverse effects on this group at 100 µg/m3 sulfuric acid. Increased respiratory difficulties are seen with exposures to sulfur dioxide. Further sensitivity studies are necessary to find the health impacts of sulfate. 32,33
Fine particulate sulfate is efficient at scattering light; thus, it is a factor in visibility degradation. Even at low concentrations, below 3 µg/m3, sulfate will affect visibility. The light-scattering potential of sulfate increases with increasing relative humidity. Seasonal changes in sulfate levels are associated with seasonal changes in visual range in the western United States.34 Section 10 of this report provides further discussion concerning visibility issues in Colorado.
Sulfate compounds, as acid deposition, can adversely affect aquatic and terrestrial ecosystems. Water supplies are affected when minerals are leached from the soil by acid deposition. Drinking water containing either sulfates or leached metals can cause human health problems.
No standards have been promulgated for sulfates. Control of sulfates is achieved by federal ambient and source emissions standards for sulfur dioxide and PM10. 9.32 Monitoring and Data
Sulfates were monitored at two locations in 2000. Sulfates are measured by extracting the water soluble fraction of the total suspended particulate collected on glass fiber filters. The concentration of sulfates is determined using ion chromatography.
The sulfate concentrations have remained consistent for the past 10 years and seem to depend more on location than other factors. The 24-hour maximums have shown more year to year variation but have been fairly consistent for the past 10 years as well.
Table 9.4
2000 SULFATE DATA SUMMARY County Location Annual Average
(µg/m3) 24-hour Max
(µg/m3) Adams
Adams City
5.6
9.2
Denver Denver CAMP 5.5 9.4

62

63
10.0 VISIBILITY 10.1 Physical Characteristics and Sources
Visibility is unique among air pollution effects in that it involves human perception and judgment. It has been described as the maximum distance that an object can be perceived against the background sky. Visibility also refers to the clarity with which the form and texture of distant, middle and near details can be seen as well as the sense of the trueness of their apparent coloration. As a result, measures of visibility serve as surrogates of human perception. There are several ways to measure visibility but none of them tell the whole story or completely measure visibility as it is experienced by human beings.
The cause of visibility impairment in Colorado is most often fine particles in the 0.1 to 2.5 micrometer size range (one micrometer is a millionth of a meter). Light passing from a vista to an observer is either scattered away from the sight path or absorbed by the atmospheric fine particulate. Sunlight entering the pollution cloud may be scattered into the sight path adding brightness to the view and making it difficult to see elements of the vista. Sulfate, nitrate, elemental carbon and organic carbon are the types of particulate matter most effective at scattering and/or absorbing light. The man-made sources of these particulates include woodburning, electric power generation, industrial combustion of coal or oil, and emissions from cars, trucks and buses.
Visibility conditions vary considerably across the state. Usually, visibility in Colorado is among the best in the country. Our prized western vistas exist due to unique combinations of topography and scenic features and because air in much of the west contains low humidity and minimal levels of visibility-degrading pollution. Nevertheless, visibility problems occur periodically throughout the state.
Woodburning haze is a concern in several mountain communities each winter. Denver's "Brown Cloud" persists and other major population centers in Colorado are concerned about the potential for worsening visibility. Monitoring performed in and near national parks, monuments, and wilderness areas shows pollution-related visibility impairment occurring in these areas in Colorado. The type of impairment most often impacting Colorado's important scenic mountain views is known as regional haze. It is characterized by having many sources and interstate or even regional scale transport between source areas and areas of impact.
The visibility problems across the state have raised public concern and spurred research. The goal of Colorado's visibility program is to protect visual air quality where it is presently good and improve visibility where it is degraded. 10.2 Health and Welfare Effects
Visual air quality is an element of public welfare. Specifically, it is an important aesthetic, natural and economic resource of the state of Colorado. The worth of visibility is difficult to measure, yet good visibility is something that people undeniably value. Impaired visibility can affect the enjoyment of a recreational visit to a scenic mountain area. Similarly, people prefer to have clear views from their homes and offices. These concerns are often reflected in residential property values and office rents. Any loss in visual air quality may contribute to corresponding losses in tourism and usually make an area less attractive to residents, potential newcomers and industry.
There is increasing information that shows a correlation between ambient concentrations of particulate matter and respiratory illnesses. Some researchers believe this link may be strongest with levels of fine particles, which also contribute to visibility impairment. In July 1997, the EPA developed a National Ambient Air Quality Standard for particulate matter less than 2.5 microns in diameter (PM2.5). See the chapter 7 for more information

64
on Colorado=s PM2.5 monitoring program and the status of the standard. Any control strategies to lower ambient concentrations of fine particulate matter for health reasons will also improve visibility. 10.3 Standards
The Colorado Air Quality Control Commission established a visibility standard in 1990 for the Front Range cities from Fort Collins to Colorado Springs. The standard, an atmospheric extinction of 0.076 per kilometer, was based on the public's definition of unacceptable amounts of haze as judged from slides of different haze levels taken in the Denver area. At the standard, 7.6 percent of the light in a kilometer of air is blocked. The standard applies from 8 a.m. to 4 p.m. each day, during those hours when the relative humidity is less than 70 percent. Visibility, along with meteorology and levels of other pollutants for which National Ambient Air Quality Standards exist, is used to determine the need for mandatory woodburning and voluntary driving restrictions.
There is no quantitative visibility standard for Colorado's pristine and scenic rural areas. However, in the 1977 amendments to the Federal Clean Air Act, Congress added Section 169a35 and established a national visibility goal that created a qualitative standard of "the prevention of any future and the remedying of any existing, impairment of visibility in mandatory Class I federal areas which impairment results from manmade air pollution”. The implementation of Section 169a has led to federal requirements to protect visual air quality in large national parks and wilderness areas.36 Colorado has 12 of these Class I areas. Federal and state law prohibits visibility impairment in national parks and wildernesses due to large stationary sources of air pollution. 10.4 Monitoring
There are several ways to measure visibility. Currently, the Division uses camera systems to provide qualitative visual documentation of a view. Transmissometers and nephelometers are used to measure the atmosphere=s ability to attenuate light quantitatively.
The camera systems consist of a specially constructed 35mm camera that automatically takes slides at regularly scheduled times each day. For slides taken before March 1992, the visual range in kilometers was calculated using densitometry. Since then, the slides are taken and archived for view documentation.
A visibility site was installed in Denver in late 1990 using a long path transmissometer. Visibility in the downtown area is monitored using a receiver located near Cheeseman Park and a transmitter located on the roof of a downtown building. This instrument directly measures light extinction, which is proportional to the ability of atmospheric particles and gases to attenuate image forming light as it travels from an object to an observer. The visibility standard is stated in units of atmospheric extinction. Days when visibility is affected by rain, snow or high relative humidity are not counted as violations of the visibility standard. In September 1993, a transmissometer and nephelometer were purchased by the city of Fort Collins to monitor visibility.
In Colorado, several agencies of the federal government, in cooperation with regional and nationwide state air pollution organizations, also monitor visibility in a number of Class I areas, either individually or jointly through the Inter-agency Monitoring of PROtected Visual Environments (IMPROVE) monitoring program. The goals of the monitoring programs are to establish background visibility levels, identify trends of deterioration or improvement and to identify suspected sources of visibility impairment. Visibility and the atmospheric constituents that cause visibility degradation are characterized with camera systems, transmissometers and extensive fine-particle chemical composition measurements by the monitoring network. There are currently monitoring sites in Rocky Mountain National Park, Mesa Verde National Park, Weminuche Wilderness, Mount Zirkel Wilderness, Great Sand Dunes National Monument and Maroon Bells/Snowmass Wilderness. These data are not contained in this report, but will be available at this web site address: http://alta_vista.cira.colostate.edu
In addition to the fully instrumented sites, the National Park Service, U.S. Forest Service and Bureau of Land Management conduct other visibility monitoring following the same protocol. The National Park Service currently has camera systems in the Colorado and Dinosaur National Monuments. At the Maroon Bells-Snowmass, Eagles Nest and West Elk Wilderness Areas, the U.S. Forest Service operates camera systems.

65
10.5 Data
Information about the number of days each month that exceeded the visibility standard in the Denver metropolitan area as monitored by a transmissometer is presented in Table 10.1. This table shows the number of days when visual air quality was above or below the standard and days when the standard was not applicable because of high relative humidity or when the transmissometer was out of service.
There are definite seasonal variations in visibility in the Denver metropolitan area. Generally, the visibility standard is exceeded more often during the summer months. This may be surprising since the Denver metropolitan area's most noticeable ABrown Cloud@ episodes seem to occur during the winter. During the years when visual range was calculated using the slides from the camera system, this same pattern was also monitored. This is due to the great difference in atmospheric condition between summer and winter. Episodes of poor visual air quality in Denver during the winter are characterized by dark brown ground-based hazes, often only a few hundred meters in depth. The type of haze most often seen during the summer is called uniform haze. Uniform haze episodes are usually characterized as a whitish-gray color or as a uniform "gauze”.
Table 10.1
Denver Visibility Standard Exceedance Days (Transmissometer Data)
January 2000 – December 2000 Month Days EX POOR POOR FAIR GOOD Missing W(>70% RH)
January 31 31 February 29 29
March 31 2 4 3 20 2 April 30 1 13 14 1 1 May 31 2 8 18 3 June 30 1 5 22 1 1 July 31 9 16 3 2 1
August 31 4 11 10 3 2 1 September 30 10 13 4 3
October 31 3 9 10 1 8 November 30 2 13 10 2 3 December 31 4 6 13 2 2 4
TOTALS 366 19 88 129 16 87 27

66
Figure 10.1 charts the percent of days for each visibility index category. During the year visibility was in the good or fair categories for 40 percent of the days in Denver. Visibility in the poor category occurred 24 percent of the time. Extremely poor visibility was monitored for 5 percent of the year or 19 days. The AMissing@ category is separated into those days lost to calibration and maintenance of the instrument and those days not
counted because the humidity was above 70 percent. High humidity in the air reduces light transmission the way particles can. Visibility monitoring began in late 1993 in Fort Collins. Table 10.2 charts the number of days when visual air quality in Fort Collins was above or below the standard and the number of days that data are not available. Visibility was below the standard 114 days of the year (29 percent of the year). Days with poor visibility occurred less frequently in Fort Collins than in Denver. Visibility was above the standard during 189 days (40 percent of the year). Figure 10.2 charts the percent of days for each visibility index category. The AMissing@ category is separated into those days lost to calibration and maintenance of the instrument and those days not counted because the humidity was above 70 percent. High humidity in the air reduces light transmission the way particles can.

67
Table 10.2 Fort Collins Visibility Standard Exceedance Days
(Transmissometer Data) January 2000 – December 2000
Month Days EX POOR POOR FAIR GOOD Missing W(>70% RH) January 31 12 9 8 1 1 February 29 7 10 9 3
March 31 1 7 14 3 6 April 30 1 7 13 6 2 1 May 31 9 15 1 3 3 June 30 1 9 13 2 4 1 July 31 7 20 2 1 1
August 31 1 17 13 September 30 1 2 2 5 15 5
October 31 7 12 3 9 November 30 2 8 13 3 4 December 31 5 10 10 3 3
TOTALS 12 102 144 45 26 37

68
10.6 Summary Visibility impairment is the most noticeable effect of air pollution. It is a problem throughout the state
of Colorado. Impairment of visibility occurs in both urban and rural communities. Routine monitoring of visibility in the Fort Collins and Denver areas is providing information about the frequency, intensity and potential sources of impairment. Visibility impairment also occurs in national parks, wilderness areas and other scenic mountain areas. The Division continues to work closely with federal land managers to monitor visual air quality in these sensitive areas.

69
REFERENCES 1. National Primary and Secondary Ambient Air Quality Standards, Title 40 Code of Federal Regulation,
Pt. 50. 1999 ed. 2. Environmental Protection Agency, Air Quality Criteria for Carbon Monoxide, U.S. Government
Printing Office, Washington, October 1979, EPA-600/8-79-022. 3. Air Pollution Control Division, Colorado Implementation Plan for Carbon Monoxide Support
Document, Chapter #6, Colorado Department of Public Health and Environment, October, 1994. 4. Environmental Protection Agency, National Air Quality and Emissions Trends Report, 1999, Carbon
Monoxide, Mod September 5, 2001. 5. National Primary and Secondary Ambient Air Quality Standards for Carbon Monoxide, Title 40 Code
of Federal Regulations, Pt. 50.8. 1999 ed. 6. United States Carbon Monoxide Air Quality Monitors (2000), Monitor Ranking Report, Available:
www.epa.gov/air/data/monvals.html. Ranking [September 2001]. 7. Hempel and Hawley, The Encyclopedia of Chemistry, 3rd Ed., Van Nostrand Reinhold Co., New York
City; 1973. 8. Environmental Protection Agency, National Air Quality and Emissions Trends Report, 1999, Ozone,
Mod September 5, 2001. 9. Environmental Protection Agency, National Ambient Standards for Ozone: Final Rule, Title 40 Code of
Federal Regulations Pt. 50, July 18, 1997. 10. Environmental Protection Agency, Aerometric Information Retrieval System, Quick Look Report,
Ozone, September 2001. 11. United States Ozone Air Quality Monitors (2000), Monitor Ranking Report, Available:
www.epa.gov/air/data/monvals.html. Ranking [September 2001]. 12. Air Pollution Control Division, Mobile Sources Vehicles Travel Projections, January 1997 13. Environmental Protection Agency, National Air Quality and Emissions Trends Report, 1999, Nitrogen
Dioxide, Mod September 5, 2001. 14. Environmental Protection Agency Strategies and Air Standards Division, Preliminary Assessment of
Health and Welfare Effects Associated with Nitrogen Oxides for Standards Setting Purposes, U.S. Government Printing Office, Washington: October 1981, pp i-iii.
15 Environmental Protection Agency, Aerometric Information Retrieval System, Quick Look Report, Nitrogen Dioxide, September 2001. 16. United States Nitrogen Dioxide Air Quality Monitors (2000), Monitor Ranking Report, Available:

70
www.epa.gov/air/data/monvals.html. Ranking [September 2001].
17. Environmental Protection Agency, National Air Quality and Emissions Trends Report, 1999, Sulfur
Dioxide. Mod September 5, 2001. 18. Sulfur Dioxide, Minimal Lethal Exposure and Maximum Tolerated Exposure, in TOMES Medical
Management file[database online]. Colorado Department of Public Health and Environment, 1995 [cited September 12, 1995]. Available from Micromedex Inc. Englewood, CO.
19. National Primary and Secondary Ambient Air Quality Standards for Sulfur Dioxide, Title 40 Code of
Federal Regulations, Pt. 50.5. 1999 ed. 20. United States Sulfur Dioxide Air Quality Monitors (2000), Monitor Ranking Report, Available:
www.epa.gov/air/data/monvals.html. Ranking [September 2001]. 21. The Perils of Particulates, American Lung Association, New York, New, York, March 1994. 22. Environmental Protection Agency, National Air Quality and Emissions Trends Report, 1999. Particulate
Matter. Mod September 5, 2001. 23. National Primary and Secondary Ambient Air Quality Standards for Particulate Matter, Title 40 Code of
Federal Regulation, Pt. 50.7. 1999 ed. 24. United States PM10 Air Quality Monitors (2000), Monitor Ranking Report, Available:
www.epa.gov/air/data/monvals.html. Ranking [September 2001]. 25. Environmental Protection Agency, National Air Quality and Emissions Trends Report, 1999. Particulate
Matter. Mod September 5, 2001. 26. United States PM2.5 Air Quality Monitors (2000), Monitor Ranking Report, Available:
www.epa.gov/air/data/monvals.html. Ranking [September 2001]. 27. Environmental Protection Agency, National Air Quality and Emissions Trends Report, 1999. Lead.
Mod September 5, 2001.
28. Royce, Overview of Radon, Lead and Asbestos Exposure, American Family Physicians Supplement, November 1991, Vol. 44 S52-S62.
29. United States Lead Air Quality Monitors (2000), Monitor Ranking Report, Available:
www.epa.gov/air/data/monvals.html. Ranking [September 2001]. 30. Environmental Protection Agency, Air Quality Criteria for Oxides of Nitrogen, December 1982,
AP 600/8-82-029aF. 31. Marrow, P.E. and M.J. Utell, Technology and Methodology of Clinical Exposure to Aerosols, Aerosols,
S.D. Lee, Editor, Lewis Publishers, Inc., 1986, pp 671-681. 32. Hacknay J.D., W.S. Linn and E.L. Avol, Controlled Exposures of Human Volunteers to Particulate
Pollution: Recent Findings and Current Research Questions, Aerosols, S.D. Lee, Editor, Lewes Publications, Inc., 1986, 699-709.

71
33. Loiy, P.J. and M. Lipann, Measurements of Exposures to Acid Sulfuric Aerosols, Aerosols, S.D. Lee,
Editor, Lewes Publications, Inc., 1986, 699-709. 34. W.C. Malm, et Visibility and Particulate Measurements in the Western United States, presented at the
78th Annual Meeting of APCA, June 1985. 35. Clean Air Act as amended in 1977, section 169a (42 USC 7491) 36. Visibility Protection for Federal Class I Areas, codified at Title 40 Code of Federal Regulations,
Pt. 51.300-309.