Embed Size (px)
Citation preview
Colorado All Payer Claims Database Annual Report • 2018
Celebrating Five Years of Creating Knowledge
The Center for Improving Value in Health Care (CIVHC) is an objective, not-for-profit organization striving to empower individuals, communities, and organizations advancing the Triple Aim of better health, better care, and lower costs. Through services, health data, and analytics, we partner with Change Agents driving towards the Triple Aim for all Coloradans. We believe that together we can alter the trajectory of health care and are privileged to serve those creating a better health system for us all.
Who is CIVHC?
In 2010, the Executive Director of the Colorado Department of Health Care Policy and Financing (HCPF) appointed CIVHC the administrator of the Colorado All Payer Claims Database (CO APCD). The CO APCD is a state-legislated, secure health care claims database compliant with all federal privacy laws. The complexity and scale of the database grows each month. It is the only claims repository in the state that represents the majority of insured lives in Colorado, with more than nine years of data from commercial health insurance payers, Medicaid and Medicare. CIVHC makes this information available publicly and on a non-public basis to consumers, researchers, state agencies, advocacy organizations, nonprofits, and other health care organizations working to improve health care and lower costs for Colorado residents.
What is the CO APCD?
Change Agent • nounIndividual or organization working to lower costs, improve care, and make Colorado healthier.

Previously, CIVHC reported about the CO APCD based on calendar year. In 2018, we are shifting our reporting to align with our fiscal year. This report provides information about fiscal year 2018 (July 2017 –
June 2018), and reflects on the five-year anniversary and growth of this integral statewide resource.
The CO APCD contains claims for approximately three quarters of the covered lives in Colorado, with claims from 39 commercial health insurance plans, including Medicare Advantage and voluntarily submitted self-insured employer plans, plus Medicaid and Medicare Fee-for-Service (FFS) claims. The database has grown significantly since 2012 when CIVHC first received claims from only eight commercial payers and Medicaid.
What’s in the CO APCD
The CO APCD has medical, pharmacy and dental claims, which show what services were performed and how much they cost for both the patient and the insurance company.
Medically Insured Coloradans, CO APCD 2018
23%
77%
Total Insured Coloradans
1.1M - Fully Insured Commercial
1.4M - Medicaid
520K - Medicare Fee-For-Service**
342K - 24% of Self-insured total
528K - Medicare Advantage
5.04M Insured Lives*
“I was really just struck by how unique the CO APCD is, and I think that really helped us to gain
some insight into the problems that we’re trying to address. By hosting us as researchers and promoting our research…CIVHC is really helping us to reach
out to people who are thinking about this stuff and are in a position where they can do more than sit in
the ivory tower.”
– Duke University Graduate Student
761K - 76% of Self-insured total***
Included in the CO APCD
421K - Federal Programs**** (VA, Tricare, etc.)
*Approximate number of insured Coloradans, 2017 Colorado Health Access Survey data.**Medicare FFS volume represents 2017 data as claims are submitted to the CO APCD one year retrospectively.***Self-insured submissions are voluntary, and missing self-insured claims is an estimate based on assumption that self-insured commercial represent 50% of all commercial claims.****Federal insurance program coverage is an estimate of the remaining covered lives as those claims are not submitted to the CO APCD at this time.
Not Included in the CO APCD
As of December 2018
Growth, CO APCD 2012-2018
2018
20
17
2
016
201
5
2
014
201
3
146
2018
20
17
2
016
201
5
2
014
201
3
Claims (in millions) Payers (all)
330
450
510
700
16
22
23
23
33
797 41
1

Payers submit claims for everyone they provide coverage to during the previous period, resulting in over four and a half million claims collected monthly.
When a Coloradan who has health insurance receives a health care service, the provider typically submits a claim for reimbursement to their health insurance company. Once the claim has been paid, the health insurance company submits the information for collection in the CO APCD.
How does the CO APCD work?
CIVHC releases CO APCD data in two ways: non-public releases, licensed by Change Agents working on specific projects to improve care for Coloradans; and public reporting, information on civhc.org designed to foster decision-making at all levels of the health care system, from consumers to state agencies.
What can the CO APCD do?
“In the US, there are different types of insurance for different people, and we have
no idea how people move through the system. All Payer Claims Databases are essentially the
only way to get data to answer these system-wide questions.”
- Sarah Gordon, Doctoral Candidate at Brown University
Custom Data Fulfillments, CO APCD FY13-FY18
FY18
FY
17
F
Y16
FY
15
F
Y14
FY
13 9
FY18
FY
17
F
Y16
FY
15
F
Y14
FY
13
# of Organizations # of Fulfillments
14
34
41
54
9
14
34
91
153
69 163
# of Fulfillments by Stakeholder Group, FY18
4Paye
r
12
Employer
9
Hospitals/P
roviders
8
Consultant/V
endor
83
Government
12
Researcher
Non-Profit35
2
Visit us at www.civhc.org/partner-with-us to learn about how each stakeholder group is
using the CO APCD.
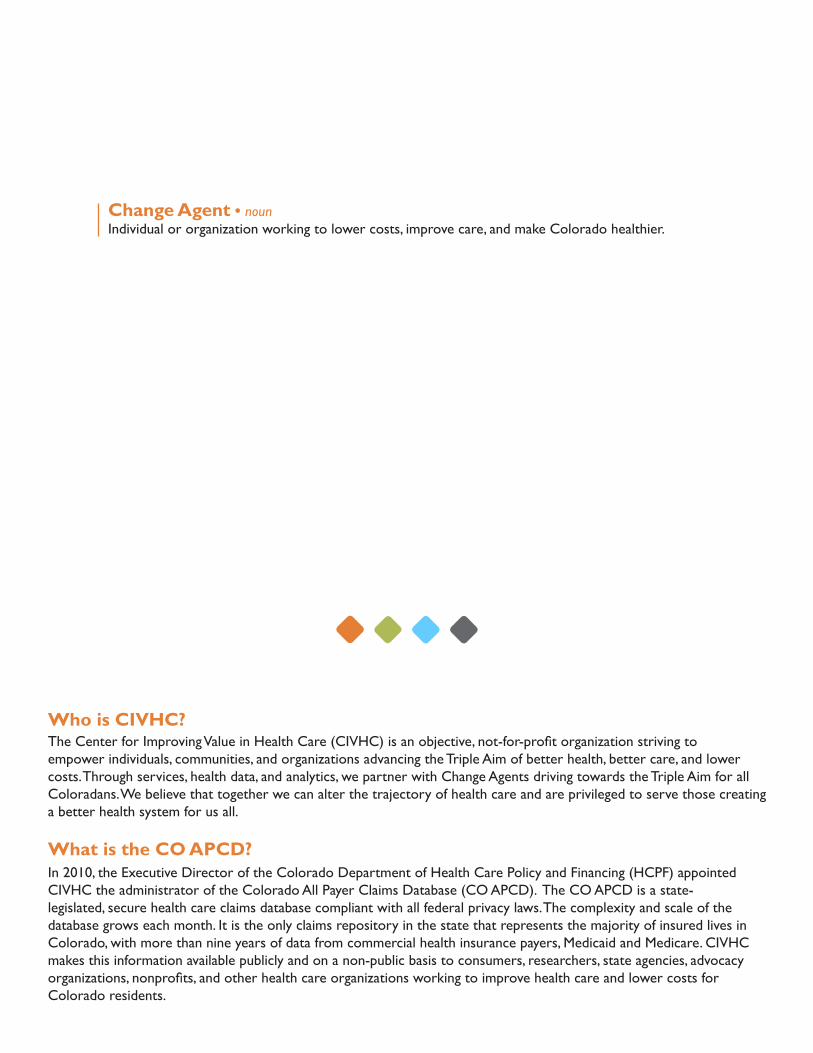
The Colorado General Assembly established the HCPF CO APCD Scholarship Fund in 2014, allocating funds to offset the cost of data for requestors with limited resources. HCPF administers the funds, and requestors must meet specific criteria in order to be considered for the scholarship.
Some organizations have multiple projects partially funded through the HCPF CO APCD Scholarship.
Prior to 2016, requests were counted by applications submitted rather than number of fulfillments provided; meaning if one request had multiple fulfillments (i.e. the State Innovation Model) it was counted once. CIVHC recognized that this did not accurately represent the true number of non-public data releases reported and began reporting each fulfillment individually.
“When we started getting the CO APCD data and analyzing it, we were no longer going on
assumptions. We actually have some hard facts on which to base some of our decision making.”
- Ken Davis, Northwestern Colorado Community Health Partnership
FY14 FY15 FY16 FY17 FY18
6
1922
2521
Scholarship Fulfillments CO APCD, FY14-FY18
Scholarship Recipients, CO APCD FY18
Association for Family Practice Medicine
Col
orad
o C
omm
unity
M
anag
ed C
are
Net
wor
k
Family and Intercultural
Resource C
enter
Bell Policy Center
Colorado Department of Public Health and
the Environment
New Hampshire Insurance Department
Boul
der V
alle
y In
divi
dual
Pr
actic
e A
ssoc
iatio
n
Colorado Health Institute
Northwest Colorado Community Health
Partnership
Catalyst for Payment Reform
Colorado State Legislature
San
Luis
Val
ley
Hea
lth
Part
ners
hip
Colorado African Organization
Dar
tmou
th C
olle
ge
Trailhead Solutions
Colorado Business Group on Health
Department of Justice
University of Colorado
Col
orad
o C
ance
r C
oalit
ion
Doctor’s Care
University of San Francisco
3
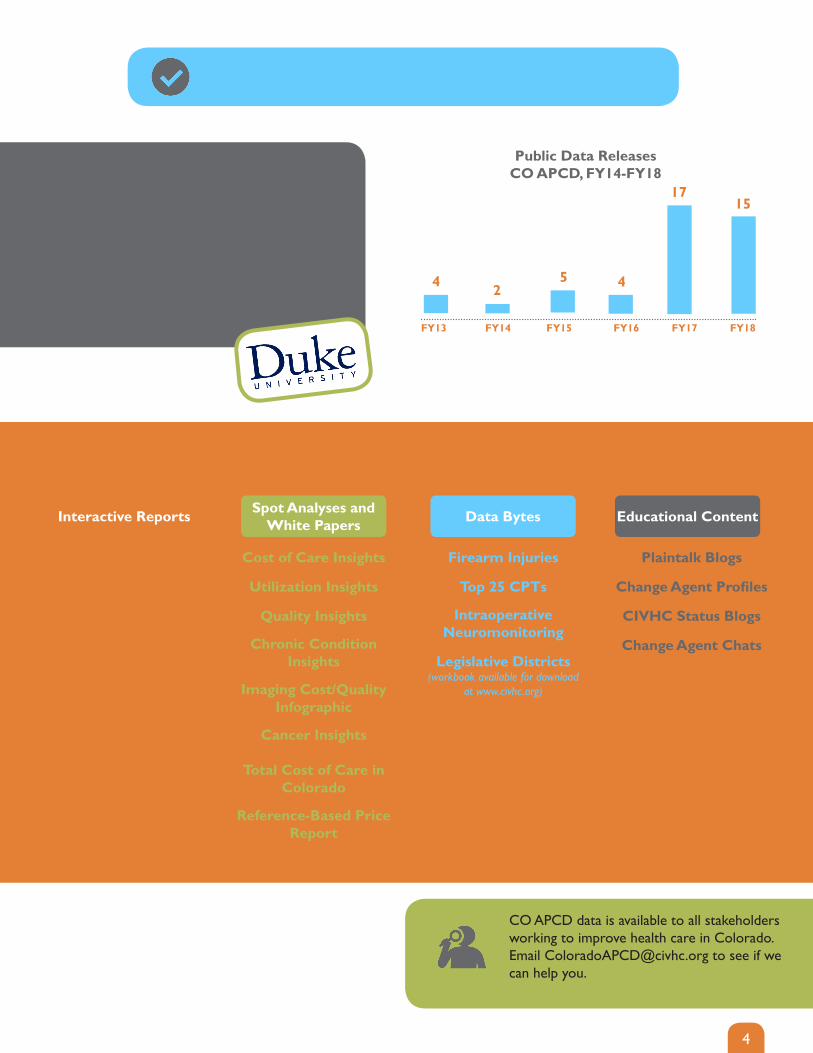
Transparent public reporting of health care information is one of the explicit purposes of the CO APCD per the enabling statute.
“In order to study market-wide phenomenon like we do, you really need a broader data set. What was so wonderful about the CO APCD is that it’s both broad enough, covering so many
payers and the whole state, but it’s also detailed enough that you are looking at
individual-level decisions.”
– Duke University Graduate Student
CO APCD data is available to all stakeholders working to improve health care in Colorado. Email [email protected] to see if we can help you.
FY13 FY14 FY15 FY16 FY17 FY18
4 25 4
17
Public Data ReleasesCO APCD, FY14-FY18
15
Publications, CO APCD - Available at www.civhc.org
Interactive Reports Spot Analyses and White Papers Data Bytes Educational Content
Cost of Care
Utilization
Quality Measures
Condition Prevalence
Reference-Based Price Report
Cost of Care Insights
Utilization Insights
Quality Insights
Chronic Condition Insights
Imaging Cost/QualityInfographic
Cancer Insights
Total Cost of Care in Colorado
Reference-Based Price Report
Firearm Injuries
Top 25 CPTs
Intraoperative Neuromonitoring
Legislative Districts (workbook available for download
at www.civhc.org)
Plaintalk Blogs
Change Agent Profiles
CIVHC Status Blogs
Change Agent Chats
4
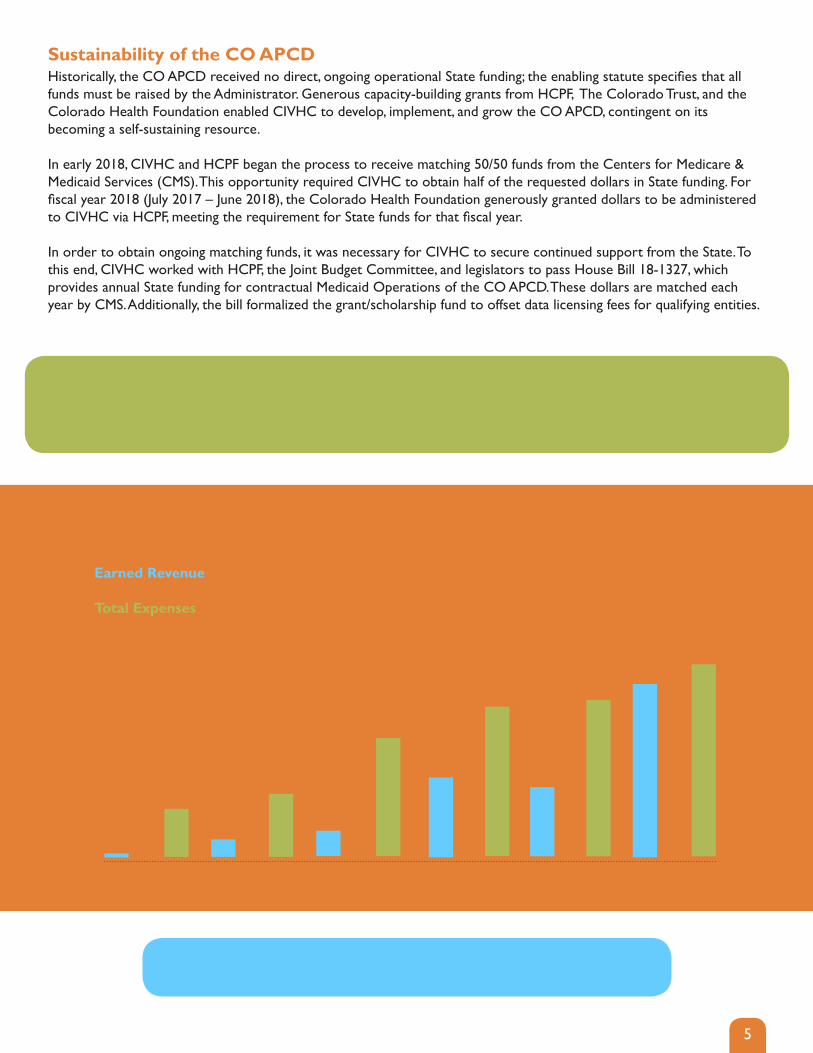
Historically, the CO APCD received no direct, ongoing operational State funding; the enabling statute specifies that all funds must be raised by the Administrator. Generous capacity-building grants from HCPF, The Colorado Trust, and the Colorado Health Foundation enabled CIVHC to develop, implement, and grow the CO APCD, contingent on its becoming a self-sustaining resource.
In early 2018, CIVHC and HCPF began the process to receive matching 50/50 funds from the Centers for Medicare & Medicaid Services (CMS). This opportunity required CIVHC to obtain half of the requested dollars in State funding. For fiscal year 2018 (July 2017 – June 2018), the Colorado Health Foundation generously granted dollars to be administered to CIVHC via HCPF, meeting the requirement for State funds for that fiscal year.
In order to obtain ongoing matching funds, it was necessary for CIVHC to secure continued support from the State. To this end, CIVHC worked with HCPF, the Joint Budget Committee, and legislators to pass House Bill 18-1327, which provides annual State funding for contractual Medicaid Operations of the CO APCD. These dollars are matched each year by CMS. Additionally, the bill formalized the grant/scholarship fund to offset data licensing fees for qualifying entities.
Sustainability of the CO APCD
Ongoing infrastructure and data management costs account for approximately 82 percent of all CO APCD annual expenses. The CO APCD annual budget has increased over time due to a number of factors
including an increase in data storage costs, data intake and management costs related to more submitters, and an increase in volume of public and custom analytics being produced to support the Triple Aim.
The CO APCD now contains approximately 11 terabytes of data, which costs roughly $220,000 per year to store.
FY13 FY14 FY15 FY16 FY17 FY18
CO APCD Earned Revenue, Grant Revenue and Total Expenses, FY13-FY18
$113
,000
Earned RevenueGrant RevenueTotal Expenses
$562
,000
$806
,000
$2,0
72,0
00
$1,7
69,0
00
$2,0
19,0
00
$1,6
37,0
00
$1,6
30,0
00
$1,5
06,0
00
$2,1
96,0
00
$2,4
84,0
00
$2,6
32,0
00
$3,4
50,0
00
$1,8
39,0
00
$3,6
59,0
00
$3,8
31,0
00
$725
,000
$4,2
29,0
00
5
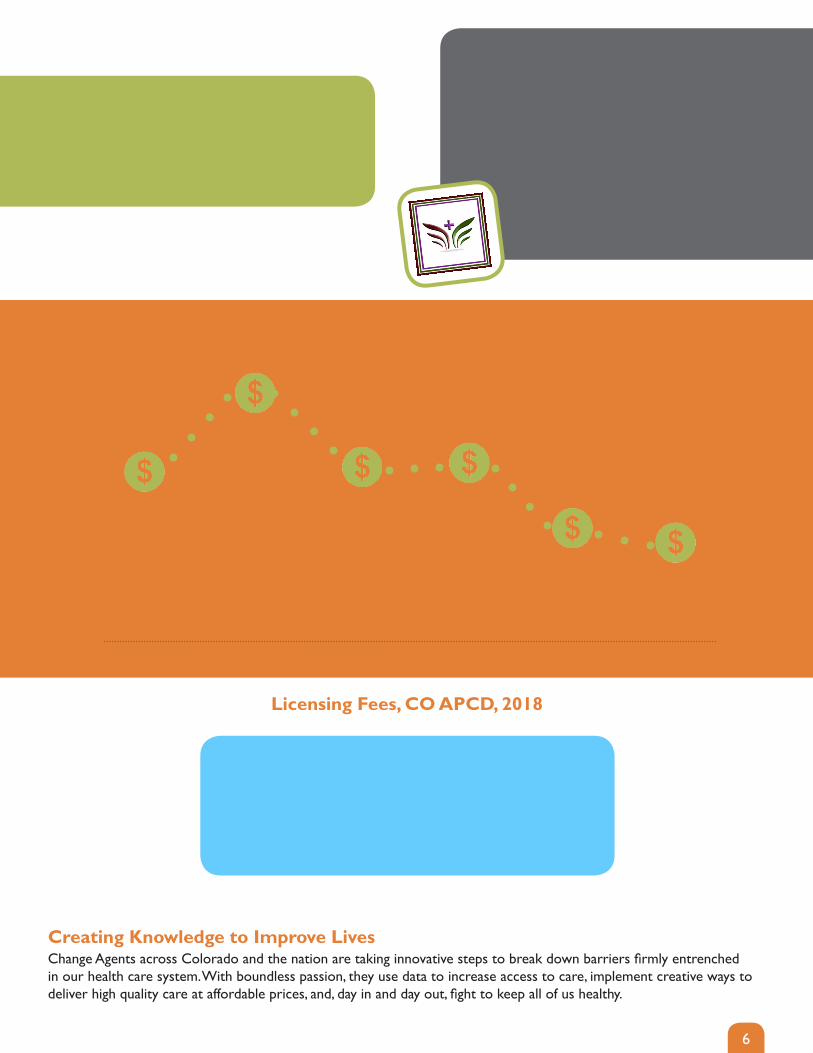
“If you don’t think CO APCD data is worth the money, I would argue against that pretty
quickly. The ability to double revenue is significant for any organization. So is having
data to validate your internal information. It’s definitely worth your time and money.”
-Trampas Hutches, Melissa Memorial Hospital, Holyoke, CO
The average fee for CO APCD products has decreased 60 percent since CIVHC began
licensing non-public data, while the number of annual fulfillments has increased by over
1,700 percent from 2013 to 2018.
FY13 FY14 FY15 FY16 FY17 FY18
$28,000
$46,000
$30,500 $31,000
$19,000$18,500
Average Data Access Fee, CO APCD, FY13-FY18
6
Change Agents across Colorado and the nation are taking innovative steps to break down barriers firmly entrenched in our health care system. With boundless passion, they use data to increase access to care, implement creative ways to deliver high quality care at affordable prices, and, day in and day out, fight to keep all of us healthy.
Creating Knowledge to Improve Lives
Standard Reports • $500-$7,000Standard De-Identified Data Sets • $15,000-$25,000
Custom Reports • $5,000-$20,000Custom De-Identified Data Sets • $15,000-$30,000
Custom Limited Data Sets • $20,000-$40,000Custom Fully-Identified Data Sets • $30,000-$50,000
Licensing Fees, CO APCD, 2018

7
In July 2018, CIVHC released a tool that allows consumers to shop for care. The tool displays price and quality information by provider for common imaging procedures, with planned additions in early 2019. The tool continues to be one of the most heavily used resources displayed on CIVHC’s website.
Shop for Care
A Way for Consumer and Employer Change Agents to Use the Shop for Care Tool
Select service of interest
Select zip
Compare total costs and quality at different facilities
“Good news. The hospital settled at the reasonable level of $2,226. Using data from Colorado All Payer Claims Database, I was able to make a case for a $14,000 reduction in the $16,385 bill. Thank you CIVHC, the
information was invaluable in enabling me to achieve a fair outcome.”
- Colorado Patient
“I’m a consumer looking to shop for the highest quality, lowest cost care
for a CT scan.”
Prices can vary by nearly $8,000 for some MRIs and CT scans
depending on location, so shopping for care is one way consumers can help reduce overall health care costs and
rising premiums.
8
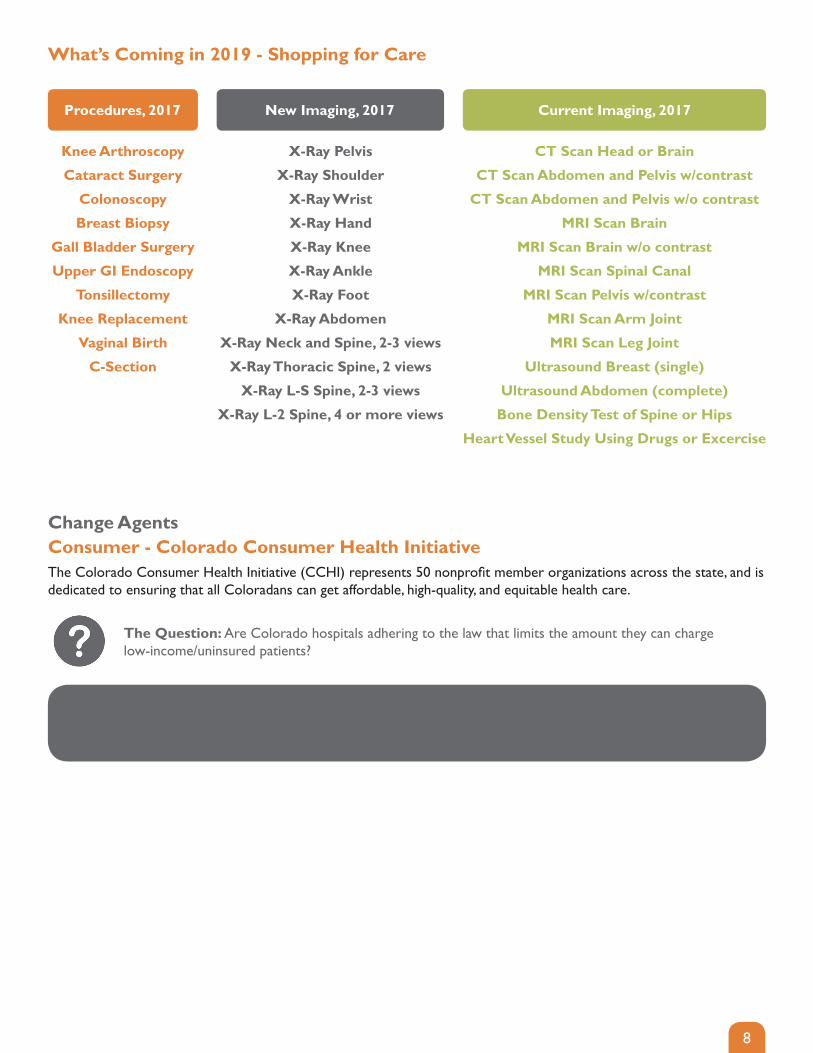
The Colorado Consumer Health Initiative (CCHI) represents 50 nonprofit member organizations across the state, and is dedicated to ensuring that all Coloradans can get affordable, high-quality, and equitable health care.
Consumer - Colorado Consumer Health Initiative
What’s Coming in 2019 - Shopping for Care
Benefit to Colorado: Lack of transparency surrounding health care pricing removes the ability of the patient to make the best decision for their care and drives up system-wide costs. This study highlighted the variation in cost among Colorado hospitals, reinforcing the need for accessible and transparent health care information.
The Question: Are Colorado hospitals adhering to the law that limits the amount they can charge low-income/uninsured patients?
Procedures, 2017 New Imaging, 2017
Knee Arthroscopy
Cataract Surgery
Colonoscopy
Breast Biopsy
Gall Bladder Surgery
Upper GI Endoscopy
Tonsillectomy
Knee Replacement
Vaginal Birth
C-Section
CT Scan Head or Brain
CT Scan Abdomen and Pelvis w/contrast
CT Scan Abdomen and Pelvis w/o contrast
MRI Scan Brain
MRI Scan Brain w/o contrast
MRI Scan Spinal Canal
MRI Scan Pelvis w/contrast
MRI Scan Arm Joint
MRI Scan Leg Joint
Ultrasound Breast (single)
Ultrasound Abdomen (complete)
Bone Density Test of Spine or Hips
Heart Vessel Study Using Drugs or Excercise
X-Ray Pelvis
X-Ray Shoulder
X-Ray Wrist
X-Ray Hand
X-Ray Knee
X-Ray Ankle
X-Ray Foot
X-Ray Abdomen
X-Ray Neck and Spine, 2-3 views
X-Ray Thoracic Spine, 2 views
X-Ray L-S Spine, 2-3 views
X-Ray L-2 Spine, 4 or more views
Change Agents
Current Imaging, 2017

9
Costs to provide care to insured Coloradans vary depending on where you live, which ultimately leads to higher premiums in certain areas. Understanding how costs differ across the state helps communities, policy makers, and others begin to identify solutions to reduce variation in spending.
Cost of Care
A Way for Government Change Agents to Use the Cost of Care Report
Look at service categories to determine where spend is the highest for payers and patients
The Total Cost of Care Multi-State Analysis is
another resource that shows which services are the biggest
cost drivers for CO.
Benchmark costs in different service categories to understand patient responsibility and evaluate affordability
Identify how costs have changed over time for payers and patients
Understand cost differences over time in rural and urban counties to identify possible access issues
Medicare Advantage patients are paying significantly more
than they previously have. 2015 was the first year they paid more out of pocket than Commercial.
Look at your county compared to others across the state to compare costs for different services
There is not one county or region that is always highest
or lowest cost for any services. Further analysis would be
needed at the individual service category level to determine options for cost reduction.
“I’m a legislator trying to understand costs in my district and how those compare to the state to better
serve my constituency.”
Overview
Trends
Geography
“It is kind of exciting. This is the first project where we were looking at total cost of care as an outcome, and because
CIVHC has that data, we were able to get what we needed.”
– Dr. David Keller, Professor and first Vice ChairUniversity of Colorado School of Medicine and
Children’s Hospital Colorado
10
Vendor - Mediquire
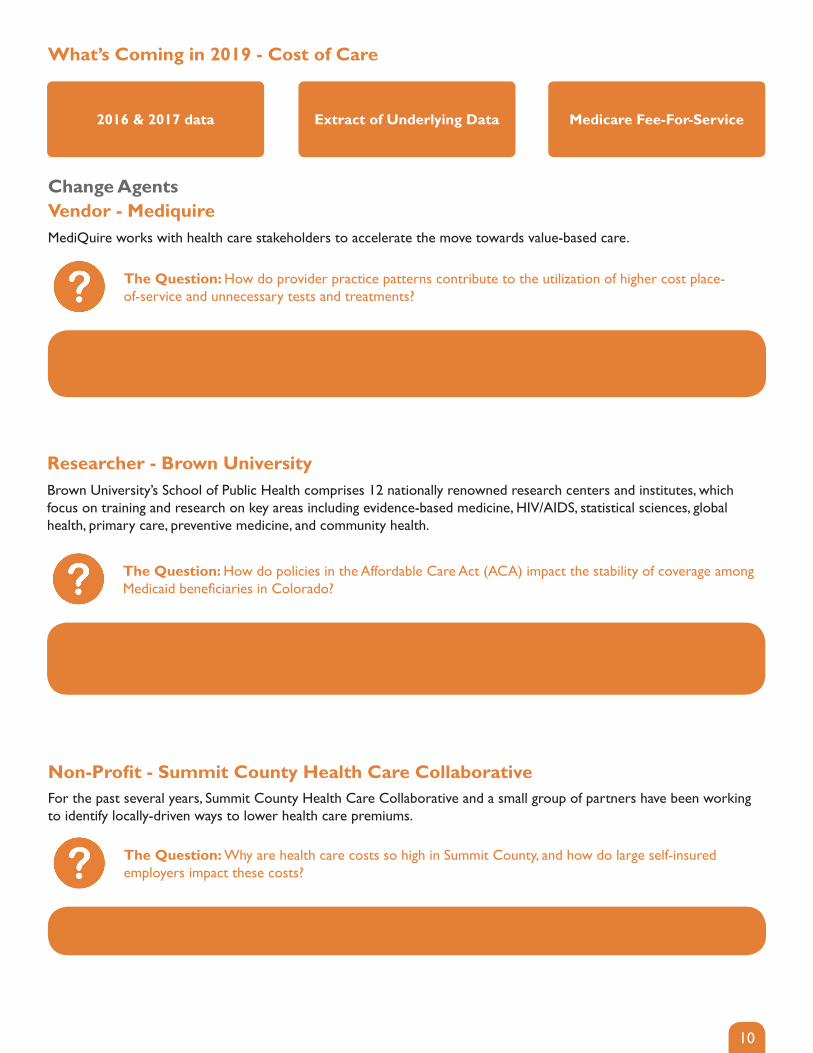
What’s Coming in 2019 - Cost of Care
Researcher - Brown University
Non-Profit - Summit County Health Care Collaborative
MediQuire works with health care stakeholders to accelerate the move towards value-based care.
Benefit to Colorado: Unnecessary tests and treatments are major cost drivers in the health care system, and findings from this project could help identify ways to modify practice behavior to improve patient health while lowering costs.
The Question: How do provider practice patterns contribute to the utilization of higher cost place-of-service and unnecessary tests and treatments?
Brown University’s School of Public Health comprises 12 nationally renowned research centers and institutes, which focus on training and research on key areas including evidence-based medicine, HIV/AIDS, statistical sciences, global health, primary care, preventive medicine, and community health.
Benefit to Colorado: Moving between insurers and inconsistent coverage affect the care patients receive. Information from this study could inform the need for policy decisions that can increase continuity of coverage, thereby lowering costs and improving care.
The Question: How do policies in the Affordable Care Act (ACA) impact the stability of coverage among Medicaid beneficiaries in Colorado?
For the past several years, Summit County Health Care Collaborative and a small group of partners have been working to identify locally-driven ways to lower health care premiums.
Benefit to Colorado: Findings of this research can inform efforts to improve care while lowering costs by designing programs to address these cost drivers.
The Question: Why are health care costs so high in Summit County, and how do large self-insured employers impact these costs?
2016 & 2017 data Extract of Underlying Data Medicare Fee-For-Service
Change Agents
11
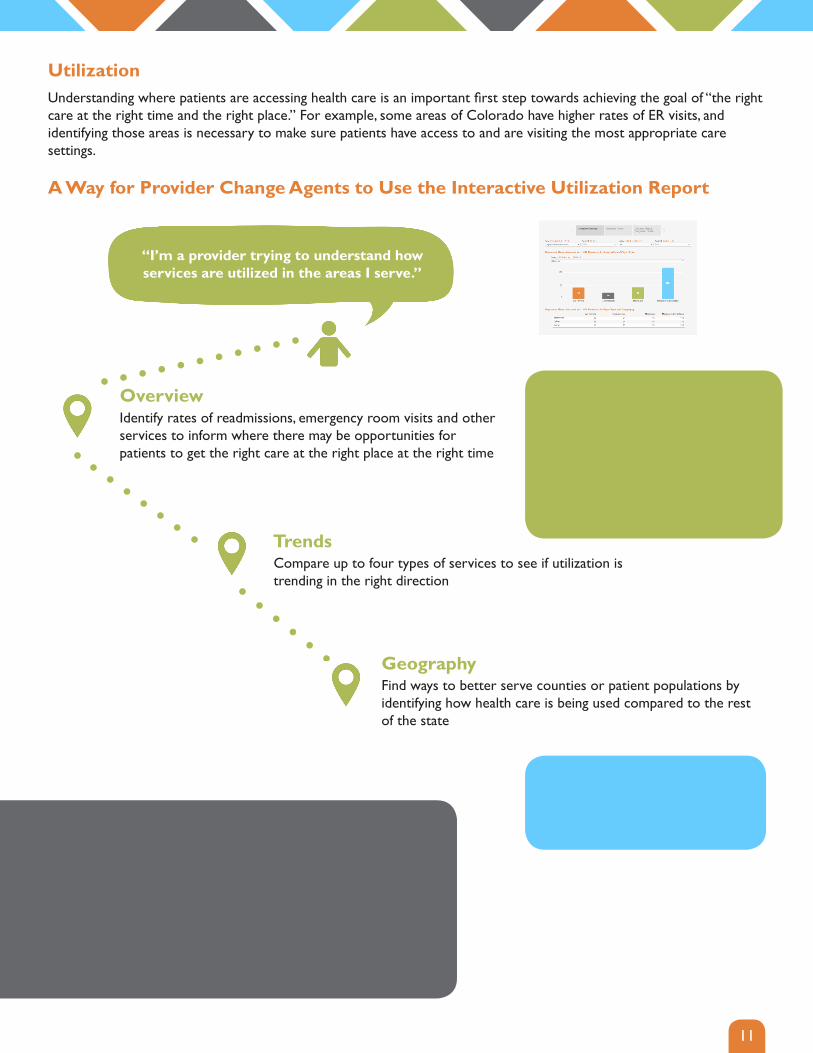
UtilizationUnderstanding where patients are accessing health care is an important first step towards achieving the goal of “the right care at the right time and the right place.” For example, some areas of Colorado have higher rates of ER visits, and identifying those areas is necessary to make sure patients have access to and are visiting the most appropriate care settings. A Way for Provider Change Agents to Use the Interactive Utilization Report
Identify rates of readmissions, emergency room visits and other services to inform where there may be opportunities for patients to get the right care at the right place at the right time
Compare up to four types of services to see if utilization is trending in the right direction
Find ways to better serve counties or patient populations by identifying how health care is being used compared to the rest of the state
“I’m a provider trying to understand how services are utilized in the areas I serve.”
“Our work has always been and remains people-centric, but it is very satisfying to confirm the impact of our services.
Through data, we’ve been able to verify that simple things we’re doing like giving people a ride to the grocery store or to their doctor’s appointment, or installing a ramp or a grab bar can exponentially impact people’s ability to live the life
they want to live and stay as healthy as possible.”
- Denver Regional Council of Governments
Overview
Trends
Geography
Emergency room visits and readmissions have decreased over
time in the Medicaid population, likely as a result of
efforts by HCPF to reduce unnecessary ED visits and provide
coordinated care through accountable care models.
Higher use of ED visits for one county as opposed to the state may suggest a need for more
urgent care options.
12
Non-Profit - Colorado African Organization
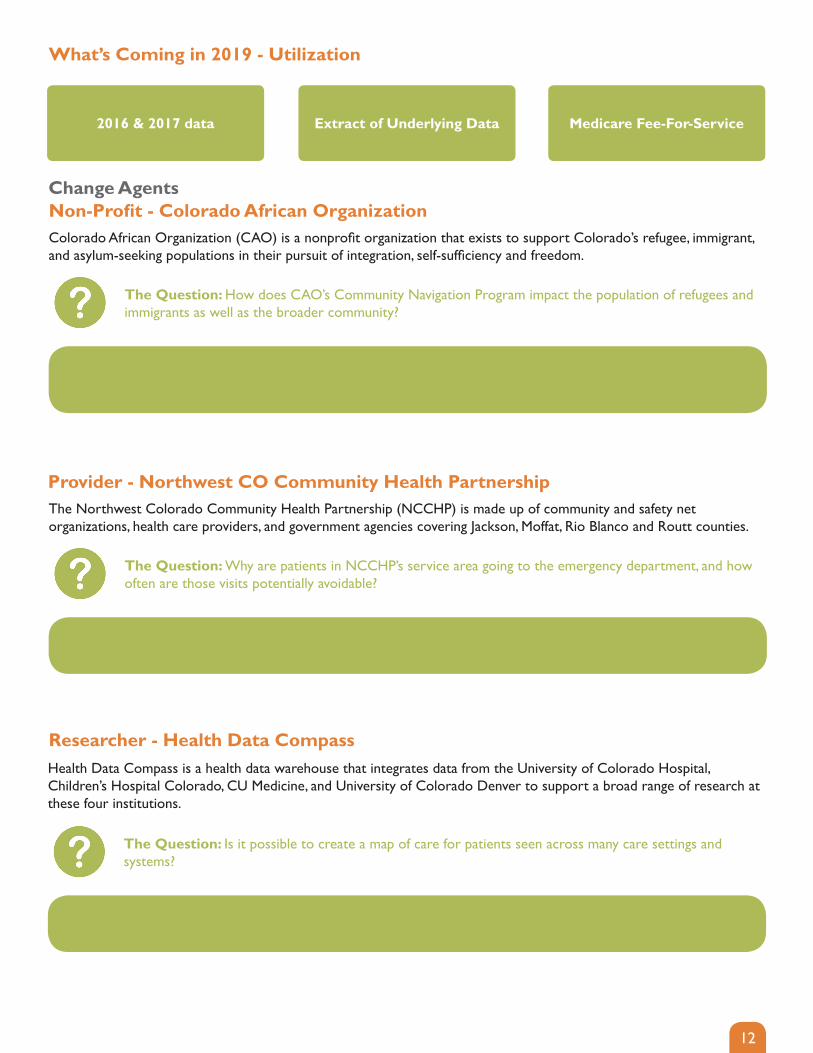
What’s Coming in 2019 - Utilization
Provider - Northwest CO Community Health Partnership
Researcher - Health Data Compass
Colorado African Organization (CAO) is a nonprofit organization that exists to support Colorado’s refugee, immigrant, and asylum-seeking populations in their pursuit of integration, self-sufficiency and freedom.
Benefit to Colorado: CAO’s findings will enhance the evidence base surrounding hospitalization and emergency room utilization. Change Agents can use these findings as a foundation for future program design that improves care and lowers costs.
The Question: How does CAO’s Community Navigation Program impact the population of refugees and immigrants as well as the broader community?
The Northwest Colorado Community Health Partnership (NCCHP) is made up of community and safety net organizations, health care providers, and government agencies covering Jackson, Moffat, Rio Blanco and Routt counties.
Benefit to Colorado: This report is being used to help reduce emergency department visits for health issues that could be treated in a doctor’s office, clinic, or urgent care settings, resulting in lower costs.
The Question: Why are patients in NCCHP’s service area going to the emergency department, and how often are those visits potentially avoidable?
Health Data Compass is a health data warehouse that integrates data from the University of Colorado Hospital, Children’s Hospital Colorado, CU Medicine, and University of Colorado Denver to support a broad range of research at these four institutions.
Benefit to Colorado: Maps of care will help create more complete records of patient treatment. The example of Health Data Compass can inform opportunities for care coordination across teams, resulting in better outcomes.
The Question: Is it possible to create a map of care for patients seen across many care settings and systems?
2016 & 2017 data Extract of Underlying Data Medicare Fee-For-Service
Change Agents
13
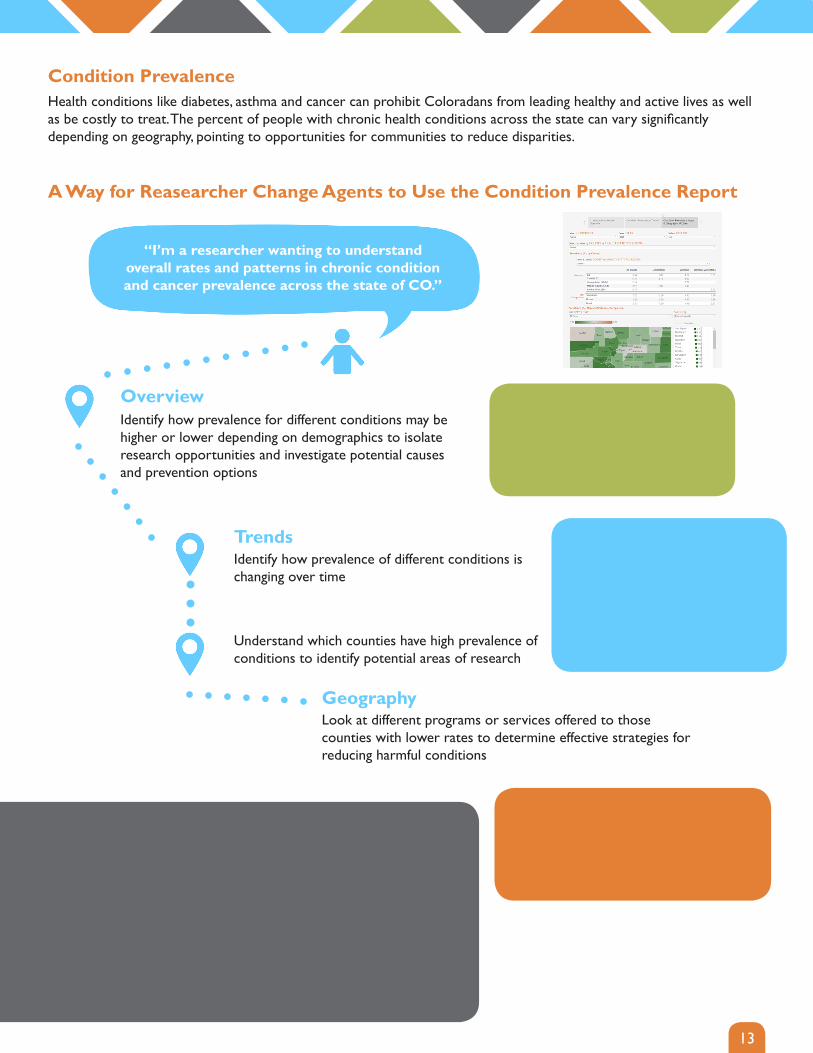
Health conditions like diabetes, asthma and cancer can prohibit Coloradans from leading healthy and active lives as well as be costly to treat. The percent of people with chronic health conditions across the state can vary significantly depending on geography, pointing to opportunities for communities to reduce disparities.
Condition Prevalence
A Way for Reasearcher Change Agents to Use the Condition Prevalence Report
Identify how prevalence for different conditions may be higher or lower depending on demographics to isolate research opportunities and investigate potential causes and prevention options
Identify how prevalence of different conditions is changing over time
Understand which counties have high prevalence of conditions to identify potential areas of research
“Until the creation of All Payer Claims Databases and states like Colorado that allow access to the data, there wasn’t a
claims resource for researchers to use to understand commercial, Medicare and Medicaid data, making it
impossible to get a comprehensive understanding of spending for specific diagnoses. By combining data from the CO APCD
with other databases available nationally, we are able to more accurately identify what we’re spending on skin cancer.”
– Emily Ruiz, MD, MPH - Brigham and Women’s Hospital
Look at different programs or services offered to those counties with lower rates to determine effective strategies for reducing harmful conditions
“I’m a researcher wanting to understand overall rates and patterns in chronic condition and cancer prevalence across the state of CO.”
Overview
Trends
Geography
Use the Quality Report to compare prevalence of cancers and chronic disease, as well as
utilization of preventive screenings.
Not all condition increases indicate a negative outcome, though all increases indicate a larger population needing more care. Increased cancer
rates indicate that more people are being diagnosed
and surviving.
Asthma prevalence is significantly higher in the southeast part of the state. Research could be conducted
to identify the factors associated with this higher prevalence.
14
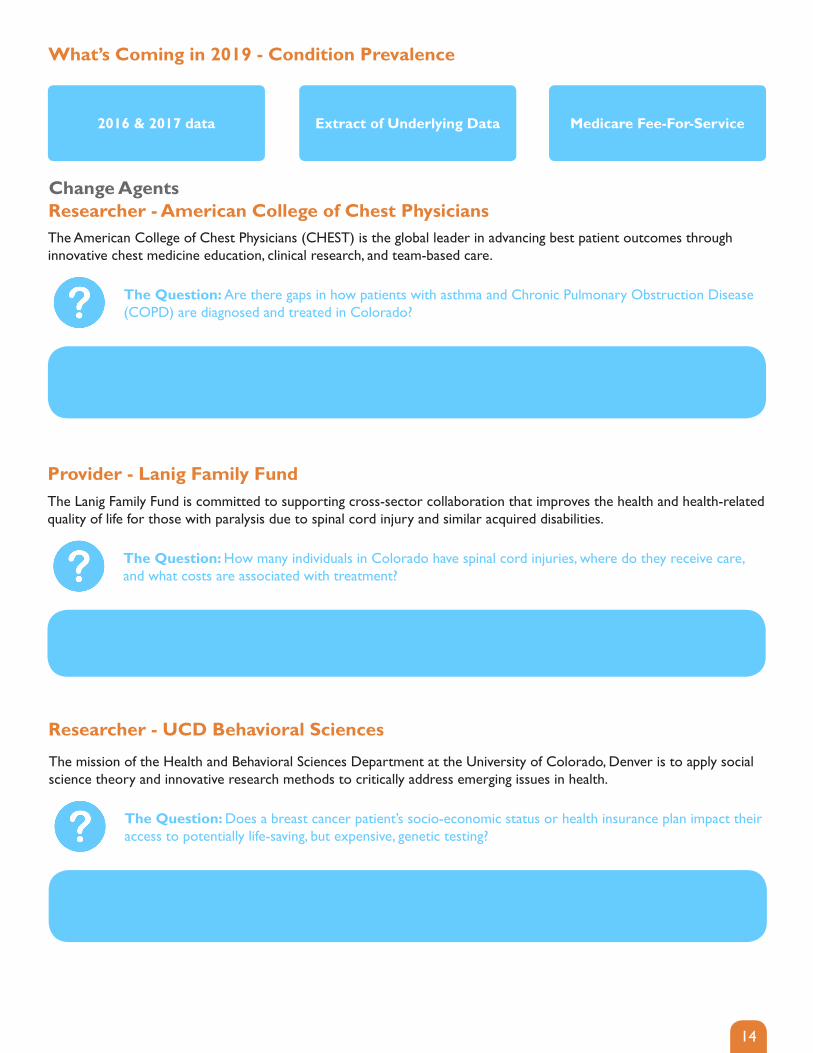
Researcher - American College of Chest Physicians
What’s Coming in 2019 - Condition Prevalence
Provider - Lanig Family Fund
Researcher - UCD Behavioral Sciences
The American College of Chest Physicians (CHEST) is the global leader in advancing best patient outcomes through innovative chest medicine education, clinical research, and team-based care.
Benefit to Colorado: Results of this investigation can improve quality of care for patients with asthma and COPD in Colorado, across the US and internationally. For those designing interventions, these findings could provide valuable information, leading to improvements in health outcomes and lowered health care costs.
The Question: Are there gaps in how patients with asthma and Chronic Pulmonary Obstruction Disease (COPD) are diagnosed and treated in Colorado?
The Lanig Family Fund is committed to supporting cross-sector collaboration that improves the health and health-related quality of life for those with paralysis due to spinal cord injury and similar acquired disabilities.
Benefit to Colorado: This study is the first step in understanding how patients with spinal cord injuries interact with the health care system in Colorado. Such information can help increase awareness of the issues impacting these individuals and drive system change toward one more inclusive of all with physical disabilities.
The Question: How many individuals in Colorado have spinal cord injuries, where do they receive care, and what costs are associated with treatment?
The mission of the Health and Behavioral Sciences Department at the University of Colorado, Denver is to apply social science theory and innovative research methods to critically address emerging issues in health.
Benefit to Colorado: Findings from this project may show how differences in health insurance coverage are related to socio-economic status and how these differences can lead to health disparities. Armed with this information, interventions could be designed to improve care and lower costs for vulnerable populations.
The Question: Does a breast cancer patient’s socio-economic status or health insurance plan impact their access to potentially life-saving, but expensive, genetic testing?
2016 & 2017 data Extract of Underlying Data Medicare Fee-For-Service
Change Agents
15
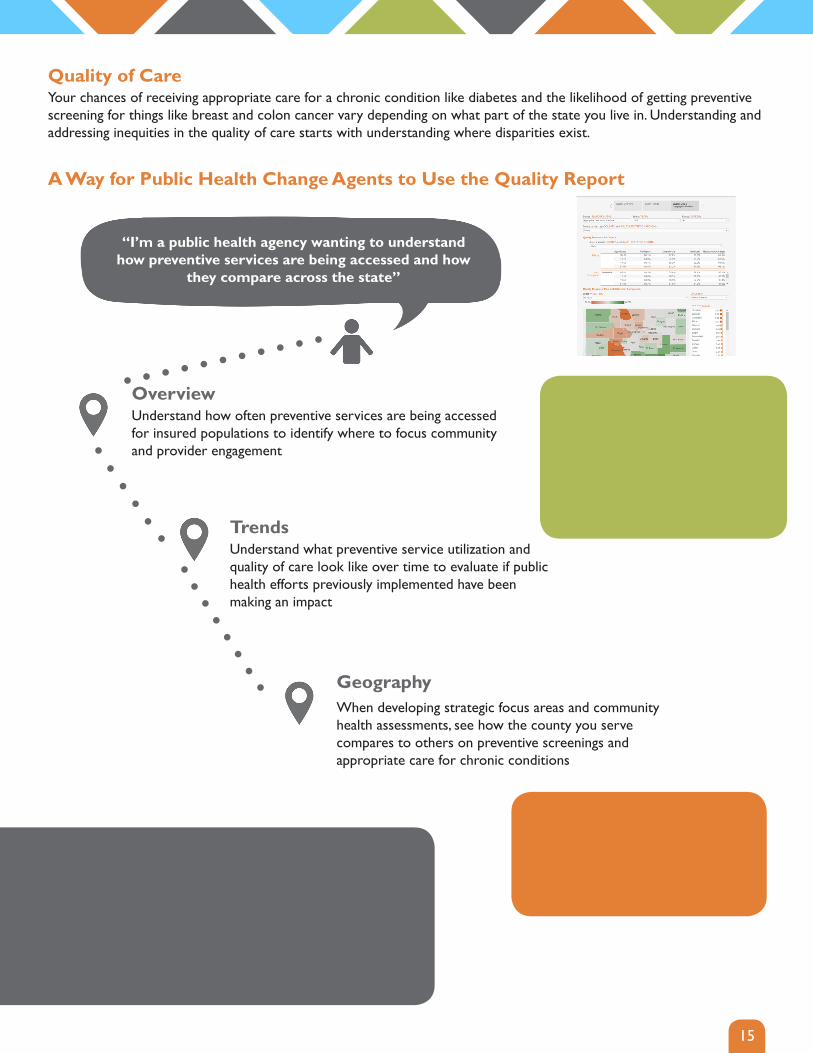
Your chances of receiving appropriate care for a chronic condition like diabetes and the likelihood of getting preventive screening for things like breast and colon cancer vary depending on what part of the state you live in. Understanding and addressing inequities in the quality of care starts with understanding where disparities exist.
Quality of Care
A Way for Public Health Change Agents to Use the Quality Report
Understand how often preventive services are being accessed for insured populations to identify where to focus community and provider engagement
Under the ACA, insured patients don’t have to pay out of pocket
for preventive screenings, so low rates indicate a potential need
to raise consumer awareness on the importance of preventive
screening, and improve effective community outreach.
Understand what preventive service utilization and quality of care look like over time to evaluate if public health efforts previously implemented have been making an impact
When developing strategic focus areas and community health assessments, see how the county you serve compares to others on preventive screenings and appropriate care for chronic conditions
For regions with higher quality care, there is an opportunity to understand best practices and
programs that could be duplicated in other areas.
“The value of neutral, de-identified data in large volumes, representing the majority of Colorado, is that it’s hard to argue with analytics based on millions of data points. This big data helped us see where we are in the big picture and enables us to have honest conversations and help answer
pressing health care questions.”
- Cameron MacDonald, American Physical Therapy Association - CO Chapter
“I’m a public health agency wanting to understand how preventive services are being accessed and how
they compare across the state”
Overview
Trends
Geography
16
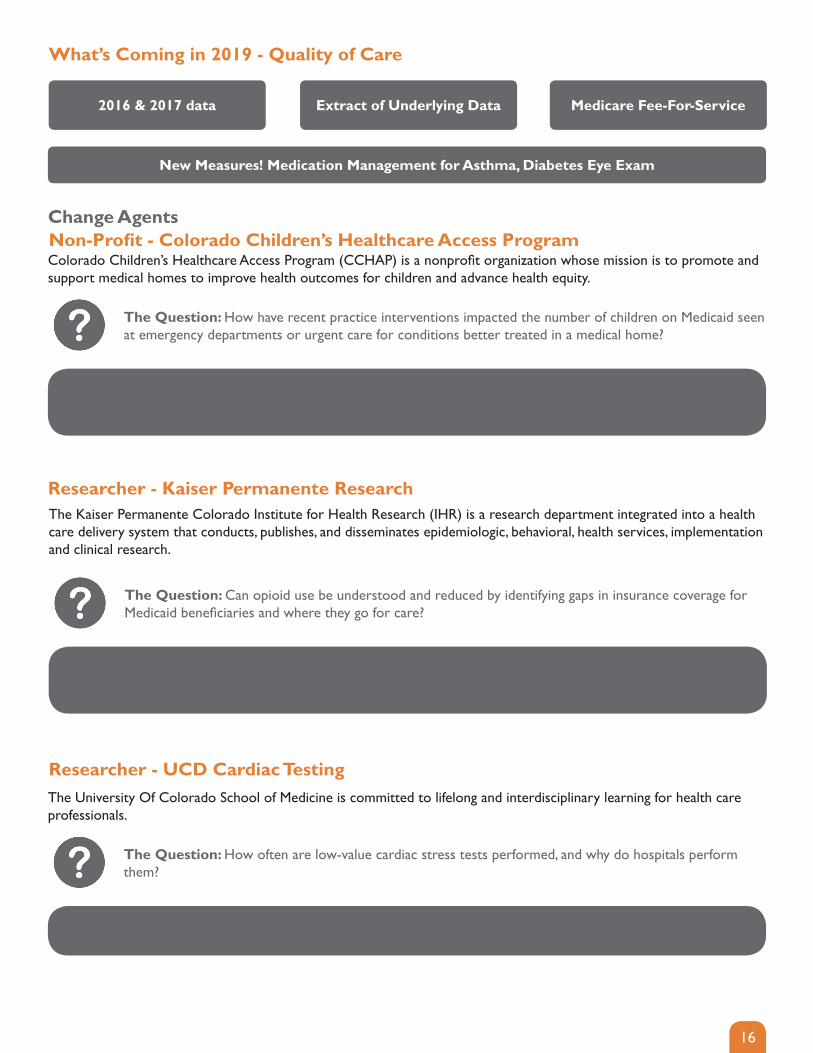
Non-Profit - Colorado Children’s Healthcare Access Program
What’s Coming in 2019 - Quality of Care
Researcher - Kaiser Permanente Research
Researcher - UCD Cardiac Testing
Colorado Children’s Healthcare Access Program (CCHAP) is a nonprofit organization whose mission is to promote and support medical homes to improve health outcomes for children and advance health equity.
Benefit to Colorado: Preliminary results suggest that emergency department visits have been cut in half, resulting in significant savings. The lessons from this study could encourage shifts in treatment settings to lower costs and improve care for young and vulnerable Coloradans.
The Question: How have recent practice interventions impacted the number of children on Medicaid seen at emergency departments or urgent care for conditions better treated in a medical home?
The Kaiser Permanente Colorado Institute for Health Research (IHR) is a research department integrated into a health care delivery system that conducts, publishes, and disseminates epidemiologic, behavioral, health services, implementation and clinical research.
Benefit to Colorado: This research will provide key evidence about opioid use, overdose, and the impacts of expanded access to overdose treatment. This knowledge can inform the creation of programs and interventions to help those living with opioid use disorders.
The Question: Can opioid use be understood and reduced by identifying gaps in insurance coverage for Medicaid beneficiaries and where they go for care?
The University Of Colorado School of Medicine is committed to lifelong and interdisciplinary learning for health care professionals.
Benefit to Colorado: Identifying effective measures to reduce use of these tests can help improve patient outcomes and reduce health care costs.
The Question: How often are low-value cardiac stress tests performed, and why do hospitals perform them?
2016 & 2017 data Extract of Underlying Data Medicare Fee-For-Service
New Measures! Medication Management for Asthma, Diabetes Eye Exam
Change Agents
The CO APCD provides a neutral, unbiased guide to help navigate Colorado’s health care landscape. Such a transparent guide is necessary now more than ever as efforts are underway to herald fundamental shifts in how health care is paid for and administered.
Public CO APCD data releases, like the interactive Shop for Care reports and Reference-based Price analysis, provide consumers, organizations, communities, legislators, and more with access to information to inform help lower costs and improve quality of care. Non-public, custom CO APCD releases support the specific needs of Change Agents from state agencies and public health entities working to foster healthy populations to providers and hospitals focused on improving the lives of their patients.
Visit www.civhc.org to learn more, view the Appendices of this report, and access public CO APCD data.

Custom CO APCD Data Requests 2018
Stakeholder Type
Scholarship Project PurposeProduct
Type
Employer Analysis of spending on health care services for covered members.Standard Report
Employer Analyze spending on health care services for covered members.Standard Report
Employer Analyze spending on health care services for covered members.Standard Report
Hospital / Provider Group
Investigate costs of specialty services for their membersStandard Report
Hospital / Provider Group
Assess variation in care for high-risk populations and interface across health systems, such as home health, mental health services, durable medical equipment, pharmacy, Vendor / Consultant ancillary services and Vendor / Consultant community providers.
Fully-Identifiable Data Set
Hospital / Provider Group
Reduce variation in care for specific pediatric diseases by investigating supply utilization, length of stay, and complication rates among children undergoing appendectomies.
Fully-Identifiable Data Set
Hospital / Provider Group
Examine utilization and costs of care among patients served by this nonprofit and individuals residing in specific neighborhoods.
Fully-Identifiable Data Set
Hospital / Provider Group
Understand patient care patterns outside of the community to inform enhancing service offerings to better meet the needs of the population.
Standard Report
Non Profits / Advocacy
The American College of Chest Physicians (CHEST) is proposing a project designed to improve understanding of the diagnosis and treatment of asthma and COPD in Colorado residents. Specifically, the project will investigate a number of key questions in order to illuminate gaps in care and develop the basis for quality improvement recommendations.
Limited Data Set
1 of 7
Custom CO APCD Data Requests 2018
Stakeholder Type
Scholarship Project PurposeProduct
TypeNon Profits /
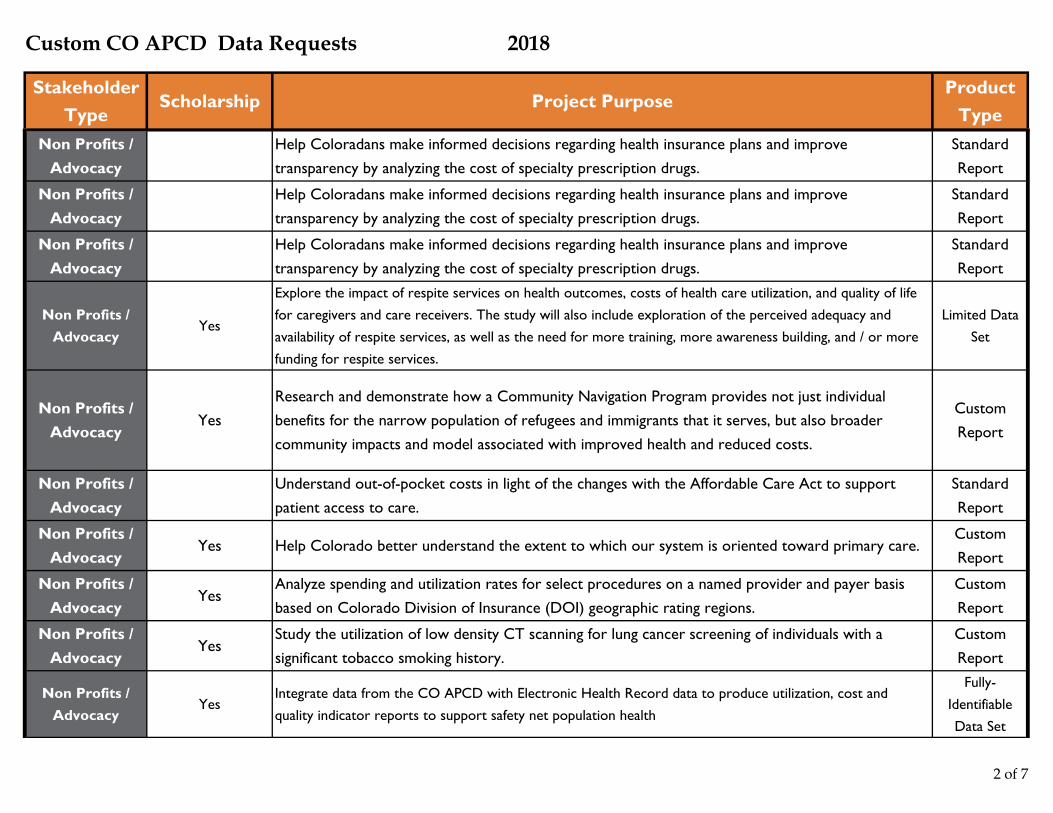
AdvocacyHelp Coloradans make informed decisions regarding health insurance plans and improve transparency by analyzing the cost of specialty prescription drugs.
Standard Report
Non Profits / Advocacy
Help Coloradans make informed decisions regarding health insurance plans and improve transparency by analyzing the cost of specialty prescription drugs.
Standard Report
Non Profits / Advocacy
Help Coloradans make informed decisions regarding health insurance plans and improve transparency by analyzing the cost of specialty prescription drugs.
Standard Report
Non Profits / Advocacy
Yes
Explore the impact of respite services on health outcomes, costs of health care utilization, and quality of life for caregivers and care receivers. The study will also include exploration of the perceived adequacy and availability of respite services, as well as the need for more training, more awareness building, and / or more funding for respite services.
Limited Data Set
Non Profits / Advocacy
YesResearch and demonstrate how a Community Navigation Program provides not just individual benefits for the narrow population of refugees and immigrants that it serves, but also broader community impacts and model associated with improved health and reduced costs.
Custom Report
Non Profits / Advocacy
Understand out-of-pocket costs in light of the changes with the Affordable Care Act to support patient access to care.
Standard Report
Non Profits / Advocacy
Yes Help Colorado better understand the extent to which our system is oriented toward primary care.Custom Report
Non Profits / Advocacy
YesAnalyze spending and utilization rates for select procedures on a named provider and payer basis based on Colorado Division of Insurance (DOI) geographic rating regions.
Custom Report
Non Profits / Advocacy
YesStudy the utilization of low density CT scanning for lung cancer screening of individuals with a significant tobacco smoking history.
Custom Report
Non Profits / Advocacy
YesIntegrate data from the CO APCD with Electronic Health Record data to produce utilization, cost and quality indicator reports to support safety net population health
Fully-Identifiable Data Set
2 of 7
Custom CO APCD Data Requests 2018
Stakeholder Type
Scholarship Project PurposeProduct
Type
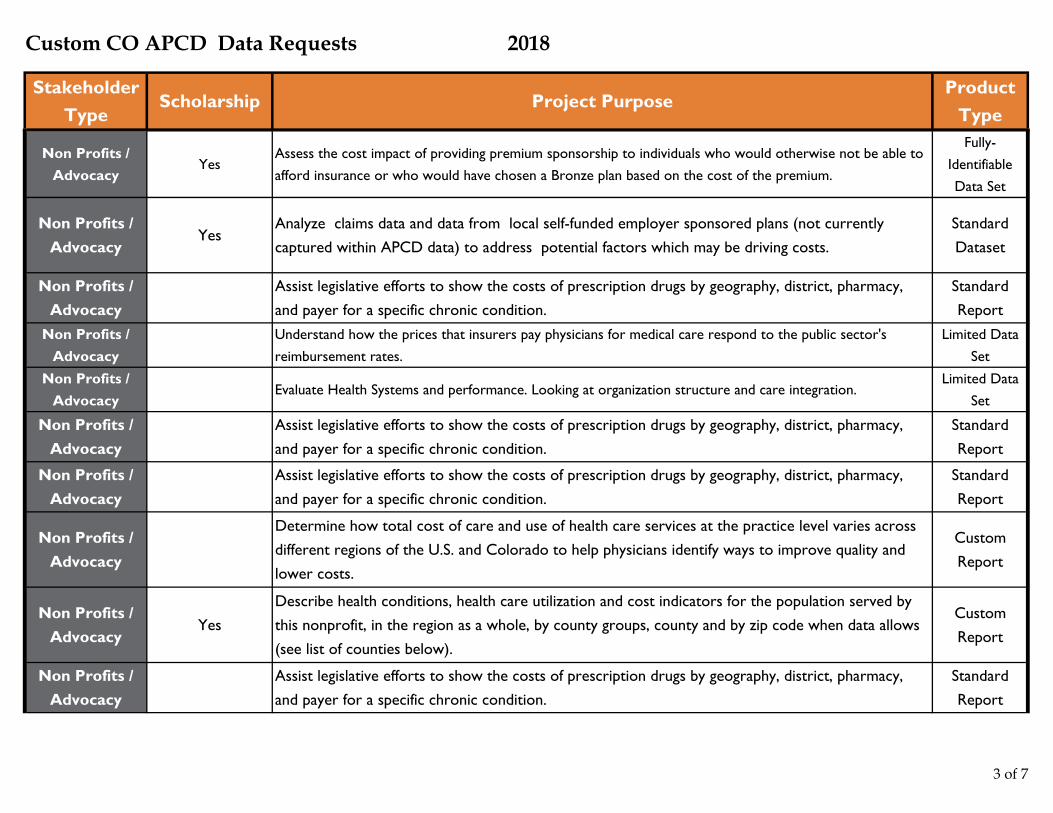
Non Profits / Advocacy
YesAssess the cost impact of providing premium sponsorship to individuals who would otherwise not be able to afford insurance or who would have chosen a Bronze plan based on the cost of the premium.
Fully-Identifiable Data Set
Non Profits / Advocacy
YesAnalyze claims data and data from local self-funded employer sponsored plans (not currently captured within APCD data) to address potential factors which may be driving costs.
Standard Dataset
Non Profits / Advocacy
Assist legislative efforts to show the costs of prescription drugs by geography, district, pharmacy, and payer for a specific chronic condition.
Standard Report
Non Profits / Advocacy
Understand how the prices that insurers pay physicians for medical care respond to the public sector's reimbursement rates.
Limited Data Set
Non Profits / Advocacy
Evaluate Health Systems and performance. Looking at organization structure and care integration.Limited Data
Set
Non Profits / Advocacy
Assist legislative efforts to show the costs of prescription drugs by geography, district, pharmacy, and payer for a specific chronic condition.
Standard Report
Non Profits / Advocacy
Assist legislative efforts to show the costs of prescription drugs by geography, district, pharmacy, and payer for a specific chronic condition.
Standard Report
Non Profits / Advocacy
Determine how total cost of care and use of health care services at the practice level varies across different regions of the U.S. and Colorado to help physicians identify ways to improve quality and lower costs.
Custom Report
Non Profits / Advocacy
YesDescribe health conditions, health care utilization and cost indicators for the population served by this nonprofit, in the region as a whole, by county groups, county and by zip code when data allows (see list of counties below).
Custom Report
Non Profits / Advocacy
Assist legislative efforts to show the costs of prescription drugs by geography, district, pharmacy, and payer for a specific chronic condition.
Standard Report
3 of 7
Custom CO APCD Data Requests 2018
Stakeholder Type
Scholarship Project PurposeProduct
Type
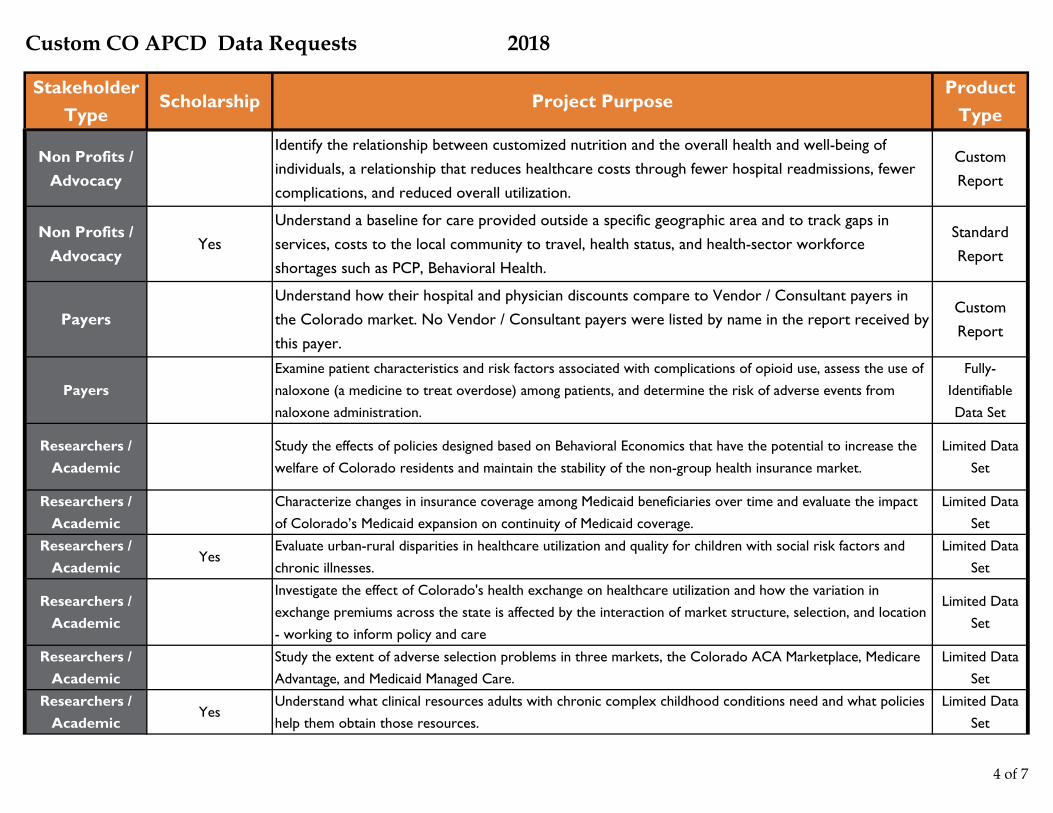
Non Profits / Advocacy
Identify the relationship between customized nutrition and the overall health and well-being of individuals, a relationship that reduces healthcare costs through fewer hospital readmissions, fewer complications, and reduced overall utilization.
Custom Report
Non Profits / Advocacy
YesUnderstand a baseline for care provided outside a specific geographic area and to track gaps in services, costs to the local community to travel, health status, and health-sector workforce shortages such as PCP, Behavioral Health.
Standard Report
PayersUnderstand how their hospital and physician discounts compare to Vendor / Consultant payers in the Colorado market. No Vendor / Consultant payers were listed by name in the report received by this payer.
Custom Report
PayersExamine patient characteristics and risk factors associated with complications of opioid use, assess the use of naloxone (a medicine to treat overdose) among patients, and determine the risk of adverse events from naloxone administration.
Fully-Identifiable Data Set
Researchers / Academic
Study the effects of policies designed based on Behavioral Economics that have the potential to increase the welfare of Colorado residents and maintain the stability of the non-group health insurance market.
Limited Data Set
Researchers / Academic
Characterize changes in insurance coverage among Medicaid beneficiaries over time and evaluate the impact of Colorado’s Medicaid expansion on continuity of Medicaid coverage.
Limited Data Set
Researchers / Academic
YesEvaluate urban-rural disparities in healthcare utilization and quality for children with social risk factors and chronic illnesses.
Limited Data Set
Researchers / Academic
Investigate the effect of Colorado's health exchange on healthcare utilization and how the variation in exchange premiums across the state is affected by the interaction of market structure, selection, and location - working to inform policy and care
Limited Data Set
Researchers / Academic
Study the extent of adverse selection problems in three markets, the Colorado ACA Marketplace, Medicare Advantage, and Medicaid Managed Care.
Limited Data Set
Researchers / Academic
YesUnderstand what clinical resources adults with chronic complex childhood conditions need and what policies help them obtain those resources.
Limited Data Set
4 of 7
Custom CO APCD Data Requests 2018
Stakeholder Type
Scholarship Project PurposeProduct
Type
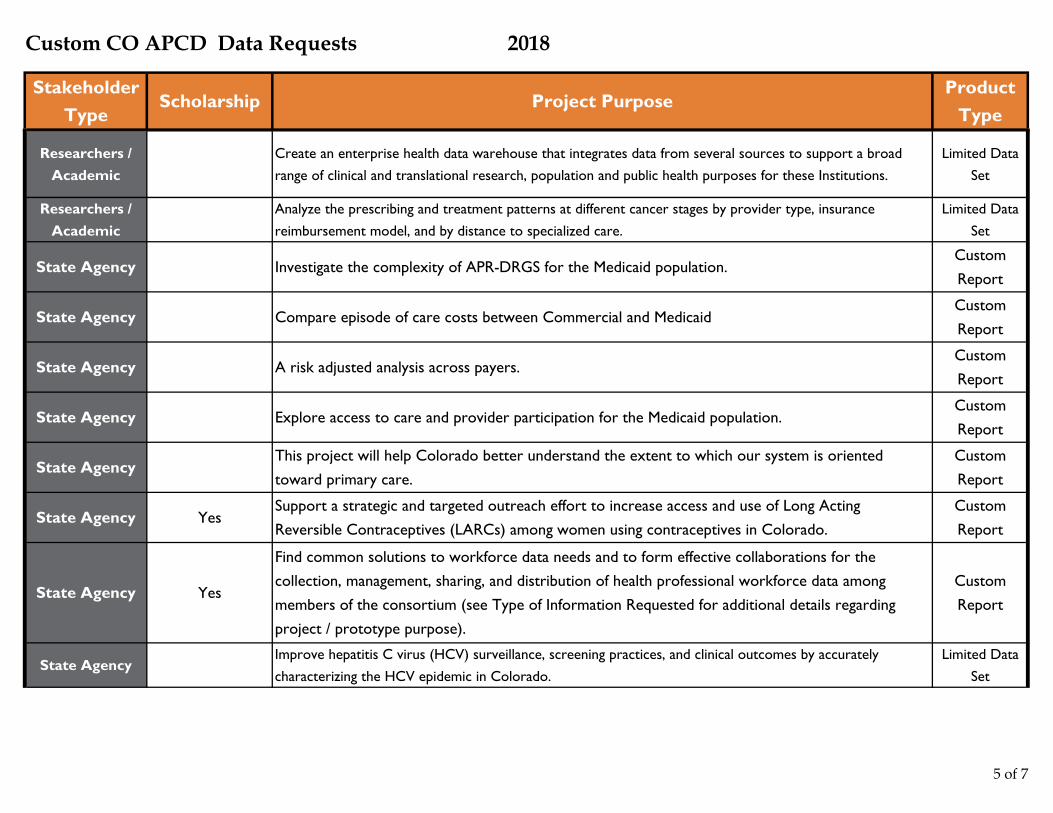
Researchers / Academic
Create an enterprise health data warehouse that integrates data from several sources to support a broad range of clinical and translational research, population and public health purposes for these Institutions.
Limited Data Set
Researchers / Academic
Analyze the prescribing and treatment patterns at different cancer stages by provider type, insurance reimbursement model, and by distance to specialized care.
Limited Data Set
State Agency Investigate the complexity of APR-DRGS for the Medicaid population.Custom Report
State Agency Compare episode of care costs between Commercial and MedicaidCustom Report
State Agency A risk adjusted analysis across payers.Custom Report
State Agency Explore access to care and provider participation for the Medicaid population.Custom Report
State AgencyThis project will help Colorado better understand the extent to which our system is oriented toward primary care.
Custom Report
State Agency YesSupport a strategic and targeted outreach effort to increase access and use of Long Acting Reversible Contraceptives (LARCs) among women using contraceptives in Colorado.
Custom Report
State Agency Yes
Find common solutions to workforce data needs and to form effective collaborations for the collection, management, sharing, and distribution of health professional workforce data among members of the consortium (see Type of Information Requested for additional details regarding project / prototype purpose).
Custom Report
State AgencyImprove hepatitis C virus (HCV) surveillance, screening practices, and clinical outcomes by accurately
characterizing the HCV epidemic in Colorado.Limited Data
Set
5 of 7
Custom CO APCD Data Requests 2018
Stakeholder Type
Scholarship Project PurposeProduct
Type
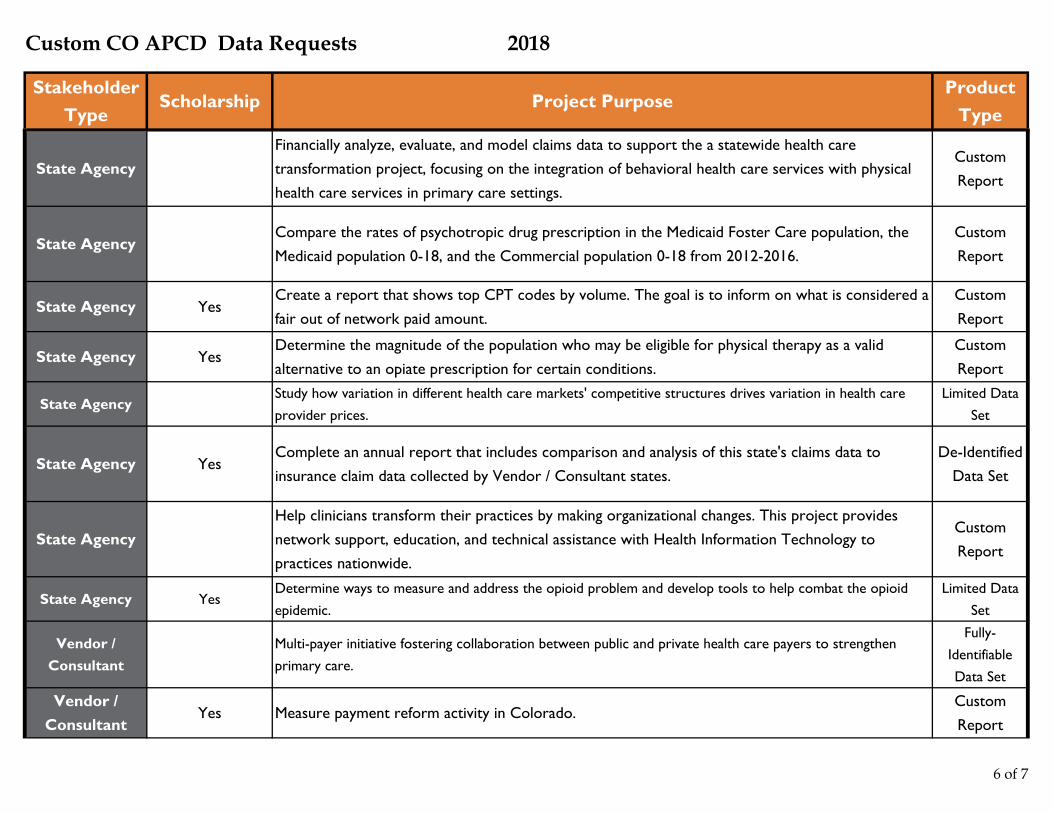
State AgencyFinancially analyze, evaluate, and model claims data to support the a statewide health care transformation project, focusing on the integration of behavioral health care services with physical health care services in primary care settings.
Custom Report
State AgencyCompare the rates of psychotropic drug prescription in the Medicaid Foster Care population, the Medicaid population 0-18, and the Commercial population 0-18 from 2012-2016.
Custom Report
State Agency YesCreate a report that shows top CPT codes by volume. The goal is to inform on what is considered a fair out of network paid amount.
Custom Report
State Agency YesDetermine the magnitude of the population who may be eligible for physical therapy as a valid alternative to an opiate prescription for certain conditions.
Custom Report
State AgencyStudy how variation in different health care markets' competitive structures drives variation in health care provider prices.
Limited Data Set
State Agency YesComplete an annual report that includes comparison and analysis of this state's claims data to insurance claim data collected by Vendor / Consultant states.
De-Identified Data Set
State AgencyHelp clinicians transform their practices by making organizational changes. This project provides network support, education, and technical assistance with Health Information Technology to practices nationwide.
Custom Report
State Agency YesDetermine ways to measure and address the opioid problem and develop tools to help combat the opioid epidemic.
Limited Data Set
Vendor / Consultant
Multi-payer initiative fostering collaboration between public and private health care payers to strengthen primary care.
Fully-Identifiable Data Set
Vendor / Consultant
Yes Measure payment reform activity in Colorado.Custom Report
6 of 7

Custom CO APCD Data Requests 2018
Stakeholder Type
Scholarship Project PurposeProduct
Type
Vendor / Consultant
Determine the prevalence of medical conditions potentially related to the consumption of drinking water (surface or well water) containing elevated concentrations of molybdenum in certain Colorado counties.
Custom Report
Vendor / Consultant
Understand how the prices that insurers pay physicians for medical care respond to the public sector's reimbursement rates.
De-Identified Data Set
Vendor / Consultant
Measure insurance churn in the market place.Limited Data
Set
Vendor / Consultant
Evaluate the impact of targeted digital advertising on preventive care patterns and access to care for 18-34 year old rural Coloradans.
Custom Report
7 of 7
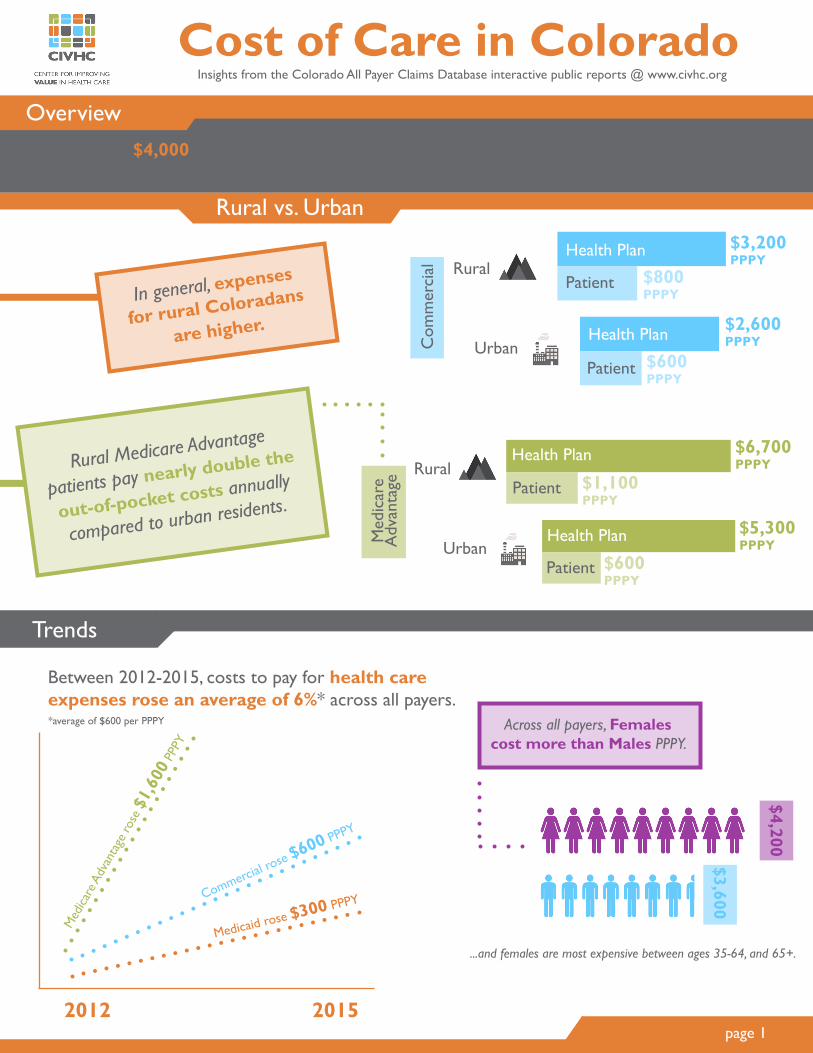
Cost of Care in ColoradoOverviewIt takes nearly $4,000 Per Person Per Year (PPPY) to cover the health care needs of most Coloradans*
In general, expenses
for rural Coloradans
are higher.
*Medicaid, Commercial, & Medicare Advantage covered lives
Across all payers, Females cost more than Males PPPY.
$4,200
$3,600
Between 2012-2015, costs to pay for health care expenses rose an average of 6%* across all payers. *average of $600 per PPPY
2012 2015
Commercial rose $600 PPPY
Med
icare
Adv
anta
ge ro
se $
1,60
0 PP
PY
Medicaid rose $300 PPPY
page 1
Insights from the Colorado All Payer Claims Database interactive public reports @ www.civhc.org
Rural Medicare Advantage
patients pay nearly double the
out-of-pocket costs annually
compared to urban residents.
Com
mer
cial
Patient
Patient
Health Plan
Health Plan
Rural
Urban
$3,200 PPPY
$2,600 PPPY
$800 PPPY
$600 PPPY
Rural
Urban
Health Plan
Patient
Health Plan
Patient
Med
icar
e A
dvan
tage
$6,700 PPPY
$1,100 PPPY
$5,300 PPPY
$600 PPPY
Rural vs. Urban
Trends
...and females are most expensive between ages 35-64, and 65+.

page 2
The biggest increase in costs across all payers is in the pharmacy service category. Medicare Advantage had the highest increase in pharmacy, from $440 PPPY to $1,900 PPPY.
SERVICE CATEGORY PERCENT CHANGES FROM 2012-2015
PROFESSIONAL (clinician)
SERVICES*
4%
INPATIENT (hospital)
SERVICES
2%
PHARMACY SERVICES
27%OUTPATIENT (clinic) SERVICES
4%
In 2015 Commercially insured annual costs were higher in some Western Slope areas and Eastern Plains areas, and lower in the Front Range and Southeast areas of the state.
Pitkin County is 68% above the median per person per year cost for the state.
Phillips County is 83% above the median per person per year cost for the state.
$6,000
PPPY $6,600PPPY
To learn more, visit us at: www.civhc.org/get-data/interactive-data/statewide-metrics/cost-of-care
Statewide Median $3,700 PPPY
Service Costs
County Profiles
*Professional services typically occur in inpatient, outpatient, or clinic settings and are typically billed separately.
COMMERCIAL PAYERS, 2015
$1,400
$6,600
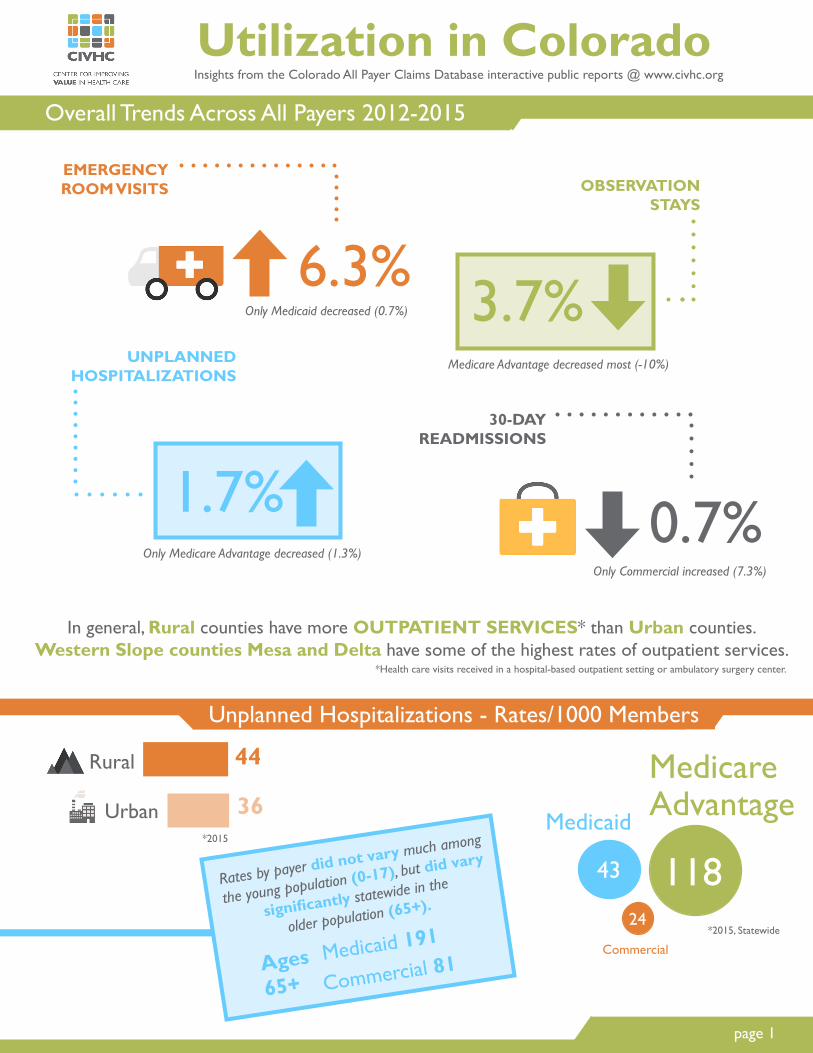
Utilization in ColoradoOverall Trends Across All Payers 2012-2015
Insights from the Colorado All Payer Claims Database interactive public reports @ www.civhc.org
page 1
In general, Rural counties have more OUTPATIENT SERVICES* than Urban counties. Western Slope counties Mesa and Delta have some of the highest rates of outpatient services.
*Health care visits received in a hospital-based outpatient setting or ambulatory surgery center.
30-DAY READMISSIONS
0.7%
UNPLANNED HOSPITALIZATIONS
1.7%
EMERGENCY ROOM VISITS
6.3%
OBSERVATION STAYS
3.7%
Only Medicare Advantage decreased (1.3%)Only Commercial increased (7.3%)
Medicaid
Medicare Advantage
Commercial
Rural
Urban
44
36
Unplanned Hospitalizations - Rates/1000 Members
Rates by payer did not vary much among
the young population (0-17), but did vary
significantly statewide in the
older population (65+).
Medicaid 191
Commercial 81Ages65+
11843
24
Only Medicaid decreased (0.7%)
Medicare Advantage decreased most (-10%)
*2015
*2015, Statewide

ER Visits - Rates/1000 Members
Pharmacy Scripts
page 2To learn more, visit us at: www.civhc.org/get-data/interactive-data/statewide-metrics/utilization
Commercial
Medicaid
Medicare Advantage
Counties in Southern CO have the highest levels of ER Visits in all age groups.
Rural has higher ER rates for Medicare Advantage...
...but Urban is higher for Commercial and Medicaid.
30-Day Readmissions
The 30-day readmissions rate is highest for the age group 65+.
Within this group, the population covered by Medicaid had a readmission rate nearly five times higher than the Commercial and Medicare Advantage popuations.
Medicaid
Commercial
51
10
Statewide Average: 10.8 Medications per person, of those, 8.7 Generic
Commercial 5%
Medicaid 4.7%
Medicare Advantage 2.3%
TR
EN
DS All Medications Generics Only
Commercial 4%
Medicaid 5.3%
Medicare Advantage 3.3%
581
322
131
*2015, Statewide
Medicare Advantage 13
77759
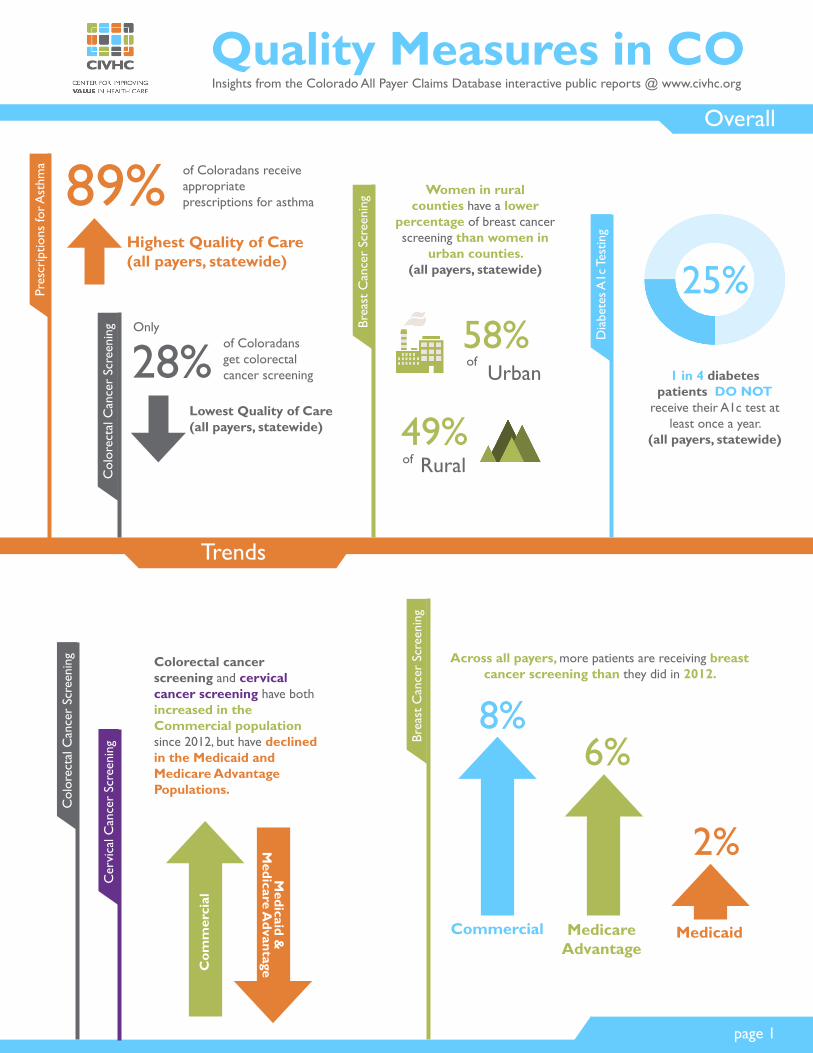
Quality Measures in COOverall
Insights from the Colorado All Payer Claims Database interactive public reports @ www.civhc.org
Trends
page 1
Pres
crip
tions
for A
sthm
a
Brea
st C
ance
r Sc
reen
ing
Dia
bete
s A1c
Tes
ting
Highest Quality of Care (all payers, statewide)
89%
Col
orec
tal C
ance
r Sc
reen
ing
Lowest Quality of Care (all payers, statewide)
28%
Women in rural counties have a lower
percentage of breast cancer screening than women in
urban counties. (all payers, statewide) 25%
1 in 4 diabetes patients DO NOT
receive their A1c test at least once a year.
(all payers, statewide)
Brea
st C
ance
r Sc
reen
ing
Medicaid
Across all payers, more patients are receiving breast cancer screening than they did in 2012.
Commercial MedicareAdvantage
8%6%
2%
of Coloradans receive appropriate prescriptions for asthma
of Coloradans get colorectal cancer screening
Only
Urbanof58%
49%Ruralof
Col
orec
tal C
ance
r Sc
reen
ing
Cer
vica
l Can
cer
Scre
enin
g
Colorectal cancer screening and cervical cancer screening have both increased in the Commercial population since 2012, but have declined in the Medicaid and Medicare Advantage Populations.
Com
mer
cial
Medicaid &
M
edicare Advantage
page 2To learn more, visit us at: www.civhc.org/get-data/interactive-data/statewide-metrics/quality-measures/
Trends
Geographic Variation
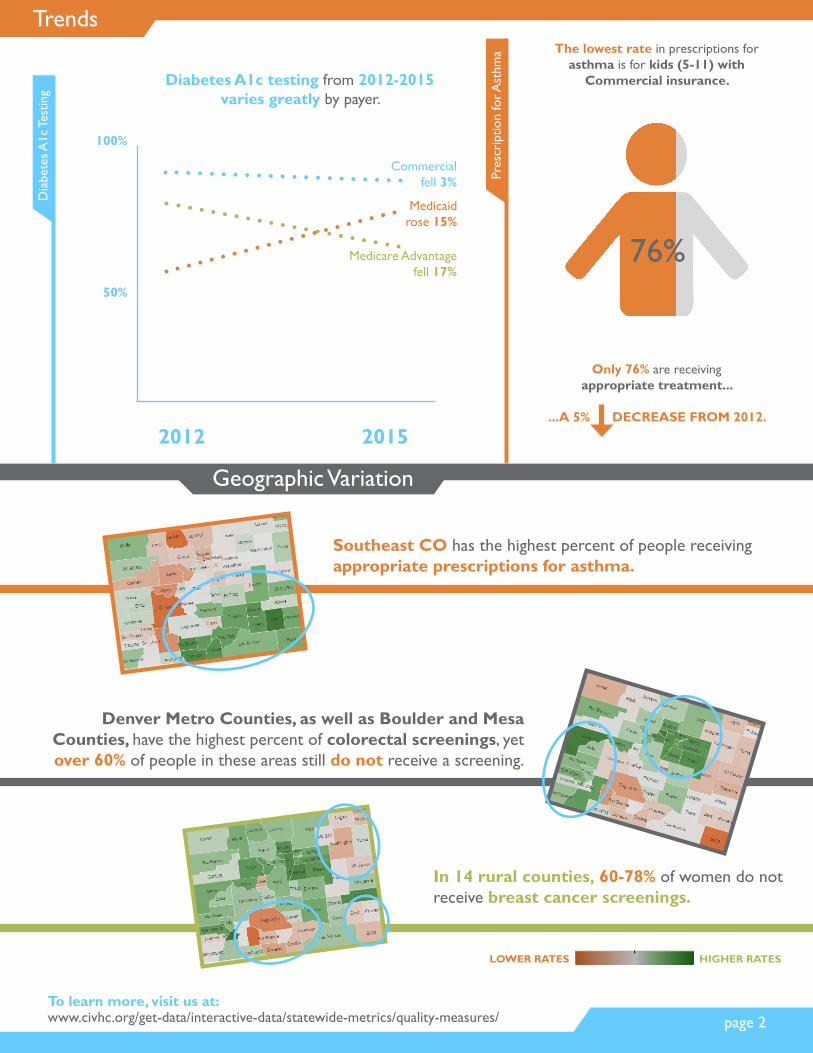
Southeast CO has the highest percent of people receiving appropriate prescriptions for asthma.
Dia
bete
s A1c
Tes
ting
2012 2015
Commercial fell 3%
Medicare Advantage fell 17%
Medicaid rose 15%
50%
100%
Diabetes A1c testing from 2012-2015 varies greatly by payer.
Denver Metro Counties, as well as Boulder and Mesa Counties, have the highest percent of colorectal screenings, yet over 60% of people in these areas still do not receive a screening.
LOWER RATES HIGHER RATES
In 14 rural counties, 60-78% of women do not receive breast cancer screenings.
Pres
crip
tion
for A
sthm
a The lowest rate in prescriptions for asthma is for kids (5-11) with
Commercial insurance.
76%
Only 76% are receiving appropriate treatment...
...A 5% DECREASE FROM 2012.
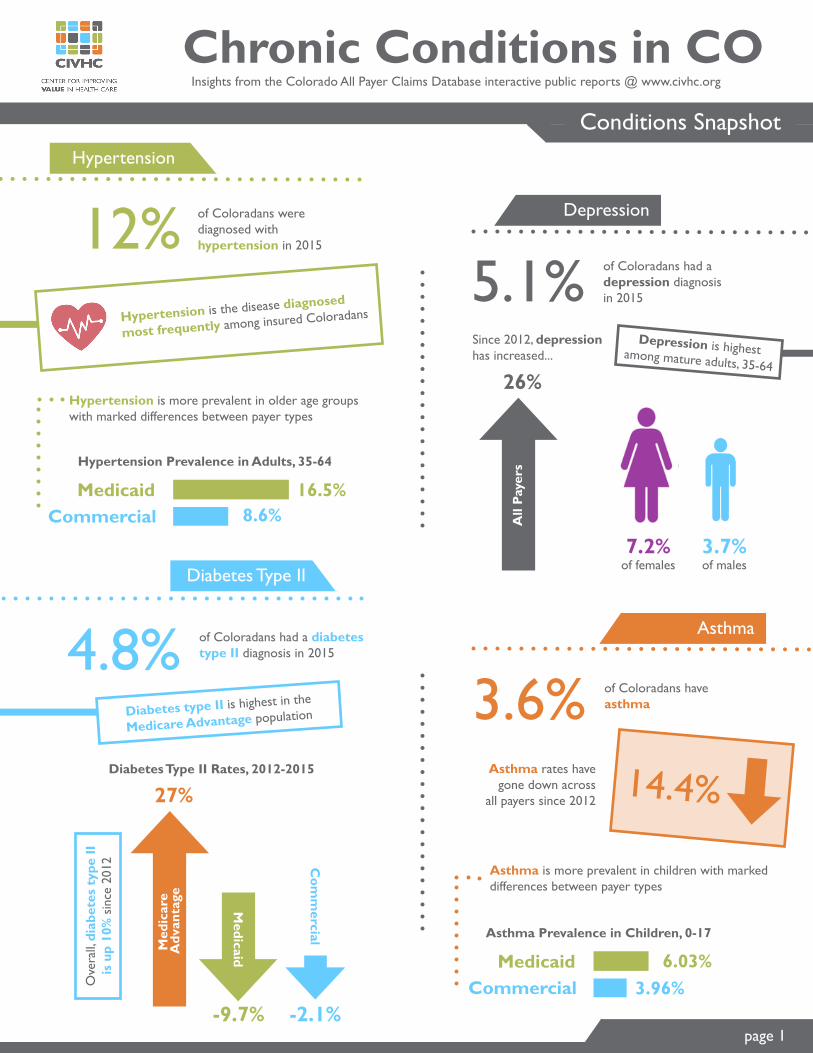
Chronic Conditions in COConditions Snapshot
Insights from the Colorado All Payer Claims Database interactive public reports @ www.civhc.org
Asthma
Diabetes Type II
Hypertension
Depression12% of Coloradans were diagnosed with hypertension in 2015
5.1% of Coloradans had adepression diagnosis in 2015
4.8% of Coloradans had a diabetes type II diagnosis in 2015
3.6% of Coloradans have asthma
Hypertension is the disease diagnosed
most frequently among insured Coloradans
Hypertension is more prevalent in older age groups with marked differences between payer types
Hypertension Prevalence in Adults, 35-64
16.5%8.6%
MedicaidCommercial
Med
icar
e A
dvan
tage
Medicaid
Com
mercial
27%
-9.7% -2.1%
Diabetes Type II Rates, 2012-2015
Ove
rall,
diab
etes
typ
e II
is
up
10%
sin
ce 2
012
Diabetes type II is highest in the
Medicare Advantage population
7.2% of females
3.7% of males
All
Paye
rs
26%
Since 2012, depression has increased...
14.4%Asthma rates have
gone down across all payers since 2012
Asthma Prevalence in Children, 0-17
6.03%3.96%
MedicaidCommercial
Depression is highest among mature adults, 35-64
page 1
Asthma is more prevalent in children with marked differences between payer types
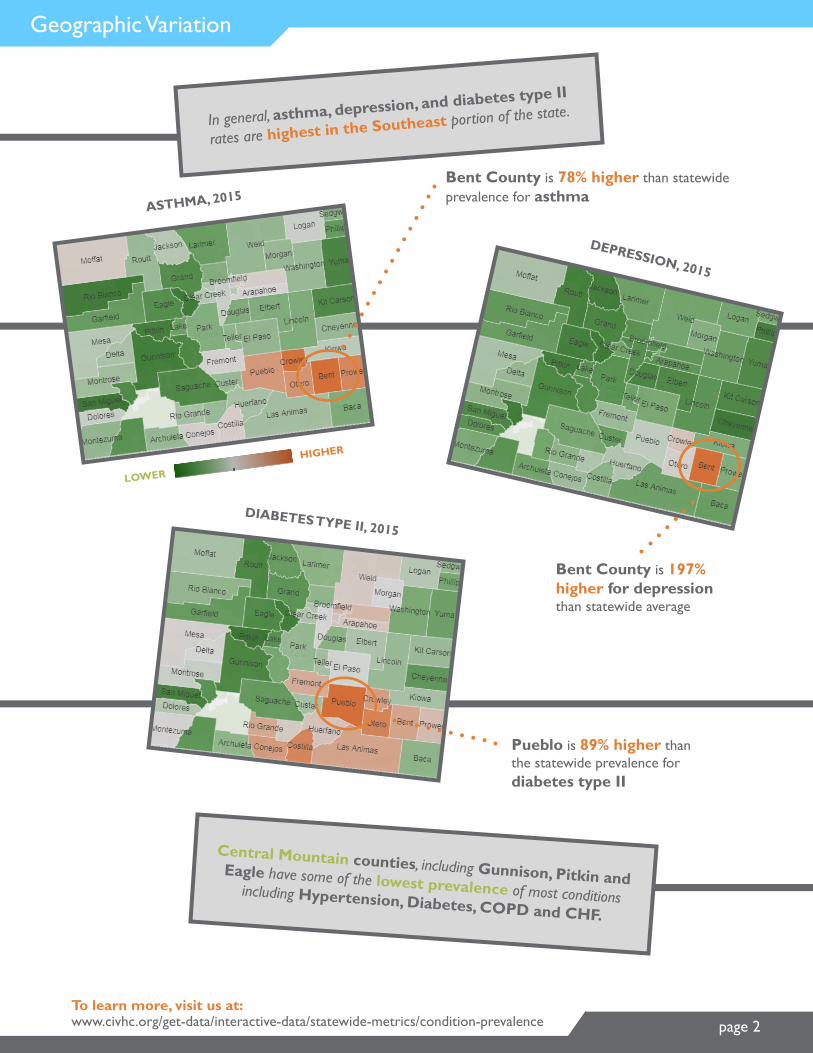
Geographic Variation
page 2
Bent County is 78% higher than statewide prevalence for asthma
To learn more, visit us at: www.civhc.org/get-data/interactive-data/statewide-metrics/condition-prevalence
ASTHMA, 2015
LOWER
HIGHER
Pueblo is 89% higher than the statewide prevalence for diabetes type II
DEPRESSION, 2015
DIABETES TYPE II, 2015
Bent County is 197% higher for depression than statewide average
In general, asthma, depression, and diabetes type II
rates are highest in the Southeast portion of the state.
Central Mountain counties, including Gunnison, Pitkin and Eagle have some of the lowest prevalence of most conditions including Hypertension, Diabetes, COPD and CHF.
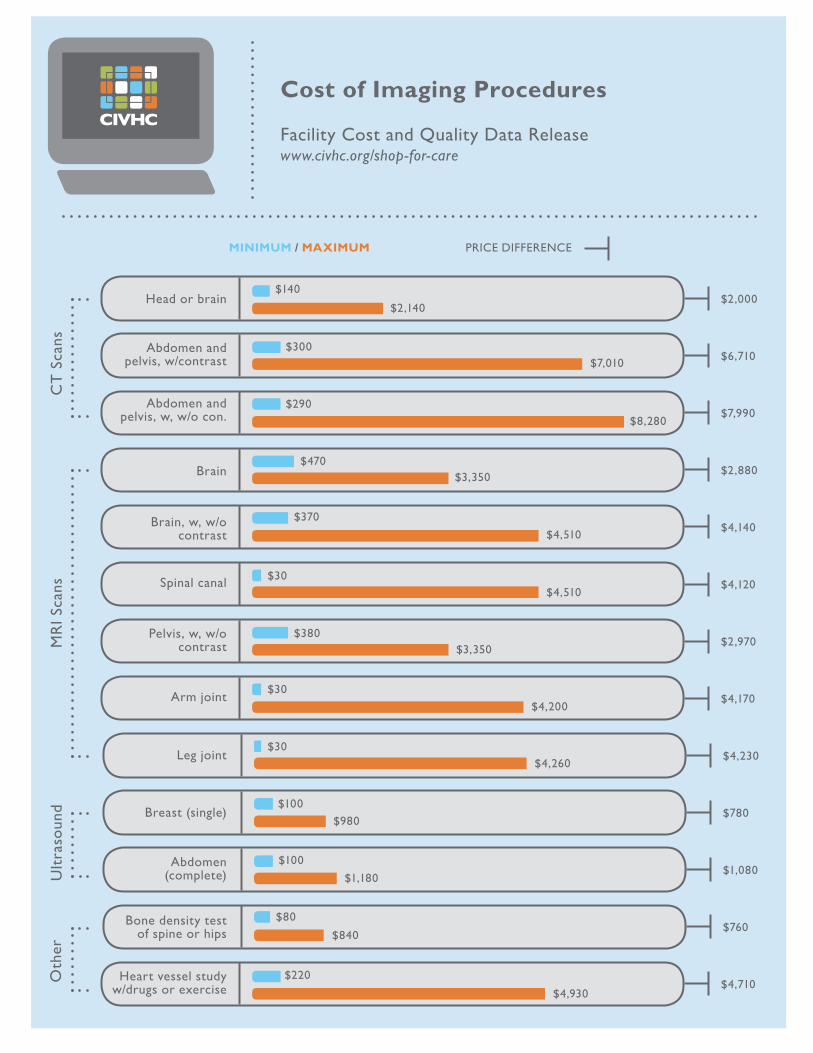
$2,880
$6,710
$7,990
Head or brain $2,000
$4,170
$4,120
$2,970
$4,140
$760
$780
$1,080
$4,230
$4,710
MINIMUM / MAXIMUM PRICE DIFFERENCE
CT
Sca
nsM
RI S
cans
Ult
raso
und
Oth
er
Facility Cost and Quality Data Releasewww.civhc.org/shop-for-care
Cost of Imaging Procedures
Abdomen and pelvis, w/contrast
Abdomen and pelvis, w, w/o con.
Brain
Brain, w, w/o contrast
Spinal canal
Pelvis, w, w/o contrast
Arm joint
Leg joint
Breast (single)
Abdomen (complete)
Bone density test of spine or hips
Heart vessel study w/drugs or exercise
$140
$2,140
$300$7,010
$290$8,280
$470$3,350
$370$4,510
$30$4,510
$380$3,350
$30$4,200
$30$4,260
$100$980
$100$1,180
$80
$220
$840
$4,930
Cancer Prevalence in COOverview
Insights from the Colorado All Payer Claims Database interactive public reports @ www.civhc.org
page 1
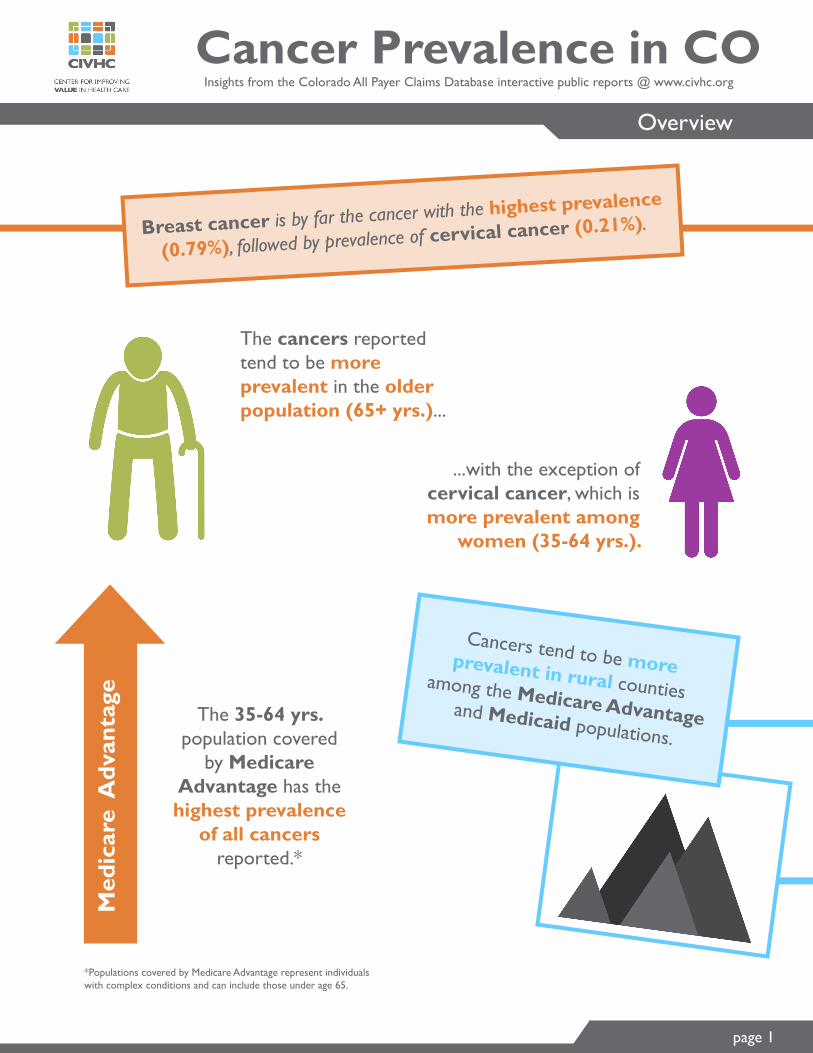
Breast cancer is by far the cancer with the highest prevalence
(0.79%), followed by prevalence of cervical cancer (0.21%).
The cancers reported tend to be more prevalent in the older population (65+ yrs.)...
...with the exception of cervical cancer, which is more prevalent among
women (35-64 yrs.).
Cancers tend to be more prevalent in rural counties among the Medicare Advantage and Medicaid populations.
Med
icar
e A
dvan
tage
The 35-64 yrs. population covered
by Medicare Advantage has the highest prevalence
of all cancers reported.*
*Populations covered by Medicare Advantage represent individuals with complex conditions and can include those under age 65.

Cervical Cancer
Breast Cancer
Colorectal Cancer
Lung Cancer
page 2
To learn more, visit us at: www.civhc.org/get-data/interactive-data/statewide-metrics/condition-prevalence
Commercial -29%
Medicaid -24%
Medicare Advantage 14%Commercial -16%
Medicaid -17%
Medicare Advantage 25%
Commercial -8%
Medicaid -13%
Medicare Advantage 5%Commercial -36%
Medicaid -25%
Medicare Advantage 0%
Trends since 2012
Trends since 2012
Trends since 2012
Trends since 2012
0.79% Overall rate across all payers
0.21% Overall rate across all payers
0.14% Overall rate across all payers
0.09% Overall rate across all payers
Urban counties have higher rates of breast cancer (0.8%) compared to rural (0.6%).
Overall prevalence of lung cancer tends to be higher in the older population (65+).
Rural counties have higher rates of cervical cancer in the Medicaid and Medicare Advantage population.
No apparent variation between rural and urban prevalence for all payers.
This report is based on record of specific diagnoses associated to health care services billed to a third party during a calendar year, as opposed to individuals’ self-reported diagnosis.
Total Cost of Care Multi-State Analysis
Overview
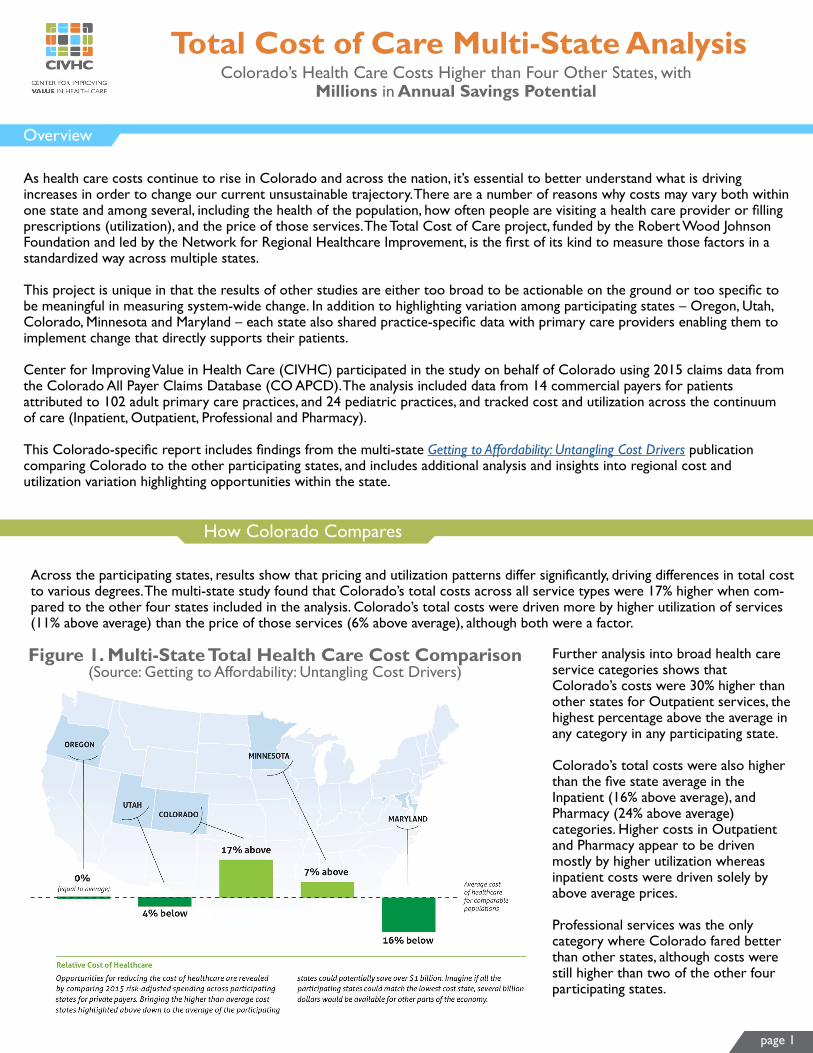
Colorado’s Health Care Costs Higher than Four Other States, with Millions in Annual Savings Potential
As health care costs continue to rise in Colorado and across the nation, it’s essential to better understand what is driving increases in order to change our current unsustainable trajectory. There are a number of reasons why costs may vary both within one state and among several, including the health of the population, how often people are visiting a health care provider or filling prescriptions (utilization), and the price of those services. The Total Cost of Care project, funded by the Robert Wood Johnson Foundation and led by the Network for Regional Healthcare Improvement, is the first of its kind to measure those factors in a standardized way across multiple states.
This project is unique in that the results of other studies are either too broad to be actionable on the ground or too specific to be meaningful in measuring system-wide change. In addition to highlighting variation among participating states – Oregon, Utah, Colorado, Minnesota and Maryland – each state also shared practice-specific data with primary care providers enabling them to implement change that directly supports their patients.
Center for Improving Value in Health Care (CIVHC) participated in the study on behalf of Colorado using 2015 claims data from the Colorado All Payer Claims Database (CO APCD). The analysis included data from 14 commercial payers for patients attributed to 102 adult primary care practices, and 24 pediatric practices, and tracked cost and utilization across the continuum of care (Inpatient, Outpatient, Professional and Pharmacy).
This Colorado-specific report includes findings from the multi-state Getting to Affordability: Untangling Cost Drivers publication comparing Colorado to the other participating states, and includes additional analysis and insights into regional cost and utilization variation highlighting opportunities within the state.
How Colorado Compares
Across the participating states, results show that pricing and utilization patterns differ significantly, driving differences in total cost to various degrees. The multi-state study found that Colorado’s total costs across all service types were 17% higher when com-pared to the other four states included in the analysis. Colorado’s total costs were driven more by higher utilization of services (11% above average) than the price of those services (6% above average), although both were a factor.
Further analysis into broad health care service categories shows that Colorado’s costs were 30% higher than other states for Outpatient services, the highest percentage above the average in any category in any participating state.
Colorado’s total costs were also higher than the five state average in the Inpatient (16% above average), and Pharmacy (24% above average) categories. Higher costs in Outpatient and Pharmacy appear to be driven mostly by higher utilization whereas inpatient costs were driven solely by above average prices.
Professional services was the only category where Colorado fared better than other states, although costs were still higher than two of the other four participating states.
Figure 1. Multi-State Total Health Care Cost Comparison (Source: Getting to Affordability: Untangling Cost Drivers)
page 1
page 2
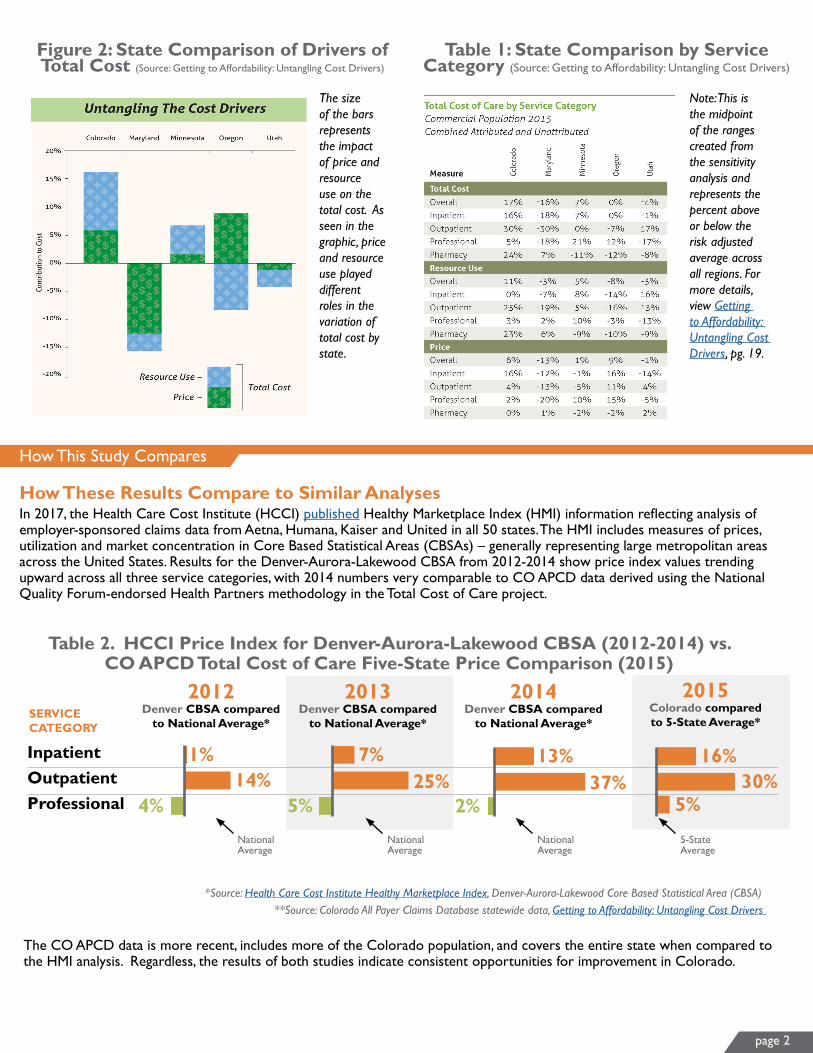
Figure 2: State Comparison of Drivers of Total Cost (Source: Getting to Affordability: Untangling Cost Drivers)
Table 1: State Comparison by Service Category (Source: Getting to Affordability: Untangling Cost Drivers)
How This Study Compares
In 2017, the Health Care Cost Institute (HCCI) published Healthy Marketplace Index (HMI) information reflecting analysis of employer-sponsored claims data from Aetna, Humana, Kaiser and United in all 50 states. The HMI includes measures of prices, utilization and market concentration in Core Based Statistical Areas (CBSAs) – generally representing large metropolitan areas across the United States. Results for the Denver-Aurora-Lakewood CBSA from 2012-2014 show price index values trending upward across all three service categories, with 2014 numbers very comparable to CO APCD data derived using the National Quality Forum-endorsed Health Partners methodology in the Total Cost of Care project.
How These Results Compare to Similar Analyses
The CO APCD data is more recent, includes more of the Colorado population, and covers the entire state when compared to the HMI analysis. Regardless, the results of both studies indicate consistent opportunities for improvement in Colorado.
OutpatientProfessional
Inpatient
2013 Denver CBSA compared
to National Average*
7%
5%25%
1%
4%14%
13%
2%37%
16%30%
SERVICE CATEGORY
2012Denver CBSA compared
to National Average*
2014Denver CBSA compared
to National Average*
2015Colorado compared to 5-State Average*
*Source: Health Care Cost Institute Healthy Marketplace Index, Denver-Aurora-Lakewood Core Based Statistical Area (CBSA)**Source: Colorado All Payer Claims Database statewide data, Getting to Affordability: Untangling Cost Drivers
Table 2. HCCI Price Index for Denver-Aurora-Lakewood CBSA (2012-2014) vs. CO APCD Total Cost of Care Five-State Price Comparison (2015)
5%
National Average
National Average
National Average
5-StateAverage
The size of the bars represents the impact of price and resource use on the total cost. As seen in the graphic, price and resource use played different roles in the variation of total cost by state.
Note: This is the midpoint of the ranges created from the sensitivity analysis and represents the percent above or below the risk adjusted average across all regions. For more details, view Getting to Affordability: Untangling Cost Drivers, pg. 19.

page 3
Opportunities for Savings in CO
When evaluating total costs across the commercially insured patients at the 102 Colorado adult primary care practices included in the Colorado analysis, data indicates that if practices with above average costs reduced per member per month (PMPM) spending to the average across all practices ($437 PMPM), Colorado could save up to $48 million in health care spending per year. This potential savings could be even greater if it was spread across all patients and practices in Colorado, and would be even more significant if practices in Colorado matched more closely with the average total cost across all five states.
Regional Variation in CO
To achieve cost savings in Colorado, it is important to understand where the biggest opportunities are for change. Looking at variation in spending across Colorado Division of Insurance (DOI) geographic rate setting regions helps isolate areas of potential focus. Within Colorado, total costs across all services varied substantially by region and ranged from $390-$591 PMPM across practices analyzed.
Six regions in Colorado had higher PMPM costs than the statewide average. The East and Greeley regions had the two highest risk-adjusted PMPM costs in the state, driven by both higher utilization and higher prices. Grand Junction and the West regions had the third and fourth highest total costs respectively, primarily driven by higher prices, as utilization in those areas was either lower than or nearly equal to the statewide average.
Figure 3: Colorado Total (Inpatient, Outpatient, Professional, Pharmacy) Median Risk-Adjusted Per Member Per Month
(PMPM) Cost by CO Division of Insurance Region
Table 3. Total (Inpatient, Outpatient, Professional, Pharmacy) Median Risk-Adjusted Per Member Per Month (PMPM) Cost by CO Division of Insurance Region
GreeleyWest
East
Grand JunctionPuebloBoulder
DenverColorado Springs
Fort Collins
UTILIZATION Compared to the CO Statewide Median*
PRICE Compared to the CO Statewide Median*
8%
2%
6%
9%5%
8%
8%1%
21%17%
23%33%
4%
7%8%
7%6%
$559$547
$591
$455$539
$424$439
$390$403
COSTPMPM
*Statewide medians only reflect results for the 102 adult primary care practices included in the 2015 Colorado All Payer Claims Database study
Statewide Median:$437
Statewide Median
Statewide Median
*Statewide medians only reflect results for the 102 adult primary care practices included in the 2015 Colorado All Payer Claims Database study
page 4
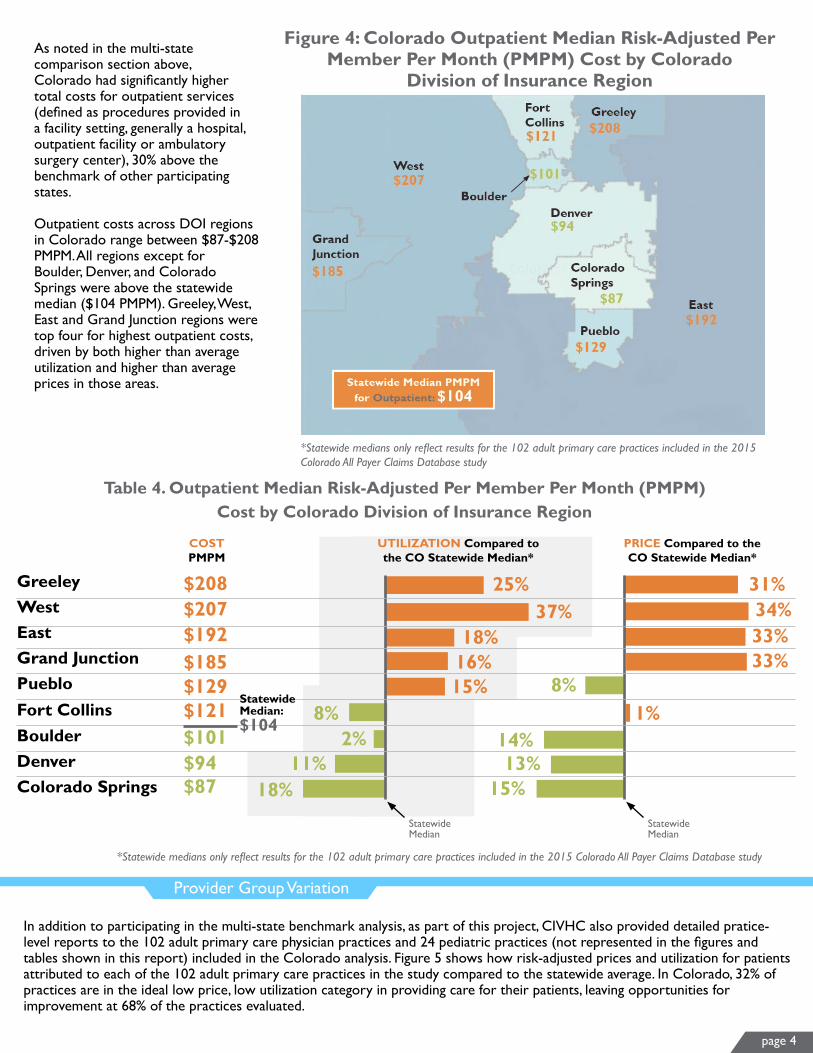
Figure 4: Colorado Outpatient Median Risk-Adjusted Per Member Per Month (PMPM) Cost by Colorado
Division of Insurance Region
As noted in the multi-state comparison section above, Colorado had significantly higher total costs for outpatient services (defined as procedures provided in a facility setting, generally a hospital, outpatient facility or ambulatory surgery center), 30% above the benchmark of other participating states.
Outpatient costs across DOI regions in Colorado range between $87-$208 PMPM. All regions except for Boulder, Denver, and Colorado Springs were above the statewide median ($104 PMPM). Greeley, West, East and Grand Junction regions were top four for highest outpatient costs, driven by both higher than average utilization and higher than average prices in those areas.
Provider Group Variation
In addition to participating in the multi-state benchmark analysis, as part of this project, CIVHC also provided detailed pratice-level reports to the 102 adult primary care physician practices and 24 pediatric practices (not represented in the figures and tables shown in this report) included in the Colorado analysis. Figure 5 shows how risk-adjusted prices and utilization for patients attributed to each of the 102 adult primary care practices in the study compared to the statewide average. In Colorado, 32% of practices are in the ideal low price, low utilization category in providing care for their patients, leaving opportunities for improvement at 68% of the practices evaluated.
GreeleyWestEastGrand JunctionPueblo
BoulderDenverColorado Springs
Fort Collins
Table 4. Outpatient Median Risk-Adjusted Per Member Per Month (PMPM) Cost by Colorado Division of Insurance Region
UTILIZATION Compared to the CO Statewide Median*
PRICE Compared to the CO Statewide Median*
15%
18%
2%
Statewide Median
31%34%
33%
1%8%
$207$192
$208
$129$185
$101$121
$87$94
COSTPMPM
25%37%
18%16%
33%
8%
11%14%13%
15%
Statewide Median:$104
Statewide Median
*Statewide medians only reflect results for the 102 adult primary care practices included in the 2015 Colorado All Payer Claims Database study
*Statewide medians only reflect results for the 102 adult primary care practices included in the 2015 Colorado All Payer Claims Database study
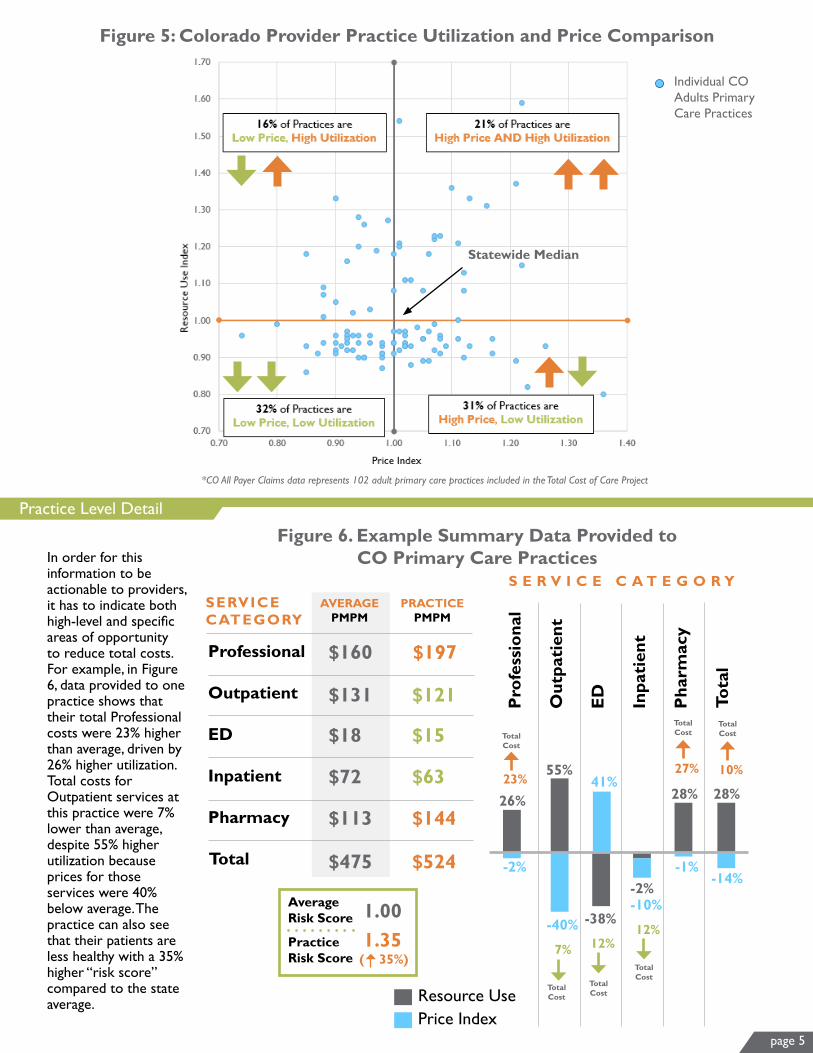
Figure 5: Colorado Provider Practice Utilization and Price Comparison
page 5
Practice Level Detail
In order for this information to be actionable to providers, it has to indicate both high-level and specific areas of opportunity to reduce total costs. For example, in Figure 6, data provided to one practice shows that their total Professional costs were 23% higher than average, driven by 26% higher utilization. Total costs for Outpatient services at this practice were 7% lower than average, despite 55% higher utilization because prices for those services were 40% below average. The practice can also see that their patients are less healthy with a 35% higher “risk score” compared to the state average.
Statewide Median
Individual CO Adults Primary Care Practices
*CO All Payer Claims data represents 102 adult primary care practices included in the Total Cost of Care Project
Figure 6. Example Summary Data Provided to CO Primary Care Practices
Out
pati
ent
ED
Pro
fess
iona
l
26%
-40%
S E R V I C E C A T E G O R Y
Pha
rmac
y
Tota
l
Inpa
tien
t
Resource UsePrice Index
55%
-38%
-2%
28% 28%41%
-10%
-14%-2% -1%
Outpatient
ED
Professional
Pharmacy
Total
Inpatient
SERVICE CATEGORY
$160
$131
$18
$72
$113
$475
$197
$121
$15
$63
$144
$524
AVERAGEPMPM
PRACTICEPMPM
12%
23%
Total Cost
Total Cost
Total Cost
Total Cost
Total Cost
Total Cost
12%7%
10%27%
( 35%)
Average Risk Score
Practice Risk Score
1.001.35

Reference-Based Inpatient and Outpatient Payment Analysis:
Reducing Payment Variation as a Potential Cost-Savings Mechanism
November 2018

Many cost reduction strategies have been implemented and tested to address rising health care costs locally and nationally. One model in particular – reference-based pricing – has proven to be an effective approach for reducing health care spending.
In partnership with the Colorado Business Group on Health (CBGH), and with funding from the Colorado Department of Health Care Policy and Financing (HCPF), the Center for Improving Value in Health Care (CIVHC) analyzed paid amounts in the Colorado All Payer Claims Database (CO APCD) to determine the potential impact reference-based pricing (both percent of Medicare and median commercial payments) could have statewide on high volume, high price inpatient and outpatient services.
Results show that if variation in prices for the top 12 inpatient services and top 10 outpatient services were normalized to one of three reference-based pricing scenarios, health care spending could be reduced by $49-$178 million annually across commercial health insurance payments. Additional reductions in spending, referred to in this report as savings, would be possible if a reference-based pricing model was applied across all inpatient and outpatient services in the state.
Overview
Background
Commercial health insurance payers often negotiate rates with providers based on expected discounts on the amounts charged for services. These charges, however, are determined independently by each provider or facility, making it difficult for a self-insured employer or health plan to determine if they are receiving a reasonable rate. For example, one health care facility may charge $100,000 for brain surgery while another charges $50,000 for the same procedure. A payer negotiating a 20% discount off of charges with each facility would get the same discount or “deal” but would still be paying a lot more at the facility that charges the higher initial rate.
In contrast, the Centers for Medicare & Medicaid Services (CMS) determines reasonable payments to hospitals and providers through MedPAC, an independent advisory group that takes into consideration a variety of factors including patient mix and geographic location when setting payments. MedPAC establishes new rates annually with the goal to cover costs for efficient hospitals and providers. While MedPAC does propose rates to Congress that are intended to cover costs for hospitals, those payments are not always approved as suggested, and the top 15 percent most efficient and high-value hospitals in the country report a one percent loss on Medicare payments.
To accommodate the need for providers to make a profit in order to continue to provide care to patients with public insurance, this analysis assumes payments of 1.5-2 times Medicare payments and the median statewide commercial paid amounts as potential reference points. It is important to note that the three scenarios provided in this analysis are intended for demonstration purposes only, and other reference-based negotiation options should be explored between payers and providers seeking to implement a similar model.
1
Analysis and Methodology
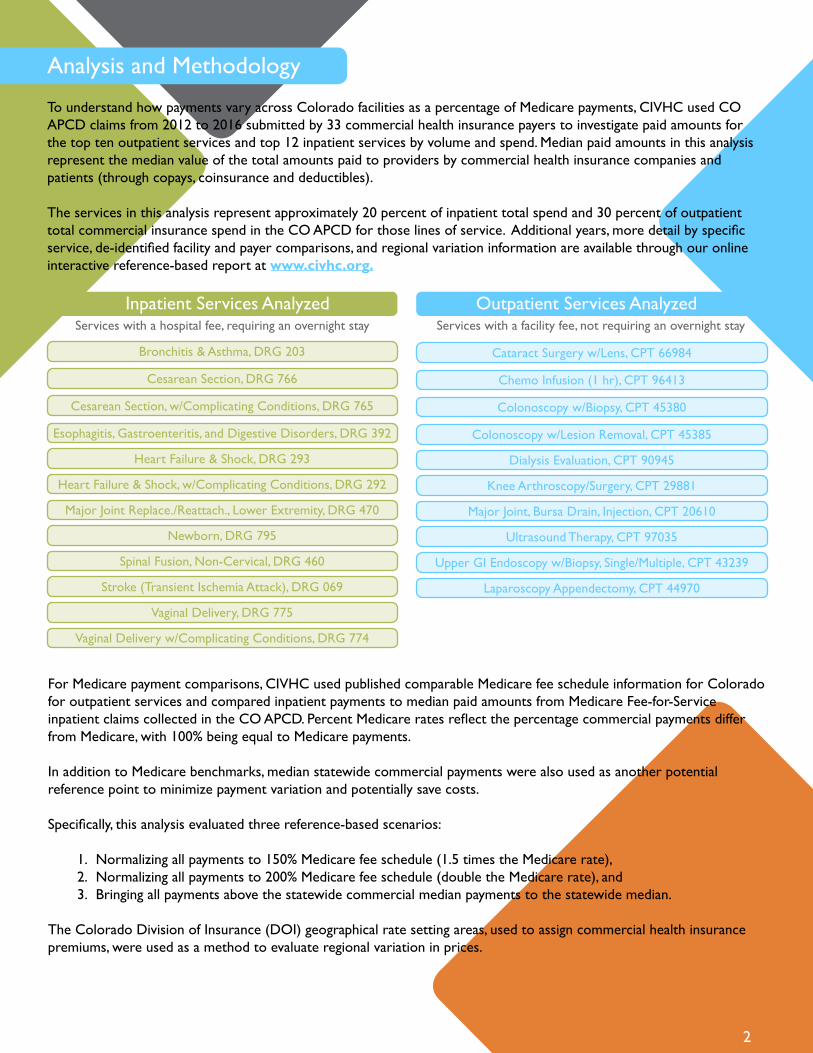
To understand how payments vary across Colorado facilities as a percentage of Medicare payments, CIVHC used CO APCD claims from 2012 to 2016 submitted by 33 commercial health insurance payers to investigate paid amounts for the top ten outpatient services and top 12 inpatient services by volume and spend. Median paid amounts in this analysis represent the median value of the total amounts paid to providers by commercial health insurance companies and patients (through copays, coinsurance and deductibles).
The services in this analysis represent approximately 20 percent of inpatient total spend and 30 percent of outpatient total commercial insurance spend in the CO APCD for those lines of service. Additional years, more detail by specific service, de-identified facility and payer comparisons, and regional variation information are available through our online interactive reference-based report at www.civhc.org.
Inpatient Services AnalyzedServices with a hospital fee, requiring an overnight stay
Outpatient Services AnalyzedServices with a facility fee, not requiring an overnight stay
2
For Medicare payment comparisons, CIVHC used published comparable Medicare fee schedule information for Colorado for outpatient services and compared inpatient payments to median paid amounts from Medicare Fee-for-Service inpatient claims collected in the CO APCD. Percent Medicare rates reflect the percentage commercial payments differ from Medicare, with 100% being equal to Medicare payments.
In addition to Medicare benchmarks, median statewide commercial payments were also used as another potential reference point to minimize payment variation and potentially save costs.
Specifically, this analysis evaluated three reference-based scenarios:
1. Normalizing all payments to 150% Medicare fee schedule (1.5 times the Medicare rate), 2. Normalizing all payments to 200% Medicare fee schedule (double the Medicare rate), and 3. Bringing all payments above the statewide commercial median payments to the statewide median.
The Colorado Division of Insurance (DOI) geographical rate setting areas, used to assign commercial health insurance premiums, were used as a method to evaluate regional variation in prices.
Bronchitis & Asthma, DRG 203
Stroke (Transient Ischemia Attack), DRG 069
Spinal Fusion, Non-Cervical, DRG 460
Newborn, DRG 795
Vaginal Delivery, DRG 775
Major Joint Replace./Reattach., Lower Extremity, DRG 470
Heart Failure & Shock, w/Complicating Conditions, DRG 292
Heart Failure & Shock, DRG 293
Esophagitis, Gastroenteritis, and Digestive Disorders, DRG 392
Cesarean Section, w/Complicating Conditions, DRG 765
Cesarean Section, DRG 766
Vaginal Delivery w/Complicating Conditions, DRG 774
Cataract Surgery w/Lens, CPT 66984
Laparoscopy Appendectomy, CPT 44970
Upper GI Endoscopy w/Biopsy, Single/Multiple, CPT 43239
Ultrasound Therapy, CPT 97035
Major Joint, Bursa Drain, Injection, CPT 20610
Knee Arthroscopy/Surgery, CPT 29881
Dialysis Evaluation, CPT 90945
Colonoscopy w/Lesion Removal, CPT 45385
Colonoscopy w/Biopsy, CPT 45380
Chemo Infusion (1 hr), CPT 96413
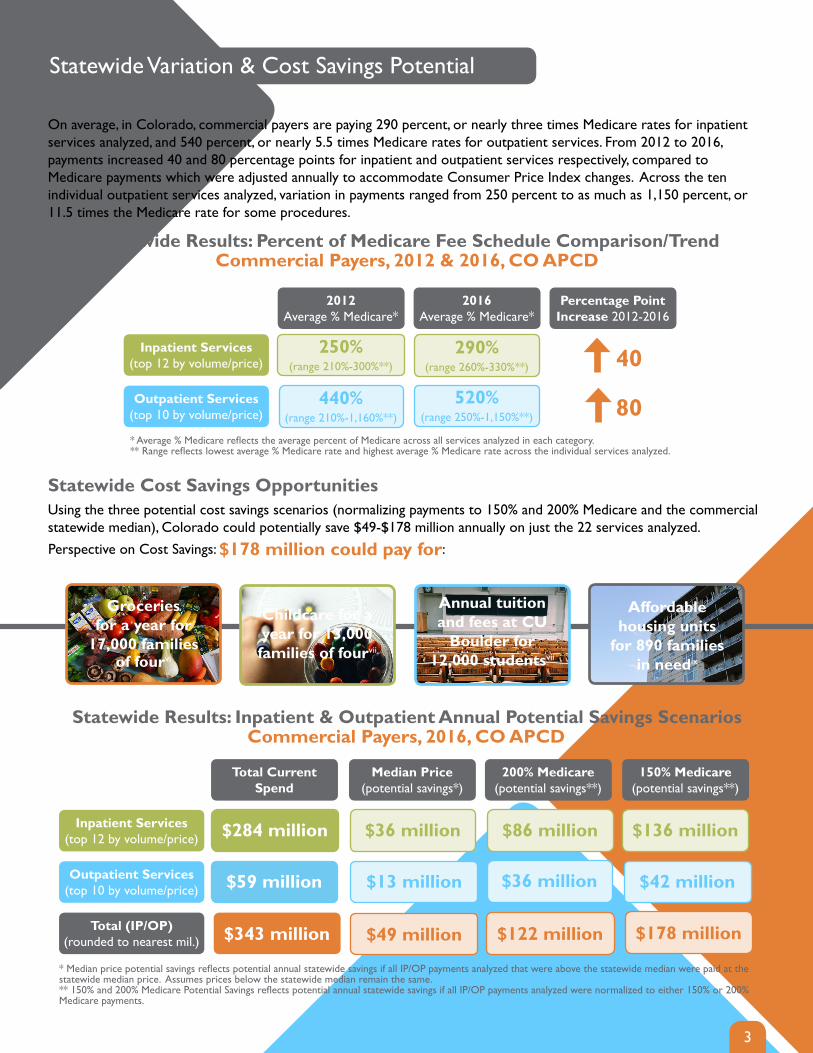
Statewide Variation & Cost Savings Potential
Statewide VariationOn average, in Colorado, commercial payers are paying 290 percent, or nearly three times Medicare rates for inpatient services analyzed, and 540 percent, or nearly 5.5 times Medicare rates for outpatient services. From 2012 to 2016, payments increased 40 and 80 percentage points for inpatient and outpatient services respectively, compared to Medicare payments which were adjusted annually to accommodate Consumer Price Index changes. Across the ten individual outpatient services analyzed, variation in payments ranged from 250 percent to as much as 1,150 percent, or 11.5 times the Medicare rate for some procedures.
Statewide Results: Percent of Medicare Fee Schedule Comparison/TrendCommercial Payers, 2012 & 2016, CO APCD
Statewide Cost Savings OpportunitiesUsing the three potential cost savings scenarios (normalizing payments to 150% and 200% Medicare and the commercial statewide median), Colorado could potentially save $49-$178 million annually on just the 22 services analyzed. Perspective on Cost Savings: $178 million could pay for:
Statewide Results: Inpatient & Outpatient Annual Potential Savings ScenariosCommercial Payers, 2016, CO APCD
3
Inpatient Services (top 12 by volume/price)
Outpatient Services (top 10 by volume/price)
2012 Average % Medicare*
2016 Average % Medicare*
Percentage Point Increase 2012-2016
250%(range 210%-300%**)
290%(range 260%-330%**)
440%(range 210%-1,160%**)
520%(range 250%-1,150%**)
40
80
Inpatient Services (top 12 by volume/price)
Outpatient Services (top 10 by volume/price)
Total Current Spend
Median Price(potential savings*)
200% Medicare(potential savings**)
$284 million
$59 million
150% Medicare(potential savings**)
$36 million
$13 million
$86 million $136 million
$36 million $42 million
Total (IP/OP) (rounded to nearest mil.) $343 million $49 million $122 million $178 million
Childcare for a year for 13,000 families of fourvii
Annual tuition and fees at CU
Boulder for 12,000 studentsvii
Affordable housing units
for 890 families in needix
Groceries for a year for
17,000 families of fourvi
* Average % Medicare reflects the average percent of Medicare across all services analyzed in each category.** Range reflects lowest average % Medicare rate and highest average % Medicare rate across the individual services analyzed.
* Median price potential savings reflects potential annual statewide savings if all IP/OP payments analyzed that were above the statewide median were paid at the statewide median price. Assumes prices below the statewide median remain the same.** 150% and 200% Medicare Potential Savings reflects potential annual statewide savings if all IP/OP payments analyzed were normalized to either 150% or 200% Medicare payments.
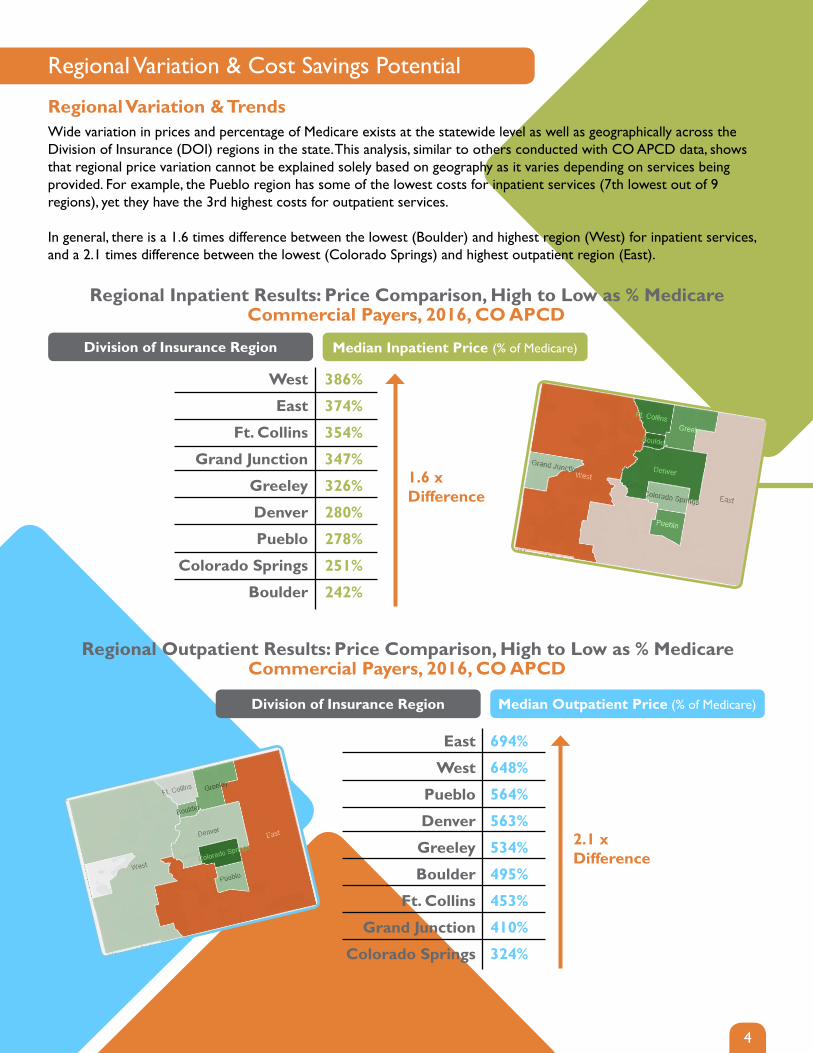
Regional Variation & Cost Savings Potential
Regional Variation & TrendsWide variation in prices and percentage of Medicare exists at the statewide level as well as geographically across the Division of Insurance (DOI) regions in the state. This analysis, similar to others conducted with CO APCD data, shows that regional price variation cannot be explained solely based on geography as it varies depending on services being provided. For example, the Pueblo region has some of the lowest costs for inpatient services (7th lowest out of 9 regions), yet they have the 3rd highest costs for outpatient services.
In general, there is a 1.6 times difference between the lowest (Boulder) and highest region (West) for inpatient services, and a 2.1 times difference between the lowest (Colorado Springs) and highest outpatient region (East).
Regional Inpatient Results: Price Comparison, High to Low as % MedicareCommercial Payers, 2016, CO APCD
Regional Outpatient Results: Price Comparison, High to Low as % MedicareCommercial Payers, 2016, CO APCD
4
Median Inpatient Price (% of Medicare)Division of Insurance Region
Median Outpatient Price (% of Medicare)Division of Insurance Region
West
East
Ft. Collins
Grand Junction
Greeley
Denver
Pueblo
Colorado Springs
Boulder
East
West
Pueblo
Denver
Greeley
Boulder
Ft. Collins
Grand Junction
Colorado Springs
386%
374%
354%
347%
326%
280%
278%
251%
242%
1.6 x Difference
694%
648%
564%
563%
534%
495%
453%
410%
324%
2.1 x Difference
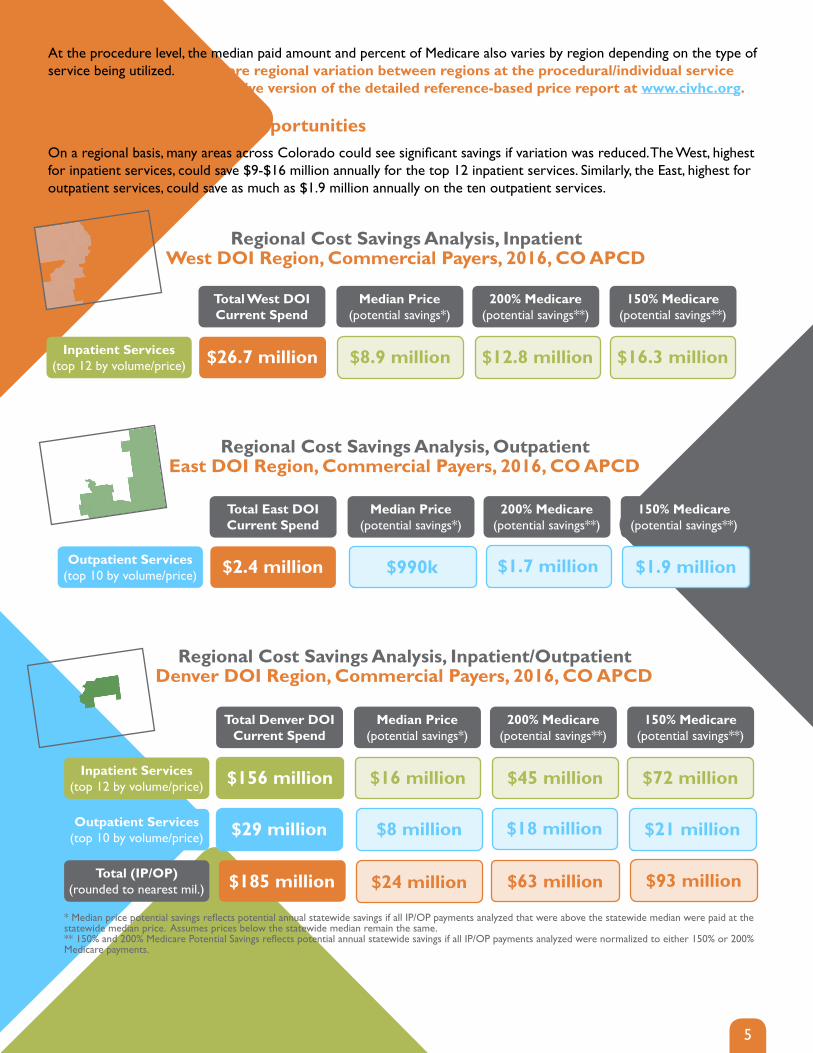
5
At the procedure level, the median paid amount and percent of Medicare also varies by region depending on the type of service being utilized. To explore regional variation between regions at the procedural/individual service level, please visit the interactive version of the detailed reference-based price report at www.civhc.org.
On a regional basis, many areas across Colorado could see significant savings if variation was reduced. The West, highest for inpatient services, could save $9-$16 million annually for the top 12 inpatient services. Similarly, the East, highest for outpatient services, could save as much as $1.9 million annually on the ten outpatient services.
Regional Cost Savings Opportunities
Regional Cost Savings Analysis, InpatientWest DOI Region, Commercial Payers, 2016, CO APCD
Regional Cost Savings Analysis, OutpatientEast DOI Region, Commercial Payers, 2016, CO APCD
Regional Cost Savings Analysis, Inpatient/OutpatientDenver DOI Region, Commercial Payers, 2016, CO APCD
Inpatient Services (top 12 by volume/price)
Total West DOI Current Spend
Median Price(potential savings*)
200% Medicare(potential savings**)
$26.7 million
150% Medicare(potential savings**)
$8.9 million $12.8 million $16.3 million
Outpatient Services (top 10 by volume/price)
Total East DOI Current Spend
Median Price(potential savings*)
200% Medicare(potential savings**)
$2.4 million
150% Medicare(potential savings**)
$990k $1.7 million $1.9 million
Inpatient Services (top 12 by volume/price)
Outpatient Services (top 10 by volume/price)
Total Denver DOI Current Spend
Median Price(potential savings*)
200% Medicare(potential savings**)
$156 million
$29 million
150% Medicare(potential savings**)
$16 million
$8 million
$45 million $72 million
$18 million $21 million
Total (IP/OP) (rounded to nearest mil.) $185 million $24 million $63 million $93 million
* Median price potential savings reflects potential annual statewide savings if all IP/OP payments analyzed that were above the statewide median were paid at the statewide median price. Assumes prices below the statewide median remain the same.** 150% and 200% Medicare Potential Savings reflects potential annual statewide savings if all IP/OP payments analyzed were normalized to either 150% or 200% Medicare payments.

Facility Variation & TrendsPayments and percentage of Medicare vary greatly, not only by region of the state, but also across facilities. For example, for a major joint replacement of lower extremity without complications, hospital-specific payments varied from $19,000 on the low end to $57,000 on the high end. The tables below identify facility commercial payer variation for several of the inpatient and outpatient procedures. To see variation across all services, visit our interactive report online at www.civhc.org.
Inpatient Variation in Facility Median Paid Amount & Percent of Medicare2017, CO APCD
Outpatient Variation in Facility Median Paid Amount & Percent Medicare2017, CO APCD
6
Inpatient Service (DRG)
Vaginal DeliveryDRG 775
C-Section DRG 776
Digestive Disorders DRG 392
Joint Replacement DRG 470
Spinal FusionDRG 460
$3,980 (122%)
$13,100 (402%)
$9,100 (200%)$19,760 (434%)
$7,130 (176%)$12,770 (314%)
$19,460 (163%)$64,550 (540%)
$35,450 (147%)$89,000 (368%)
LOW / HIGH
Outpatient Service (CPT)
Cataract SurgeryCPT 66984
Chemo Infusion CPT 96413
Colonoscopy w/Bio.CPT 45380
Knee Arthroscopy CPT 29881
Up. GI Endoscopy CPT 43239
$370 (56%)
$2,930(446%)
$180 (125%)$950 (674%)
$550 (259%)$3,430 (1,604%)
$790 (139%)$4,310 (763%)
$300 (202%)$3,480 (2,352%)
Laparoscopy App. CPT 44970
$900 (143%)$11,780 (1,865%)
(% Medicare)
LOW / HIGH (% Medicare)

Colorado Employer Cost Savings StudyLarge employers who fund their own employee health insurance program can utilize this type of analysis and the CO APCD to evaluate potential cost-savings approaches. As an example, CIVHC took claims data from a large statewide employer with approximately 12,000 self-insured members and analyzed their payments for the inpatient claims against the same three cost-savings scenarios. Data in the table below shows that this employer could save between $530,000 and $3.3 million if they were able to negotiate rates similar to median statewide commercial prices or up to 200% of Medicare for the 12 inpatient services. Savings could be much higher if all outpatient and inpatient services were negotiated using a reference-based pricing model.
Inpatient Annual Potential Employer Savings ScenariosCommercial Payers, 2016, CO APCD
7
Inpatient Services (top 12 by
volume/price)
Total Current Spend
Median Price(potential savings*)
200% Medicare(potential savings**)
$5.1 million
150% Medicare(potential savings**)
$530k $1.5 million
$2.4 million
100% Medicare(potential savings**)
$3.3 million
* Median price potential savings reflects potential annual savings for a Colorado employer if all inpatient payments analyzed that were above the statewide median were paid at the statewide median price. Assumes prices below statewide median remain the same.** 100%, 150% and 200% Medicare Potential Savings reflects potential annual savings for a Colorado employer if all outpatient payments analyzed were normalized to either 100%, 150% or 200% Medicare payments.
Faced with looming projections of a $9 million deficit for their state employee health plan in 2017, the Montana State Employee Plan used Medicare rates as a baseline to negotiate prices with hospitals.i They worked with the vast majority of hospitals in the state, many of which are Critical Access Hospitals, to pay 234 percent of Medicare payments for all inpatient and outpatient services.ii Using Medicare as a reference-base as opposed to traditional negotiations based on charges, the state saved $15.6 million in the first year and now has over $100 million in reserves.iii These savings have helped secure the future of health insurance for state employees in Montana and allowed the State Department to use some of the surplus to support other pressing statewide needs.iv Based on the results of Montana’s reference-based pricing results, North Carolina has plans to implement a similar structure for their state employee plan in January 2020.v
Montana Case Study
Sources
8
i, iiAppleby, J. (2018, June 20). ‘Holy Cow’ Moment Changes How Montana’s State Health Plan Does Business. Kaiser Health News. Retrieved August 2018, from https://khn.org/news/holy-cow-moment-changes-how-montanas-state-health- plan-does-business/?utm_campaign=KHN%3A%20First%20Edition&utm_source=hs_email&utm_medium=e mail&utm_content=63899645&_hsenc=p2ANqtz--XqDFBzZeQW4sOiEy0x5mD9Eta296DchNyWTfIPPr8OW 6aWsZqAii
iii, ivBartlett, M. (June 2018). State of MT - RBP Initiative Presentation for The Colorado Business Group on Health. Colorado Business Group on Health Determining Price Reasonableness.
v The Pilot. (2018, October 4). State Health Plan Launches New Provider Reimbursement Effort. ThePilot.com. Retrieved October 2018, from http://www.thepilot.com/business/state-health-plan-launches-new-provider-reimbursement-ef fort/article_1a31dbf6-c7f3-11e8-bb85-6bdba81c9f16.html
vi, vii, ix Massachusetts Institute of Technology. (2018). Living Wage Calculation for Denver County, Colorado. Retrieved August 2018, from The Living Wage Calculator: http://livingwage.mit.edu/counties/08031
viii University of Colorado. (2018). Cost Estimates - Undergraduate Colorado Resident. Retrieved from University of Colorado Boulder Bursar’s Office: https://www.colorado.edu/bursar/cost-estimates/undergraduate-colorado-resi dent
The Way Forward
This analysis used median commercial prices and Medicare rates as potential benchmarks to measure price variation. However, other options exist and could be considered to reduce variation in payments for health care services. Other considerations such as a provider’s geographic location and patient mix, among other factors, would need to be examined when evaluating the impact of implementing cost savings mechanisms at the individual facility level. This infor-mation can, however, be used as a starting point to stimulate further conversations among employers, legislators, provid-ers and other stakeholders on potential ways Colorado could consider addressing rising costs and improving the health and quality of care for all Coloradans.
The Colorado Business Group on Health (CBGH) has been actively convening state officials, employers, hospitals, payers and other stakeholders to introduce the concept of using this type of data from the CO APCD as a starting point to address rising health care costs as well as the burden on employers and all Coloradans. They plan to continue engaging employers to work with payers, hospitals, and other facilities to change the way health care is purchased in the state with the intent of creating a more functional marketplace that works for all players. To find out more or to engage in the work of CBGH and others across the state, please contact CBGH directly at www.cbghealth.org, or contact CIVHC at [email protected] to find out how you can be a part of the conversation.
Funding support for this analysis was made possible through the Colorado Business Group on Health and the CO APCD Scholarship fund administered by the Department of Health Care Policy and Finance.
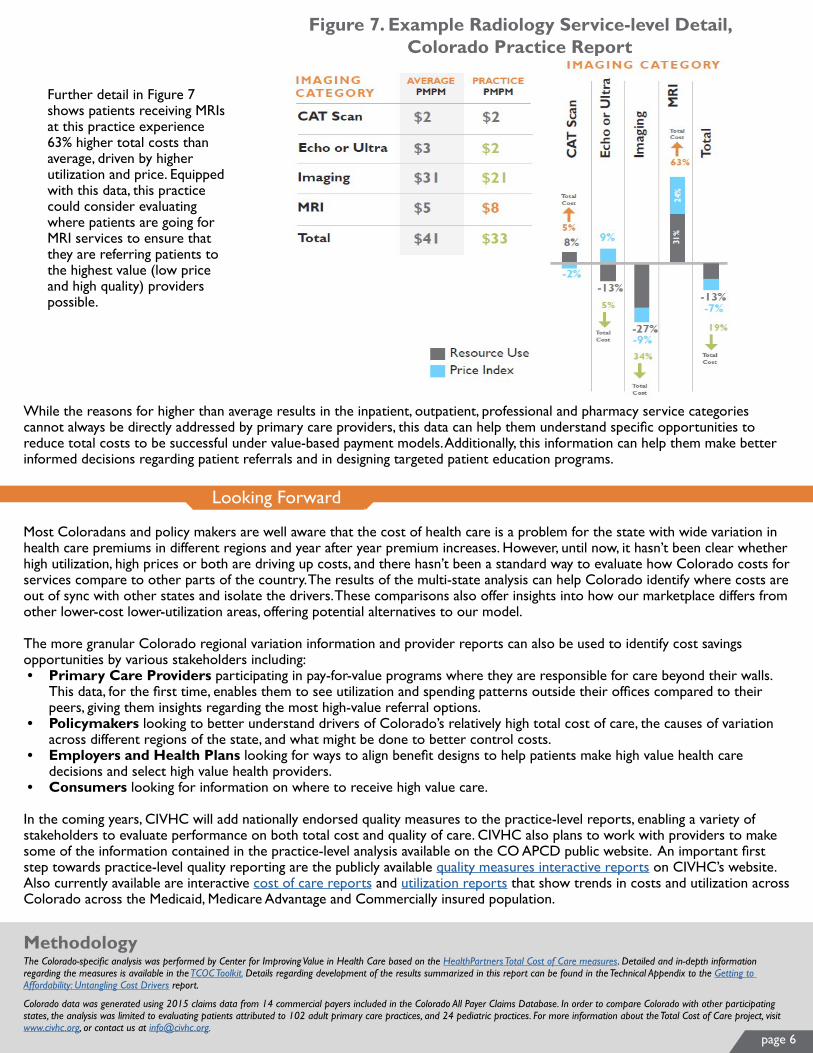
page 6
Further detail in Figure 7 shows patients receiving MRIs at this practice experience 63% higher total costs than average, driven by higher utilization and price. Equipped with this data, this practice could consider evaluating where patients are going for MRI services to ensure that they are referring patients to the highest value (low price and high quality) providers possible.
Figure 7. Example Radiology Service-level Detail, Colorado Practice Report
While the reasons for higher than average results in the inpatient, outpatient, professional and pharmacy service categories cannot always be directly addressed by primary care providers, this data can help them understand specific opportunities to reduce total costs to be successful under value-based payment models. Additionally, this information can help them make better informed decisions regarding patient referrals and in designing targeted patient education programs.
Looking Forward
Most Coloradans and policy makers are well aware that the cost of health care is a problem for the state with wide variation in health care premiums in different regions and year after year premium increases. However, until now, it hasn’t been clear whether high utilization, high prices or both are driving up costs, and there hasn’t been a standard way to evaluate how Colorado costs for services compare to other parts of the country. The results of the multi-state analysis can help Colorado identify where costs are out of sync with other states and isolate the drivers. These comparisons also offer insights into how our marketplace differs from other lower-cost lower-utilization areas, offering potential alternatives to our model.
The more granular Colorado regional variation information and provider reports can also be used to identify cost savings opportunities by various stakeholders including: • Primary Care Providers participating in pay-for-value programs where they are responsible for care beyond their walls.
This data, for the first time, enables them to see utilization and spending patterns outside their offices compared to their peers, giving them insights regarding the most high-value referral options.
• Policymakers looking to better understand drivers of Colorado’s relatively high total cost of care, the causes of variation across different regions of the state, and what might be done to better control costs.
• Employers and Health Plans looking for ways to align benefit designs to help patients make high value health care decisions and select high value health providers.
• Consumers looking for information on where to receive high value care.
In the coming years, CIVHC will add nationally endorsed quality measures to the practice-level reports, enabling a variety of stakeholders to evaluate performance on both total cost and quality of care. CIVHC also plans to work with providers to make some of the information contained in the practice-level analysis available on the CO APCD public website. An important first step towards practice-level quality reporting are the publicly available quality measures interactive reports on CIVHC’s website. Also currently available are interactive cost of care reports and utilization reports that show trends in costs and utilization across Colorado across the Medicaid, Medicare Advantage and Commercially insured population.
MethodologyThe Colorado-specific analysis was performed by Center for Improving Value in Health Care based on the HealthPartners Total Cost of Care measures. Detailed and in-depth information regarding the measures is available in the TCOC Toolkit. Details regarding development of the results summarized in this report can be found in the Technical Appendix to the Getting to Affordability: Untangling Cost Drivers report.
Colorado data was generated using 2015 claims data from 14 commercial payers included in the Colorado All Payer Claims Database. In order to compare Colorado with other participating states, the analysis was limited to evaluating patients attributed to 102 adult primary care practices, and 24 pediatric practices. For more information about the Total Cost of Care project, visit www.civhc.org, or contact us at [email protected].

CO APCD DATA BYTE: FIREARM INJURY TRENDS AND COSTS IN COLORADO
FIREARM INJURY TRENDS AND TOTAL COSTSCOMMERCIAL, CO APCD, 2012-2016
FIREARM CLAIMS BY INJURY TYPE, COMMERCIAL, MEDICAID, MEDICARE FFS, MEDICARE ADVANTAGE, CO APCD, 2016
FIREARM INJURY TRENDS AND TOTAL COSTS, COMMERCIAL, MEDICAID, MEDICARE FFS, MEDICARE ADVANTAGE, CO APCD, 2012- 2016
-
500
1,000
1,500
2,000
2,500
3,000
3,500
Unclassified UndeterminedIntent
Self Harm Assault UnintentionalHarm
-
500
1,000
1,500
2,000
2,500
3,000
3,500
4,000
4,500
5,000
2012 2013 2014 2015 2016
-
100
200
300
400
500
600
700
2012 2013 2014 2015 2016
70
VOLUME
230 330680
3,040
1,330 1,350
2,490
3,430
4,350
340 360
490560 580
$3.1
M
TOTAL PAID AMOUNT$4
.3M
$750
K
$16.
1M
$1.6
M
$17.
2M
$19.
1M
$24.
6M
$30M
$25.
8M
$2.1
M
$10.
5M
$6.3
M
$5.4
M
$6.1
M
Tota
l Cla
ims
Tota
l Cla
ims
Tota
l Cla
ims
VOLUME
TOTAL PAID AMOUNT
VOLUME
TOTAL PAID AMOUNT
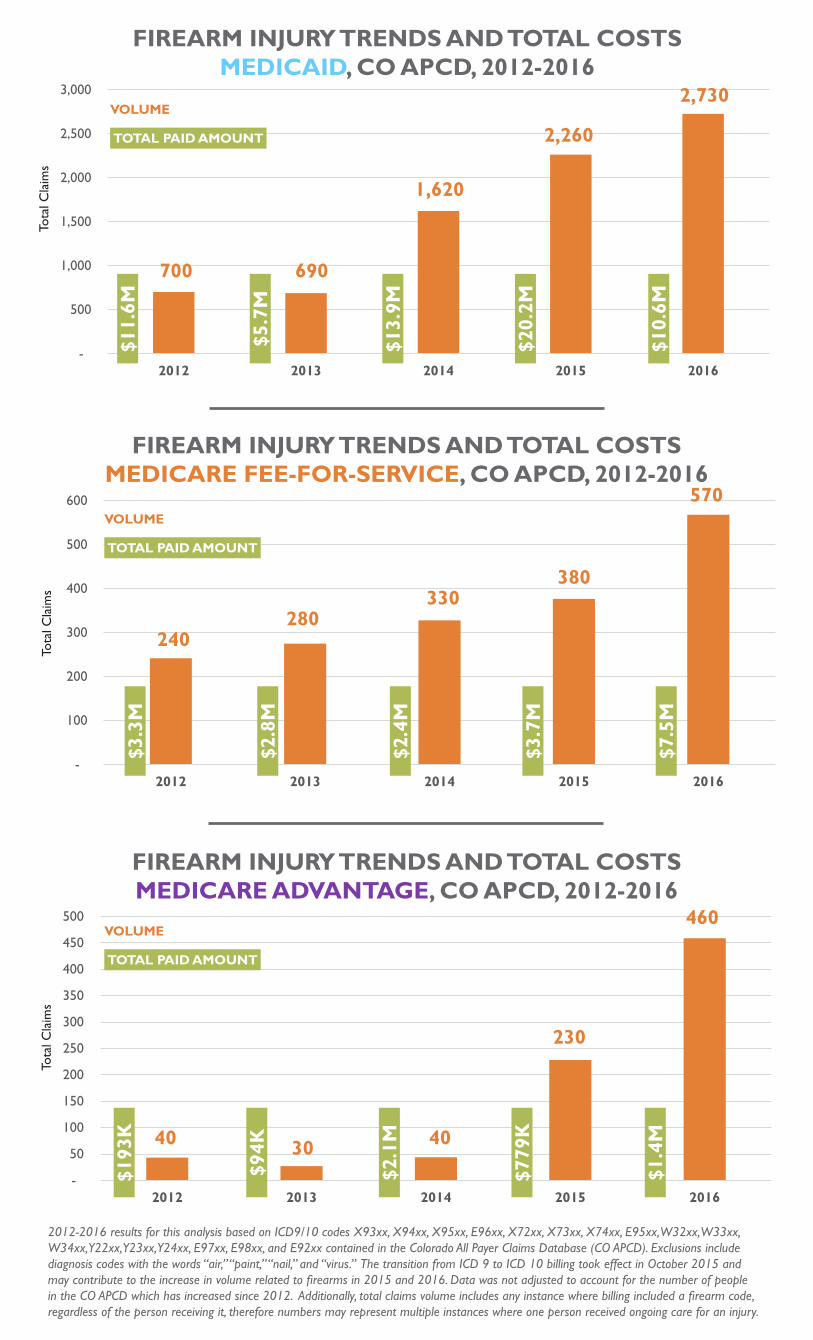
FIREARM INJURY TRENDS AND TOTAL COSTSMEDICARE ADVANTAGE, CO APCD, 2012-2016
FIREARM INJURY TRENDS AND TOTAL COSTSMEDICARE FEE-FOR-SERVICE, CO APCD, 2012-2016
FIREARM INJURY TRENDS AND TOTAL COSTSMEDICAID, CO APCD, 2012-2016
-
500
1,000
1,500
2,000
2,500
3,000
2012 2013 2014 2015 2016
-
100
200
300
400
500
600
2012 2013 2014 2015 2016
-
50
100
150
200
250
300
350
400
450
500
2012 2013 2014 2015 2016
700 690
1,620
2,260
2,730
240280
330380
570
40 30 40
230
460
$11.
6M
$5.7
M
$13.
9M
$20.
2M
$10.
6M
$3.3
M
$2.8
M
$2.4
M
$3.7
M
$7.5
M
$193
K
$94K
$2.1
M
$779
K
$1.4
M
2012-2016 results for this analysis based on ICD9/10 codes X93xx, X94xx, X95xx, E96xx, X72xx, X73xx, X74xx, E95xx, W32xx, W33xx, W34xx, Y22xx, Y23xx, Y24xx, E97xx, E98xx, and E92xx contained in the Colorado All Payer Claims Database (CO APCD). Exclusions include diagnosis codes with the words “air,” “paint,” “nail,” and “virus.” The transition from ICD 9 to ICD 10 billing took effect in October 2015 and may contribute to the increase in volume related to firearms in 2015 and 2016. Data was not adjusted to account for the number of people in the CO APCD which has increased since 2012. Additionally, total claims volume includes any instance where billing included a firearm code, regardless of the person receiving it, therefore numbers may represent multiple instances where one person received ongoing care for an injury.
Tota
l Cla
ims
Tota
l Cla
ims
Tota
l Cla
ims
VOLUME
TOTAL PAID AMOUNT
VOLUME
TOTAL PAID AMOUNT
VOLUME
TOTAL PAID AMOUNT
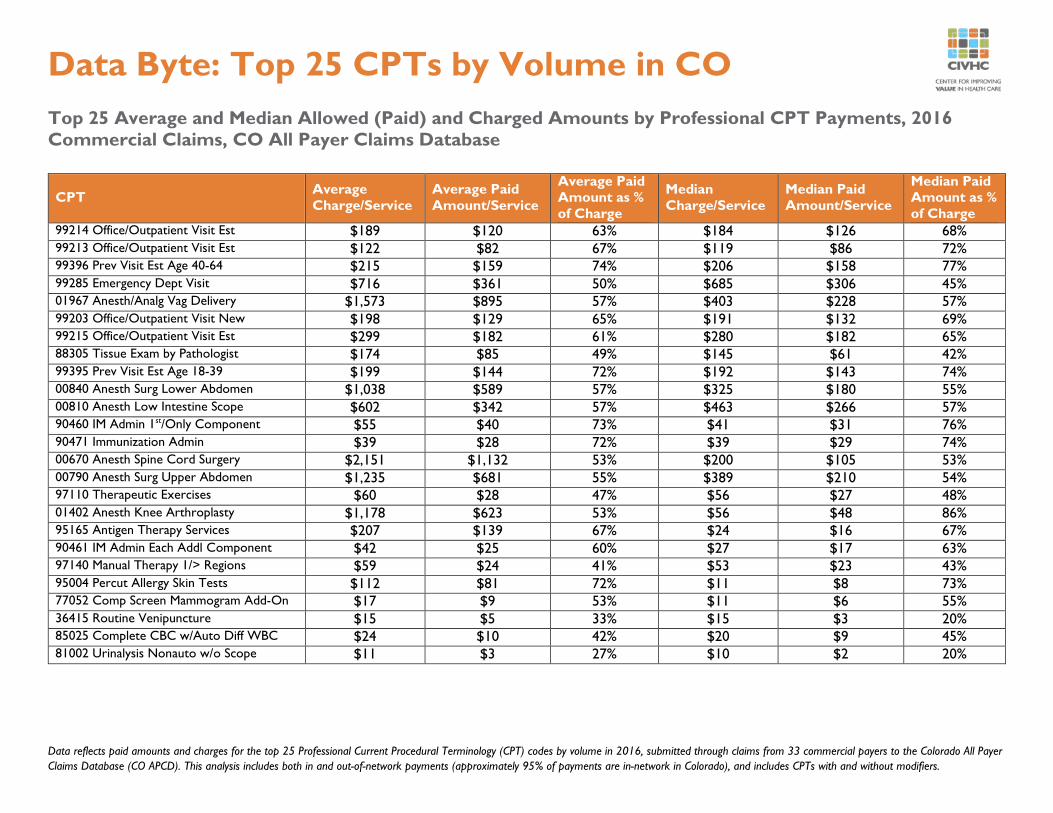
Data reflects paid amounts and charges for the top 25 Professional Current Procedural Terminology (CPT) codes by volume in 2016, submitted through claims from 33 commercial payers to the Colorado All Payer Claims Database (CO APCD). This analysis includes both in and out-of-network payments (approximately 95% of payments are in-network in Colorado), and includes CPTs with and without modifiers.
Data Byte: Top 25 CPTs by Volume in CO Top 25 Average and Median Allowed (Paid) and Charged Amounts by Professional CPT Payments, 2016 Commercial Claims, CO All Payer Claims Database
CPT Average Charge/Service
Average Paid Amount/Service
Average Paid Amount as % of Charge
Median Charge/Service
Median Paid Amount/Service
Median Paid Amount as % of Charge
99214 Office/Outpatient Visit Est $189 $120 63% $184 $126 68% 99213 Office/Outpatient Visit Est $122 $82 67% $119 $86 72% 99396 Prev Visit Est Age 40-64 $215 $159 74% $206 $158 77% 99285 Emergency Dept Visit $716 $361 50% $685 $306 45% 01967 Anesth/Analg Vag Delivery $1,573 $895 57% $403 $228 57% 99203 Office/Outpatient Visit New $198 $129 65% $191 $132 69% 99215 Office/Outpatient Visit Est $299 $182 61% $280 $182 65% 88305 Tissue Exam by Pathologist $174 $85 49% $145 $61 42% 99395 Prev Visit Est Age 18-39 $199 $144 72% $192 $143 74% 00840 Anesth Surg Lower Abdomen $1,038 $589 57% $325 $180 55% 00810 Anesth Low Intestine Scope $602 $342 57% $463 $266 57% 90460 IM Admin 1st/Only Component $55 $40 73% $41 $31 76% 90471 Immunization Admin $39 $28 72% $39 $29 74% 00670 Anesth Spine Cord Surgery $2,151 $1,132 53% $200 $105 53% 00790 Anesth Surg Upper Abdomen $1,235 $681 55% $389 $210 54% 97110 Therapeutic Exercises $60 $28 47% $56 $27 48% 01402 Anesth Knee Arthroplasty $1,178 $623 53% $56 $48 86% 95165 Antigen Therapy Services $207 $139 67% $24 $16 67% 90461 IM Admin Each Addl Component $42 $25 60% $27 $17 63% 97140 Manual Therapy 1/> Regions $59 $24 41% $53 $23 43% 95004 Percut Allergy Skin Tests $112 $81 72% $11 $8 73% 77052 Comp Screen Mammogram Add-On $17 $9 53% $11 $6 55% 36415 Routine Venipuncture $15 $5 33% $15 $3 20% 85025 Complete CBC w/Auto Diff WBC $24 $10 42% $20 $9 45% 81002 Urinalysis Nonauto w/o Scope $11 $3 27% $10 $2 20%
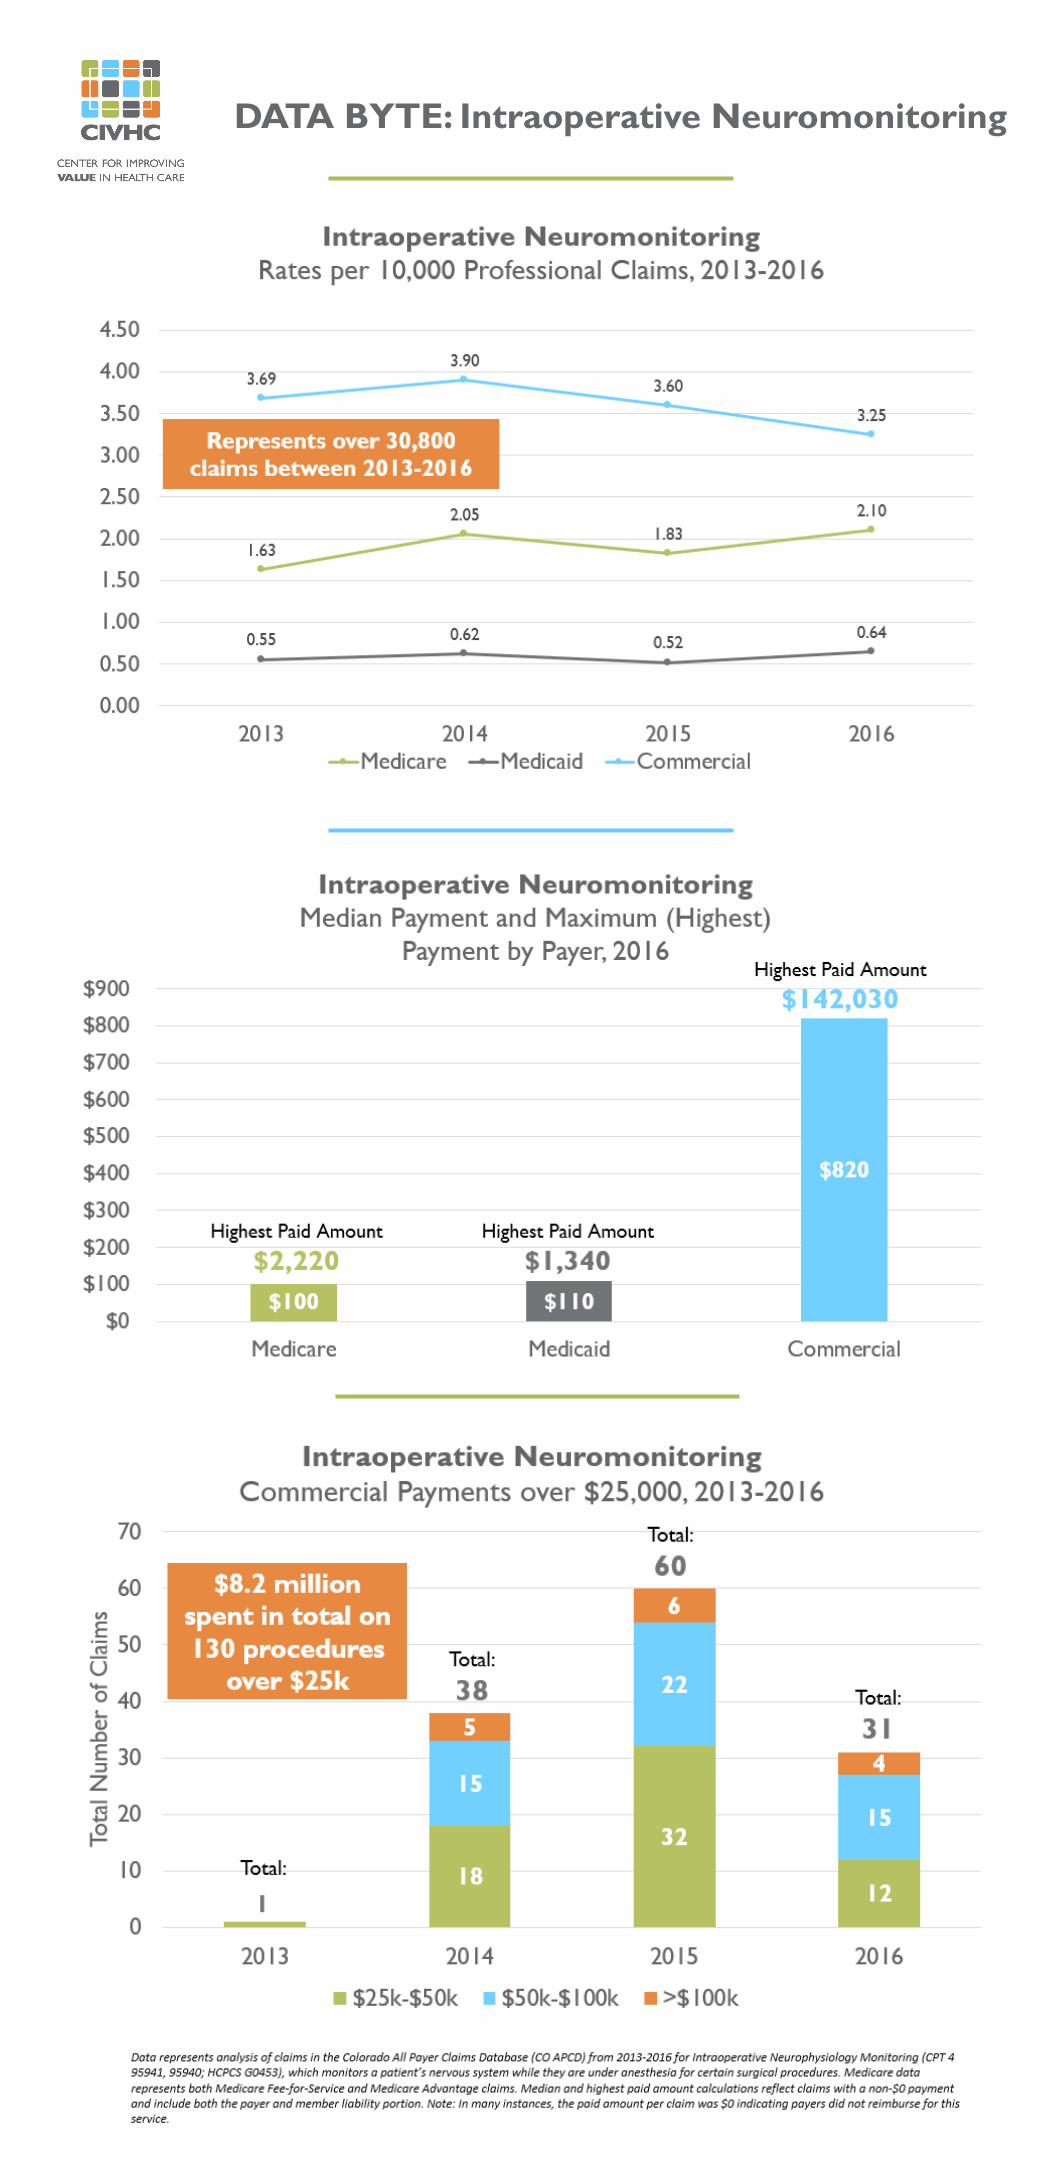
DATA BYTE: Intraoperative Neuromonitoring


![Shes Definitely Your Gangster [1.0]](https://img.pdfslide.net/doc/110x75/545dea00b1af9f14568b47b5/shes-definitely-your-gangster-10.jpg)