Embed Size (px)
Citation preview
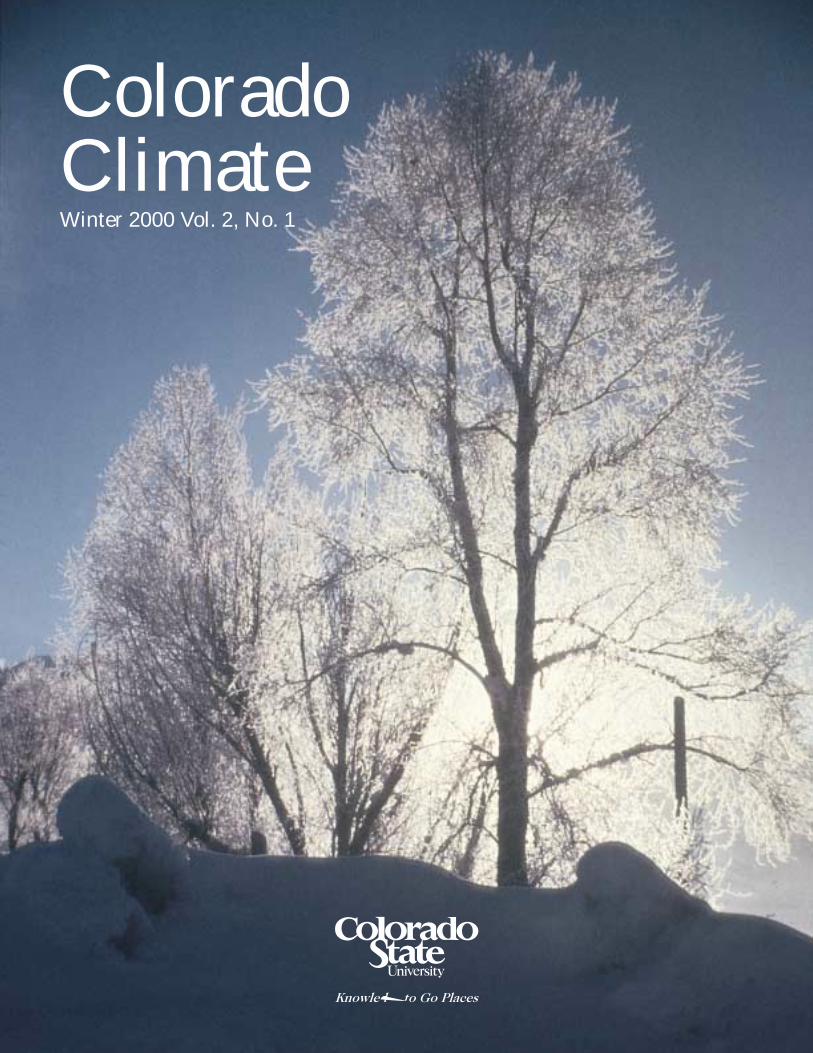
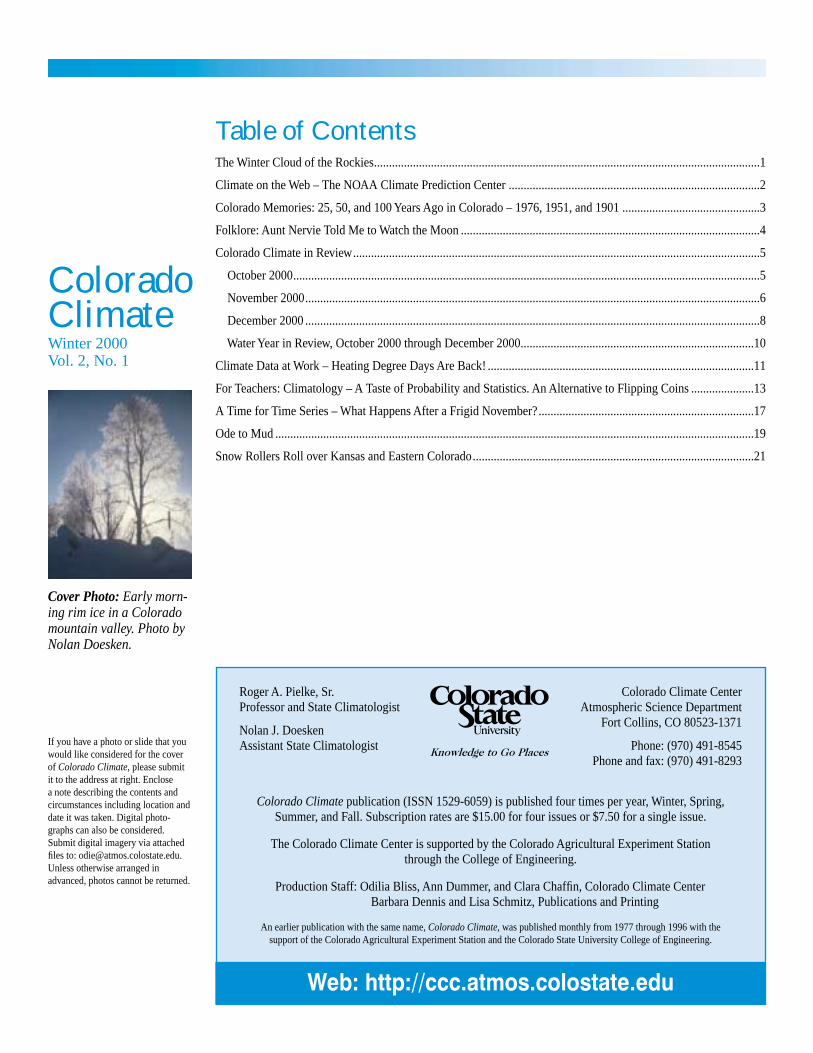
Table of ContentsThe Winter Cloud of the Rockies.................................................................................................................................1
Climate on the Web – The NOAA Climate Prediction Center ....................................................................................2
Colorado Memories: 25, 50, and 100 Years Ago in Colorado – 1976, 1951, and 1901 ..............................................3
Folklore: Aunt Nervie Told Me to Watch the Moon ....................................................................................................4
Colorado Climate in Review........................................................................................................................................5
October 2000............................................................................................................................................................5
November 2000........................................................................................................................................................6
December 2000 ........................................................................................................................................................8
Water Year in Review, October 2000 through December 2000..............................................................................10
Climate Data at Work – Heating Degree Days Are Back! .........................................................................................11
For Teachers: Climatology – A Taste of Probability and Statistics. An Alternative to Flipping Coins .....................13
A Time for Time Series – What Happens After a Frigid November?........................................................................17
Ode to Mud ................................................................................................................................................................19
Snow Rollers Roll over Kansas and Eastern Colorado..............................................................................................21
Cover Photo: Early morn-ing rim ice in a Colorado mountain valley. Photo by Nolan Doesken.
If you have a photo or slide that you would like considered for the cover of Colorado Climate, please submit it to the address at right. Enclose a note describing the contents and circumstances including location and date it was taken. Digital photo-graphs can also be considered. Submit digital imagery via attached fi les to: [email protected]. Unless otherwise arranged in advanced, photos cannot be returned.
Colorado Climate publication (ISSN 1529-6059) is published four times per year, Winter, Spring, Summer, and Fall. Subscription rates are $15.00 for four issues or $7.50 for a single issue.
The Colorado Climate Center is supported by the Colorado Agricultural Experiment Station through the College of Engineering.
Production Staff: Odilia Bliss, Ann Dummer, and Clara Chaffi n, Colorado Climate Center Barbara Dennis and Lisa Schmitz, Publications and Printing
An earlier publication with the same name, Colorado Climate, was published monthly from 1977 through 1996 with the support of the Colorado Agricultural Experiment Station and the Colorado State University College of Engineering.
Colorado Climate CenterAtmospheric Science Department
Fort Collins, CO 80523-1371
Phone: (970) 491-8545Phone and fax: (970) 491-8293
Roger A. Pielke, Sr.Professor and State Climatologist
Nolan J. DoeskenAssistant State Climatologist
Web: http://ccc.atmos.colostate.edu
Colorado ClimateWinter 2000Vol. 2, No. 1
Colorado Climate 1
The Winter Cloud of the Rockies
Nolan Doesken
H ave you ever seen a cloud like this? The scientifi c name for this type of cloud is altocumulus standing lenticular or altocu-mulus lenticularis. This name refers to
mid-level clouds with some vertical structure that are shaped like lenses. The meteorological abbreviation for this cloud type is ACSL. If you live within 50 miles of any of the various ranges of the Rocky Mountains the chances are that you have seen clouds like this. But have you really watched them and wondered why they are shaped the way they are?
ACSL are most likely seen upwind, downwind, or immediately over mountain ranges. They can occur most anywhere in the world, but are only common over or near mountains in the middle and upper lati-tudes. They are most often seen here in Colorado during the fall, winter, and spring and are least often seen during summer. They form when moderate or strong winds in the atmosphere encounter an obstacle such as a mountain range. As the air is defl ected upward, the air cools by expansion (same principle that is used in your refrigerator). Depending on the temperature and profi le of the atmosphere, a wave motion may be triggered, setting up a series of waves. In the portion of the wave where air is rising and cool-ing, condensation will occur if suffi cient water vapor is present. As the air descends, evaporation occurs and the cloud eventually disappears.
When you see an ACSL what you are really looking at is the top half of one of these waves. Watch closely if you can. Unlike other clouds
that move through the sky carried along by the winds aloft, the ACSL tends to stand still even though the winds aloft may be blowing very hard. Individual cloud ele-ments within the larger wave cloud form on the upwind edge of the cloud and dissipate at the down-wind edge. You can stand and watch those edges literally appear and disappear contin-uously before your eyes.
While the ACSL may be the most obvi-ous demonstration of waves, the attentive
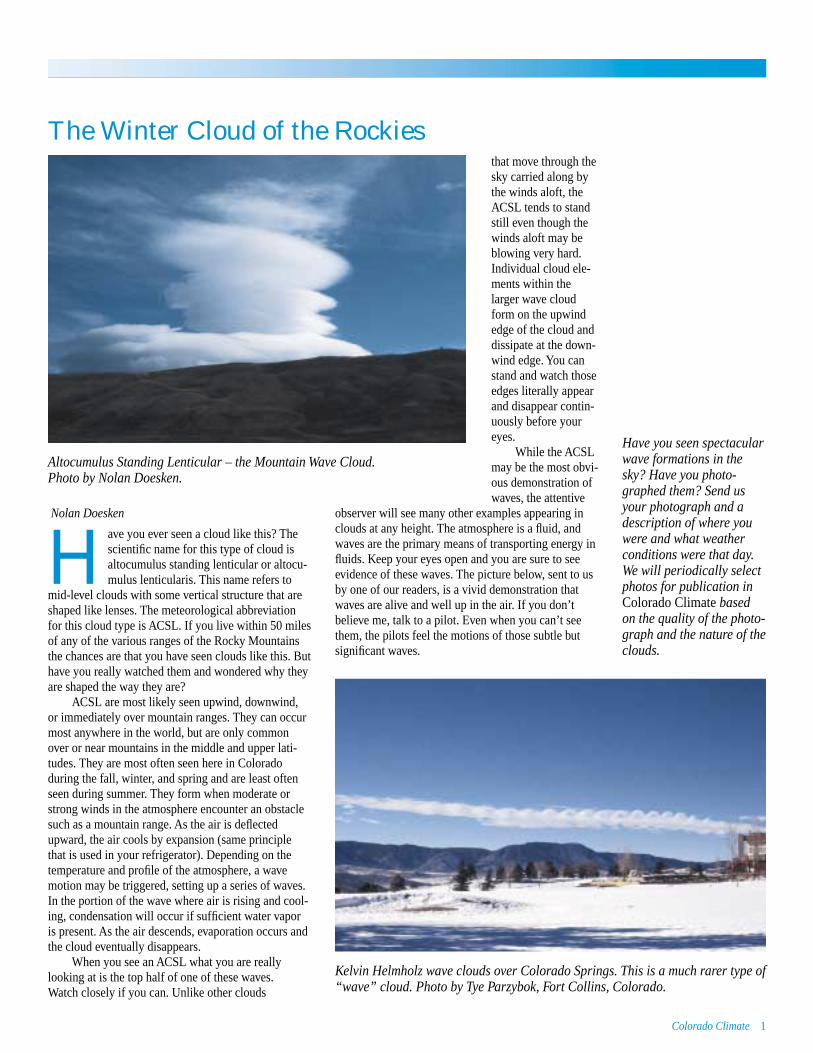
observer will see many other examples appearing in clouds at any height. The atmosphere is a fl uid, and waves are the primary means of transporting energy in fl uids. Keep your eyes open and you are sure to see evidence of these waves. The picture below, sent to us by one of our readers, is a vivid demonstration that waves are alive and well up in the air. If you don’t believe me, talk to a pilot. Even when you can’t see them, the pilots feel the motions of those subtle but signifi cant waves.
Kelvin Helmholz wave clouds over Colorado Springs. This is a much rarer type of “wave” cloud. Photo by Tye Parzybok, Fort Collins, Colorado.
Altocumulus Standing Lenticular – the Mountain Wave Cloud. Photo by Nolan Doesken.
Have you seen spectacular wave formations in the sky? Have you photo-graphed them? Send us your photograph and a description of where you were and what weather conditions were that day. We will periodically select photos for publication in Colorado Climate based on the quality of the photo-graph and the nature of the clouds.

2 Colorado Climate
Climate on the Web – The NOAA Climate Prediction Center Nolan Doesken
L ong-range forecasts (one to three months) have been issued by a special branch of the National Weather Service for many years. Many people across the country have viewed
those forecasts but until recently few took them very seriously. With the help of years of research followed by some carefully monitored dramatic changes in sea surface temperatures, winds, and pressure patterns over the Pacifi c Ocean beginning in 1997, long-range seasonal climate forecasts have gone from being pooh-poohed to being in high demand. A better understand-ing of how oceanic conditions subsequently affect con-tinental climate resulted in a new suite of long-range forecasts issued as much as 15 months in advance.
Did you know that anyone can check out the latest long-range forecast at any time? Like so many other things, they’re right on the Web and they’re updated every month. If you want to check out these forecasts plus a myriad of other climate information for the country and the world, take a quick journey to the National Oceanic and Atmospheric Administra-tion’s Climate Predication Center web page:
http://www.cpc.ncep.noaa.gov/Not only can you fi nd current forecasts, you can
even check out forecasts from the past and how well they fared. Right now, what you’re going to see in most of the seasonal forecasts for the next 15 months is the abbreviation “CL.” What that really means is the forecast models and forecasting gurus don’t have enough information to suspect that the chances of being hot or cold, wet or dry, will differ from “Clima-tology.” Some people interpret “CL” to mean “Near Average,” but what it really means is that no skill exists based on current information to lean one direc-tion or another, and that pretty much anything can happen. That’s not a bad forecast, but it certainly admits the uncertainty that is still very much a part of long-range forecasting. We have come along way, but if you think we’ve got it mastered, think again.
November, December, January 2001-02 seasonal forecast for temperature (top) and precipitation (bottom) taken from the Climate Prediction Center’s web site.
Colorado Climate 3
Climate Memories: 25, 50, and 100 Years Ago in Colorado – 1976, 1951, and 1901Nolan Doesken
W e keep hearing so much about global warming and how we’re having more extreme weather than ever before. I hear those stories and I listen with
interest, but I have to admit that I’m always just a little skeptical. I have easy access to the historical weather records for Colorado and I often look at them. Extreme weather is nothing new to this state. We’ve always had wild weather. Every time we have a storm, media reports make it sound like something terrible and unprecedented. But in reality, we’ve had storms before, and we’ll have them again.
Let’s go back in time and see what interesting weather was going on in this fi ne state of ours.
25 Years Ago: 1976 In 1976, I still lived in Illinois and was just fi nish-
ing graduate school. I had no idea I would soon be heading for Colorado. In fact, I was so busy fi nishing my thesis paper, I didn’t pay much attention to any-thing. But I did hear about the Big Thompson Flood late on July 31 and it brought back thoughts of family vacations years earlier in the Rockies when we fi rst drove up that canyon in 1959 – Illinois fl atlanders gawking at the scenery and driving 15 mph, I’m sure.
I was less aware of the other Colorado memory from 1976 – drought! Despite some heavy summer rains, the fall turned dry and by Christmas 1976, with bare ground showing on ski slopes throughout all parts of Colorado, we were well on our way into the worst winter drought ever measured in Colorado.
50 Years Ago: 1951 Fewer of you will remember this year, but it
also made its mark on the Colorado record books. On February 1st, extreme cold gripped the state with temperatures dropping below -40°F at many locations. Taylor Park Reservoir reported a new state record low of -60°F that morning. Fruit orchards were damaged or destroyed by the extreme cold. Fort Collins registered a low of -41°F. For many locations in Colorado, the records from that morning still stand.
In mid May of that year, a large storm system dropped heavy rains and hail. More than 7 inches of rain were reported in one day at a weather station in southeastern Colorado. Flood waters inundated parts of the town of Holly and at least one death was reported. Later that summer a round of heavy slow-moving thunderstorms in early August associated with the Southwest Monsoon dropped excessive rains. Severe fl ooding occurred in Denver, while up to 12 inches of rain fell in the foothills of Larimer County
west of Fort Collins and Loveland. The campus of Colorado State University was fl ooded, and several lives were lost from fl ooding in the foothills.
One more bout of extreme weather occurred the last three days of 1951 (December 29-31). The “Pine-apple Express” (a term coined many years later after the advent of weather satellites) carried a fast moving river of very moist Pacifi c air from the area of Hawaii towards Colorado. Extremely heavy and wet snows totally buried the Colorado mountains from Steamboat Springs to Durango and everywhere in between. Even the normally drier valleys like around Eagle and Mon-trose were covered by feet of snow. By the last day of December, the snow depth on the level in the town of Crested Butte was nearly 7 feet. Transportation in the mountains was totally blockaded for several days. To this very day, this storm remains the largest and most widespread snow blitz in the Colorado Rock-ies in recorded history. Heavier snows have fallen at individual locations, but this storm was remarkable for its north-south and elevational extent.
100 Years Ago: 1901 There just aren’t a whole lot of people around
today with personal memories of 1901. If you’re one of them, let me know.
There were already more than 70 weather stations operating in Colorado then, and those records remain on fi le at the Colorado Climate Center. It wasn’t an exceptional year and few events stand out as unique. However, there were all the variations and extremes that we are accustomed to.
Winter temperatures were fairly normal by today’s standards but snow accumulation was quite meager, even in the mountains. March and April each brought some heavy, wet snows. May 1901 was extremely dry in eastern Colorado but very wet near the Front Range with 4 inches of rain at some stations. This spring moisture was greatly needed, as only lim-ited reservoirs had yet been built to store water from the spring runoff.
June began with a very late freeze on the 6th dam-aging some crops in northeastern Colorado. On the 14th, widespread severe thunderstorms brought damag-ing hail, high winds, and locally fl ooding rains. Then the weather turned hot and dry from late June into early August. For July, Denver reported its warmest month on record up to that time since 1871.
Following a warm but wet August, good moisture continued for the fi rst two weeks of September. The weather then dried in time for harvest, and the state
(continued on page 4)
1976
1951
1901
YEARS

4 Colorado Climate
enjoyed a mild and sunny autumn – the type we enjoy very much now. Topsy turvy weather waited for December 1901. Temperatures climbed briefl y into the 60s at lower elevations early in the month but this was short lived as a cold wave with heavy snow moved in mid-month. Temperatures plummeted to -20° or below on December 14th over much of northeastern Colorado and some mountain valleys. But tempera-tures rebounded quickly and on the 21st and 23rd several low elevation stations east of the mountains reported temperatures in the 70s. The Trinidad weather
Climate Memories (continued from page 3)station even reached 81°F. While there wasn’t much winter recreation back in 1901, there was a hint of rejoicing after several heavy snowfalls. The monthly reports written back then focused on the “Snow in the Mountains.” At least 80 reports of mountain snow conditions from all areas of the state were compiled each month not unlike the much more sophisticated snow pack readings gathered today by the Natural Resources Conservation Service.
Yes, there was weather in Colorado 100 years ago, not all that much different than today.
Folklore: Aunt Nervie Told Me to Watch the MoonNolan Doesken
W hen I was a child, Aunt Nervie used to point out interesting things to us neigh-borhood kids that she would observe. Aunt Nervie was not her real name and
she wasn’t my aunt. Her actual name was Minerva Putnam and she was my best friends’ great aunt and part of their extended family. With her help, by the time I was 6 or 7 years old I was already well aware of lunar halos – those neat rings that you sometimes see around the moon at night. Aunt Nervie watched the moon like a fox watches chickens and whenever she saw one of those rings she would confi dently announce that a storm was headed our way and to look out for snow (or rain) in about a day and a half.
At that time, Aunt Nervie was my idol, and it seemed that she knew things that others could not even fathom. Furthermore, she made great homemade bread that she shared with us kids. Well, anyway, she was the fi rst weather forecaster I ever knew. With most of her teeth missing, she wouldn’t have done too well on TV, but that didn’t matter.
Years later, when as a professional climatolo-gist I began investigat-
ing the truths and myths of weather folklore, I found that old-timers long looked for rings around the moon or sun to give early indications of coming storms.
“Circle around the moon, rain or snow soon.”Is there truth to this old halo wisdom? Yes, there
actually is. In many parts of the country and, in fact, many parts of the world, particularly in the mid lati-tudes, a predictable progression of clouds precedes many storm systems, especially during fall, winter, and spring. High wispy cirrus clouds appear fi rst, thicken-ing and lowering gradually, followed later by thin mid level clouds (altostratus) which also gradually thicken until they block all view of the sun or moon. It is these fi rst fi lms of thin cloud that can produce the halo phenomenon that Aunt Nervie so aptly pointed out to us.
Unfortunately, here in Colorado, at least here at the eastern base of the Rocky Mountains, the cloud patterns are different. We sometimes do see halo phe-nomenon in advance of Pacifi c storm systems. These storms may bring moisture to our mountains, but on the lee side of the mountains, we are often skipped. When we do get snow, the cloud progressions here are much different than there. I don’t see as many halos as I used to, and it certainly doesn’t rain as much here as it did back in the Midwest. But then again, maybe I’m just not looking like I used to. Many of us in the midst of challenging professional lives and busy family schedules just don’t take the time to look. Sad, but true.
Yes, Aunt Nervie knew what she was talking about, and those halos were good indicators. If your cable or satellite TV goes out on you, I recommend turning on “the nature channel” and heading outside. Actually, those halos are much more inspiring than any 3-D color graphics on the tube. Both you and I might do well to take a little more quiet time just watching – and wondering.
Colorado Climate 5
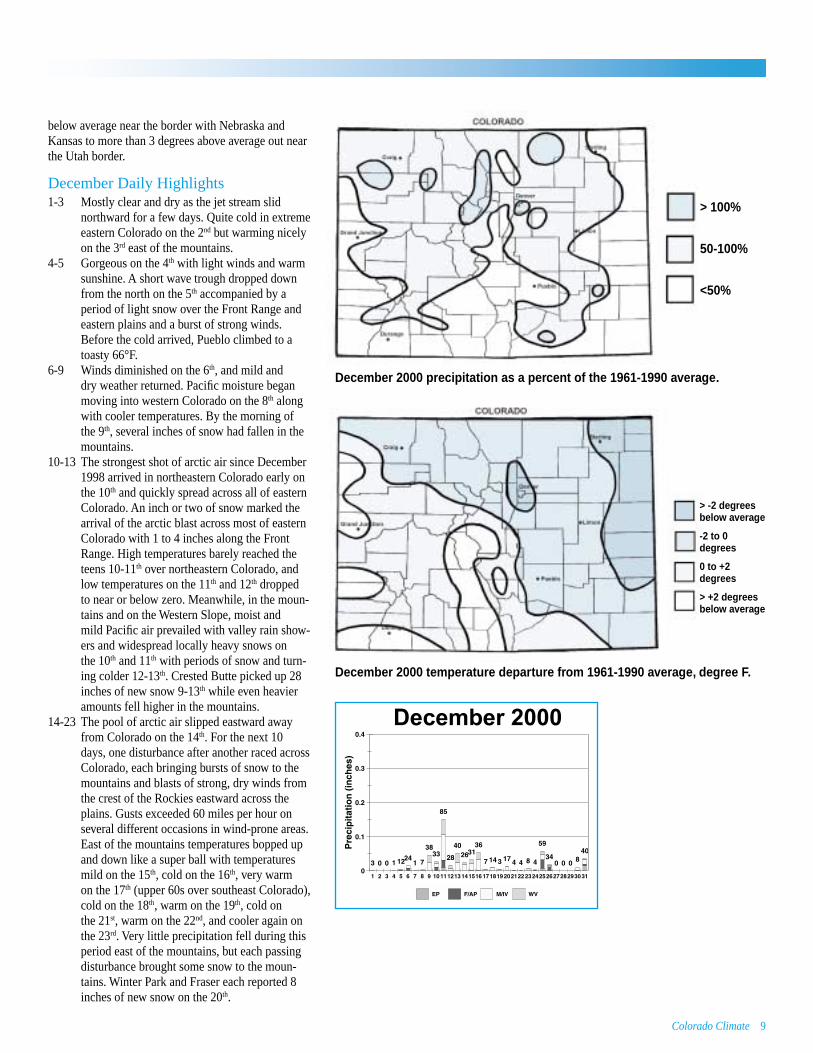
Colorado Climate in ReviewOctober 2000Climate in Perspective
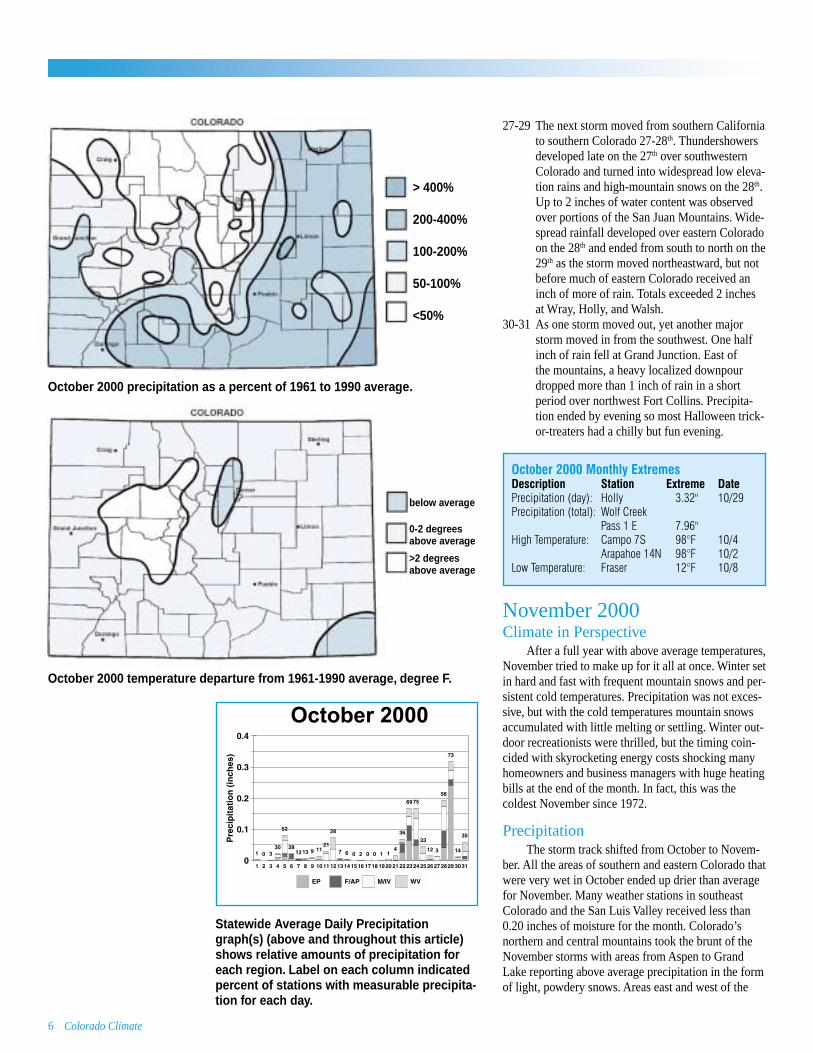
October brought a variety of weather conditions to Colorado. Summer-like temperatures early in the month, periods of sunshine, morning frosts, periods of low clouds, fog and drizzle, thunderstorms, and mountain snows were all a part of the month. After a period of quiet weather in mid October, one storm system after another developed and marched across the state taking aim most directly on southern Colorado while skipping over northern Colorado leaving some areas bone dry.
PrecipitationSeveral major storm systems brought signifi cant
precipitation to Colorado in October, but each storm dumped most of its moisture over southern and eastern parts of the state and skipped over north central and northwestern counties. The majority of precipitation fell in the form of rain, but in the southern mountains above 10,000 feet snow accumulations were generous. Well over a foot of dense snow covered the ground by month’s end. A widespread rain event deposited much-appreciated moisture over nearly all areas of the eastern plains 28-29th providing some relief to dry soil moisture conditions following the hot and dry winter, spring, and summer of 2000. Overall, October precipitation was much above average over southern and eastern Colorado with many areas reporting two to three times their average. Wolf Creek Pass totaled 7.96 inches of moisture for the month. Walsh reported 4.78 inches of rainfall, their wettest October in the 33-year history of their station. At the same time, north central Colorado was very dry. Hayden totaled just 0.30 inches (19% of average) while the Granby station only reported 0.05 inches (5% of average), their driest October in the 53-year history of that station.
Temperature Western Colorado cooled gradually through Octo-
ber while temperatures were more variable east of the mountains. Overall, most of the state ended up near to slightly warmer than average for the month as a whole. The largest anomalies were found in central Colorado where several communities were 2 to 3 degrees Fahr-enheit above average for the month.
October Daily Highlights 1-3 Hot weather was widespread on the 1st.
Cooler air moved into northeastern Colorado 2-3 but warm conditions prevailed elsewhere. Many weather stations in southeastern Colorado reported highs in the 90s on the 3rd. A few showers and windy thunder sprinkles developed on the 3rd.
4-8 Much cooler over eastern Colorado and gradu-ally cooler elsewhere. Fog, drizzle, and light rain developed over eastern Colorado on the 4th and continued 5-6th, changing to snow close to the foothills at times. A band of rain also crossed western Colorado on the 4th. Totals were generally light, but Cheyenne Wells picked up nearly a half inch of rainfall, and Boulder totaled 0.64 inches of rain and wet snow. Temperatures remained in the 30s and low 40s east of the mountains 5-7th. Clouds gradually broke up 7-8th and temperatures mod-erated.
9-12 Eastern Colorado enjoyed pleasant autumn weather 9-12th. At the same time, an upper-level low pressure trough and Pacifi c cold front brought wet weather west of the mountains, particularly over southwestern Colorado. Wolf Creek Pass picked up nearly 3 inches of rain, ice pellets, and wet snow, mostly on the 11th and 12th. Strong winds accompanied the storm 10-11th. Only light showers fell over most western valleys, and little or no precipitation reached Colorado’s northern and central moun-tains.
13-15 The upper level low pressure system moved northeastward late on the 12th bringing some late evening (12th) and early morning (13th) showers and thunder to parts of northeast Colo-rado. With clearing skies, nights were chilly. Grand Junction and surrounding areas had their fi rst subfreezing temperatures of the season on the 14th.
16-21 High pressure established itself over the region bringing sunshine and warming temperatures. Temperatures in the 70s were common at lower elevations. This would prove to be the last warm week for many months. Clouds, winds, and a few light showers spread into western Colorado on the 21st in advance of an approach-ing storm system.
22-24 A low pressure center developed over Arizona and moved northeastward spreading rain and mountain snows across most of Colorado. More than 1 inch of moisture fell over portions of southern Colorado including some areas on the eastern plains. Walsh, in extreme south-eastern Colorado, measured 2.65 inches from the storm. Buena Vista, in the upper Arkansas Valley, recorded 0.90 inches. Unstable air trig-gered thunderstorms late into the evening of the 24th over northeast Colorado.
25-26 Mostly dry but unsettled with seasonally cool temperatures as one storm departed and a new one approached from the southwest.
6 Colorado Climate
27-29 The next storm moved from southern California to southern Colorado 27-28th. Thundershowers developed late on the 27th over southwestern Colorado and turned into widespread low eleva-tion rains and high-mountain snows on the 28th. Up to 2 inches of water content was observed over portions of the San Juan Mountains. Wide-spread rainfall developed over eastern Colorado on the 28th and ended from south to north on the 29th as the storm moved northeastward, but not before much of eastern Colorado received an inch of more of rain. Totals exceeded 2 inches at Wray, Holly, and Walsh.
30-31 As one storm moved out, yet another major storm moved in from the southwest. One half inch of rain fell at Grand Junction. East of the mountains, a heavy localized downpour dropped more than 1 inch of rain in a short period over northwest Fort Collins. Precipita-tion ended by evening so most Halloween trick-or-treaters had a chilly but fun evening.
October 2000 Monthly ExtremesDescription Station Extreme DatePrecipitation (day): Holly 3.32" 10/29Precipitation (total): Wolf Creek Pass 1 E 7.96"High Temperature: Campo 7S 98°F 10/4 Arapahoe 14N 98°F 10/2Low Temperature: Fraser 12°F 10/8
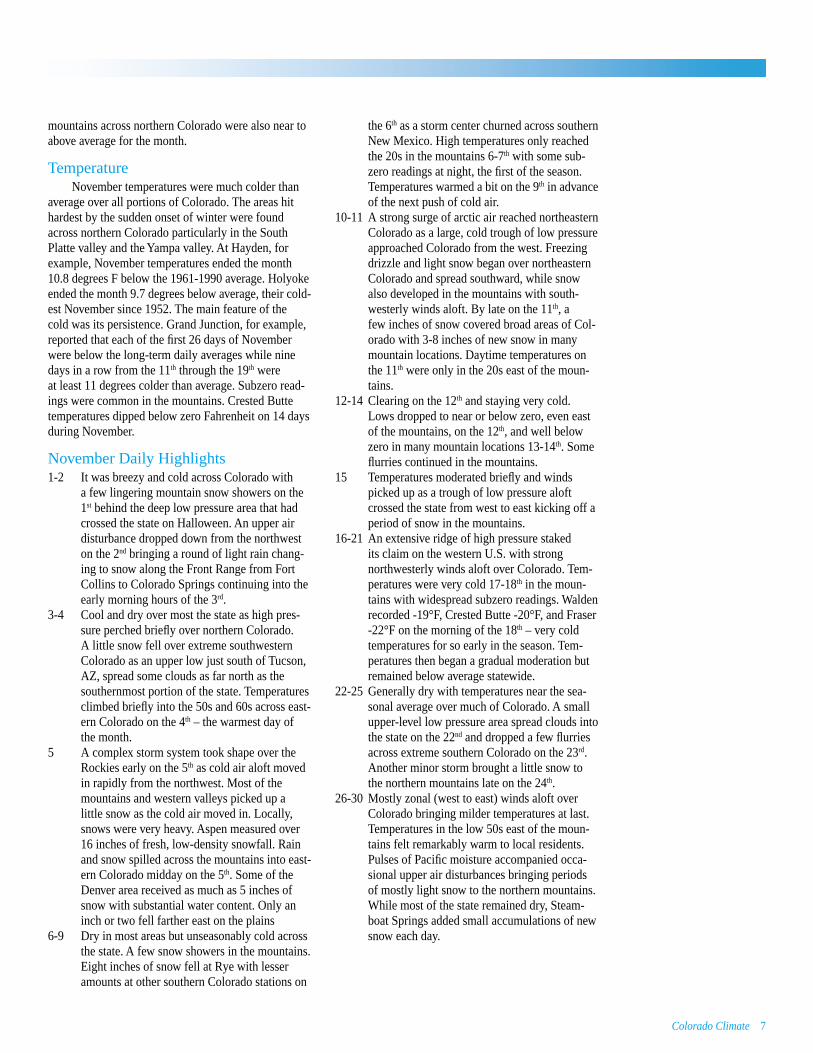
November 2000Climate in Perspective
After a full year with above average temperatures, November tried to make up for it all at once. Winter set in hard and fast with frequent mountain snows and per-sistent cold temperatures. Precipitation was not exces-sive, but with the cold temperatures mountain snows accumulated with little melting or settling. Winter out-door recreationists were thrilled, but the timing coin-cided with skyrocketing energy costs shocking many homeowners and business managers with huge heating bills at the end of the month. In fact, this was the coldest November since 1972.
Precipitation The storm track shifted from October to Novem-
ber. All the areas of southern and eastern Colorado that were very wet in October ended up drier than average for November. Many weather stations in southeast Colorado and the San Luis Valley received less than 0.20 inches of moisture for the month. Colorado’s northern and central mountains took the brunt of the November storms with areas from Aspen to Grand Lake reporting above average precipitation in the form of light, powdery snows. Areas east and west of the
October 2000 precipitation as a percent of 1961 to 1990 average.
October 2000 temperature departure from 1961-1990 average, degree F.
> 400%
200-400%
100-200%
50-100%
<50%
below average
0-2 degrees above average
>2 degrees above average
Statewide Average Daily Precipitation graph(s) (above and throughout this article) shows relative amounts of precipitation for each region. Label on each column indicated percent of stations with measurable precipita-tion for each day.
Colorado Climate 7
mountains across northern Colorado were also near to above average for the month.
Temperature November temperatures were much colder than
average over all portions of Colorado. The areas hit hardest by the sudden onset of winter were found across northern Colorado particularly in the South Platte valley and the Yampa valley. At Hayden, for example, November temperatures ended the month 10.8 degrees F below the 1961-1990 average. Holyoke ended the month 9.7 degrees below average, their cold-est November since 1952. The main feature of the cold was its persistence. Grand Junction, for example, reported that each of the fi rst 26 days of November were below the long-term daily averages while nine days in a row from the 11th through the 19th were at least 11 degrees colder than average. Subzero read-ings were common in the mountains. Crested Butte temperatures dipped below zero Fahrenheit on 14 days during November.
November Daily Highlights 1-2 It was breezy and cold across Colorado with
a few lingering mountain snow showers on the 1st behind the deep low pressure area that had crossed the state on Halloween. An upper air disturbance dropped down from the northwest on the 2nd bringing a round of light rain chang-ing to snow along the Front Range from Fort Collins to Colorado Springs continuing into the early morning hours of the 3rd.
3-4 Cool and dry over most the state as high pres-sure perched briefl y over northern Colorado. A little snow fell over extreme southwestern Colorado as an upper low just south of Tucson, AZ, spread some clouds as far north as the southernmost portion of the state. Temperatures climbed briefl y into the 50s and 60s across east-ern Colorado on the 4th – the warmest day of the month.
5 A complex storm system took shape over the Rockies early on the 5th as cold air aloft moved in rapidly from the northwest. Most of the mountains and western valleys picked up a little snow as the cold air moved in. Locally, snows were very heavy. Aspen measured over 16 inches of fresh, low-density snowfall. Rain and snow spilled across the mountains into east-ern Colorado midday on the 5th. Some of the Denver area received as much as 5 inches of snow with substantial water content. Only an inch or two fell farther east on the plains
6-9 Dry in most areas but unseasonably cold across the state. A few snow showers in the mountains. Eight inches of snow fell at Rye with lesser amounts at other southern Colorado stations on
the 6th as a storm center churned across southern New Mexico. High temperatures only reached the 20s in the mountains 6-7th with some sub-zero readings at night, the fi rst of the season. Temperatures warmed a bit on the 9th in advance of the next push of cold air.
10-11 A strong surge of arctic air reached northeastern Colorado as a large, cold trough of low pressure approached Colorado from the west. Freezing drizzle and light snow began over northeastern Colorado and spread southward, while snow also developed in the mountains with south-westerly winds aloft. By late on the 11th, a few inches of snow covered broad areas of Col-orado with 3-8 inches of new snow in many mountain locations. Daytime temperatures on the 11th were only in the 20s east of the moun-tains.
12-14 Clearing on the 12th and staying very cold. Lows dropped to near or below zero, even east of the mountains, on the 12th, and well below zero in many mountain locations 13-14th. Some fl urries continued in the mountains.
15 Temperatures moderated briefl y and winds picked up as a trough of low pressure aloft crossed the state from west to east kicking off a period of snow in the mountains.
16-21 An extensive ridge of high pressure staked its claim on the western U.S. with strong northwesterly winds aloft over Colorado. Tem-peratures were very cold 17-18th in the moun-tains with widespread subzero readings. Walden recorded -19°F, Crested Butte -20°F, and Fraser -22°F on the morning of the 18th – very cold temperatures for so early in the season. Tem-peratures then began a gradual moderation but remained below average statewide.
22-25 Generally dry with temperatures near the sea-sonal average over much of Colorado. A small upper-level low pressure area spread clouds into the state on the 22nd and dropped a few fl urries across extreme southern Colorado on the 23rd. Another minor storm brought a little snow to the northern mountains late on the 24th.
26-30 Mostly zonal (west to east) winds aloft over Colorado bringing milder temperatures at last. Temperatures in the low 50s east of the moun-tains felt remarkably warm to local residents. Pulses of Pacifi c moisture accompanied occa-sional upper air disturbances bringing periods of mostly light snow to the northern mountains. While most of the state remained dry, Steam-boat Springs added small accumulations of new snow each day.
8 Colorado Climate
November 2000 Monthly Extremes:Description Station Extreme DatePrecipitation (day): Hermit 7 ESE 1.47" 11/11Precipitation (total): Wolf Creek Pass 1E 3.99"High Temperature: John Martin Dam 73°F 11/1Low Temperature: Antero Reservoir -23°F 11/18
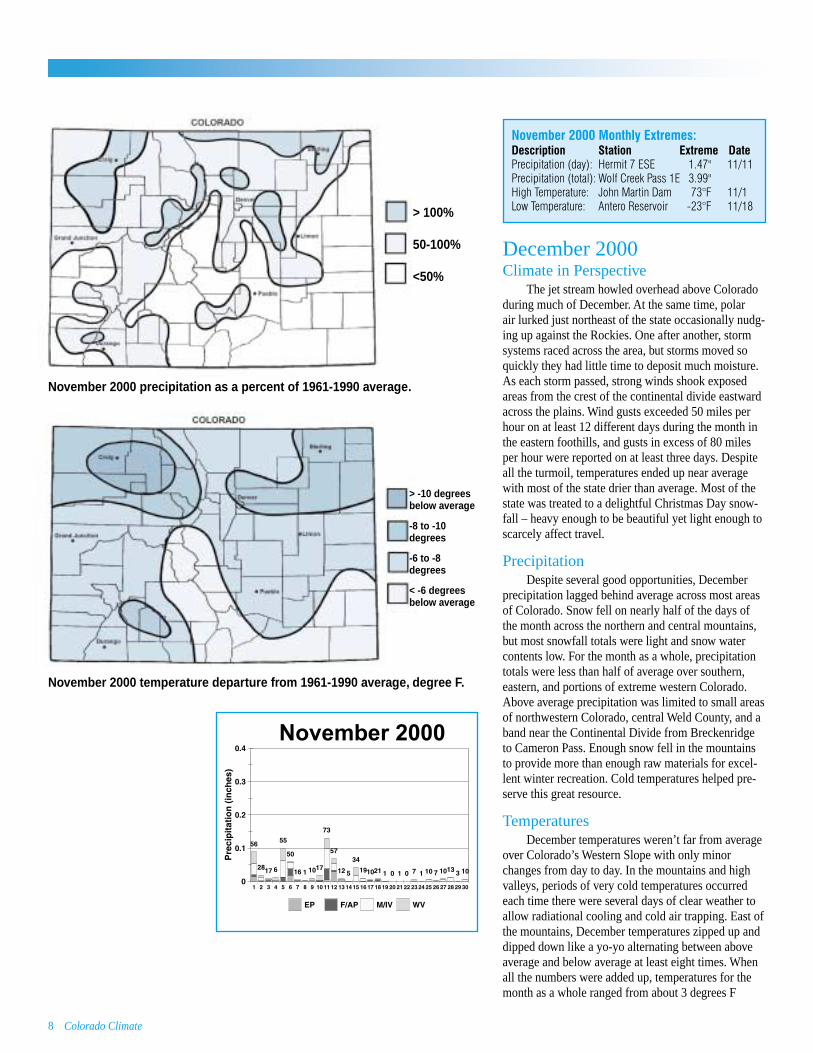
December 2000Climate in Perspective
The jet stream howled overhead above Colorado during much of December. At the same time, polar air lurked just northeast of the state occasionally nudg-ing up against the Rockies. One after another, storm systems raced across the area, but storms moved so quickly they had little time to deposit much moisture. As each storm passed, strong winds shook exposed areas from the crest of the continental divide eastward across the plains. Wind gusts exceeded 50 miles per hour on at least 12 different days during the month in the eastern foothills, and gusts in excess of 80 miles per hour were reported on at least three days. Despite all the turmoil, temperatures ended up near average with most of the state drier than average. Most of the state was treated to a delightful Christmas Day snow-fall – heavy enough to be beautiful yet light enough to scarcely affect travel.
PrecipitationDespite several good opportunities, December
precipitation lagged behind average across most areas of Colorado. Snow fell on nearly half of the days of the month across the northern and central mountains, but most snowfall totals were light and snow water contents low. For the month as a whole, precipitation totals were less than half of average over southern, eastern, and portions of extreme western Colorado. Above average precipitation was limited to small areas of northwestern Colorado, central Weld County, and a band near the Continental Divide from Breckenridge to Cameron Pass. Enough snow fell in the mountains to provide more than enough raw materials for excel-lent winter recreation. Cold temperatures helped pre-serve this great resource.
TemperaturesDecember temperatures weren’t far from average
over Colorado’s Western Slope with only minor changes from day to day. In the mountains and high valleys, periods of very cold temperatures occurred each time there were several days of clear weather to allow radiational cooling and cold air trapping. East of the mountains, December temperatures zipped up and dipped down like a yo-yo alternating between above average and below average at least eight times. When all the numbers were added up, temperatures for the month as a whole ranged from about 3 degrees F
November 2000 precipitation as a percent of 1961-1990 average.
November 2000 temperature departure from 1961-1990 average, degree F.
> 100%
50-100%
<50%
> -10 degrees below average
-8 to -10 degrees
-6 to -8 degrees
< -6 degrees below average
Colorado Climate 9
below average near the border with Nebraska and Kansas to more than 3 degrees above average out near the Utah border.
December Daily Highlights1-3 Mostly clear and dry as the jet stream slid
northward for a few days. Quite cold in extreme eastern Colorado on the 2nd but warming nicely on the 3rd east of the mountains.
4-5 Gorgeous on the 4th with light winds and warm sunshine. A short wave trough dropped down from the north on the 5th accompanied by a period of light snow over the Front Range and eastern plains and a burst of strong winds. Before the cold arrived, Pueblo climbed to a toasty 66°F.
6-9 Winds diminished on the 6th, and mild and dry weather returned. Pacifi c moisture began moving into western Colorado on the 8th along with cooler temperatures. By the morning of the 9th, several inches of snow had fallen in the mountains.
10-13 The strongest shot of arctic air since December 1998 arrived in northeastern Colorado early on the 10th and quickly spread across all of eastern Colorado. An inch or two of snow marked the arrival of the arctic blast across most of eastern Colorado with 1 to 4 inches along the Front Range. High temperatures barely reached the teens 10-11th over northeastern Colorado, and low temperatures on the 11th and 12th dropped to near or below zero. Meanwhile, in the moun-tains and on the Western Slope, moist and mild Pacifi c air prevailed with valley rain show-ers and widespread locally heavy snows on the 10th and 11th with periods of snow and turn-ing colder 12-13th. Crested Butte picked up 28 inches of new snow 9-13th while even heavier amounts fell higher in the mountains.
14-23 The pool of arctic air slipped eastward away from Colorado on the 14th. For the next 10 days, one disturbance after another raced across Colorado, each bringing bursts of snow to the mountains and blasts of strong, dry winds from the crest of the Rockies eastward across the plains. Gusts exceeded 60 miles per hour on several different occasions in wind-prone areas. East of the mountains temperatures bopped up and down like a super ball with temperatures mild on the 15th, cold on the 16th, very warm on the 17th (upper 60s over southeast Colorado), cold on the 18th, warm on the 19th, cold on the 21st, warm on the 22nd, and cooler again on the 23rd. Very little precipitation fell during this period east of the mountains, but each passing disturbance brought some snow to the moun-tains. Winter Park and Fraser each reported 8 inches of new snow on the 20th.
December 2000 precipitation as a percent of the 1961-1990 average.
December 2000 temperature departure from 1961-1990 average, degree F.
> 100%
50-100%
<50%
> -2 degrees below average
-2 to 0 degrees
0 to +2 degrees
> +2 degrees below average
10 Colorado Climate
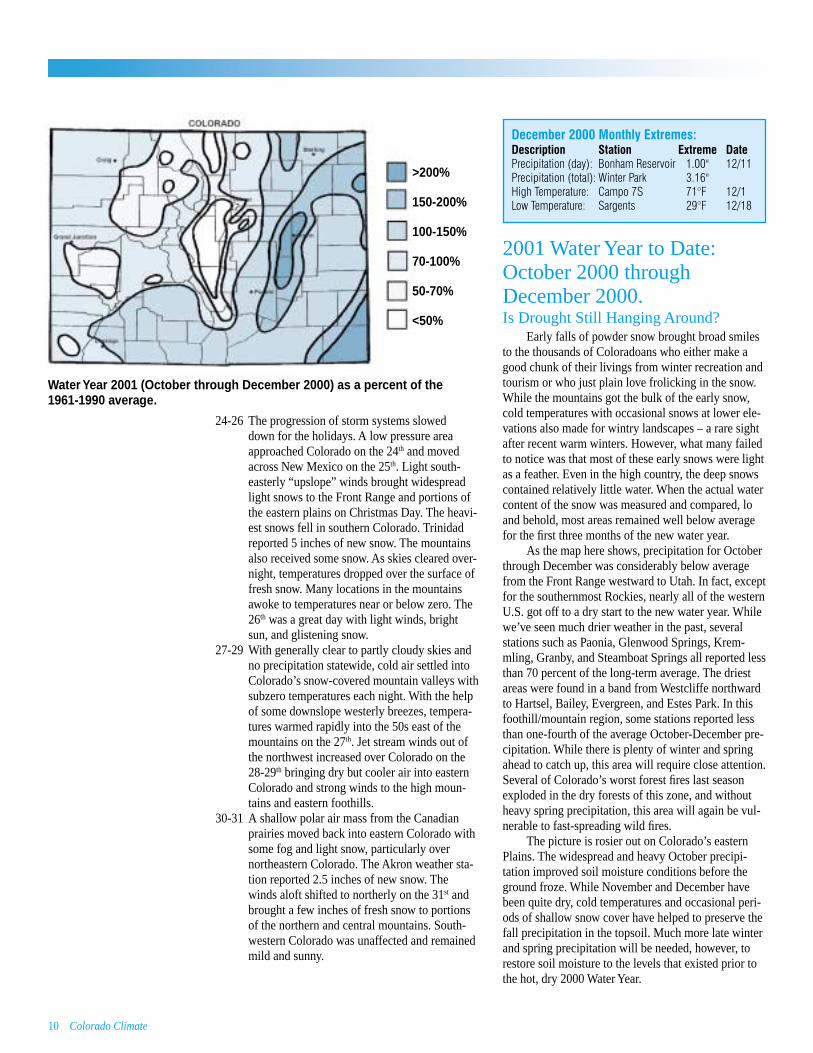
24-26 The progression of storm systems slowed down for the holidays. A low pressure area approached Colorado on the 24th and moved across New Mexico on the 25th. Light south-easterly “upslope” winds brought widespread light snows to the Front Range and portions of the eastern plains on Christmas Day. The heavi-est snows fell in southern Colorado. Trinidad reported 5 inches of new snow. The mountains also received some snow. As skies cleared over-night, temperatures dropped over the surface of fresh snow. Many locations in the mountains awoke to temperatures near or below zero. The 26th was a great day with light winds, bright sun, and glistening snow.
27-29 With generally clear to partly cloudy skies and no precipitation statewide, cold air settled into Colorado’s snow-covered mountain valleys with subzero temperatures each night. With the help of some downslope westerly breezes, tempera-tures warmed rapidly into the 50s east of the mountains on the 27th. Jet stream winds out of the northwest increased over Colorado on the 28-29th bringing dry but cooler air into eastern Colorado and strong winds to the high moun-tains and eastern foothills.
30-31 A shallow polar air mass from the Canadian prairies moved back into eastern Colorado with some fog and light snow, particularly over northeastern Colorado. The Akron weather sta-tion reported 2.5 inches of new snow. The winds aloft shifted to northerly on the 31st and brought a few inches of fresh snow to portions of the northern and central mountains. South-western Colorado was unaffected and remained mild and sunny.
December 2000 Monthly Extremes:Description Station Extreme DatePrecipitation (day): Bonham Reservoir 1.00" 12/11Precipitation (total): Winter Park 3.16"High Temperature: Campo 7S 71°F 12/1Low Temperature: Sargents 29°F 12/18
2001 Water Year to Date: October 2000 through December 2000. Is Drought Still Hanging Around?
Early falls of powder snow brought broad smiles to the thousands of Coloradoans who either make a good chunk of their livings from winter recreation and tourism or who just plain love frolicking in the snow. While the mountains got the bulk of the early snow, cold temperatures with occasional snows at lower ele-vations also made for wintry landscapes – a rare sight after recent warm winters. However, what many failed to notice was that most of these early snows were light as a feather. Even in the high country, the deep snows contained relatively little water. When the actual water content of the snow was measured and compared, lo and behold, most areas remained well below average for the fi rst three months of the new water year.
As the map here shows, precipitation for October through December was considerably below average from the Front Range westward to Utah. In fact, except for the southernmost Rockies, nearly all of the western U.S. got off to a dry start to the new water year. While we’ve seen much drier weather in the past, several stations such as Paonia, Glenwood Springs, Krem-mling, Granby, and Steamboat Springs all reported less than 70 percent of the long-term average. The driest areas were found in a band from Westcliffe northward to Hartsel, Bailey, Evergreen, and Estes Park. In this foothill/mountain region, some stations reported less than one-fourth of the average October-December pre-cipitation. While there is plenty of winter and spring ahead to catch up, this area will require close attention. Several of Colorado’s worst forest fi res last season exploded in the dry forests of this zone, and without heavy spring precipitation, this area will again be vul-nerable to fast-spreading wild fi res.
The picture is rosier out on Colorado’s eastern Plains. The widespread and heavy October precipi-tation improved soil moisture conditions before the ground froze. While November and December have been quite dry, cold temperatures and occasional peri-ods of shallow snow cover have helped to preserve the fall precipitation in the topsoil. Much more late winter and spring precipitation will be needed, however, to restore soil moisture to the levels that existed prior to the hot, dry 2000 Water Year.
Water Year 2001 (October through December 2000) as a percent of the 1961-1990 average.
>200%
150-200%
100-150%
70-100%
50-70%
<50%
Colorado Climate 11
Climate Data at Work – Heating Degree Days Are Back!Nolan Doesken
W hen I was in college in the early 1970s, an energy crisis had all of us watching our fuel consumption carefully. This happened again in the late 1970s into
the early 1980s. For several years a lot of our climate research was focused on how climate affects energy consumption and how renewable energy sources such as wind and solar energy can reduce our demand on fossil fuels. During that time, we published maps and tables of heating degree days and how they compared to average. Many individuals, businesses, and public organizations across the state subscribed to our reports in order to help track the effectiveness of energy con-servation efforts.
Since the mid 1980s, the interest in energy con-servation and renewable energy steadily faded. Many utilities have tried to maintain an energy conservation focus, but with low costs and many mild winters, most of us simply went about building bigger houses, driv-ing bigger cars, and consuming more fuel – lots more.
Then along came 2000 and energy costs began creeping higher. Later in the year, the creeping changed to leaping, at the very time that much of North America had its coldest November-December in years. With the leaping prices came screaming custom-ers shocked by the highest home gas and electric bills they had ever seen. And with that, suddenly the interest in climate and energy returned again.
With growing concern over high energy costs, residents and businesses were again studying their heating bills and comparing them to previous years. For the fi rst time in nearly 20 years, people were again inquiring about heating degree days.
What are heating degree days (abbreviated HDD)? The concept is very simple and is nearly the same as the “cooling degree days” we wrote about a few months ago (Vol. 1, No. 3). For each day, you take the highest and lowest temperature, add them and divide by 2 to determine the mean daily temperature. Then, for each day when the mean temperature is below 65°F, subtract the mean from 65°F.
For example, if the high is 54 and the low is 30, the mean daily temperature is 42 degrees. Subtracting 42 from 65 yields 23 heating degrees for that day. Add each day’s total together for a month or season, and you have the heating degree day total. The colder it is, the more heating degree days you accumulate.
(54 + 30) ÷ 2 = 42°F (mean daily temperature)65 (°F base) - 42 = 23 (heating degrees for that day)
Heating degree day totals have been found to relate well to the amount of energy required to heat a building to comfortable indoor temperatures. There-fore, HDDs are an easy way to track potential energy costs and to evaluate the success of energy conserva-tion measures. Since weather conditions are such a big factor in energy consumption, and since conditions change a lot from year to year, you can’t just compare this year’s bill to last year’s to know if your new win-dows, the extra insulation you added, or the new high effi ciency furnace you had installed is really saving energy. However, you can compute your energy con-sumption per degree day. If your consumption per degree day goes down signifi cantly, you can be confi -dent that your energy conservation efforts are paying off.
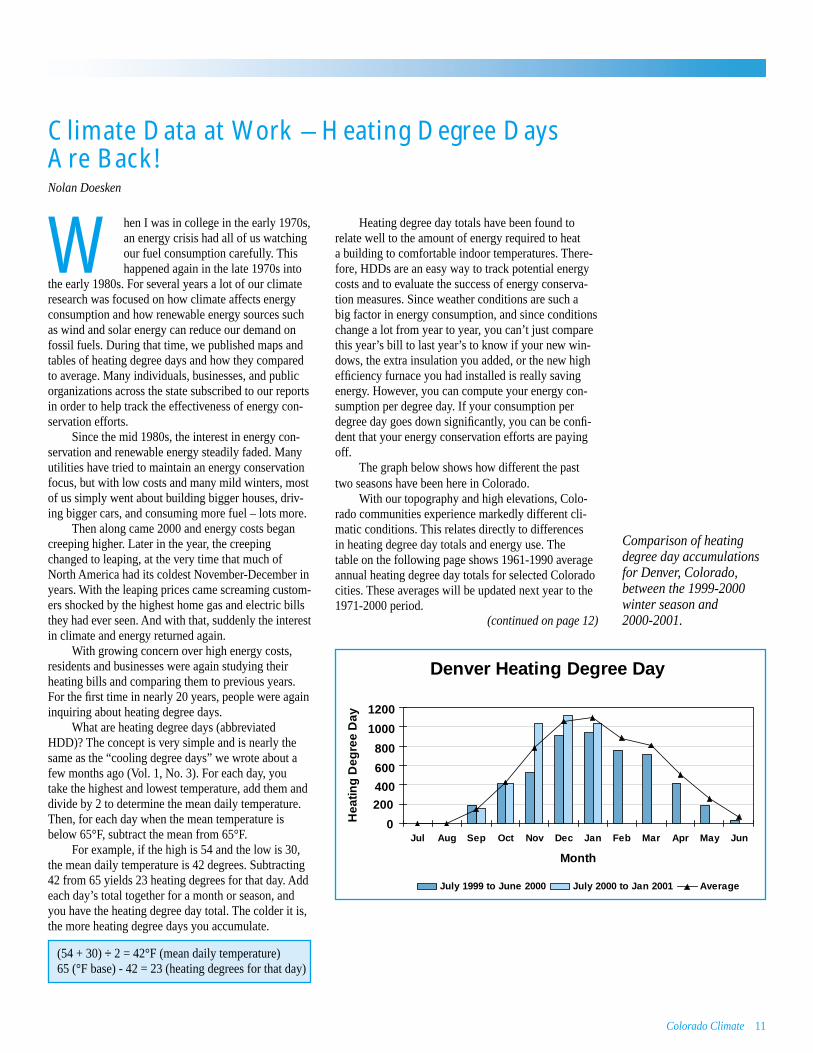
The graph below shows how different the past two seasons have been here in Colorado.
With our topography and high elevations, Colo-rado communities experience markedly different cli-matic conditions. This relates directly to differences in heating degree day totals and energy use. The table on the following page shows 1961-1990 average annual heating degree day totals for selected Colorado cities. These averages will be updated next year to the 1971-2000 period.
Comparison of heating degree day accumulations for Denver, Colorado, between the 1999-2000 winter season and 2000-2001.(continued on page 12)
Denver Heating Degree Day
0
200400
600
800
1000
1200
Jul Aug Sep Oct Nov Dec Jan Feb Mar Apr May Jun
Month
Hea
ting
Deg
ree
Day
July 1999 to June 2000 July 2000 to Jan 2001 Average
12 Colorado Climate
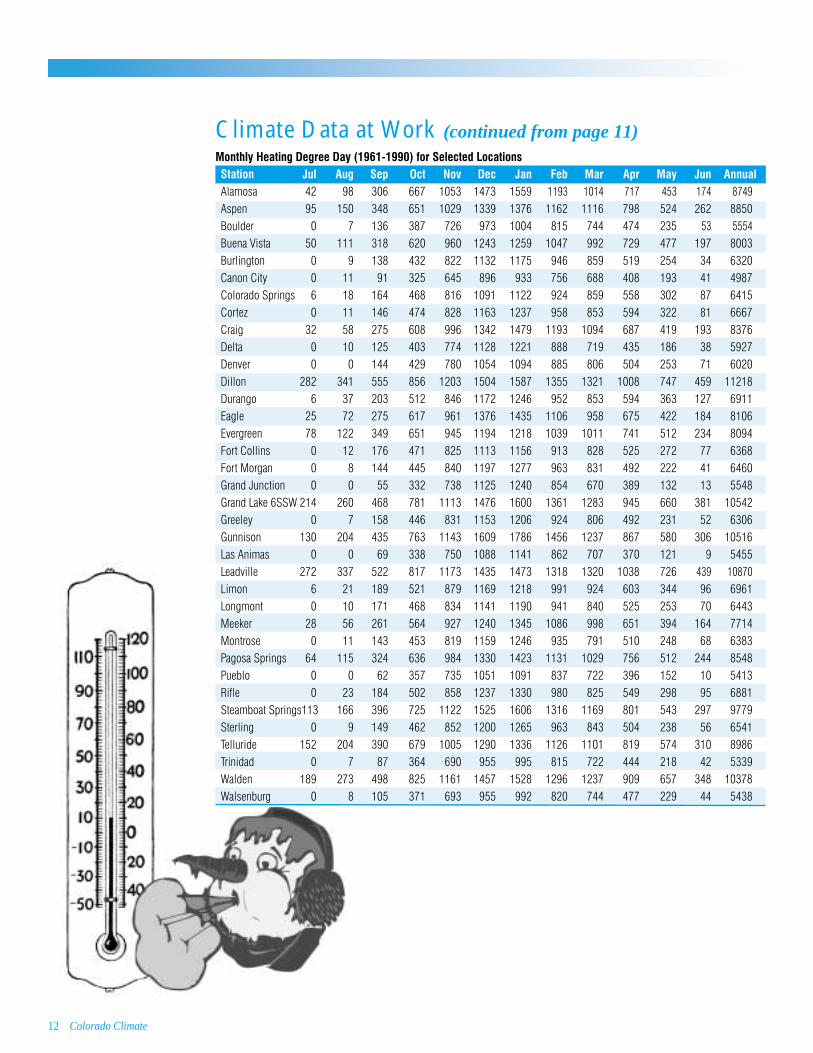
Monthly Heating Degree Day (1961-1990) for Selected Locations Station Jul Aug Sep Oct Nov Dec Jan Feb Mar Apr May Jun Annual Alamosa 42 98 306 667 1053 1473 1559 1193 1014 717 453 174 8749 Aspen 95 150 348 651 1029 1339 1376 1162 1116 798 524 262 8850 Boulder 0 7 136 387 726 973 1004 815 744 474 235 53 5554 Buena Vista 50 111 318 620 960 1243 1259 1047 992 729 477 197 8003 Burlington 0 9 138 432 822 1132 1175 946 859 519 254 34 6320 Canon City 0 11 91 325 645 896 933 756 688 408 193 41 4987 Colorado Springs 6 18 164 468 816 1091 1122 924 859 558 302 87 6415 Cortez 0 11 146 474 828 1163 1237 958 853 594 322 81 6667 Craig 32 58 275 608 996 1342 1479 1193 1094 687 419 193 8376 Delta 0 10 125 403 774 1128 1221 888 719 435 186 38 5927 Denver 0 0 144 429 780 1054 1094 885 806 504 253 71 6020 Dillon 282 341 555 856 1203 1504 1587 1355 1321 1008 747 459 11218 Durango 6 37 203 512 846 1172 1246 952 853 594 363 127 6911 Eagle 25 72 275 617 961 1376 1435 1106 958 675 422 184 8106 Evergreen 78 122 349 651 945 1194 1218 1039 1011 741 512 234 8094 Fort Collins 0 12 176 471 825 1113 1156 913 828 525 272 77 6368 Fort Morgan 0 8 144 445 840 1197 1277 963 831 492 222 41 6460 Grand Junction 0 0 55 332 738 1125 1240 854 670 389 132 13 5548 Grand Lake 6SSW 214 260 468 781 1113 1476 1600 1361 1283 945 660 381 10542 Greeley 0 7 158 446 831 1153 1206 924 806 492 231 52 6306 Gunnison 130 204 435 763 1143 1609 1786 1456 1237 867 580 306 10516 Las Animas 0 0 69 338 750 1088 1141 862 707 370 121 9 5455 Leadville 272 337 522 817 1173 1435 1473 1318 1320 1038 726 439 10870 Limon 6 21 189 521 879 1169 1218 991 924 603 344 96 6961 Longmont 0 10 171 468 834 1141 1190 941 840 525 253 70 6443 Meeker 28 56 261 564 927 1240 1345 1086 998 651 394 164 7714 Montrose 0 11 143 453 819 1159 1246 935 791 510 248 68 6383 Pagosa Springs 64 115 324 636 984 1330 1423 1131 1029 756 512 244 8548 Pueblo 0 0 62 357 735 1051 1091 837 722 396 152 10 5413 Rifl e 0 23 184 502 858 1237 1330 980 825 549 298 95 6881 Steamboat Springs113 166 396 725 1122 1525 1606 1316 1169 801 543 297 9779 Sterling 0 9 149 462 852 1200 1265 963 843 504 238 56 6541 Telluride 152 204 390 679 1005 1290 1336 1126 1101 819 574 310 8986 Trinidad 0 7 87 364 690 955 995 815 722 444 218 42 5339 Walden 189 273 498 825 1161 1457 1528 1296 1237 909 657 348 10378 Walsenburg 0 8 105 371 693 955 992 820 744 477 229 44 5438
Climate Data at Work (continued from page 11)
Colorado Climate 13
For Teachers: Climatology – A Taste of Probability and Statistics. An Alternative to Flipping CoinsNolan Doesken
U nless I’m really forgetting something, and that’s always possible, I never was taught any statistics until well into college and then not all that much. I honestly don’t
recall doing linear regression or computing standard deviations until I started work.
Times have changed. Already in 6th grade our kids have been exposed to statistics. Last year in 8th grade, our daughter was solving standard deviations and correlations and trying to do linear regression. I don’t believe she had any idea what she was doing or why, but she did as she was told and got most of the answers right. I guess they fi gure if they expose kids to statistics early they won’t be so intimidated by them when they have to take statistics later in college.
While I didn’t formally study statistics, I was fas-cinated with numbers and the characteristics of fami-lies of numbers (I know, I was weird.) Starting when I was in 6th or 7th grade, I spent a lot of time fl ipping coins. I knew that eventually you would get as many heads as tails, but I wanted to fi nd out for myself. I also wanted to fi nd out how many heads or tails I could fl ip in a row. I kept careful records of thousands of coin tosses. For years I kept my notebook with all my results. I also began keeping weather statistics early in life – calculating averages and extremes from the temperature and precipitation records that my father recorded in his journal. Yes, I was a little bit crazy, but I wasn’t a total nerd. I also loved playing basketball and many other sports. In fact, I collected baseball trading cards. My mom, bless her heart, threw out hundreds of them when I was in college not realizing that those little pieces of cardboard with pictures of folks like Mickey Mantle, Yogi Berra, Stan Musial, Warren Spahn, Ernie Banks, and Hank Aaron, bought in packs of fi ve for a nickel with my hard-earned paper route money, might actually be worth something. I also wonder if she ever realized how much I had learned about probabilities by studying the “statistics” on the back of each of those precious cards.
The fact is that probability and statistics are an important part of life and the more we learn about them, the better off we are. I guess it’s OK if they want to teach it to our kids at an early age. After all, the best sports coaches know how to use probabilities to their advantage. If kids knew that, they might not dislike learning about them as much.
I really don’t have a clue about how to teach statistics to kids, but I do know what would have gotten my attention – sports data or weather data.
There are endless opportunities to use weather data in the classroom to teach some of the basic concepts of probability and statistics. Weather data are also easy to interpret, and work nicely in spreadsheet applications. The advantage of using weather statistics is that some of your kids will be able to relate to them. Even if the kids don’t, there is a good chance (see, we’re talking probabilities!) that their parents will get curious.
Where to fi nd some data?To get started, you need some interesting yet
simple weather data. This is simple for me, since I work with it all the time, but it can be a bit intimidat-ing if you’ve never done it before. There are many good sources of current and historic weather data on the Internet that you can get your hands on. If you are stressed for time, maybe your school librarian can help. Many librarians just love searching for things. So do some of your kids.
I won’t send you in too many directions. To start with, why not use data from here in Colorado. The Colorado Climate Center web site provides access to current and historic temperature, precipitation, and snowfall data for more than 300 locations in Colorado. I would recommend starting with daily temperatures or precipitation. You can access this very easily via http://ccc.atmos.colostate.edu.
Click on “Data Access” and then click on “Daily Data” and you will see a menu of hundreds of weather stations. Choose the period of years you are interested in and the station that you want and then click on the “Submit” button and in seconds you will see lots of numbers. The daily data consists of the date, the high and low temperature (in degrees Fahrenheit), the precipitation for each day in hundredths of an inch, snowfall in tenths of an inch, and the total depth of snow on the ground in whole inches. You can either save the fi le to your computer or print it out. Beware, since there are 365 days in a year, that you will need several pages just to print out one year.
(Note: Depending on what you plan to do with your students, there are other interesting data sets including summarized monthly data for temperatures, precipitation, and snowfall (click on “Monthly Data”); data on wind, humidity, solar energy, and soil tem-peratures for agricultural weather stations (click on “COAGMET”); and maps and lists of daily precipita-tion and snowfall for many local weather stations in northern Colorado (click on “CoCo RaHS”). There are also web sites to acquire current weather information from locations all over the country and world.
(continued on page 14)
14 Colorado Climate
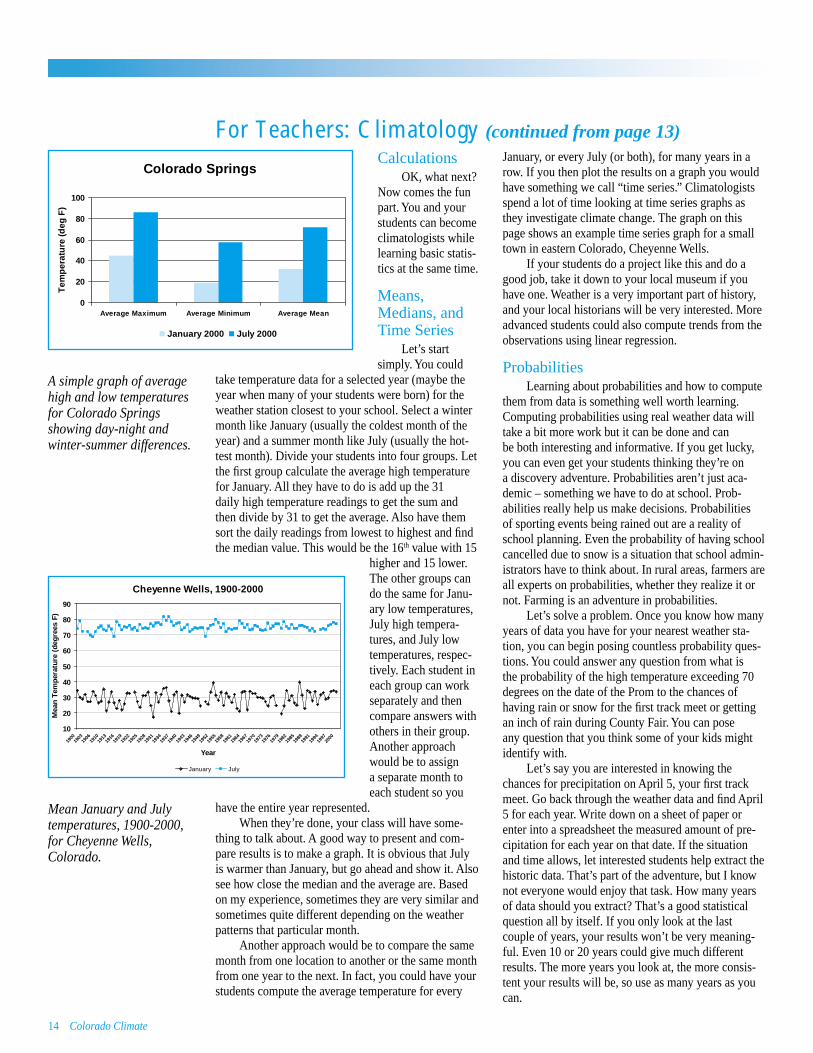
CalculationsOK, what next?
Now comes the fun part. You and your students can become climatologists while learning basic statis-tics at the same time.
Means, Medians, and Time Series
Let’s start simply. You could
take temperature data for a selected year (maybe the year when many of your students were born) for the weather station closest to your school. Select a winter month like January (usually the coldest month of the year) and a summer month like July (usually the hot-test month). Divide your students into four groups. Let the fi rst group calculate the average high temperature for January. All they have to do is add up the 31 daily high temperature readings to get the sum and then divide by 31 to get the average. Also have them sort the daily readings from lowest to highest and fi nd the median value. This would be the 16th value with 15
higher and 15 lower. The other groups can do the same for Janu-ary low temperatures, July high tempera-tures, and July low temperatures, respec-tively. Each student in each group can work separately and then compare answers with others in their group. Another approach would be to assign a separate month to each student so you
have the entire year represented.When they’re done, your class will have some-
thing to talk about. A good way to present and com-pare results is to make a graph. It is obvious that July is warmer than January, but go ahead and show it. Also see how close the median and the average are. Based on my experience, sometimes they are very similar and sometimes quite different depending on the weather patterns that particular month.
Another approach would be to compare the same month from one location to another or the same month from one year to the next. In fact, you could have your students compute the average temperature for every
January, or every July (or both), for many years in a row. If you then plot the results on a graph you would have something we call “time series.” Climatologists spend a lot of time looking at time series graphs as they investigate climate change. The graph on this page shows an example time series graph for a small town in eastern Colorado, Cheyenne Wells.
If your students do a project like this and do a good job, take it down to your local museum if you have one. Weather is a very important part of history, and your local historians will be very interested. More advanced students could also compute trends from the observations using linear regression.
ProbabilitiesLearning about probabilities and how to compute
them from data is something well worth learning. Computing probabilities using real weather data will take a bit more work but it can be done and can be both interesting and informative. If you get lucky, you can even get your students thinking they’re on a discovery adventure. Probabilities aren’t just aca-demic – something we have to do at school. Prob-abilities really help us make decisions. Probabilities of sporting events being rained out are a reality of school planning. Even the probability of having school cancelled due to snow is a situation that school admin-istrators have to think about. In rural areas, farmers are all experts on probabilities, whether they realize it or not. Farming is an adventure in probabilities.
Let’s solve a problem. Once you know how many years of data you have for your nearest weather sta-tion, you can begin posing countless probability ques-tions. You could answer any question from what is the probability of the high temperature exceeding 70 degrees on the date of the Prom to the chances of having rain or snow for the fi rst track meet or getting an inch of rain during County Fair. You can pose any question that you think some of your kids might identify with.
Let’s say you are interested in knowing the chances for precipitation on April 5, your fi rst track meet. Go back through the weather data and fi nd April 5 for each year. Write down on a sheet of paper or enter into a spreadsheet the measured amount of pre-cipitation for each year on that date. If the situation and time allows, let interested students help extract the historic data. That’s part of the adventure, but I know not everyone would enjoy that task. How many years of data should you extract? That’s a good statistical question all by itself. If you only look at the last couple of years, your results won’t be very meaning-ful. Even 10 or 20 years could give much different results. The more years you look at, the more consis-tent your results will be, so use as many years as you can.
A simple graph of average high and low temperatures for Colorado Springs showing day-night and winter-summer differences.
Mean January and July temperatures, 1900-2000, for Cheyenne Wells, Colorado.
For Teachers: Climatology (continued from page 13)
Colorado Springs
0
20
40
60
80
100
Average Maximum Average Minimum Average Mean
Tem
per
atu
re (d
eg F
)
January 2000 July 2000
Cheyenne Wells, 1900-2000
10
20
30
40
50
60
70
80
90
1900
1903
1906
1910
1913
1916
1919
1922
1925
1928
1931
1934
1937
1940
1943
1946
1949
1952
1955
1958
1961
1964
1967
1970
1973
1976
1979
1982
1985
1988
1991
1994
1997
2000
Year
Mea
n Te
mpe
ratu
re (
degr
ees
F)
January July
Colorado Climate 15
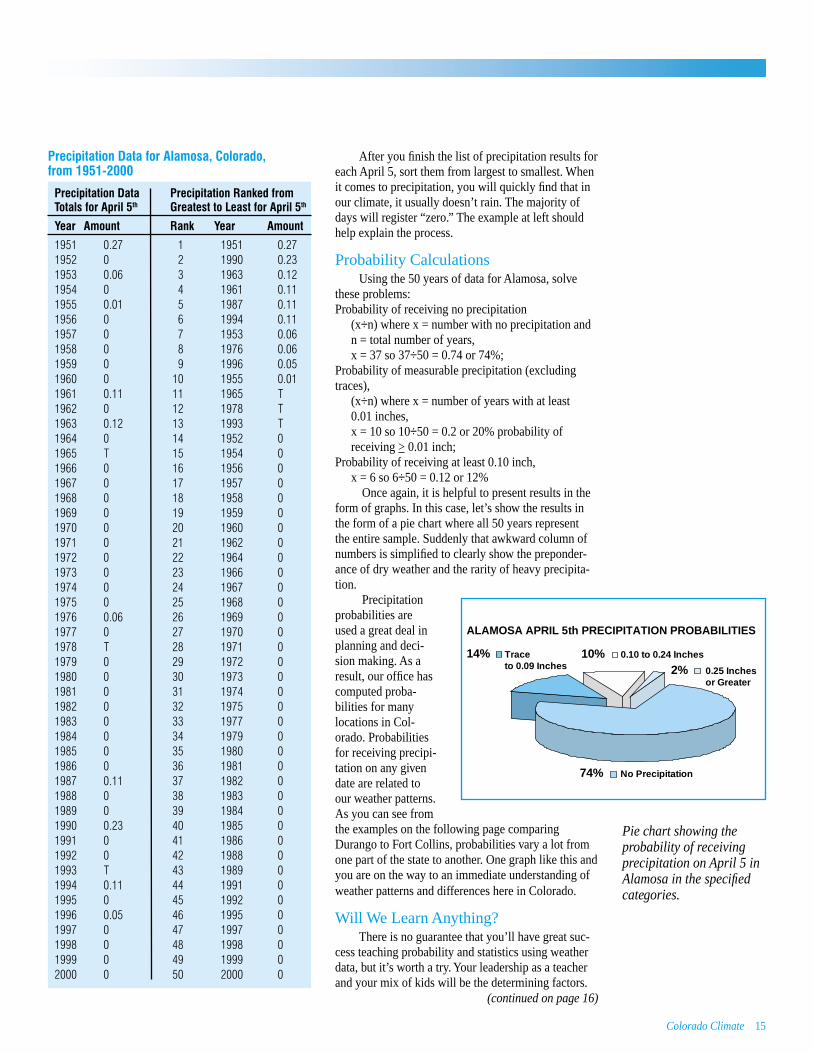
After you fi nish the list of precipitation results for each April 5, sort them from largest to smallest. When it comes to precipitation, you will quickly fi nd that in our climate, it usually doesn’t rain. The majority of days will register “zero.” The example at left should help explain the process.
Probability CalculationsUsing the 50 years of data for Alamosa, solve
these problems:Probability of receiving no precipitation (x÷n) where x = number with no precipitation and n = total number of years, x = 37 so 37÷50 = 0.74 or 74%; Probability of measurable precipitation (excluding traces), (x÷n) where x = number of years with at least 0.01 inches, x = 10 so 10÷50 = 0.2 or 20% probability of receiving > 0.01 inch; Probability of receiving at least 0.10 inch, x = 6 so 6÷50 = 0.12 or 12%
Once again, it is helpful to present results in the form of graphs. In this case, let’s show the results in the form of a pie chart where all 50 years represent the entire sample. Suddenly that awkward column of numbers is simplifi ed to clearly show the preponder-ance of dry weather and the rarity of heavy precipita-tion.
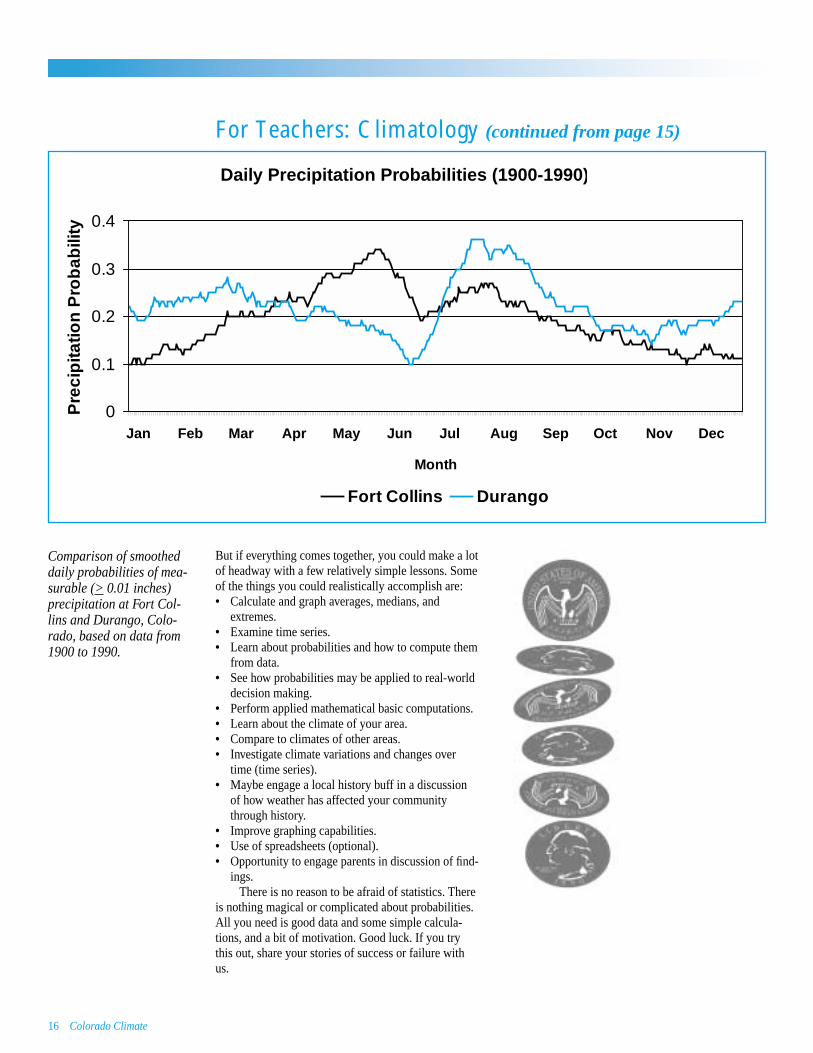
Precipitation probabilities are used a great deal in planning and deci-sion making. As a result, our offi ce has computed proba-bilities for many locations in Col-orado. Probabilities for receiving precipi-tation on any given date are related to our weather patterns. As you can see from the examples on the following page comparing Durango to Fort Collins, probabilities vary a lot from one part of the state to another. One graph like this and you are on the way to an immediate understanding of weather patterns and differences here in Colorado.
Will We Learn Anything?There is no guarantee that you’ll have great suc-
cess teaching probability and statistics using weather data, but it’s worth a try. Your leadership as a teacher and your mix of kids will be the determining factors.
Pie chart showing the probability of receiving precipitation on April 5 in Alamosa in the specifi ed categories.
(continued on page 16)
74% No Precipitation
14% Trace to 0.09 Inches
10% 0.10 to 0.24 Inches
2% 0.25 Inches or Greater
ALAMOSA APRIL 5th PRECIPITATION PROBABILITIES
Precipitation Data for Alamosa, Colorado, from 1951-2000
Precipitation Data Precipitation Ranked from Totals for April 5th Greatest to Least for April 5th
Year Amount Rank Year Amount
1951 0.27 1 1951 0.27 1952 0 2 1990 0.23 1953 0.06 3 1963 0.12 1954 0 4 1961 0.11 1955 0.01 5 1987 0.11 1956 0 6 1994 0.11 1957 0 7 1953 0.06 1958 0 8 1976 0.06 1959 0 9 1996 0.05 1960 0 10 1955 0.01 1961 0.11 11 1965 T 1962 0 12 1978 T 1963 0.12 13 1993 T 1964 0 14 1952 0 1965 T 15 1954 0 1966 0 16 1956 0 1967 0 17 1957 0 1968 0 18 1958 0 1969 0 19 1959 0 1970 0 20 1960 0 1971 0 21 1962 0 1972 0 22 1964 0 1973 0 23 1966 0 1974 0 24 1967 0 1975 0 25 1968 0 1976 0.06 26 1969 0 1977 0 27 1970 0 1978 T 28 1971 0 1979 0 29 1972 0 1980 0 30 1973 0 1981 0 31 1974 0 1982 0 32 1975 0 1983 0 33 1977 0 1984 0 34 1979 0 1985 0 35 1980 0 1986 0 36 1981 0 1987 0.11 37 1982 0 1988 0 38 1983 0 1989 0 39 1984 0 1990 0.23 40 1985 0 1991 0 41 1986 0 1992 0 42 1988 0 1993 T 43 1989 0 1994 0.11 44 1991 0 1995 0 45 1992 0 1996 0.05 46 1995 0 1997 0 47 1997 0 1998 0 48 1998 0 1999 0 49 1999 0 2000 0 50 2000 0
16 Colorado Climate
But if everything comes together, you could make a lot of headway with a few relatively simple lessons. Some of the things you could realistically accomplish are:• Calculate and graph averages, medians, and
extremes.• Examine time series.• Learn about probabilities and how to compute them
from data.• See how probabilities may be applied to real-world
decision making.• Perform applied mathematical basic computations.• Learn about the climate of your area.• Compare to climates of other areas.• Investigate climate variations and changes over
time (time series).• Maybe engage a local history buff in a discussion
of how weather has affected your community through history.
• Improve graphing capabilities.• Use of spreadsheets (optional).• Opportunity to engage parents in discussion of fi nd-
ings.There is no reason to be afraid of statistics. There
is nothing magical or complicated about probabilities. All you need is good data and some simple calcula-tions, and a bit of motivation. Good luck. If you try this out, share your stories of success or failure with us.
For Teachers: Climatology (continued from page 15)
Comparison of smoothed daily probabilities of mea-surable (> 0.01 inches) precipitation at Fort Col-lins and Durango, Colo-rado, based on data from 1900 to 1990.
Daily Precipitation Probabilities (1900-1990)
0
0.1
0.2
0.3
0.4
Jan Feb Mar Apr May Jun Jul Aug Sep Oct Nov Dec
Month
Pre
cip
itatio
n P
rob
abili
ty
Fort Collins Durango

Colorado Climate 17
18 Colorado Climate
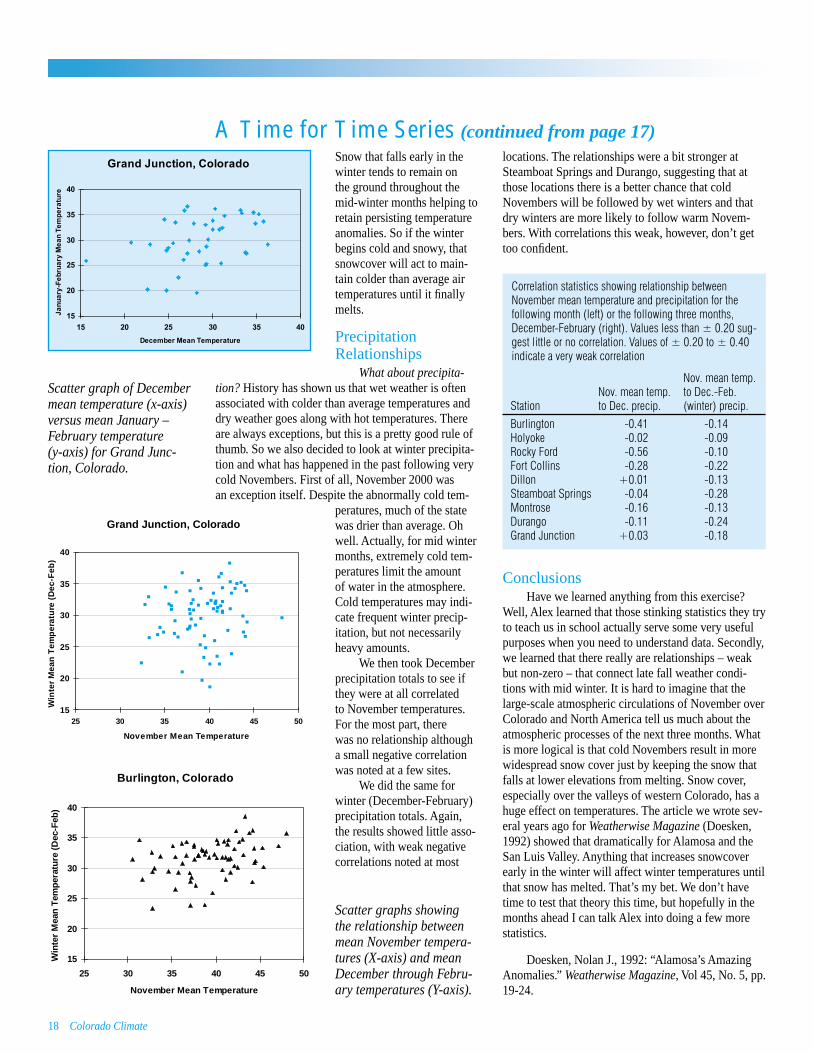
Snow that falls early in the winter tends to remain on the ground throughout the mid-winter months helping to retain persisting temperature anomalies. So if the winter begins cold and snowy, that snowcover will act to main-tain colder than average air temperatures until it fi nally melts.
Precipitation Relationships
What about precipita-tion? History has shown us that wet weather is often associated with colder than average temperatures and dry weather goes along with hot temperatures. There are always exceptions, but this is a pretty good rule of thumb. So we also decided to look at winter precipita-tion and what has happened in the past following very cold Novembers. First of all, November 2000 was an exception itself. Despite the abnormally cold tem-
peratures, much of the state was drier than average. Oh well. Actually, for mid winter months, extremely cold tem-peratures limit the amount of water in the atmosphere. Cold temperatures may indi-cate frequent winter precip-itation, but not necessarily heavy amounts.
We then took December precipitation totals to see if they were at all correlated to November temperatures. For the most part, there was no relationship although a small negative correlation was noted at a few sites.
We did the same for winter (December-February) precipitation totals. Again, the results showed little asso-ciation, with weak negative correlations noted at most
locations. The relationships were a bit stronger at Steamboat Springs and Durango, suggesting that at those locations there is a better chance that cold Novembers will be followed by wet winters and that dry winters are more likely to follow warm Novem-bers. With correlations this weak, however, don’t get too confi dent.
Correlation statistics showing relationship between November mean temperature and precipitation for the following month (left) or the following three months, December-February (right). Values less than ± 0.20 sug-gest little or no correlation. Values of ± 0.20 to ± 0.40 indicate a very weak correlation
Nov. mean temp. Nov. mean temp. to Dec.-Feb. Station to Dec. precip. (winter) precip.
Burlington -0.41 -0.14Holyoke -0.02 -0.09Rocky Ford -0.56 -0.10Fort Collins -0.28 -0.22Dillon +0.01 -0.13Steamboat Springs -0.04 -0.28Montrose -0.16 -0.13Durango -0.11 -0.24Grand Junction +0.03 -0.18
ConclusionsHave we learned anything from this exercise?
Well, Alex learned that those stinking statistics they try to teach us in school actually serve some very useful purposes when you need to understand data. Secondly, we learned that there really are relationships – weak but non-zero – that connect late fall weather condi-tions with mid winter. It is hard to imagine that the large-scale atmospheric circulations of November over Colorado and North America tell us much about the atmospheric processes of the next three months. What is more logical is that cold Novembers result in more widespread snow cover just by keeping the snow that falls at lower elevations from melting. Snow cover, especially over the valleys of western Colorado, has a huge effect on temperatures. The article we wrote sev-eral years ago for Weatherwise Magazine (Doesken, 1992) showed that dramatically for Alamosa and the San Luis Valley. Anything that increases snowcover early in the winter will affect winter temperatures until that snow has melted. That’s my bet. We don’t have time to test that theory this time, but hopefully in the months ahead I can talk Alex into doing a few more statistics.
Doesken, Nolan J., 1992: “Alamosa’s Amazing Anomalies.” Weatherwise Magazine, Vol 45, No. 5, pp. 19-24.
A Time for Time Series (continued from page 17)
Scatter graph of December mean temperature (x-axis) versus mean January – February temperature (y-axis) for Grand Junc-tion, Colorado.
Scatter graphs showing the relationship between mean November tempera-tures (X-axis) and mean December through Febru-ary temperatures (Y-axis).
Burlington, Colorado
15
20
25
30
35
40
25 30 35 40 45 50
November Mean Temperature
Win
ter
Mea
n T
emp
erat
ure
(D
ec-F
eb)
Grand Junction, Colorado
15
20
25
30
35
40
25 30 35 40 45 50
November Mean Temperature
Win
ter
Mea
n T
emp
erat
ure
(D
ec-F
eb)
Colorado Climate 19
Ode to MudNolan Doesken
T hose of you who are long-time subscribers to Colorado Climate know a little about my life. For you newcomers, I better fi ll you in – briefl y. Six years ago, our family took
the plunge and left our paved and sodded postage-stamp lot (actually, it was pie-shaped since we lived at the end of a cul-de-sac) and suburban neighborhood in west Fort Collins in search of a “richer” life – on a farm. It was not my idea, mind you. While I grew up in a tiny Illinois farm town surrounded by soybean and cornfi elds and have always loved agriculture and the lifestyle that goes with it, I still was content with my short commute to the Climate Center and a simple urban life. My wife, on the other hand, had a better idea. She had always dreamed of barns, horses, chick-ens, fruit trees, and hay. She felt confi ned by our neighborhood and wanted room to stretch out. She had a craving for soil, compost, and manure.
For many years our family had admired the old weathered barn that you could see out the kitchen window at “Grandma’s house” (my mother-in-law) up on the north end of Fort Collins. Late in 1994, we got a call from the owner letting us know he planned to sell it. My wife and my mother-in-law were elated. I was – well, not as thrilled. It was a farm, all right – small, old, and rundown. But it was a farm, and it was nearby, and it seemed like a good idea in some strange sort of way. So in April 1995 we bought the farm (so to speak), and immediately the heavens opened and it rained without ceasing (or so it seemed) until summer. That was the beginning of my lesson in Colorado mud. I’ve learned more since then, but I certainly got an appreciation for words like “quagmire.”
We only moved 2 miles, but in so many ways it felt like we moved at least 500 miles and, at the same time, back about 65 years in time. These last few years have been a great learning experience. Not a “great” experience, mind you, but a great “learning” experience. Cutting wood, loading hay, cleaning irriga-tion ditches, fi xing fences, etc. I’m not at all sure I would wish it on just anyone, but more than likely you’ve already had your own comparable experiences sometime in life. We are NEVER bored.
With this introduction, let’s move to the subject at hand – mud. Somewhere in my childhood I was taught a lovely verse that went something like this:
“Mud, mud, glorious mud!Nothing quite like it for cooling the blood.So follow me, follow,Down to the hollow,And there we shall wallow In glorious mud!”If you could hear the tune that goes with this,
you would fi nd it quite appealing. It makes mud sound
almost romantic. Well, let me tell you the truth. It’s not that way at all. Mud is awful.
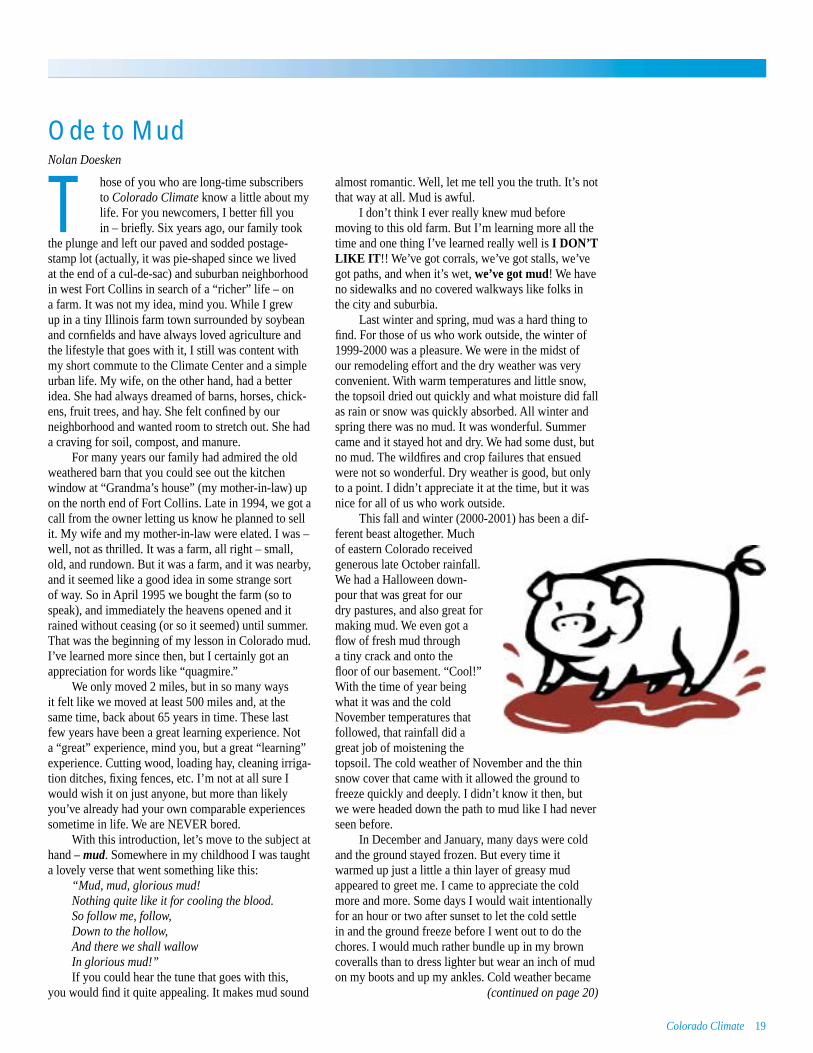
I don’t think I ever really knew mud before moving to this old farm. But I’m learning more all the time and one thing I’ve learned really well is I DON’T LIKE IT!! We’ve got corrals, we’ve got stalls, we’ve got paths, and when it’s wet, we’ve got mud! We have no sidewalks and no covered walkways like folks in the city and suburbia.
Last winter and spring, mud was a hard thing to fi nd. For those of us who work outside, the winter of 1999-2000 was a pleasure. We were in the midst of our remodeling effort and the dry weather was very convenient. With warm temperatures and little snow, the topsoil dried out quickly and what moisture did fall as rain or snow was quickly absorbed. All winter and spring there was no mud. It was wonderful. Summer came and it stayed hot and dry. We had some dust, but no mud. The wildfi res and crop failures that ensued were not so wonderful. Dry weather is good, but only to a point. I didn’t appreciate it at the time, but it was nice for all of us who work outside.
This fall and winter (2000-2001) has been a dif-ferent beast altogether. Much of eastern Colorado received generous late October rainfall. We had a Halloween down-pour that was great for our dry pastures, and also great for making mud. We even got a fl ow of fresh mud through a tiny crack and onto the fl oor of our basement. “Cool!” With the time of year being what it was and the cold November temperatures that followed, that rainfall did a great job of moistening the topsoil. The cold weather of November and the thin snow cover that came with it allowed the ground to freeze quickly and deeply. I didn’t know it then, but we were headed down the path to mud like I had never seen before.
In December and January, many days were cold and the ground stayed frozen. But every time it warmed up just a little a thin layer of greasy mud appeared to greet me. I came to appreciate the cold more and more. Some days I would wait intentionally for an hour or two after sunset to let the cold settle in and the ground freeze before I went out to do the chores. I would much rather bundle up in my brown coveralls than to dress lighter but wear an inch of mud on my boots and up my ankles. Cold weather became
(continued on page 20)
20 Colorado Climate
my best friend. While others complained of the long winter, I gave thanks for each day where the ground remained hard and solid.
All good things must come to an end, and so time after time this winter the sun would greet us. While most in town delighted in the warm days, we on the little old farm at the edge of town were isolated by mud.
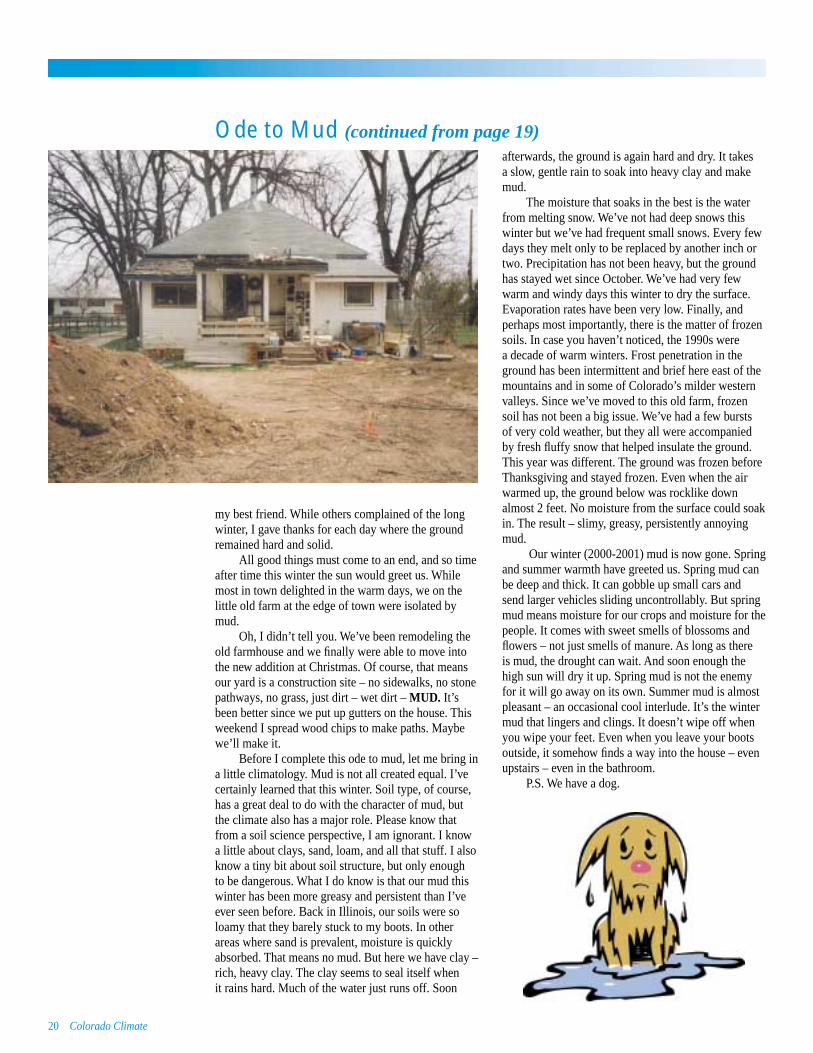
Oh, I didn’t tell you. We’ve been remodeling the old farmhouse and we fi nally were able to move into the new addition at Christmas. Of course, that means our yard is a construction site – no sidewalks, no stone pathways, no grass, just dirt – wet dirt – MUD. It’s been better since we put up gutters on the house. This weekend I spread wood chips to make paths. Maybe we’ll make it.
Before I complete this ode to mud, let me bring in a little climatology. Mud is not all created equal. I’ve certainly learned that this winter. Soil type, of course, has a great deal to do with the character of mud, but the climate also has a major role. Please know that from a soil science perspective, I am ignorant. I know a little about clays, sand, loam, and all that stuff. I also know a tiny bit about soil structure, but only enough to be dangerous. What I do know is that our mud this winter has been more greasy and persistent than I’ve ever seen before. Back in Illinois, our soils were so loamy that they barely stuck to my boots. In other areas where sand is prevalent, moisture is quickly absorbed. That means no mud. But here we have clay – rich, heavy clay. The clay seems to seal itself when it rains hard. Much of the water just runs off. Soon
afterwards, the ground is again hard and dry. It takes a slow, gentle rain to soak into heavy clay and make mud.
The moisture that soaks in the best is the water from melting snow. We’ve not had deep snows this winter but we’ve had frequent small snows. Every few days they melt only to be replaced by another inch or two. Precipitation has not been heavy, but the ground has stayed wet since October. We’ve had very few warm and windy days this winter to dry the surface. Evaporation rates have been very low. Finally, and perhaps most importantly, there is the matter of frozen soils. In case you haven’t noticed, the 1990s were a decade of warm winters. Frost penetration in the ground has been intermittent and brief here east of the mountains and in some of Colorado’s milder western valleys. Since we’ve moved to this old farm, frozen soil has not been a big issue. We’ve had a few bursts of very cold weather, but they all were accompanied by fresh fl uffy snow that helped insulate the ground. This year was different. The ground was frozen before Thanksgiving and stayed frozen. Even when the air warmed up, the ground below was rocklike down almost 2 feet. No moisture from the surface could soak in. The result – slimy, greasy, persistently annoying mud.
Our winter (2000-2001) mud is now gone. Spring and summer warmth have greeted us. Spring mud can be deep and thick. It can gobble up small cars and send larger vehicles sliding uncontrollably. But spring mud means moisture for our crops and moisture for the people. It comes with sweet smells of blossoms and fl owers – not just smells of manure. As long as there is mud, the drought can wait. And soon enough the high sun will dry it up. Spring mud is not the enemy for it will go away on its own. Summer mud is almost pleasant – an occasional cool interlude. It’s the winter mud that lingers and clings. It doesn’t wipe off when you wipe your feet. Even when you leave your boots outside, it somehow fi nds a way into the house – even upstairs – even in the bathroom.
P.S. We have a dog.
Ode to Mud (continued from page 19)
Colorado Climate 21
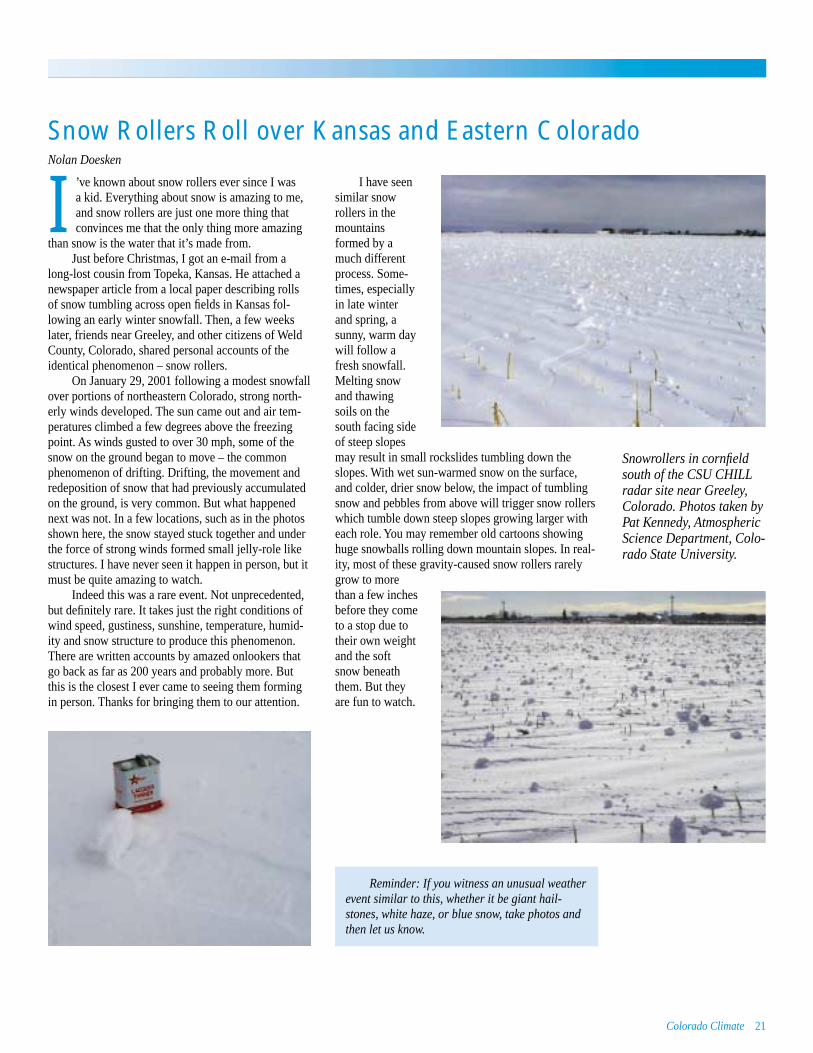
Snow Rollers Roll over Kansas and Eastern ColoradoNolan Doesken
I ’ve known about snow rollers ever since I was a kid. Everything about snow is amazing to me, and snow rollers are just one more thing that convinces me that the only thing more amazing
than snow is the water that it’s made from. Just before Christmas, I got an e-mail from a
long-lost cousin from Topeka, Kansas. He attached a newspaper article from a local paper describing rolls of snow tumbling across open fi elds in Kansas fol-lowing an early winter snowfall. Then, a few weeks later, friends near Greeley, and other citizens of Weld County, Colorado, shared personal accounts of the identical phenomenon – snow rollers.
On January 29, 2001 following a modest snowfall over portions of northeastern Colorado, strong north-erly winds developed. The sun came out and air tem-peratures climbed a few degrees above the freezing point. As winds gusted to over 30 mph, some of the snow on the ground began to move – the common phenomenon of drifting. Drifting, the movement and redeposition of snow that had previously accumulated on the ground, is very common. But what happened next was not. In a few locations, such as in the photos shown here, the snow stayed stuck together and under the force of strong winds formed small jelly-role like structures. I have never seen it happen in person, but it must be quite amazing to watch.
Indeed this was a rare event. Not unprecedented, but defi nitely rare. It takes just the right conditions of wind speed, gustiness, sunshine, temperature, humid-ity and snow structure to produce this phenomenon. There are written accounts by amazed onlookers that go back as far as 200 years and probably more. But this is the closest I ever came to seeing them forming in person. Thanks for bringing them to our attention.
I have seen similar snow rollers in the mountains formed by a much different process. Some-times, especially in late winter and spring, a sunny, warm day will follow a fresh snowfall. Melting snow and thawing soils on the south facing side of steep slopes may result in small rockslides tumbling down the slopes. With wet sun-warmed snow on the surface, and colder, drier snow below, the impact of tumbling snow and pebbles from above will trigger snow rollers which tumble down steep slopes growing larger with each role. You may remember old cartoons showing huge snowballs rolling down mountain slopes. In real-ity, most of these gravity-caused snow rollers rarely grow to more than a few inches before they come to a stop due to their own weight and the soft snow beneath them. But they are fun to watch.
Snowrollers in cornfi eld south of the CSU CHILL radar site near Greeley, Colorado. Photos taken by Pat Kennedy, Atmospheric Science Department, Colo-rado State University.
Reminder: If you witness an unusual weather event similar to this, whether it be giant hail-stones, white haze, or blue snow, take photos and then let us know.
Climate affects us daily!So don’t miss a single issue, subscribe to:
Colorado Climate$15.00/year • 4 (four) issues per year
$7.50 for a single issue Winter, Spring, Summer, and Fall
YES! I want to subscribe to the Colorado Climate publication. (Please photocopy and mail this form.)
Check one below:
❑ Payment enclosed (make check or money order payable to Colorado State University). U.S. funds only.
❑ Invoice me
❑ Charge my credit card VISA/MC Account: _______________________________________Exp: ________ Card Holder Name: _______________________________Name: _____________________________________________________Company Name: _____________________________________________Address: ____________________________________________________City: ____________________________ State: ______ ZIP: ___________Phone: __________________ e-mail: _____________________________
Return to: Colorado Climate Center • Department of Atmospheric ScienceColorado State University • Fort Collins • Colorado 80523-1371Phone: (970) 491-8545 • Fax: (970) 491-8449 E-mail: [email protected]
Share this form with a friend.Show your library. C
olor
ado
Clim
ate
Cen
ter
Dep
artm
ent o
f Atm
osph
eric
Sci
ence
Fort
Col
lins,
Col
orad
o 80
523-
1371
Floods, Hail, Drought, Blizzards, Lightning, Tornadoes
© R
onal
d L.
Hol
le, u
sed
with
per
mis
sion
.©
Ron
ald
L. H
olle
, use
d w
ith p
erm
issi
on.