Embed Size (px)
Citation preview

Colorado Community
College System
TRANSFER REPORT
FALL 2012 TO FALL 2013
SEPTEMBER 2014

1
Introduction
Facilitating the achievement of student educational goals is an important component of
the mission of the Colorado Community College System (CCCS). The educational goal
of many Coloradans is a baccalaureate or higher degree, and for a number of students a
community college is the first step toward attaining that goal. Ultimately, though,
students must transfer from a CCCS college to a four-year institution to achieve their goal
of a baccalaureate degree. Tracking transfer production – the number of students who
transfer from a CCCS college to another institution of higher education – helps CCCS
measure its success in facilitating the educational goals of this segment of its student
population.
To obtain the broadest information available on student transfers, CCCS matches its
students with National Student Clearinghouse (NSC) data. NSC collects enrollment data
from colleges and universities throughout the United States; the institutions that provide
data to NSC enroll over 98 percent of the nation’s postsecondary students. By using the
NSC database, CCCS can obtain data on transfers to out-of-state as well as in-state
institutions, public and private colleges, and two-year colleges in addition to four-year
institutions.1
Fall 2012 to Fall 2013 Transfers
A total of 12,655 students attending a CCCS college in Fall 2012 transferred to another
institution of higher education in Fall 2013. This number is 14.1 percent of the 89,868
students submitted to NSC for matching. A student is counted as a transfer if he or she
1 The Colorado Department of Higher Education also produces a report on transfers. The CDHE report is
based on data that is more limited than the data provided by NSC. The CDHE report does not include out-
of-state institutions and its data from in-state private schools is limited. Further, the CDHE report for
public in-state institutions relies on information provided by the transfer college that may result in an
underreporting of CCCS transfers. For comparison, CDHE's 2012-13 report identifies 6,210 CCCS
transfers, while NSC data identifies 12,655 such transfers.
2
enrolls in a different institution of higher education in the subsequent fall, regardless of
whether the student earned a credential at the originating CCCS college.
Table 1. CCCS Fall Students Transferred to Other Institutions in Following Fall
Fall 2012 to Fall 2013 Fall 2011 to Fall 2012
Headcount Percent of
Cohort Headcount Percent of
Cohort
Original Cohort* 89,868 100.0% 91,917 100.0%
Transfers** 12,655 14.1% 13,149 14.3% *The original cohort includes all countable undergraduates selected from the Fall 2012 Demographic file in the Student
Tracking System, duplicated across CCCS colleges.
**Transfers are students who attended or graduated from another institution in Fall 2013, according to NSC. Transfers
do not include those who withdrew from the transfer institution that term. A student’s enrollment status before or after
that term is not included in the analysis. NSC matching was performed on student name and date of birth, and resulted
in a 96.1% match rate. Not all institutions participate in NSC.
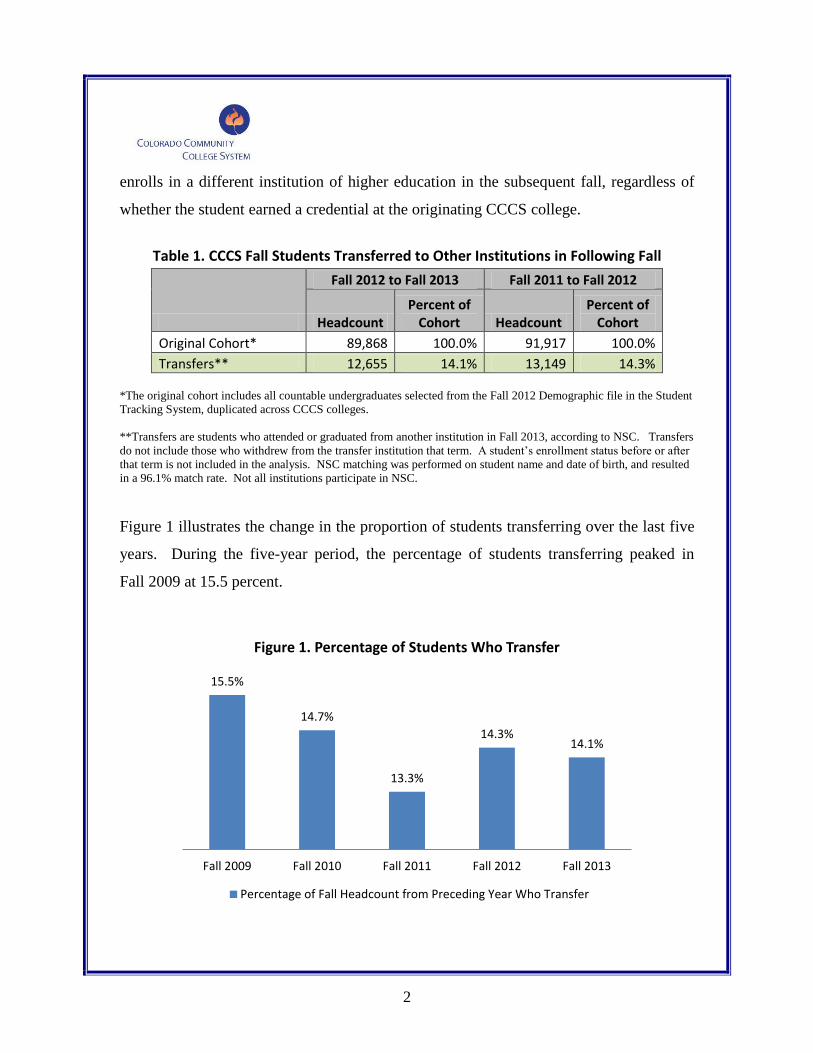
Figure 1 illustrates the change in the proportion of students transferring over the last five
years. During the five-year period, the percentage of students transferring peaked in
Fall 2009 at 15.5 percent.
15.5%
14.7%
13.3%
14.3% 14.1%
Fall 2009 Fall 2010 Fall 2011 Fall 2012 Fall 2013
Figure 1. Percentage of Students Who Transfer
Percentage of Fall Headcount from Preceding Year Who Transfer

3
The majority of students, 91.1 percent, transferred to a four-year institution (Table 2),
with 83.9 percent of students attending a public institution (Table 3). Of those at public
colleges, 90.1 percent attended a four-year college. Over the last five years, the
percentage of transfers attending a four-year college has remained relatively consistent,
averaging 91.5 percent (Figure 2).
Table 2. Destination of Transfer Students by Type of Institution
Type Total Public Private All
Four-Year 91.1% 9,567 1,957 11,524
Two-Year 8.9% 1,056 75 1,131
Total 100.0% 10,623 2,032 12,655
Table 3. Destination of Transfer Students by Location and Type of Institution
Type Colorado All
Public 70.0% 83.9%
Private 8.4% 16.1%
Total 78.4% 100.0%
92.1%
91.8%
91.2%
91.4%
91.1%
Fall 2009 Fall 2010 Fall 2011 Fall 2012 Fall 2013
Figure 2. Transfers to Four-Year Colleges
Percentage of Transfer Students Transferring to a Four-Year College

4
In Fall 2012, a higher proportion of those who transferred were attending a CCCS college
on a full-time basis – 35.6 percent versus 32.1 percent for the cohort submitted to NSC
for matching (Table 4). The proportion of transfers who were high school students in
Fall 2012 was higher than that for the cohort – 17.7 percent compared to 9.8 percent –
and was also higher than the year-ago level of 11.9 percent. Fall 2013 transfers were less
likely to be new to college in the preceding fall (8.6 percent) than the cohort
(17.5 percent).
Table 4. Enrollment Status in Fall 2012
Type of Student Transfers Cohort
Part-Time 64.4% 67.9%
Full-Time 35.6% 32.1%
Continuing Student 51.6% 53.4%
New First Time Anywhere 8.6% 17.5%
Transfer Student 11.6% 11.8%
Unknown/Other1 7.1% 1.8%
Readmit 3.4% 5.7%
High School Student 17.7% 9.8% 1 This category includes CCD consortium students. All but one of the
transfers are consortium students
Table 5 displays students’ intended credential before transferring, represented here by the
degree or certificate program declared in Fall 2012. About 69 percent of all students who
transferred had declared an intention to earn some type of associate degree, while
27.7 percent did not identify a particular course of study.
Table 5. Student Intent Prior To Transfer
Student Intent Percent
AA/AS Degree 47.8%
Non-Degree Seeking 8.5%
Undeclared 19.2%
AAS Degree 11.4%
AGS Degree 9.3%
Certificate 3.6%
Unknown 0.0%
Total 100.0%

5
Just under 18 percent of transfers obtained a credential at a CCCS institution in the year
before transferring. The majority of credentials, 52.3 percent, were AA and AS degrees.
Approximately 21 percent of awards were certificates (Table 6).2
Table 6. Credentials Earned by Transfer Students at CCCS Institutions through Academic Year 2012-13
Award Number Percent of
Awards
Certificate 531 21.2%
AAS Degree 301 12.0%
AGS Degree 363 14.5%
AA or AS Degree 1,309 52.3%
Total Awards 2,504 100.0%
Forty-six percent of students who transferred in Fall 2013 had earned between one and
twenty-nine credit hours at the time of their transfer. Figure 3 provides a breakout of
credit hours earned through Summer 2013 by Fall 2013 transfer students.3
Figure 3. Estimated Credit Hours Earned by Transfer Students
2 The number of credentials exceeds the number of students who earned a credential because some students
received more than one credential. The number of students who earned a credential was 2,229. 3 Based on cumulative credit hours reported in SURDS enrollment files.
credits >= 90
credits >=60, <90
credits >=45, <60
credits >=30, <45
credits >=15, <30
credits <15, >0
credits = 0
6.5%
24.6%
9.5%
10.8%
16.0% 30.0%
2.5%
Percent of Transfer Students in Credit-Hour Category

6
Transfer Destinations
The most common transfer destination overall was Metropolitan State University of
Denver (MSU Denver), claiming 21.9 percent of all transfers. MSU Denver's share of
the transfer population dropped 2.2 percentage points from last year. Colorado State
University (CSU) drew the next largest number, at 10.2 percent. The top five transfer
destinations drew 53.2 percent of all transfers (Table 7). Regis University was the top
private institution, drawing 4.4 percent of transfer students.
Table 7. Top Five Transfer Destinations
Transfer Destination Students % of Total Transfers
MSU Denver 2,771 21.9%
Colorado State University 1,296 10.2%
University of Colorado Denver 1,009 8.0%
University of Colorado Colorado Springs 911 7.2%
University of Colorado Boulder 744 5.9%
Total of Top Five Destinations 6,731 53.2%
As Figure 4 illustrates, MSU Denver has been the top destination throughout the last five
years, although the number of students transferring there decreased in each of the last two
years. The University of Colorado Boulder returns as the fifth most popular transfer
destination after being replaced by Regis University in 2010.

7
Table 8 identifies the number of transfers and the top transfer destination for each CCCS
college. CNCC had the highest percentage of transfers (19.3 percent), followed by CCD
(17.9 percent). MSU Denver was the top destination for four of the thirteen community
colleges, while CSU Pueblo was the top destination for three.
Table 8. Transfers by Originating College
Originating College
Transfers to Two
Year
Transfers to Four
Year Total
Transfers as % of Total
Students Top Transfer Destination
ACC 83 1,532 1,615 16.5% MSU Denver
CCA 65 965 1,030 12.6% MSU Denver
CCD 86 2,050 2,136 17.9% MSU Denver
CNCC 52 172 224 19.3% Colorado Mesa
FRCC 349 2,805 3,154 15.4% CSU
LCC 15 120 135 14.7% CSU Pueblo
MCC 54 253 307 16.7% UNC
NJC 27 267 294 15.0% CSU/UNC (tie)
OJC 17 184 201 13.8% CSU Pueblo
PCC 69 484 553 9.0% CSU Pueblo
PPCC 234 1,444 1,678 11.0% UCCS
RRCC 68 1,053 1,121 12.4% MSU Denver
TSJC 12 195 207 12.0% Adams State
Total 1,131 11,524 12,655 14.1% MSU Denver
0
500
1,000
1,500
2,000
2,500
3,000
3,500
UCB Regis UCCS UCD CSU MSU
Figure 4. Top Five Transfer Destinations, 2009 - 2013
Fall 2009
Fall 2010
Fall 2011
Fall 2012
Fall 2013

8
Figure 5 shows transfers as a percentage of the originating college’s cohort over the last
five years, while Figure 6 illustrates the total number of transfers by originating college
for the same period. Over the five-year period, ACC had the greatest increase in the
proportion of students transferring, while CCD experienced annual declines in its transfer
rate.
Figure 5. Percent of Transfers by Originating College: 2009 to 2013
Figure 6. Number of Transfers by Originating College: 2009 to 2013
0%
5%
10%
15%
20%
25%
30%
ACC CCA CCD CNCC FRCC LCC MCC NJC OJC PCC PPCC RRCC TSJC CCCS
Fall 2009
Fall 2010
Fall 2011
Fall 2012
Fall 2013
0
500
1,000
1,500
2,000
2,500
3,000
3,500
ACC CCA CCD CNCC FRCC LCC MCC NJC OJC PCC PPCC RRCC TSJC
Fall 2009
Fall 2010
Fall 2011
Fall 2012
Fall 2013

9
Demographics of Transfer Students
In terms of gender, the transfer population was not significantly different from the
Fall 2012 cohort. Females comprised a slightly lower proportion of transfers than they
did of the Fall 2012 cohort: 56.9 percent compared to 57.3 percent (Figure 7).
Conversely, the proportion of transfers who were male was slightly higher than male
representation in the cohort.
Figure 7. Comparison of Transfers and the Cohort by Gender
Transfer students were more likely to be white than the cohort: 62 percent of transfers
reported as white versus 59.5 percent of the cohort (Table 8). Minorities comprised
30 percent of the transfer population compared to 34.6 percent of the cohort.
Male Female Not Reported
42.9%
56.9%
0.2%
42.5%
57.3%
0.2%
Transfers Cohort

10
Table 8. Comparison of Transfers and Cohort by Race/Ethnicity
Race/Ethnicity Transfers Fall 2012 Cohort
Transfers Compared to Cohort
Asian 3.2% 2.9% 0.4%
Black 5.7% 7.0% -1.3%
Hawaiian/Pacific Islander 0.3% 0.3% 0.0%
Hispanic 13.4% 16.9% -3.4%
Multiple 3.1% 3.4% -0.3%
Native American/Alaska Native 0.8% 1.0% -0.2%
Non-resident Alien 1.1% 1.3% -0.2%
Unknown 10.2% 7.7% 2.5%
White 62.0% 59.5% 2.6%
Minority* 30.0% 34.6% -4.6%
* The minority percentages are calculated using only the minority and white populations. Minorities include Asian, Black, Hawaiian/Pacific Islander, Hispanic, Multiple, and Native American/Alaska Native populations.
Students in the traditional college-age population were proportionally more likely to
transfer than older students (Figure 9). In the year of transfer, 62 percent of transfers
were age 24 or younger, while 34.9 percent were age 20 or younger.
Figure 9. Comparison of Transfers and Cohort by Age
20 & Under 21 to 24 25 & Over
34.9%
27.0%
38.0%
25.9% 23.8%
50.3%
Transfers Cohort

11
Data
The National Student Clearinghouse provides the most comprehensive data available for
tracking student transfers. Nonetheless, not all postsecondary institutions participate.
According to NSC, the following Colorado institutions with enrollment of 1,000 or more
did not participate in the NSC at the time data was submitted for this report:
Concorde Career Institute Aspen University
Westwood College Denver North American Sentinel University
The Art Institute of Colorado Lincoln College of Technology
Heritage College - Denver.