Embed Size (px)
Citation preview
Colorado Learning Attitudes about Science Surveyfor Experimental Physics (E-CLASS)
Report for Physics PHYS 1140, Experimental Physics, University ofColorado
Spring 2015
Thank you for participating in the Colorado Learning Attitudes about Science Survey for Experimental Physics(E-CLASS). We hope you find this report helpful for learning more about how your students think about experimental
physics. If you have questions about the survey or the results, or if you would like to make suggestions to improve theusefulness of the survey and report, we have two ways to hear your voice:
Complete the six-question E-CLASS report feedback survey at http://tinyurl.com/E-CLASS-Feedback.Email your questions or thoughts directly to our research team at [email protected].
Sincerly,Heather Lewandowski, Benjamin Zwickl, Dimitri Dounas-Frazer, and Bethany Wilcox
A sample E-CLASS question
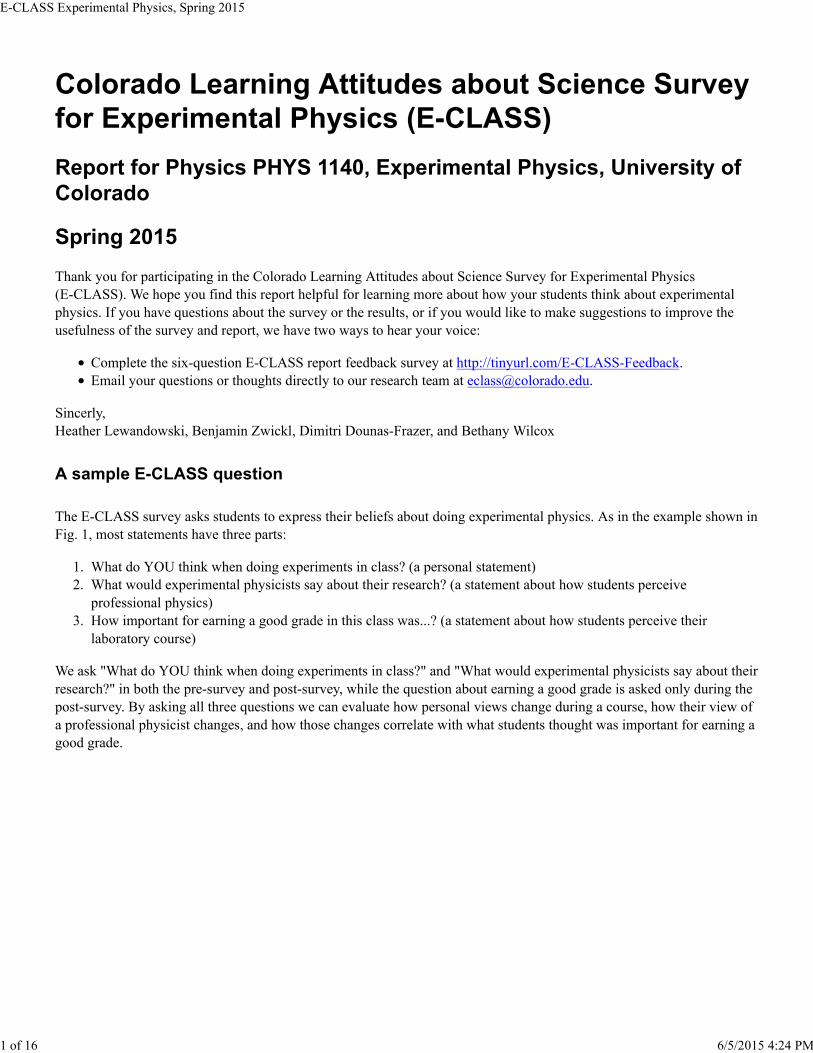
The E-CLASS survey asks students to express their beliefs about doing experimental physics. As in the example shown inFig. 1, most statements have three parts:
What do YOU think when doing experiments in class? (a personal statement)1.What would experimental physicists say about their research? (a statement about how students perceive
professional physics)
2.
How important for earning a good grade in this class was...? (a statement about how students perceive their
laboratory course)
3.
We ask "What do YOU think when doing experiments in class?" and "What would experimental physicists say about their
research?" in both the pre-survey and post-survey, while the question about earning a good grade is asked only during thepost-survey. By asking all three questions we can evaluate how personal views change during a course, how their view of
a professional physicist changes, and how those changes correlate with what students thought was important for earning agood grade.
E-CLASS Experimental Physics, Spring 2015
1 of 16 6/5/2015 4:24 PM
When doing an experiment, I try to understand how the experimental setup works.
Strongly Disagree 1 2 3 4 5 Strongly Agree
What do YOU think when doing experiments forclass? not answered
What would experimental physicists say about theirresearch? not answered
Unimportant 1 2 3 4 5 Very Important
How important for earning a good grade in thisclass was understanding how the experimental
setup works?not answered
FIG. 1 A set of three example questions around one key statement in the survey.
An example of how we process students' responses to get pre-post changes...
One key aspect of the E-CLASS survey is being able to look at how much laboratory courses shifted students' attitudes
over the course of a semester. There are many ways to visualize such a shift, but one of the easiest is shown in Fig. 4. Thissection goes over how students' responses are processed to make such a plot and to explain what it means.
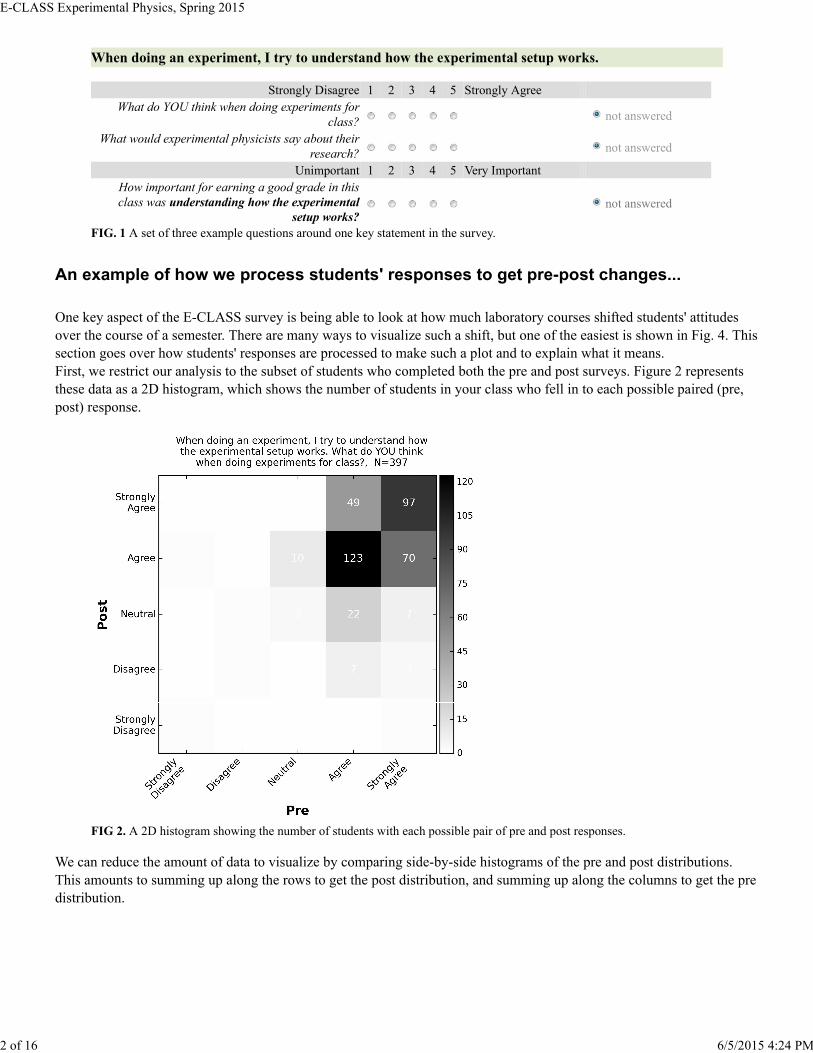
First, we restrict our analysis to the subset of students who completed both the pre and post surveys. Figure 2 representsthese data as a 2D histogram, which shows the number of students in your class who fell in to each possible paired (pre,
post) response.
FIG 2. A 2D histogram showing the number of students with each possible pair of pre and post responses.
We can reduce the amount of data to visualize by comparing side-by-side histograms of the pre and post distributions.
This amounts to summing up along the rows to get the post distribution, and summing up along the columns to get the predistribution.
E-CLASS Experimental Physics, Spring 2015
2 of 16 6/5/2015 4:24 PM
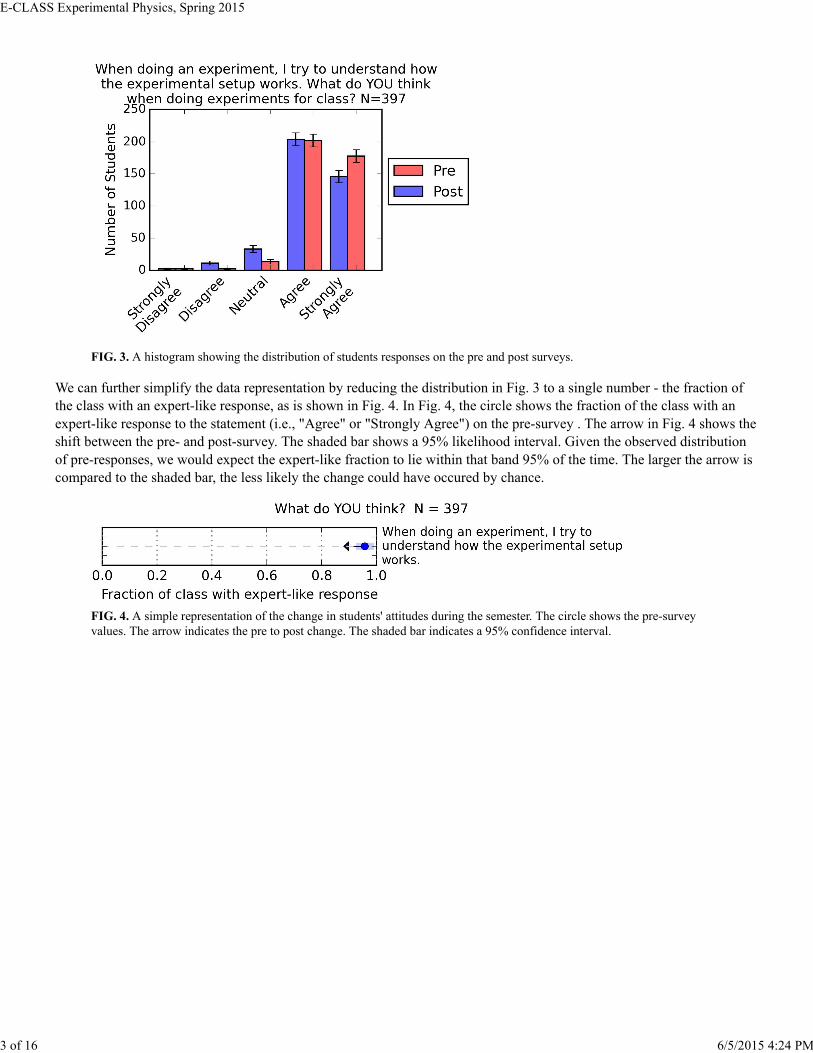
FIG. 3. A histogram showing the distribution of students responses on the pre and post surveys.
We can further simplify the data representation by reducing the distribution in Fig. 3 to a single number - the fraction ofthe class with an expert-like response, as is shown in Fig. 4. In Fig. 4, the circle shows the fraction of the class with an
expert-like response to the statement (i.e., "Agree" or "Strongly Agree") on the pre-survey . The arrow in Fig. 4 shows theshift between the pre- and post-survey. The shaded bar shows a 95% likelihood interval. Given the observed distribution
of pre-responses, we would expect the expert-like fraction to lie within that band 95% of the time. The larger the arrow iscompared to the shaded bar, the less likely the change could have occured by chance.
FIG. 4. A simple representation of the change in students' attitudes during the semester. The circle shows the pre-surveyvalues. The arrow indicates the pre to post change. The shaded bar indicates a 95% confidence interval.
E-CLASS Experimental Physics, Spring 2015
3 of 16 6/5/2015 4:24 PM
Results from your class
Summary of class participation
Number of valid pre-responses 509
Number of valid post-responses 448
Number of matched responses 397
Reported number of students in class 625
Fraction of class participating in pre and post 0.64
TABLE 1. Summary of class participation.
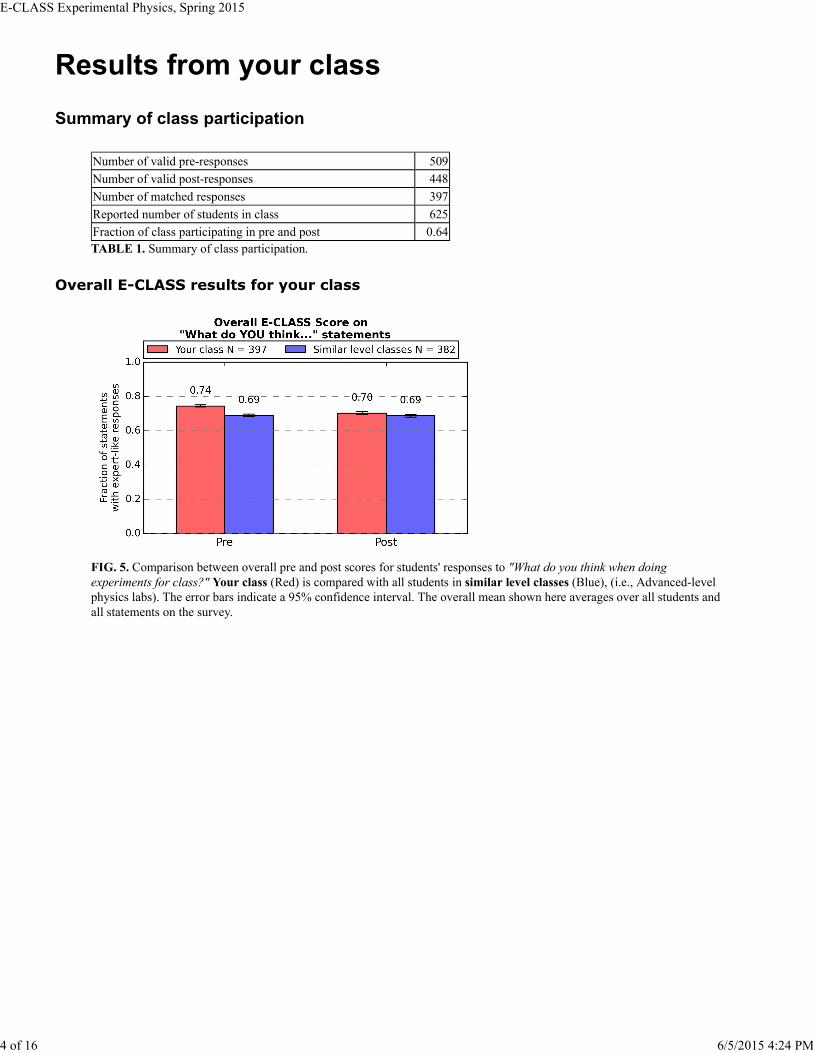
Overall E-CLASS results for your class
FIG. 5. Comparison between overall pre and post scores for students' responses to "What do you think when doingexperiments for class?" Your class (Red) is compared with all students in similar level classes (Blue), (i.e., Advanced-levelphysics labs). The error bars indicate a 95% confidence interval. The overall mean shown here averages over all students andall statements on the survey.
E-CLASS Experimental Physics, Spring 2015
4 of 16 6/5/2015 4:24 PM
How do students' personal views change in your course compared to other courses?
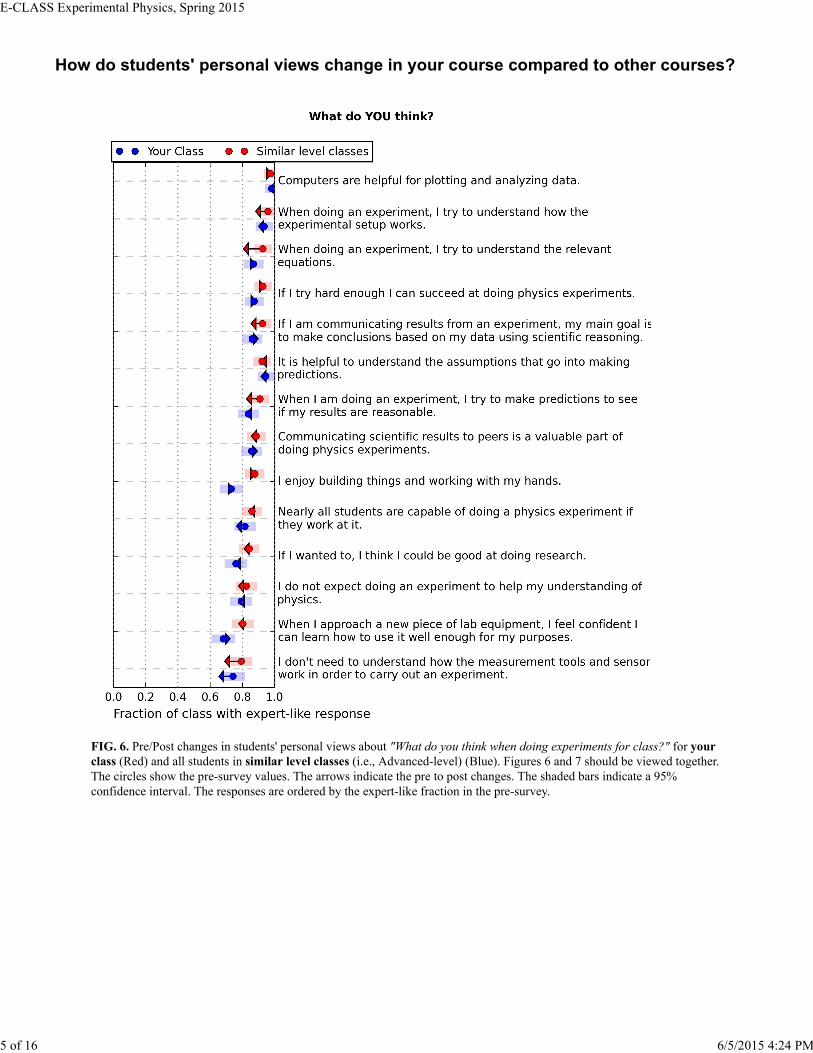
FIG. 6. Pre/Post changes in students' personal views about "What do you think when doing experiments for class?" for yourclass (Red) and all students in similar level classes (i.e., Advanced-level) (Blue). Figures 6 and 7 should be viewed together.The circles show the pre-survey values. The arrows indicate the pre to post changes. The shaded bars indicate a 95%confidence interval. The responses are ordered by the expert-like fraction in the pre-survey.
E-CLASS Experimental Physics, Spring 2015
5 of 16 6/5/2015 4:24 PM
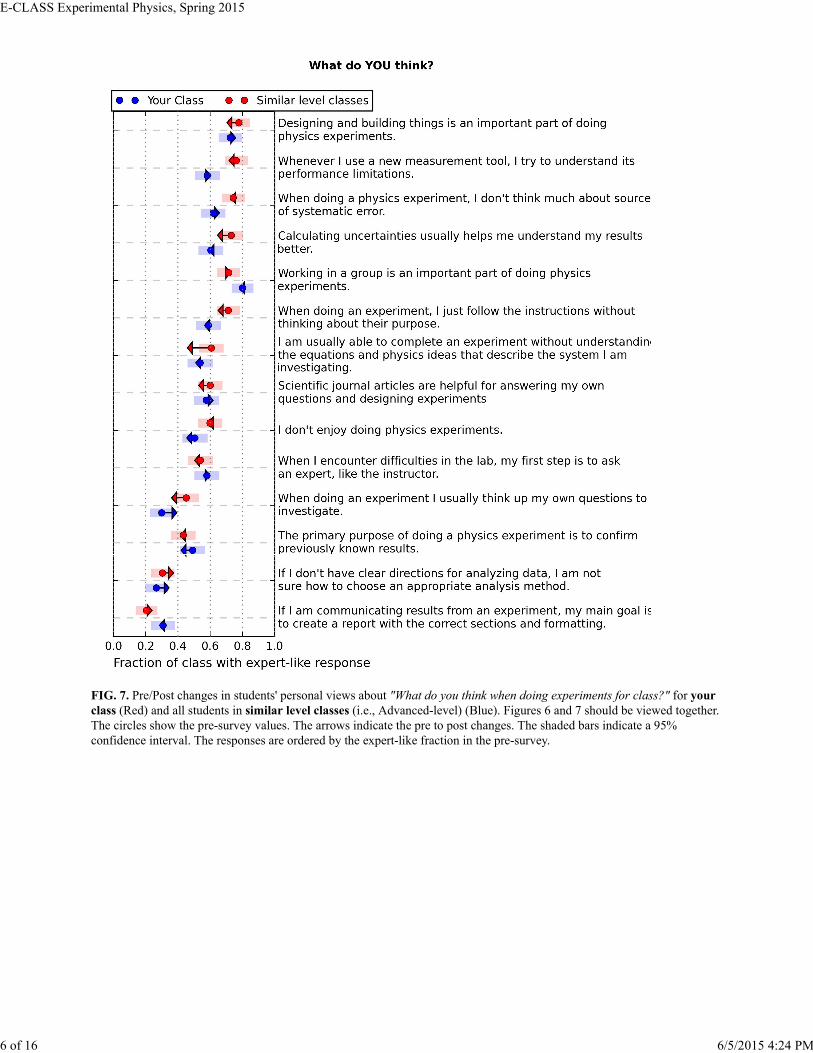
FIG. 7. Pre/Post changes in students' personal views about "What do you think when doing experiments for class?" for yourclass (Red) and all students in similar level classes (i.e., Advanced-level) (Blue). Figures 6 and 7 should be viewed together.The circles show the pre-survey values. The arrows indicate the pre to post changes. The shaded bars indicate a 95%confidence interval. The responses are ordered by the expert-like fraction in the pre-survey.
E-CLASS Experimental Physics, Spring 2015
6 of 16 6/5/2015 4:24 PM
What did students think was important for earning a good grade in your course andother similar courses?
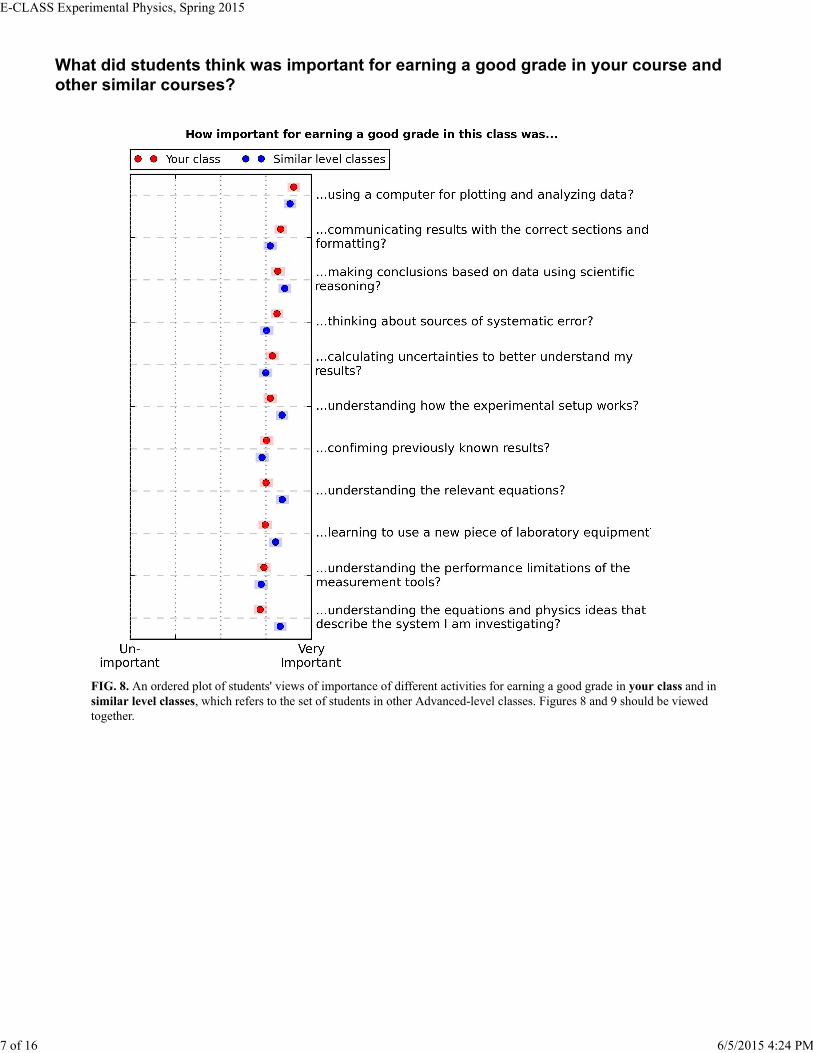
FIG. 8. An ordered plot of students' views of importance of different activities for earning a good grade in your class and insimilar level classes, which refers to the set of students in other Advanced-level classes. Figures 8 and 9 should be viewedtogether.
E-CLASS Experimental Physics, Spring 2015
7 of 16 6/5/2015 4:24 PM
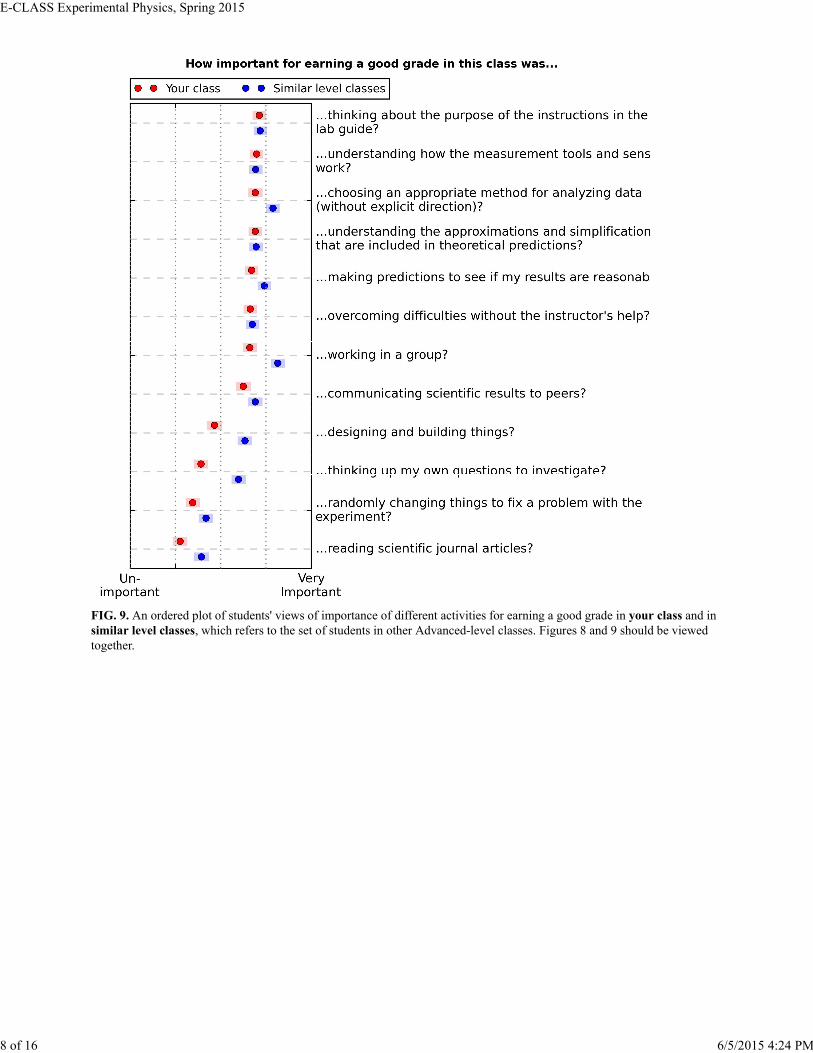
FIG. 9. An ordered plot of students' views of importance of different activities for earning a good grade in your class and insimilar level classes, which refers to the set of students in other Advanced-level classes. Figures 8 and 9 should be viewedtogether.
E-CLASS Experimental Physics, Spring 2015
8 of 16 6/5/2015 4:24 PM
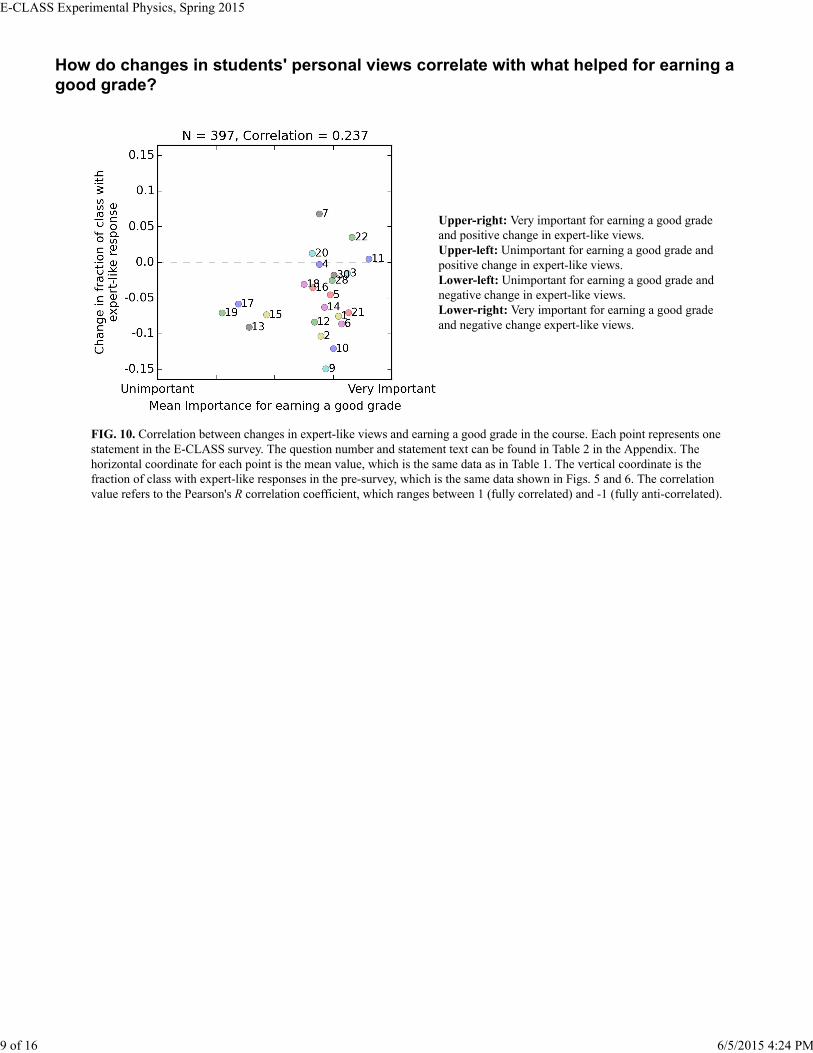
How do changes in students' personal views correlate with what helped for earning agood grade?
Upper-right: Very important for earning a good gradeand positive change in expert-like views.Upper-left: Unimportant for earning a good grade andpositive change in expert-like views.Lower-left: Unimportant for earning a good grade andnegative change in expert-like views.Lower-right: Very important for earning a good gradeand negative change expert-like views.
FIG. 10. Correlation between changes in expert-like views and earning a good grade in the course. Each point represents onestatement in the E-CLASS survey. The question number and statement text can be found in Table 2 in the Appendix. Thehorizontal coordinate for each point is the mean value, which is the same data as in Table 1. The vertical coordinate is thefraction of class with expert-like responses in the pre-survey, which is the same data shown in Figs. 5 and 6. The correlationvalue refers to the Pearson's R correlation coefficient, which ranges between 1 (fully correlated) and -1 (fully anti-correlated).
E-CLASS Experimental Physics, Spring 2015
9 of 16 6/5/2015 4:24 PM
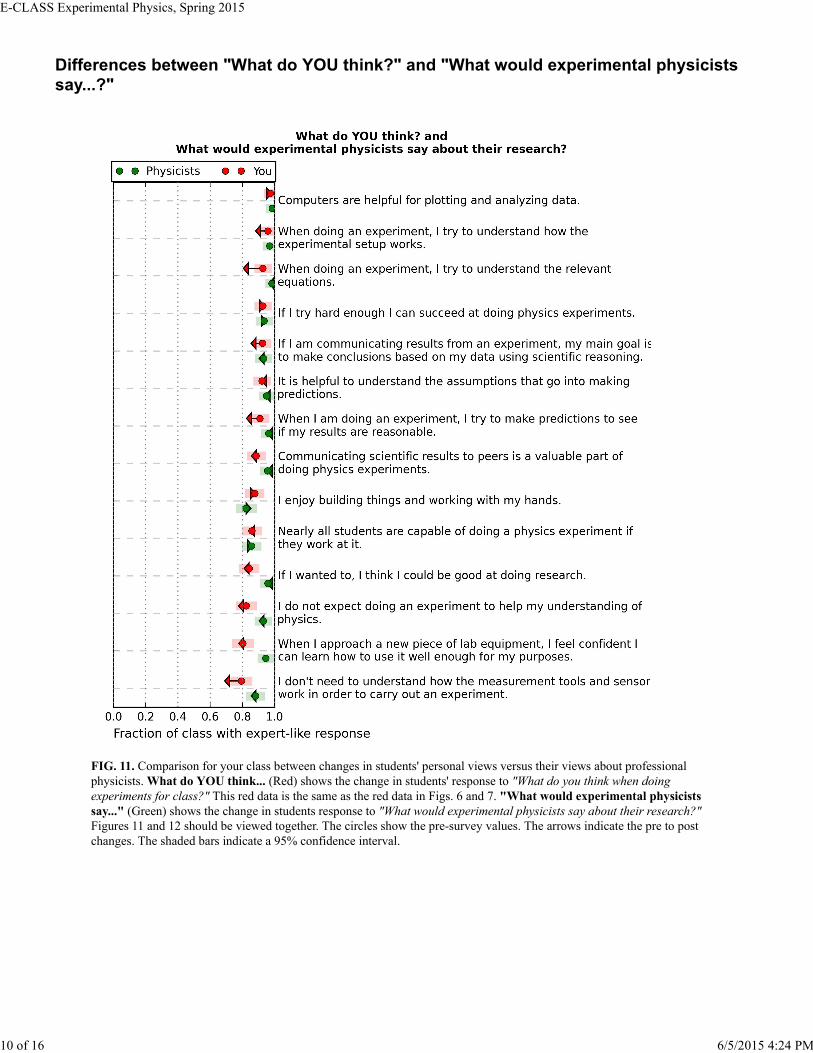
Differences between "What do YOU think?" and "What would experimental physicistssay...?"
FIG. 11. Comparison for your class between changes in students' personal views versus their views about professionalphysicists. What do YOU think... (Red) shows the change in students' response to "What do you think when doingexperiments for class?" This red data is the same as the red data in Figs. 6 and 7. "What would experimental physicistssay..." (Green) shows the change in students response to "What would experimental physicists say about their research?"Figures 11 and 12 should be viewed together. The circles show the pre-survey values. The arrows indicate the pre to postchanges. The shaded bars indicate a 95% confidence interval.
E-CLASS Experimental Physics, Spring 2015
10 of 16 6/5/2015 4:24 PM
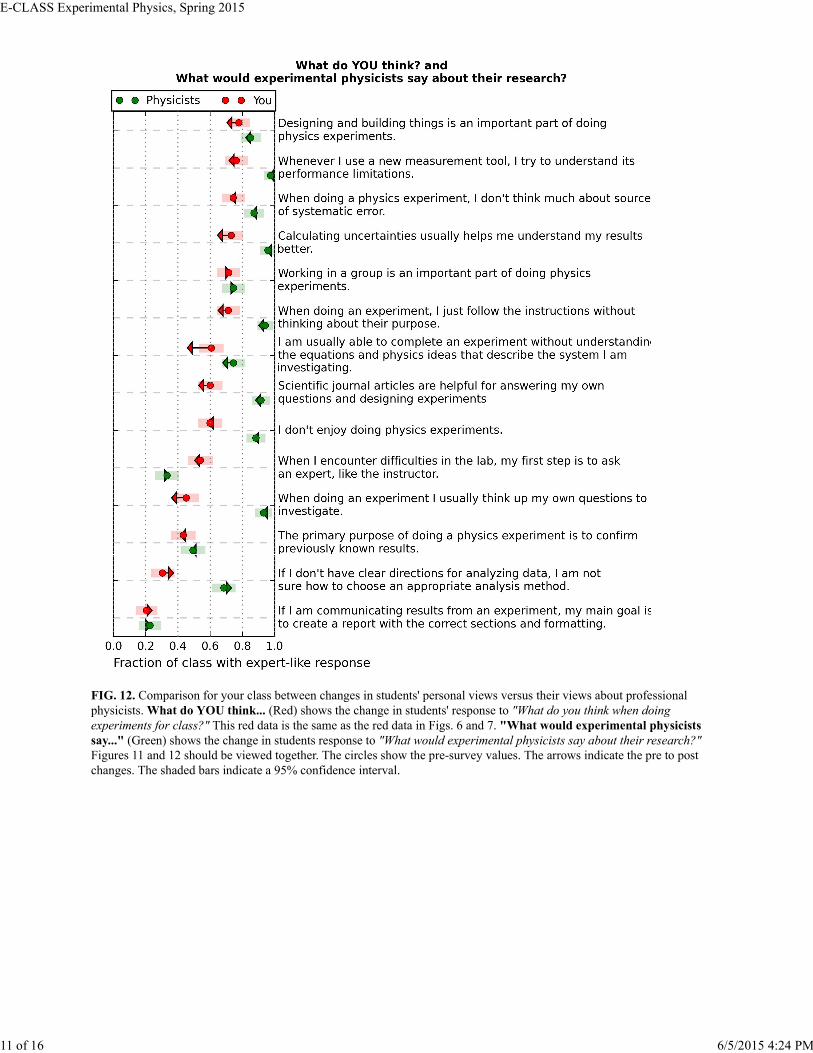
FIG. 12. Comparison for your class between changes in students' personal views versus their views about professionalphysicists. What do YOU think... (Red) shows the change in students' response to "What do you think when doingexperiments for class?" This red data is the same as the red data in Figs. 6 and 7. "What would experimental physicistssay..." (Green) shows the change in students response to "What would experimental physicists say about their research?"Figures 11 and 12 should be viewed together. The circles show the pre-survey values. The arrows indicate the pre to postchanges. The shaded bars indicate a 95% confidence interval.
E-CLASS Experimental Physics, Spring 2015
11 of 16 6/5/2015 4:24 PM
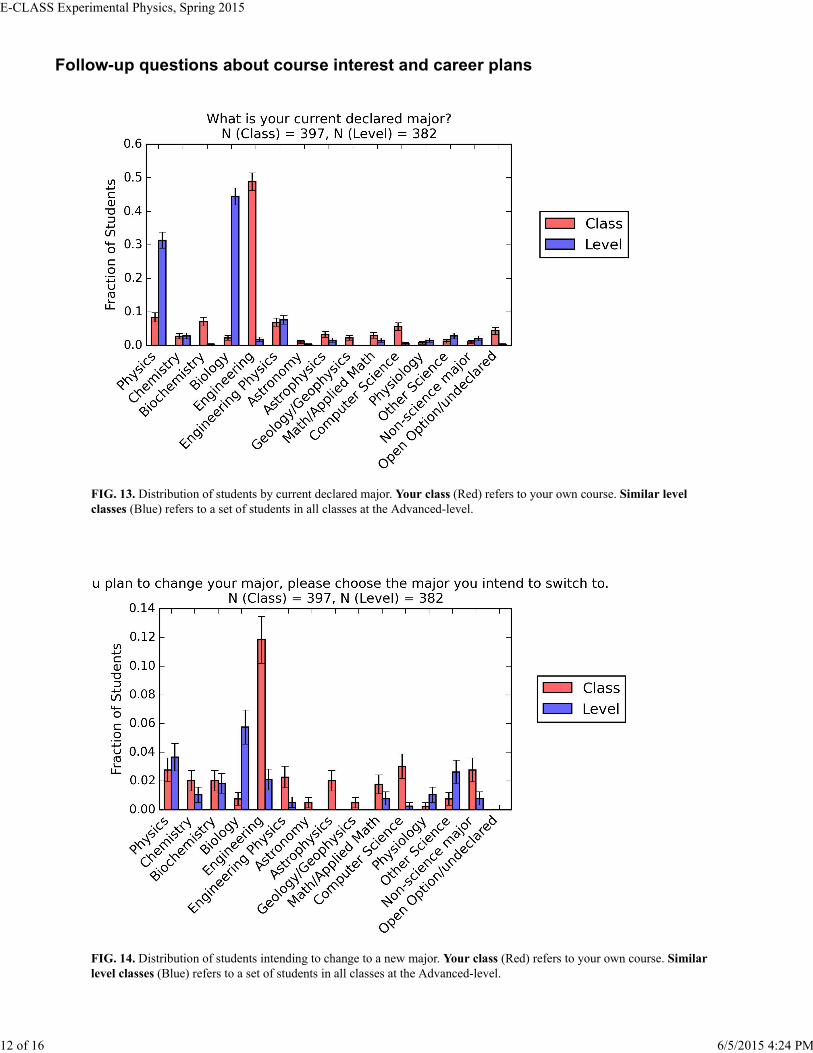
Follow-up questions about course interest and career plans
FIG. 13. Distribution of students by current declared major. Your class (Red) refers to your own course. Similar levelclasses (Blue) refers to a set of students in all classes at the Advanced-level.
FIG. 14. Distribution of students intending to change to a new major. Your class (Red) refers to your own course. Similarlevel classes (Blue) refers to a set of students in all classes at the Advanced-level.
E-CLASS Experimental Physics, Spring 2015
12 of 16 6/5/2015 4:24 PM
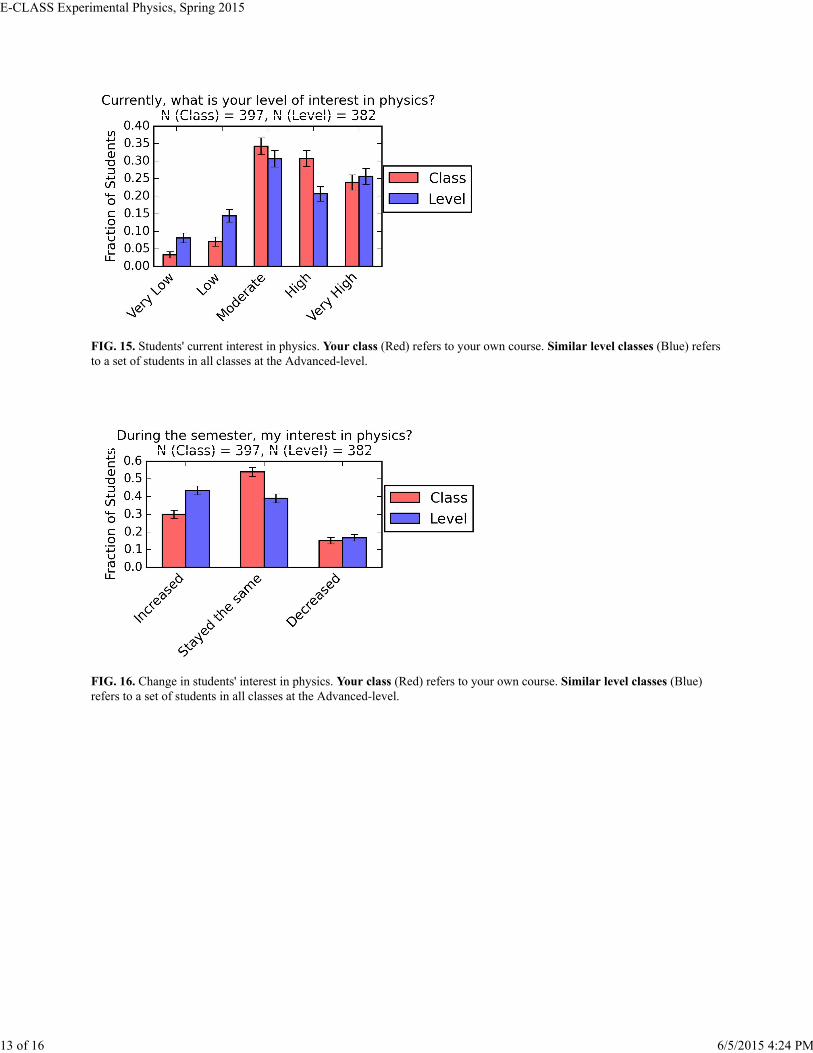
FIG. 15. Students' current interest in physics. Your class (Red) refers to your own course. Similar level classes (Blue) refersto a set of students in all classes at the Advanced-level.
FIG. 16. Change in students' interest in physics. Your class (Red) refers to your own course. Similar level classes (Blue)refers to a set of students in all classes at the Advanced-level.
E-CLASS Experimental Physics, Spring 2015
13 of 16 6/5/2015 4:24 PM
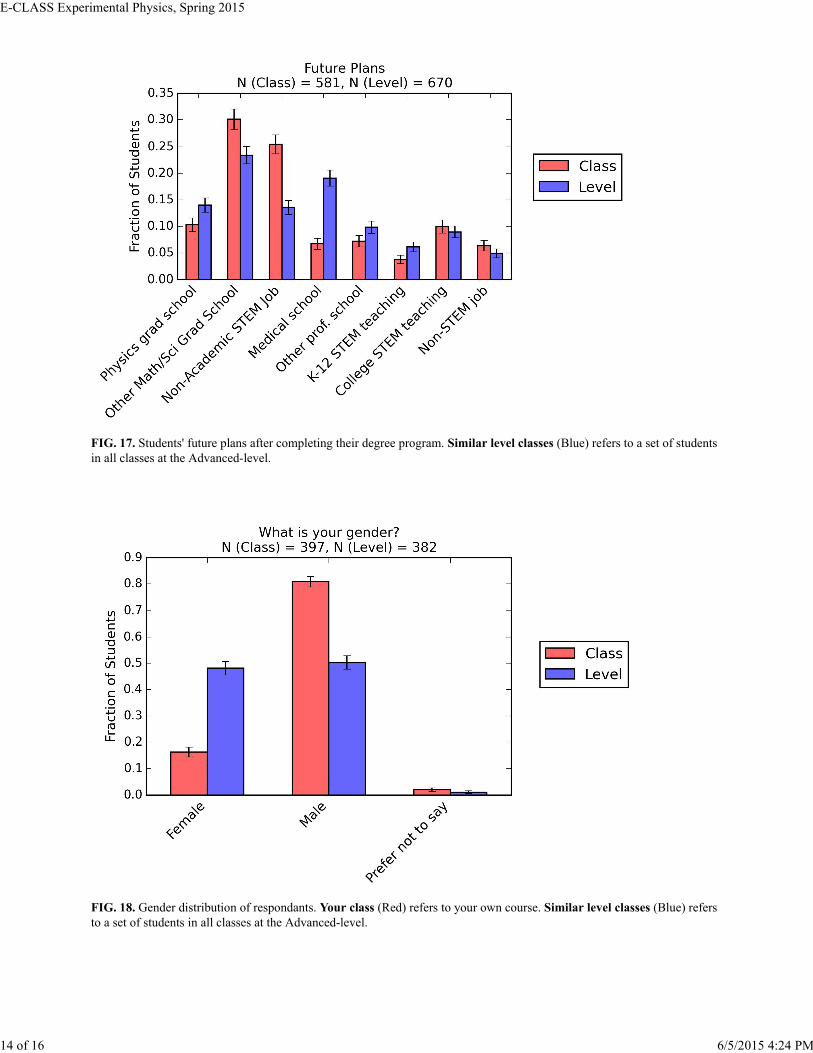
FIG. 17. Students' future plans after completing their degree program. Similar level classes (Blue) refers to a set of studentsin all classes at the Advanced-level.
FIG. 18. Gender distribution of respondants. Your class (Red) refers to your own course. Similar level classes (Blue) refersto a set of students in all classes at the Advanced-level.
E-CLASS Experimental Physics, Spring 2015
14 of 16 6/5/2015 4:24 PM
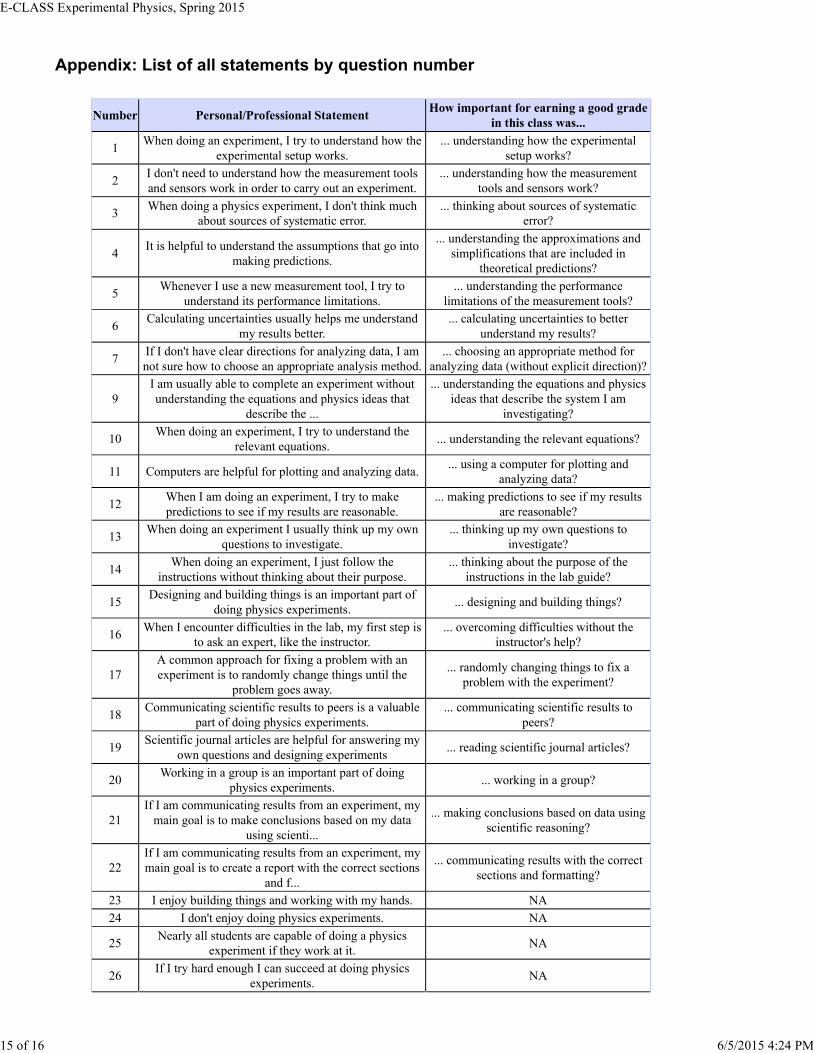
Appendix: List of all statements by question number
Number Personal/Professional StatementHow important for earning a good grade
in this class was...
1When doing an experiment, I try to understand how the
experimental setup works.... understanding how the experimental
setup works?
2I don't need to understand how the measurement toolsand sensors work in order to carry out an experiment.
... understanding how the measurementtools and sensors work?
3When doing a physics experiment, I don't think much
about sources of systematic error.... thinking about sources of systematic
error?
4It is helpful to understand the assumptions that go into
making predictions.
... understanding the approximations andsimplifications that are included in
theoretical predictions?
5Whenever I use a new measurement tool, I try to
understand its performance limitations.... understanding the performance
limitations of the measurement tools?
6Calculating uncertainties usually helps me understand
my results better.... calculating uncertainties to better
understand my results?
7If I don't have clear directions for analyzing data, I amnot sure how to choose an appropriate analysis method.
... choosing an appropriate method foranalyzing data (without explicit direction)?
9I am usually able to complete an experiment withoutunderstanding the equations and physics ideas that
describe the ...
... understanding the equations and physicsideas that describe the system I am
investigating?
10When doing an experiment, I try to understand the
relevant equations.... understanding the relevant equations?
11 Computers are helpful for plotting and analyzing data.... using a computer for plotting and
analyzing data?
12When I am doing an experiment, I try to makepredictions to see if my results are reasonable.
... making predictions to see if my resultsare reasonable?
13When doing an experiment I usually think up my own
questions to investigate.... thinking up my own questions to
investigate?
14When doing an experiment, I just follow the
instructions without thinking about their purpose.... thinking about the purpose of the
instructions in the lab guide?
15Designing and building things is an important part of
doing physics experiments.... designing and building things?
16When I encounter difficulties in the lab, my first step is
to ask an expert, like the instructor.... overcoming difficulties without the
instructor's help?
17A common approach for fixing a problem with anexperiment is to randomly change things until the
problem goes away.
... randomly changing things to fix aproblem with the experiment?
18Communicating scientific results to peers is a valuable
part of doing physics experiments.... communicating scientific results to
peers?
19Scientific journal articles are helpful for answering my
own questions and designing experiments... reading scientific journal articles?
20Working in a group is an important part of doing
physics experiments.... working in a group?
21If I am communicating results from an experiment, my
main goal is to make conclusions based on my datausing scienti...
... making conclusions based on data usingscientific reasoning?
22If I am communicating results from an experiment, mymain goal is to create a report with the correct sections
and f...
... communicating results with the correctsections and formatting?
23 I enjoy building things and working with my hands. NA
24 I don't enjoy doing physics experiments. NA
25Nearly all students are capable of doing a physics
experiment if they work at it.NA
26If I try hard enough I can succeed at doing physics
experiments.NA
E-CLASS Experimental Physics, Spring 2015
15 of 16 6/5/2015 4:24 PM
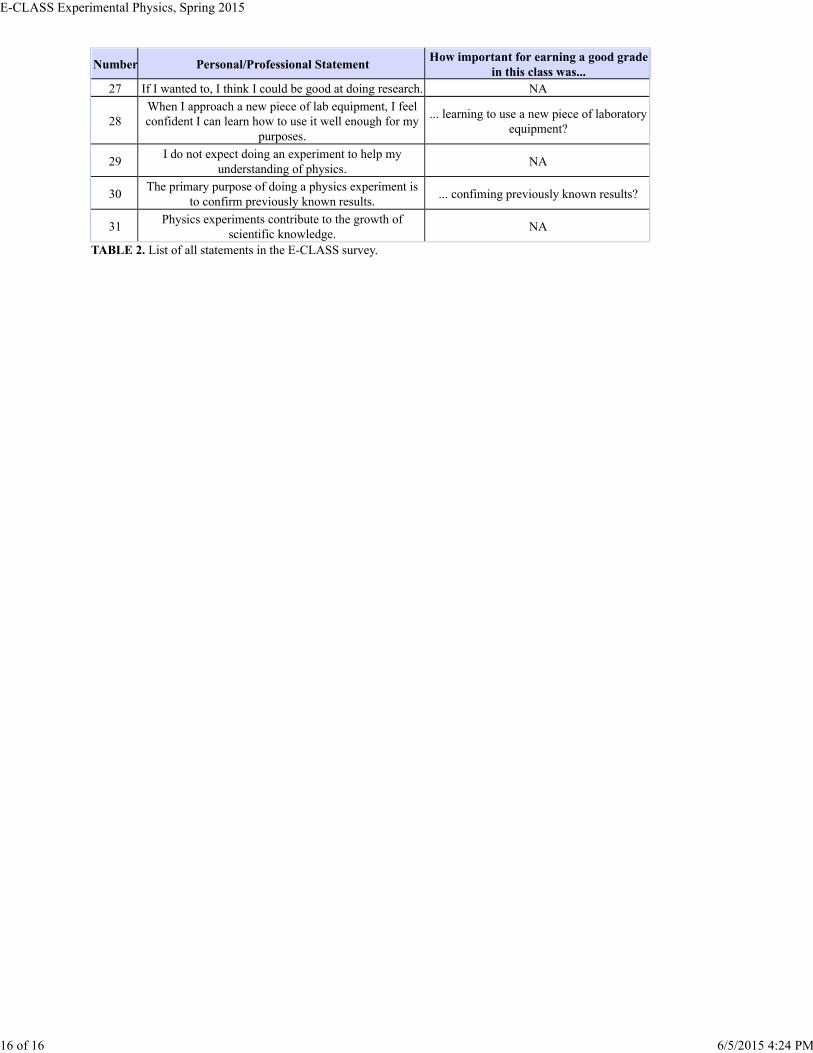
Number Personal/Professional StatementHow important for earning a good grade
in this class was...
27 If I wanted to, I think I could be good at doing research. NA
28When I approach a new piece of lab equipment, I feelconfident I can learn how to use it well enough for my
purposes.
... learning to use a new piece of laboratoryequipment?
29I do not expect doing an experiment to help my
understanding of physics.NA
30The primary purpose of doing a physics experiment is
to confirm previously known results.... confiming previously known results?
31Physics experiments contribute to the growth of
scientific knowledge.NA
TABLE 2. List of all statements in the E-CLASS survey.
E-CLASS Experimental Physics, Spring 2015
16 of 16 6/5/2015 4:24 PM