Embed Size (px)
Citation preview

Report No. CDOT-DTD-R-2005-4 Final Report COLORADO’S AXIAL LOAD TESTS ON DRILLED
SHAFTS SOCKETED IN WEAK ROCKS: SYNTHESIS
AND FUTURE NEEDS
Naser Abu-Hejleh
William J. Attwooll
September 2005 COLORADO DEPARTMENT OF TRANSPORTATION RESEARCH BRANCH
The contents of this report reflect the views of the author(s), who is (are)
responsible for the facts and accuracy of the data presented herein. The
contents do not necessarily reflect the official views of the Colorado Department
of Transportation or the Federal Highway Administration. This report does
not constitute a standard, specification, or regulation. Use of the information
contained in the report is at the sole discretion of the user.
iii
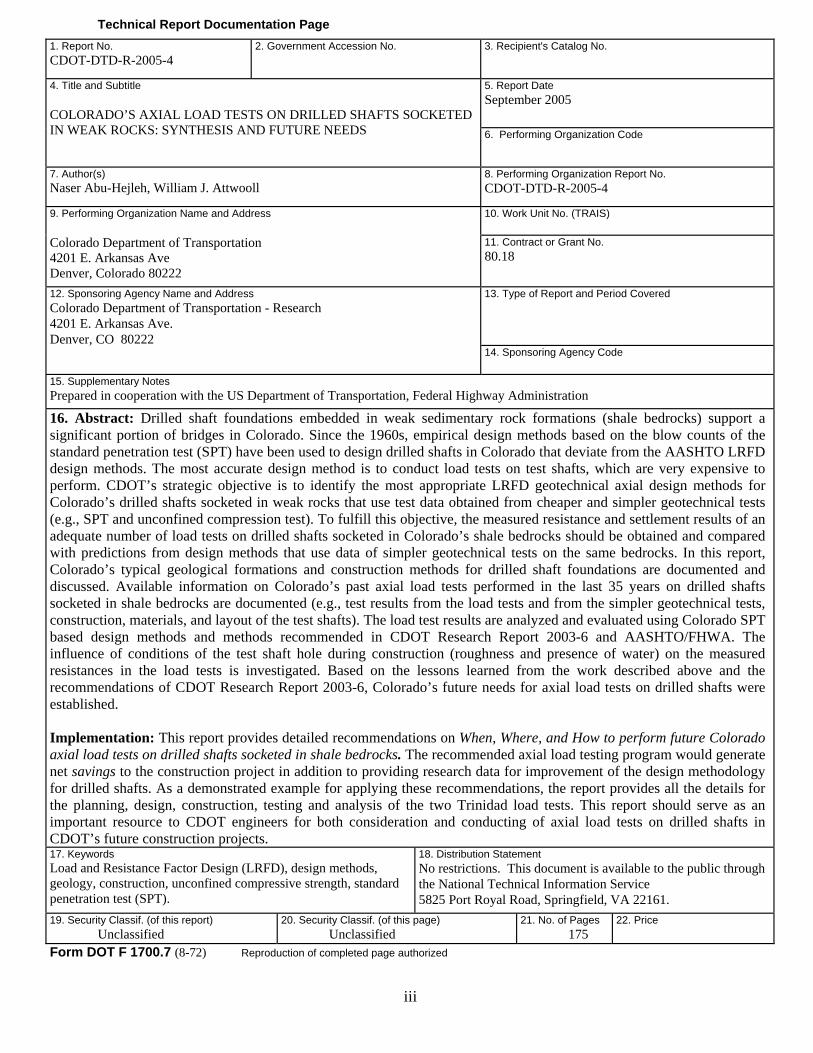
Technical Report Documentation Page 1. Report No. CDOT-DTD-R-2005-4
2. Government Accession No.
3. Recipient's Catalog No.
5. Report Date September 2005
4. Title and Subtitle COLORADO’S AXIAL LOAD TESTS ON DRILLED SHAFTS SOCKETED IN WEAK ROCKS: SYNTHESIS AND FUTURE NEEDS 6. Performing Organization Code
7. Author(s) Naser Abu-Hejleh, William J. Attwooll
8. Performing Organization Report No. CDOT-DTD-R-2005-4
10. Work Unit No. (TRAIS)
9. Performing Organization Name and Address Colorado Department of Transportation 4201 E. Arkansas Ave Denver, Colorado 80222
11. Contract or Grant No. 80.18 13. Type of Report and Period Covered
12. Sponsoring Agency Name and Address Colorado Department of Transportation - Research 4201 E. Arkansas Ave. Denver, CO 80222 14. Sponsoring Agency Code
15. Supplementary Notes Prepared in cooperation with the US Department of Transportation, Federal Highway Administration
16. Abstract: Drilled shaft foundations embedded in weak sedimentary rock formations (shale bedrocks) support a significant portion of bridges in Colorado. Since the 1960s, empirical design methods based on the blow counts of the standard penetration test (SPT) have been used to design drilled shafts in Colorado that deviate from the AASHTO LRFD design methods. The most accurate design method is to conduct load tests on test shafts, which are very expensive to perform. CDOT’s strategic objective is to identify the most appropriate LRFD geotechnical axial design methods for Colorado’s drilled shafts socketed in weak rocks that use test data obtained from cheaper and simpler geotechnical tests (e.g., SPT and unconfined compression test). To fulfill this objective, the measured resistance and settlement results of an adequate number of load tests on drilled shafts socketed in Colorado’s shale bedrocks should be obtained and compared with predictions from design methods that use data of simpler geotechnical tests on the same bedrocks. In this report, Colorado’s typical geological formations and construction methods for drilled shaft foundations are documented and discussed. Available information on Colorado’s past axial load tests performed in the last 35 years on drilled shafts socketed in shale bedrocks are documented (e.g., test results from the load tests and from the simpler geotechnical tests, construction, materials, and layout of the test shafts). The load test results are analyzed and evaluated using Colorado SPT based design methods and methods recommended in CDOT Research Report 2003-6 and AASHTO/FHWA. The influence of conditions of the test shaft hole during construction (roughness and presence of water) on the measured resistances in the load tests is investigated. Based on the lessons learned from the work described above and the recommendations of CDOT Research Report 2003-6, Colorado’s future needs for axial load tests on drilled shafts were established. Implementation: This report provides detailed recommendations on When, Where, and How to perform future Colorado axial load tests on drilled shafts socketed in shale bedrocks. The recommended axial load testing program would generate net savings to the construction project in addition to providing research data for improvement of the design methodology for drilled shafts. As a demonstrated example for applying these recommendations, the report provides all the details for the planning, design, construction, testing and analysis of the two Trinidad load tests. This report should serve as an important resource to CDOT engineers for both consideration and conducting of axial load tests on drilled shafts in CDOT’s future construction projects. 17. Keywords Load and Resistance Factor Design (LRFD), design methods, geology, construction, unconfined compressive strength, standard penetration test (SPT).
18. Distribution Statement No restrictions. This document is available to the public through the National Technical Information Service 5825 Port Royal Road, Springfield, VA 22161.
19. Security Classif. (of this report) Unclassified
20. Security Classif. (of this page) Unclassified
21. No. of Pages 175
22. Price
Form DOT F 1700.7 (8-72) Reproduction of completed page authorized
iv
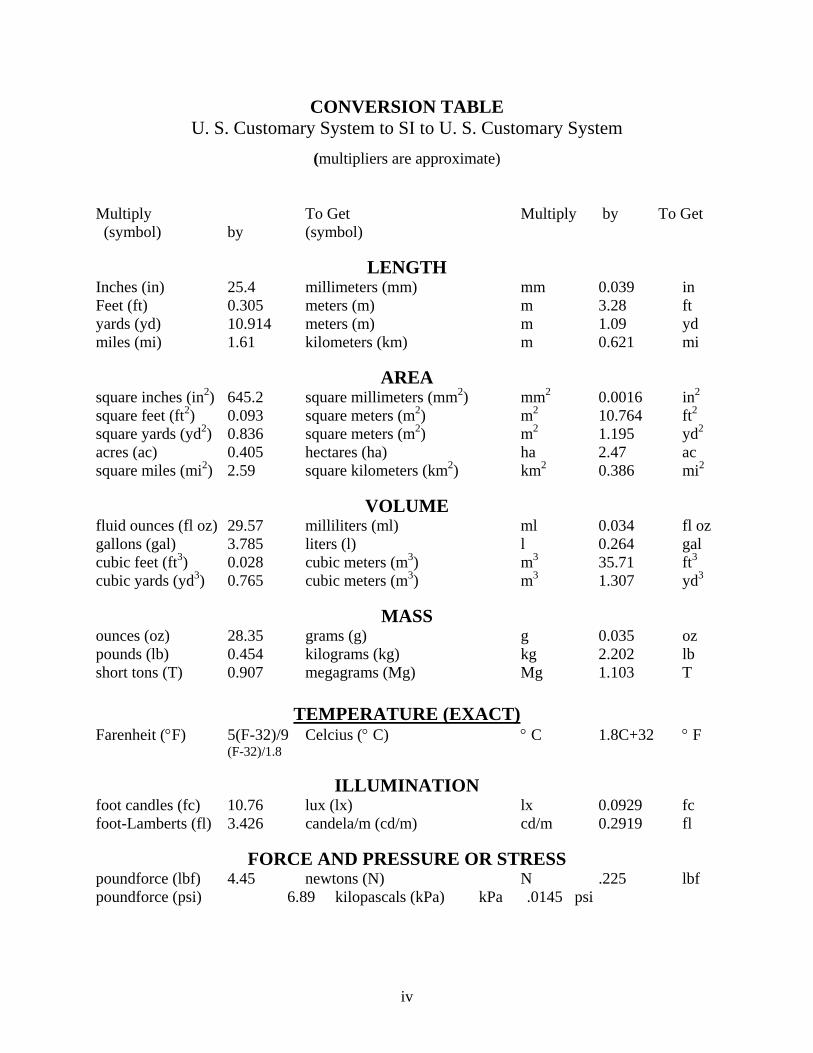
CONVERSION TABLE U. S. Customary System to SI to U. S. Customary System
(multipliers are approximate)
Multiply To Get Multiply by To Get (symbol) by (symbol)
LENGTH Inches (in) 25.4 millimeters (mm) mm 0.039 in Feet (ft) 0.305 meters (m) m 3.28 ft yards (yd) 10.914 meters (m) m 1.09 yd miles (mi) 1.61 kilometers (km) m 0.621 mi
AREA square inches (in2) 645.2 square millimeters (mm2) mm2 0.0016 in2 square feet (ft2) 0.093 square meters (m2) m2 10.764 ft2 square yards (yd2) 0.836 square meters (m2) m2 1.195 yd2 acres (ac) 0.405 hectares (ha) ha 2.47 ac square miles (mi2) 2.59 square kilometers (km2) km2 0.386 mi2
VOLUME fluid ounces (fl oz) 29.57 milliliters (ml) ml 0.034 fl oz gallons (gal) 3.785 liters (l) l 0.264 gal cubic feet (ft3) 0.028 cubic meters (m3) m3 35.71 ft3 cubic yards (yd3) 0.765 cubic meters (m3) m3 1.307 yd3
MASS ounces (oz) 28.35 grams (g) g 0.035 oz pounds (lb) 0.454 kilograms (kg) kg 2.202 lb short tons (T) 0.907 megagrams (Mg) Mg 1.103 T
TEMPERATURE (EXACT) Farenheit (°F) 5(F-32)/9 Celcius (° C) ° C 1.8C+32 ° F (F-32)/1.8
ILLUMINATION foot candles (fc) 10.76 lux (lx) lx 0.0929 fc foot-Lamberts (fl) 3.426 candela/m (cd/m) cd/m 0.2919 fl
FORCE AND PRESSURE OR STRESS poundforce (lbf) 4.45 newtons (N) N .225 lbf poundforce (psi) 6.89 kilopascals (kPa) kPa .0145 psi
v
COLORADO’S AXIAL LOAD TESTS ON DRILLED SHAFTS
SOCKETED IN WEAK ROCKS:
SYNTHESIS AND FUTURE NEEDS
by
Naser Abu-Hejleh, Colorado DOT (Research Branch) William J. Attwooll, Terracon
Report No. CDOT-DTD-R-2005-4
Sponsored by the Colorado Department of Transportation
In Cooperation with the U.S. Department of Transportation Federal Highway Administration
Colorado Department of Transportation Research Branch
4201 E. Arkansas Ave. Denver, CO 80222
(303) 757-9506
vi
ACKNOWLEDGEMENTS
The Colorado Department of Transportation and the Federal Highway Administration provided
funding for this study. Very special thanks go to John Deland from CDOT Staff Bridge and Joe
Garcia from CDOT Region 2 who managed the Trinidad load tests and provided all the support
needed for this research study on these tests. John Deland (Staff Bridge), Mark Vessely (Staff
Materials), Mahmood Hasan (Staff Materials), Matt Greer (Colorado FHWA Office), and Dennis
Hanneman (Kleinfelder, Inc.) provided an in-depth technical review of this report and valuable
comments. Their knowledge and advice kindly offered in meetings, emails and telephone
conversations were essential to the successful completion of this report. Support to this research
was provided by Trever Wang, Rich Griffin and Ahmad Ardani. Thank you all.
vii
EXECUTIVE SUMMARY Drilled shaft foundations embedded in weak sedimentary rock formations (e.g., Denver blue
claystone shale bedrock) support a significant portion of bridges in Colorado. Since the 1960s,
empirical design methods and “rules of thumb” have been used to design drilled shafts in
Colorado that deviate from the AASHTO LRFD design methods. The most accurate design
method for these shafts is to conduct load tests on test shafts, which are very expensive to
perform. CDOT’s strategic objective is to identify the most appropriate LRFD geotechnical axial
design methods for Colorado’s drilled shafts socketed in weak rocks that use test data obtained
from cheaper and simpler geotechnical tests (e.g., SPT-N value from the standard penetration
test, unconfined compressive strength, qu from the unconfined compression test or UCT). To
fulfill this objective, the measured resistance and settlement results of an adequate number of
load tests on drilled shafts socketed in Colorado’s shale bedrocks (same as weak rocks) should
be obtained and compared with predictions from design methods that use data of simpler
geotechnical tests on the same shale bedrocks. CDOT Research Report 2003-6 thoroughly
documented and analyzed the results of four Osterberg (O-Cell) load tests performed on soft to
hard to very hard and massive shale bedrocks, and outlined a long-term plan of six tasks to fulfill
the strategic objective listed above. This study was initiated to execute the following tasks in this
plan:
Compile and evaluate Colorado’s past axial load test information on drilled shafts.
Determine CDOT’s future needs for performing new axial load tests on drilled shafts.
All the acquired Colorado load test information is presented, discussed, and evaluated in
Chapters 3, 5, and Appendices A, D, and E. The following information (if available) is presented
for the load tests: construction, materials, and layout of the test shafts; geological and
geotechnical description of the foundation bedrock around and below the test shafts including the
results of SPT, UCT, and pressuremeter tests; and results of the load tests. The compiled load
tests (Table 3.1) are named after their location as: Fort Carson, 23rd Street Viaduct in Denver, I-
270/I-76, SH82 Shale Bluffs in Pitkin County, T-REX along I-25 in Denver (I-225, County Line,
and Franklin), Broadway Viaduct along I-25 in Denver, and Trinidad. The analyzed load test
results support the use of the design methods recommended in CDOT Research Report 2003-6,
and indicate that the Colorado SPT based design method for very hard shale bedrocks is very
viii
conservative (high factor of safety) and leads to factors of safety lower than 2 for the soft
claystone shale bedrocks.
The type and general locations of Colorado’s bridges are discussed in Section 2.2 of this report.
The geology of Colorado’s highways is presented in Section 2.3 and the impact of geology on
highway structure foundations is presented in Section 2.4. Tables 2.1 and 2.2 summarize the
geological formations along Interstates I-25, I-70, and I-76, and along State Highway 50. Table
3.1 lists the compiled Colorado axial load sites on drilled shafts and the names of their geological
bedrock formations. Tables 2.1 and 2.2 suggest that many of Colorado’s highways alignments
and all locations of loads tests are in the Sedimentary Cretaceous and Tertiary Formations.
Section 2.5.1 presents an overview of CDOT construction specifications and Colorado’s methods
for construction of drilled shafts. Section 2.5.3 presents recommendations to improve CDOT
construction practices for drilled shafts (cleaning, drilling and concrete placement, use of water,
slurry, and casing, wet holes, and shaft roughness). The construction methods for the test shafts
employed in the T-REX and Broadway projects are described in detail in Section 2.5.2, and for
test shafts in other locations are presented in Chapters 3 and 5, and Appendix A. Different levels
of roughness and dry and wet shaft hole conditions were encountered in the load tests.
Implementation Statement: CDOT’s Future Needs for Axial Load Tests on Drilled Shafts.
Based on the lessons learned from the work executed in this study (see Chapter 6) and the
recommendations of CDOT Research Report 2003-6, CDOT’s future needs for axial load tests
on drilled shafts were established in Chapter 6: Where, When, and How to perform future axial
load tests on drilled shafts. The recommended axial load testing program would generate net
savings to the construction project (higher resistance values and lower factor of safety) in
addition to providing research data for improvement of the design methodology for drilled shafts.
Therefore, it is important to consider the following details in performing load tests on drilled
shafts in CDOT’s future construction projects.
1. Type, Locations, and Number of Future Load Tests. The Osterberg Cell (O-Cell) method
should be considered in Colorado’s future drilled shaft load tests until more cost-effective and
ix
innovative load test methods become available. Examples of revisions to Section 503 of CDOT
Construction Specifications when O-Cell load tests are employed are presented in Appendices B
and C. It is also recommended to consider conventional load tests for low-capacity 1000 tons
production shafts. Colorado’s future load tests should be performed on shafts embedded in weak
sedimentary rocks with unconfined compressive strength (qu) up to 500 ksf. The load tests
should not be limited to any particular sedimentary geological formations because it is believed
that drilled shaft load test results in one sedimentary formation can readily be extrapolated to
another sedimentary formation of similar in situ strength and type. Future load tests in Colorado
should be drilled with augers having cutting teeth. This is the appropriate drilling method for the
weak sedimentary rocks recommended for future Colorado load tests.
No future load tests are recommended for the soil-like sandstone shale bedrocks (50<SPT-N
value< 100). No future load tests are recommended for the typical soft claystone shale bedrocks
(20<SPT-N<100) with smooth shaft holes because they will not generate any savings to the
construction project and will not lead to significant improvement in the accuracy of the
recommended design methods (see Chapter 6 for justification). Future Colorado load tests should
be considered in the following three categories of sedimentary weak rocks:
I. The firmer claystone shale bedrock (50<SPT-N<100) when shear rings are employed during
construction for artificial roughening of the shaft hole sides. Shear rings in this kind of shale
bedrock generate a measurable improvement in side shear capacity (leading to savings). A
minimum of 7 (2 for wet and 5 for dry shaft holes) new load tests are recommended for
determination of only the side resistance (not the base resistance).
II. Very hard claystone shale bedrock with SPT-N value >120 bpf (or > 50/5”) and qu< 100 ksf,
and classified as rock-like material per Colorado Testing Procedure 26-90. A minimum of 7
load test sites (2 per site) are recommended (2 for wet and 5 for dry shaft hole conditions).
III. Very hard and massive shale bedrock with qu less than 500 ksf, and SPT-N values >100 for
granular-based rock, and qu>100 ksf for clay-based rock, and classified as rock-like material
per Colorado Testing Procedure 26-90. A minimum of 5 load test sites (two tests per site) are
recommended (1 for wet and 4 for dry shaft hole conditions).
x
Two load tests are recommended per site for Categories II and III: one mainly to obtain base
resistance data and one mainly to obtain side resistance data. Recommendations for inspection of
roughening of shaft holes generated under normal drilling (expected for Categories II and III of
rocks) and under artificial roughening (for Category I) are furnished.
2. When to Perform a Load Test? Section 4.2 provides step-by- step procedures on when it is
cost-effective to consider load tests as part of the subsurface geotechnical investigation during
different stages of the project development. Four conditions should be met:
A large number of drilled shafts are required to support large bridges and with total
construction costs for all phases of the project exceeding $10,000,000 (e.g., corridor
projects).
Penetration depth of the drilled shafts is controlled by the axial loads, not the lateral loads.
The type of weak rock should be one of the three categories previously listed.
Net savings are expected based on cost-benefit analysis (described in Chapter 4).
3. How to Perform a New Load Test? Example? Chapter 4 presents comprehensive guidelines
for planning, design, and construction of new load tests, especially O-Cell load tests, and
analysis of the O-Cell load test results. These guidelines were applied in the Trinidad project.
Chapter 5 provides specific details of all the steps employed for the planning, design,
construction and analysis of the two Trinidad load tests.
xi
TABLE OF CONTENTS 1.0 INTRODUCTION ...........................................................................................................1-1
1.1 Background and Study Objectives ..............................................................................1-1
1.2 Overview and Organization of the Report ..................................................................1-3
2.0 TYPICAL GEOLOGICAL FORMATIONS AND CONSTRUCTION METHODS
FOR DRILLED SHAFT FOUNDATIONS ..................................................................2-1
2.1 Introduction ................................................................................................................2-1
2.2 Types and General Locations of Colorado's Bridges..................................................2-1
2.3 Geology of Colorado's Highways ...............................................................................2-3
2.4 Impact of Geology on Bridge Foundations.................................................................2-5
2.5 Colorado's Drilled Shaft Construction Methods .........................................................2-8
2.5.1 General ......................................................................................................................2-8
2.5.2 Examples of Construction Methods from the T-REX and Broadway Projects ......2-10
2.5.3 Recommendations for Construction of Future Dilled Shafts .................................2-11
3.0 RECORDS OF COLORADO’S AXIAL LOAD TESTS ON DRILLED SHAFTS
SOCKETED IN WEAK ROCKS ..................................................................................3-1
3.1 Overview.....................................................................................................................3-1
3.2 Trinidad Load Tests ....................................................................................................3-3
3.3 T-REX and Broadway Load Tests ..............................................................................3-3
3.3.1 Assessment of Colorado SPT Based Design Method ..............................................3-5
3.3.2 Recommended Design Methods ..............................................................................3-6
3.4 Fort Carson Load Tests ...............................................................................................3-7
3.5 The 23rd Street Viaduct Load Tests.............................................................................3-8
3.5.1 Subsurface Conditions and Strength Characteristics of the Bedrock .......................3-9
3.5.2 Test Program and Construction.................................................................................3-9
3.5.3 Test and Analysis Results .......................................................................................3-10
3.6 The I-270/I-76 Load Tests ........................................................................................3-11
3.6.1 Subsurface Conditions and Strength Characteristics of the Claystone ..................3-12
3.6.2 Construction of Test Shafts ....................................................................................3-13
3.6.3 Testing and Analysis Results ..................................................................................3-14

xii
3.7 SH 82 O-Cell Load Tests (Pitkin County) ................................................................3-15
3.7.1 Test 1 (Caisson 47 A, Shale Bluffs)........................................................................3-15
3.7.2 Test 2 (at Pier No. 2) ..............................................................................................3-16
4.0 GUIDELINES FOR CONDUCTING COLORADO'S NEW AXIAL LOAD TESTS
ON DRILLED SHAFTS ...............................................................................................4-1
4.1 Introduction ................................................................................................................4-1
4.2 Requirements for Cost-Effective Load Tests .............................................................4-3
4.2.1 Meeting the 1st and 2nd Requirements .......................................................................4-4
4.2.2 Meeting the 3rd Requirement.....................................................................................4-4
4.2.3 Meeting the 4th Requirement.....................................................................................4-5
4.2.4 Finalize the Scope of Work for the Geotechnical Investigation and Design Work 4-6
4.3 Guidelines for Planning, Design, and Construction of New Load Tests on Drilled
Shafts (Level 3 Design) ..............................................................................................4-7
4.3.1 Purpose and Promotion of Load Tests ......................................................................4-7
4.3.2 Location and Number of Load Tests.........................................................................4-7
4.3.3 Type of Test Shafts (Production or Sacrificial) ........................................................4-8
4.3.4 Type, Features, and Costs of Load Tests .................................................................4-9
4.3.5 Geotechnical Investigation around the Test Shaft ..................................................4-12
4.3.6 Design of the O-Cell Load Test .............................................................................4-13
4.3.7 Instrumentation of the Test Shafts .........................................................................4-16
4.3.8 Construction of the Test Shafts .............................................................................4-17
4.3.9 Data Collection at the Load Test Site ....................................................................4-19
4.4 Analysis of Osterberg Cell (O-Cell) Load Test Results ...........................................4-20
4.4.1 Determination of the Load Transfer Curves ...........................................................4-22
4.4.2 Definitions of Tolerable Settlement, Ultimate Unit Base Resistance, and Ultimate
Unit Side Resistance .............................................................................................4-24
4.4.3 Construction of the Equivalent Top Load-Settlement Curve from the Results of the
O-Cell Load Test ..................................................................................................4-25
4.4.3 Construction of a Simple Equivalent Top Load-Settlement Curve from the Results of
Simple Geotechnical Tests ...................................................................................4-26
xiii
5.0 TRINIDAD LOAD TESTS: EXAMPLE OF APPLICATION OF THE PROPOSED
GUIDELINES FOR CONDUCTING NEW AXIAL LOAD TESTS .........................5-1
5.1 Overview.....................................................................................................................5-1
5.2 Subsurface Conditions and Strength Characteristics of the Bedrock .........................5-1
5.3 Recommendations for Design and Construction of the O-Cell Load Tests................5-2
5.3.1 Selecting L and D for the Test Shafts .......................................................................5-3
5.3.2 Selecting the Capacity and Location of the O-Cell...................................................5-4
5.3.3 Recommendations for the Construction and Instrumentation of the O-Cell Load Tests
.....................................................................................................................................5-6
5.4 Construction of Test Shafts.........................................................................................5-7
5.5 Load Testing Results and Analysis .............................................................................5-8
5.5.1 Side Resistance..........................................................................................................5-8
5.3.2 Base Resistance.........................................................................................................5-9
5.6 Design Changes and Benefits Based on Load Test Results......................................5-12
6. SUMMARY AND CONCLUSIONS..............................................................................6-1
6.1 Overview.....................................................................................................................6-1
6.2 Summary and Evaluation of Colorado’s Records of Axial Load Tests on Drilled Shafts
.....................................................................................................................................6-3
6.2.1 Types of Load Tests ..................................................................................................6-3
6.2.2 Discussion of Colorado's Past Load Tests ................................................................6-4
6.3 Lessons Learned for Planning Future Load Tests.......................................................6-7
6.3.1 Lessons Learned from Colorado's Past Load Tests ..................................................6-7
6.3.2 Lessons Learned from the Investigation on Construction of Drilled Shafts...........6-10
6.3.4 Lessons Learned from the Investigation on Geology of Colorado’s Bedrocks ......6-14
6.4 CDOT's Future Needs for Axial Load Tests on Drilled Shafts.................................6-16
6.4.1 Type, Location, and Number of Future Load Tests ................................................6-16
6.4.2 Guidelines for Conducting and Analyzing Colorado's Future Axial Load Tests .6-20
xiv
REFERENCES...........................................................................................................................7-1
APPENDIX A: SUMMARY INFORMATION OF COLORADO'S LOAD TESTS ON
DRILLED SHAFTS.................................................................................... A-1
APPENDIX B: SAMPLE GUIDE SPECIFICATIONS FOR OSTERBERG CELL LOAD
TESTING OF DRILLED SHAFTS (By LOADTEST, Inc.)................... B-1
APPENDIX C: REVISIONS OF SECTION 503, OSTERBERG CELL LOAD TEST (from
Broadway's Construction Plans and Specifications Project).................. C-1
APPENDIX D: INFORMATION FROM PAST COLORADO LOAD TESTS (from Load
Test Reports listed in the References). ...................................................... D-1
APPENDIX E: RESULTS OF LOAD TEST INVESTIGATION IN THE TRINIDAD
PROJECT.................................................................................................... E-1
xv
LIST OF FIGURES
Figure 4.1 Photo of the O-Cell Placed in the Broadway Test Shaft ......................................4-27
Figure 4.2 Results of O-Cell Load Test at the County Line Test Shaft..................................4-28
Figure 4.3 Unit Side Resistance vs. Upward Movement for the Broadway Test Shaft..........4-28
Figure 4.4 Unit Side Resistance vs. Upward Movement in the Entire Bedrock Socket: Franklin
and Broadway Test Shafts. ...................................................................................4-29
Figure 4.5 Unit Base Resistance vs. Settlement: Franklin and Broadway Test Shafts...........4-29
Figure 4.6 Extracted Load-Settlement Curves: Franklin and Broadway Test Shafts ............ 4-30
Figure 4.7 Extracted Load-Settlement Curves: I-225 and County Line Shafts ..................... 4-30
Figure 5.1 Unit Side Resistance vs. Upward Movement in the Bedrock Socket of the Trinidad
Test Shafts.............................................................................................................5-11
Figure 5.2 Unit Base Resistance vs. Settlement for the Trinidad Test Shafts ........................5-11
xvi
LIST OF TABLES
Table 2.1 Rural Interstate Geology (I-25, I-70, and I-76) .......................................................2-6
Table 2.2 SH-50 Geology........................................................................................................2-7
Table 3.1 Summary of Colorado's Available Load Tests on Drilled Shafts............................3-2
Table 4.1 Typical Construction, Materials, and Layout Data for the Test Shafts ................4-21
Table 5.1 Results of the Trinidad Load Tests as Reported by Loadtest, Inc.(2003) ...............5-9
Table 5.2 Geotechnical Design Parameters for the Trinidad's 4 feet Diameter Drilled Shafts
before and after the O-Cell Load ..........................................................................5-12
Table 6.1 Available Load Test Information for the Types of Shale Bedrocks Recommended in
Future Load Testing..............................................................................................6-20
1-1
1 INTRODUCTION 1.1 Background and Study Objectives
Drilled shaft foundations embedded in weak rock formations (e.g., Denver blue claystone and
sandstone) support a significant portion of bridges in Colorado. Drilled shafts derive support by
embedment in these weak rocks, typically found at relatively shallow depth in Colorado. The
contribution of overburden to the drilled shaft axial capacity is often ignored. Thorough
geotechnical design of a drilled shaft requires determination of a top load-settlement curve, qmax
(ultimate unit base resistance) of the rock layer beneath the shaft, fmax (ultimate unit side
resistance) of the rock layers around the shaft, the load factor and resistance factor (φ) in the
LRFD (Load and Resistance Factor Design) method, and the factor of safety (FS) in the
allowable stress design (ASD) method.
The most accurate design method to estimate qmax, fmax, and settlements of drilled shafts is to
conduct load tests on test shafts constructed as planned in the construction project. The load tests
are expensive and therefore only considered in large projects. However, the very accurate design
information obtained from the load tests could be used: 1) to design production shafts with more
confidence (lowest FS or highest φ) and accuracy (leading to less conservative estimates of qmax,
fmax, and settlements in most cases), resulting in significant savings to the project, and 2) as
research data to improve the accuracy of simpler analytical design methods for drilled shafts that
use data of simpler geotechnical tests, mainly SPT (Standard Penetration Test), UCT
(Unconfined Compression Test), and the pressuremeter test or PMT. The in situ SPT provides
information on the driving resistance of the weak rock in term of blow counts per foot (bpf), or
N-value. The laboratory UCT is employed to determine both the unconfined compressive
strength (qu) and Young’s modulus (Ei) of intact rock cores. Due to the presence of
discontinuities (soft seams and/ or joints) in the rock mass, intact core strength and stiffness as
measured in the UCT could be larger than the rock mass strength and rock mass stiffness (Em).
Information on the RQD (Rock Quality Designation) and conditions and structures of joints are
utilized to develop reduction factors for strength and stiffness values obtained from laboratory
testing on intact cores. From the in situ pressuremeter tests on weak rocks, the stress-strain curve
1-2
and Em can be measured directly and the unconfined compressive strength can be estimated
indirectly (see Abu-Hejleh et. al., 2003 for complete details).
Since January 1, 2000, it has been the policy of Colorado Department of Transportation (CDOT)
to incorporate the new and more rational AASHTO LRFD method for the design of its
structures, including drilled shafts. Since the 1960s, empirical methods and “rules of thumb”
have been used to design drilled shafts in Colorado that are based on the blow counts of the
Standard Penetration Test (SPT) and deviate from the AASHTO LRFD Design Methods. The
margin of safety (or φ) and expected shaft settlement are unknown in these methods, both needed
to implement the AASHTO LRFD design methods. AASHTO offers design methods that are
based on the results of UCT for rocks not the results of SPT as in CDOT method. However,
AASHTO methods are developed for conditions that may be different from those encountered in
Colorado (i.e., not for the weak sedimentary rocks often encountered in Colorado). To address
all these needs and shortcomings, the CDOT’s strategic objectives for Colorado’s drilled shafts
socketed in weak rocks were identified (Abu-Hejleh et. al., 2003) as to
• Identify the most appropriate and accurate geotechnical design methods to predict the
ultimate axial resistance and settlements of Colorado’s drilled shafts socketed in weak rocks
that are based on simple and routine geotechnical tests (SPT, UCT, and PMT).
• Identify the most appropriate resistance factors (φ) needed per the LRFD for the design
methods identified in the 1st Objective.
To fulfill these objectives, the measured resistance and settlement results of an adequate number
of load tests on drilled shafts socketed in Colorado’s shale bedrocks should be obtained and
compared with predictions from design methods that use test data of simpler and more common
geotechnical tests (SPT, UCT, and PMT) on the same shale bedrocks. CDOT Research Report
2003-6 (Abu-Hejleh et. al., 2003), titled “Improvement of the Geotechnical Axial Design
Methodology for Colorado’s Drilled Shafts Socketed in Weak Rocks,” thoroughly documented
and analyzed the results of four O-Cell load tests performed in 2002 as part of the T-REX and
Broadway Viaduct projects. The bedrock at the load test sites represents the range of typical
claystone and sandstone (soft to very hard) encountered in Denver. To maximize the benefits of
1-3
this work, the O-Cell load test results, information on the construction and materials of the test
shafts, and geology of bedrock were documented, and an extensive subsurface geotechnical
investigation was performed on the weak rock at the load test sites. This included the SPT,
strength tests, and pressuremeter tests. The analysis of all test data and information and
experience gained in this study were employed to provide: 1) best correlation equations between
results of various common geotechnical tests (SPT, UCT, and PMT), 2) best-fit design equations
to predict the shaft ultimate unit base and side resistance values, and the load-settlement curve as
a function of the results of common geotechnical tests, and 3) assessment of the CDOT and
AASHTO design methods.
CDOT Research Report 2003-6 also outlined a long-term plan with six tasks to fulfill the
strategic objectives listed above. This study was initiated to execute the following tasks in this
plan:
Compile and evaluate all available Colorado’s past and reliable axial load test information.
Determine CDOT’s future needs for performing new axial load tests on drilled shafts in
CDOT future construction projects.
1.2 Overview and Organization of the Report
The types and general locations of Colorado’s bridges are discussed in Section 2.2. Colorado’s
typical geological formations and construction methods for drilled shaft foundations are
presented in Chapter 2. The Geology of Colorado’s highways is presented in Section 2.3 and the
impact of geology on highway structure foundations is presented in Section 2.4. Tables 2.1 and
2.2 summarize the geological formations along Interstates I-25, I-70, and I-76, and along State
Highway 50. Section 2.5.1 presents an overview of CDOT construction specifications and
Colorado’s methods for construction of drilled shafts. Section 2.5.3 presents recommendations to
improve this practice. The Construction methods for the test shafts employed in the T-REX and
Broadway projects are described in detail in Section 2.5.2.
All the acquired Colorado load test information is presented, discussed, and evaluated in
Chapters 3, 5, and Appendices A, D, and E. The following information (if available) is presented
1-4
for the load tests: construction, materials, and layout of the test shafts; geological and
geotechnical description of the foundation bedrock around and below the test shafts including
the results of SPT, UCT, and PMT; and results of the load tests. The compiled load tests (Table
3.1) are named after their location as: Fort Carson, 23rd Street Viaduct in Denver, I-270/I-76,
SH82 Shale Bluffs in Pitkin County, T-REX along I-25 in Denver (I-225, County Line, and
Franklin), Broadway Viaduct along I-25 in Denver, and Trinidad. Some reported information
(e.g., results of load tests and of the geotechnical investigation) in the Testing Reports are
furnished in Appendix D for the 23rd Street, I-270/I-76 and SH82 Shale load tests, and in
Appendix E for the Trinidad load test. Load tests that have most of the information needed for
analysis and evaluation are summarized in seven tables in Appendix A.
Chapter 4 presents comprehensive guidelines for planning, design, and construction of new load
tests, and analysis of the Osterberg Cell (O-Cell) load test results. Sample Guide Specifications
for Osterberg Cell Load Testing of Drilled Shafts are presented in Appendix B. Revision of
Section 503 of CDOT Standard Specifications to incorporate the Osterberg Cell Load Test in the
Broadway construction project is presented in Appendix C. Section 4.2 provide step by step
procedures on when it is cost-effective to consider load tests as part of the subsurface
geotechnical investigation during different stages of the project development. The recommended
guidelines were applied in the Trinidad project. Chapter 5 provides specific details of all the
steps employed for the planning, design, construction and analysis of the two Trinidad two load
tests.
Chapter 6 provides a brief summary of all work performed in this study and the lessons learned
for future planning of Colorado’s axial load tests shale socketed in weak rocks from:
• Colorado’s past load tests.
• Investigation on the construction methods and observations for Colorado’s load test
shafts.
• Investigation on the geology of Colorado’s bedrock formations.
Based on these lessons and recommendations of CDOT Research Report 2003-6, CDOT’s future
1-5
needs for axial load tests on drilled shafts are also presented in Chapter 6: Where, When, and
How to perform future axial load tests on drilled shafts. Future Colorado load tests should be
considered in three categories of sedimentary weak rocks that are presented in Chapter 6.
Available load tests information on these three categories of weak rocks are identified and
ranked. All details required to conduct future load tests in these three types of weak rocks are
presented, including the minimum number of load tests.
2-1
2. TYPICAL GEOLOGICAL FORMATIONS AND CONSTRUCTION METHODS FOR DRILLED SHAFT FOUNDATIONS
2.1 Introduction
The following information, needed for planning of future load tests in Colorado, is summarized
in this chapter:
1. Types and general locations of Colorado’s Bridges.
2. Geology of Colorado’s Highways and impact of geology on bridge foundations.
3. An overview of Colorado’s methods for construction of drilled shafts and
recommendations to improve this practice. Examples of construction procedures
employed in the T-REX and Broadway projects are also presented.
The geological bedrock formations and construction methods for the compiled Colorado’s axial
load tests on drilled shafts are presented in subsequent chapters and appendices. The study
findings and recommendations for consideration of the geology and construction factors in the
planning of future axial load tests on drilled shafts are presented in Chapter 6.
2.2 Types and General Locations of Colorado’s Bridges
Bridges are found on virtually all Colorado State Highways. Most of the bridges on 2-lane rural
highways are at drainage crossings, with most having relatively small span lengths. Larger
bridges are found at railroad and river crossings and on divided highways. The most numerous
and largest bridges are associated with limited access highways (interstates/freeways), especially
at interchanges. Thus, in terms of Colorado highways, the greatest number of large bridges will
be associated with limited-access highway corridor improvement projects.
Drilled shafts extending into soft to firm to very hard claystone/sandstone bedrock often provide
bridge support. Drilled shafts are used to support bridge piers and abutments. When a suitable
bearing layer is at modest depth, drilled shafts are usually the most economical deep foundation
for support of bridge piers. Drilled shafts can also be used for abutment support. However,
2-2
driven H-Piles are often used for abutment support, especially for integral decks and abutments
where abutment flexibility is desirable.
Drilled shafts are also used as earth retention structures. However, in these applications, drilled
shafts are used predominantly for their lateral support capability. Significant axial loads are
usually not associated with earth retention structure applications.
The main Colorado highway corridors connect the principal cities/population centers, and tend to
follow geographic features such as rivers and mountain passes. Examples of the rural Interstate
Highways are as follows:
• I-25 extends from New Mexico to Wyoming at the foot of the Front Range of the Rocky
Mountains. Much of the way, the highway alignment is within a few miles of the
boundary between the Great Plains and the Rocky Mountain Physiographic Provinces.
Along the way, portions of the I-25 alignment are controlled by rivers and streams such
as Fountain Creek, Monument Creek, Plum Creek, and The South Platte River, as well as
Monument Pass.
• The alignment of I-70 from Denver to Grand Junction is controlled by mountain passes,
rivers and streams. The mountain passes are Loveland Pass (the Eisenhower Tunnel) and
Vail Pass. East of the Eisenhower Tunnel, which is at the Continental Divide, the
highway parallels Clear Creek. Between the Eisenhower Tunnel and Vail Pass, the
highway parallels Short Creek and Ten Mile Creek. West of Vail Pass the highway
parallels the Colorado River and its tributaries, Vail Creek and the Eagle River all the
way to the Utah border.
• I-76 from Denver to Ft. Morgan to Julesburg by the South Platte River.
Other major highways are also controlled by geographic features. Examples include:
• SH-50 from Monarch Pass to Holly by the Arkansas River and its tributaries.
• Virtually all highways through the Front Range, Sangre de Cristo Mountains, the Gore
Range, West Elk Mountains, the San Juan Mountains, etc. are controlled by mountain
passes and stream/river valleys.
2-3
2.3 Geology of Colorado’s Highways
Drilled shafts are used for support of highway bridge structures throughout Colorado. Geologic
conditions in which drilled shafts are used vary from alluvium and weak formational materials to
very hard sedimentary, metamorphic and igneous rocks. Table 2.1 and 2.2 summarize the
geological formations along Interstates I-25, I-70, and I-76, and along State Highway 50. SH-50
was selected because it is representative of many Colorado Highways as it crosses the center of
the State from Utah to Kansas, including valleys in the west, the Rocky Mountains, and the
Eastern Plains. The feasibility of using drilled shafts in these formations is also presented in
these tables. Hard rock is typically found in the igneous/metamorphic cores of the principal
ranges. However, even these rocks can be highly variable, especially in the volcanic rock in the
San Juan Mountains.
As highways extend away from mountain passes, they usually parallel mountain streams and
rivers. If the highway follows the valley floor, the alignment is likely to be underlain by alluvium
extending to bedrock. Where the highways bypass the valley floors, they often are cut into the
generally hard rock. On the flanks of the mountains and in broad intermountain valleys, the
highways leave the hard mountain cores and extend over softer sedimentary bedrock. East of the
Front Range virtually all of Eastern Colorado is underlain by sedimentary bedrock. Sedimentary
bedrock is not a unique material. It can range from very hard, cliff-forming sandstones and
conglomerates to very soft shale.
While highways must traverse whatever rock type is along the way, highways tend to follow
locations with gentle slopes. These locations are often underlain by softer sedimentary geologic
formations such as shale. Examples are the Pierre Shale that underlies I-25 in Trinidad, from
south of Pueblo to Colorado Springs, and north of Denver; and the Mancos Shale that underlies
SH-82 in the Roaring Fork Valley, I-70 west of Glenwood Springs, and SH-160 west of
Durango. Some of the major rivers have deeply incised into the underlying bedrock, with the
incised channels backfilled with alluvium. These conditions exist along the South Platte River
northeast of Denver and have impacted structures along SH-85, I-76, and where other state
2-4
highways cross the river. In addition, the Colorado River is locally deeply incised, which has
influenced highway structure foundations in Glenwood Springs, for example.
Based on the above and information listed in Tables 2.1 and 2.2., it can be concluded that most
of Colorado’s shafts (existing and future) are underlain by Late Cretaceous age sedimentary
rock formations that in many locations have engineering properties of “weak rock.” Drilled
shafts derive support by embedment in these weak rocks, typically found at relatively shallow
depth. These sedimentary formations consist of weakly cemented claystone, siltstone, sandstone,
and interbedded sandstone/claystone, with composition consisting of varying amounts of fine-
grained to very coarse-grained sediments. Three prevalent geologic formations for the weak
rocks in Colorado are the Pierre and Denver Formations (Turner et al., 1993) and the Mancos
formations. Abu-Hejleh et. al. (2003) provided a geotechnical and geological description of
bedrock formations likely to be encountered in the Denver metropolitan area (e.g., Pierre and
Denver Formations) and other populated areas along the Front Range Urban Corridor in
Colorado. The Mancos Shale (not described by Abu-Hejleh et. al., 2003) underlies large portions
of Western Colorado, especially in the broad river valleys. The Mancos Shale is a very thick,
claystone/shale dominant formation. The bedrock units are usually dark grey to black, and
almost always suspect for moderately to very high swell potential, medium to high plasticity, and
low slope stability. There are numerous landslides in Western Colorado on slopes underlain by
the Mancos Formation. There are occasional sandstone beds within the clay shale, and one
significant sandstone member, the Ferrin Sandstone, within the Formation. Where the Mancos
Formation is exposed at the surface, such as immediately north of Grand Junction, and in the
Gunnison River Valley between Montrose and Grand Junction, there is often very little
vegetation and the ground has a “bad lands” appearance. The Mancos formation is generally
equivalent to the Pierre Formation found in the eastern part of Colorado. Both were deposited in
the Cretaceous Sea. However, the base of the Mancos rests directly on the Dakota Formation,
whereas the Pierre is separated from the Dakota by the Colorado Group and the Niobrara
Formations. Both are overlain by sandstones; the Mancos by the Mesaverde Formation, and the
Pierre by the Fox Hills Sandstone.
2-5
2.4 Impact of Geology on Bridge Foundations
The local geology at a bridge site will largely determine the bridge foundation type. For
example, where sound rock is found at foundation level, deep foundations may not be needed.
Conversely, where roadways parallel mountain streams, bridges are often supported on deep
foundations extending through alluvium to underlying bedrock.
Where bridges are founded over deep alluvium, the foundation type will depend on local
conditions and structural design requirements. Several different bridges are illustrative of these
conditions.
• The new bridge over the Colorado River at West Glenwood is founded on piles driven
into very dense bouldery alluvium. It would not have been practical to attempt to drill
shafts into the very hard cobbles and boulders.
• Where SH-39 crosses the South Platte River near Goodrich, there was almost 100 feet of
alluvium over bedrock. Because of the nature of the alluvium and the bridge structural
requirements, the bridge was supported on drilled shafts. Experience during bridge
construction suggests that this depth to bedrock may be a practical limit to drilled shaft
construction using normally available construction equipment.
• Where SH-71 crosses the South Platte River near Snyder, about 200 feet of alluvium
overlie bedrock. Drilled shafts were not practical at this location. Rather, the bridge was
supported on driven piles.
The variability of sedimentary rock requires that site-specific investigations be performed to
assess local conditions and appropriate foundation types. For example, high capacity drilled
shafts can be used to support bridges in the harder Denver Blue Formation. Even deep
foundations would not be necessary if shallow sound sedimentary rock exists at foundation level.
However, elsewhere the Denver Formation may be highly weathered and not much better than
hard clay, limiting drilled shaft capacities. According to Jubenville and Hepworth (1981), the
range of unconfined compressive strength for the Denver Formation is from 6 ksf (very stiff clay
soils) to more than 60 ksf (very low strength rock), and shear strengths are higher in the “blue”
claystone that underlies downtown Denver. Abu-Hejleh (3) reported unconfined compressive
2-6
strengths greater than 300 ksf for rocks in the Denver formation and greater than 400 ksf for
rocks in the Pierre formations. Significant variability was also noticed in the Mancos Shale as
will be discussed next chapter based on the reported load test results for the SH-82 project.
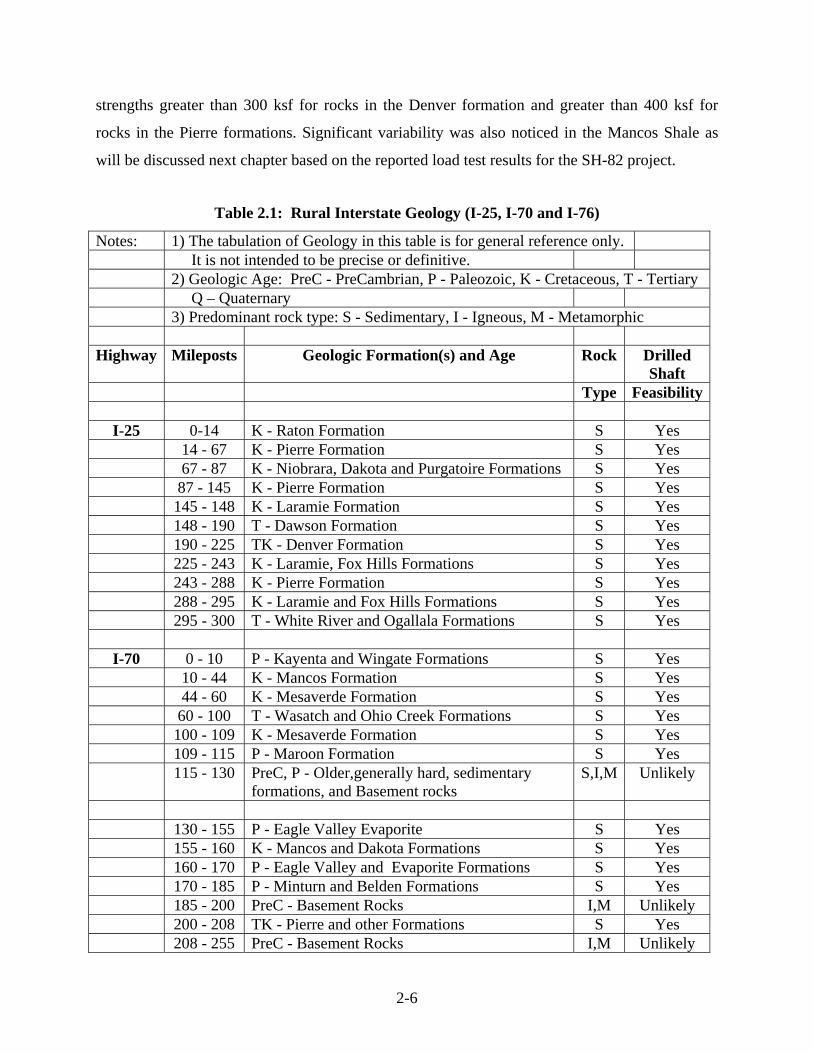
Table 2.1: Rural Interstate Geology (I-25, I-70 and I-76)
Notes: 1) The tabulation of Geology in this table is for general reference only. It is not intended to be precise or definitive. 2) Geologic Age: PreC - PreCambrian, P - Paleozoic, K - Cretaceous, T - Tertiary Q – Quaternary 3) Predominant rock type: S - Sedimentary, I - Igneous, M - Metamorphic Highway Mileposts Geologic Formation(s) and Age Rock Drilled
Shaft Type Feasibility
I-25 0-14 K - Raton Formation S Yes 14 - 67 K - Pierre Formation S Yes 67 - 87 K - Niobrara, Dakota and Purgatoire Formations S Yes 87 - 145 K - Pierre Formation S Yes 145 - 148 K - Laramie Formation S Yes 148 - 190 T - Dawson Formation S Yes 190 - 225 TK - Denver Formation S Yes 225 - 243 K - Laramie, Fox Hills Formations S Yes 243 - 288 K - Pierre Formation S Yes 288 - 295 K - Laramie and Fox Hills Formations S Yes 295 - 300 T - White River and Ogallala Formations S Yes
I-70 0 - 10 P - Kayenta and Wingate Formations S Yes 10 - 44 K - Mancos Formation S Yes 44 - 60 K - Mesaverde Formation S Yes 60 - 100 T - Wasatch and Ohio Creek Formations S Yes 100 - 109 K - Mesaverde Formation S Yes 109 - 115 P - Maroon Formation S Yes 115 - 130 PreC, P - Older,generally hard, sedimentary
formations, and Basement rocks S,I,M Unlikely
130 - 155 P - Eagle Valley Evaporite S Yes 155 - 160 K - Mancos and Dakota Formations S Yes 160 - 170 P - Eagle Valley and Evaporite Formations S Yes 170 - 185 P - Minturn and Belden Formations S Yes 185 - 200 PreC - Basement Rocks I,M Unlikely 200 - 208 TK - Pierre and other Formations S Yes 208 - 255 PreC - Basement Rocks I,M Unlikely
2-7
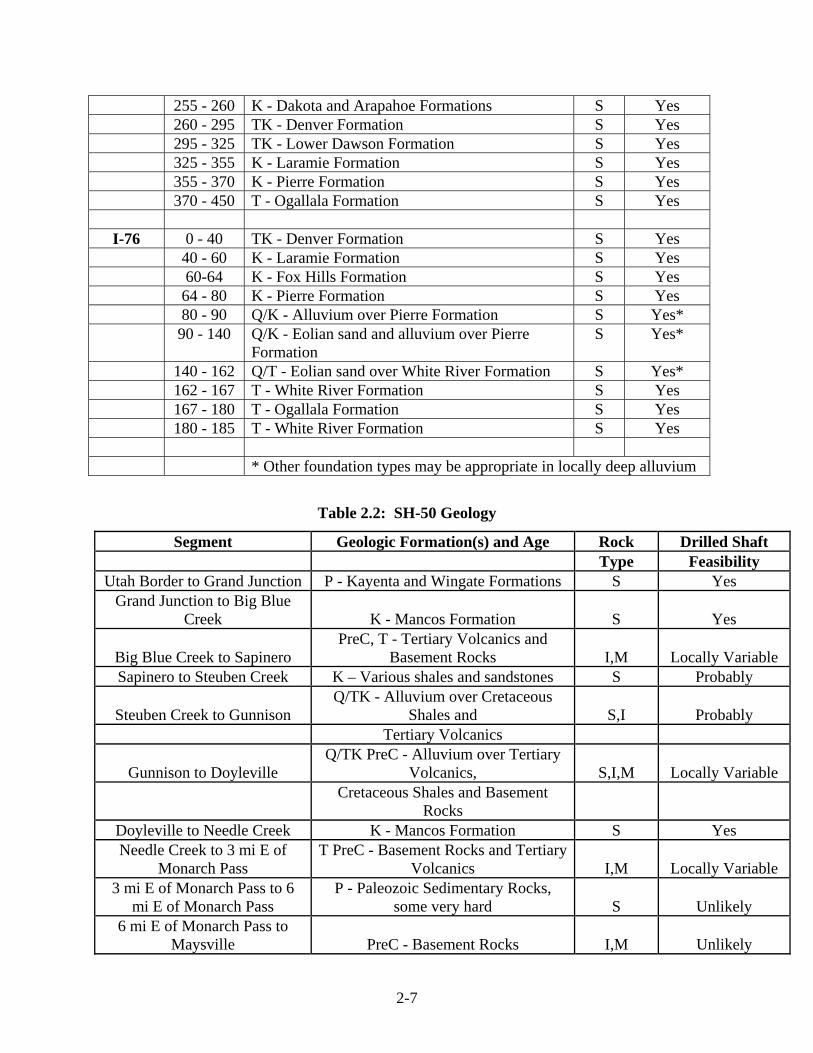
255 - 260 K - Dakota and Arapahoe Formations S Yes 260 - 295 TK - Denver Formation S Yes 295 - 325 TK - Lower Dawson Formation S Yes 325 - 355 K - Laramie Formation S Yes 355 - 370 K - Pierre Formation S Yes 370 - 450 T - Ogallala Formation S Yes
I-76 0 - 40 TK - Denver Formation S Yes 40 - 60 K - Laramie Formation S Yes 60-64 K - Fox Hills Formation S Yes 64 - 80 K - Pierre Formation S Yes 80 - 90 Q/K - Alluvium over Pierre Formation S Yes* 90 - 140 Q/K - Eolian sand and alluvium over Pierre
Formation S Yes*
140 - 162 Q/T - Eolian sand over White River Formation S Yes* 162 - 167 T - White River Formation S Yes 167 - 180 T - Ogallala Formation S Yes 180 - 185 T - White River Formation S Yes * Other foundation types may be appropriate in locally deep alluvium
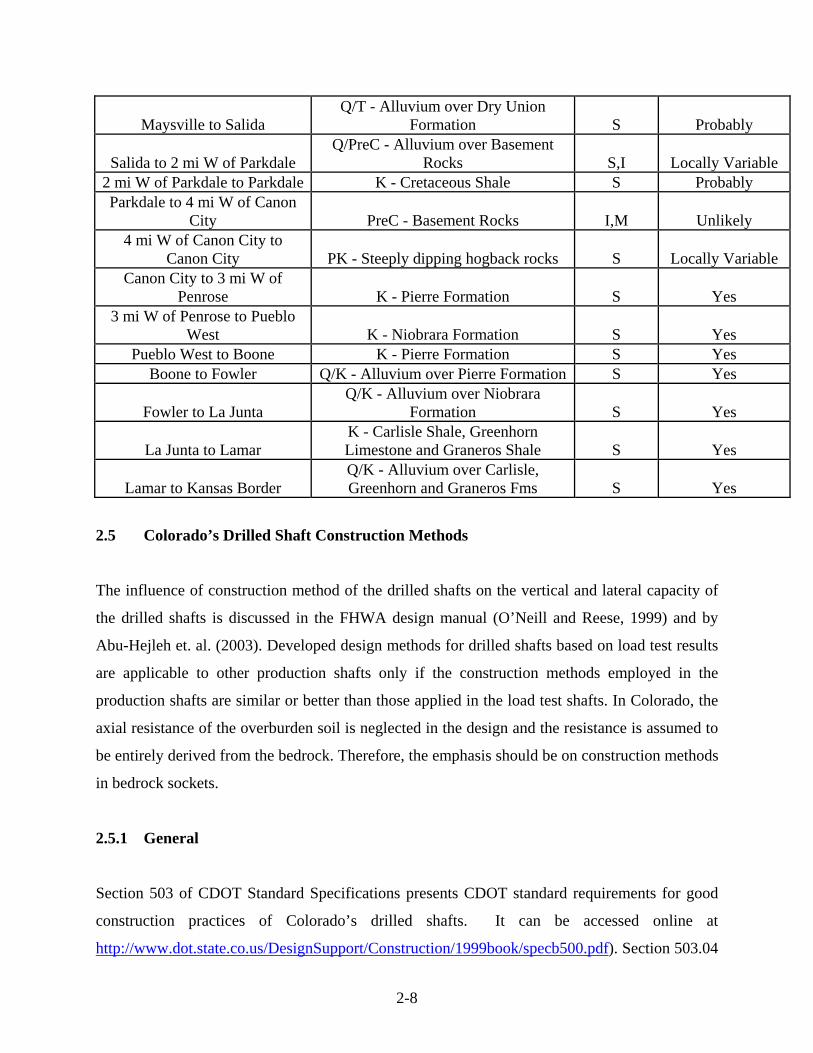
Table 2.2: SH-50 Geology
Segment Geologic Formation(s) and Age Rock Drilled Shaft Type Feasibility
Utah Border to Grand Junction P - Kayenta and Wingate Formations S Yes Grand Junction to Big Blue
Creek K - Mancos Formation S Yes
Big Blue Creek to Sapinero PreC, T - Tertiary Volcanics and
Basement Rocks I,M Locally Variable Sapinero to Steuben Creek K – Various shales and sandstones S Probably
Steuben Creek to Gunnison Q/TK - Alluvium over Cretaceous
Shales and S,I Probably Tertiary Volcanics
Gunnison to Doyleville Q/TK PreC - Alluvium over Tertiary
Volcanics, S,I,M Locally Variable
Cretaceous Shales and Basement
Rocks Doyleville to Needle Creek K - Mancos Formation S Yes Needle Creek to 3 mi E of
Monarch Pass T PreC - Basement Rocks and Tertiary
Volcanics I,M Locally Variable 3 mi E of Monarch Pass to 6
mi E of Monarch Pass P - Paleozoic Sedimentary Rocks,
some very hard S Unlikely 6 mi E of Monarch Pass to
Maysville PreC - Basement Rocks I,M Unlikely
2-8
Maysville to Salida Q/T - Alluvium over Dry Union
Formation S Probably
Salida to 2 mi W of Parkdale Q/PreC - Alluvium over Basement
Rocks S,I Locally Variable 2 mi W of Parkdale to Parkdale K - Cretaceous Shale S Probably Parkdale to 4 mi W of Canon
City PreC - Basement Rocks I,M Unlikely 4 mi W of Canon City to
Canon City PK - Steeply dipping hogback rocks S Locally Variable Canon City to 3 mi W of
Penrose K - Pierre Formation S Yes 3 mi W of Penrose to Pueblo
West K - Niobrara Formation S Yes Pueblo West to Boone K - Pierre Formation S Yes
Boone to Fowler Q/K - Alluvium over Pierre Formation S Yes
Fowler to La Junta Q/K - Alluvium over Niobrara
Formation S Yes
La Junta to Lamar K - Carlisle Shale, Greenhorn Limestone and Graneros Shale S Yes
Lamar to Kansas Border Q/K - Alluvium over Carlisle, Greenhorn and Graneros Fms S Yes
2.5 Colorado’s Drilled Shaft Construction Methods
The influence of construction method of the drilled shafts on the vertical and lateral capacity of
the drilled shafts is discussed in the FHWA design manual (O’Neill and Reese, 1999) and by
Abu-Hejleh et. al. (2003). Developed design methods for drilled shafts based on load test results
are applicable to other production shafts only if the construction methods employed in the
production shafts are similar or better than those applied in the load test shafts. In Colorado, the
axial resistance of the overburden soil is neglected in the design and the resistance is assumed to
be entirely derived from the bedrock. Therefore, the emphasis should be on construction methods
in bedrock sockets.
2.5.1 General
Section 503 of CDOT Standard Specifications presents CDOT standard requirements for good
construction practices of Colorado’s drilled shafts. It can be accessed online at
http://www.dot.state.co.us/DesignSupport/Construction/1999book/specb500.pdf). Section 503.04
2-9
of CDOT specifications reads, “Holes shall be pumped free of water, cleaned of loose material,
and inspected by the engineer.” Based on this requirement, it is expected that the contractor will
keep the hole dry, scrape any soft cuttings from the sides of the hole, and clean the base of the
hole. Any deviation from CDOT Standard should be documented and accounted for either
through changes in the geotechnical design of drilled shafts or by the Project Engineer in the
field (i.e., increase of bedrock socket length).
Drilled shafts in Colorado are usually installed with auger drills. These can be mounted directly
on the supporting vehicle, or can be mounted on cranes. Hydraulic power is typically used to
rotate a central steel bar, known as a Kelly bar. Augers with one to three flights are typically
installed at the bottom of the Kelly bar. Cutting teeth mounted at the bottom of the augers assist
in advancing the augers. The cutting teeth depend on the material being excavated, with blades
for softer materials, and hardened points for harder materials. Other less common drilling tools
include buckets with cutting teeth, core barrels and breaker bars to extend shafts through very
hard layers or boulders, etc.
The methods of advancing the augers depend on subsurface conditions. Where conditions allow,
the drill hole is advanced into the supporting materials in the dry. To accomplish this, casing is
often extended though water bearing and/or sloughing overlying materials. Groundwater often
seeps into drill holes. The CDOT Standard Specifications for Road and Bridge Construction
address this issue. If there are 2-inches or less water in the bottom of the shaft, it is considered a
dry hole. With more than 2-inches of water, it is defined as a wet hole requiring underwater
placement and concrete richer in cement. Slurry drilling is sometimes used as an alternative to
casing in wet and caving ground. Mineral or polymer slurry can be used to maintain open holes.
Slurry supported holes are wet holes per the CDOT Standard Specifications.
Concrete placement method depends on the condition of the drill hole. Dry holes are usually
concreted using tremies, or free-fall of concrete directed into the center of the hole so as not to
strike the reinforcing bars. Concrete is usually placed in wet holes using the tremmie method.
2-10
2.5.2 Examples of Construction Methods from the T-REX and Broadway Projects.
Four Osterberg (O-Cell) load tests on drilled shafts were performed in the T-REX and Broadway
that will be described in the next chapter. The load test sites along I-25 are called: County Line,
I-225, Franklin, and Broadway. The construction of the test shafts in these two projects is
representative of the typical construction procedure for production shafts employed in the
Denver area and in the T-REX and Broadway construction projects. The construction of these
shafts is described by Abu-hejleh et. al. (2003) and is summarized below.
Excavation Methods: Drilling was performed with a flight auger placed at the end of a Kelly
bar powered by the drill rig. Cutting teeth were attached to the base of the auger that extended
approximately 0.5 in. beyond the edge of the auger to provide sufficient clearance to facilitate
getting the auger in and out of the shaft hole. The drillers did not add any water during drilling to
aid in picking up of the cuttings.
The test shafts at I-225 and County Line, embedded in the soil-like (soft) claystone, were drilled,
respectively, with 42- and 48-inch diameter augers. When the shafts reached their intended
depths, the lower 8 to 10 ft of the shafts were roughened by replacing the outer cutting teeth with
a “roughening” tooth that extended about 1.7” beyond the edge of the auger. The roughening
consisted of spinning the auger and cutting shallow grooves in the sides of the holes at about 6-
inch vertical spacing. The primary purpose of the roughening is to somewhat remove the
polished skin of the remolded material that can sometimes form in the softer claystone bedrock
(i.e., remove smear zone). Expected depth of roughening in the intact rock is 0.5 in. to 1 in.,
which is less rigorous than roughening with shear rings. After roughening was completed, the
outer tooth was removed. The base and side of shaft holes were then cleaned by spinning and
removing the auger several times until little, if any, loose soil spoils were obtained. It was
observed that the bases of the shafts were clean and very little water was present at the base of
the shafts before concrete placement.
The GWL (groundwater level) at the Franklin site had to be lowered using a side pump because
the GWL was located in the overburden very close to the ground level. The GWL at the
2-11
Broadway site was located at almost the level of the competent rock. The test shafts at the
Franklin and Broadway sites were initially drilled with, respectively, 48-inch and 60-inch
diameter augers to the top of the very hard rock. The hole sides were stabilized with natural
slurry made of the on-site soil. Casing was then installed and screwed into the top 1 to 2 ft of the
rock. The slurry inside the casing was then removed with a mud bucket. Casings were specified
to keep the hole dry in the socket and to keep the overburden stable.
At the Broadway site, a 4-ft diameter auger was used for pre-drilling the bedrock socket and a
4.5-ft auger was then used to obtain the nominal socket diameter and to complete the excavation
of the bedrock socket. For the Franklin test shaft, a 3.5 ft auger was used for drilling the nominal
bedrock socket diameter. No artificial roughening efforts were employed for the Franklin and
Broadway test shafts, as for the County Line and I-225 sites, because of the expectation (based
on observations) that normal drilling and cleaning in the very hard rocks creates clean, intact
shaft walls with no smear zones. In addition, the drillers believe that normal drilling in the very
hard bedrock at the Franklin and Broadway sites creates naturally rough sockets as reported in
the literature. During drilling, the shaft sides were dry all the way to the bottom of the Broadway
shaft. The base and side of shafts were cleaned with a mud bucket and/or auger. Prior to
concrete placement, the base of the Broadway shaft was dry and 18 inches of water was left at
the base of the Franklin shaft.
Concrete Placement: Immediately after the hole cleaning operations were completed, placement
of the concrete started. Concrete was placed relatively slowly with a tremie pipe to keep the
concrete under water and to avoid mixing the concrete with this water. The concrete slump,
required by CDOT specifications to be 5 to 8 inches, was kept on the high side or slightly above
the upper CDOT limit. After concrete placement is completed, the temporary casing was pulled
out and additional concrete was added to maintain the targeted elevation for top of concrete.
2.5.3 Recommendations for Construction of Future Drilled Shafts
CDOT Research report 2003-6 provides recommendations to improve CDOT Standard
Construction Specifications for construction of drilled shafts. These recommendations were
2-12
reviewed very carefully after the report was published and a new set of recommendations were
developed. They are presented next.
Shaft Cleaning: Good construction practices for production shafts meeting the requirements of
CDOT Standard Specifications for Drilled Caissons are expected as discussed before. The
inspection process should, and generally does, result in a hole with minimal slough remaining. It
is very important to have qualified, experienced inspectors with sufficient authority as part of
this process. The inspectors must know they have the full support and backing of the Project and
Resident Engineers. If the contractors know up front that they will be held to proper standards
they can and generally will do a good job. Shaft drilling tends to be a repetitive process.
Therefore, if proper procedures are established in the first few holes, they will generally be
followed throughout the project.
For deep shafts cleaned following the standard procedure, but where a clean bottom cannot be
verified (as in very deep shafts, in jointed and blocky rock or in cases there is some sloughing
and spalling is expected), one of the following measures should be undertaken:
Reduce the recommended ultimate base resistance by 20%; or
Deepen the bedrock socket length by 20%. This is not restrictive for deep shafts because
most of the carrying capacity of deep shafts will be in side shear. It is not uncommon for
about 80 percent of the capacity of deep shafts to be in side shear. Thus, reducing the end
bearing by 20 percent only reduces the overall capacity by about 4 percent. For most shafts,
this load carrying deficiency can be overcome by the side shear of a few feet of additional
penetration; or
Post-grout the bases of the drilled shaft through pipes inserted in the reinforcing cage. This
will minimize the effects of stress relief in boreholes that might have been left open too long
and of loose cuttings left on the hole. The qmax (maximum base resistance) determined from
loading tests are biased unconservatively, because production shafts may not be constructed
with the same care as test shafts. Grouting all shaft bases will ensure that the conditions of
production shafts are similar to those in the test shafts, which means that the design formula
may not change, but the associated reliability will be higher (e.g., higher resistance factors).
2-13
Post-grouting the base of the drilled shaft will also permit utilization of the full theoretical
base capacity, stiffen up the bases, and could alleviate concerns with long-term settlements.
Drilling and Concrete Placement: Rapid drilling and placement of concrete of the shaft holes
is expected as per Section 503.07 of CDOT Specifications. The drilling and concreting process
should be continuous, with no stoppage of work between the completion of drilling and cleaning
the hole and placement of concrete after setting the steel cage. The rate of rise of concrete should
be at least 12 m (40 feet) per hour and the 7–8 inch slump is maintained to ensure that ground
stresses are re-established. If the concrete is not placed the same day as the drilling of the socket
occurs, the contractor shall either “overream” the hole (cut it to a larger diameter) by 2 inches or
increase the rock socket length by 1/3 of the specified socket length, prior to placing concrete.
This requirement might be waived if directed by the Engineer after consultation with the
Geotechnical Engineer for very large shafts embedded in cemented, very hard clay-shale, or
durable rock where this requirement is not economically feasible and the rock strength would not
be reduced due to excessive exposure time.
Use of Water, Slurry and Casing: In order to prevent the rock socket of the production shafts
from being smooth, it is also expected that the drillers: 1) will not use drilling slurry or casing in
the rock socket used for load resistance, 2) will not pour excessive water to make cuttings sticky
so they can be picked up by an auger or bucket, 3) will use casing in the overburden when
perched water is expected, and 4) remove quickly any water encountered in the rock socket. In
dry holes, a small amount of added water (a few buckets at most) may be desirable and allowed
to moisten the cuttings of soft soil-like bedrock. Making these cuttings “sticky” does aid in
cleaning the hole. Adding water is not necessary and is not appropriate with very hard and
blocky bedrock that is not made “sticky” by the addition of a little water.
Casing and slurry should not be used in rock sockets. The rock penetration should be measured
below the bottom of the casing. Slurry is generally defined as a mixture of water and clayey
overburden soils and is used to advance a hole until casing can be set. After the casing is set the
slurry is then pumped out to create a dry hole when the shaft is extended into bedrock. Thus,
once the hole extends into bedrock there is no remaining “slurry.” There are some occasions with
holes that cave in bedrock, sometimes from poorly cemented or caving sandstone layers. With
2-14
respect to using slurry in the rock socket for caving sandstone, etc., this should be avoided if
possible. If this is not possible, the requirement for not using slurry in drilling the rock socket
could be waived (e.g., in caving sandstone) in writing by the Engineer after consultation with the
Project Geotechnical Engineer who might adjust the design side resistance values. If the caving
is accompanied or caused by groundwater inflow, the caving can usually be controlled by filling
the shaft with water above the hydrostatic water level in the caving zone. This should not be
called “slurry”, just water.
Wet Shaft Holes: In some other cases, caving will not occur but the caisson hole is also called
“Wet” because water is infiltrating into the bedrock hole (due to presence to fractures and joints
in blocky rock) at a rate higher than it can be pumped out. Exposure of certain shale to water for
long periods could weaken its side resistance. In this case, time of drilling is an important and the
contractor should be prepared to drill the hole to the required depth plus a few feet in a
continuous drilling operation. The hole should then be quickly cleaned and the reinforcing cage
should be installed quickly. The concrete trucks should be positioned to start concrete placement
immediately and continuously. The depth of extra drilling should be determined in consultation
with the Geotechnical Engineer based on the estimated degradation of the sidewall materials on
the exposure to the water.
Very hard shale bedrocks should meet the requirements of Colorado Testing Procedure 26-90 for
rock-like material (durable, sound, not sensitive to water, and has very small potential for creep).
Water is not expected to degrade this type of sound and rock-like material. Based on field
observations and results of load tests (Broadway and Trinidad), large water infiltration in these
types of rocks is due to presence to fractures and joints in blocky rocks and will not cause caving
and degradation to the rock, so that deepening the hole may not be needed. At any rate, it is
probably better to have that be a field decision depending on conditions as opposed to a
specification requirement. The decision to deepen the hole with wet shafts should be left to
CDOT Project Engineer in the field after consultation with the Project Geotechnical Engineer.
If the shaft hole is wet, the cement ratio of the concrete mix is often increased by 25% and the
tremie method must be used to place concrete. The general contractor should have the proper
2-15
equipment for the tremie method on site when the shaft is partially or completely full of water
during the concreting (wet). If this is not performed, problems could occur during concreting,
resulting in poor quality concrete. The general contractor and the drilled shaft contractor must be
familiar with standard concreting procedures for wet shafts and should plan to work together on
this issue. The general contractor should submit a detailed plan describing his intended procedure
to deal with wet shafts.
When a shaft is constructed wet, a solid steel pipe (tremie) should be used, not the flexible drain
pipes used in concreting dry holes. The concrete can be pumped through a 5 or 6-inch pipe or
delivered by gravity through a 12-inch pipe. FHWA has very clear guidance on this point. Most
procedures for placement of concrete in dry shafts, such as using "elephant trunks" or free
falling, are not acceptable. In addition, concreting of wet shafts through a tremie must require the
use of a seal or "rabbit" type device so that concrete and water do not mix in the tremie. Often a
pipe is not sealed but a sponge or "rabbit" is placed at the top of water level so that as the
concrete moves down the water filled tremie, it does not mix with the water. This issue might be
worth further investigation and a look at other states' specifications for suggestions on their
procedures.
Shaft Roughening: Minimal artificial roughening for all CDOT drilled shafts socketed in weak
rocks is recommended if roughening under normal drilling is not observed. Medium to rough
holes were obtained in the very hard claystone and sandstone shales at the Franklin and
Broadway sites with normal drilling procedures. The procedure suggested below for minimal
roughening is much less rigorous than the extensive and more expensive process of roughening
with shear rings.
Minimal roughening can be achieved by asking the drillers to make a final drilling pass by
replacing the outer cutting teeth with a “roughening” tooth that extends about 1.7” (or any other
dimension used by the drillers) from the sides of the auger to roughen the socket at least
minimally. The tooth dimensions depend on the driller. The 1.7” tooth used on the TREX test
shafts was what the contractor had on hand. Others use roughening teeth up to 3” long.
2-16
Regardless, the tooth should be able to score the side of the hole. The best procedure is to spin
the auger with the tooth attached and simultaneously move the Kelly up and down to create
diagonal scoring on the sides of the hole. The roughening does not need to completely score the
side of the hole, but should make numerous, visible grooves. It takes only few minutes to be
performed on 10 ft bedrock socket. As the artificial roughening described above is simple, quick,
and easy to do, it is recommended to consider this roughening “if in doubt of roughening under
normal drilling” No inspection of the dimensions of grooves is needed herein (no measurements
of depth and width of grooves), just witnessing that the contractor performs the work described
herein. The proposed roughening method shall be approved by the Project Engineer. If the
roughening operation described below results in excess degradation of the bedrock (e.g., caving),
or otherwise adversely affects the final product, alternate procedures shall be proposed to the
Engineer. The roughening requirement may be waived at the Engineer’s discretion and after
consultation with the Geotechnical Engineer.
The minimal roughening is most appropriate for soft, soil-like claystone, as its main purpose is to
knock the “shine” off the side of the hole in order to allow the natural roughness to be effective.
In harder shale bedrock there are likely to be some asperities. On such formations, the need for
roughening can usually be determined by observations during normal drilling (no roughening is
needed if it is observed during the normal drilling).
For holes drilled without casing, the roughening procedures presented above should be the
standard operating procedure if roughening under normal drilling is not observed. A grooving
tooth cannot be used in a cased hole. In cased holes, and if roughening sides cannot be observed
during normal drilling, the contractor should decide the best tool (perhaps a simple version of
shear rings) to minimally and quickly (in matter of few minutes) roughen the hole side as with a
grooving tooth.
Artificial roughening with shear rings during drilling was employed at some load test sites as
will be discussed in the next chapter.
3-1
3. RECORDS OF COLORADO’S AXIAL LOAD TESTS ON DRILLED
SHAFTS SOCKETED IN WEAK ROCKS 3.1 Overview
This Chapter and Chapter 5 document and evaluate the available records of Colorado’s axial load
tests performed on drilled shafts socketed in weak rocks in the last 35 years. Because of the
significant expense of drilled shaft load tests, there have been relatively few load tests performed
in Colorado. A summary of the identified load tests is presented in Table 3.1. For each of the
load tests, the study attempted to obtain the following information (see Table 3.1 and Appendices
A, D, and E):
• Geographic location.
• Number, date, and type of load test.
• Geological information of the bedrock.
• Construction information of the shaft hole. This includes information on the method and
timing (e.g., how many hours or slow vs. fast) of the drilling operations and information
on the conditions of the shaft wall sides and bottom (wet or dry; rough or smooth sides;
cleaned or not).
• Construction and material information of the test shafts. This includes method and timing
(e.g., how many hours or slow vs. fast) for placement of the concrete and information on
the strength and slump of the concrete.
• Layout information of the shafts. This includes diameter (D) and length (L) of the rock
socket, and other information that describe the location of the test shaft with respect to
the bedrock and groundwater table (GWT).
• Geotechnical description of the shale bedrocks as obtained from results of subsurface
geotechnical investigation, such as the N-value (# of blows per foot or bpf) obtained from
the standard penetration test (SPT), and/or the unconfined compressive strength (qu)
obtained from the unconfined compression test (UCT), and any reported strength and
stiffness results obtained from the pressuremeter test (PMT).
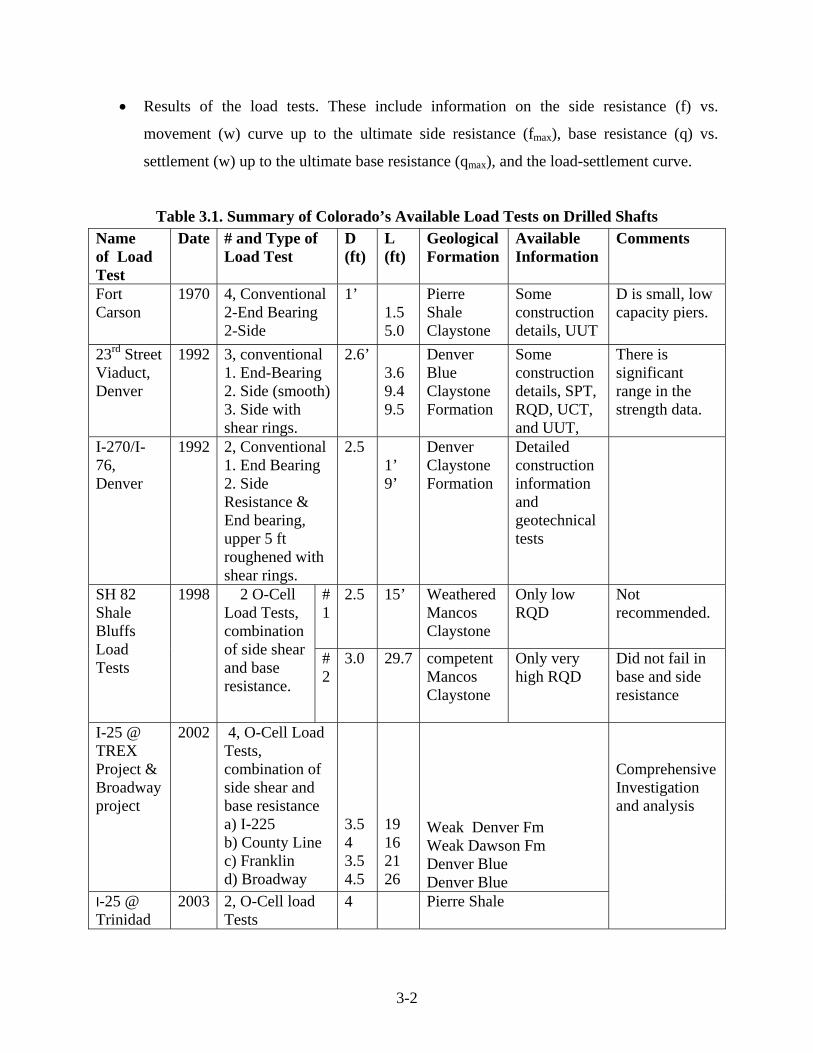
3-2
• Results of the load tests. These include information on the side resistance (f) vs.
movement (w) curve up to the ultimate side resistance (fmax), base resistance (q) vs.
settlement (w) up to the ultimate base resistance (qmax), and the load-settlement curve.
Table 3.1. Summary of Colorado’s Available Load Tests on Drilled Shafts Name of Load Test
Date # and Type of Load Test
D (ft)
L (ft)
Geological Formation
Available Information
Comments
Fort Carson
1970 4, Conventional 2-End Bearing 2-Side
1’ 1.5 5.0
Pierre Shale Claystone
Some construction details, UUT
D is small, low capacity piers.
23rd Street Viaduct, Denver
1992 3, conventional 1. End-Bearing 2. Side (smooth)3. Side with shear rings.
2.6’ 3.6 9.4 9.5
Denver Blue Claystone Formation
Some construction details, SPT, RQD, UCT, and UUT,
There is significant range in the strength data.
I-270/I-76, Denver
1992 2, Conventional 1. End Bearing 2. Side Resistance & End bearing, upper 5 ft roughened with shear rings.
2.5 1’ 9’
Denver Claystone Formation
Detailed construction information and geotechnical tests
#1
2.5 15’ Weathered Mancos Claystone
Only low RQD
Not recommended.
SH 82 Shale Bluffs Load Tests
1998 2 O-Cell Load Tests, combination of side shear and base resistance.
# 2
3.0 29.7 competent Mancos Claystone
Only very high RQD
Did not fail in base and side resistance
I-25 @ TREX Project & Broadway project
2002 4, O-Cell Load Tests, combination of side shear and base resistance a) I-225 b) County Line c) Franklin d) Broadway
3.5 4 3.5 4.5
19 16 21 26
Weak Denver Fm Weak Dawson Fm Denver Blue Denver Blue
I-25 @ Trinidad
2003 2, O-Cell load Tests
4
Pierre Shale
Comprehensive Investigation and analysis
3-3
The compiled load tests (Table 3.1) are named after their location as: Fort Carson, 23rd Street
Viaduct in Denver, I-270/I-76, SH82 Shale Bluffs in Pitkin County, T-REX along I-25 in Denver
(I-225, County Line, and Franklin), Broadway Viaduct along I-25 in Denver, and Trinidad. For
all these tests except the Fort Carson and SH 82 Shale Bluffs load tests, Tables A.1 to A.7
(Appendix A) present the available testing results from the load tests and from the simpler and
routine geotechnical tests (e.g., SPT, UCT, and PMT), and information on the materials,
construction, and layout of the tests shafts.
3.2 Trinidad Load Tests
As a part of the I-25 Trinidad project located in Trinidad, Colorado, two O-Cell load tests were
performed on 48” diameter test shafts. The purpose of these two load tests was to check the
recommended geotechnical design parameters for the drilled shafts in the construction project
and to provide research data that would improve the accuracy of CDOT future design
methodology for drilled shafts. Dr. Naser Abu-Hejleh from CDOT Research Office
administrated a comprehensive subsurface exploration and laboratory testing program around the
two test shafts, and then provided construction and testing information for the two load tests. The
Trinidad load tests are discussed thoroughly in Chapter 5. Summary information on the layout,
materials, and construction of the test shafts and the results from the load tests and the subsurface
geotechnical investigation program are presented in Table A.5. Reported results from the load
tests and the subsurface geotechnical investigation are listed in Appendix E.
3.3 T-REX and Broadway Load Tests
These tests are thoroughly documented in a recently published CDOT Research Report 2003-6
(Abu-Hejleh et. al., 2003) titled “Improvements of the Geotechnical Axial Design Methodology
for Colorado’s Drilled Shafts Socketed in Weak Rocks.” Tables A.1 to A.4 provides a summary
of all the information on the layout, materials, and construction of the test shafts and the testing
results from the load tests and the subsurface geotechnical investigations. The results from this
study that are relevant to this study are presented in this section.
3-4
As a part of the construction requirements for the T-REX and Broadway Viaduct project along I-
25 in Denver, four Osterberg axial load tests were performed in 2002 on drilled shafts embedded
in the typical range of weak rocks encountered in Denver: soil-like (or soft to firm) claystone (I-
225 and County Line sites) to very hard sandy claystone (Franklin site) to even much harder and
more massive clayey sandstone (Broadway site). To maximize the benefits of this work, the
Osterberg load test results and information on the construction and materials of the test shafts
were documented, and an extensive program of simple geotechnical tests was performed at the
load test sites. This included SPT, UCT, and PMT. Analysis of all test data, information, and
experience gained in this study were employed to provide: 1) best-fit equations to predict the
unconfined strength of weak rocks from SPT, and PMT data; 2) assessment of the CDOT design
method (see Section 3.3.1) and AASHTO/FHWA design methods; and 3) recommended design
equations to predict the shaft ultimate unit base resistance (qmax), side resistance (fmax), and an
approximate load-settlement curve as a function of the results of simple geotechnical tests for the
types of weak rock and conditions investigated in this study (see Section 3.3.2). Other products
are developed to help CDOT with implementation of accurate and feasible LRFD methods for
the design of drilled shafts.
A relationship between the SPT-N value and the unconfined compressive strength (qu), is
recommended as qu (ksf) = 0.24 N.
Two failure criteria to define ultimate fmax and qmax for claystone bedrocks were employed in the
analysis:
• For soil-like or soft claystone (SPT N-value < 100 bpf, or qu< 25 ksf), fmax and qmax should
correspond to the true base and side resistance values that correspond to the full mobilization
of the resistance in the plastic range. If needed, the values of fmax and qmax could be obtained
through a conservative extrapolation of the plastic failure portion of the resistance-movement
curves.
• For the very hard claystone and sandstone, qmax to correspond to a displacement of 5% of the
shaft diameter, but not to exceed 3 inches, and fmax to a displacement of 1% of the shaft
diameter (0.3”).
3-5
3.3.1 Assessment of Colorado SPT Based Design Method:
Since the 1960s, empirical methods and “rules of thumb” have been used to design drilled shafts
in the Denver Metropolitan/Colorado Front Range area. This empirical formula is geared toward
allowable stress design method (ASD) with no information on expected settlement of drilled
shafts. In the Colorado SPT-Based design (CSB) method, the allowable base resistance in kips
per square foot (ksf) is taken as qall (ksf) = qmax/FS = 0.5 N, and the allowable side resistance is
taken as fall (ksf) = fmax/FS = N/20. With the lack of information on the proper factor of safety
embedded in the CSB design method, a factor of safety (FS) of 3 (resistance factor,φ, of 0.5) is
often assumed by CDOT engineers and is used to recommend qmax and fmax values. The same
CSB design method, based SPT-N values, is uniformly applied to both cohesive and
cohesionless weak rocks and to stronger rocks. Because the CSB design method is rather crude,
most practitioners limit the allowable base resistance, for geomaterials with N>100, to about 50
ksf (ultimate to 150 ksf) and allowable side resistance to 5 ksf (ultimate 15 ksf). Assessment of
the CSB method concluded (see CDOT Research Report 2003-6 for more details) that
There is a large difference between the measured and predicted ultimate resistance values
because the true FS associated with the CSB method is smaller than the assumed value of 3.
The predicted allowable base resistance values for the soil-like claystone bedrock from the
current CSB method (qall = 0.5 N) are very close to those measured from the load tests (qall =
0.46N) using a factor of safety of 2.
The CSB side resistance design method for the soil-like claystone resulted in a factor of
safety of less than 2 but above 1, ranging from 1.3 to 1.8.
On the other hand, the CSB design method is very conservative when drilled pier sockets are
constructed in the very hard claystone/sandstone formations (i. e., the “Denver Blue”). This
method results in FS ranging from 3.4 to 7, leading to costly design and construction of high-
capacity piers embedded in the competent claystone and sandstone bedrock. For these
bedrocks, the use of AASHTO and FHWA strength-based design equations are appropriate
and will be very cost-effective.
3-6
3.2.2 Recommended Design Methods.
These recommendations are valid for drilled shafts with conditions (type of weak rocks, adequate
subsurface geotechnical investigation, shafts: materials, construction, and layout) close to those
of the four load test sites described in the study.
I. Soft claystone bedrock shales (called also soil-like or weathered). Clay-based
geomaterials with SPT-N values (bpf) between 20 and 100 (qu <24 ksf) as those encountered at
the I-225 and County Line sites. Updated Colorado SPT-Based (UCSB) Design Method is
recommended for soil-like claystone as:
qmax(ksf) = 0.92 N ……………………………………………………………………………...3.1
f max (ksf) = 0.075 N ……………………………………………………………………………..3.2
And with a recommended factor of safety of 2, the allowable unit base and side resistances are
obtained as:
qall (ksf)= 0.46N…………………………………………………………………………………3.3
fall (ksf) =0.037N ………………………………………………………………………………..3.4
The UCSB method will produce a factor of safety very close to or larger than 2, which is higher
than the FS generated from the CSB design method (1.3- 1.8) currently used in Colorado. Other
AASHTO and FHWA design equations for the soil-like claystone employ high factors of safety,
ranging from 2.3 to 3. It is recommended to use the UCSB design method with relatively smaller
FS than the AASHTO method because: 1) of the excellent short- and long-term performance of
innumerable structures designed in Colorado over the last 40 yrs with the CSB design method; 2)
it is more cost-effective than the AASHTO/FHWA strength-based design method that employs a
higher FS; 3) the use of SPT-based design is commonplace in Colorado; and 4) it is more
consistent to obtain SPT data than UC strength data in soft claystone geomaterial.
II. Very hard sandy claystone bedrock shale with SPT-N value >120 bpf (or > 50/5”) and
unconfined compressive strength (qu) is less than 100 ksf. This is a very typical material in
3-7
Colorado. The Franklin bedrock is a very hard, mostly thinly bedded, bluish gray, and sandy
claystone bedrock with qu ranging from 40 ksf to 90 ksf (average of 65 ksf) around the bedrock
socket and around 41 ksf beneath the socket. In this rock, SPT testing was terminated in the
second interval with 50 blows per 4 inches of penetration (50/4”) around the shaft and 50/5”
beneath the shaft. The following design equation is recommended for conditions similar to those
of the Franklin test shaft. Use the Canadian design equation to predict the base resistance with a
factor of safety of 3
qmax = (1.2+0.48 L/D) qu and not to exceed 4.08 qu when L/D>6 …………………………….3.5
and
f max (ksf) = 2.05 qu0.5
…………………………………………………………………………..3.6
with FS of 2.7.
III. Very hard and Massive Bedrock Shale with qu less than 500 ksf, and SPT-N values
>100 for granular-based rock, and qu>100 ksf for clay-based rock. The Broadway bedrock is
very hard, well-cemented, bluish gray and clayey sandstone with claystone interbeds and qu
ranging from 97 ksf to 293 ksf (average of 145 ksf) around the bedrock socket and around 219
ksf beneath the socket. In the rock around the test shaft, SPT testing was terminated during both
the second interval (50/3”) and the first interval (100/5.5”). In the rock beneath the test shaft, the
SPT testing was terminated in the first interval (83/6”). The following design equation is
recommended for conditions similar to those of the Broadway test shaft.
qmax (ksf) = 17 (qu)0.5 ....................................................................................................................3.7
The recommended FS is 2.7. Use Eq. 3.6 and FS of 2.7 for the side resistance analysis.
3.4 Fort Carson Load Tests Load tests on four drilled shafts near Fort Carson, Colorado, were conducted in 1970 for the U.S
Army Corps of Engineers, as described by Jubenville and Hepworth (1981) and later analyzed by
Turner et al. (1993). The tests were performed on 1’ diameter shafts founded in Pierre shale.
3-8
Two of the shafts were side shear tests with 5 linear feet of formational material tested.
Cardboard (possibly void form) was used to isolate the tip. For the end bearing tests, the sides of
the shafts were isolated. Both side shear tests were successful. One of the end bearing tests was
successful. Unconsolidated, undrained triaxial shear tests (UUT) were performed on seven core
and drive samples, not the unconfined compression test (UCT) recommended by Abu-Hejleh et.
al (2003). For illustration and analysis purposes, it will be assumed that the results from the UUT
and UCT are similar. The shear strength of the samples from the UUT varied from 8.3 ksf (N=
35 bpf) to17.3 ksf (72 bpf) ksf with an average of 11.3 ksf (47 bpf). The N-values were
estimated from the equation recommended by Abu-Hejleh et al. (2003) as qu (ksf) = 0.24 N.
The ultimate end bearing was measured at settlement that corresponds to 10% of the shaft
diameter as 75 ksf. The measured ultimate side resistance at a settlement of around 0.27”
averaged about 4 ksf. These data suggest that the encountered bedrock shale in this site fit to the
description of soft claystone bedrock shale. The prediction of qmax from Eq. 3.1 is = 0.92* 72=
66.3 ksf and for fmax is =0.075*47= 3.53 ksf. These predictions are close to the measured
resistance values and are conservative.
3.5 The 23rd Street Viaduct Load Tests At the 23rd Street Viaduct, three conventional load tests were performed on 31” diameter shafts
(one end bearing with L= 3.6’ and two to evaluate side resistance with and without shear rings,
L=9.5’). The purpose of the load tests was to confirm the recommended design values presented
in the Geotechnical Investigation for the 23rd Street Viaduct Replacement project. The source for
information on these tests is a report prepared by Ground Engineering Consultants (1992). The
title of this report is “Drilled Straight-Shaft Piers, Pier Load Test, 23rd Street Viaduct, Denver,
Colorado.” The test shaft locations presently near the NE corner of Wazee Street and Park
Avenue (used to be called 23rd street), inside the Coors Field parking lot. The test site is located
where Denver Formation bedrock is at a shallow sub crop. Figures D.1 to D.7 in Appendix D
summarize the locations (Figure D.1), elevations, and as-built details of the test shafts (Figure
D.2), and geotechnical test data (Figure D.3 and D.4) and load test data (Figures D.5 to D.7).
Table A.6 provides summary information on the layout, materials, and construction of the test
shafts and the testing results from the load tests and the subsurface geotechnical investigation.
3-9
3.5.1 Subsurface Conditions and Strength Characteristics of the Bedrock
Standard Denver area geotechnical data are also presented, including blow counts on a California
Sampler, and unconfined compression test and triaxial shear test data (Figures D.3 and D.4). The
load test site consists of fill and natural clay overlying claystone (Denver Blue Formation) with
occasional interebeds of sandstone and siltstone. RQD from two boreholes in the test pockets
was in the range of 93 to 95. The design methods (Eqs 3.1 to 3.7) are either based on SPT N
values, not the N-values from California Sampler, or unconfined compressive strength of the
rock, not the compressive strength obtained from the UU triaxial tests. N-values obtained with
California Sampler range from 76 (in the upper range) to 120 (in the lower more competent
zone) with average of 94 (Turner et. al, 1993). The unconfined compressive strength of the
bedrock, qu, ranged from 5 ksf (in the upper range) to 25.2 ksf (in the lower competent zone). In
the test pocket for end bearing test (lower zone, see Figure D.3), appropriate N- value and
unconfined strength should be equal, around, or even greater than, respectively, 120 bpf or 25.2.
ksf. To solve uncertainties with the strength data obtained around and below the test shafts, it is
recommended to:
1. Obtain more reliable test data from SPT or unconfined compressive strength tests.
2. Rank the test data as fair (not good) because they are based on judgment, not only testing.
3.5.2 Test Program and Construction
The two side resistances load tests were socketed 9.4 ft and 9.5 ft in the bedrock socket with 1
foot of collapsible void placed at the base to isolate the bearing resistance (Figure D.2). One
shaft was drilled with straight sides. The other shaft had five 2” by 3” shear rings at 1.5’ spacing.
The rock socket length for the end-bearing test was 3.6 ft. Void was maintained between the test
shaft and the geomaterial around the test shaft to isolate the side resistance. Loads were applied
in accordance with ASTM 1143-81, Quick Load Test Methods for Individual Piles. The shafts
were instrumented to measure the settlements of the shaft during the test. The load vs. settlement
curves for the three tests are shown in Figures D.5 to D.7.
3-10
3.5.3 Test and Analysis Results
The end-bearing test resulted in an end-bearing pressure of about 118 ksf at 1-inch settlement.
Ground Engineering felt this was less than ultimate as the load deflection curve suggested the
bottom of the hole was not clean (Figure D.5). Nevertheless, with a FS of 2 to 3, an allowable
design load of 40 ksf to 50 ksf is indicated, which is in line with typical Denver area design
values (CSB Design Method). Given Ground’s concern that the hole was not fully clean, and
that the tip of the shaft was quite shallow, the results may be conservative.
According to the definitions of qmax and fmax established by Abu-Hejleh et. al. (2003),
If the claystone bedrock is soft, ultimate true qmax in the 1st load test is 198 ksf (settlement of
3”), fmax in the 2nd load test is 5.9 ksf (2”), and fmax in the 3rd load test is 21.6 ksf (0.85”).
If the claystone is very hard, qmax in the first load test is 145 ksf measured at settlement
equals to 0.05 D or of 1.5”, fmax in the 2nd test is 3.3 ksf (at settlement that corresponds to
0.01 D= 0.031”), and in the 3rd load fmax is 18.2 ksf (see Appendix D).
Based on the measured SPT N values, it seems that the rock around the test shafts fits to soil-like
(or soft) claystone, so fmax values of 5.9 ksf can used for the load test with smooth sides and 21.6
ksf for the load tests with sides roughened with artificial shear rings. Using Eq. 3.2, fmax can be
predicted as 94*0.075= 7 ksf. This is close to the measured resistance value from the load test
with smooth sides (5.9 ksf). Ground Engineering suggested seepage of perched groundwater
might have influenced the concrete to bedrock bond. Groundwater seepage was observed from
bedrock fractures during drilling. In the test shafts analyzed by Abu-Hejleh on the soft claystone
(at County Line and I-225), the lower 8 ft of the side shafts were cleaned with minimal
roughening, and Eq. 3.4 should be used with N-values obtained from the SPT not obtained from
the California Sampler. These two factors might contribute to the small difference between the
measured fmax and those predicted with the equations suggested by Abu-Hejleh et. al. (2003).
Also, the penetration driving resistance to be
The capacity of the 23rd shaft with shear rings (3rd load tests) was substantially greater than the
smooth-sided shaft 21.6 ksf compared to 5.9 ksf). With a FS of 2.0 to 2.5, an allowable side
3-11
shear of about 11 ksf is indicated. A rough-sided rock socket could have three times the side
resistance capacity of a smooth-sided rock socket (Abu-Hejleh et. al., 2003). The performed two
load tests at the 23rd Street suggest a ratio close to 3.5.
The shale bedrock beneath the tip of the end-bearing test shaft is at the boundaries between the
soft claystone and the very hard claystone (N-value of 120 bpf from the California Sampler or
unconfined compressive strength of 25.2 ksf). Whatever design method is employed to predict
qmax, the measured qmax value will suggest that the rock beneath the test shaft is stronger than
25.2 ksf, as suggested before.
Based on the load test data and the overall geotechnical data for the overall project, Ground
presented a design end-bearing of 75 ksf, and side shear of 3 ksf in the first 10’ of bedrock with
8.5 ksf below 10 feet when shear rings are installed.
3.6 The I-270/I-76 Load Tests
Two conventional load tests were performed on 2.5’diamater shafts (one end bearing with L=1’
and the 2nd to evaluate side resistance, L=9’). Woodward-Clyde Consultants (WCC) (now part of
URS) performed axial and lateral load tests on driven H-Piles and drilled shafts. The study was
performed under contract to CDOT under Project Number IM-IR(CX) 25-3(107). The purpose of
the study was to confirm design recommendations for then proposed improvements to the I-70/I-
270 interchange and the nearby I-25/I-270/SH-36 (Boulder Turnpike) Interchange. The source
for information on these tests documented in this study is a report prepared by Woodward-Clyde
Consultants (1992). The title of this report is “Pier and Pile Foundation Load Tests at
Interchanges 270 and 76, Adams County, Colorado.”
Appendix D provides the following information for this test: location (Figure D.8), a summary
log of the test borings adjacent to the location of the test shafts (Figure D.9), load test results
(Figures D.10 and D.11), and layout and properties of the test shafts (Figures D.12 and D.13).
The test site is located between SH 224 (south side) and Clear Creek, just north of the then
existing I-270/I-76 interchange and on line with the anticipated I-270 extension (Figure D.8).
3-12
The test site is located in a gravel parking lot adjacent to Clear Creek, which provides access to a
pedestrian and bike path along the Creek. The bedrock strength and consistency were evaluated
by field and laboratory testing. Field-testing included Standard Penetration Tests (SPT), NX
coring with measurements of recovery and RQD, and pressuremeter tests. Laboratory UU
Triaxial Tests were also performed. Table A.7 provides summary information on the layout,
materials, and construction of the test shafts and the testing results from the load tests and the
subsurface geotechnical investigation.
3.6.1 Subsurface conditions and Strength Characteristics of the Claystone
Subsurface conditions at the test site consisted of about 4 feet of poor quality fill and 15 feet of
sandy alluvium over sandstone and claystone bedrock (Figure D.9). The claystone bedrock was
encountered at a depth of about 19 ft. The upper surface of the claystone was weathered with the
degree of weathering reducing with depth. This layer is called the weathered claystone layer and
extends from depth of 19 ft to 25 ft. The unweathered or more competent claystone layer extends
below a depth of 25 ft.
In the weathered claystone layer, the SPT N-values range from 32 to 76 (bpf) with an average of
about 50 blows per foot (bpf). No undrained shear strength values from the triaxial tests were
reported in this layer. The unconfined compressive strength for this layer was estimated
indirectly from the results of PMT and SPT (Abu-Hejleh et. al., 2003) as, respectively, 9.4 ksf
and 12 ksf. For analysis purposes, it is seems reasonable to assume qu= 10 ksf and SPT- N value
of 50 for the weathered claystone layer.
In the unweathered (or competent) claystone bedrock layer, the SPT N-values ranges from 62 to
over 200 (bpf) with an average of 100 bpf. After reviewing the boring logs, it seems that an
average SPT-N value of 100 bpf is reasonable and could be employed in the analysis. Results of
triaxial tests suggest that the unconfined compressive strength in this layer range from 12.8 ksf to
23.6 ksf. Two pressuremeter tests were performed in this layer,
One at depth of 26 ft (very close to the boundary between the weathered and unweathered
claystone layers), resulting in qu of 23.8 ksf.
3-13
One at depth of 31 ft, resulting in qu of 22.2 ksf.
The strength data from the PMT are more consistent and reliable than results from laboratory
strength tests as reported by Abu-Hejleh et. al. (2003). Note that the SPT-N value of 100
corresponds to unconfined compressive strength is 24 ksf. For analysis purposes, it is seems
reasonable to assume qu= 23 ksf and SPT N-value of 100 bpf for the competent (unweathered)
claystone layer.
Both the weathered and unweathered claystone layers with SPT N-value fall under the definition
of soil-like claystone as proposed by Abu-Hejleh et. al. (2003). Thus, the ultimate resistance
values, qmax and fmax for both claystone layers should correspond to the full mobilization of the
resistance in the plastic range.
3.6.2 Construction of Test Shafts
Two 2.5 foot diameter drilled shafts were constructed and then tested axially to failure. One test
was in end-bearing (Test 1), the other was a combination of side shear and end-bearing (Test 2).
Excavation for both shafts was performed using 30” helical auger. After drilling through the
overburden to the upper surface of the claystone using slurry mixed in the hole, a temporary
casing was installed and sealed into the claystone. Then, the slurry was removed and the
remaining penetration of the drilled shafts in the claystone was drilled essentially dry. A trace of
water entered most of the shafts during drilling, with a maximum rate of 2 to 5 gpm in some
shafts. Water depth was 2” or less in all shafts before placement of concrete. The reinforcing
steel was inserted before concrete placement for most of the production shafts, except for those
shafts with higher inflows of water. In that case, the reinforcing steel was inserted thought he
fresh concrete. The concrete was placed to about 2 feet below grade by directing a freefall down
the center of the shaft, without striking the steel.
The end-bearing test shaft had minimal penetration into claystone bedrock (one foot below the
bottom of the casing). The combination test shaft was socketed 9-feet into bedrock below the
bottom of the temporary casing with 5 ft in the weathered claystone and 4 ft in the unweathered
3-14
claystone. One shear ring (3” high, 2” deep) was installed near the upper surface of the
unweathered claystone and the remaining shear rings were installed in the weathered claystone.
3.6.3 Testing and Analysis Results:
The axial loads were applied though a reaction beam restrained by drilled shafts acting in uplift.
Axial loads were measured by calibrated hydraulic jacks and an electronic load cell. The load
distribution along the shaft was evaluated by tell tales and strain gages in the shaft at the top of
bedrock and near the bottom of the shaft. The test procedure generally followed the “quick”
method set under ASTM 1143 Standard Test Method for Piles under Static Axial Compressive
Load.
The end-bearing test essentially provided a direct measure of end bearing in the upper, weathered
claystone. The end-bearing that correspond to the full mobilization of the resistance in the plastic
range is measured as 47 ksf. The ultimate end-bearing pressure was consistent with the Denver
Method prediction based on the SPT. It perfectly matches the equations suggested by Abu-
Hejleh et. al. (2003), Eq. 3.1, as qmax= 0.92 N, with prediction of 46 ksf for a claystone with
SPT-N value of 50 bpf.
With respect to the combined test, the strain gages and telltales were used to separate the total
applied test load into end-bearing and side shear. Interpretation was required because the lower
strain-gage was above the bottom of the shaft. Based on the strength ratio between the
unweathered claystone (23 ksf), and the weathered claystone (10 ksf), and the measured qmax for
the weathered claystone (47 ksf), a qmax of 105 ksf is estimated for the unweathered claystone.
Using this value the average fmax in the rock socket (5 ft weathered and roughened claystone and
4 ft of unweathered claystone) is 12.4 ksf. For the entire claystone layer, the average weighted
SPT-N value is 72 bpf and qu is 16 ksf. Using Eq. 3.1, fmax can be predicted as 0.075*72= 5.4
ksf. The shear rings appear to have increased the side shear resistance by a ratio of 2.5 (12.4/5.4).
This ratio is lower than the ratio of 3.5 measured at the 23rd Street load test and the ratio of 3
reported in the literature, most likely because the shear rings were not applied in the entire
3-15
claystone layer. It seems to be reasonable to conclude that the shear rings increased the fmax in the
unweathered claystone by a ratio of 3 as reported in the literature.
3.7 SH 82 O-Cell Load Tests (Pitkin County) Two O-Cell load tests were performed along SH 82 in 1998. Each test provided information on
side resistance and base resistance but no geotechnical test data (e.g., qu) were provided other
than RQD. The results of these two load tests are summarized in two test reports prepared by
LOADTEST, Inc. (1998) to the Colorado Department of Transportation, titled as
o Test # 1: Caisson 47 A, Shale Bluffs, Pitkin County
o Test # 2: Test Shaft at Pier No. 2, Highway 82 Glenwood/Aspen-Aspen, CO.
According to Mr. Shan-Tei Yeh, the two load tests were intended to evaluate the resistance of
softer portion of the bedrock (highly weathered Mancos claystone formation, Load Test No. 1)
and the harder portion (very competent Mancos claystone formation, Test No. 2) so the data
could be used for bridge design.
3.7.1 Test 1 (Caisson 47A, Shale Bluffs)
This was an O-Cell test on Highway 82 in Pitkin County. The shaft was drilled into a steeply
sloping bedrock surface, with about 10’ difference in rock elevation across the shaft. Drilling by
dry hole technique began on the morning of 5/19/98. Due to problems with caving of the
overburden, drilling was continued the following morning after a temporary casing was installed.
A 5-foot of grout was pumped below the level of the O-Cell before the cage was inserted. The
remainder of the shaft was filled with concrete by gravity feed (dropped) from top of the hole.
The test shaft was 2.5 feet in diameter, but had a relatively small rock socket of about 10 feet
above the O-Cell. There is little geotechnical information available. The boring was cored, but
only recovery and RQD data (83% to 6%) were presented on the log (Figure D.12).
The load test failed in end bearing and side shear at the same load increment indicating the O-
Cell was at the balance point for the shaft. Because of limited penetration in poor quality
claystone, the ultimate side shear in the bedrock was between 3 and 4 ksf (movement around 4
3-16
inches). There was an approximate 5’ concrete (or grout) plug below the O-Cell, so considerable
assumed side shear had to be subtracted to obtain the end-bearing capacity. The resulting
ultimate end-bearing capacity thus calculated was 40 ksf.
This test shaft is of little value for research purposes and additional geotechnical investigation at
this test shaft location is not suggested because:
The radically sloping bedrock surface around the test shaft making it hard to analyze the
data.
The presence of 5 ft of grout below the O-Cell make it hard to analyze the data and
separate the base resistance from the side resistance in that zone.
Problems encountered during construction.
There is little geotechnical information available, other than RQD that appears to
decrease with depth in rock over the length of the shaft from an RQD of 83 near the top
of the shaft, to less than 10 near the tip. The bedrock was described as weathered, much
fractured with joints (sometimes vertical) and/or with clay zone (see Figure D.12).
Region 2 was contacted and according to them it is very difficult to access this site.
The reported side and base resistance values suggest that low resistance values should be
expected with highly weathered and fractured claystone shale. By comparing the reported load
testing results for this test with the four load tests analyzed by Abu-Hejleh et. al. (2003), it seems
that the bedrock at this site is a little bit weaker than the soil-like claystone encountered at the I-
225 site. For such bedrock, the RQD is not needed and the rock should be treated as very stiff
clay or soft claystone.
3.7.2 Test 2 (at Pier No. 2)
The second load test on the Shale Bluffs project was on a 3 foot diameter shaft that extended
29.7 feet into hard shale. The shaft was constructed dry with a total length of 39.7 ft. The tip of
the test shaft was located 1.3 ft below the O-Cell. Log information and Load test data are
presented in Figures D.13 to D.16.
3-17
The sub-surface stratigraphy at the test shaft location (Figure D.13) consists of sandy gravel
overburden down to a depth of 8 ft where weathered shale was encountered in the next two feet.
At depth of 10 ft to undetermined depth, very hard shale was present (Figure D.13). As with load
Test No. 1, the only geotechnical data on the logs is recovery and RQD data (Figure D.16).
Compared to Test 1, the shale in this test appears to be much sounder, with RQD values of 70%
to 90% (Figure D.13).
As seen in Figure D.16, the shaft did not fail at the maximum O-Cell load of 1,239 tons applied
up (movement of 0.07”) and down (0.09”). Movement to that deflection was linear, so the testing
company did not attempt to extrapolate the data to failure values. The measured maximum unit
side resistances at the end of the test were 4 ksf in the upper 13.4 ft of the bedrock socket, and
14.8 ksf in the lower 15 feet of bedrock socket, with an average value of 9.2 ksf in the entire
bedrock socket. The trend of unit side resistance vs. side movement data over 0.07” of movement
seems to be close to similar results reported by Abu-Hejleh et. al. (2003) for the Franklin and
Broadway load tests and similar to the results obtained for the Trinidad load tests that will be
presented later in this report.
The maximum measured unit base resistance was 325 ksf (at settlement of 0.09”). This is a very
high value at a settlement of 0.09” when compared to all other load tests presented in this study,
suggesting the rock strength in this site is much stronger/stiffer than the very massive bedrock
shales encountered in the Broadway (qu as high as 200 ksf) and Trinidad (qu as high as 500 ksf)
sites. It is possible that the rock strength in this site is close or even exceeds the strength of the
concrete. It would be worthwhile to drill an additional boring at this location so that strength
tests can be performed on recovered cores. Until then, we should be careful with accepting the
measured base resistance value in this test.
The report does not state what the design values were, but given the deflections under the
maximum load, it would not be unreasonable in the sounder bedrock to use the highest measured
values as conservative design values. These values are well above typical design values.
4-1
4. GUIDELINES FOR CONDUCTING COLORADO’S NEW AXIAL LOAD TESTS
ON DRILLED SHAFTS 4.1 Introduction This chapter presents:
Step-by-step procedure on when it is cost-effective to consider load tests as part of the
subsurface geotechnical investigation in CDOT future bridge construction projects during
different stages of the design phase. The objective of new load tests is not just to obtain
research data for improvement of the accuracy of the design methods for drilled shafts, but
also to generate significant net savings. After Colorado’s design methods are improved based
on sufficient number of load tests, additional loads tests may be performed in the future for
purely economical reasons.
Guidelines for planning, design, and construction of new load tests on drilled test shafts.
Sample Guide Specifications for Osterberg Cell Load Testing of Drilled Shafts are presented
in Appendix B. Revision of Section 503 of CDOT Standard Specifications to incorporate the
Osterberg Cell Load Test in the Broadway construction project is presented in Appendix C.
Analysis Procedure of Osterberg Cell (O-Cell) Load Test Results.
The comprehensive guidelines suggested in this chapter for conducting new load tests were
applied in the Trinidad project. Chapter 5 provides specific details of all the steps employed for
the planning, design, construction, and analysis of the Trinidad two load tests.
The CDOT Region Office administrates all the design activities of project development. They
are:
1. Environmental Assessment (EA) phase to assess the impacts of the project on the
environment. This is usually performed in relatively large corridor projects with multiple
structures under what is called the “Corridor Study.” A certain amount of Basic Engineering
(BE) needs to be performed as part of this work. Geologic hazards assessment, possibly
geologic mapping, and perhaps a few geotechnical borings are performed during the EA/BE
study.
4-2
2. Development of a Scope of Work for the design of the structure (Scoping Stage). This scope
is executed during the FIR and FOR phases of the project, either by various CDOT design
offices, or by consultants who have contracts and task orders with CDOT. On many of the
Region’s projects, a consultant does the bridge plans. The Region needs to know the scope of
work as soon as possible to enter into contract with the consultant.
3. FIR or the preliminary design phase. Often, the geotechnical investigations and
recommendations are completed in this phase, and 30% of the design of the bridge
superstructure is completed.
4. FOR or the final design stage. Design is completed in this stage.
There are three levels of geotechnical axial design of drilled shafts installed in Colorado’s
bedrock shales:
1. Level I Design based only on the results of the standard penetration test (N-values) which is
the most common practice in Colorado. Abu-Hejleh et. al. (2003) described improved SPT-
based design methods to estimate the ultimate unit base resistance, unit side resistance, and
settlement of shafts installed in soft claystone (SPT N-value less than 100 blows per foot or
bpf). This level of design could also be employed for the harder rock formations, if the
advanced levels of design suggested below are not appropriate or cost-effective (see below
for more details).
2. Level II Design based on the unconfined compressive strength results on recovered rock core
specimens in addition to the SPT test. This design is only appropriate when very hard shale
bedrocks exist with SPT N-value greater than 100 bpf or 50 for 6” penetration). For shafts
installed in bedrock formations as those encountered at the Franklin and Broadway sites,
Abu-Hejleh et. al. (2003) described improved strength-based design methods to estimate
their ultimate unit base resistance, unit side resistance, and settlement. In this case, it is
recommended to perform SPT on 70% (this can be adjusted by the geotechnical engineers) of
the test holes. On the other 30% of test holes, to perform SPT until the rock is very hard and
then switch to coring with either triple-walled or double-walled core barrel to recover rock
specimens for the lab strength tests. If reliable rock core specimens cannot be collected
because of the thinly bedded or jointed nature of the weak rock, it is recommended to
4-3
conduct the in situ pressure meter test (PMT) to estimate the strength of the rock. This is a
more advanced and reliable design procedure than Level 1 and can lead to significant savings
to the project.
3. Level III Design based on full-scale load testing of test drilled shafts similar to the
production shafts at certain locations and geotechnical investigation as in Level II on the
remainder of the project. This is the most accurate and advanced level of geotechnical design
and provides all the information the designer needs (unit base and side resistance values, and
settlement at working loads). This level of design is only cost-effective for drilled shafts
embedded in very hard shale bedrocks as those described under Level II Design.
4.2 Requirements for Cost-Effective Load Tests
Consideration of load tests on drilled shafts in the subsurface geotechnical investigation is cost-
effective if all the following conditions are met:
1) Projects with large number of drilled shafts required to support large bridges and when
total construction costs for all phases of the project exceeding $10,000,000. The greatest
number of large bridges that will be supported by drilled shafts will be associated with
limited-access highway corridor improvement projects.
2) Penetration depth of the drilled shafts is controlled by axial load, not lateral load.
3) Presence of:
a. Very hard claystone and/or sandstone shale bedrocks with SPT N value larger than
50/6” and confirmed to be rock-like geomaterial per Colorado Testing Procedure 26-90.
b. Soft Claystone with SPT-N value larger than 50 and when artificial shear rings will be
employed for roughening the sides of the shaft holes.
4) Net savings are expected based on cost-benefit analysis.
If one of these conditions is not met, then the current SPT-based design methods (Level 1)
should be employed for the design of the drilled shafts because savings will not offset the
additional testing costs required in Level 2 and 3 Designs.
4-4
4.2.1 Meeting the 1st and 2nd Requirements
The structural engineer, geotechnical engineer, resident engineer and project engineer for the
project should meet to decide if the 1st and 2nd conditions are met.
As load test costs on large projects will be less than one percent of project costs, there would not
be a significant impact on total project costs even if there were no immediate benefits, which is
an unlikely outcome on most projects.
The load tests performed in the Snowmass Canyon project have the potential to generate savings
in the millions according to Dr. Liu from CDOT Geotechnical Office. The results of the T-REX
and Broadway load tests presented in this report were used to improve the geotechnical design of
the production shafts in these two projects. Broadway’s production shafts were redesigned based
on the load test results. The ultimate side resistance was increased from as low as 4.8 ksf to 15
ksf and for both the side and base resistance the resistance factor, needed in LRFD, was
increased from 0.55 to 0.8. The total savings are estimated at $140,000. More savings are
expected in the future construction of bridges close to the Broadway and Franklin sites (Santa Fe
and Alameda Interchanges) and in bedrock formations with geotechnical properties close to
those encountered at the Broadway and Franklin sites. Based on the Trinidad load test (Chapter
5), it was recommended to reduce the rock socket length for the 4’ diameter shafts from 59 ft to 8
ft. Savings in the Trindiad project from the load tests were $113,000.
4.2.2. Meeting the 3rd Requirement
Preliminary subsurface geotechnical investigation (Phase 1) is recommended to address the 3rd
condition before conducting the complete subsurface geotechnical investigation in Phase 2.
Phase I (Preliminary) Geotechnical Investigation (before or during the scoping stage of the
design) The objective of the 1st phase is to get a general idea of the strength, geology,
characteristics, and the variability of the rock that will support the bridge drilled shafts. Few test
holes should be drilled covering the entire area of the project site. On each test hole, it is
4-5
recommended to perform SPT until the rock is very hard (N-value are much higher than 50/6”)
and then to switch to coring with either triple-walled or double-walled core barrel to recover rock
core samples for the lab strength tests (unconfined compression tests or UCT). The extent of the
geotechnical investigation should be finalized by the Geotechnical Engineer based on the
variability of the rock and the previous geotechnical work in the area.
The presence of very hard and competent claystone and/or sandstone bedrock formation (like at
the Broadway and Trinidad sites) should be verified based on the results of: 1) SPT-N values
(larger than 50/6”), 2) UCT (unconfined strength larger than 40 ksf), and 3) results of Colorado
Testing Procedure 26-90 (to verify it is rock-like geomaterial that is durable, not sensitive to
water, and has very small potential for creep).
It is highly recommended to perform the Phase I investigation before working on the scope of
work for the design of the structure. It could be performed during the Environmental Assessment
Phase of large corridor projects. For bridges that will be replaced, information needed for Phase I
could be obtained from previous geotechnical investigations performed at the old bridge. As a
last resort, it can be performed during the design scoping stage. The cost of a Phase I
investigation is approximately $5000 to $10,000 for several scattered holes along the entire
project site. Additional minimal costs to the project will come from performing two
mobilizations instead of one for the subsurface geotechnical investigation (for Phase I and Phase
II). These costs may be compensated if advanced level of geotechnical investigation found very
cost-effective or from savings in other projects.
4.2.3 Meeting the 4th Requirement
General guidelines to determine the number and type of load test tests are presented in the next
section. Then, additional costs of the load test program and the geotechnical investigation around
the test shafts can be determined. The potential benefits of load tests in increasing the design unit
base and side resistance values and reducing the factor of safety are also discussed in the next
section. Based on the cost and benefit information, the structural engineer will determine the
potential net savings of load tests.
4-6
4.2.4 Finalize the Scope of Work for the Geotechnical Investigation and Design Work
Based on the results of step 3, one of the three levels of geotechnical design and subsurface
geotechnical investigation presented before should be selected and included in the scope of
geotechnical design work. The structural engineer, geotechnical engineer, resident engineer and
project engineer for the project should meet to decide if load tests should or should not be
included in the scope of design work. If the net savings of the load tests were not significant, the
option of Level 2 Design should be considered. It is roughly estimated that the cost of Level 2
geotechnical design and its geotechnical investigation is twice the cost of the 1st level of design.
If the net savings are expected to be minimal or costs are more than savings, Level 1
Geotechnical Design should be recommended.
Guidelines for planning and performing new load tests are described in the next section. An
important decision should be made if the load test can be performed in a timely manner to
develop or change the design recommendations for drilled shafts:
Conducted before the FIR meeting. In this case, the scope of work for Level III design should
be referenced in the scope of design and field work (Scoping stage).
Performed in the FOR design phase where last minute design changes to drilled shafts could
be made. A new contract to perform the load tests may be needed in this case.
Performed per a separate construction project prior to the main construction project, or in the
early stages of the construction project. In these two cases, a caisson design change in a
CMO will be needed. In the construction plans, there should be an option to adjust the shaft
penetration lengths upon completion of load tests. The project planners should be on the
lookout for a situation where a separate project or Phase 1 construction project could be done
for conducting the load test so that the foundation resistance values could be available to
designers in a timely manner to incorporate into the Phase 2 of the project.
4-7
4.3 Guidelines for Planning, Design, and Construction of New Load Tests on Drilled Test
Shafts (Level 3 Design)
Sample Guide Specifications for Osterberg Cell Load Testing of Drilled Shafts are presented in
Appendix B. Revision of Section 503 of CDOT Standard Specifications to incorporate the
Osterberg Cell Load Test in the Broadway construction project is presented in Appendix C.
Level 2 Geotechnical subsurface investigation should be performed along the entire project site.
Based on the results of this investigation, load tests can then performed as presented in the
following subsections.
4.3.1. Purposes and Promotion of New Load Tests Axial loading tests are performed for two general purposes:
To prove that the test shaft is capable of sustaining a given magnitude of an axial load
(“proof test”). In this case, the test shaft is constructed in the same manner as the production
shafts, usually under the construction project contract. The test shaft must sustain a load that
is twice the working load without excessive settlement.
To obtain the side load transfer curve (f-w) curve and fmax for all rock layers that will be
encountered in all the production shafts and the base load transfer curve (q-w curve) and qmax
for the rock layers that will be encountered beneath the production shafts (“load transfer
test”). The load test data can then be used: 1) to design the production shafts with more
confidence (smaller FS around 2 and higher resistance factor φ around 0.8) and using higher
ultimate unit base and side resistance values that may result in significant savings to the
project, 2) as research data to improve the future design methodology of Colorado’s drilled
shafts installed in weak rocks.
4.3.2 Location and Number of the Load Tests Test locations should be selected following one or more of the following criteria:
4-8
At or close to the project site, in a location that represents all of the production shafts on the
project.
At or close to the weakest rock (not relevant if uniform rock is encountered at the site).
In flat areas accessible to large equipments (important with sacrificial shafts constructed
before construction is started).
At or close to shafts with the highest loads.
At or close to locations where perched ground water will be encountered above the rock.
The number of load tests should be determined based on the variability of the site rock layers as
identified in the results of Level 2 geotechnical subsurface investigation. If multiple geologic
formations exist on the site, load testing within each formation should be considered. For a
uniform site, or if the weakest rock will be tested and assumed in the design, a minimum of two
load tests should be performed. A second load is needed to confirm the first load test and to
provide a sense of consistency, especially because capacity of the shafts is influenced so strongly
by construction. If there is consistency between the results of the two tests, resistance factor of
0.8 could be adopted in the design. For research purposes, it is a good idea to consider a load test
in the weakest rock area and a second in the strongest rock area to investigate the correlation
between rock strength and resistance.
4.3.3. Type of Test Shafts (Production or Sacrificial)
The purpose and type of the load test determine the type of the test shaft. Production test shafts
are often selected for proof load test, and sacrificial test shafts are used for load transfer tests.
When the exact locations of the production shafts are not finalized, it is recommended to
consider a sacrificial test shaft. Testing of a production shaft could be risky in some areas (e.g.,
under water). Performing a load transfer test on a sacrificial test shaft during the design phase
would allow for design modifications of the production shafts based on the load test results and
could result in cost savings to the project. If a production shaft is selected, it is best to consider a
standard conventional load test. It is recommended that the O-Cell load test be performed only
on a sacrificial test shaft, not a production shaft, if possible for the following reasons:
4-9
Filling the voids at the bottom of the shaft around and within the O-Cell with grout has a
questionable effect on the structural integrity of the shaft.
With an O-Cell load test on production shaft, the designer needs to add perhaps two feet of
extra penetration of the shaft in the competent rock.
In production shafts, the maximum upward applied load in the O-Cell load test has to be
limited to maintain the functionality of the shafts after test completion. In a conventional load
test, the load is applied downward as expected in production shafts under the service
compression load.
The behavior of Colorado rock socket in side shear after the rock has failed in an O-Cell
loading and the direction of shear stress is reversed is not well-understood. It is possible that
in some cases the performance of the O-Cell loading test on a rock socket could result in
lower side resistance in the same socket under service loading conditions.
However, the Broadway and Franklin test shafts were production shafts that were O-Cell load
tested. In these test shafts, the ultimate base resistance and large portion of the side resistance
were mobilized, resulting in savings to the projects. The performance of these two shafts should
be monitored to study the long-term performance of these production shafts under service loads.
4.3.4. Types, Features, and Costs of Load Tests The conventional static axial load test is the most reliable technique to determine the
performance of shafts in the competent rock. The main limitation of this test is the high cost
associated with set-up, test duration, construction delays, and instrumentation. These limitations
are acute when high capacity foundations are involved (cost as high as a million dollars per test
is reported in the literature). Alternative methods to standard static load testing, therefore, have
been developed; one of these is the Osterberg Cell (O-Cell) load test, which is popular in
Colorado.
The side resistance and base resistance used in the current design methods for shafts are assumed
to be independent (uncoupled) from each other. Therefore, it is recommended in all future load
tests to obtain separate information on both the side resistance and the base resistance. If a
conventional load test is not instrumented, it would not be possible to separate the side resistance
4-10
load transfer curve (f-w curve) from the base resistance load transfer curve (q-w curve). If the
conventional load test is instrumented, it is possible to separate the two load transfer curves and
even to measure any interaction between them. In the loading of a shaft, the side resistance and
base resistance may have an interaction effect (e.g., f-w curve influences the q-w curve).
For the selection of the type of the load test (O-Cell or conventional), consider the following:
Whether the test shaft will be a production or a sacrificial pier, as discussed previously.
The total capacity of the 34 inches O-Cell employed in the Broadway project is around 6000
tons (in two directions). A world record for a total load of 17000 tons was set in Arizona in
2001. Multiple O-cells can be used and placed in the same plane to increase the available test
capacity and/or on two levels to isolate strata of interest. The O-Cell load test allows for
obtaining both the base and side resistance values for uniform type of rock (even with no
instrumentation). It can be planned that the O-Cell loading test will be conducted to failure
either in side resistance or base resistance (whichever occurs first) or for both failures to
occur at the same time. The ultimate base and side resistance were reached (almost) at the
same stage for the I-225 and County Line test shafts. However, it is rare and hard to design
the O-Cell load test for measuring both qmax and fmax from one load test. Therefore, there is a
need to perform two O-Cell load tests to obtain the complete f-w and q-w curves.
Additionally, instrumentation of the O-Cell load test is needed to obtain the f-w curves for
different rock layers along the test socket. Finally, the O-cell test will provide side load
transfer information for loads applied upward not downward as in actual loading of a shaft.
The difference could be significant in granular materials but possibly not in competent
bedrock shales.
The highest capacity of a conventional load test is only (in theory) 4000 tons, and the test
could be massively expensive. Only Caltrans (in the USA) has a beam for that capacity and it
is a huge beam that is enormously expensive to transport and set-up. In Asia, tests
sometimes approach 2000 tons using kentlage by having a 4-story pile of concrete blocks on
the shaft. To alleviate the capacity problem and reduce the cost of conventional load tests,
two conventional load tests are usually performed on smaller diameter shafts (i.e., 2 ft). The
first test is to measure only the side resistance (f-w curve) in the bedrock only (no
contribution from overburden), and the second test to measure only the q-w curve, both in a
4-11
properly designed and controlled manner. The side shear test is accomplished by using a
form material in the bottom of the hole to eliminate base resistance. The base resistance test
is accomplished using an oversized hole or a shear breaker casing to eliminate side
resistance. This approach is widely used and reported in the literature because (According to
personnel communication from Ground Engineering, Inc. of Denver): 1) the side resistance
contribution of overburden soils can be eliminated, 2) good quality data can be obtained from
direct measurements, 3) data interpretation involves less assumption and estimation, and 4)
the test requires smaller jacks and load frame, and as a result, can be performed at a lower
cost. However, a risky extrapolation from a 2-ft-diamater shaft to production shafts more
than 4 ft in diameter shafts may be involved in this process.
Cost of the loading system. The O-Cell load test at the Broadway site using the 34 inches O-
Cell (with total capacity of 6000 tons) costs around $70 K in 2002. This cost covers the
expertise from LOADTTEST, Inc., and their equipment (O-Cell and instruments) and labor
to perform the load test and issue a test report. For a total capacity of 9000 tons, the costs are
expected to be doubled. Therefore, performing the O-Cell load test on smaller-diameter
shafts (up to 5 ft diameter) and scaling the results to larger diameter shafts should be
considered. For a conventional load test on a full-sized drilled shaft (36 - 48 inches in
diameter by 60 - 70 feet deep), that is instrumented, the cost are typically larger than about
$125,000. This cost would include the installation of two to four reaction piers and provision
of a reaction frame capable of resisting 1200 tons of applied load, jack, load cell, reference
beams and deflection measurement instruments, technicians, engineer, etc.
According to the FHWA design manual (1999), the cost of O-Cell test is often in the range of
50% to 60% of the cost of performing a similar small capacity conventional loading test, because
there is no need to construct a reaction system. The conditions under which the cost of
conventional loading tests may be nearly the same as for O-Cell tests are: (a) low capacity, less
than 1200 tons, because 1200-ton reaction frames are generally available around the country, and
(b) tests on shafts (production or sacrificial) using production shafts as reaction shafts (which cut
out the costs for the reactions). For shafts with capacity higher than 1200 tons, the choices are to
scale the test shaft downward in size, use the Caltrans frame, or use an expedient innovative load

4-12
tests as the O-Cell or Statnamic device methods. Statnamic load tests can be done after the shaft
has been installed whereas the O-Cell test cannot. Statnamic or other high-strain load tests are
probably more cost-effective than O-Cell load tests but methods of interpretation of these tests
are not finalized yet.
Based on the above, it is recommended to consider the O-Cell load test for the high-capacity
production drilled shafts (ultimate load larger than 1500 ton), and either the O-Cell load test or
the conventional load test for low-capacity production shafts. The possibility to perform
Statanmic tests should remain open. It is also recommended for CDOT to perform side-by-side
O-Cell loading test and a top-down (standard) loading test at a couple of sites (e.g., soft
claystone bedrock and very hard claystone or sandstone bedrock). This might allay any doubts
that some engineers might have that those O-Cell tests give something close to the correct
results. This issue and the recommendations for the use of the statnamic tests should all be
addressed in NCHRP project 21-08. One of the objectives of this on-going research project is to
evaluate innovative load testing methods for deep foundations and recommend interim
procedures for use and interpretation of these tests.
4.3.5. Geotechnical Investigation around the Test Shaft If the geotechnical subsurface investigation at the location of load test is performed before
construction of the test shaft, drill test holes as close as possible to the future center-location of
the test shaft. If drilling will be performed after construction of test shafts, and in order to get a
picture of the undisturbed material and at the same time stay close enough to the shaft, it is
recommended to drill the test holes at one pier diameter (D) from the edge of test shaft (3D/2
from the center of the shaft). Subsurface geotechnical investigation methods at the test holes will
include auger drilling with standard penetration testing, coring with subsequent laboratory testing
on recovered core specimens, and, if needed, in situ pressuremeter testing. A large number of
tests will be performed for each weak rock layer to accurately (as much as possible) acquire its
geotechnical properties. No that if the claystone or sandstone shale layer is very hard, two test
holes will be needed as there will be no need to perform the pressuremeter tests.
4-13
Three test hoes are recommended to be drilled around the test shaft:
1. In the first test hole, SPT tests shall be made at 2.5-foot vertical intervals in the overburden
and in the weak rock, or whenever a sand or friable sandstone layer is encountered. Disturbed
soil and rock samples recovered with the split spoon sampler will be identified and classified
visually in order to demonstrate correspondence with the core runs that will be taken in the
second borehole. The first borehole will remain open for a period sufficient to ascertain
whether free ground water seeps into the borehole and, if so, long enough to determine the
final piezometric level of the ground water. The initial and final piezometric level of the
ground water will be reported
2. In the second test hole, the borehole will be drilled to accommodate HQ- or NX-sized core
barrels and collect rock core runs. An unconfined compression test to determine the rock
unconfined compressive strength and other lab tests will be conducted on each rock sample
as described by Abu-Hejleh et. al. (2003).
3. Based on the test results, visual examination of the recovered samples and core runs, and
drilling information, the boundaries of different weak rock layers will be defined.
4. In the third test hole, and for each uniform rock layer, at least one Menard pressuremeter test
will be performed. From the pressuremeter test (PMT) data, the coefficient of lateral earth
pressure at rest, the initial, reload, and unload moduli, and the cohesive shear strength of the
rock will be determined and reported. CDOT Research Report 2003-8 (Abu-Hejleh et. al.,
2003) provides guidelines for preparation of the test holes for the PMT and conducting the
test in accordance with ASTM D-4719 and for analysis of the test data.
5. A test report describing the location and conditions of the load test site, geological setting
and formations, results of subsurface exploration, laboratory testing, and subsurface
conditions will be prepared.
4.3.6. Design of the O-Cell Load Test The study will recommend the use of the O-Cell load test in Colorado’s future drilled shaft load
tests until more cost-effective and innovative load test methods become available.
The layout, construction process, and material of the test shafts should be similar to those
planned for the production shafts.
4-14
Specific Objectives of Load Tests: The first task in the design of a load test program is to
predict the ranges of unit resistance values that should be expected from the load test (that will
be performed) based on the results of subsurface geotechnical tests and results of previous load
tests in similar rock formations. That is to establish a lower limit of fmax (fmaxL) and upper limit
(fmaxU), and a lower limit of qmax (qmaxL) and upper limit (qmaxU) and the measured maximum unit
resistance values are expected to fall between these ranges. The fmaxU should be as close as
possible to the highest possible true unit side resistance of the weak rock. The qmaxU should be as
close as possible to the highest possible true unit base resistance for soil-like claystone bedrock,
and to exceed the unit base resistance value that corresponds to a settlement larger than 0.05 D
(preferred 0.1 D) for the very hard claystone and sandstone bedrock shales.
Two O-Cell load tests on two separate test shafts at two different locations are highly
recommended. If the project budget allows for just only one test shaft, the designer may consider
the option of a load test with two Osterberg cells placed at two levels inside one test shaft. This
test can be designed to obtain both the f-w and q-w curves. The discussion below assumes two
separate O-Cell load tests on two separate test shafts.
The results of the first load test should be obtained before the test shaft for the second load test is
constructed. This is to correct for any problem encountered in the first load test and to make
modifications to the location of the O-Cell in the second load test.
The primary objective of the first load test is to obtain the side resistance load transfer curve
(f-w curve) up to fmaxU, and the secondary objective is to obtain a portion of the base
resistance load transfer curve (q-w curve), which will be confirmed from the second load test.
It is important for this to be the objective of the first load test because:
o Almost 90 % of the resistance to working loads at the Franklin and Broadway shafts
was provided by means of side resistance, and then base resistance picked up the rest of
the load resistance. The q-w curve for the Broadway shaft was linear (no yielding) up to
the end of the test, suggesting that the true base resistance is higher than the resistance
measured at the defined displacement criterion (0.05D).
4-15
o For some bedrock formations, it is reported (FHWA, 1999) that side resistance might
be lessened past the peak resistance (referred to as brittle behavior). This should be
investigated for Colorado weak rocks as it has important consequences for the design.
The primary objective of the second load test (unless modified based on the results of the
first load test) is to obtain the complete q-w curve up to qmaxU, and the secondary objective is
to obtain a portion of the f-w curve, which will confirm the results of the 1st load test.
Layout of the Test Shafts: Depth of overburden to competent rock should be determined from
the subsurface geotechnical investigation. The length (L) and diameter (D) for the embedment of
all the production shafts in the rock should initially be computed based on the recommendations
of the geotechnical engineer for the construction project. Using the fmaxL and qmaxL, and a
resistance factor of 0.8 (or FS of 2), L and D should be reevaluated for all production shafts to
estimate the potential cost savings from the load tests. These savings could be finalized after the
load test results are obtained.
If more than one alternative for shaft diameters is recommended in the project, and if the money
is available, it would be best to test the larger diameter shaft, then scale the load test result down,
which should be safe theoretically. However, to reduce cost of loading tests, it is recommended
to determine fmax and qmax from tests on the small-diameter drilled shaft and then scale the results
to the larger diameter shafts as discussed by Abu-Hejleh et. al. (2003). Test shafts should not
have D less 0.5 the diameter of the prototype shaft, nor should they be less than 2.5 ft. Based on
experience, the benefits of load tests are more for smaller shaft diameters (4 ft not 7 ft). The real
problem with scaling seems to come when one discovers that it is far cheaper to drill a six-inch-
diameter socket and subject it to a pullout test to measure unit side resistance in order to apply
the measured value to the design of larger-diameter shafts. O’Neill et. al. (1996) found that the
unit side resistance on such small test sockets was about 2.7 times that on the full-sized drilled
shafts-a disaster if this information is applied directly to a larger production shaft.
In the design of the load tests, the longest L value should be considered (including the L
expected for the larger diameter shafts) in order to obtain f-w and q-w curves for all rock layers
4-16
expected in the production shafts. The influence of different L values (e.g., from 12 ft to 21 ft) on
the measured resistance values is expected to be small.
1st O-Cell load test: to ensure that almost all the “push” will be upward and guarantee side shear
failure will occur in the test socket above O-Cell before base failure, and to take advantage of
most of the stroke of the O-Cell,
qmaxL x Ab ≥ (L2-L1) 3.14D x fmaxU + overburden side resistance, .....................................…… 4.1
Capacity of O-Cell ≥ (L2-L1) 3.14D fmaxU + overburden side resistance, ....................................4.2
where L2 and L1 are the lengths of shafts in the competent rock above and below the O-Cell.
Based on Eqs. 4.1 and 4.2, the proper location and capacity of the O-Cell can be determined.
For the second load test, the O-Cell needs to be placed at the bottom of the test shaft, and L2
should be large enough to guarantee a base failure before side failure:
qmaxU Ab ≤ (L2 –L1) x 3.14D fmaxL + overburden side resistance, .................................................4.3
Capacity of O-Cell ≥ qmaxU Ab+ L1 x 3.14D fmaxU ......................................................................4.4
4.3.7. Instrumentation of the Test Shafts Consider the use of LVDTs to measure accurately the upward movement of the O-Cell and top
of the shaft. The sets (four gages per set) of strain gages (Geokon Model #4911) should be
placed at the boundaries between soil and competent rock (if the test shaft will extend through
the overburden) and between the different rock layers as determined in the subsurface
geotechnical test report. Consider the placement of proper type of strain gages at the bottom of
the reaction socket if the O-Cell will not be placed close to the base of the test shaft. The Geokon
sister bars that house the Geokon Model # 4911 strain gage are 4 feet long. This means that the
measurement should be taken 2 ft above the bottom and that the reaction socket has to be at least
4 feet long. Other types of vibrating wire strain gages could be made 2 feet long and work.
4-17
However, non-uniform stress distribution exists over the cross section for 0.5 D to D below the
O-Cell. Therefore, end strain gages could help if the reaction socket is long. For direct
measurements of base resistance for test shafts with reaction socket, consider a second O-Cell, a
commercial flat jack, or Geokon pressure cells placed right on the bottom of the reaction socket.
The thickness of the steel plates around the O-Cell (see Figure 3.1) should be 3 inches (2 inches
employed for test shafts reported in this study), and the diameter of the bottom plate should be as
close as possible to the diameter of the shaft.
Consider the use of four telltales to get compression data of the test shaft and measure any tilting.
It seems that there is evidence of small tilting of the O-Cell in almost all O-Cell load tests
performed in the T-Rex and Broadway projects. This is a problem that O-Cell vendors need to
address, because if the cell tilts, the friction in the socket changes in some unpredictable way.
The influence of this small tilting is unknown, but it should be minimized by having a high
quality, uniform, and thick concrete pad below the O-Cell. Consider construction of a good base
using high strength grout below the O-Cell to minimize tilting. Consider the use of two PVC
pipes that extend past the O-Cell to place this grout. Post-grouting the base of the shaft is needed
when the hole is “wet” as will be discussed in the next subsection.
4.3.8. Construction of the Test Shafts Use augers with cutting teeth for drilling for rapid and continuous drilling of the shaft hole with
minimal use of water during drilling, and no use of slurry and casing in the portion of rock
socket used for load resistance.
The construction plans should include language that empowers the Engineer (e.g., “subject to the
Engineer’s approval”), and that leaves some details (e.g., location of O-Cell and strain gages)
open. The project engineer should approve the plans for the O-Cell load tests and should be able
to make changes to the locations of the O-Cell and strain gages. The design engineer should
provide Revision of Section 503, Osterberg Cell Load Test (see Examples in Appendices B and
C). Other details are described in the following. The test shafts should be constructed in
accordance with Section 503 of CDOT standard specifications and EXCATLY/IDENTICAL as
4-18
expected in the production shafts (the same materials, drilling method, cleaning procedure, and
placement of concrete). The rate of rise of concrete in the production shaft should be at least 12
m (40 feet) per hour and the slump is 7 - 8 inches in order to ensure that ground stresses have
reestablished. For shafts embedded in hard rocks, the compressive strength of the concrete of the
test shaft should be at least 4000 psi or a higher value specified by the load test company to
ensure that the concrete will not be crushed during the test. The compressive strength and
stiffness of the concrete at time of load test must be determined in the lab and used to estimate
the composite Young modulus of the shaft.
Eliminate the contribution of overburden to side resistance by installation of a temporary casing
to top of rock and keep it there until the test is complete. The concrete would then be placed to 1
ft below bottom of casing. The contractor needs to ensure that the casing and concrete are not
mechanically connected.
Contingent grouting procedure should be specified that would be employed if the test shafts
turned to be wet during construction. If the shaft is dry then no grouting is required. A wet shaft
is defined as a shaft filled with water- or shaft that even if pumped out, has a water intrusion rate
higher than the pumping out rate. In this case, CDOT placement procedure for the concrete
might lead to low quality concrete above or below the O-Cell. Basically, it will be hard to get a
tremie pipe past the O-Cell. Placing a concrete plug/pad may be work with little water. But with
significant water, grouting is the best procedure to ensure uniform high quality concrete/grout
around and below the cell. The grout should be placed below the O-Cell (1 ft) and above the O-
Cell (around 2 ft). The grout strength will be very close to the strength of the concrete of the
production shafts (around 4000 psi is OK). The grout should be a standard mix and be installed
according to CDOT placement standards for drilled shafts under water. Make cylinders of the
fresh grout mix as you do for fresh concrete and make sure that CDOT strength requirements for
the grout are met. After placement of grouting for two feet or so above O-Cell, the construction
and materials of the remaining of the test shafts will follow CDOT requirements for placement of
concrete under water (Section 601.12f), and as approved by the engineer.
4-19
4.3.9. Data Collection at the Load Test Site Three types of data should be collected:
A report for the subsurface geotechnical investigation for the entire project (Level 2
Geotechnical Investigation) and at the load test site.
A report on the load test from the testing company. These data will be analyzed very
carefully as described in the next section to obtain the f-w curve and fmax for rock layers
around the test shaft and q-w curve and qmax for all rocks layer beneath the test shaft, and to
construct the top load-settlement curve.
Cost, total and net saving of the load tests to the project, and other benefits of the load tests.
Location, layout, materials, and construction information of the test shaft, including:
o Map description of the location of the test shaft, including its coordinates (northing,
easting, and elevation) if possible.
o Layout of the test shaft: diameter of the shafts (D), length of shaft in the overburden (Lo),
and length of the bedrock socket (L), and depths to: groundwater level (GWL),
competent bedrock, top and base of the shafts, the O-Cell, and the sets of strain gages.
o Date of construction the test shafts, and times when excavation/drilling started and
completed, and times when concreting started and completed. Use these information to
estimate the time the hole was open (beginning of socket excavation up to the time of
start of placement of concrete) and rate of concrete placemat (ft/hour).
o Methods/procedure for: excavation/drilling (e.g., auger or core barrel), cleaning the base
and sides of the borehole, and placement of the concrete. Was any water tipped into the
borehole to aid in removal of cuttings?
o Was the hole wet or dry? Possible sources of this water, if any and its amount (could be
measured from water accumulated at the base of shaft hole at end of the drilling
operations).
o Any available information on the smoothness of the sides of the borehole in the rock
including any estimates (even if rough) of the depth, width, and spacing of grooves. If
possible, caliber the test pier borehole and obtain its roughness profile using laser devices
or mechanical devices. At minimum, have the inspector use some sort of feeler (or
visually) and determine the depth of the deepest grooves.
4-20
o Slump and rate of placement of the fresh concrete. The unconfined compressive strength
and stiffness of the concrete at time of load test should be determined in the lab, and used
to estimate the composite Young modulus of the shaft, Ec.
Examples of the construction, materials, and layout information collected for the Broadway and
T-REX test shafts are shown in Table 4.1. Construction information includes: date of
construction, time required for excavation of the shaft hole, amount of ground water accumulated
at the base of shaft hole at end of the drilling operations, information on the smoothness of the
shaft side walls, slump and placement time of the fresh concrete, and the concrete compressive
strength (f’c) at time of load test. Included in Table 4.1 also the composite Young modulus of the
shaft, Ec, defined as the sum of the concrete area multiplied by concrete modulus and steel area
multiplied by the steel modulus divided by the entire test shaft area. The values of Ec were taken
from the LOADTEST, Inc. test reports (2002). The concrete modulus (ksf) was estimated using
the ACI formula as 8208 (f’c)0.5, where the units of f’c are in psi. Layout information of each test
shaft includes diameter of the shaft (D), length of shaft in the overburden (Lo), length of the
bedrock socket (L), and depths to: groundwater level (GWL), competent bedrock, top and base
of the shafts, the O-cell, and the 1st and 2nd levels of strain gages). Complete information on the
excavation and concrete placement methods of the drilled shafts are presented in Chapter 2.
4.4 Analysis of Osterberg Cell (O-Cell) Load Test Results
The recommended analysis of the O-Cell load test results is similar to the analysis employed by
Abu-Hejleh et. al. (2003) for the analysis of the O-Cell load tests performed in the T-REX and
Broadway projects, as presented in the following sections.
A photograph of the Osterberg Cell is shown in Figure 4.1. The O-Cell test is performed by
applying hydraulic pressure to the O-Cell which acts equally in two opposing directions, resisted
by side shear above the O-cell and by both base resistance and side shear in the reaction socket
below the O-Cell. The load increments were applied using the Quick Load Test Method (ASTM
D1143). The test shafts were also instrumented to record the upward deflection of the shaft head
and upward and downward movement of the O-Cell as the load is applied in increments (Figure
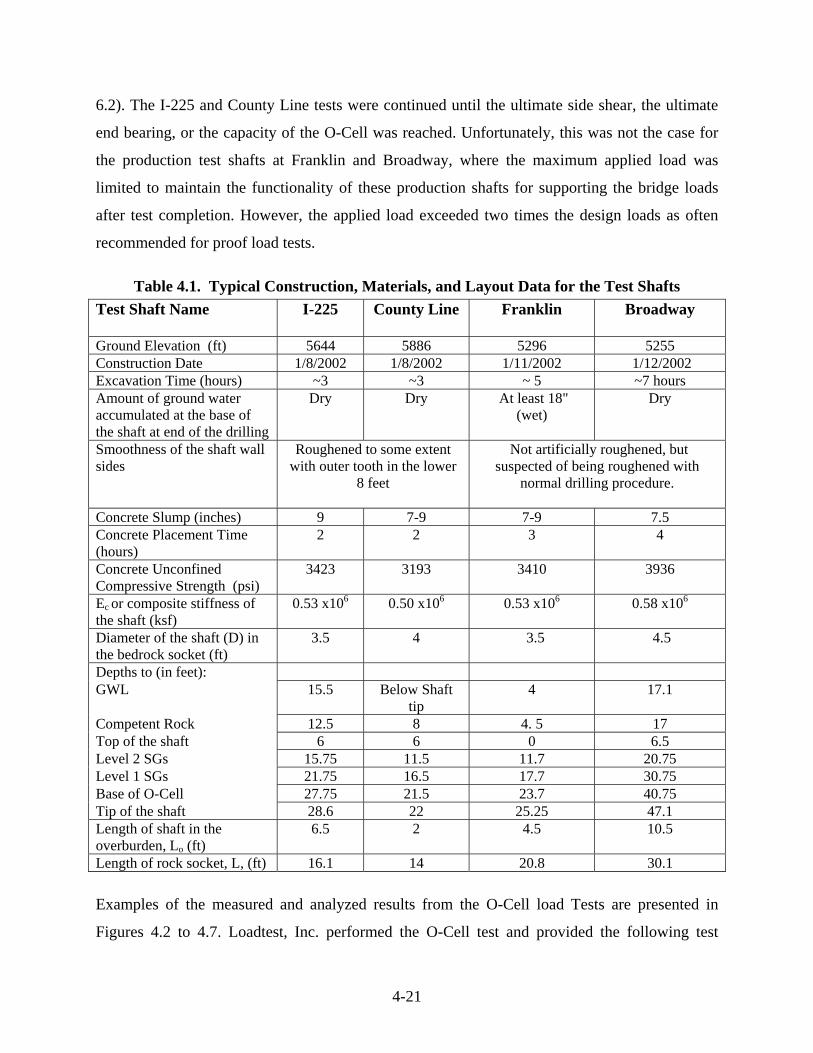
4-21
6.2). The I-225 and County Line tests were continued until the ultimate side shear, the ultimate
end bearing, or the capacity of the O-Cell was reached. Unfortunately, this was not the case for
the production test shafts at Franklin and Broadway, where the maximum applied load was
limited to maintain the functionality of these production shafts for supporting the bridge loads
after test completion. However, the applied load exceeded two times the design loads as often
recommended for proof load tests.
Table 4.1. Typical Construction, Materials, and Layout Data for the Test Shafts Test Shaft Name I-225 County Line Franklin Broadway
Ground Elevation (ft) 5644 5886 5296 5255 Construction Date 1/8/2002 1/8/2002 1/11/2002 1/12/2002 Excavation Time (hours) ~3 ~3 ~ 5 ~7 hours Amount of ground water accumulated at the base of the shaft at end of the drilling
Dry Dry At least 18" (wet)
Dry
Smoothness of the shaft wall sides
Roughened to some extent with outer tooth in the lower
8 feet
Not artificially roughened, but suspected of being roughened with
normal drilling procedure.
Concrete Slump (inches) 9 7-9 7-9 7.5 Concrete Placement Time (hours)
2 2 3 4
Concrete Unconfined Compressive Strength (psi)
3423 3193 3410 3936
Ec or composite stiffness of the shaft (ksf)
0.53 x10⁶ 0.50 x10⁶ 0.53 x10⁶ 0.58 x10⁶
Diameter of the shaft (D) in the bedrock socket (ft)
3.5 4 3.5 4.5
Depths to (in feet): GWL 15.5 Below Shaft
tip 4 17.1
Competent Rock 12.5 8 4. 5 17 Top of the shaft 6 6 0 6.5 Level 2 SGs 15.75 11.5 11.7 20.75 Level 1 SGs 21.75 16.5 17.7 30.75 Base of O-Cell 27.75 21.5 23.7 40.75 Tip of the shaft 28.6 22 25.25 47.1 Length of shaft in the overburden, Lo (ft)
6.5 2 4.5 10.5
Length of rock socket, L, (ft) 16.1 14 20.8 30.1
Examples of the measured and analyzed results from the O-Cell load Tests are presented in
Figures 4.2 to 4.7. Loadtest, Inc. performed the O-Cell test and provided the following test
4-22
results: gross O-Cell load versus upward and downward movement of the O-Cell (Figure 4.2),
and, from results of strain gages, unit side resistance for different zones across the test shafts vs.
the upward movement of the O-Cell (Figure 4.3), and the equivalent top load vs. settlement
curve. It is assumed in the Loadtest, Inc. analysis and in this study that the measured relations for
side resistance versus upward movement (as in an O-Cell test) in any zone are equivalent to side
resistance versus downward movement in that zone.
4.4.1 Determination of the Load Transfer Curves
For research and design needs, it was important to extract from the O-Cell data the most accurate
load transfer curves for the weak rocks: settlement (w) versus base unit resistance (q) until the
maximum unit base resistance qmax is reached for the weak rock layer encountered beneath the
test shaft, and side movement (w) vs. unit side resistance (f) until the maximum unit side
resistance fmax is reached for all weak rock layers encountered across the test shaft.
f-w Curves: There are many sources for errors in estimating the side resistance from only the
strain gages (Abu-Hejleh et. al, 2003). In addition to the results from strain gages, it was deemed
more accurate to estimate the average shaft side resistance along the entire shaft segment
embedded in the competent rock, requiring no data from strain gages (Figure 4.4). Because the
resistance to working loads is provided mostly by means of side resistance, this approach was not
only more accurate but also was more conservative than using side resistance values estimated
with the strain gages. This approach for estimating side resistance was recommended by NCHRP
project 21-08 for design purposes.
The movement of a given segment of the test socket is somewhere between the O-Cell upward
movement and the top-of-shaft movement. At the Franklin site, the measured upward movement
of the shaft at the end of the load test ranged from 0.154 inches at the O-Cell to 0.104 inches at
the top of the shaft. The difference, due to compression of the shaft, was almost 33% (large) of
the total measured upward movement of the O-Cell (0.154 inches). The average side movement
of the shaft in the bedrock zone under consideration, w, was calculated and presented graphically
against the average measured side resistance in that zone, f . This includes curves of average side
resistance versus average side movement in the entire bedrock socket (Figure 6.4) and similar
4-23
curves extracted based on results of strain gages (Figure 4.3). In order to estimate the side
resistance in the entire bedrock socket only, the small contribution of overburden to the overall
side resistance measured in the O-Cell tests was neglected in the very hard claystone and
sandstone at Franklin and Broadway shafts, and was roughly estimated in the soil-like claystone
at I-225 and County Line shafts. For correlation purposes, the average weighted SPT-N values
and rock strength was estimated in different zones where f-w curves were generated using the
measured results from the geotechnical testing program performed around the test shafts.
q-w curves: The maximum O-Cell downward load was resisted mostly by the shaft base
resistance at County Line, I-225 and Franklin. At these sites, the base resistance, q, versus
settlement, w, relation could be obtained directly from the test results provided by the testing
company. For the Broadway test shafts, the O-Cell downward load was resisted by both the end
bearing at the tip of the shaft and by the side resistance of the shaft segment beneath the O-Cell
(referred to as the reaction socket). The side resistance component of the reaction socket was
significant in the Broadway shaft because the length of the reaction socket was large (6 ft).
Extracting the base resistance versus settlement relation for the bedrock beneath the tip of the
Broadway shafts required a method to estimate the contribution of the side resistance of the
reaction socket to the shaft overall measured resistance beneath the O-Cell. Unfortunately, there
were no side strain gages placed around the tip of the shaft to estimate the shaft side resistance of
the reaction socket. Hence, there was much uncertainty in trying to reconstruct base resistance
versus settlement curve for the Broadway test shaft. Side resistance vs. movement response
beneath the O-Cell roughly could be estimated through two alternatives:
Use the side resistance vs. movement curve measured from O-Cell to the next level of strain
gages. This could be a reasonable assumption if the rock strength below and above the O-
Cell is similar. However, this could also be questionable due to many sources of errors in
strain gages results as discussed before.
Use the side resistance vs. movement curve obtained for the entire bedrock socket above the
O-Cell. This is conservative approach for estimating the side resistance and possibly could
overestimate the base resistance.
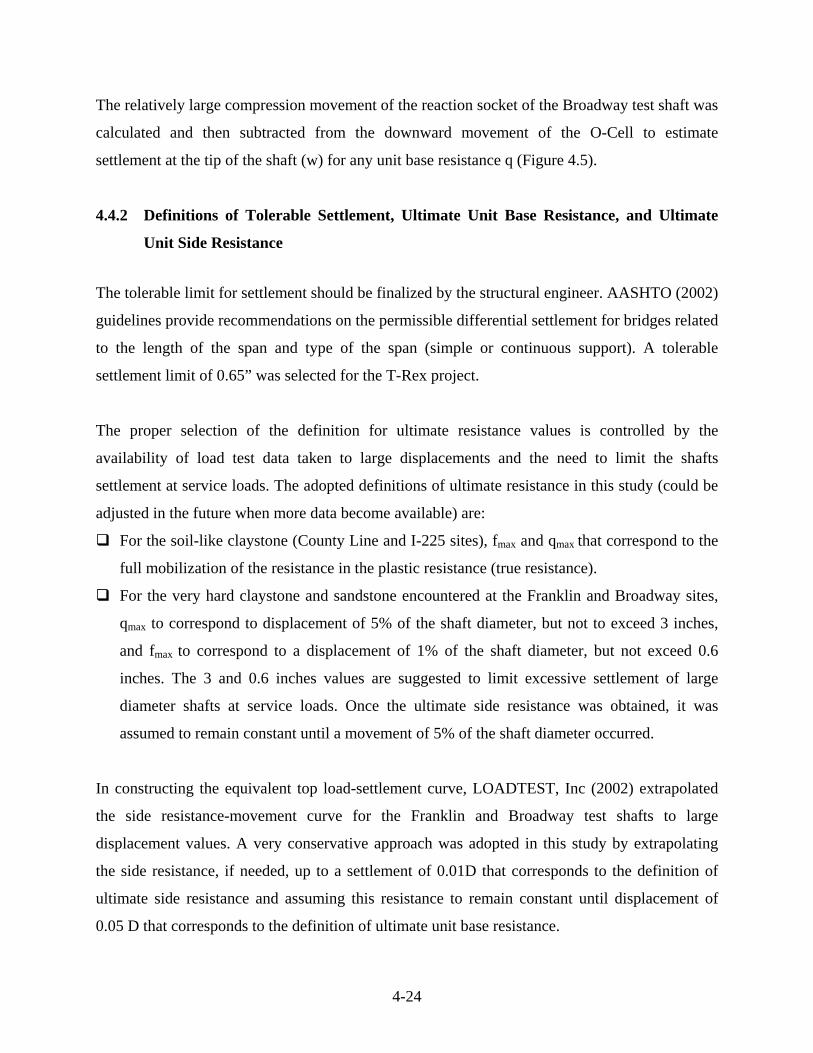
4-24
The relatively large compression movement of the reaction socket of the Broadway test shaft was
calculated and then subtracted from the downward movement of the O-Cell to estimate
settlement at the tip of the shaft (w) for any unit base resistance q (Figure 4.5).
4.4.2 Definitions of Tolerable Settlement, Ultimate Unit Base Resistance, and Ultimate
Unit Side Resistance
The tolerable limit for settlement should be finalized by the structural engineer. AASHTO (2002)
guidelines provide recommendations on the permissible differential settlement for bridges related
to the length of the span and type of the span (simple or continuous support). A tolerable
settlement limit of 0.65” was selected for the T-Rex project.
The proper selection of the definition for ultimate resistance values is controlled by the
availability of load test data taken to large displacements and the need to limit the shafts
settlement at service loads. The adopted definitions of ultimate resistance in this study (could be
adjusted in the future when more data become available) are:
For the soil-like claystone (County Line and I-225 sites), fmax and qmax that correspond to the
full mobilization of the resistance in the plastic resistance (true resistance).
For the very hard claystone and sandstone encountered at the Franklin and Broadway sites,
qmax to correspond to displacement of 5% of the shaft diameter, but not to exceed 3 inches,
and fmax to correspond to a displacement of 1% of the shaft diameter, but not exceed 0.6
inches. The 3 and 0.6 inches values are suggested to limit excessive settlement of large
diameter shafts at service loads. Once the ultimate side resistance was obtained, it was
assumed to remain constant until a movement of 5% of the shaft diameter occurred.
In constructing the equivalent top load-settlement curve, LOADTEST, Inc (2002) extrapolated
the side resistance-movement curve for the Franklin and Broadway test shafts to large
displacement values. A very conservative approach was adopted in this study by extrapolating
the side resistance, if needed, up to a settlement of 0.01D that corresponds to the definition of
ultimate side resistance and assuming this resistance to remain constant until displacement of
0.05 D that corresponds to the definition of ultimate unit base resistance.
4-25
4.4.3 Construction of the Equivalent Top Load-Settlement Curve from the Results of the
O-Cell Test.
Applying the definitions for ultimate resistance as presented before, qmax and fmax (fmax for the
entire bedrock socket) were obtained and utilized to calculate the ultimate resistance load of the
shaft, Qmax, as Abqmax+Asfmax where Ab and As are, respectively, the base and side areas of the
shaft in the rock. The allowable design base and side resistance values and loads as determined
from the O-Cell load test results can be determined using FS (factor of safety) of 2 as qall=
qmax/2, fall= fmax/2, and Qall= Qmax /2.
Using the obtained q-w and f-w curves, the elastic stiffness of the shaft (Ec), load-settlement
curves can be constructed accurately using several programs available in the market (e.g.,
SHAFT, APILE or SPILE). These programs account for the shaft compressibility using
sophisticated load-transfer analyses.
A simple procedure is also recommended to construct a simple load-settlement curve as follows.
Assume initially that the shaft behaves as a rigid shaft and therefore settlement (w) at base and
head of the shaft are the same. For arbitrary settlement, w, the corresponding unit side resistance,
f, and base resistance, q, are estimated from the extracted q vs. w and f vs. w curves. (f for the
entire bedrock socket). Note that uniform unit side resistance distribution is assumed across the
entire bedrock socket, estimated for any movement w from the f-w curve. The shaft side
resistance in the overburden is neglected. Then, the shaft resistance load or the equivalent top
load, Q, for the arbitrary settlement, w, can be estimated by adding the base resistance load (Qb=
Abq) to the side resistance load (Qs = Asf) as Q= Qb + Qb = Abq+Asf. This should be repeated for
several arbitrary values of settlements to obtain several (Q, w) points up to the ultimate
resistance load or Qmax (Figure 4.6).
The shaft head load-settlement curve should then be modified to take into account the
compressibility of the shaft, in which the settlement of the shaft head is w+δ, where δ is the
elastic shortening of the shaft, and settlement of the shaft base is w. The elastic compression is
only important in high-capacity drilled shafts embedded in hard claystone and sandstone bedrock
4-26
(e.g., Franklin and Broadway shafts). For any arbitrary settlement of w, calculate Q, Qs, and Qb
as for rigid shafts. The axial load in the shaft in the overburden is Q (no change from top load
because side resistance in the overburden is assumed negligible). The shaft axial load at the base
is Qb. The average shaft axial load in the bedrock socket is (Q+Qb)/2. The additional elastic
settlement can now be calculated as δ =(Q/AbEc) Lo+ L/(AbEc) (Q+Qb)/2 , where Lo is the length
of the shaft in the overburden and L is the length of the shaft in the rock. Now a new point of (Q,
w+δ) is obtained. This should be repeated for several arbitrary values of settlements, w, to obtain
several (Q, w+δ) points up to the ultimate resistance load or Qmax (Figure 4.6). To simplify the
analysis and to be conservative, similar Q is assumed for both rigid and compressible cases
(Figure 4.6, difference only in settlements). In reality, the additional elastic compression of the
shaft generates more side movement (more than w) leading to additional side resistance. This
requires adjustment of the resistance load of the shaft (Q) in an iterative procedure until the
change in load between two successive iterations become negligible.
4.4.4. Construction of A simple Equivalent Top Load-Settlement Curve from the Results
of Simple Geotechnical Tests
It would be of interest to get an approximate estimate for the load-settlement curve, especially
settlement under working loads, as a function of the results of simple geotechnical tests. A head
load versus settlement curve for rigid drilled shafts can be approximated as two linear segments
with three points (0,0), (Qd, 0.01D), and (Qmax, 0.05D) as shown in Figure 6.7. The ultimate shaft
resistance load (Qmax) corresponds to a settlement of 0.05D. At a settlement of 0.05 D, most of
the base and side resistance for shafts embedded in different types of weak rocks are mobilized.
This study will define qd, fd, needed to calculate Qd = Abqd+Asfd, respectively as the base
resistance and side resistance that correspond to settlement equal to 0.01D. Then, the developed
load-settlement curve can be adjusted for elastic deformation if necessary. Analysis of adequate
number of load tests in the future should attempt to identify correlation relations between qmax,
fmax, qd , fd and the simple test results of SPT, UC, and PM test data as was performed by Abu-
Hejleh et. al. (2003).
4-27
Figure 4.1. Photo of the O-Cell Placed in the Broadway Test Shaft.
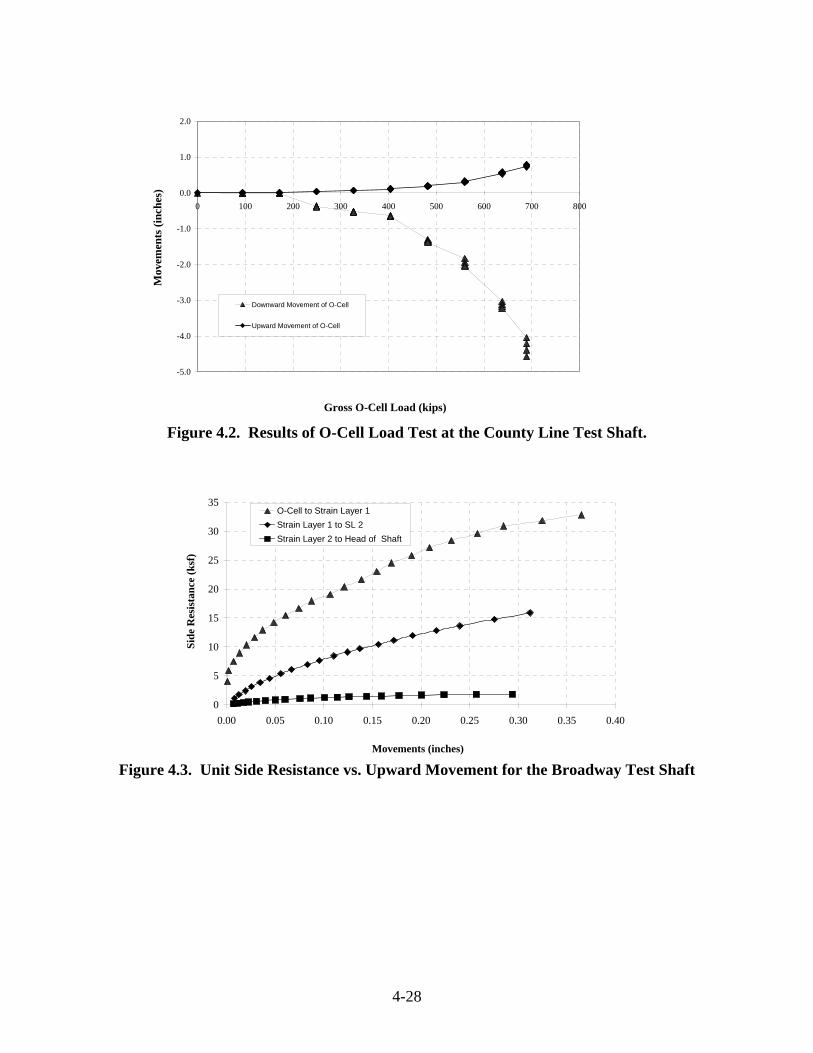
4-28
Figure 4.2. Results of O-Cell Load Test at the County Line Test Shaft.
Figure 4.3. Unit Side Resistance vs. Upward Movement for the Broadway Test Shaft
-5.0
-4.0
-3.0
-2.0
-1.0
0.0
1.0
2.0
0 100 200 300 400 500 600 700 800
Gross O-Cell Load (kips)
Mov
emen
ts (i
nche
s)
Downward Movement of O-Cell
Upward Movement of O-Cell
0
5
10
15
20
25
30
35
0.00 0.05 0.10 0.15 0.20 0.25 0.30 0.35 0.40
Movements (inches)
Side
Res
ista
nce
(ksf
)
O-Cell to Strain Layer 1Strain Layer 1 to SL 2Strain Layer 2 to Head of Shaft
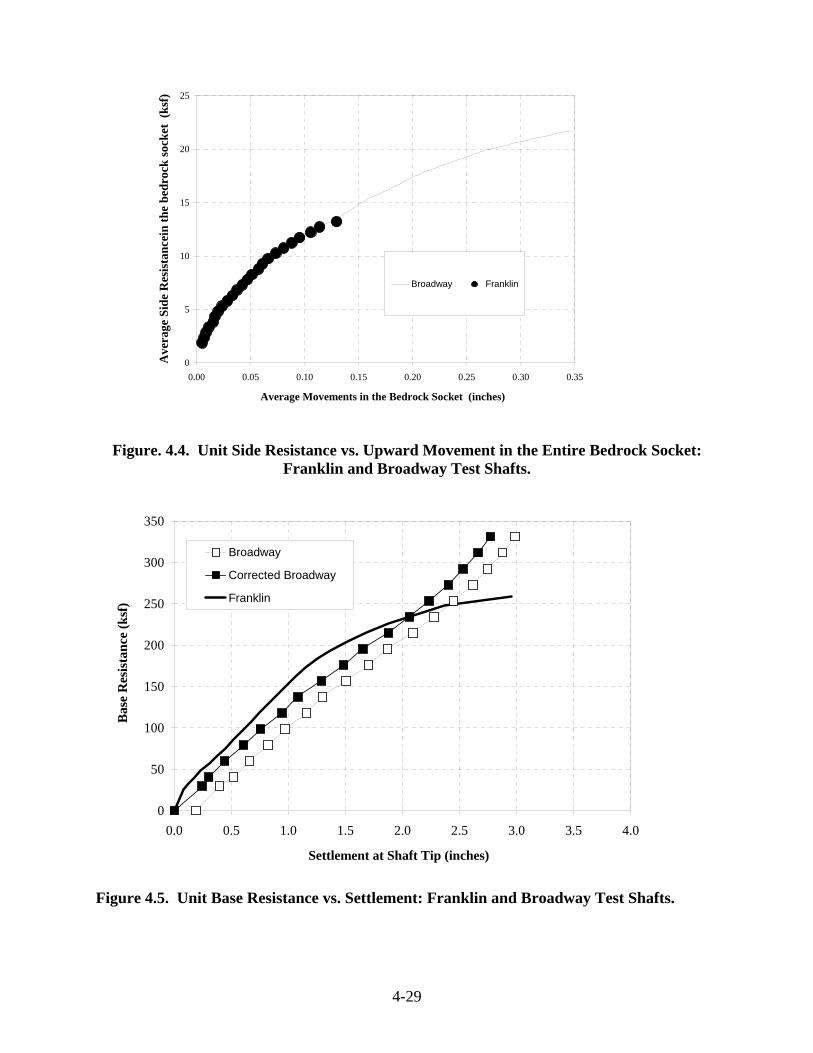
4-29
Figure. 4.4. Unit Side Resistance vs. Upward Movement in the Entire Bedrock Socket:
Franklin and Broadway Test Shafts.
Figure 4.5. Unit Base Resistance vs. Settlement: Franklin and Broadway Test Shafts.
0
5
10
15
20
25
0.00 0.05 0.10 0.15 0.20 0.25 0.30 0.35
Average Movements in the Bedrock Socket (inches)
Ave
rage
Sid
e R
esis
tanc
ein
the
bedr
ock
sock
et (
ksf)
Broadway Franklin
0
50
100
150
200
250
300
350
0.0 0.5 1.0 1.5 2.0 2.5 3.0 3.5 4.0
Settlement at Shaft Tip (inches)
Bas
e R
esis
tanc
e (k
sf)
Broadway
Corrected Broadway
Franklin
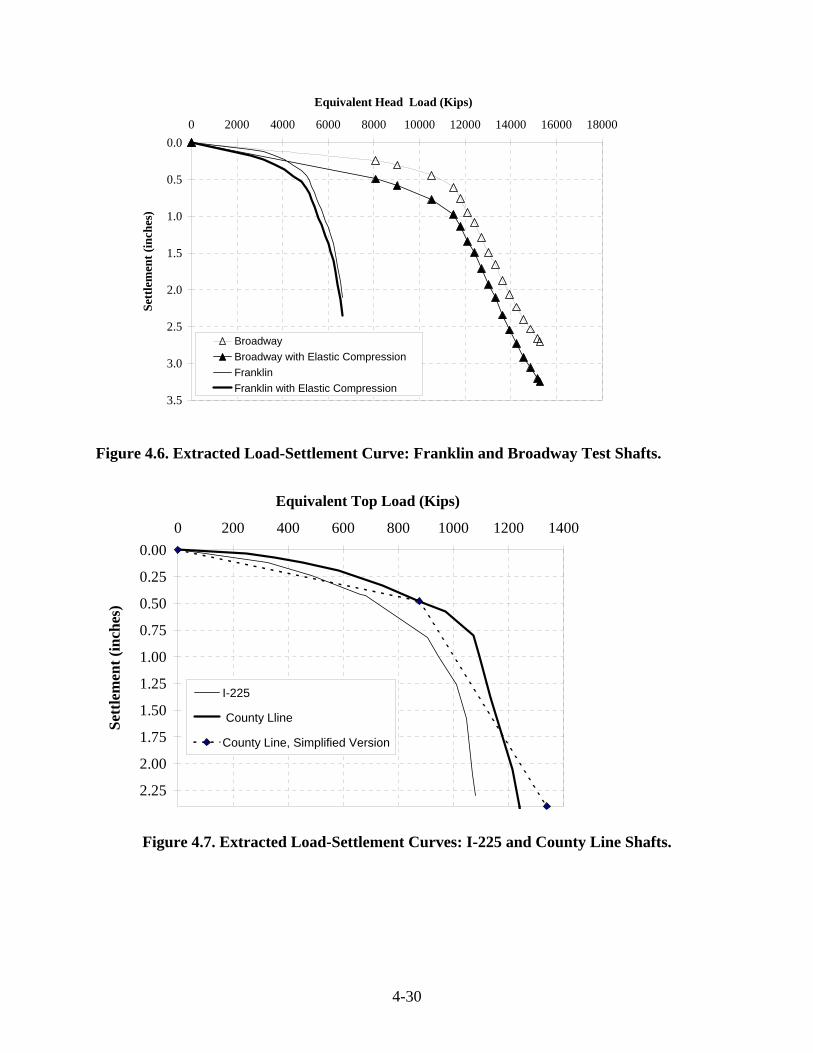
4-30
Figure 4.6. Extracted Load-Settlement Curve: Franklin and Broadway Test Shafts.
Figure 4.7. Extracted Load-Settlement Curves: I-225 and County Line Shafts.
0.0
0.5
1.0
1.5
2.0
2.5
3.0
3.5
0 2000 4000 6000 8000 10000 12000 14000 16000 18000
Equivalent Head Load (Kips)
Sett
lem
ent (
inch
es)
BroadwayBroadway with Elastic CompressionFranklinFranklin with Elastic Compression
0.00
0.25
0.50
0.75
1.00
1.25
1.50
1.75
2.00
2.25
0 200 400 600 800 1000 1200 1400
Equivalent Top Load (Kips)
Sett
lem
ent (
inch
es)
I-225
County Lline
County Line, Simplified Version
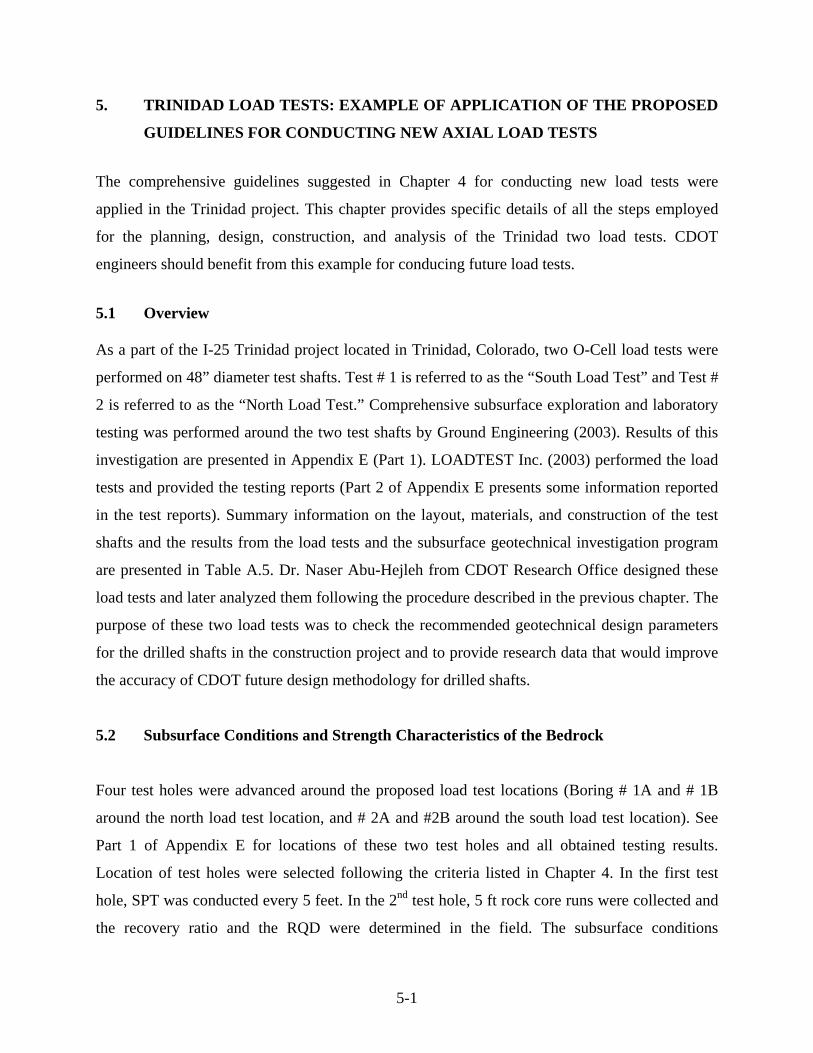
5-1
5. TRINIDAD LOAD TESTS: EXAMPLE OF APPLICATION OF THE PROPOSED
GUIDELINES FOR CONDUCTING NEW AXIAL LOAD TESTS
The comprehensive guidelines suggested in Chapter 4 for conducting new load tests were
applied in the Trinidad project. This chapter provides specific details of all the steps employed
for the planning, design, construction, and analysis of the Trinidad two load tests. CDOT
engineers should benefit from this example for conducing future load tests.
5.1 Overview As a part of the I-25 Trinidad project located in Trinidad, Colorado, two O-Cell load tests were
performed on 48” diameter test shafts. Test # 1 is referred to as the “South Load Test” and Test #
2 is referred to as the “North Load Test.” Comprehensive subsurface exploration and laboratory
testing was performed around the two test shafts by Ground Engineering (2003). Results of this
investigation are presented in Appendix E (Part 1). LOADTEST Inc. (2003) performed the load
tests and provided the testing reports (Part 2 of Appendix E presents some information reported
in the test reports). Summary information on the layout, materials, and construction of the test
shafts and the results from the load tests and the subsurface geotechnical investigation program
are presented in Table A.5. Dr. Naser Abu-Hejleh from CDOT Research Office designed these
load tests and later analyzed them following the procedure described in the previous chapter. The
purpose of these two load tests was to check the recommended geotechnical design parameters
for the drilled shafts in the construction project and to provide research data that would improve
the accuracy of CDOT future design methodology for drilled shafts.
5.2 Subsurface Conditions and Strength Characteristics of the Bedrock
Four test holes were advanced around the proposed load test locations (Boring # 1A and # 1B
around the north load test location, and # 2A and #2B around the south load test location). See
Part 1 of Appendix E for locations of these two test holes and all obtained testing results.
Location of test holes were selected following the criteria listed in Chapter 4. In the first test
hole, SPT was conducted every 5 feet. In the 2nd test hole, 5 ft rock core runs were collected and
the recovery ratio and the RQD were determined in the field. The subsurface conditions
5-2
encountered in the test holes consisted of man-made fill and natural sand and gravel underlained
by very competent Pierre shale bedrock at depth approximately 28.5 to 20 ft below the existing
grade (see Boring Logs in pages E-5 to E-10). The encountered Pierre shale was very well
cemented, typical RQD from 85 to 100, fine grained, low to medium plastic, very hard, slightly
moist, and gray to dark gray in color. Free groundwater was encountered at depth around 14 feet
during drilling rising to a depth of 11 feet 6 days after drilling. The driving resistance was very
high with typical SPT-N values of 100 blows for penetration of 2”. Unconfined compressive
tests were conducted on selected and intact rock core samples to determine the unconfined
compressive strength, qu, of the underlying bedrock (see Table 1 on page E-11). The unconfined
compressive strength of the bedrock around the test shafts ranges from 330 ksf to 518 ksf.
Classification tests on the bedrock samples were not possible because the bedrock was well
cemented so it is called here in as Pierre Shale (not claystone or sandstone as at other locations).
5.3 Recommendations for Design and Construction of the O-Cell Load Tests
The two Trinidad O-Cell load tests were designed (as in Section 4.3.6) based on the results of
subsurface geotechnical investigation presented before and the reported project information,
For typical pier shafts, the structure engineer provided in the construction plans two options for
the diameters of the production shafts: two 4 ft diameter shafts each shaft supporting factored
axial load (Pu) of 2600 kips, or one 7 ft shaft diameter that supports Pu of 5200 kips. For the
main span shafts, two options were available in the plans: three 4 ft diameter shafts, each
supporting Pu of 4863 kips, or two 7 ft shafts, each supporting Pu of 5280 kips. Therefore, two
extreme scenarios need investigation: the 4 ft diameter shaft with Pu 4863 kips (main span) and
the 7 ft diameter shaft with Pu of 5280 kips (typical shafts). The design practice is to require the
length of the rock socket (L) to be at least 3 times the shaft diameter (L=3D). The geotechnical
engineer for the construction project recommended a very conservative ultimate side resistance
of 8 ksf with a resistance factor of 0.55 and ultimate base resistance of 300-ksf with a resistance
factor of 0.5. These are very conservative design values as will be discussed later.
5-3
5.3.1 Selecting L and D for the Test Shafts
The layout of the test shafts for O-Cell load test should be similar to those planned in the
production shafts. The production shafts should be designed based on the results of the load test.
Therefore, the layout of the test shaft for the O-Cell load tests should be designed based on the
expected minimum resistance values obtained from the load tests.
Based on the measured unconfined compressive strength, qu, and the results of load tests at
Broadway site, it was estimated that the ultimate unit side resistance, fmax would fall between 20
and 40 ksf (20-40 ksf) and the ultimate unit base resistance, qmax would be larger than 350 ksf. A
maximum qmax value of 400 ksf was set for design of the O-Cell load test because it felt it would
be harder to use higher values in the design of the production shafts, even if justified by the load
test. These resistance values are valid only if 4’ diameter shafts are employed. For the 7' shafts,
the minimum fmax can be assumed 10 ksf and the minimum qmax can be assumed 200 ksf (see
scaling relations provided by Abu-Hejleh et. al., 2003).
Selecting D: The design calculations for the 7’ ft diameter shafts, using fmax and qmax expected
from the load tests, suggested that L=3D will govern the design. Even if the conservative design
values recommended by the geotechnical consultant are employed, L=3D will continue to govern
the design. Therefore, there were no benefits to the construction project from the O-Cell load
test on the 7' shafts. Also, the costs of performing an O-Cell Load test on 7' shaft will be very
large (higher capacity of loading system is needed). Therefore, the diameter of the two test shafts
is recommended to be 4'.
Selecting L: For the 4’ ft diameter shafts, L was calculated twice: first based on fmax and qmax
recommended by the geotechnical engineer for the construction project (before the O-Cell load
test is performed), and second based on the lower limits of side and base unit resistance values
expected from the load test results. Resistance factors of 0.8 are employed because two load tests
are performed in the projects. The design calculations suggested that the load test had the
5-4
potential to reduce L from 53 ft to 12 ft for the main span piers. This provided a rough estimate
of the savings that should be expected from the load tests. The savings and design of the
production shafts were finalized after the load tests had been performed.
L for the production shafts could extend from 12' (for the 4' shaft) to 21' (for the 7 ft shaft). It is
important to get side resistance values of all rock layers expected in the production shafts.
Therefore, L was selected as 12 ft for the 1st test shaft and 21 ft the 2nd test shaft.
Schematics drawings of the test shafts with diameters (D) of 4 ft are shown in Appendix E. For
the 1st load test at the southern location, the socket length (L) is 11.25 ft. For the 2nd load test at
the northern location, the socket length is 20 ft. The contribution of overburden to side resistance
was eliminated by installing a temporary casing to top of rock and keeping it there until the test
is complete. The concrete would then be placed to 1 ft below top of competent rock. The
contractor was asked to ensure that the casing and concrete are not mechanically connected.
5.3.2 Selecting the Capacity and Location of the O-Cell
It is assumed in the calculations that bottom of the O-Cell will be placed around 1 ft above tip of
the test shafts (L2-L1= 1 ft). This is very close to the placed location of the O-Cell relative to tip
of the test shaft (see Part 2 of Appendix E).
1st Load Test (Southern Location, target L= 12 ft): The goal of the 1st load test is to obtain the
side resistance up to 40 ksf with a secondary objective of confirming the base resistance up to
350 ksf that will be obtained from the 2nd load test (see previous chapter). Another goal is to
investigate if the side resistance might be lessened past the peak resistance (referred to as brittle
behavior).
It is important to obtain accurate information for the side resistance, more important than for the
base resistance, because: (1) most of the resistance for working loads is provided by mean of
side resistance, and (2) the true ultimate unit base resistance of hard shale bedrocks is very large
5-5
(Abu-Hejleh et. al., 2003). The results of the 1st load test should be obtained before the test shaft
for the 2nd load test is constructed. This is to correct for any problem encountered in the 1st load
test and to make any last minute modification to the location of the O-Cell in the 2nd load test
(see previous chapter).
In the southern location, clay joints will be present along the sides of the socket (see Appendix E,
Part 1) and this why this location was selected for the 1st load test to represent the worst field
conditions for side resistance.
Note that perimeter and base area of shaft with D= 4ft are, respectively, 12.57 ft and 12.57 ft2.
By applying Eq. 4.1, length of the shaft above O-Cell for the 1st test shaft, L2, can be obtained as
L2 < 12.57*350/ 12.57 *40 + L1 = 8.75+1= 9.75 ft, so L2 of 10 ft was recommended (close to the
placed length of 11.25-0.9= 10.35 ft, see Appendix E). Now applying Eq. 4.2, Capacity of O-
Cell ≥ 10*12.57* 40= 5028 kips. Thus, 34” O-Cell is recommended with a capacity of 6000
kips in each direction (12000 kips of maximum total test capacity) is recommended for the 1st
load test.
2nd Load Test (Northern Location): The goal of the 2nd load test (unless modified based on the
results of the 1st load test) is to obtain the base resistance up to 400 ksf with a secondary
objective of confirming the results of side resistance up to 20 ksf that will be obtained from the
1st load test.
By applying Eq. 4.3, L2> (400*12.57)/(12.57*20) +L1=20+1 =21 ft. This is a little greater than
the placed L2 in Test 2 (19.2 ft, see Appendix E, Part 2). Capacity of O-Cell ≥ 400*12.57+
12.57*1*40= 5531 kips. Thus, 34” O-Cell is recommended with a capacity of 6000 kips in each
direction (12000 kips of maximum total test capacity) is recommended for the 2nd load test.
5-6
5.3.3 Recommendations for the Construction and Instrumentation of the O-Cell load
Tests
For each load test, it was recommended to use three (3) Geokon Model #4911 strain gages
placed at one level shown in the drawing to assist in the determination of the side shear load
transfer curves. Use three telltales to get compression data of the test shaft and measure any
titling.
The construction recommendations described in the previous chapter for new load tests were
employed in the Trinidad project. This included the specification of a contingent grouting
procedure that would be employed if the test shafts turned to be wet during construction. A wet
shaft is defined as a shaft filled with water. Also, the contribution of overburden to side
resistance was removed by installation of a temporary casing to top of rock and keep this casing
there until the test is complete. The concrete would then be placed to 1 ft below bottom of casing
(see Part 2 of Appendix E). The contractor was asked to ensure that the casing and concrete are
not mechanically connected.
It was requested that the contractor provides the project engineer with the following construction
information of the test shafts.
Times when excavation/drilling started and completed, and times when concreting started
and completed.
Methods/procedure for: excavation/drilling (e.g., auger), cleaning the base and sides of the
borehole, and placement of the concrete.
Were the hole sides and base cleaned before placement of the concrete? Was any water
tipped into the borehole to aid in removal of cuttings? Were the sides of the rock socket wet
or dry during drilling? Possible sources of this water, if any, and its amount (could be
measured from water accumulated at the base of shaft hole at end of the drilling operations).
How much water was pumped out before placement of concrete?
The slump of the fresh concrete, the unconfined compressive strength and stiffness of the
concrete at time of load test.
5-7
Information on the smoothness of the sides of the borehole in the bedrock rock including any
estimates (even if rough) of the depth, width, and spacing of grooves. If possible, caliper the
test pier borehole and obtain its roughness profile using laser devices or mechanical devices.
At minimum, the depth of the deepest grooves should be obtained as this has a major
influence on the side resistance of the shaft.
5.4. Construction of Test Shafts
Southern Test Shaft (for side resistance): drilling started on October 13, 2003 through the
overburden but stopped shortly after that due to some construction problems. Drilling resumed
on October 15 and the hole was stabilized with natural slurry. When the rock was encountered,
the overburden was stabilized with a casing and the slurry was removed and the shaft in the rock
was constructed using an auger under dry conditions thereafter. The shaft bottom was cleaned
with 42-inch clean-out bucket. Then, the reinforcing cage and O-Cell assembly were inserted,
concrete was placed with a tremie pipe, and then the casing was removed.
Northern Test Shaft (for end-bearing): Construction on October 9, 2003 proceeded as
described above but the casing failed to seal the excavation from intrusion of water. Before the
cage was placed, the water level is the shaft excavation was approximately 30 ft down from the
ground surface. Note that the coring log for the North Load Test (see Appendix E, Part 1)
suggests that the upper zone of the rock has a very low recovery ratio and RQD, indicating that
the quality of the rock there is very poor (fractured). This fractured zone could provide an access
to the overburden free water to seep through this poor rock into the test shaft hole. This fractured
zone with low RQD was not noticed in the test hole near to the southern shaft and there was no
problem with water seeping into that shaft holes. After base cleaning and placement of the
reinforcing cage, grout was delivered into the base of the shaft through preinstalled PVC pipes.
The wet grout extended past the O-Cell to about 1 ft above the cell, when concreting was begun.
Several problems occurred during the concreting (tremie pipe was not available, slow and
interrupted process of concrete placement) that may have led to low quality concrete placed in
some parts of the Northern Test Shaft.
5-8
5.5 Load Testing Results and Analysis
Testing results from the two O-Cell load test results as reported by LOADTEST, Inc. are
presented in Part 2 of Appendix E and briefly summarized in Table 5.1.
The measured unconfined compression test results (see Table 1 on page E-11) on rock core
samples collected around and below the test shafts were carefully analyzed. An appropriate (on
the high side) unconfined compressive, qu, for the rock around the two test shafts was selected as
400 ksf and for the rock beneath the two test shafts was selected as 480 ksf.
5.5.1 Side Resistance:
Measured side resistance values at the end of the two load tests as reported by LOADTEST, Inc.
(2003) are given in Table 5.1. As discussed in chapter 4, the average measured side resistance in
the entire bedrock socket is more reliable than the measured side resistance values from strain
gages. The average unit side resistance vs. the average side movement in the entire bedrock
socket is shown in Figure 5.1. It is clear from Figure 5.1 that the ultimate true and peak unit side
resistance, fmax, was reached in the South Load Test (26.4 ksf) at side movement of 0.75”. There
seems some limited brittle behavior passed the peak side resistance because of loss of pressure at
that resistance that lessened the peak resistance to 23.5 ksf (movement of 1.5”). There was a
good match between the results for side resistance from the two load tests, although there were
many problems with the North Load Test (low quality concrete, wet hole). This suggests that the
presence of water has minimal effect on the side resistance, as expected for very hard and
competent bedrock shales.
Carter and Kulhawy recommended fmax= 0.92 qu0.51 for shafts with smooth bedrock socket, and
fmax= 2.05qu0.51 for shafts with intermediate roughness level. The results for the Franklin and
Broadway test shafts suggested an intermediate roughness level for their bedrock sockets that
was generated under normal drilling (Abu-Hejleh et. al. , 2003). Using these two equations with
qu of 400 ksf, fmax is predicted as 19.5 ksf for smooth socket and 43.5 ksf for intermediate
roughened bedrock sockets. The measured fmax (26.4 ksf for peak and 23.5 ksf for residual) was
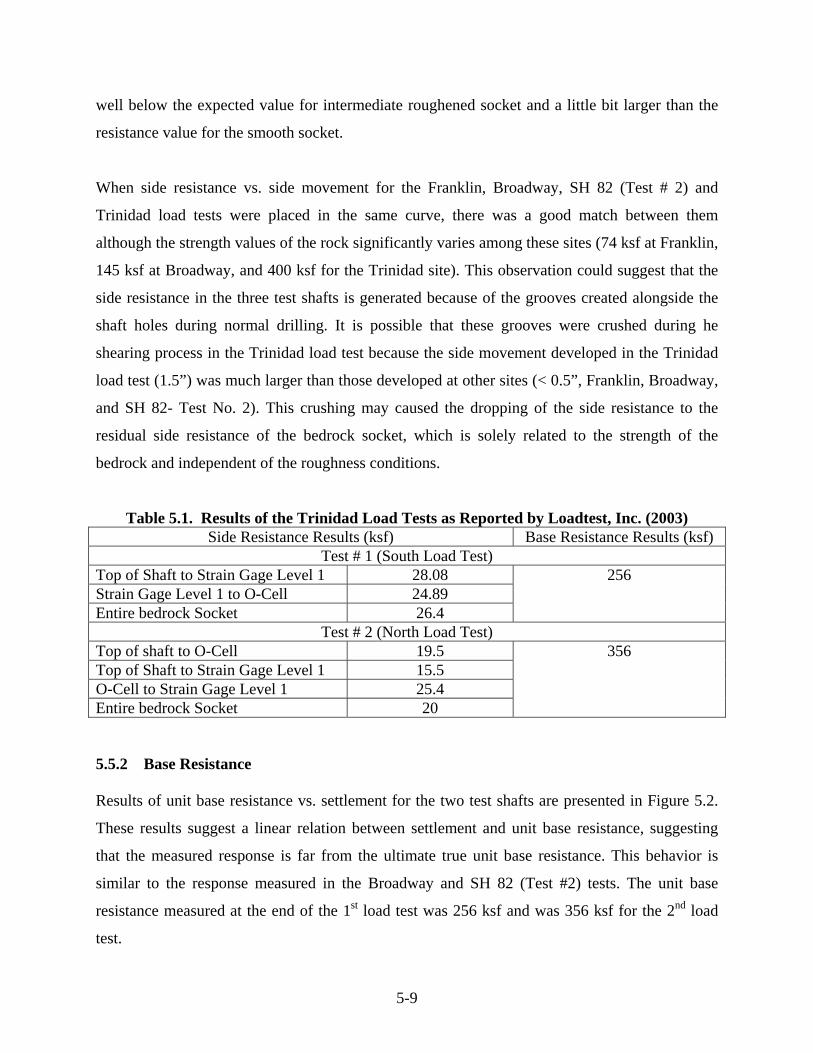
5-9
well below the expected value for intermediate roughened socket and a little bit larger than the
resistance value for the smooth socket.
When side resistance vs. side movement for the Franklin, Broadway, SH 82 (Test # 2) and
Trinidad load tests were placed in the same curve, there was a good match between them
although the strength values of the rock significantly varies among these sites (74 ksf at Franklin,
145 ksf at Broadway, and 400 ksf for the Trinidad site). This observation could suggest that the
side resistance in the three test shafts is generated because of the grooves created alongside the
shaft holes during normal drilling. It is possible that these grooves were crushed during he
shearing process in the Trinidad load test because the side movement developed in the Trinidad
load test (1.5”) was much larger than those developed at other sites (< 0.5”, Franklin, Broadway,
and SH 82- Test No. 2). This crushing may caused the dropping of the side resistance to the
residual side resistance of the bedrock socket, which is solely related to the strength of the
bedrock and independent of the roughness conditions.
Table 5.1. Results of the Trinidad Load Tests as Reported by Loadtest, Inc. (2003) Side Resistance Results (ksf) Base Resistance Results (ksf)
Test # 1 (South Load Test) Top of Shaft to Strain Gage Level 1 28.08 Strain Gage Level 1 to O-Cell 24.89 Entire bedrock Socket 26.4
256
Test # 2 (North Load Test) Top of shaft to O-Cell 19.5 Top of Shaft to Strain Gage Level 1 15.5 O-Cell to Strain Gage Level 1 25.4 Entire bedrock Socket 20
356
5.5.2 Base Resistance Results of unit base resistance vs. settlement for the two test shafts are presented in Figure 5.2.
These results suggest a linear relation between settlement and unit base resistance, suggesting
that the measured response is far from the ultimate true unit base resistance. This behavior is
similar to the response measured in the Broadway and SH 82 (Test #2) tests. The unit base
resistance measured at the end of the 1st load test was 256 ksf and was 356 ksf for the 2nd load
test.
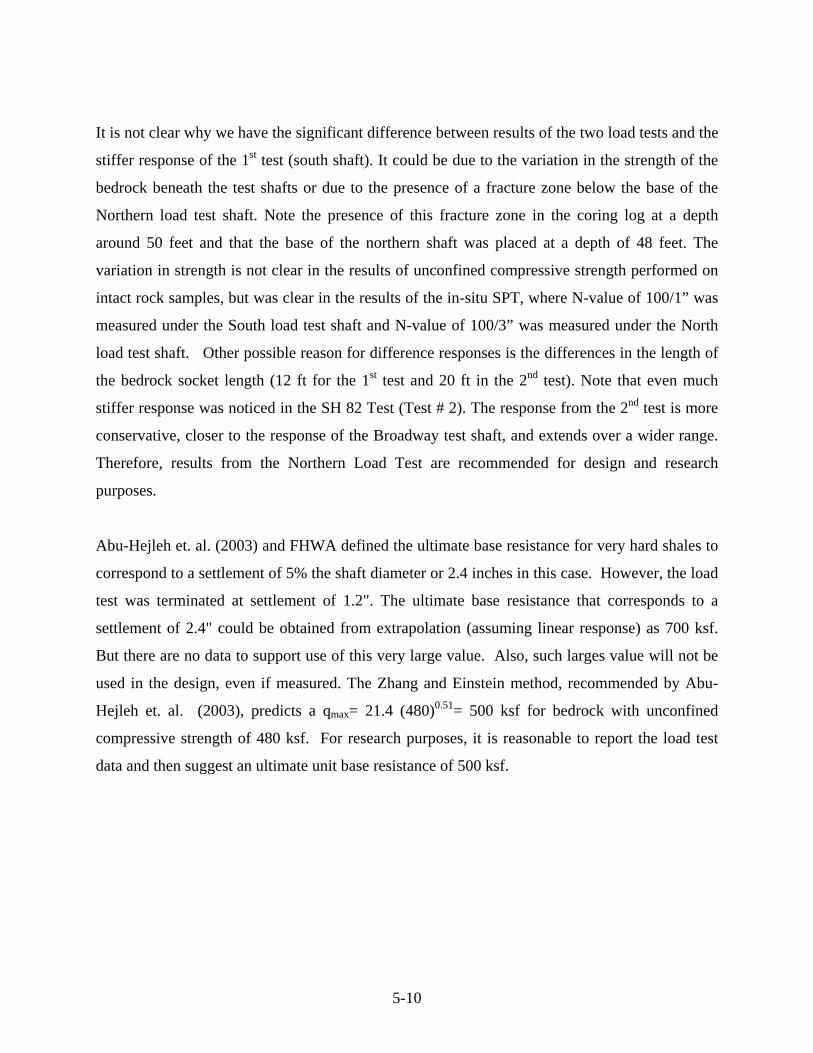
5-10
It is not clear why we have the significant difference between results of the two load tests and the
stiffer response of the 1st test (south shaft). It could be due to the variation in the strength of the
bedrock beneath the test shafts or due to the presence of a fracture zone below the base of the
Northern load test shaft. Note the presence of this fracture zone in the coring log at a depth
around 50 feet and that the base of the northern shaft was placed at a depth of 48 feet. The
variation in strength is not clear in the results of unconfined compressive strength performed on
intact rock samples, but was clear in the results of the in-situ SPT, where N-value of 100/1” was
measured under the South load test shaft and N-value of 100/3” was measured under the North
load test shaft. Other possible reason for difference responses is the differences in the length of
the bedrock socket length (12 ft for the 1st test and 20 ft in the 2nd test). Note that even much
stiffer response was noticed in the SH 82 Test (Test # 2). The response from the 2nd test is more
conservative, closer to the response of the Broadway test shaft, and extends over a wider range.
Therefore, results from the Northern Load Test are recommended for design and research
purposes.
Abu-Hejleh et. al. (2003) and FHWA defined the ultimate base resistance for very hard shales to
correspond to a settlement of 5% the shaft diameter or 2.4 inches in this case. However, the load
test was terminated at settlement of 1.2". The ultimate base resistance that corresponds to a
settlement of 2.4" could be obtained from extrapolation (assuming linear response) as 700 ksf.
But there are no data to support use of this very large value. Also, such larges value will not be
used in the design, even if measured. The Zhang and Einstein method, recommended by Abu-
Hejleh et. al. (2003), predicts a qmax= 21.4 (480)0.51= 500 ksf for bedrock with unconfined
compressive strength of 480 ksf. For research purposes, it is reasonable to report the load test
data and then suggest an ultimate unit base resistance of 500 ksf.
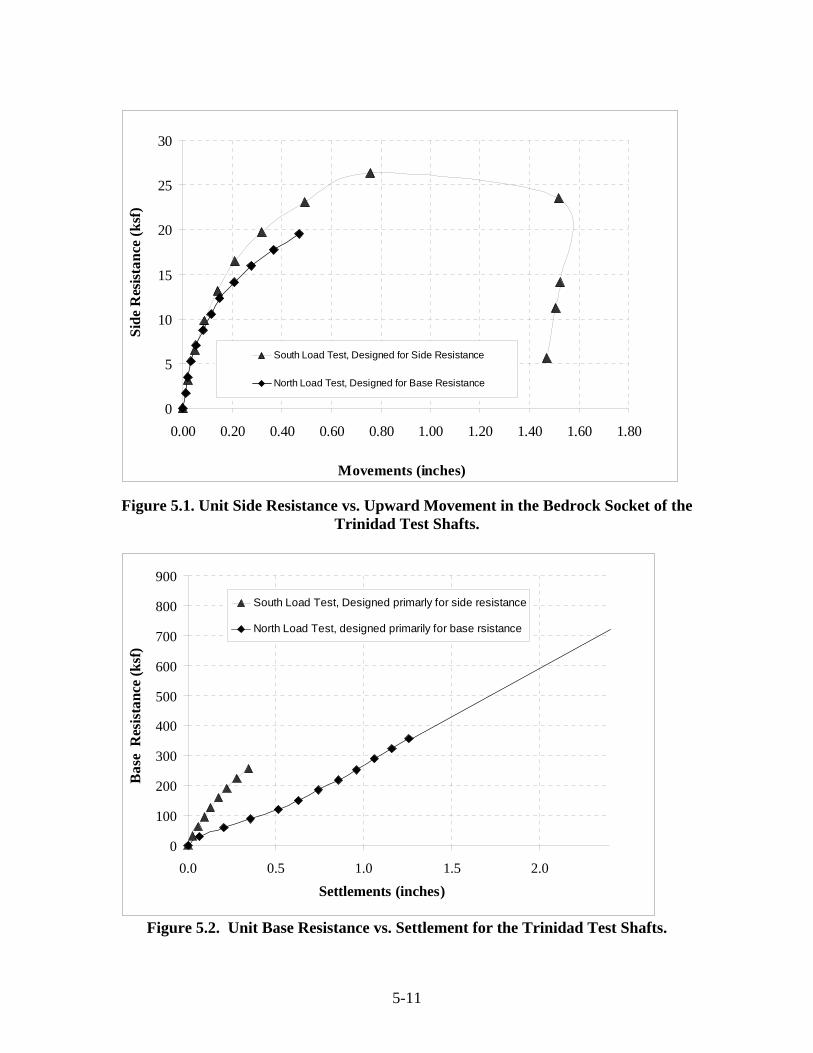
5-11
Figure 5.1. Unit Side Resistance vs. Upward Movement in the Bedrock Socket of the Trinidad Test Shafts.
Figure 5.2. Unit Base Resistance vs. Settlement for the Trinidad Test Shafts.
0
5
10
15
20
25
30
0.00 0.20 0.40 0.60 0.80 1.00 1.20 1.40 1.60 1.80
Movements (inches)
Side
Res
istan
ce (k
sf)
South Load Test, Designed for Side Resistance
North Load Test, Designed for Base Resistance
0
100
200
300
400
500
600
700
800
900
0.0 0.5 1.0 1.5 2.0
Settlements (inches)
Bas
e R
esis
tanc
e (k
sf)
South Load Test, Designed primarly for side resistance
North Load Test, designed primarily for base rsistance
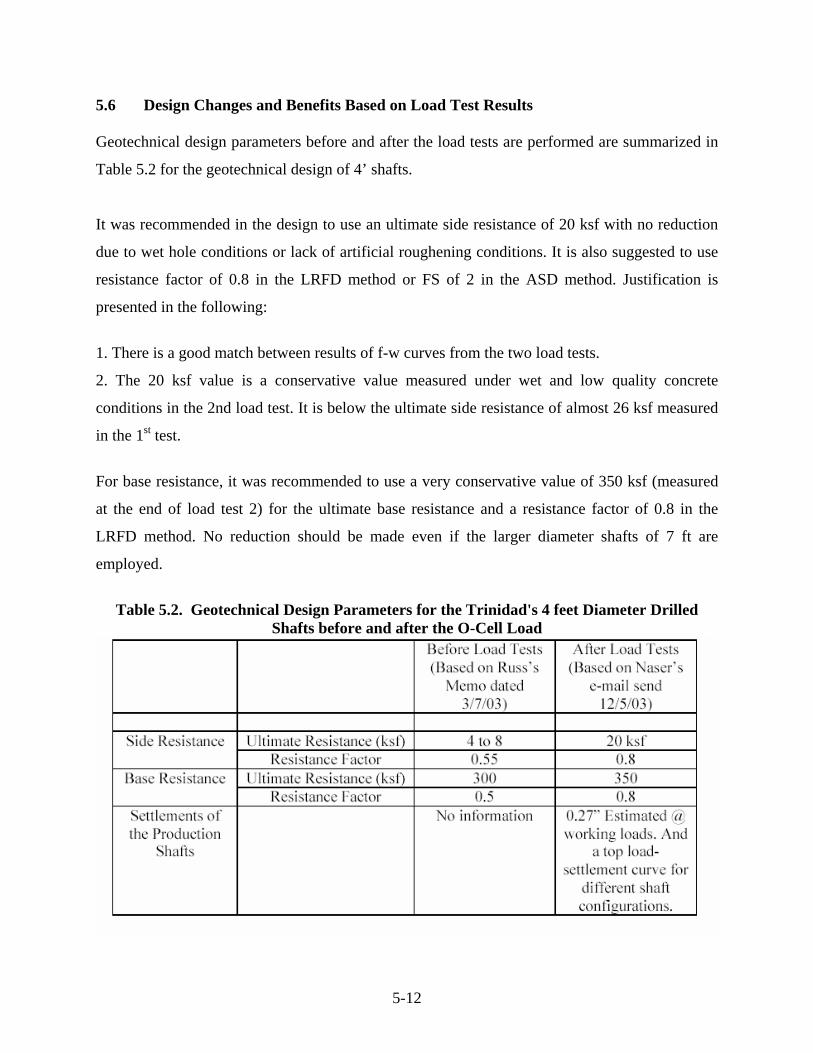
5-12
5.6 Design Changes and Benefits Based on Load Test Results Geotechnical design parameters before and after the load tests are performed are summarized in
Table 5.2 for the geotechnical design of 4’ shafts.
It was recommended in the design to use an ultimate side resistance of 20 ksf with no reduction
due to wet hole conditions or lack of artificial roughening conditions. It is also suggested to use
resistance factor of 0.8 in the LRFD method or FS of 2 in the ASD method. Justification is
presented in the following:
1. There is a good match between results of f-w curves from the two load tests.
2. The 20 ksf value is a conservative value measured under wet and low quality concrete
conditions in the 2nd load test. It is below the ultimate side resistance of almost 26 ksf measured
in the 1st test.
For base resistance, it was recommended to use a very conservative value of 350 ksf (measured
at the end of load test 2) for the ultimate base resistance and a resistance factor of 0.8 in the
LRFD method. No reduction should be made even if the larger diameter shafts of 7 ft are
employed.
Table 5.2. Geotechnical Design Parameters for the Trinidad's 4 feet Diameter Drilled
Shafts before and after the O-Cell Load
5-13
A few number of the production shafts were 4 feet in diameter. The design calculations provided
before conducting the O-Cell load indicated that the socket length for 4' shafts in the main span
(with factored load of 4863 kips) is 59 ft. Using the geotechnical design parameters
recommended based on results of load test, the required socket length for these shafts was
calculated as 8 ft. Hence, the benefits of the load test could be dramatic if 4 ft diameter shafts
were employed, reducing the length of the rock socket from 59 ft to 8 ft.
The designer selected 7-ft diameter for the design of most of the production shafts. The
calculations showed that the base resistance load in this case will be huge that no side resistance
will be needed from penetration of the shafts in the bedrock (L=0). As per the current practice of
Colorado’s structural engineers, minimum L =3D (21 ft) was planned before conducting the load
tests. The discussion on this issue in accordance with the recommendation of CDOT Research
Report 2003-6 led to change in the current practice from using L=3D (21 ft) to a value as
required to just support the lateral load (L close to 14 ft). This saved the project around 7 feet of
penetration on each shaft drilled in the Trinidad project.
According to Mr. Joe Garcia, the project engineer for the Trinidad Project, the savings to the
Phase I of the project from conducting the load tests are $113,400. More savings are expected in
the future phases of the project.
6-1
6. SUMMARY AND CONCLUSIONS
6.1 Overview
Drilled shaft foundations embedded in weak rock formations (e.g., Denver blue claystone and
sandstone) support a significant portion of bridges in Colorado. The type and general locations of
Colorado’s bridges are discussed in Section 2.2 of this report. Drilled shafts derive support by
embedment in these weak rocks, typically found at relatively shallow depth in Colorado. The
contribution of overburden to the drilled shaft axial capacity is often ignored. Thorough
geotechnical design of a drilled shaft requires determination of a top load-settlement curve, qmax
(ultimate unit base resistance) of the rock layer beneath the shaft, fmax (ultimate unit side
resistance) of the rock layers around the shaft, the load factor and resistance factor (φ) in the
LRFD (Load and Resistance Factor Design) method, and the factor of safety (FS) in the
allowable stress design (ASD) method. The most accurate design method to estimate qmax, fmax,
and settlements of drilled shafts is to conduct load tests on test shafts constructed as planned in
the construction project. The load tests are expensive and therefore only considered in large
projects. However, the very accurate design information obtained from the load tests could be
used: 1) to design production shafts with more confidence (lowest FS or highest φ) and accuracy
(leading to less conservative estimates of qmax, fmax, and settlements in most cases), resulting in
significant savings to the project, and 2) as research data to improve the accuracy of simpler
analytical design methods for drilled shafts that use data of simpler geotechnical tests like SPT,
and/or UCT, and/or PMT).
Since January 1, 2000, it has been the policy of Colorado Department of Transportation (CDOT)
to incorporate the new and more rational AASHTO LRFD method for the design of its
structures, including drilled shafts. Since the 1960s, empirical methods and “rules of thumb”
have been used to design drilled shafts in Colorado that are based on the blow counts of the
Standard Penetration Test (SPT) and deviate from the AASHTO LRFD Design Methods. The
margin of safety (or φ) and expected shaft settlement are unknown in these methods, both needed
to implement the AASHTO LRFD design methods. To address all these needs and
6-2
shortcomings, the CDOT’s strategic objectives for Colorado’s drilled shafts socketed in weak
rocks (Abu-Hejleh et. al., 2003) are to:
• Identify the most appropriate and accurate geotechnical design methods to predict the
ultimate axial resistance and settlements of Colorado’s drilled shafts socketed in weak rocks
that are based on simple and routine geotechnical tests (SPT, UCT, and PMT).
• Identify the most appropriate resistance factors (φ) needed per the LRFD for the design
methods identified in the 1st objective.
To fulfill these objectives, the measured resistance and settlement results of an adequate number
of load tests on drilled shafts socketed in Colorado’s shale bedrocks should be obtained and
compared with predictions from design methods that use test data of simpler and more common
geotechnical tests (SPT, UCT, and PMT) on the same shale bedrocks. CDOT Research Report
2003-6 (Abu-Hejleh et. al., 2003), titled “Improvement of the Geotechnical Axial Design
Methodology for Colorado’s Drilled Shafts Socketed in Weak Rocks,” thoroughly documented
and analyzed the results of four O-Cell load tests performed in 2002 as part of the T-REX and
Broadway Viaduct projects. The bedrock at the load test sites represents the range of typical
claystone and sandstone (soft to very hard) encountered in Denver. To maximize the benefits of
this work, the O-Cell load test results, information on the construction and materials of the test
shafts, and geology of bedrock were documented, and an extensive subsurface geotechnical
investigation was performed on the weak rock at the load test sites. This included the SPT,
strength tests, and pressuremeter tests. The analysis of all test data and information and
experience gained in this study were employed to provide: 1) best correlation equations between
results of various common geotechnical tests (SPT, UCT, and PMT), 2) best-fit design equations
to predict the shaft ultimate unit base and side resistance values, and the load-settlement curve as
a function of the results of common geotechnical tests, and 3) assessment of the CDOT and
AASHTO design methods.
CDOT Research Report 2003-6 also outlined a long-term plan with six tasks to fulfill the
strategic objectives listed above. This study was initiated to execute the following tasks in this
plan:
6-3
Compile and evaluate all available Colorado’s past and reliable axial load test information.
Determine CDOT future needs for performing new axial load tests on drilled shafts in CDOT
future construction projects.
Several tasks were conducted in this study to address these objectives. A summary of the
findings of these tasks are initially presented in this Chapter. Then, lessons learned from the
study findings for future planning of load tests are furnished. Finally, CDOT’s future needs for
axial load tests on drilled shafts are listed in this Chapter.
6.2 Summary and Evaluation of Colorado’s Records of Axial Load Tests on Drilled
Shafts
There are relatively few historical load tests in Colorado that are of value to this study. All the
acquired Colorado load test information is presented, discussed, and evaluated in Chapters 3, 5,
and Appendices A, D, and E. The following information (if available) is presented for the load
tests: construction, materials, and layout of the test shafts; geological and geotechnical
description of the foundation bedrock around and below the test shafts including the results of
SPT, UCT, and PMT; and results of the load tests. The compiled load tests (Table 3.1) are named
after their location as: Fort Carson, 23rd Street Viaduct in Denver, I-270/I-76, SH82 Shale Bluffs
in Pitkin County, T-REX along I-25 in Denver (I-225, County Line, and Franklin), Broadway
Viaduct along I-25 in Denver, and Trinidad. Some reported information (e.g., results of load tests
and of the geotechnical investigation) in the Testing Reports are furnished in Appendix D for the
23rd Street, I-270/I-76 and SH82 Shale load tests, and in Appendix E for the Trinidad load test.
Load tests that have most of the information needed for analysis and evaluation are summarized
in seven tables in Appendix A.
6.2.1 Types of Load Tests
With one exception (Fort Carson), the load tests were performed on CDOT projects. Historically,
a challenge of load tests on drilled shafts has been that it has been very difficult and expensive to
6-4
obtain sufficient reaction to test full-scale drilled shafts with common production dimensions.
As a result, most of the earlier drilled shaft load tests (all conventional load tests with load
applied from top) were not full-scale (see Table 3.1 for diameter and length of the test shafts).
Rather, the pier diameters were minimized and/or the length of the rock sockets shortened.
Typically, those performing the tests attempted to run separate tests for end-bearing and side
shear. As a result, most of the credible, earlier load tests were of limited capacity. For these and
other reasons, it is difficult to extrapolate the measured test results to full-scale drilled shafts of
the dimensions that typically support highway structures. Results from these tests should be
considered with caution.
In recent years, a new technology has become available for performing load tests that overcomes
some of the previous limitations. This is the Osterberg Cell (O-Cell). The most useful load tests
have been the most recent. This is because the O-Cell test method was used, and because detailed
subsurface information was obtained at each load test location (except the SH 82 O-Cell load
tests.) The principle advantage of the O-Cell is that external reaction frames are not needed.
Therefore, tests on full-scale production piers can be carried to very large capacities. The tests on
SH-82 at Snowmass Canyon (Shale Bluffs), T-REX and Trinidad were performed using the O-
Cell method. Most of these tests were carried to total loads well in excess of what could have
been obtained using earlier reaction frame methods. According to the FHWA design manual
(1999), the cost of an O-Cell test is often in the range of 50% to 60% of the cost of performing a
similar small capacity conventional loading test, because there is no need to construct a reaction
system. An alternate load test method which may have some promise is the Statnamic test.
However, the O-Cell results are likely to be more representative of the load/deflection
relationships of production shafts. More specific details for conducting new load tests are
presented in Section 4.3.4.
6.2.2 Discussion of Colorado’s Past Load Tests
Trinidad, T-REX and Broadway O-Cell load tests. These are the most recent tests performed
from 2002 to 2004. They have been planned well, documented, and analyzed in detail by the

6-5
CDOT Research Branch (Abu-Hejleh et. al., 2003 and Chapter 5). These tests should be
considered for evaluation in the future with a rank of “Very Good.”
The 1970 Fort Carson tests. These are of little value to CDOT because they were not intended
to replicate large, heavily loaded bridge foundation drilled shafts. The test objective stated that
the tests were for small diameter, low capacity piers. This means that significant upward scaling
is needed to make use of these data. Not only were the shafts small, they only extended a few
feet below grade. Analysis of these data also requires information on SPT-N values and the
unconfined compressive strength, both not provided. It is not believed that any useful
improvement could be made to the test data by obtaining new geotechnical data at the load test
site. This test should not be among the selected load tests for evaluation in the future.
The 23rd Street Viaduct and the I-270/I-76 load tests. These were performed for CDOT
projects. Both sites have reasonable quality geotechnical data, including PMT for the I-270/I-76
load test sites. Both load test programs were performed using the same reaction beam and jacks.
The reaction beam had a large, 1,000 ton capacity. Nevertheless, this capacity was not sufficient
to test full-size production shafts to failure. Therefore, the shaft dimensions and embedment were
limited. This factor should be considered for the analysis of the data from these load tests. With
the use of shear rings for artificial roughening of the shaft holes in the bedrock, these tests
suggested significant improvements to the side resistance. The base and side resistance results
from the I-270/I-76 load tests and just the side resistance (not base resistance) results from the
23rd Street load tests should be considered for evaluation in the future with a rank of “Good.”
These test results were rated “Good” not “Very Good” because dimensions and embedment of
the test shafts are not as large as those of typical production shafts employed by CDOT.
The analysis of the 23rd Street load tests suggests that the strength reported in the test report for
the Denver Blue shale bedrock below the test shafts may be low. Therefore, a better
understanding of the strength of this shale should be obtained by new geotechnical data at the
load test site. The test location is currently in a Coors Field parking lot. The Denver Metropolitan
Major League Baseball Stadium District is the facility owner. The CDOT Research Branch made
all the arrangements needed to perform subsurface geotechnical investigation at the load test
6-6
locations. However, the study panel recommended not conducting this investigation because
bedrock conditions at that site have changed with time since the load test was performed and any
investigation may add uncertainty to the results of the load test sites. In addition, costs for this
geotechnical investigation work were significant: $5000. Based on this, the base resistance
results from the 23rd Street load tests should be considered in the future with a rank of “fair”
due to: 1) uncertainty of the results from the geotechnical tests, and 2) dimension and
embedment of the test shafts are not as large as those of typical production shafts employed by
CDOT.
The SH-82 Shale Bluffs two load tests. There is very little useful geotechnical data in these two
tests. The 1st load test is of little value for research purposes and additional geotechnical
investigation at this test shaft location is not suggested for several reasons discussed in detail in
Section 3.5.1. This test should not be among the selected load tests for evaluation in the future.
It is unfortunate that the 2nd load test (D= 3ft and L =29.7 ft) did not have the capacity to fail the
shaft. It appears both the end-bearing and side shear components of the resistance were still in
the linear range when the test was concluded at an upward movement of 0.07” and a downward
movement of 0.09”. Two observations were noticed from the load test results:
The trend of the unit side resistance vs. side movement data over 0.07” of movement
measured in this test seems close to similar results reported for the Franklin, Broadway, and
Trinidad load tests. The measured maximum unit side resistances at the end of the test were 4
ksf in the upper 13.4 ft of the bedrock socket, and 14.8 ksf in the lower 15 feet of bedrock
socket, with an average value of 9.2 ksf in the entire bedrock socket.
The maximum measured unit base resistance of 325 ksf at a settlement of 0.09” is a very high
value when compared to all other load tests presented in this study, suggesting the rock
strength at this site is much stronger/stiffer than the very massive bedrock shales encountered
in the Broadway (qu as high as 200 ksf) and Trinidad (qu as high as 500 ksf) sites. It is
possible that the rock strength at this site is close to or even exceeds the strength of the
concrete.
6-7
Even though the test shaft did not fail, it is believed that much could be learned if material
strength were available. It would be good to supplement the rock core recovery and RQD with
strength data. For example, it could be determined if the excellent pier capacity would have been
predicted based on the strength of the rock. Mr. Joseph Elsen from Region 3 indicated that it is
extremely difficult to access the load test site. Mr. Mark Vessely from CDOT Geotechnical
Office has gone through the SH 82 records and has not located any relevant rock strength test
results. It is also possible that the conditions of the rocks at that site may have changed with time
since the load test was performed and any investigation may add uncertainty to the results of the
load test sites. For all these reasons, it was decided not to conduct a subsurface geotechnical
investigation at the load test site. Only the two observations previously listed should be
considered for evaluation in the future. We should be careful with accepting the measured base
resistance value in this test.
6.3 Lessons Learned for Planning Future Load Tests
This section summarizes the lessons learned for future planning of Colorado’s axial load tests
shale socketed in weak rocks from:
• Colorado’s past load tests.
• Investigation on the construction methods and observations for Colorado’s load test
shafts.
• Investigation on the geology of Colorado’s bedrock formations.
6.3.1 Lesson Learned from Colorado’s Past Load tests
Type of Load test. The O-Cell load test should be considered in Colorado’s future drilled shaft
load tests until more cost-effective and innovative load test methods become available. It is also
recommended to consider conventional load tests for low-capacity production shafts with
ultimate capacity up to 1000 tons. The O-cell load test is more cost-effective than the
conventional static load test for testing similar large-diameter shafts socketed in rock. Most of
Colorado’s good unit and side resistance data for Colorado's bedrock are generated from the O-
Cell load tests. This test has been used in Colorado extensively over the last 7 years. Therefore, it
6-8
will be hard in the future to calibrate resistance data obtained from an innovative load test
different than O-Cell. The O-Cell load test can mobilize the ultimate unit base resistance and side
resistance in soft shale bedrocks (settlements larger than 2"), unit base resistance in harder shale
bedrock over a settlement up to 3" (5% of the shaft diameter), and with a careful design the
ultimate unit side resistance in the harder shale bedrock (drop of side resistance after reaching
the peak was observed in the Trinidad load test).
Types of shale bedrock for future cost-effective load tests. Based on the results of the T-REX
and Broadway load tests and the subsurface test data, CDOT Research Report 2003-6 evaluated
the Colorado SPT-based (CSB) design method and the AASHTO/FHWA design methods. For
conditions like those encountered in these load tests, the report proposed new design methods to
predict the unit base and side resistances and settlements of Colorado’s shafts embedded in soft
to very hard to even much harder and massive shale bedrock based on results of routine
geotechnical tests (SPT, UCT, and PMT). For the soft claystone (20 bpf <SPT-N<100), the
proposed design method is based on the results of the SPT and is called the updated Colorado
SPT-based (UCSB) design method. A factor of safety of 2 is recommended for the UCSB
method.
In soft claystone like those encountered in the I-225 and County Line sites (20<SPT-N<100), the
CSB and UCSB methods made reasonable predictions of end-bearing if a factor of safety of 2 is
assumed. However, measured side resistance data were less than values predicted from the CSB
method (FS ranged from 1.3 to 1.8) and agreed well with values predicted from the UCSB
method. Analysis results of the Fort Carson, 23rd Street and the I-270/I-76 load tests, when no
shear rings were employed for roughening the shaft holes (smooth shafts), also support the
proposed UCSB method. No future load tests are recommended for the soft claystone with
smooth shaft holes because the proposed UCSB method is: 1) the most accurate and economical
since it employs the lowest possible factor of safety of 2; and 2) more conservative than the CSB
method employed in Colorado for decades with overwhelming success using a factor of safety
less than 2.
6-9
But with the use of artificial roughening (shear rings) in softer shale bedrock formations, the 23rd
Street Viaduct and the I-270/I-76 load tests suggest that shear rings produce a measurable
improvement in side shear capacity compared to drilled shafts of similar dimensions but drilled
with no or minimal roughening. These load tests showed the benefits of artificial roughening to
drilled shafts embedded in soft claystone shale bedrocks having SPT- N values larger than 50.
This observation is very important, because many structure locations are in this kind of claystone
bedrock. If shear rings were routinely used in these very weak formations, it may be possible to
use greater side shear allowable design parameters. This would reduce drilled shaft dimensions
with accompanying cost savings. Hence, new design methods (more load tests) for these types of
weak rocks are needed when shear rings are employed.
In the harder bedrock shale formations like those encountered in the Broadway, Trinidad, SH-82
(Test No. 2), and the Franklin sites, the results of the O-Cell tests indicated that both end-bearing
and side shear capacities were well above those predicted from the Colorado SPT-based (CSB)
design methods (FS: 3.4 to 7). Hence, new and improved design methods for drilled shafts
embedded in these bedrock shales will generate significant savings to CDOT. The side resistance
vs. side movement was measured over a large movement (1.5”) only for the Trinidad load tests,
where some limited brittle behavior was observed due to lessening of the peak resistance
(occurred at movement of 0.75”). This issue is worth investigating in future load tests.
Based on the above, future drilled shaft load tests can be of much economical value in:
• Reducing drilled shaft embedment lengths in the harder bedrock shale formations
because of higher allowable end-bearing and side resistance.
• Reducing drilled shaft embedment in softer bedrock shale formations because of the
greater side resistance that may be available if shear rings are used.
• Reducing drilled shaft dimensions because of higher resistance factors with improved and
more accurate design methods.
Different levels of roughness and dry and wet shaft hole conditions were encountered in the load
tests. Learned lessons on these issues are covered in the next section.
6-10
6.3.2 Lessons Learned from the Investigation on Construction of Drilled Shafts
Scope of work: Colorado construction specifications and standards for drilled shafts are
documented, construction information and observations of drilled shafts at the load test sites are
presented and evaluated, and then recommendations for construction of production and test
shafts are furnished.
Construction specifications and standards. Section 2.5.1 presents an overview of CDOT
construction specifications and Colorado’s methods for construction of drilled shafts. Section
503.04 of CDOT specifications reads, “Holes shall be pumped free of water, cleaned of loose
material, and inspected by the engineer.” Based on this requirement, it is expected that the
contractor will keep the hole dry, scrape any soft cuttings from the sides of the hole, and clean
the base of the hole.
Construction information and observations at the load test sites. The construction methods
for the test shafts employed in the T-REX and Broadway projects are described in detail in
Section 2.5.2. These construction methods are representative of the typical construction
procedure for production shafts employed in Colorado. The documented construction methods
for the drilled shafts employed in the other load tests are also presented in Chapters 3 and 5, and
Appendix A. Dry and wet shaft hole conditions are encountered in the load tests (discussed
later). These are the roughness conditions experienced in the test shaft holes:
Medium to rough holes were generated in the harder claystone and sandstone shale bedrock
at the Franklin, Broadway, and Trinidad load test sites under normal drilling procedures
using the auger and cutting teeth. It is expected that there will be no need for artificial
roughening in these hard shale formations.
In the soft claystone shale bedrocks, three levels of roughness were reported at the load test
sites.
i. Smooth sides, no use of artificial roughening. Lowest values of unit side resistance for a
given strength are reported in this case (the 23rd Street load tests and the I-270/I76 load
tests).
6-11
ii. Minimal roughening of the of the lower 10 feet of the bedrock socket by replacing the
outer cutting teeth with a “roughening” tooth that extends about 1.7” from the sides of the
auger. This simple and quick roughening procedure was performed in the I-225 and
County Line shafts to remove any smear zone from the side of the shaft holes in order to
allow the natural roughness to be effective. Values of unit side resistance for a given
bedrock strength seem to be higher than those reported for the first case.
iii. Artificial roughening with the use of side shear rings. One of the benefits of the two load
tests performed in the early 1990s (23rd Street and I-270/I76 load tests) is the result that
shear rings generate a measurable improvement in side shear capacity compared to drilled
shafts of similar dimensions completely drilled without or with some roughening.
Recommendation to improve CDOT’s current practice for construction of production and
test drilled shafts. Section 2.5.3 presents some additional recommendations to improve CDOT’s
construction practice for drilled shafts (shaft cleaning, drilling and concrete placement, use of
water, slurry, and casing, wet holes, and shaft roughness). For deep shafts cleaned following the
standard procedure, but where a clean bottom cannot be verified, several alternatives are
suggested. In order to prevent the bedrock socket of the shafts from being smooth or degrading
with time, the following requirements (some in CDOT construction requirements) should be
adhered to:
Rapid and continuous drilling of the shaft hole with minimal use of water during drilling,
followed by rapid and continuous placement of the fresh concrete.
No use of drilling slurry or casing in the rock socket.
Use of casing in the overburden when perched water is expected, and
Quick removal of any water encountered in the rock socket.
Minimal artificial roughening (not rigorous with shear rings) as described before for all CDOT
drilled shafts socketed in weak rocks is recommended if roughening under normal drilling is not
observed. This roughening is simple, quick (in matter of few minutes), and easy to do, and it is
recommended to consider if in doubt of roughening under normal drilling. The proposed
roughening method shall be approved by the Project Engineer. The roughening requirement may
be waived at the Engineer’s discretion and after consultation with the Geotechnical Engineer.
6-12
A wet shaft is defined as a shaft filled with water which occurs when water infiltrates into the
shaft excavation at a rate higher than it can be pumped out. This condition was observed in rocks
of high RQD (due to presence of fractures and joints in blocky rock) and when GWT
(groundwater table) is located above the top level of the rock. Suggestions for placement of
concrete in wet shaft holes are presented in Section 2.5.3. Exposure of certain bedrock shales to
water for long periods, especially the softer claystone shale bedrock, could weaken its side
resistance, so rapid drilling and placement of concrete are important factors in this case as
discussed in Section 2.5.3. It should be remembered that the presence of natural water in the
rocks (for example due to high ground water table) is accounted for in testing results of the lab
strength tests, the in situ test (SPT and PMT), and the load tests. So no reduction should be made
to any estimate of the side and base unit resistances or to measured strength of the rock due to
the presence of natural water. The water problem may develop when the shale bedrock is
subjected to excess water, for example, from perched water present in the overburden soil above
fractured or weathered rocks that could seep in the shaft hole and influence the concrete to
bedrock bond. This happened during the Trinidad load test (Section 5.4.4) and the 23rd Street
load test with smooth shaft holes.
In the very hard shale bedrocks like those encountered in the Broadway and Trinidad sites, the
load test results suggest that any influence of the water on load tests is minimal. Therefore, water
is not expected to degrade what is called in this study hard shale bedrock. In this study, hard
shale bedrock should be classified as rock-like (not soil-like) material (durable, sound, not
sensitive to water, and has very small potential for creep) per Colorado Testing Procedure 26-90.
The observations and findings of this study for hard shale bedrock are that large water infiltration
in these types of rocks: will not cause caving, is due to presence of fractures and joints in blocky
rocks, and will not degrade the rock so that deepening the hole may not be needed.
The depth of extra drilling due to wet hole conditions should be determined in consultation with
the Geotechnical Engineer based on the estimated degradation of the sidewall materials on the
exposure to the water. Load tests should be performed on wet and dry shaft hole conditions to
investigate and quantify the influence of water for different types of shale bedrocks.
6-13
Additional recommendations for construction of test shafts: Most of the following
recommendations are presented in Chapter 4 and were applied in the Trinidad load tests
discussed in Chapter 5. Any developed design methods for drilled shafts based on load test
results are applicable to other production shafts only if the construction methods employed in the
production shafts are similar or better than those applied in the load test shafts. Therefore, future
load test shafts in Colorado will be constructed with layouts, materials, and construction
procedures like (or worse than) those employed for the production projects. Construction,
materials, and layout information for the test shafts should be documented. Other
recommendations are:
1. Method of drilling can influence the generated side resistance. Future load tests in Colorado
should be drilled with augers having cutting teeth. This is the appropriate drilling method for
the weak sedimentary rocks recommended (next section) in future Colorado load tests.
2. The load testing procedure for the test shafts should be described through revisions to Section
503 of CDOT construction specifications. Examples of these revisions when O-Cell load
tests are employed are presented in Appendices B and C.
3. Eliminate the contribution of overburden to side resistance by installation of a temporary
casing to top of rock and keep it there until the test is complete (see Chapter 5 and Appendix
E).
4. For the O-Cell load test, a contingent grouting procedure should be specified that would be
employed if the test shafts are wet during construction. This procedure is described in
Section 4.3.8. If the shaft is dry then no grouting is required.
5. Any available roughness conditions of the bedrock socket and the use of any artificial
roughening tools should be documented. With minimal roughening, no inspection of the
dimensions of grooves is needed herein (no measurements of depth and width of grooves),
just witnessing that the contractor performs the work described herein. For inspection of
roughening generated under normal drilling or under artificial roughening using shear rings,
caliber the test pier borehole and obtain its roughness profile using laser devices or
mechanical devices. At minimum, have the inspector use some sort of feeler or mirrors and
determine the depth of the deepest grooves.

6-14
6.3.3 Lessons Learned from the Investigation on Geology of Colorado’s Bedrocks
Scope of Work: To list and describe Colorado’s bedrock geological formations that are
typically encountered during construction of drilled shafts, and for which the load test data are
collected. Then, based on the results of this investigation, to: 1) select the type of geological
formations that should be considered in future planning of load tests, and 2) determine if geology
should be a factor in selecting the exact locations of future load tests.
Study findings: The geology of Colorado’s highways is presented in Section 2.3 and the impact
of geology on highway structure foundations is presented in Section 2.4. The greatest
applicability of load test data is to major bridge structures. These are most commonly associated
with rural interstate highways and urban controlled-access highway improvements. Much of the
mileage of these types of highways is along the existing interstate highway grid, and in the Front
Range Metropolitan areas. Tables 2.1 and 2.2 summarize the geological formations along
Interstates I-25, I-70, and I-76, and along State Highway 50. SH-50 is listed because it is
representative of many Colorado highways as it crosses the center of the State from Utah to
Kansas, including valleys in the west, the Rocky Mountains, and the Eastern Plains. The
feasibility of using drilled shafts in these formations is also presented in these tables. Table 3.1
lists the compiled Colorado axial load sites on drilled shafts and the names of their geological
bedrock formations.
Tables 2.1 and 2.2 suggest that many of Colorado’s highways alignments are in the Sedimentary
Cretaceous and Tertiary Formations such as the Upper Dawson Arkose, Castle Rock
Conglomerate, Denver, Arapahoe, & Lower Dawson Formations and the Laramie Formation,
Fox Hills Sandstone, Pierre Shale, and Mancos Formations. Large parts of Colorado are
underlain by the Pierre and Mancos Formations, the Pierre in the east half of the State, and the
Mancos on the west part of the State (Tables 2.1 and 2.2). The most common formations are the
Pierre, Mancos, Denver, and Dawson Formations and these cover the bedrock formations on
which the load tests collected in this study were performed (see Table 3.1). These sedimentary
formations consist of weakly cemented claystone, siltstone, sandstone, and interbedded
sandstone/claystone, with composition consisting of varying amounts of fine-grained to very
6-15
coarse-grained sediments. The sedimentary rocks encountered in the load test sites are highly
variable with unconfined compressive strength ranging from 6 ksf (very stiff clay soils) to more
than 500 ksf (Trinidad site). The variability of sedimentary rock requires that site-specific
investigations be performed to assess local conditions and appropriate foundation types. The
sedimentary rocks in Colorado can be called “weak” making them feasible for the use of drilled
shaft foundation systems (see Tables 2.1 and 2.2).
Based on the above, sedimentary rock formations will most likely be encountered in drilled
foundations supporting bridge structures in Colorado. In these formations, drilled shafts are
capable of supporting large loads. The formations indicated as unlikely candidates for drilled
shafts in Tables 2.1 and 2.2 are typically the very hard igneous and metamorphic rocks. Drilled
shafts can be installed in these hard rocks but with high costs, making other foundation
alternatives, such as shallow foundations or end-bearing H-piles, cheaper.
Rock type and strength are probably better delineators of engineering behavior than geologic
formations, unless the depositional process or age of one formation is very different from another
for the same rock type. It is believed that for Colorado’s weak sedimentary rocks, strength and
consistency of the rock, not type of the geological formation, should be considered to estimate
the capacity of the rock to support foundation loads, because:
• Similar geological depositional environments and age for many of Colorado’s sedimentary
geological formations are likely be encountered in drilled foundations. Some of the most
common geological formations in Colorado (Mancos, and Pierre) were deposited in the
Cretaceous Sea (see Tables 2.1 and 2.2), so they are very similar in age, composition and
character. The Denver and the Dawson have many similar characteristics. Thus, drilled
shaft design parameters are often very similar in these formations.
• All the design methods recommended in AASHTO, FHWA, and the Canadian Foundation
Design Manual are not in any way a function of the geological formation but are a function
of the mass strength and type of the rock. Geotechnical engineers in Colorado, for routine
projects, seek for easily (inexpensively) obtained parameters that are either direct or
indirect measures of supporting material strength. At the simplest level, the Denver Method
uses SPT N-Values as a rough indication of rock strength. Thus rock strength, usually
6-16
indirectly measured, is used to determine drilled shaft capacities, generally without regard
to the geologic formations.
• Many of Colorado’s load tests were performed on drilled shafts embedded in soft to very
hard Pierre, Denver, Dawson, and Mancos bedrock formations (Table 3.1). The test results
seem to indicate that strength and consistency, not geology, are the main parameters that
control the capacity of the rock to resist external loads.
Based on the above, the study recommends not to limit Colorado’s future load tests to any
particular sedimentary geological formations because it is believed that drilled shaft load test
results in one sedimentary geological formation in Colorado can readily be extrapolated to
another sedimentary geological formation of similar in situ strength and type (claystone or
sandstone). This conclusion will greatly facilitate applying the load test information obtained
over greater areas of the state. It is also important to identify the type of the geological formation
encountered at the load test site. It is probable that as a load test database is assembled, any
influence of the bedrock geology on the capacity of the drilled shafts will be identified.
6.4 CDOT’s Future Needs for Axial Load Tests on Drilled Shafts
Based on the lessons learned in this study and the recommendations of CDOT Research Report
2003-6, CDOT’s future needs for axial load tests on drilled shafts are established: Where, When,
and How to perform future axial load tests on drilled shafts. The recommended axial load testing
program would generate net savings to the construction project (higher resistance values and
lower factor of safety) in addition to providing research data for improvement of the design
methodology for drilled shafts. After Colorado’s design methods are improved based on
sufficient number of load tests, additional loads tests may be performed in the future for just pure
economical reasons.
6.4.1. Type, Location, and Number of Future Load Tests
The O-Cell should be considered in Colorado’s future drilled shaft load tests until more cost-
effective and innovative load test methods become available. It is also recommended to consider
6-17
conventional load tests for low-capacity production shafts with ultimate capacity up to 1000 tons.
Colorado’s future load tests should be performed on shafts embedded in weak sedimentary rocks
with unconfined compressive strength (qu) up to 500 ksf. The load tests should not be limited to
any particular sedimentary geological formations because it is believed that drilled shaft load test
results in one sedimentary formation can readily be extrapolated to another sedimentary
formation of similar in situ strength and type. Future load tests in Colorado should be drilled
with augers having cutting teeth. This is the appropriate drilling method for the weak
sedimentary rocks recommended in future Colorado’s load tests.
No future load tests are recommended for the soil-like sandstone shale bedrocks (50<SPT-N
value< 100) as it is unlikely savings will be generated from improved design methods in these
materials based on load tests. This type of weak rocks exists in Colorado but is not a typically
encountered material. Denver traditional design methods or those recommended by the FHWA
(see Abu-Hejleh, et. al, 2003) can be used for the design of drilled shafts embedded in this type
of weak rocks.
No future load tests are recommended for the typical soft claystone shale bedrocks (20<SPT-
N<100) with smooth shaft holes as those encountered at the I-225 and County Line sites because
the UCSB design method recommended by Abu-Hejleh et. al (2003) for these materials is: 1) the
most accurate and economical since it employs the lowest possible factor of safety of 2; and 2)
more conservative than the CSB design method employed in Colorado for decades without
failure using a factor of safety less than 2. Hence, future load tests in these soft shale bedrocks
will generate no savings to the construction project and most likely will not lead to significant
improvement in the accuracy of the recommended UCSB method.
Future Colorado load tests should be considered in the following three categories of sedimentary
weak rocks (see Table 6.1):
The firmer claystone shale bedrocks (50<SPT-N<100) when shear rings are employed during
construction for artificial roughening of the shaft hole sides. In this case, side shear resistance
may improve significantly as discussed before. A minimum of 7 new load test sites (one test
per site) are recommended (2 for wet and 5 for dry shaft holes). Since the objective is to
develop only accurate side resistance design methods (not base) for drilled shafts (dry or
6-18
wet), the main purpose of the load tests should be to determine (mobilize) the ultimate unit
side resistance of the rock. Unit base resistance in this type of shale bedrock can be estimated
from the current Colorado SPT-based (CSB) design method with a factor of safety of 2 or the
UCSB method recommended in CDOT Research Report 2003-6 (presented in Section 3.2.2).
Very hard claystone shale bedrocks with SPT-N value >120 bpf (or > 50/5”) and qu< 100 ksf,
and classified as rock-like material per Colorado Testing Procedure 26-90. This is a typical
shale bedrock in Colorado encountered in the Franklin load test. The Franklin bedrock is a
very hard, mostly thinly bedded, bluish gray, and sandy claystone bedrock with qu ranging
from 40 ksf to 90 ksf (average of 65 ksf) around the bedrock socket and around 41 ksf
beneath the socket. In this rock, SPT testing was terminated in the second interval with 50
blows per 4 inches of penetration (50/4”) around the shaft and 50/5” beneath the shaft. A
minimum of 7 load test sites are recommended (2 for wet and 5 for dry shaft hole
conditions). Two load tests per site should be performed: one mainly to obtain base
resistance data and one mainly to obtain side resistance data. The load tests for side
resistance should be designed to fully mobilize the side resistance over a settlement
exceeding 1”. The purpose of the load tests is to develop more accurate base and side
resistance design methods of the drilled shafts in these materials when the shaft holes are
either wet or dry. Once the design methods are improved for these materials (in the long-term
not in the short term), long-term savings should be expected. It is expected that normal
drilling using the auger and cutting teeth in this material will generate medium to rough
holes.
Very hard and massive shale bedrock with qu less than 500 ksf, and SPT-N values >100 for
granular-based rock, and qu>100 ksf for clay-based rock, and classified as rock-like material
per Colorado Testing Procedure 26-90. This rock was experienced in the Broadway and
Trinidad sites (see Chapter 5 for description). The Broadway bedrock is very hard, well-
cemented (massive), bluish gray and clayey sandstone with claystone interbeds and qu
ranging from 97 ksf to 293 ksf (average of 145 ksf) around the bedrock socket and around
219 ksf beneath the socket. In the rock around the test shaft, SPT testing was terminated
during both the second interval (50/3”) and the first interval (100/5.5”). In the rock beneath
the test shaft, the SPT testing was terminated in the first interval (83/6”). A minimum of 5
load test sites are recommended (1 for wet and 4 for dry shaft hole conditions). Two load
6-19
tests per site should be performed: one mainly to obtain base resistance data and one mainly
to obtain side resistance data. The load tests for side resistance should be designed to fully
mobilize the side resistance over a settlement exceeding 1”. The load tests will improve the
accuracy of the design methods (reduce FS), and will result in higher allowable unit base and
side resistance values for wet and dry shaft holes. The use of load tests in this case is
expected to generate significant savings immediately to the construction project and in the
long-term when the design methods are improved. It is expected that normal drilling using
the auger and cutting teeth in this material will generate medium to rough holes.
Available load tests information on these three categories of weak rocks are identified and
ranked in Table 6.1.
A wet shaft is defined as a shaft filled with water at the time of concrete placement, which occurs
when water is infiltrating into the bedrock hole at a rate higher than it can be pumped out. Shafts
are considered dry if water is pumped out and water depth is kept low when concrete placement
started. A wet shaft hole condition was only encountered in one of the two Trinidad load tests,
and this explains the relatively smaller number of wet load tests (only 2) required in each type of
shale bedrock. The best scenario is to have wet and dry load tests side by side in the same site
(as in the Trinidad load tests) in order to quantify the influence of water on the measured unit
base and side resistances of the test shafts.
For inspection of roughening of shaft holes generated under normal drilling (expected for
Categories II and III of rocks) and under artificial roughening (for Category I), caliber the test
pier borehole and obtain its roughness profile using laser devices or mechanical devices. At
minimum, have the inspector use some sort of feeler or mirrors and determine the depth of the
deepest grooves.
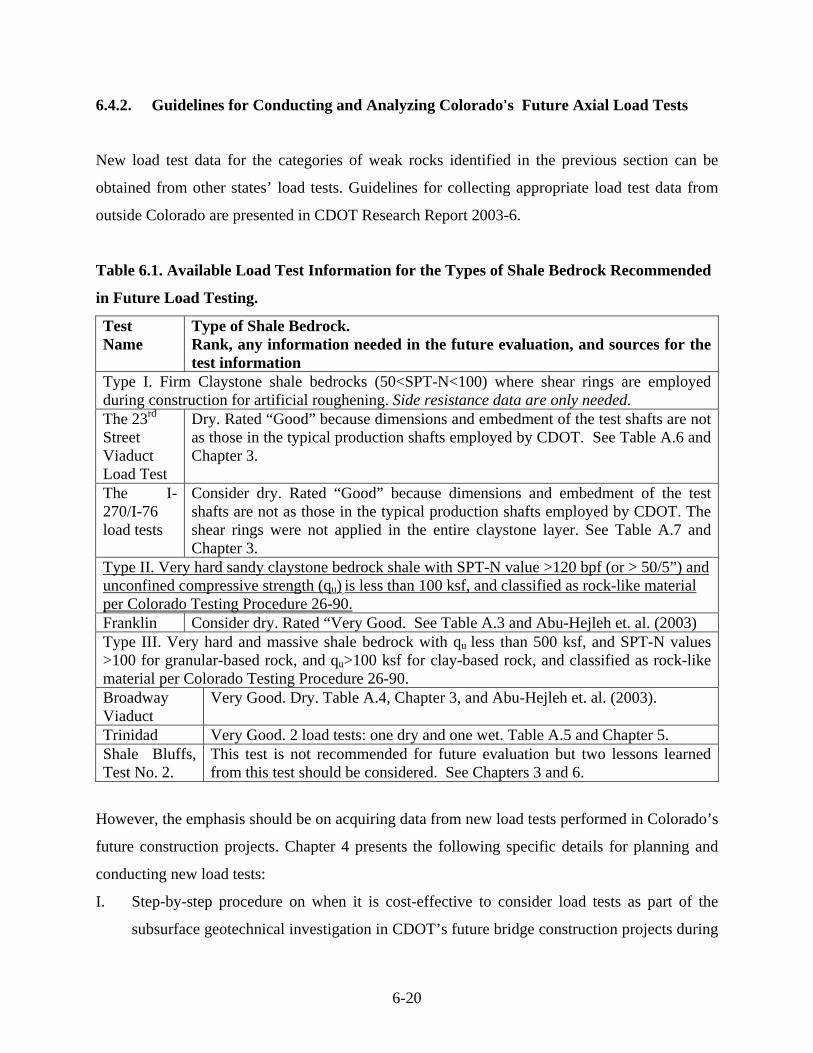
6-20
6.4.2. Guidelines for Conducting and Analyzing Colorado's Future Axial Load Tests
New load test data for the categories of weak rocks identified in the previous section can be
obtained from other states’ load tests. Guidelines for collecting appropriate load test data from
outside Colorado are presented in CDOT Research Report 2003-6.
Table 6.1. Available Load Test Information for the Types of Shale Bedrock Recommended
in Future Load Testing.
Test Name
Type of Shale Bedrock. Rank, any information needed in the future evaluation, and sources for the test information
Type I. Firm Claystone shale bedrocks (50<SPT-N<100) where shear rings are employed during construction for artificial roughening. Side resistance data are only needed. The 23rd Street Viaduct Load Test
Dry. Rated “Good” because dimensions and embedment of the test shafts are not as those in the typical production shafts employed by CDOT. See Table A.6 and Chapter 3.
The I-270/I-76 load tests
Consider dry. Rated “Good” because dimensions and embedment of the test shafts are not as those in the typical production shafts employed by CDOT. The shear rings were not applied in the entire claystone layer. See Table A.7 and Chapter 3.
Type II. Very hard sandy claystone bedrock shale with SPT-N value >120 bpf (or > 50/5”) and unconfined compressive strength (qu) is less than 100 ksf, and classified as rock-like material per Colorado Testing Procedure 26-90. Franklin Consider dry. Rated “Very Good. See Table A.3 and Abu-Hejleh et. al. (2003) Type III. Very hard and massive shale bedrock with qu less than 500 ksf, and SPT-N values >100 for granular-based rock, and qu>100 ksf for clay-based rock, and classified as rock-like material per Colorado Testing Procedure 26-90. Broadway Viaduct
Very Good. Dry. Table A.4, Chapter 3, and Abu-Hejleh et. al. (2003).
Trinidad Very Good. 2 load tests: one dry and one wet. Table A.5 and Chapter 5. Shale Bluffs, Test No. 2.
This test is not recommended for future evaluation but two lessons learned from this test should be considered. See Chapters 3 and 6.
However, the emphasis should be on acquiring data from new load tests performed in Colorado’s
future construction projects. Chapter 4 presents the following specific details for planning and
conducting new load tests:
I. Step-by-step procedure on when it is cost-effective to consider load tests as part of the
subsurface geotechnical investigation in CDOT’s future bridge construction projects during
6-21
different stages of the design phase. Load tests on drilled shafts are cost-effective if ALL
the following conditions are met:
1) Projects with a large number of drilled shafts required to support large bridges and with
total construction costs for all phases of the project exceeding $10,000,000. The greatest
number of large bridges that will be supported by drilled shafts will be associated with
limited-access highway corridor improvement projects.
2) Penetration depth of the drilled shafts is controlled by axial load, not lateral load.
3) Presence of
a. Very hard claystone and/or sandstone shale bedrock with SPT-N value larger than
50/6” and confirmed to be rock-like geomaterial per Colorado Testing Procedure 26-90.
b. Firm claystone shale bedrock with SPT-N value larger than 50 and when artificial shear
rings will be employed for roughening the sides of the shaft holes.
4) Net savings are expected based on cost-benefit analysis (described in Chapter 4).
Load tests should be performed early in the project timeline so that the results can be
incorporated by the design team into the construction bid package and all the benefits from the
load test can be realized. This is most feasible when the project/corridor geology and general
subsurface conditions are obtained in the Environmental Assessment/Preliminary Engineering
Phase of the project, and the drilled shaft load tests are performed during the FIR project phase.
See Chapter 4 for more details.
II. Guidelines for planning, design, and construction of new load tests on drilled test shafts.
This includes: 1) purposes and promotion of new load tests; 2) location and number of the
load tests; 3) type of test shafts (production or sacrificial); 4) types, features, and costs of
load tests; 5) geotechnical investigation around the test shaft; 6) design of the O-Cell load
test; 7) construction and instrumentation of the test shafts; and 8) data collection at the load
test site. The construction recommendations for test shafts were summarized in Section
6.3.2. Sample Guide Specifications for Osterberg Cell Load Testing of Drilled Shafts are
presented in Appendix B. Revision of Section 503 of CDOT Standard Specifications to
incorporate the Osterberg Cell Load Test in the Broadway construction project is presented
in Appendix C.
6-22
III. Analysis procedure of Osterberg Cell (O-Cell) load test results. This includes: 1) analysis
of O-Cell load test results to extract the load transfer curves; 2) definitions of tolerable
settlement, ultimate unit base and side resistances; 3) construction of the equivalent top
load-settlement curve from the results of the O-Cell test; and 4) construction of a simple
equivalent top load-settlement curve from the results of simple geotechnical tests. The
measured and analyzed results from four O-Cell load tests are thoroughly discussed in
CDOT Research Report 2003-6. The analysis employed in that report to identify the proper
design methods of drilled shafts can be used as a reference in analyzing the larger set of
load tests that will be developed in Colorado in the future.
The comprehensive guidelines suggested in Chapter 4 for conducting new load tests,
summarized in the previous subsection, were applied in the Trinidad project. Chapter 5 provides
details of all the steps employed for the planning, design, construction, and analysis of the two
Trinidad load tests. CDOT engineers should benefit from this example for conducting future load
tests.
Once the assembly of a database with adequate number of load test results and other information
is completed, the analysis procedure for load test results and the descriptions of different
categories of weak rocks presented in this report should be revisited and modified if necessary.
7-1
REFERENCES AASHTO (2002). Standard Specifications for Highways Bridges. American Association of Highway and Transportation Officials, Washington, D.C., 17th Edition. AASHTO (1998). LRFD Bridge Design Specifications. American Association of Highway and Transportation Officials, Washington, D.C., 2nd Edition. Abu-Hejleh,N., O’Neill, M., Hanneman, D., and Attwooll, W. (2003). Improvement of the Geotechnical Axial Design Methodology for Colorado’s Drilled Shafts Socketed in Weak Rocks. Colorado DOT, CDOT-DTD-R-2003-6. Denver. 192p. FHWA (1999). Drilled Shafts: Construction Procedures and Design Methods. FHWA Publication No. FHWA-IF-99-025. Department of Transportation, Federal Highway Administration, McLean, VA 22101-2296, USA. Published by TRB, Washington, D.C., USA. Ground Engineering Consultants, Inc. (2003). “Subsurface Exploration and Laboratory Testing, Caisson Load Test, I-25 Trinidad Project.” Task Order 6, Job Number 03-3099. Report Submitted to Felsburg Holt & Ullevig, Englewood, Colorado. Ground Engineering Consultants, Inc. (1992). “Drilled Straight-Shaft Piers, Pier Load Test, 23rd Street Viaduct, Denver, Colorado.” Job Number 92-106, Report Submitted to Centennial Engineering, Inc., P.O. Drawer 1307, Arvada, CO 80001. Jubenville, D, M., and Hepworth, R. C. (1981). “Drilled Pier Foundations in Shale, Denver, Colorado Area”, Drilled Piers and Caissons, Ed. by M. W. O’Neill, ASCE, pp. 66 – 81. LOADTEST, Inc. (2003). “Data Report on Drilled Shafts Load Testing (OSTERBERG METHOD),” Trinidad, CO-I-25. Project Numbers LT-8958-1 and 2. Prepared for Lawrence Construction CO, 9002 North Moore Rd., Littleton, CO 80125. LOADTEST, Inc. (2002). “Data Report on Drilled Shafts Load Testing (OSTERBERG METHOD)”. Project Numbers LT-8739-1, 2, and 3, and LT-8817-1 and 2. Prepared for Southeast Corridor Constructors. 7200 South Alton Way, Centennial, CO 80112. LOADTEST, Inc. (1998). “Data Report on Drilled Shafts Load Testing (OSTERBERG METHOD)”. Project Numbers LT-8402-1 and 2. Prepared for Kiewit Western CO., P.O.Box 7947, Aspen, Colorado 81612. Turner, J. P., Sandberg, E., and Chou, N. (1993). “Side Resistance of Drilled Shafts in the Denver and Pierre Formations,” Design and Performance of Deep Foundations: Piles and Piers in Soil and Soft Rock, GSP No. 38, Ed. by P. P. Nelson, T. D. Smith and E. C. Clukey, ASCE, pp. 245 – 259.
7-2
Woodward-Clyde Consultants (1992). “Pier and Pile Foundation Load Tests at Interchanges 270
and 76, Adams County, Colorado.” Prepared for Colorado Department of Transportation, 4340
East Louisiana Ave., Denver, CO 80222.

7-3
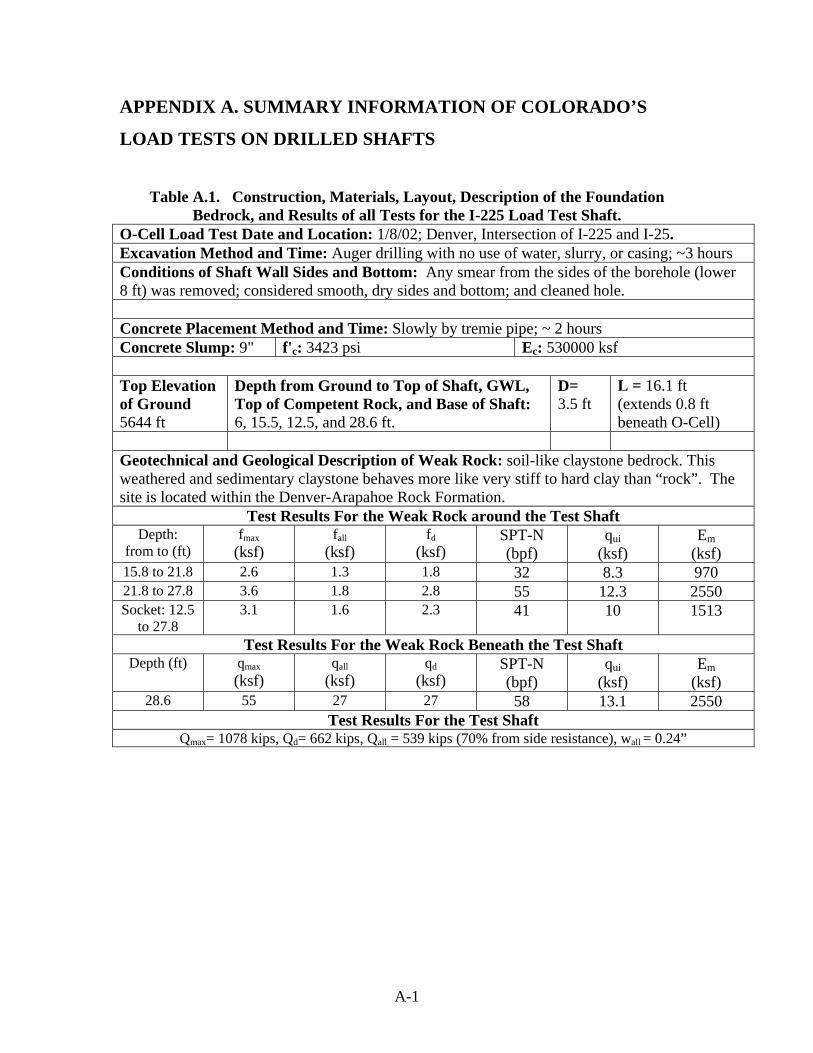
A-1
APPENDIX A. SUMMARY INFORMATION OF COLORADO’S
LOAD TESTS ON DRILLED SHAFTS
Table A.1. Construction, Materials, Layout, Description of the Foundation Bedrock, and Results of all Tests for the I-225 Load Test Shaft.
O-Cell Load Test Date and Location: 1/8/02; Denver, Intersection of I-225 and I-25. Excavation Method and Time: Auger drilling with no use of water, slurry, or casing; ~3 hours Conditions of Shaft Wall Sides and Bottom: Any smear from the sides of the borehole (lower 8 ft) was removed; considered smooth, dry sides and bottom; and cleaned hole. Concrete Placement Method and Time: Slowly by tremie pipe; ~ 2 hours Concrete Slump: 9" f'c: 3423 psi Ec: 530000 ksf Top Elevation of Ground 5644 ft
Depth from Ground to Top of Shaft, GWL, Top of Competent Rock, and Base of Shaft: 6, 15.5, 12.5, and 28.6 ft.
D= 3.5 ft
L = 16.1 ft (extends 0.8 ft beneath O-Cell)
Geotechnical and Geological Description of Weak Rock: soil-like claystone bedrock. This weathered and sedimentary claystone behaves more like very stiff to hard clay than “rock”. The site is located within the Denver-Arapahoe Rock Formation.
Test Results For the Weak Rock around the Test Shaft Depth:
from to (ft) fmax
(ksf) fall
(ksf) fd
(ksf) SPT-N (bpf)
qui (ksf)
Em (ksf)
15.8 to 21.8 2.6 1.3 1.8 32 8.3 970 21.8 to 27.8 3.6 1.8 2.8 55 12.3 2550 Socket: 12.5
to 27.8 3.1 1.6 2.3 41 10 1513
Test Results For the Weak Rock Beneath the Test Shaft Depth (ft) qmax
(ksf) qall
(ksf) qd
(ksf) SPT-N (bpf)
qui (ksf)
Em (ksf)
28.6 55 27 27 58 13.1 2550 Test Results For the Test Shaft
Qmax= 1078 kips, Qd= 662 kips, Qall = 539 kips (70% from side resistance), wall = 0.24”
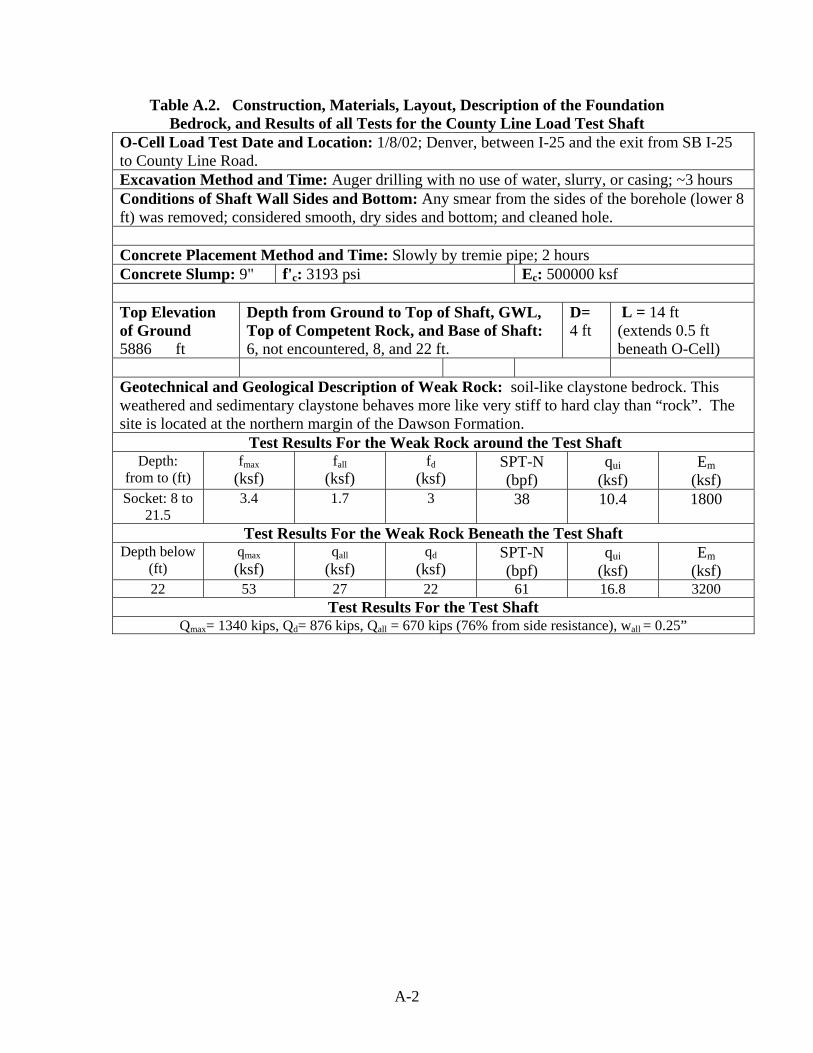
A-2
Table A.2. Construction, Materials, Layout, Description of the Foundation Bedrock, and Results of all Tests for the County Line Load Test Shaft
O-Cell Load Test Date and Location: 1/8/02; Denver, between I-25 and the exit from SB I-25 to County Line Road. Excavation Method and Time: Auger drilling with no use of water, slurry, or casing; ~3 hours Conditions of Shaft Wall Sides and Bottom: Any smear from the sides of the borehole (lower 8 ft) was removed; considered smooth, dry sides and bottom; and cleaned hole. Concrete Placement Method and Time: Slowly by tremie pipe; 2 hours Concrete Slump: 9" f'c: 3193 psi Ec: 500000 ksf Top Elevation of Ground 5886 ft
Depth from Ground to Top of Shaft, GWL, Top of Competent Rock, and Base of Shaft: 6, not encountered, 8, and 22 ft.
D= 4 ft
L = 14 ft (extends 0.5 ft beneath O-Cell)
Geotechnical and Geological Description of Weak Rock: soil-like claystone bedrock. This weathered and sedimentary claystone behaves more like very stiff to hard clay than “rock”. The site is located at the northern margin of the Dawson Formation.
Test Results For the Weak Rock around the Test Shaft Depth:
from to (ft) fmax
(ksf) fall
(ksf) fd
(ksf) SPT-N (bpf)
qui (ksf)
Em (ksf)
Socket: 8 to 21.5
3.4 1.7 3 38 10.4 1800
Test Results For the Weak Rock Beneath the Test Shaft Depth below
(ft) qmax
(ksf) qall
(ksf) qd
(ksf) SPT-N (bpf)
qui (ksf)
Em (ksf)
22 53 27 22 61 16.8 3200 Test Results For the Test Shaft
Qmax= 1340 kips, Qd= 876 kips, Qall = 670 kips (76% from side resistance), wall = 0.25”
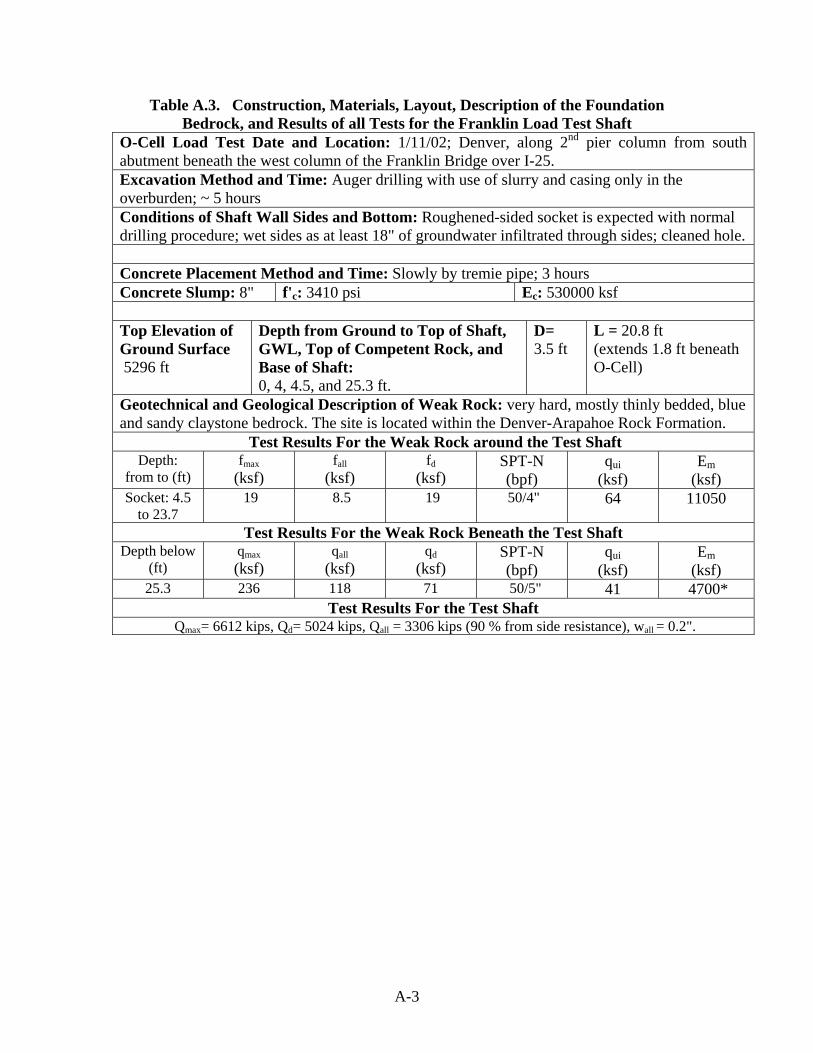
A-3
Table A.3. Construction, Materials, Layout, Description of the Foundation Bedrock, and Results of all Tests for the Franklin Load Test Shaft
O-Cell Load Test Date and Location: 1/11/02; Denver, along 2nd pier column from south abutment beneath the west column of the Franklin Bridge over I-25. Excavation Method and Time: Auger drilling with use of slurry and casing only in the overburden; ~ 5 hours Conditions of Shaft Wall Sides and Bottom: Roughened-sided socket is expected with normal drilling procedure; wet sides as at least 18" of groundwater infiltrated through sides; cleaned hole. Concrete Placement Method and Time: Slowly by tremie pipe; 3 hours Concrete Slump: 8" f'c: 3410 psi Ec: 530000 ksf Top Elevation of Ground Surface 5296 ft
Depth from Ground to Top of Shaft, GWL, Top of Competent Rock, and Base of Shaft: 0, 4, 4.5, and 25.3 ft.
D= 3.5 ft
L = 20.8 ft (extends 1.8 ft beneath O-Cell)
Geotechnical and Geological Description of Weak Rock: very hard, mostly thinly bedded, blue and sandy claystone bedrock. The site is located within the Denver-Arapahoe Rock Formation.
Test Results For the Weak Rock around the Test Shaft Depth:
from to (ft) fmax
(ksf) fall
(ksf) fd
(ksf) SPT-N (bpf)
qui (ksf)
Em (ksf)
Socket: 4.5 to 23.7
19 8.5 19 50/4" 64 11050
Test Results For the Weak Rock Beneath the Test Shaft Depth below
(ft) qmax
(ksf) qall
(ksf) qd
(ksf) SPT-N (bpf)
qui (ksf)
Em (ksf)
25.3 236 118 71 50/5" 41 4700* Test Results For the Test Shaft
Qmax= 6612 kips, Qd= 5024 kips, Qall = 3306 kips (90 % from side resistance), wall = 0.2".
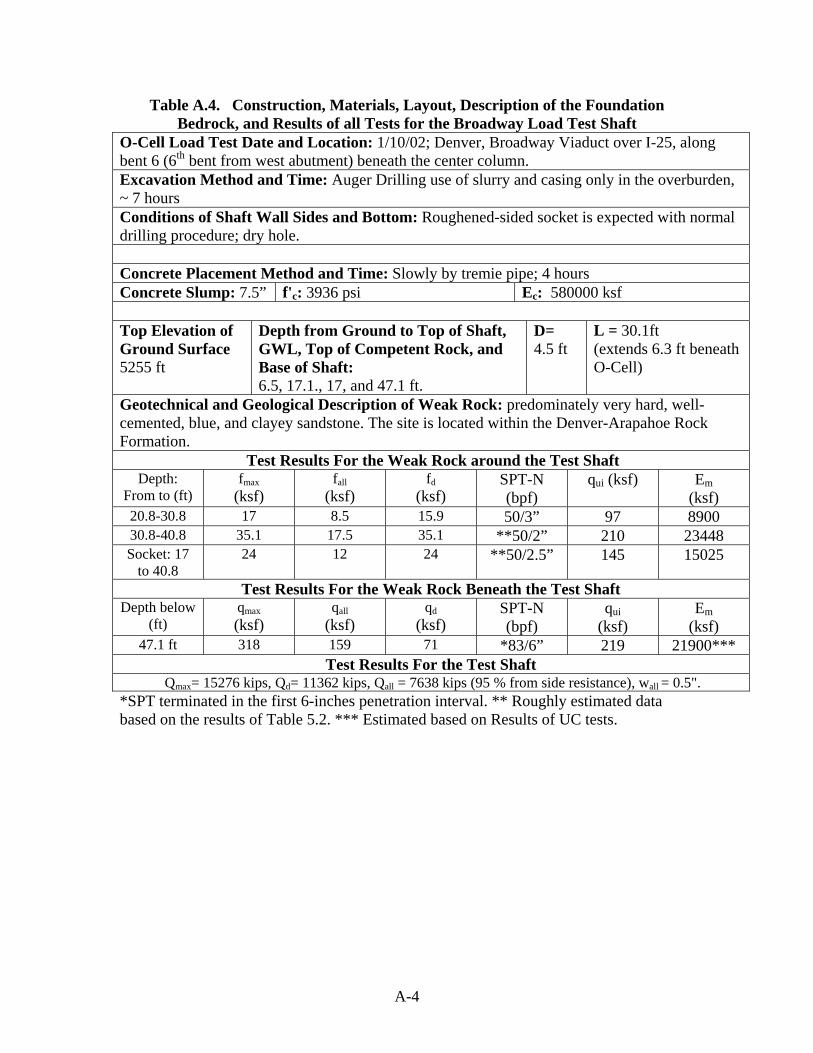
A-4
Table A.4. Construction, Materials, Layout, Description of the Foundation Bedrock, and Results of all Tests for the Broadway Load Test Shaft
O-Cell Load Test Date and Location: 1/10/02; Denver, Broadway Viaduct over I-25, along bent 6 (6th bent from west abutment) beneath the center column. Excavation Method and Time: Auger Drilling use of slurry and casing only in the overburden, ~ 7 hours Conditions of Shaft Wall Sides and Bottom: Roughened-sided socket is expected with normal drilling procedure; dry hole. Concrete Placement Method and Time: Slowly by tremie pipe; 4 hours Concrete Slump: 7.5” f'c: 3936 psi Ec: 580000 ksf Top Elevation of Ground Surface 5255 ft
Depth from Ground to Top of Shaft, GWL, Top of Competent Rock, and Base of Shaft: 6.5, 17.1., 17, and 47.1 ft.
D= 4.5 ft
L = 30.1ft (extends 6.3 ft beneath O-Cell)
Geotechnical and Geological Description of Weak Rock: predominately very hard, well-cemented, blue, and clayey sandstone. The site is located within the Denver-Arapahoe Rock Formation.
Test Results For the Weak Rock around the Test Shaft Depth:
From to (ft) fmax
(ksf) fall
(ksf) fd
(ksf) SPT-N (bpf)
qui (ksf) Em (ksf)
20.8-30.8 17 8.5 15.9 50/3” 97 8900 30.8-40.8 35.1 17.5 35.1 **50/2” 210 23448 Socket: 17
to 40.8 24 12 24 **50/2.5” 145 15025
Test Results For the Weak Rock Beneath the Test Shaft Depth below
(ft) qmax
(ksf) qall
(ksf) qd
(ksf) SPT-N (bpf)
qui (ksf)
Em (ksf)
47.1 ft 318 159 71 *83/6” 219 21900*** Test Results For the Test Shaft
Qmax= 15276 kips, Qd= 11362 kips, Qall = 7638 kips (95 % from side resistance), wall = 0.5". *SPT terminated in the first 6-inches penetration interval. ** Roughly estimated data based on the results of Table 5.2. *** Estimated based on Results of UC tests.
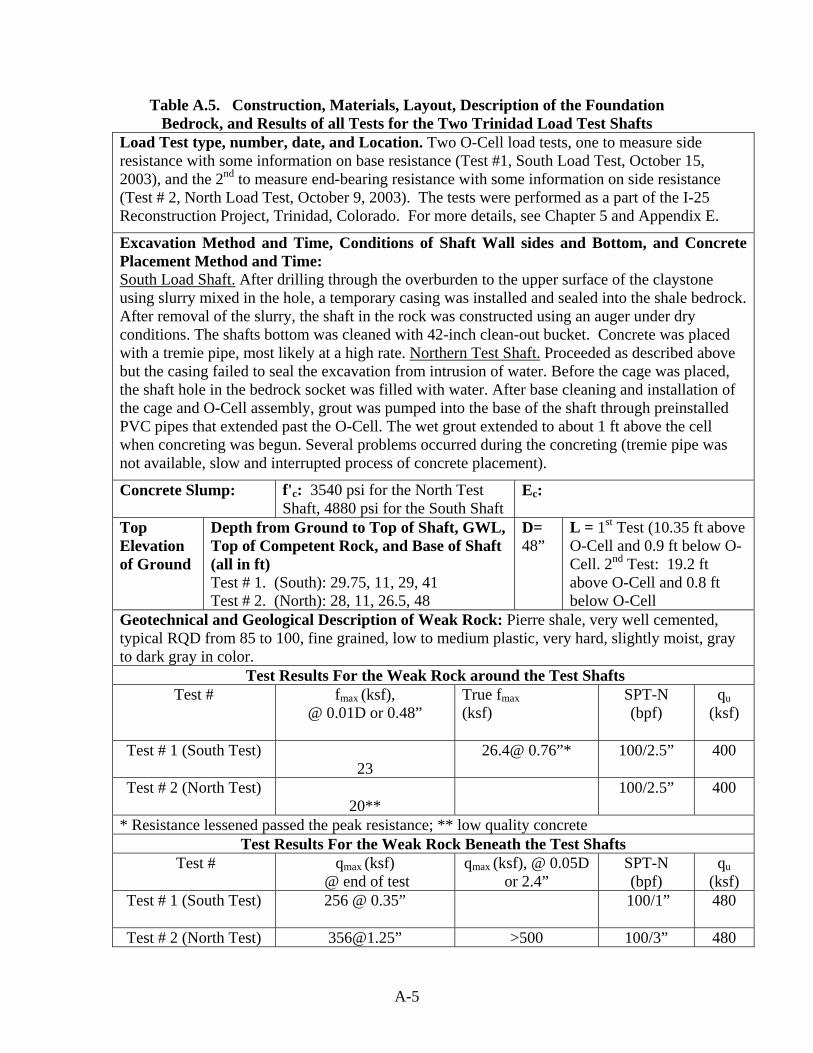
A-5
Table A.5. Construction, Materials, Layout, Description of the Foundation Bedrock, and Results of all Tests for the Two Trinidad Load Test Shafts
Load Test type, number, date, and Location. Two O-Cell load tests, one to measure side resistance with some information on base resistance (Test #1, South Load Test, October 15, 2003), and the 2nd to measure end-bearing resistance with some information on side resistance (Test # 2, North Load Test, October 9, 2003). The tests were performed as a part of the I-25 Reconstruction Project, Trinidad, Colorado. For more details, see Chapter 5 and Appendix E.
Excavation Method and Time, Conditions of Shaft Wall sides and Bottom, and Concrete Placement Method and Time: South Load Shaft. After drilling through the overburden to the upper surface of the claystone using slurry mixed in the hole, a temporary casing was installed and sealed into the shale bedrock. After removal of the slurry, the shaft in the rock was constructed using an auger under dry conditions. The shafts bottom was cleaned with 42-inch clean-out bucket. Concrete was placed with a tremie pipe, most likely at a high rate. Northern Test Shaft. Proceeded as described above but the casing failed to seal the excavation from intrusion of water. Before the cage was placed, the shaft hole in the bedrock socket was filled with water. After base cleaning and installation of the cage and O-Cell assembly, grout was pumped into the base of the shaft through preinstalled PVC pipes that extended past the O-Cell. The wet grout extended to about 1 ft above the cell when concreting was begun. Several problems occurred during the concreting (tremie pipe was not available, slow and interrupted process of concrete placement).
Concrete Slump: f'c: 3540 psi for the North Test Shaft, 4880 psi for the South Shaft
Ec:
Top Elevation of Ground
Depth from Ground to Top of Shaft, GWL, Top of Competent Rock, and Base of Shaft (all in ft) Test # 1. (South): 29.75, 11, 29, 41 Test # 2. (North): 28, 11, 26.5, 48
D= 48”
L = 1st Test (10.35 ft above O-Cell and 0.9 ft below O-Cell. 2nd Test: 19.2 ft above O-Cell and 0.8 ft below O-Cell
Geotechnical and Geological Description of Weak Rock: Pierre shale, very well cemented, typical RQD from 85 to 100, fine grained, low to medium plastic, very hard, slightly moist, gray to dark gray in color.
Test Results For the Weak Rock around the Test Shafts Test # fmax (ksf),
@ 0.01D or 0.48” True fmax (ksf)
SPT-N (bpf)
qu (ksf)
Test # 1 (South Test)
23 26.4@ 0.76”* 100/2.5” 400
Test # 2 (North Test)
20** 100/2.5” 400
* Resistance lessened passed the peak resistance; ** low quality concrete
Test Results For the Weak Rock Beneath the Test Shafts Test # qmax (ksf)
@ end of test qmax (ksf), @ 0.05D
or 2.4” SPT-N (bpf)
qu (ksf)
Test # 1 (South Test) 256 @ 0.35”
100/1” 480
Test # 2 (North Test) [email protected]” >500 100/3” 480
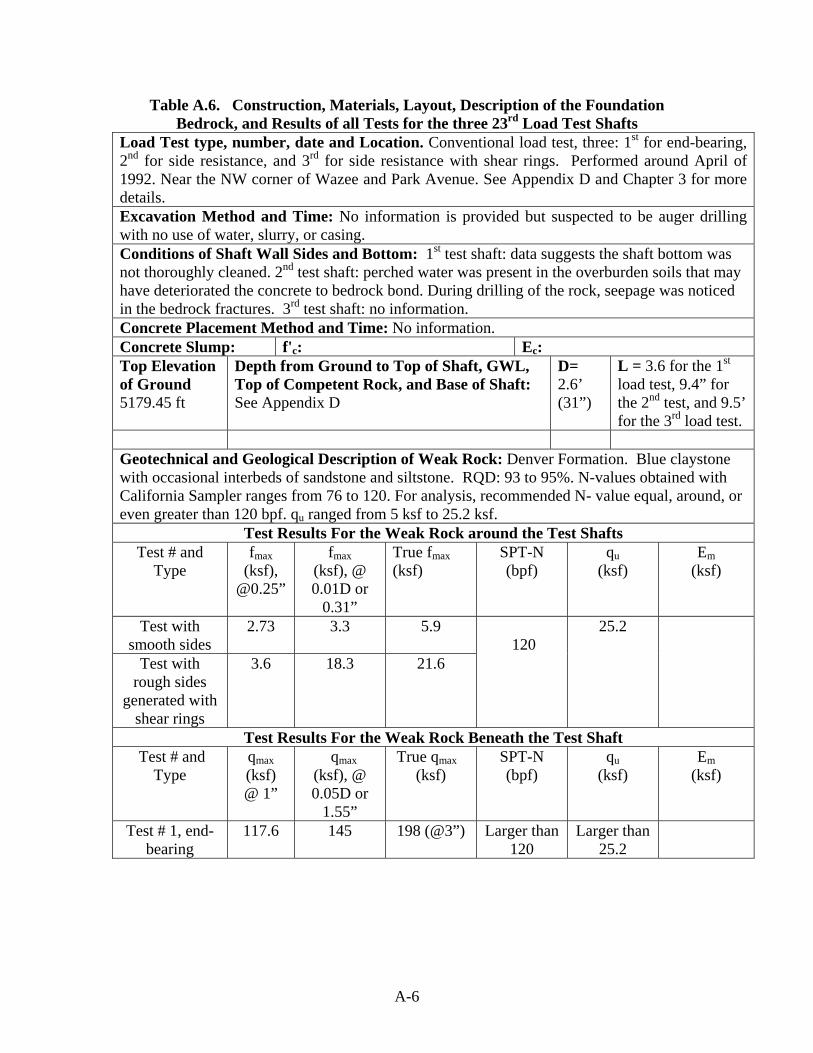
A-6
Table A.6. Construction, Materials, Layout, Description of the Foundation Bedrock, and Results of all Tests for the three 23rd Load Test Shafts
Load Test type, number, date and Location. Conventional load test, three: 1st for end-bearing, 2nd for side resistance, and 3rd for side resistance with shear rings. Performed around April of 1992. Near the NW corner of Wazee and Park Avenue. See Appendix D and Chapter 3 for more details. Excavation Method and Time: No information is provided but suspected to be auger drilling with no use of water, slurry, or casing. Conditions of Shaft Wall Sides and Bottom: 1st test shaft: data suggests the shaft bottom was not thoroughly cleaned. 2nd test shaft: perched water was present in the overburden soils that may have deteriorated the concrete to bedrock bond. During drilling of the rock, seepage was noticed in the bedrock fractures. 3rd test shaft: no information. Concrete Placement Method and Time: No information. Concrete Slump: f'c: Ec: Top Elevation of Ground 5179.45 ft
Depth from Ground to Top of Shaft, GWL, Top of Competent Rock, and Base of Shaft: See Appendix D
D= 2.6’ (31”)
L = 3.6 for the 1st load test, 9.4” for the 2nd test, and 9.5’ for the 3rd load test.
Geotechnical and Geological Description of Weak Rock: Denver Formation. Blue claystone with occasional interbeds of sandstone and siltstone. RQD: 93 to 95%. N-values obtained with California Sampler ranges from 76 to 120. For analysis, recommended N- value equal, around, or even greater than 120 bpf. qu ranged from 5 ksf to 25.2 ksf.
Test Results For the Weak Rock around the Test Shafts Test # and
Type fmax
(ksf), @0.25”
fmax (ksf), @ 0.01D or
0.31”
True fmax (ksf)
SPT-N (bpf)
qu (ksf)
Em (ksf)
Test with smooth sides
2.73 3.3 5.9
Test with rough sides
generated with shear rings
3.6 18.3 21.6
120
25.2
Test Results For the Weak Rock Beneath the Test Shaft Test # and
Type qmax (ksf) @ 1”
qmax (ksf), @ 0.05D or
1.55”
True qmax (ksf)
SPT-N (bpf)
qu (ksf)
Em (ksf)
Test # 1, end-bearing
117.6 145 198 (@3”) Larger than 120
Larger than 25.2
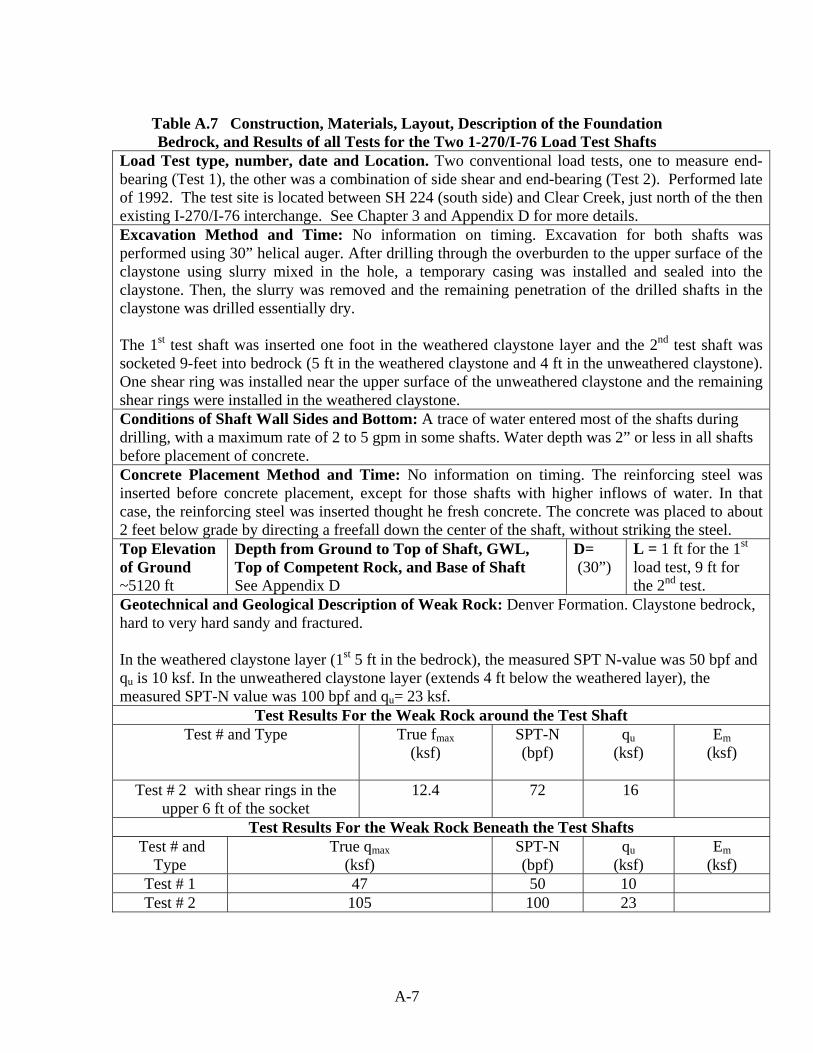
A-7
Table A.7 Construction, Materials, Layout, Description of the Foundation Bedrock, and Results of all Tests for the Two 1-270/I-76 Load Test Shafts
Load Test type, number, date and Location. Two conventional load tests, one to measure end-bearing (Test 1), the other was a combination of side shear and end-bearing (Test 2). Performed late of 1992. The test site is located between SH 224 (south side) and Clear Creek, just north of the then existing I-270/I-76 interchange. See Chapter 3 and Appendix D for more details. Excavation Method and Time: No information on timing. Excavation for both shafts was performed using 30” helical auger. After drilling through the overburden to the upper surface of the claystone using slurry mixed in the hole, a temporary casing was installed and sealed into the claystone. Then, the slurry was removed and the remaining penetration of the drilled shafts in the claystone was drilled essentially dry. The 1st test shaft was inserted one foot in the weathered claystone layer and the 2nd test shaft was socketed 9-feet into bedrock (5 ft in the weathered claystone and 4 ft in the unweathered claystone). One shear ring was installed near the upper surface of the unweathered claystone and the remaining shear rings were installed in the weathered claystone. Conditions of Shaft Wall Sides and Bottom: A trace of water entered most of the shafts during drilling, with a maximum rate of 2 to 5 gpm in some shafts. Water depth was 2” or less in all shafts before placement of concrete. Concrete Placement Method and Time: No information on timing. The reinforcing steel was inserted before concrete placement, except for those shafts with higher inflows of water. In that case, the reinforcing steel was inserted thought he fresh concrete. The concrete was placed to about 2 feet below grade by directing a freefall down the center of the shaft, without striking the steel. Top Elevation of Ground ~5120 ft
Depth from Ground to Top of Shaft, GWL, Top of Competent Rock, and Base of Shaft See Appendix D
D= (30”)
L = 1 ft for the 1st load test, 9 ft for the 2nd test.
Geotechnical and Geological Description of Weak Rock: Denver Formation. Claystone bedrock, hard to very hard sandy and fractured. In the weathered claystone layer (1st 5 ft in the bedrock), the measured SPT N-value was 50 bpf and qu is 10 ksf. In the unweathered claystone layer (extends 4 ft below the weathered layer), the measured SPT-N value was 100 bpf and qu= 23 ksf.
Test Results For the Weak Rock around the Test Shaft Test # and Type True fmax
(ksf)
SPT-N (bpf)
qu (ksf)
Em (ksf)
Test # 2 with shear rings in the upper 6 ft of the socket
12.4 72 16
Test Results For the Weak Rock Beneath the Test Shafts Test # and
Type True qmax
(ksf) SPT-N (bpf)
qu (ksf)
Em (ksf)
Test # 1 47 50 10 Test # 2 105 100 23
B-1
APPENDIX B: SAMPLE GUIDE SPECIFICATIONS FOR OSTERBERG CELL LOAD TESTING OF DRILLED SHAFTS (Prepared by LOADTEST, Inc) 1.0 Description This work shall consist of furnishing all materials and labor necessary for conducting an Osterberg Cell (O-cell) Load Test and reporting the results. The Contractor will be required to supply material and labor as hereinafter specified and including prior to, during and after the load test. The drilled shaft used for the load test program will be instrumented by LOADTEST, Inc. (the Osterberg Cell supplier) or others, as approved by the Engineer. The Osterberg cell load test will be conducted by LOADTEST, Inc. or others, as approved by the Engineer, with the Contractor providing auxiliary equipment and services as detailed herein. The O-cell load test is a non-destructive test and is suitable for both dedicated test shafts and production test shafts. If the test shaft is constructed at a production shaft location (intended to carry structural service loads) it shall be left in a condition suitable for use as a production shaft in the finished structure. 2.0 Materials The Contractor shall supply all materials required to install the Osterberg cell, conduct the load test, and remove the load test apparatus as required. Osterberg Cell - The Contractor shall furnish one (1) or more Osterberg Cells as required for each load test, to be supplied by:
LOADTEST International, Inc. World Headquarters 2631- D NW 41st Street Gainesville, FL 32606 Phone (800) 368-1138 or
(352) 378-3717 Fax (352) 378-3934
The Osterberg cell(s) to be provided shall have a capacity of at least ____ kips in each direction and shall be equipped with all necessary hydraulic lines, fittings, pressure source, pressure gage and telltale devices. Required materials include, but are not limited to the following:
1. Fresh, clean water from an approved source to be mixed with a water-soluble oil provided by
LOADTEST, Inc., to form the hydraulic fluid used to pressurize the Osterberg Cell.
B-2
2. Materials sufficient to construct a stable reference beam system for monitoring movements of the shaft during testing. The system shall be supported at a minimum distance of 3 shaft diameters from the center of the test shaft to minimize disturbance of the reference system. A good quality, self-leveling surveyors level shall be provided to monitor the reference system.
3. Materials sufficient to construct a protected work area (including provisions such as a tent or
shed for protection from inclement weather for the load test equipment and personnel) of size and type required by the Engineer and LOADTEST, Inc. In the case of cold weather, the protected work area shall be maintained at a temperature above 40° F in order to insure proper operation of the load testing equipment.
4. Stable electric power source, as required for lights, welding, instruments, etc. 5. Materials for carrier frame, steel bearing plates and/or other devices needed to attach O-cell to
rebar cage, as required.
Materials supplied, which do not become a part of the finished structure become the responsibility of the Contractor at the conclusion of the load test and shall be removed from the job site. 3.0 Equipment The Contractor shall supply equipment required to install the Osterberg cell, conduct the load test, and remove the load test apparatus as required. Required equipment includes but is not limited to:
1. Welding equipment, certified welding personnel and labor, as required, to assemble the test equipment under the supervision of LOADTEST, Inc. personnel, attach instrumentation to the Osterberg cell(s), and prepare the work area.
2. Equipment and labor to construct the steel reinforcing cage and/or placement frame including
any steel bearing plates required for the test shaft.
3. Equipment and operators for handling the Osterberg cell, instrumentation and placement frame or steel reinforcing cage during the installation of the Osterberg cell and during the conduct of the test, including but not limited to a crane or other lifting device, manual labor, and hand tools as required by LOADTEST, Inc. and the Engineer.
4. Equipment and labor sufficient to erect the protected work area and reference beam system, to
be constructed to the requirements of the Engineer and LOADTEST, Inc.
5. Air compressor (minimum 185 cfm, 100 psi) for pump operation during the load test.
B-3
4.0 Procedure For the drilled shaft(s) selected for testing by the Engineer, the Contractor shall construct the drilled shaft using the approved shaft installation techniques until the drilled shaft excavation has been completed. This includes both dry and wet (slurry) methods. The Osterberg Cell, hydraulic supply lines and other instruments will be assembled and made ready for installation under the direction of LOADTEST, Inc. and the Engineer, in a suitable area, adjacent to the test shaft, to be provided by the Contractor. When a steel reinforcing cage is required for the shaft, the Osterberg Cell assembly shall be welded to the bottom of the cage in conjunction with the construction of the cage. The plane of the bottom plate(s) of the O-cell(s) shall be set at right angles to the long axis of the cage. The Contractor shall use the utmost care in handling the test assembly so as not to damage the instrumentation during installation. The contractor shall limit the deflection of the cage to two (2) feet between pick points while lifting the cage from the horizontal position to vertical. The maximum spacing between pick points shall be 25 feet. The contractor shall provide support bracing, strong backs, etc. to maintain the deflection within the specified tolerance. The O-cell assembly must remain perpendicular to the long axis of the reinforcing cage throughout the lifting and installation process. When the test shaft excavation has been completed, inspected and accepted by the Engineer, the O-cell assembly and the reinforcing steel may be installed. A seating layer of concrete or grout shall be placed by an approved method, in the base of the shaft to provide a level base and reaction for the O-cell. The preferred method is to install the O-cell assembly and deliver the seating layer using a pump line or tremmie pipe extending through the O-cell assembly to the base of the shaft. Depending on the configuration of the test assembly, it may be necessary to deliver the seating layer of concrete prior to installing the O-cell. In this case, the O-cell
assembly shall be installed while the concrete or grout at the base is still fluid, under the direction of LOADTEST, Inc. and the Engineer. The Osterberg Cell should end up at least partially submerged and firmly seated into the base grout or concrete After seating the Osterberg cell, the remainder of the drilled shaft shall be concreted in a manner similar to that specified for production shafts. However, if approved by the Engineer, the Contractor may use high early strength cement (Type III) in the mix to reduce the time between concreting and testing. At least four (4) concrete test cylinders, in addition to those specified elsewhere, shall be made from the concrete used in the test shaft, to be tested at the direction of LOADTEST, Inc. At least one of these test cylinders shall be tested prior to the load test and at least two cylinders shall be tested on the day of the load test. During the load test, no casings may be vibrated into place in the foundation area near the load test. Drilling may not continue within a 100-foot radius of the test shaft. If test apparatus shows any interference due to construction activities outside of this perimeter, such activities shall cease immediately. After the completion of the load test, and at the direction of the Engineer, the Contractor shall
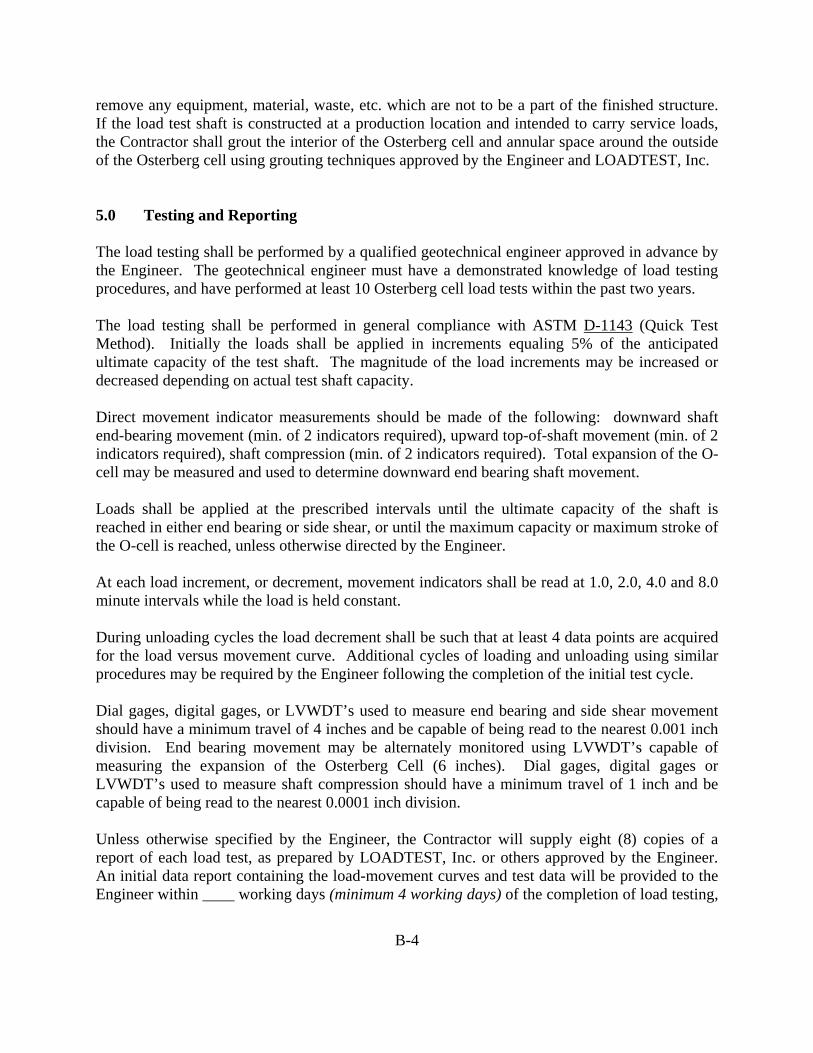
B-4
remove any equipment, material, waste, etc. which are not to be a part of the finished structure. If the load test shaft is constructed at a production location and intended to carry service loads, the Contractor shall grout the interior of the Osterberg cell and annular space around the outside of the Osterberg cell using grouting techniques approved by the Engineer and LOADTEST, Inc. 5.0 Testing and Reporting The load testing shall be performed by a qualified geotechnical engineer approved in advance by the Engineer. The geotechnical engineer must have a demonstrated knowledge of load testing procedures, and have performed at least 10 Osterberg cell load tests within the past two years.
The load testing shall be performed in general compliance with ASTM D-1143 (Quick Test Method). Initially the loads shall be applied in increments equaling 5% of the anticipated ultimate capacity of the test shaft. The magnitude of the load increments may be increased or decreased depending on actual test shaft capacity.
Direct movement indicator measurements should be made of the following: downward shaft end-bearing movement (min. of 2 indicators required), upward top-of-shaft movement (min. of 2 indicators required), shaft compression (min. of 2 indicators required). Total expansion of the O-cell may be measured and used to determine downward end bearing shaft movement.
Loads shall be applied at the prescribed intervals until the ultimate capacity of the shaft is reached in either end bearing or side shear, or until the maximum capacity or maximum stroke of the O-cell is reached, unless otherwise directed by the Engineer.
At each load increment, or decrement, movement indicators shall be read at 1.0, 2.0, 4.0 and 8.0 minute intervals while the load is held constant.
During unloading cycles the load decrement shall be such that at least 4 data points are acquired for the load versus movement curve. Additional cycles of loading and unloading using similar procedures may be required by the Engineer following the completion of the initial test cycle.
Dial gages, digital gages, or LVWDT’s used to measure end bearing and side shear movement should have a minimum travel of 4 inches and be capable of being read to the nearest 0.001 inch division. End bearing movement may be alternately monitored using LVWDT’s capable of measuring the expansion of the Osterberg Cell (6 inches). Dial gages, digital gages or LVWDT’s used to measure shaft compression should have a minimum travel of 1 inch and be capable of being read to the nearest 0.0001 inch division.
Unless otherwise specified by the Engineer, the Contractor will supply eight (8) copies of a report of each load test, as prepared by LOADTEST, Inc. or others approved by the Engineer. An initial data report containing the load-movement curves and test data will be provided to the Engineer within ____ working days (minimum 4 working days) of the completion of load testing,
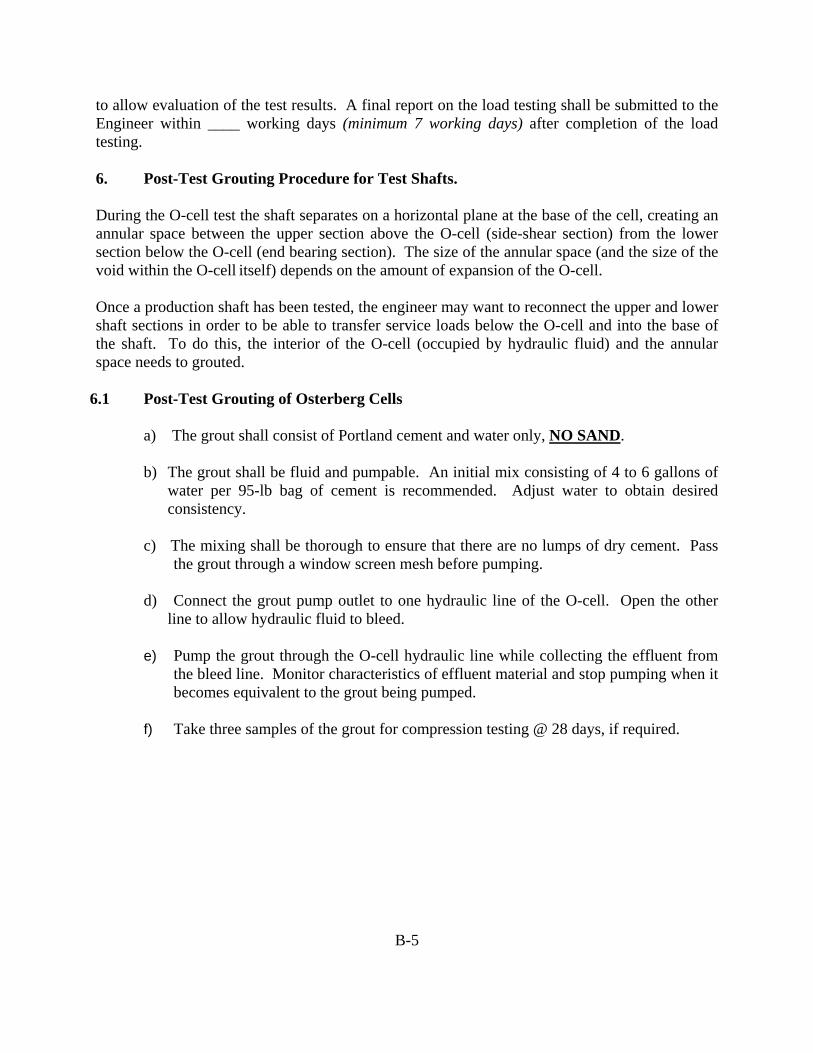
B-5
to allow evaluation of the test results. A final report on the load testing shall be submitted to the Engineer within ____ working days (minimum 7 working days) after completion of the load testing. 6. Post-Test Grouting Procedure for Test Shafts.
During the O-cell test the shaft separates on a horizontal plane at the base of the cell, creating an annular space between the upper section above the O-cell (side-shear section) from the lower section below the O-cell (end bearing section). The size of the annular space (and the size of the void within the O-cell itself) depends on the amount of expansion of the O-cell.
Once a production shaft has been tested, the engineer may want to reconnect the upper and lower shaft sections in order to be able to transfer service loads below the O-cell and into the base of the shaft. To do this, the interior of the O-cell (occupied by hydraulic fluid) and the annular space needs to grouted.
6.1 Post-Test Grouting of Osterberg Cells
a) The grout shall consist of Portland cement and water only, NO SAND.
b) The grout shall be fluid and pumpable. An initial mix consisting of 4 to 6 gallons of water per 95-lb bag of cement is recommended. Adjust water to obtain desired consistency.
c) The mixing shall be thorough to ensure that there are no lumps of dry cement. Pass
the grout through a window screen mesh before pumping.
d) Connect the grout pump outlet to one hydraulic line of the O-cell. Open the other line to allow hydraulic fluid to bleed.
e) Pump the grout through the O-cell hydraulic line while collecting the effluent from
the bleed line. Monitor characteristics of effluent material and stop pumping when it becomes equivalent to the grout being pumped.
f) Take three samples of the grout for compression testing @ 28 days, if required.
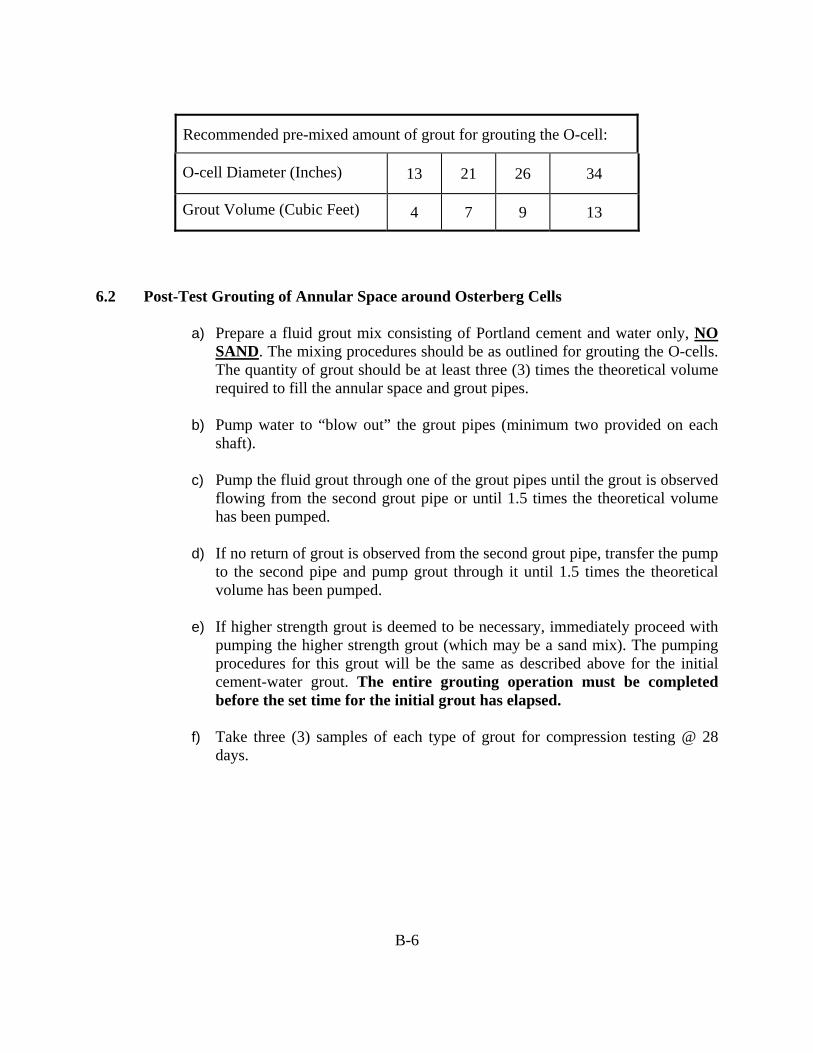
B-6
Recommended pre-mixed amount of grout for grouting the O-cell: O-cell Diameter (Inches) 13 21 26 34
Grout Volume (Cubic Feet) 4 7 9 13
6.2 Post-Test Grouting of Annular Space around Osterberg Cells
a) Prepare a fluid grout mix consisting of Portland cement and water only, NO
SAND. The mixing procedures should be as outlined for grouting the O-cells. The quantity of grout should be at least three (3) times the theoretical volume required to fill the annular space and grout pipes.
b) Pump water to “blow out” the grout pipes (minimum two provided on each
shaft). c) Pump the fluid grout through one of the grout pipes until the grout is observed
flowing from the second grout pipe or until 1.5 times the theoretical volume has been pumped.
d) If no return of grout is observed from the second grout pipe, transfer the pump
to the second pipe and pump grout through it until 1.5 times the theoretical volume has been pumped.
e) If higher strength grout is deemed to be necessary, immediately proceed with
pumping the higher strength grout (which may be a sand mix). The pumping procedures for this grout will be the same as described above for the initial cement-water grout. The entire grouting operation must be completed before the set time for the initial grout has elapsed.
f) Take three (3) samples of each type of grout for compression testing @ 28
days.
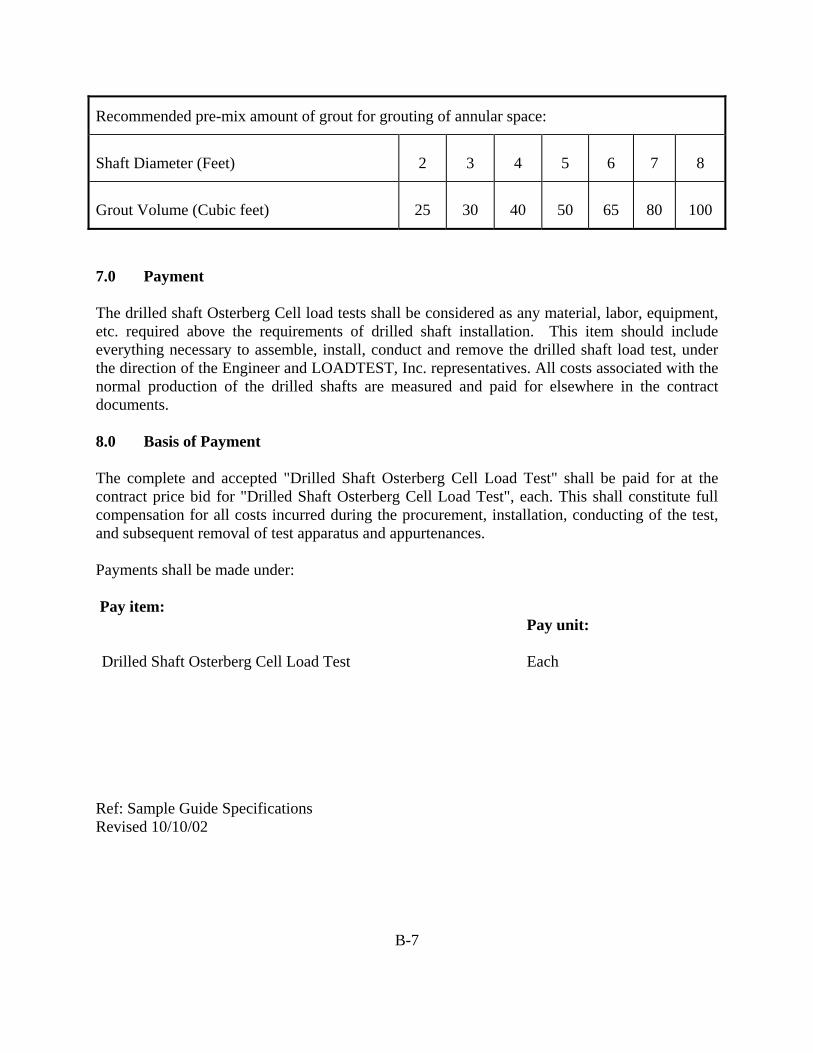
B-7
Recommended pre-mix amount of grout for grouting of annular space: Shaft Diameter (Feet)
2
3
4
5
6
7
8
Grout Volume (Cubic feet)
25
30
40
50
65
80
100
7.0 Payment The drilled shaft Osterberg Cell load tests shall be considered as any material, labor, equipment, etc. required above the requirements of drilled shaft installation. This item should include everything necessary to assemble, install, conduct and remove the drilled shaft load test, under the direction of the Engineer and LOADTEST, Inc. representatives. All costs associated with the normal production of the drilled shafts are measured and paid for elsewhere in the contract documents. 8.0 Basis of Payment The complete and accepted "Drilled Shaft Osterberg Cell Load Test" shall be paid for at the contract price bid for "Drilled Shaft Osterberg Cell Load Test", each. This shall constitute full compensation for all costs incurred during the procurement, installation, conducting of the test, and subsequent removal of test apparatus and appurtenances. Payments shall be made under: Pay item:
Pay unit:
Drilled Shaft Osterberg Cell Load Test Each Ref: Sample Guide Specifications Revised 10/10/02
C-1
APPENDIX C: REVISIONS OF SECTION 503, OSTERBERG CELL LOAD
TEST (from Broadway’s Construction Plans and Specifications Project)
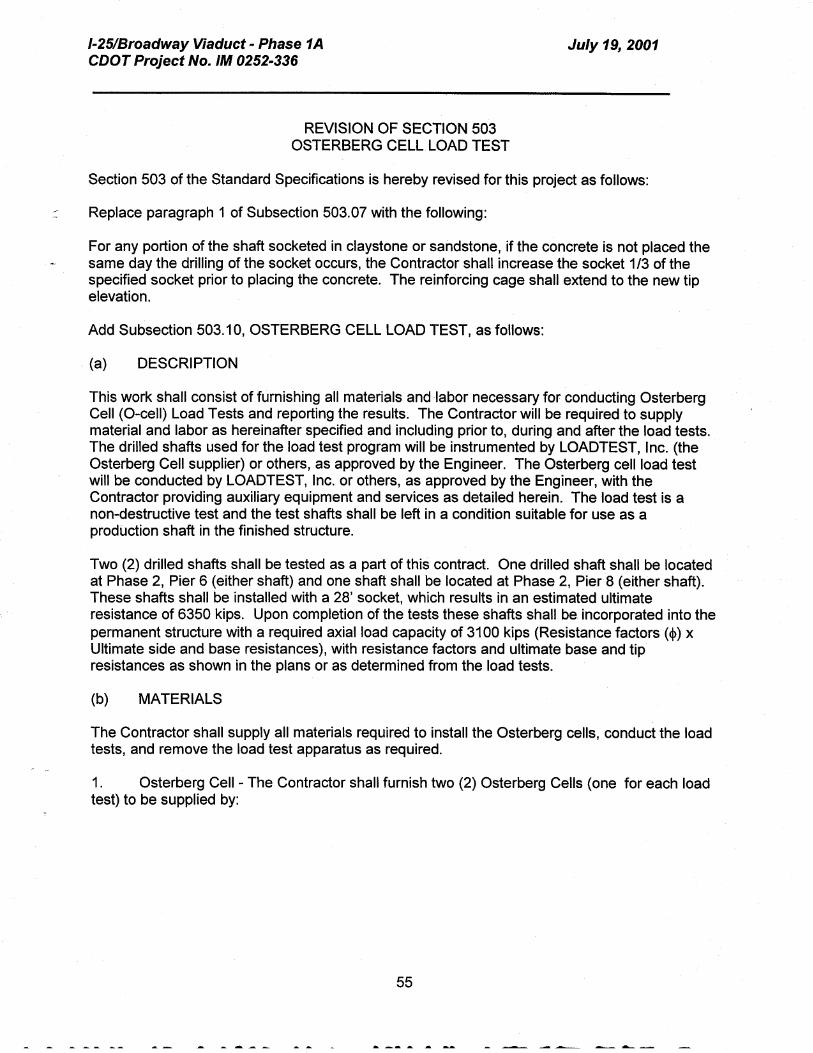
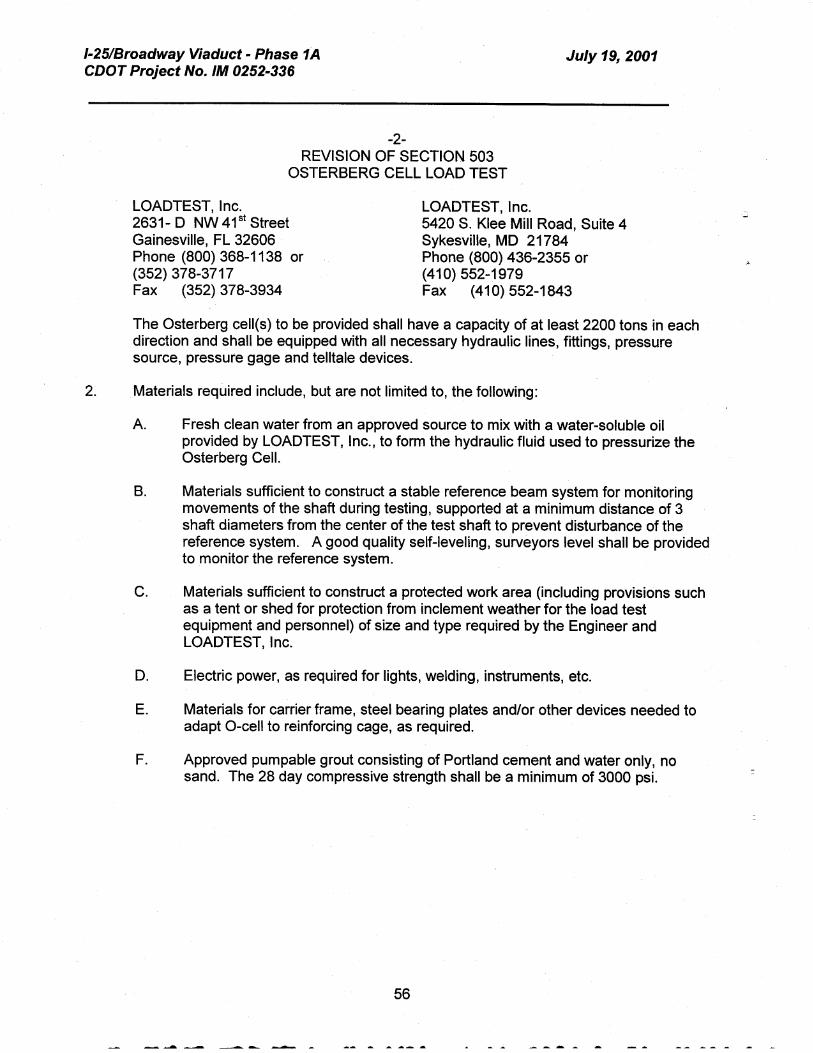
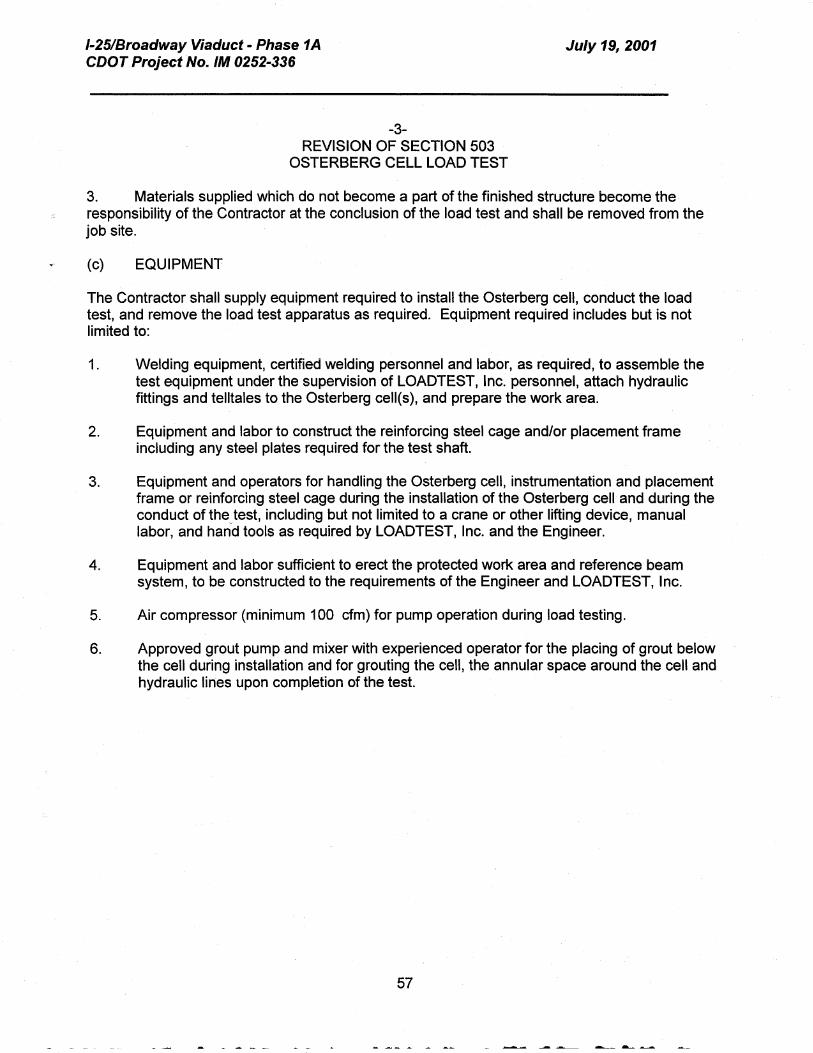
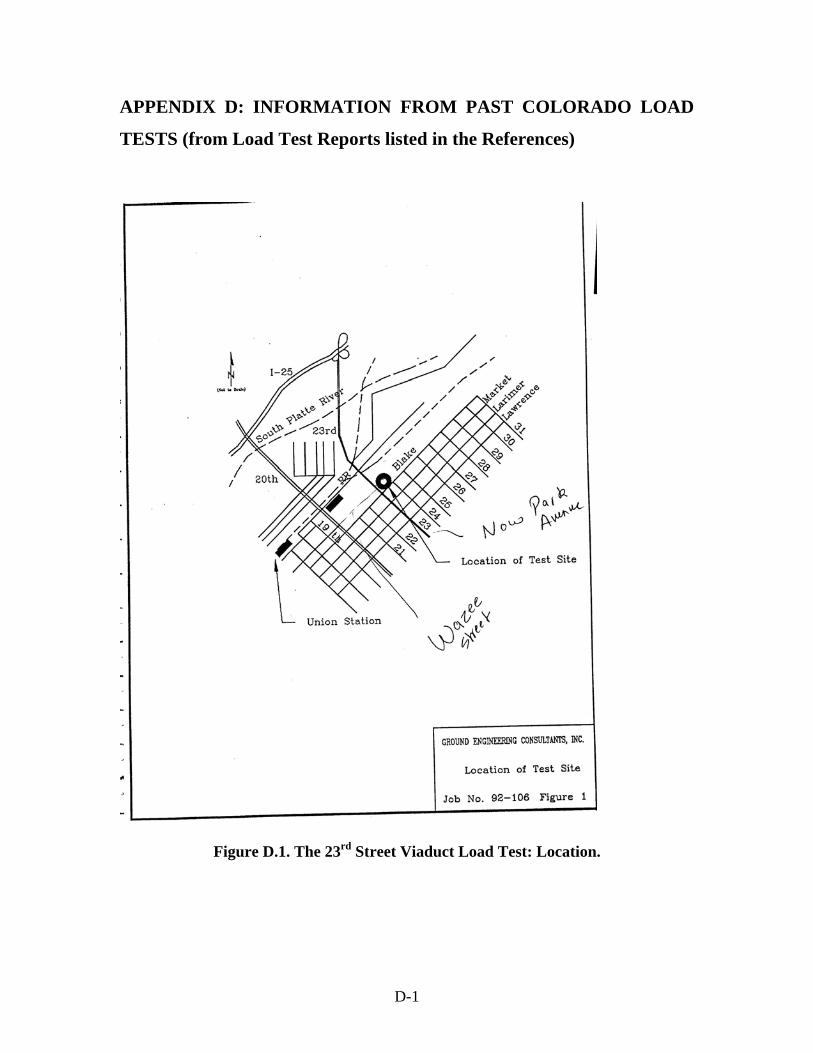
D-1
APPENDIX D: INFORMATION FROM PAST COLORADO LOAD
TESTS (from Load Test Reports listed in the References)
Figure D.1. The 23rd Street Viaduct Load Test: Location.
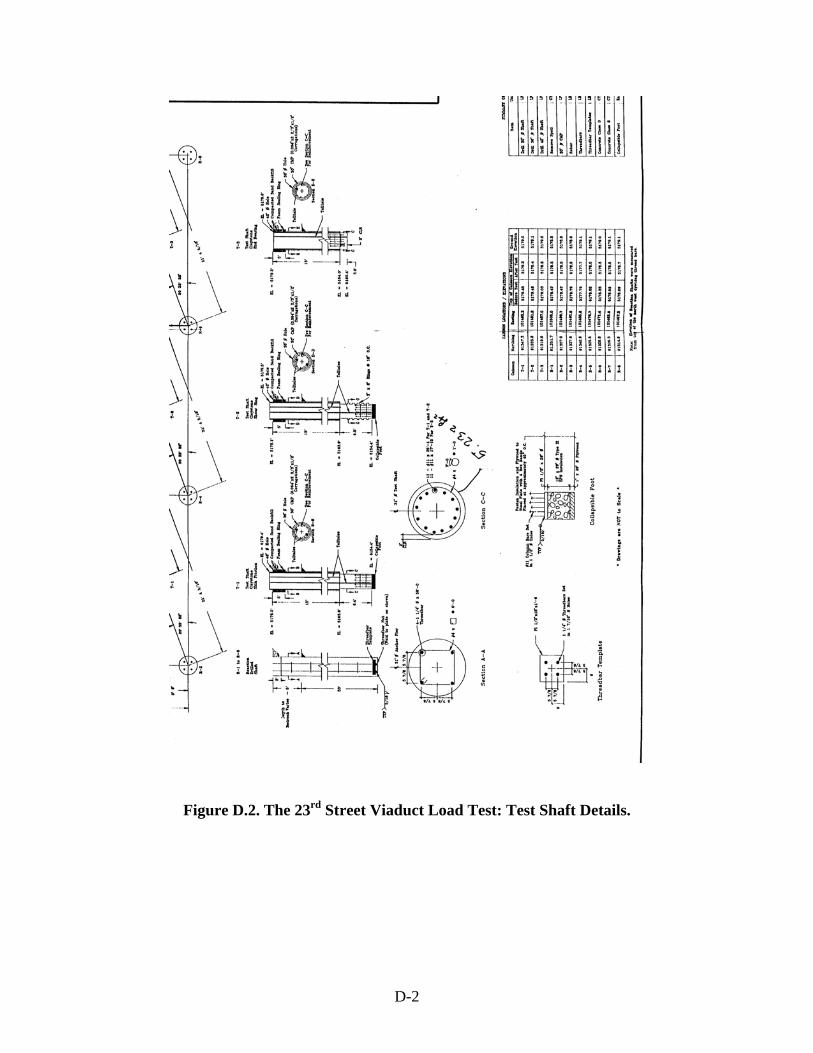
D-2
Figure D.2. The 23rd Street Viaduct Load Test: Test Shaft Details.
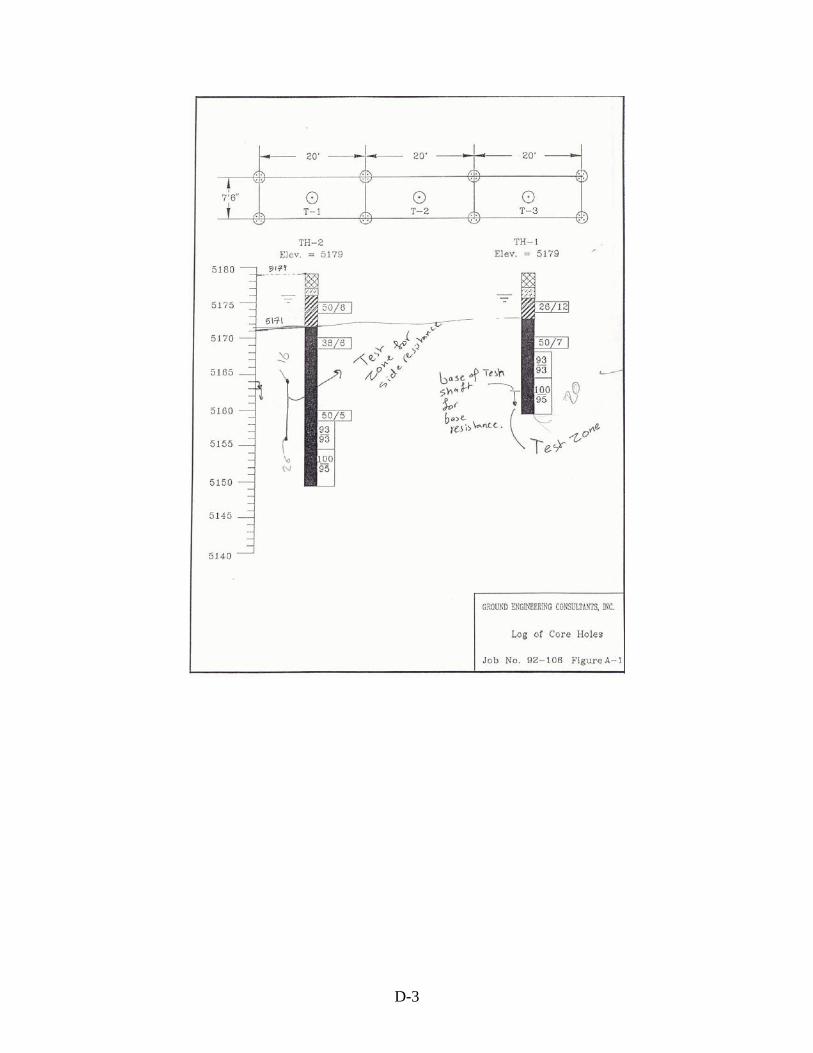
D-3
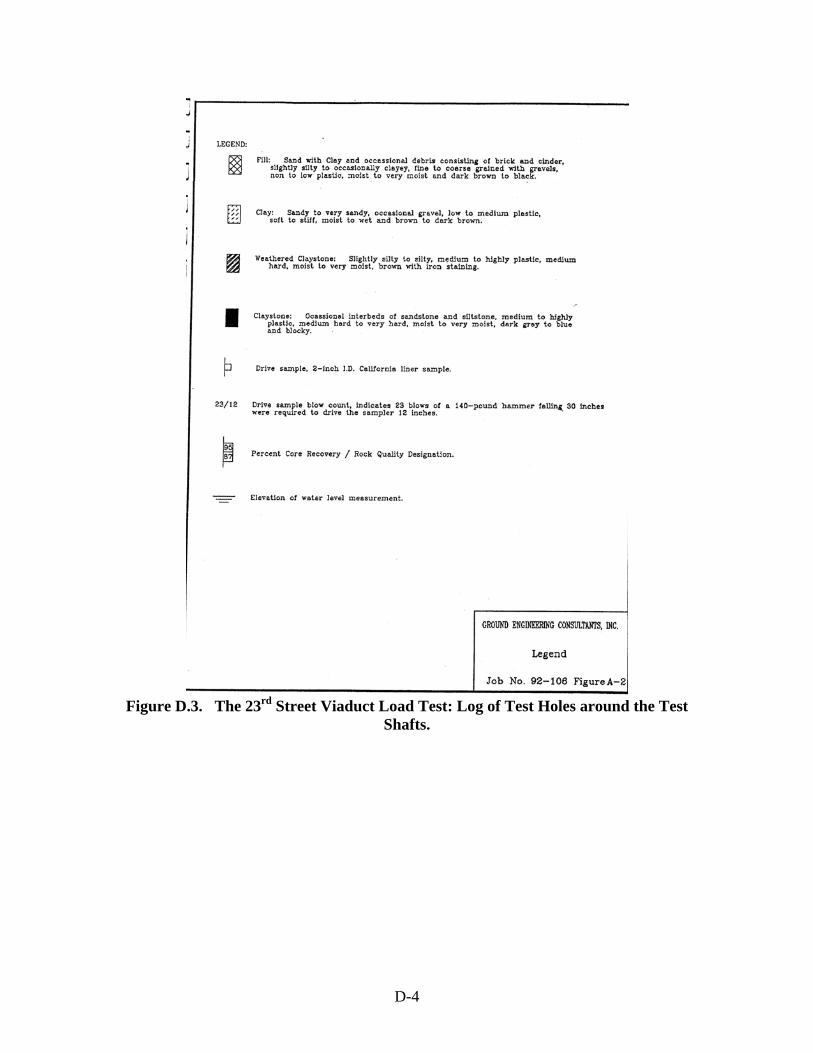
D-4
Figure D.3. The 23rd Street Viaduct Load Test: Log of Test Holes around the Test
Shafts.
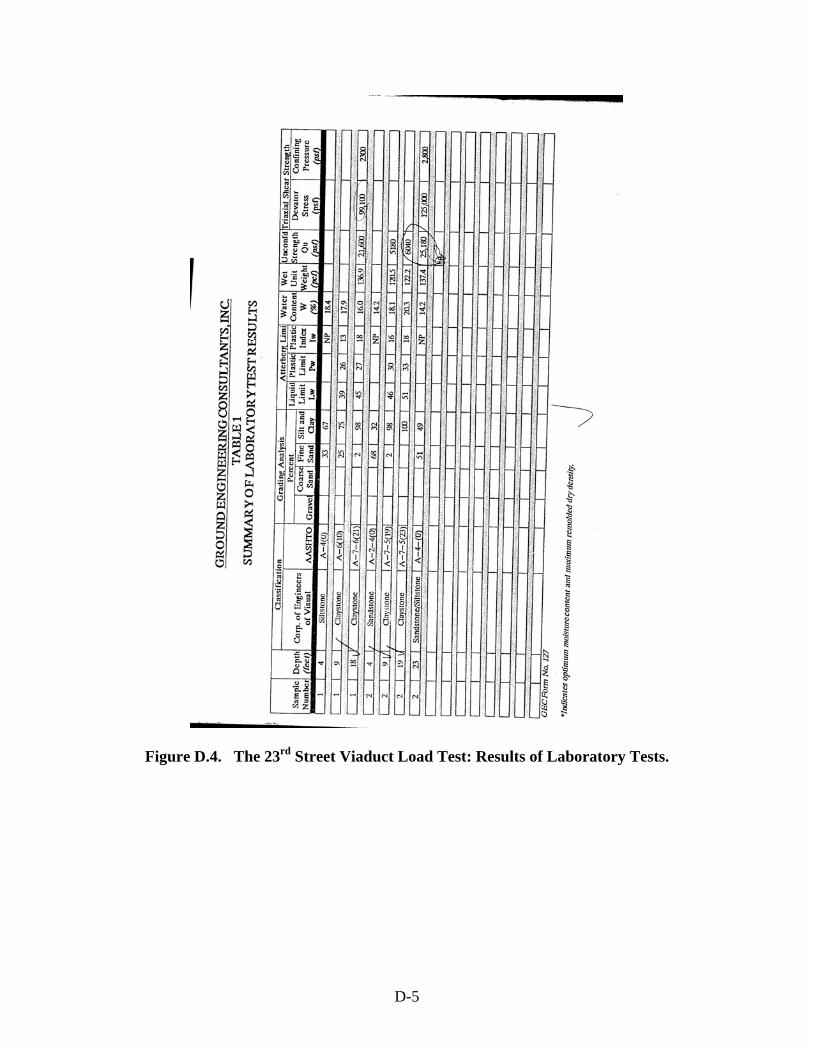
D-5
Figure D.4. The 23rd Street Viaduct Load Test: Results of Laboratory Tests.
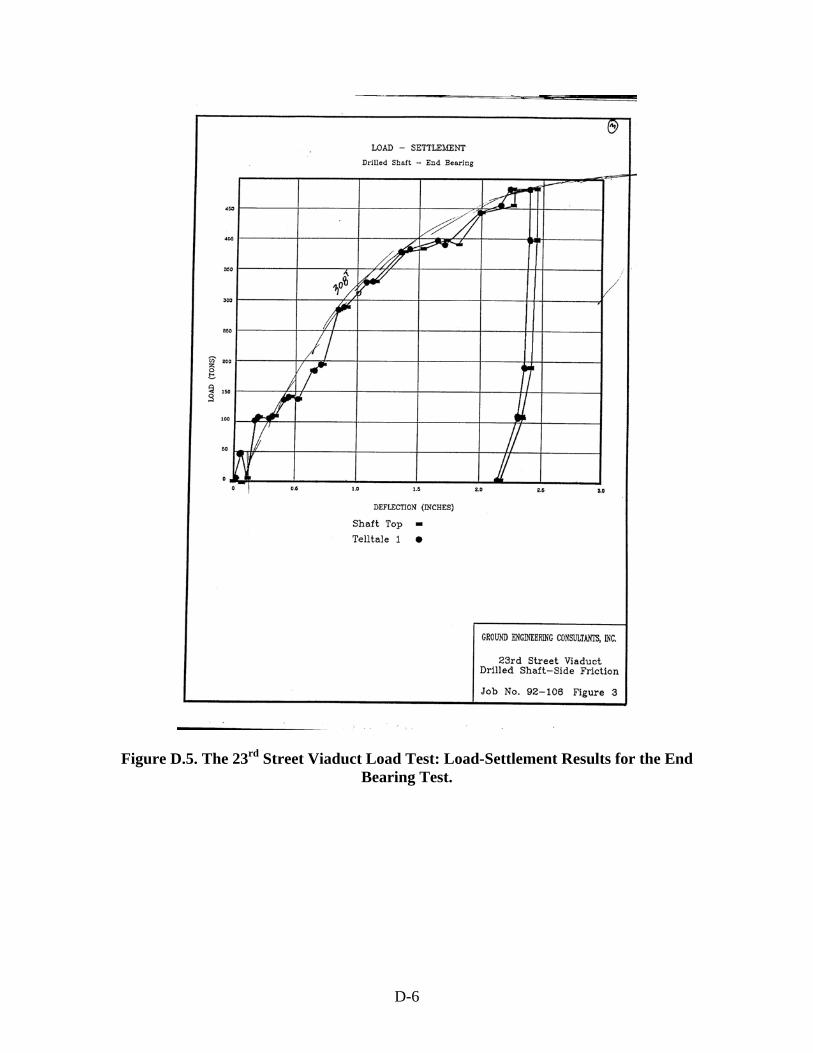
D-6
Figure D.5. The 23rd Street Viaduct Load Test: Load-Settlement Results for the End
Bearing Test.
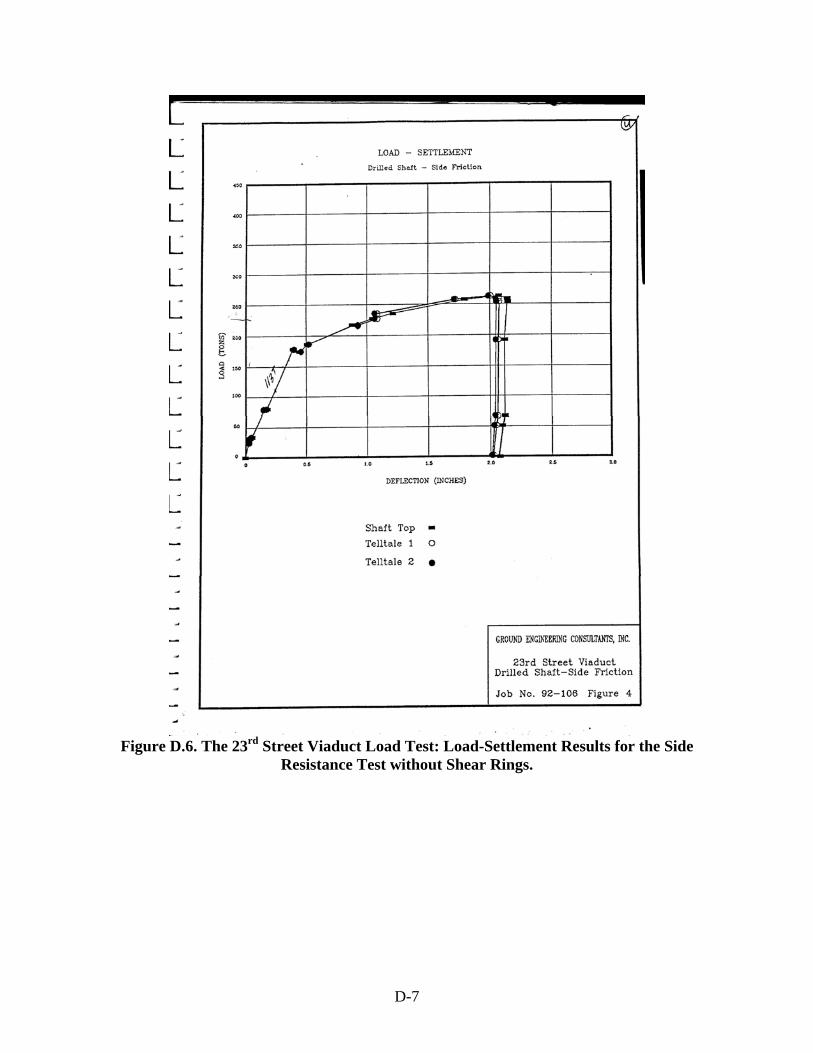
D-7
Figure D.6. The 23rd Street Viaduct Load Test: Load-Settlement Results for the Side
Resistance Test without Shear Rings.
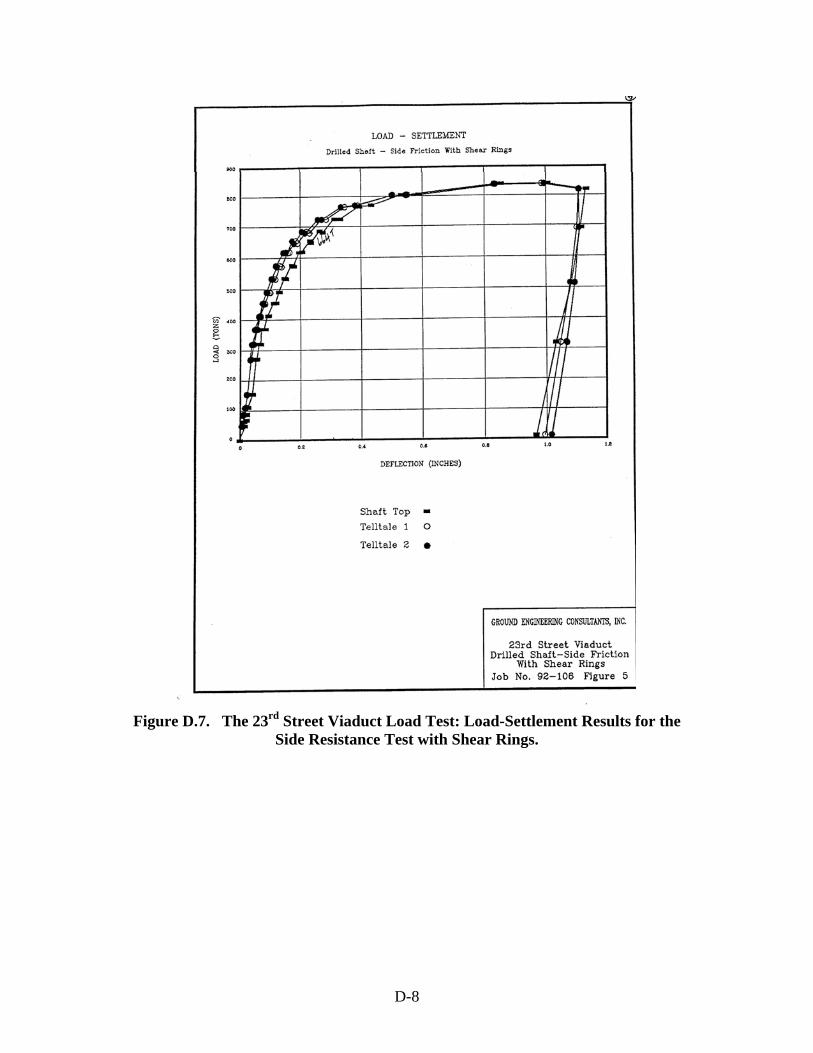
D-8
Figure D.7. The 23rd Street Viaduct Load Test: Load-Settlement Results for the
Side Resistance Test with Shear Rings.
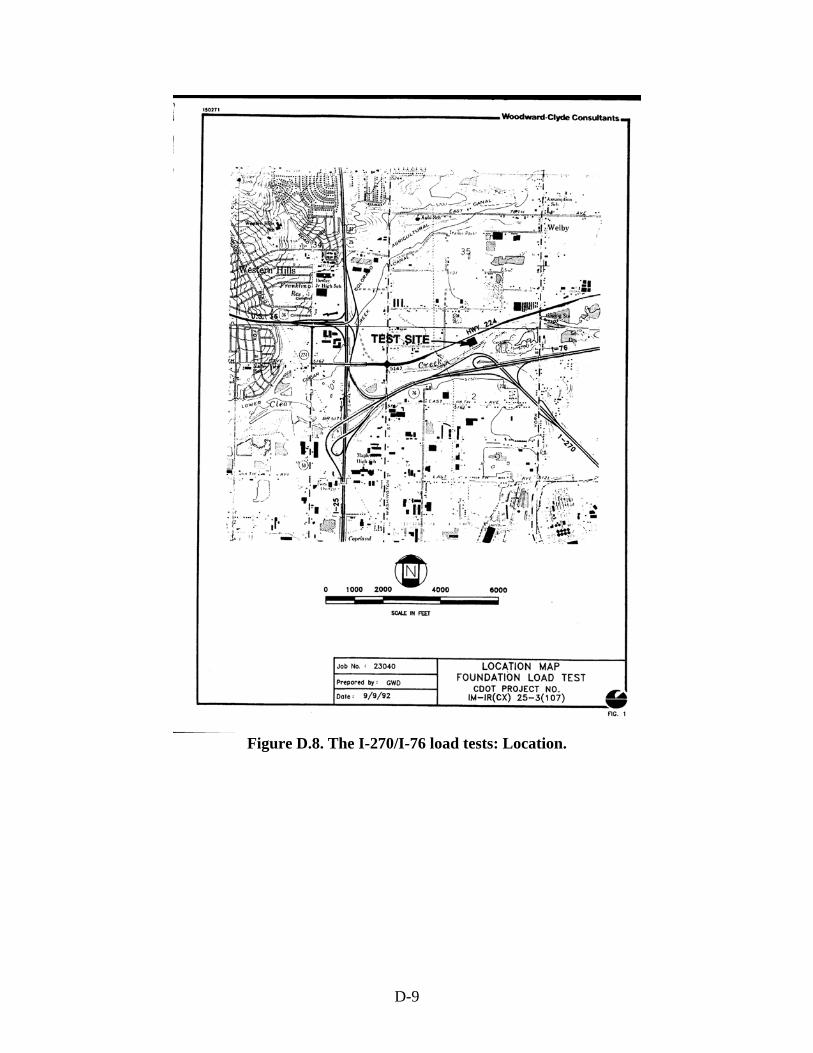
D-9
Figure D.8. The I-270/I-76 load tests: Location.
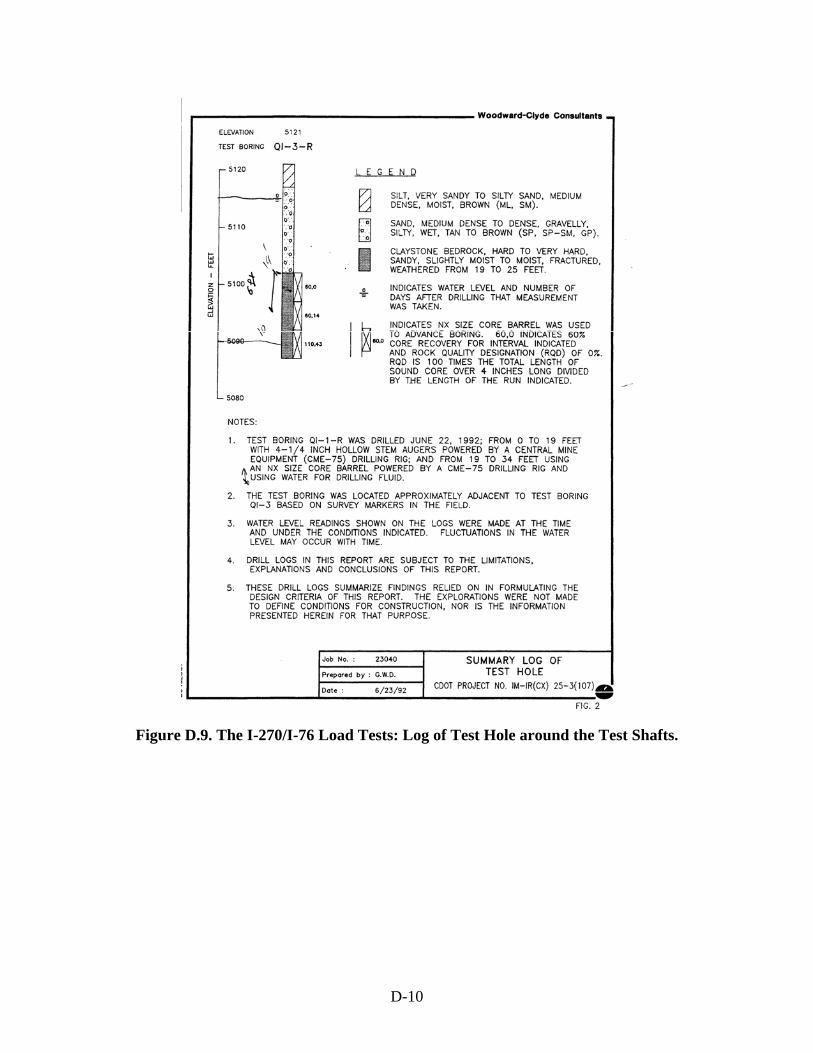
D-10
Figure D.9. The I-270/I-76 Load Tests: Log of Test Hole around the Test Shafts.
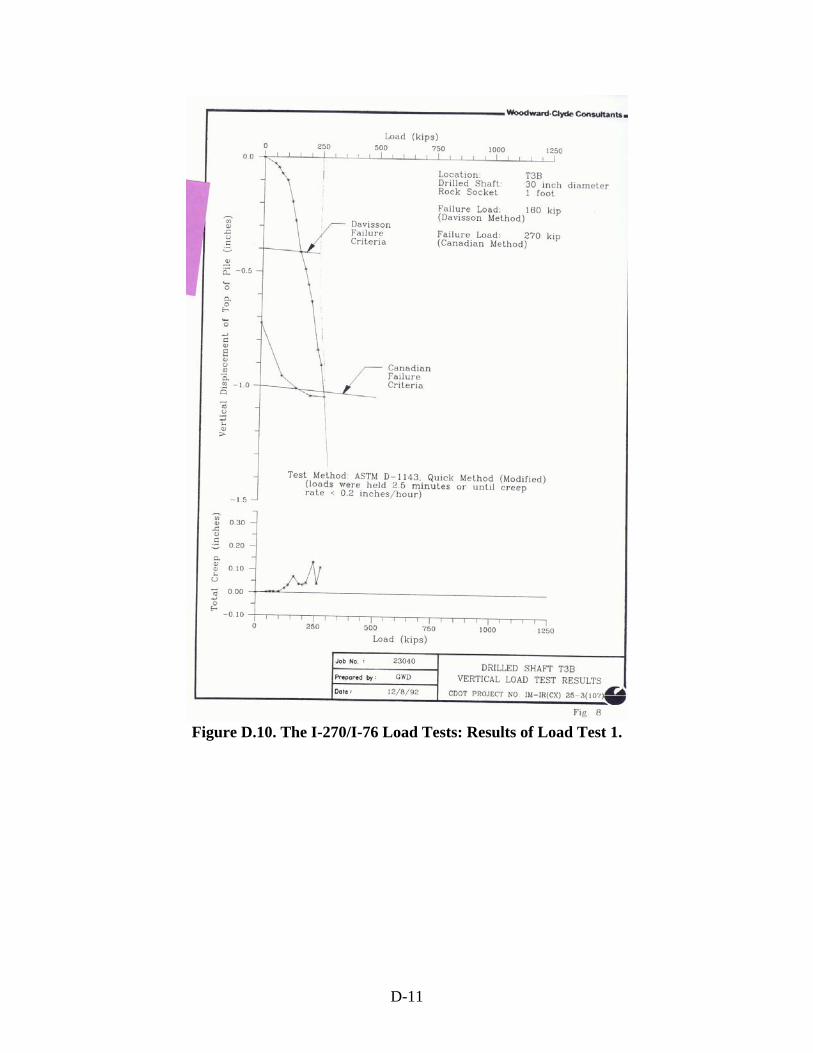
D-11
Figure D.10. The I-270/I-76 Load Tests: Results of Load Test 1.
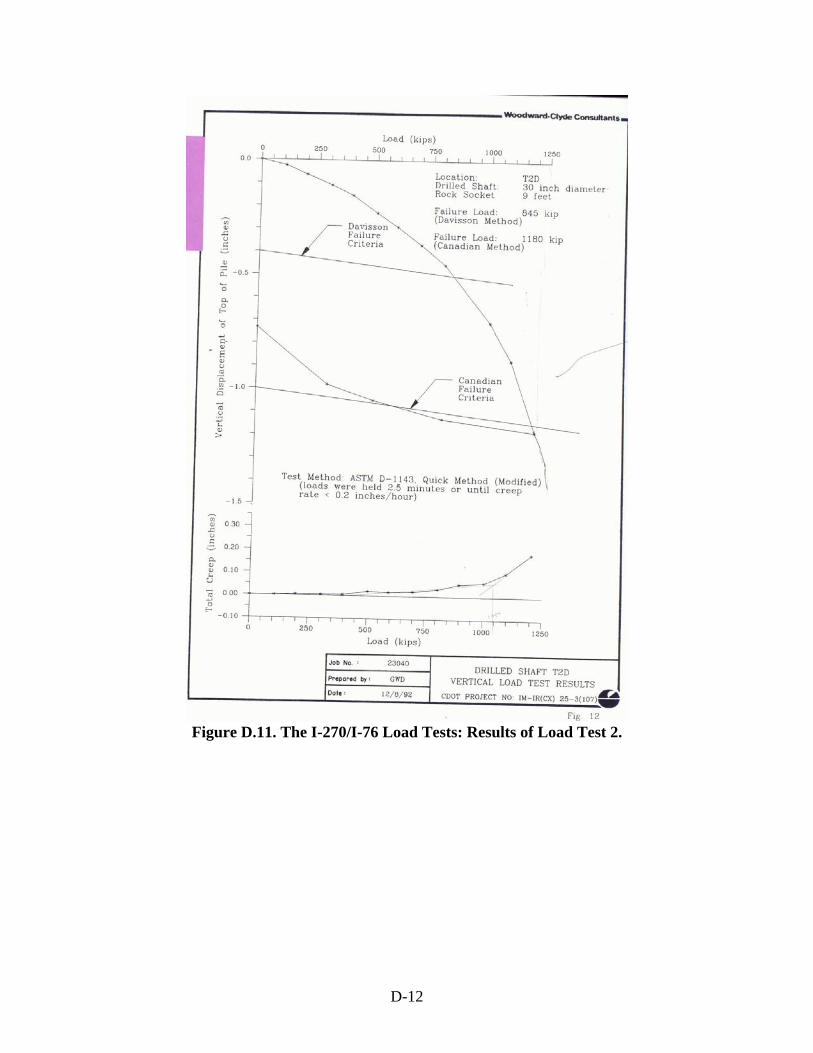
D-12
Figure D.11. The I-270/I-76 Load Tests: Results of Load Test 2.
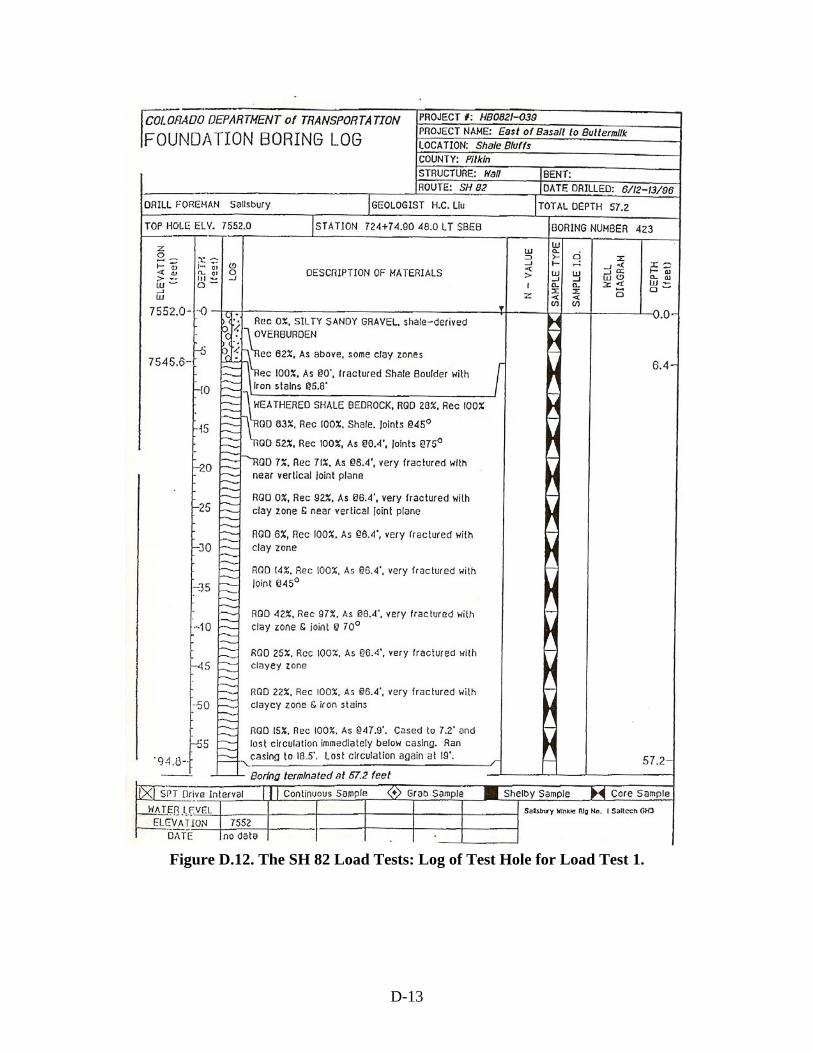
D-13
Figure D.12. The SH 82 Load Tests: Log of Test Hole for Load Test 1.
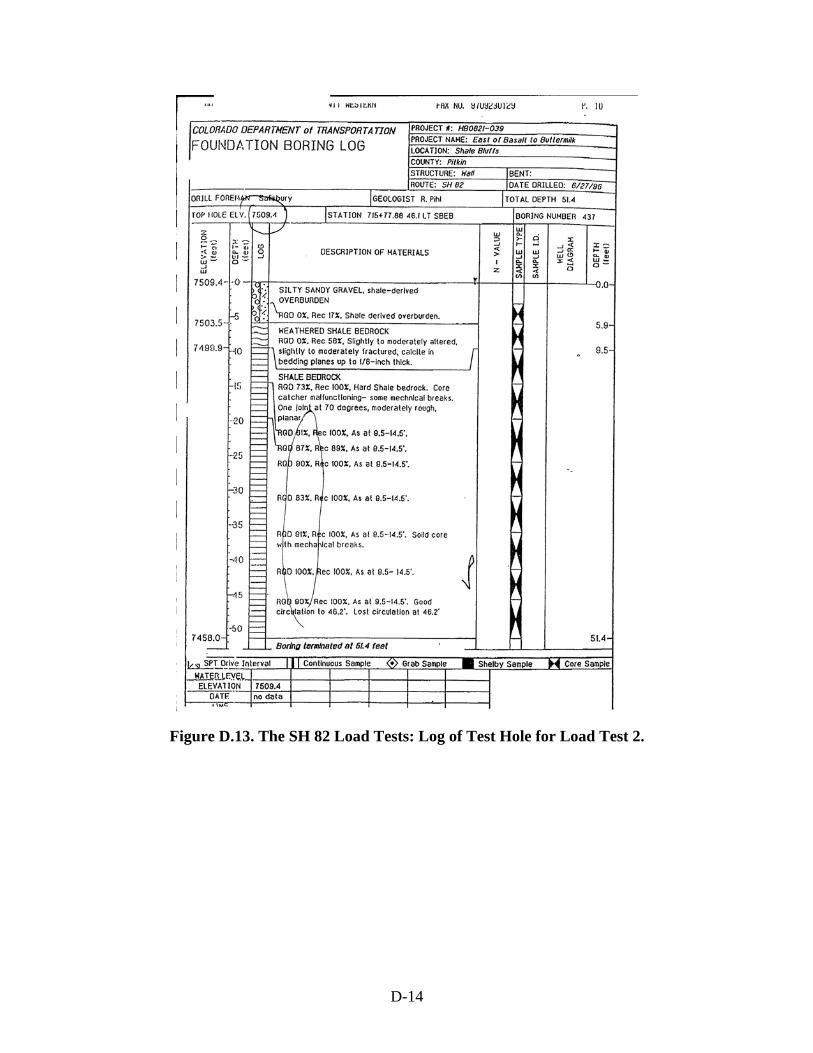
D-14
Figure D.13. The SH 82 Load Tests: Log of Test Hole for Load Test 2.
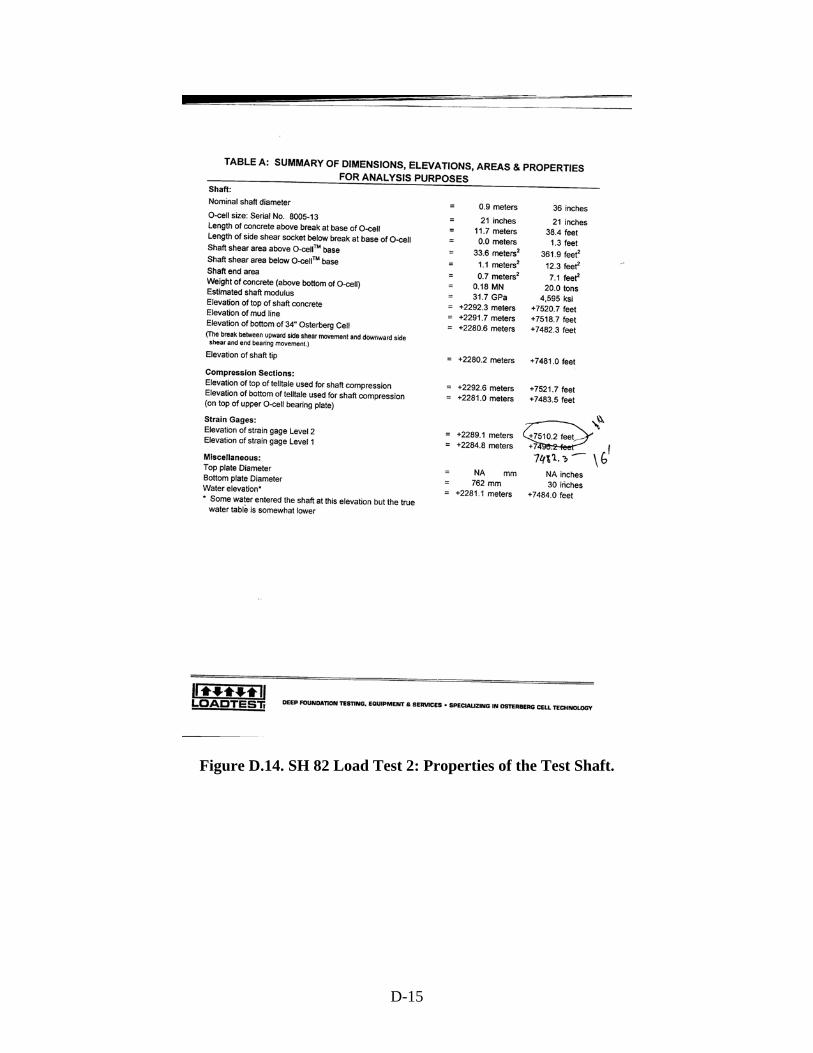
D-15
Figure D.14. SH 82 Load Test 2: Properties of the Test Shaft.
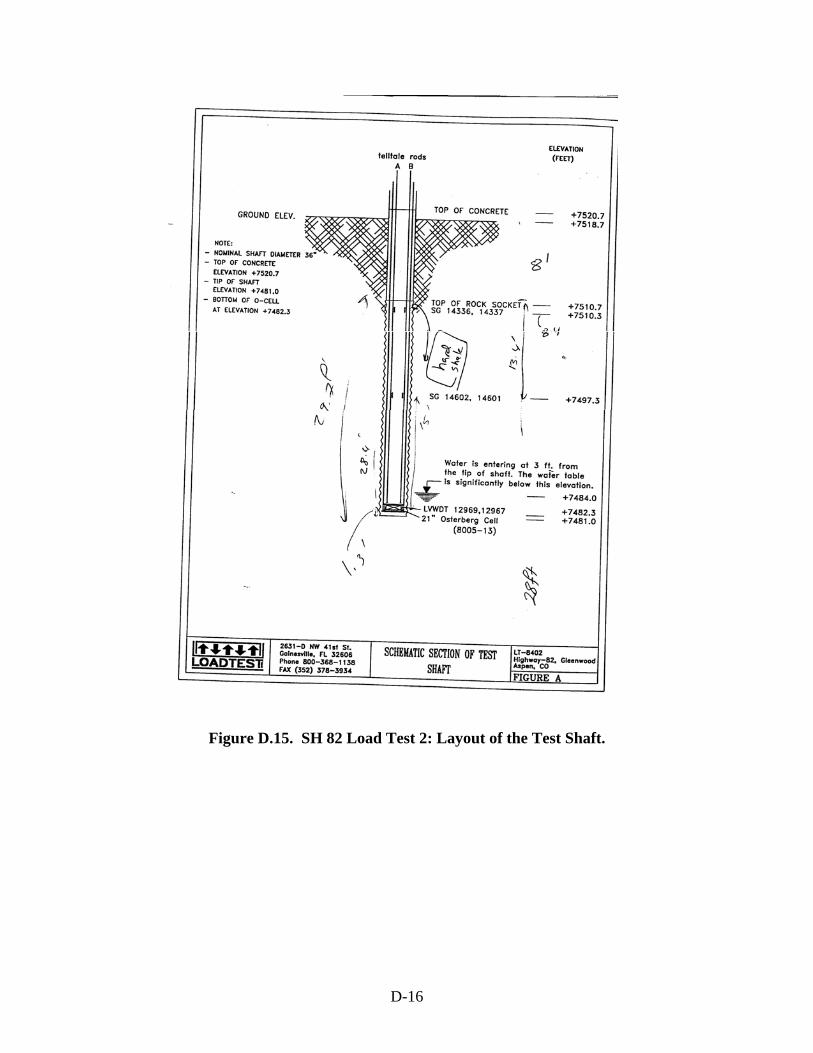
D-16
Figure D.15. SH 82 Load Test 2: Layout of the Test Shaft.
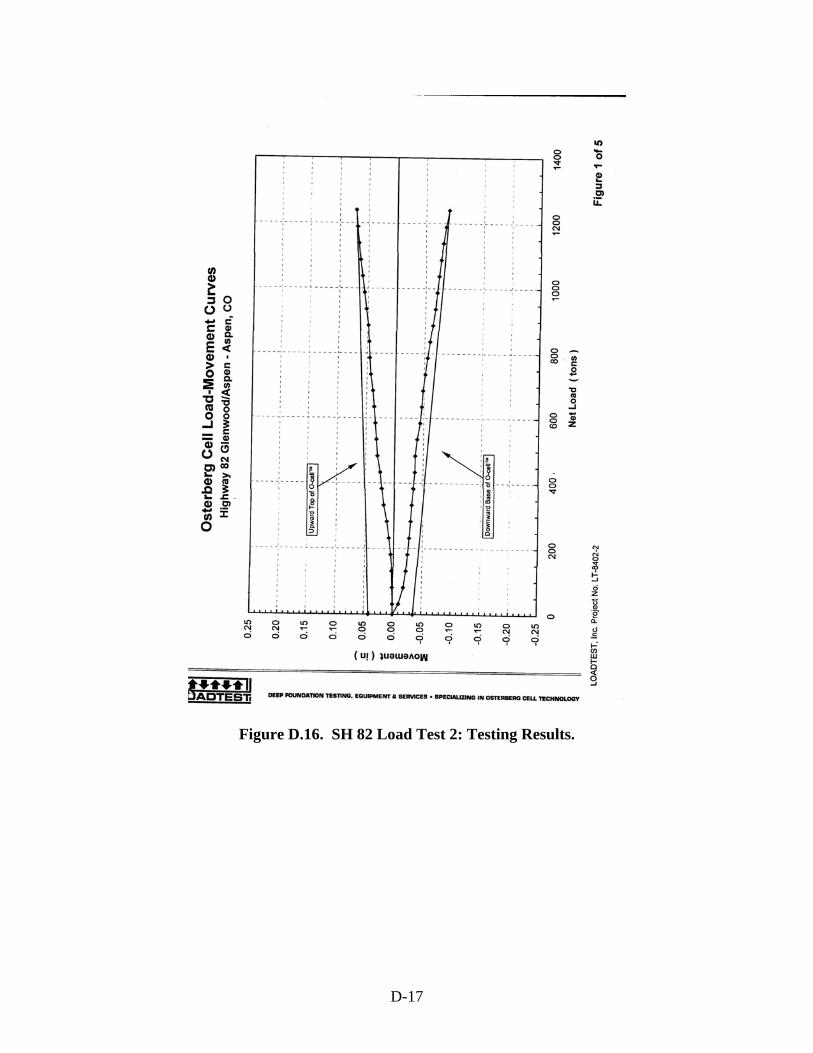
D-17
Figure D.16. SH 82 Load Test 2: Testing Results.
E-1
APPENDIX E: RESULTS OF LOAD TEST INVESTIGATION IN THE
TRINIDAD PROJECT
Part 1: Results of the Subsurface Geotechnical Investigation, pages E-2 to E-11. Part 2: Results of the Two O-Cell Load Tests, Pages E-12 to E-15.
E-2
E-3
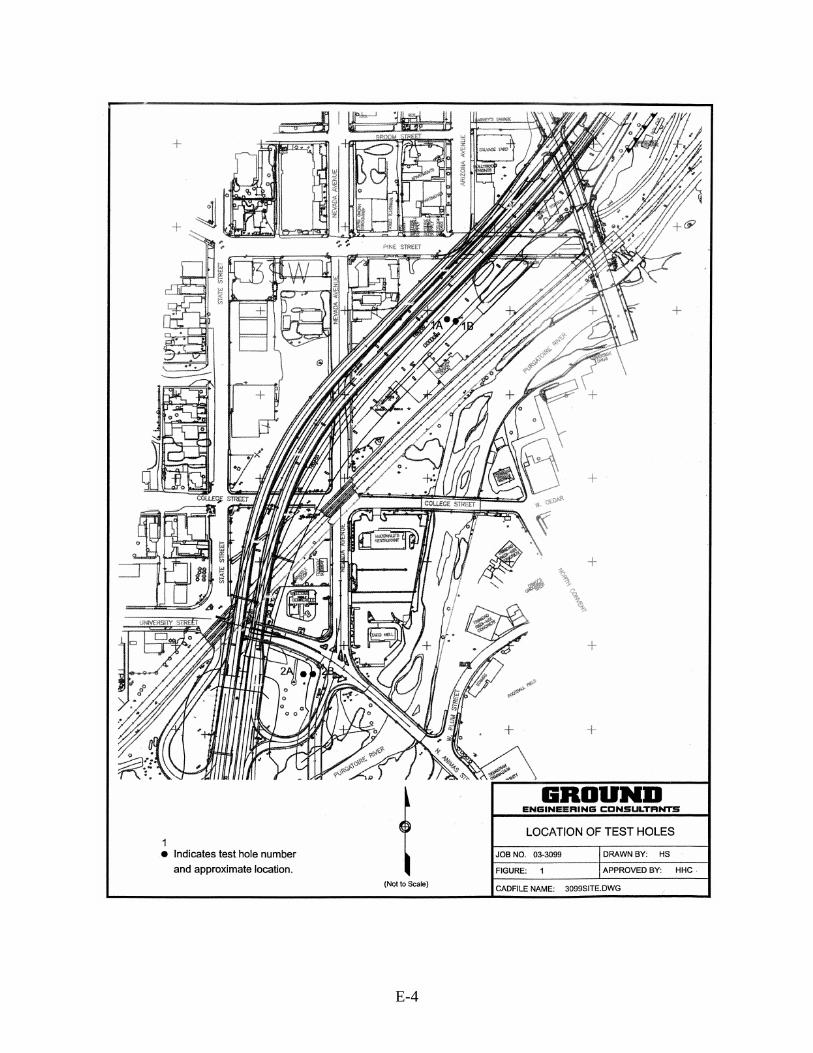
E-4
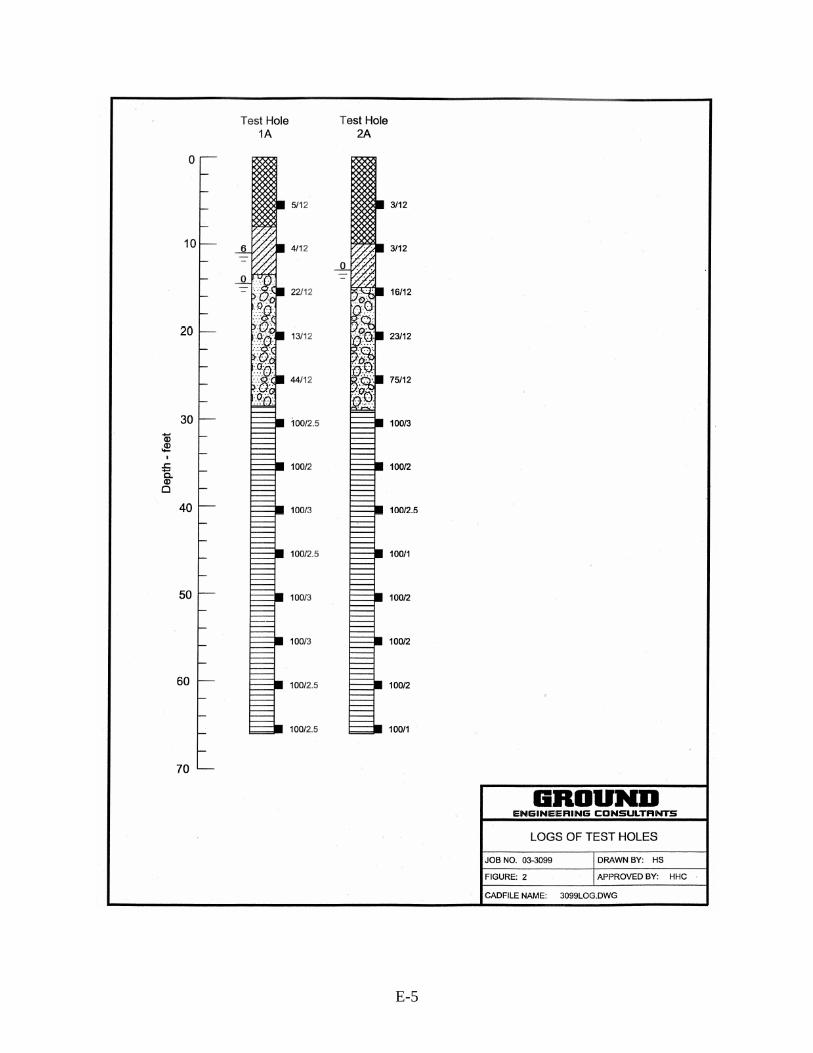
E-5
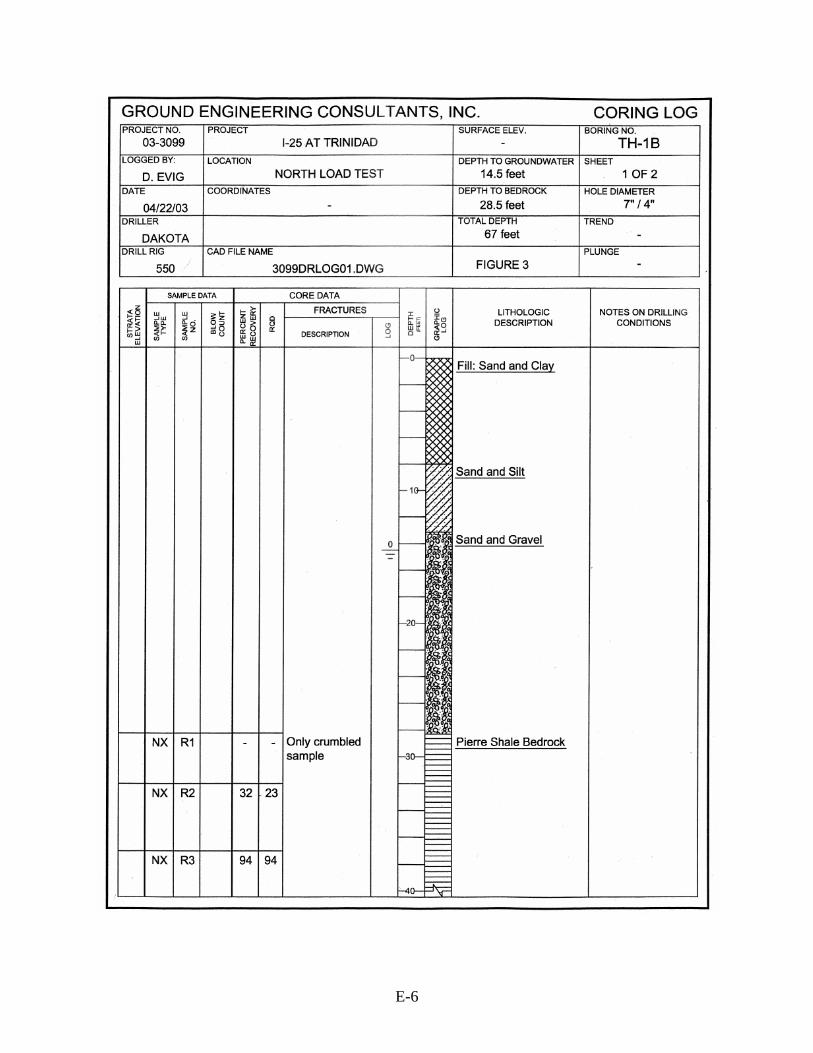
E-6
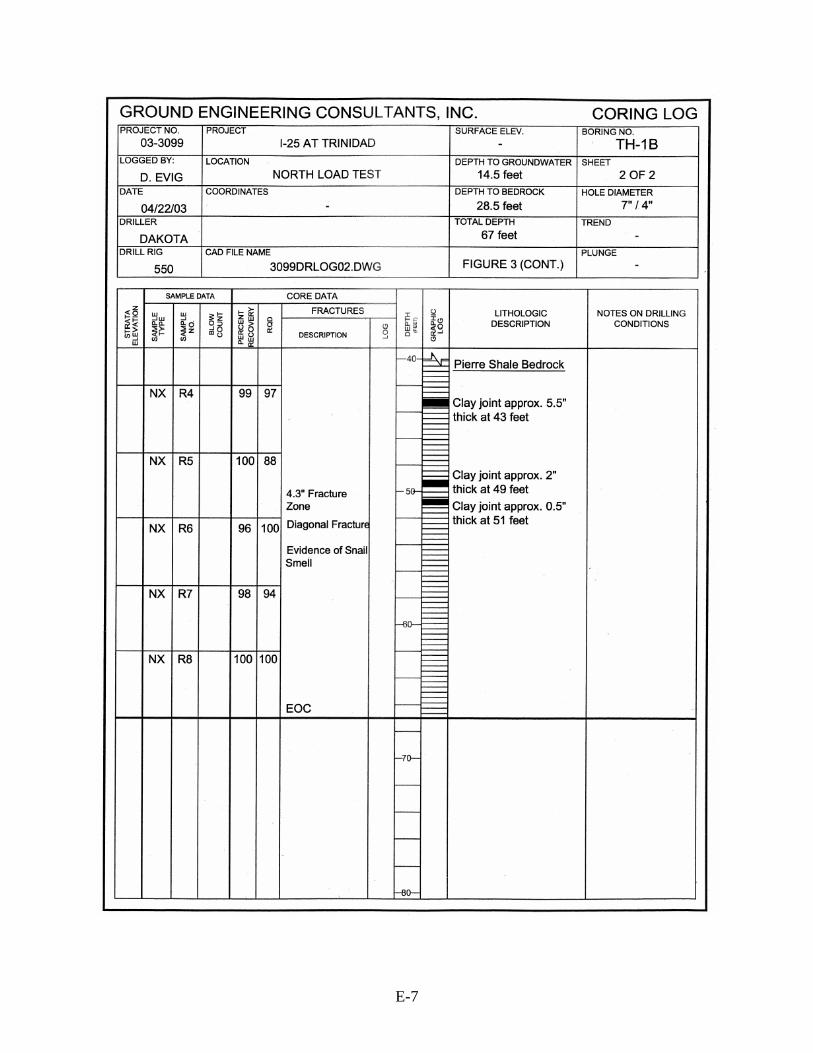
E-7
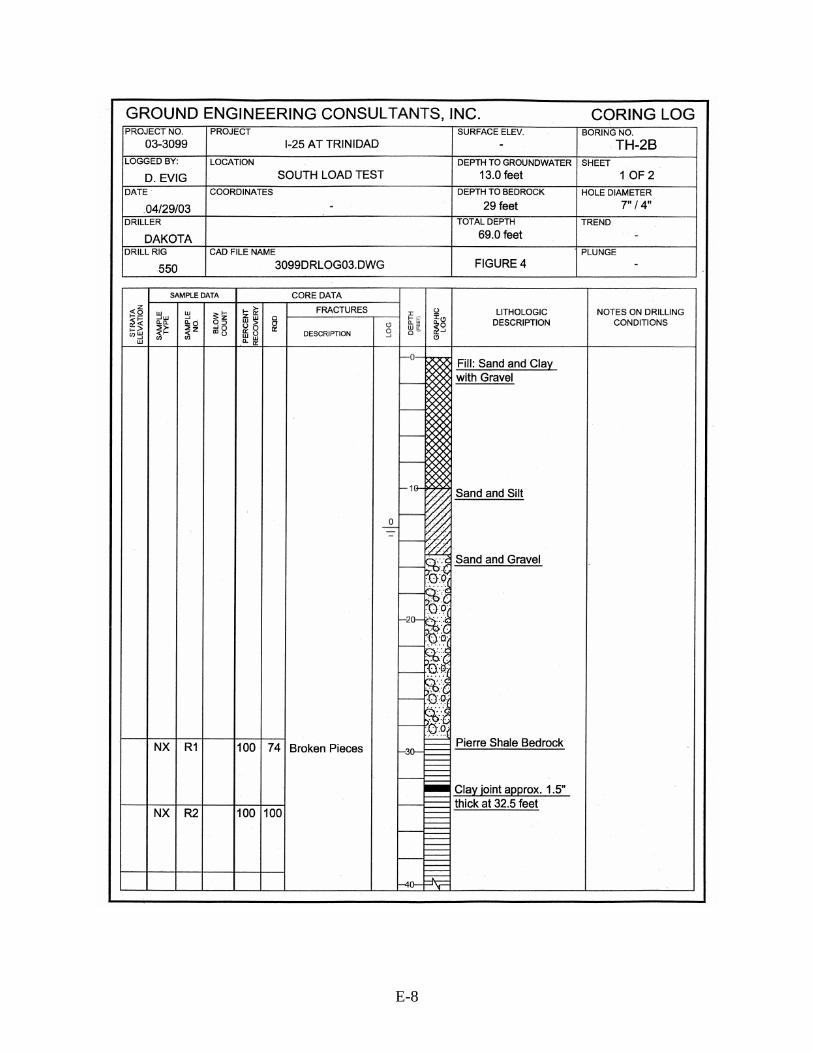
E-8
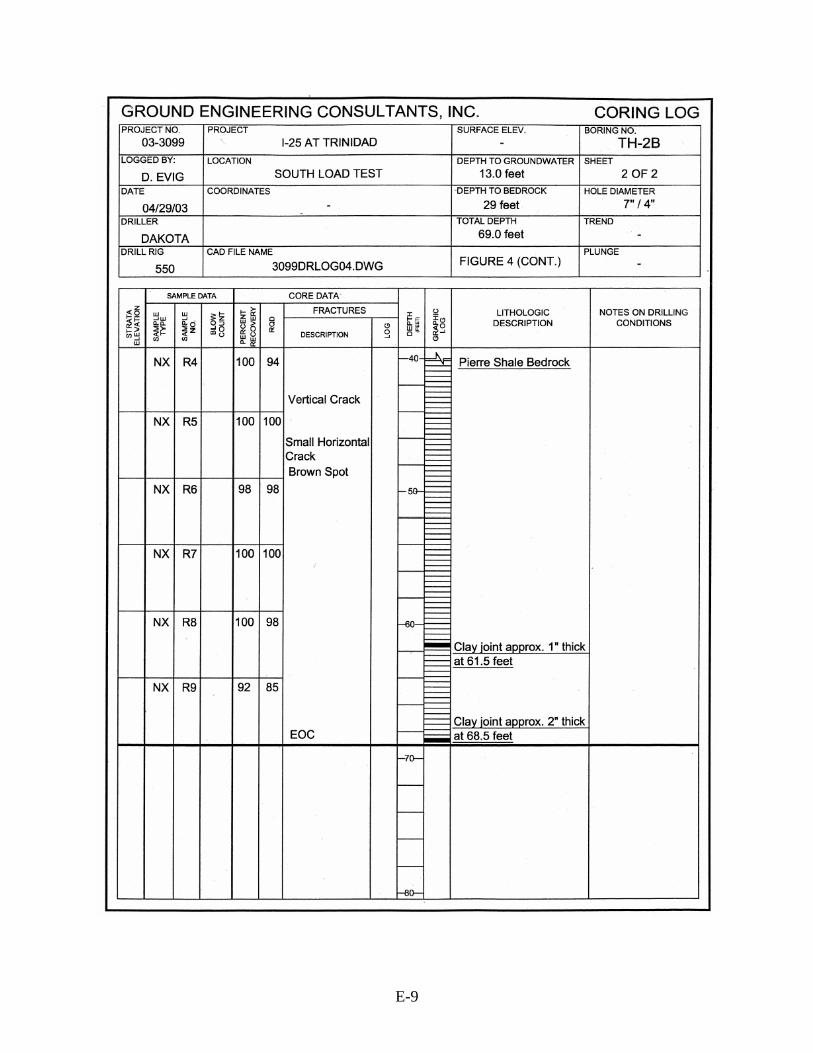
E-9
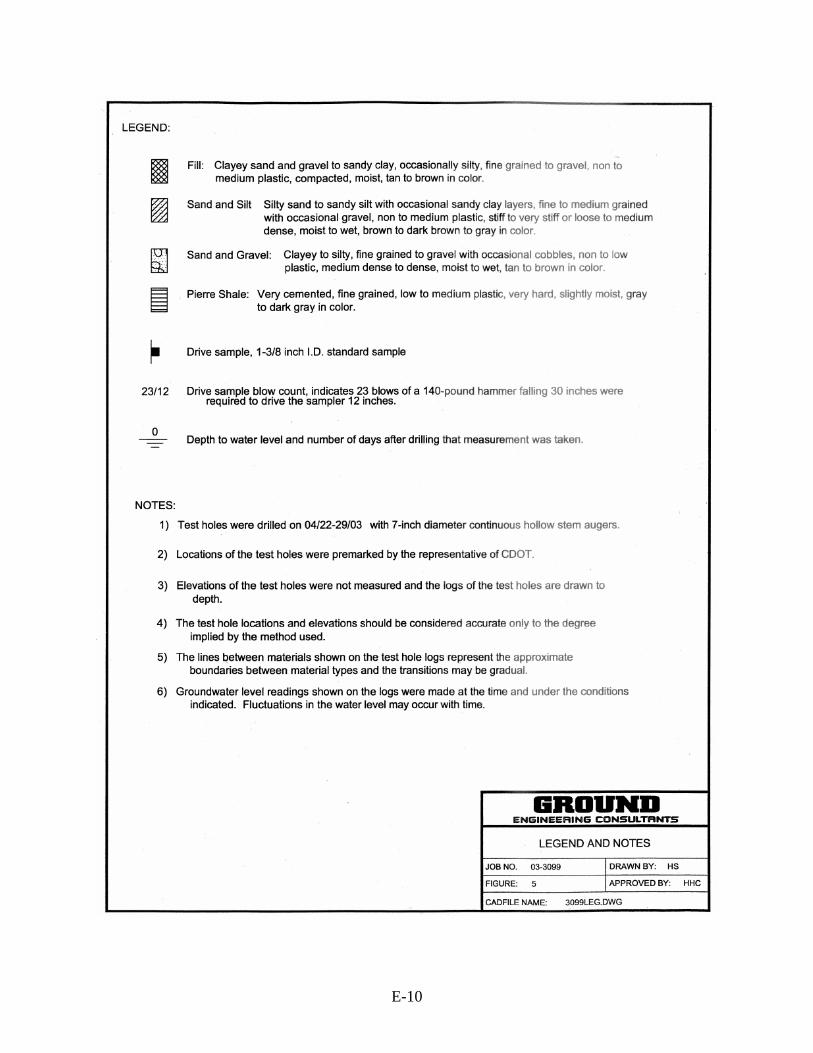
E-10
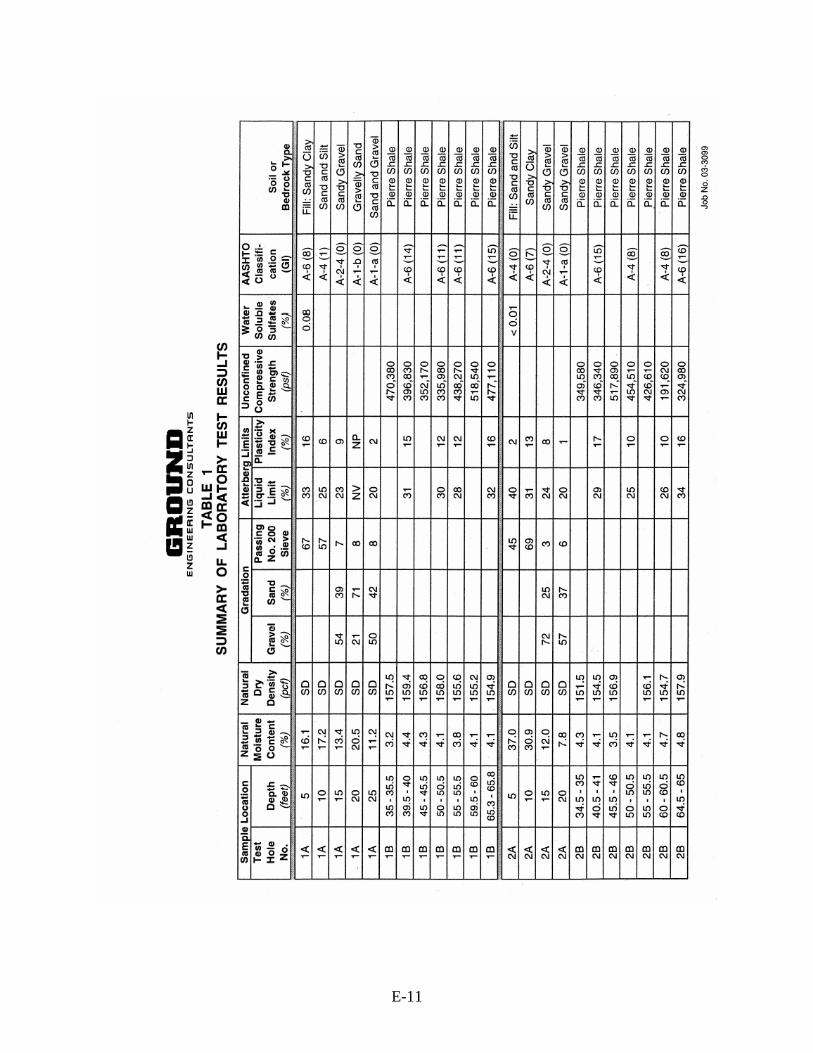
E-11
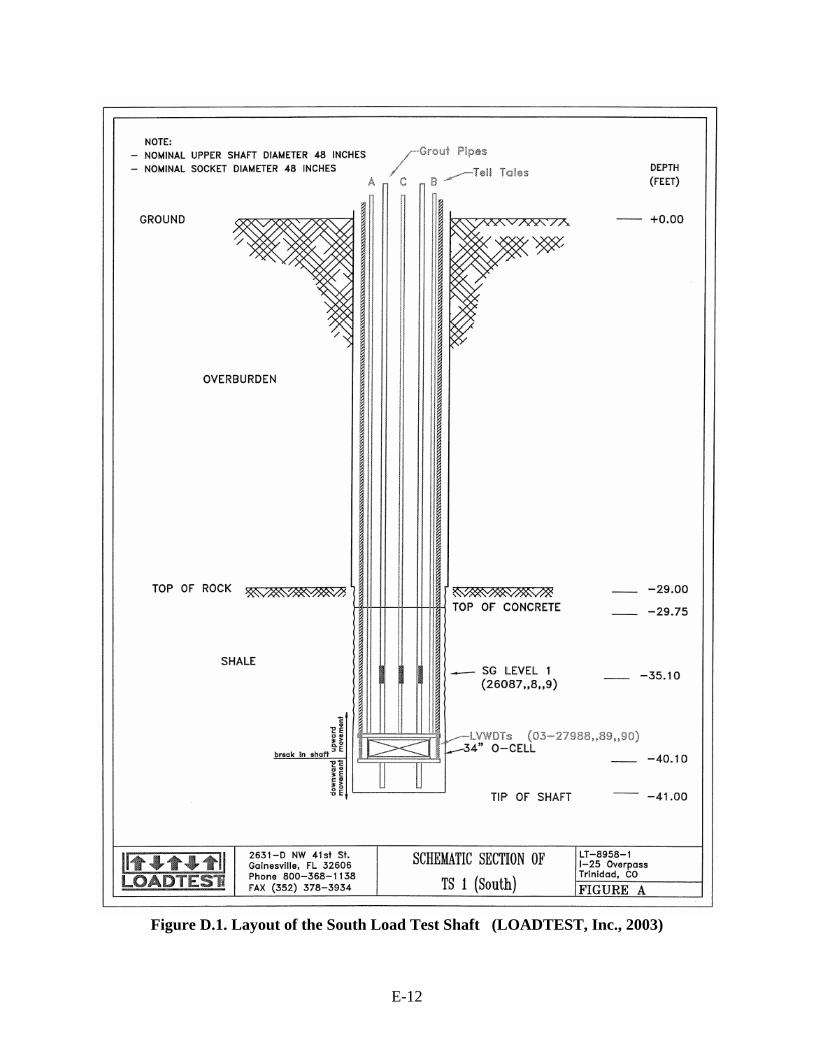
E-12
Figure D.1. Layout of the South Load Test Shaft (LOADTEST, Inc., 2003)
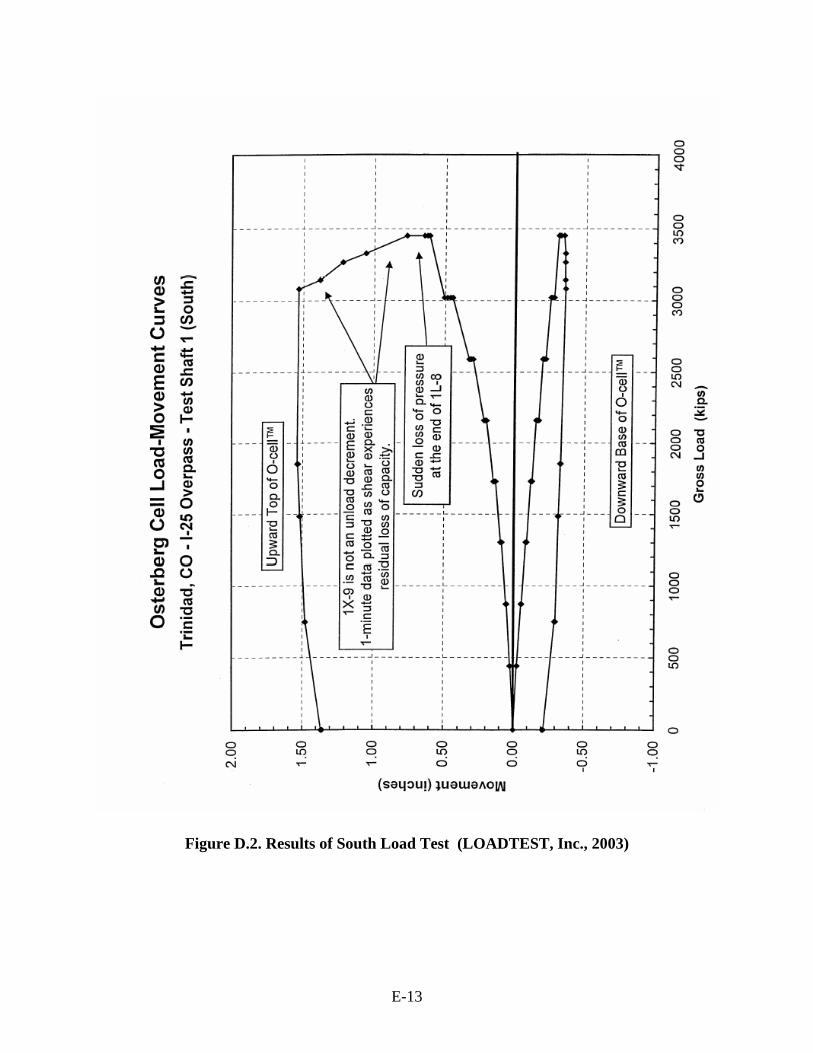
E-13
Figure D.2. Results of South Load Test (LOADTEST, Inc., 2003)
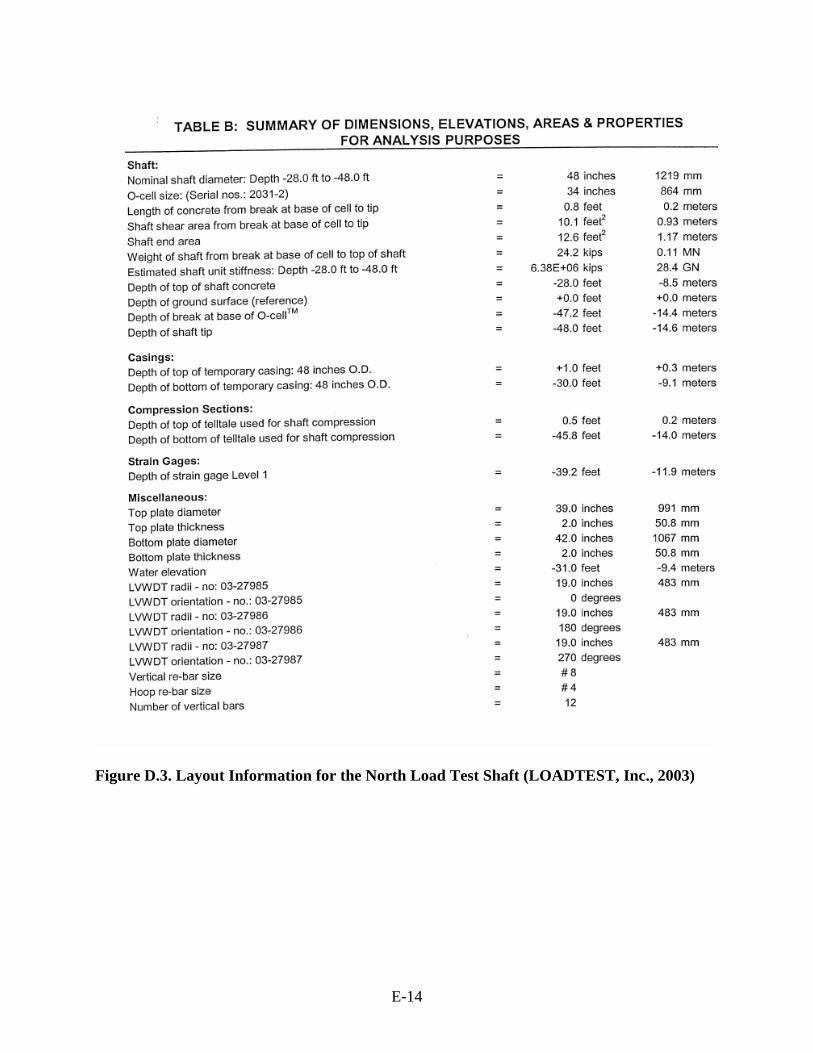
E-14
Figure D.3. Layout Information for the North Load Test Shaft (LOADTEST, Inc., 2003)
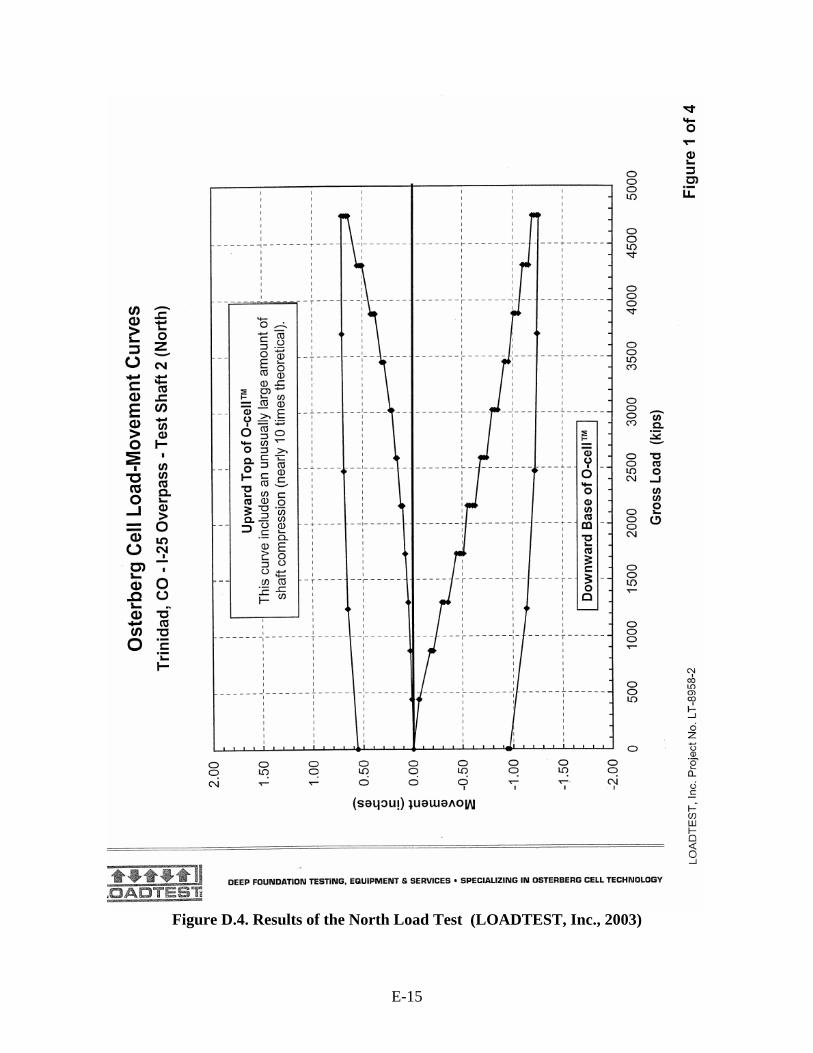
E-15
Figure D.4. Results of the North Load Test (LOADTEST, Inc., 2003)