Embed Size (px)
Citation preview

Colorado’s New Normal
SEPTEMBER 2017 #2017CHAS
State Maintains Historic Health Insurance GainsFINDINGS FROM THE 2017 COLORADO HEALTH ACCESS SURVEY
CHAS 2017 Chart Pack AcknowledgementsColorado Health Institute (CHI) staff members contributing to this report:
Jeff Bontrager, Principal Investigator
Teresa Manocchio, Project Leader
Deborah Goeken, Editor
Brian Clark, Designer
Emily Johnson, Data Analyst
Rebecca Silvernale, Data Analyst
Karam Ahmad
Alex Caldwell
Chrissy Esposito
Cliff Foster
Joe Hanel
Michele Lueck
Emily Morian-Lozano
Allie Morgan
Adrian Nava
Ian Pelto
Edmond Toy
Natalie Triedman
CHI thanks Dr. Ned Calonge and The Colorado Trust, a foundation dedicated to achieving health equity, for ongoing support of the Colorado Health Access Survey.
Special thanks to the Colorado Department of Health Care Policy and Financing and the Colorado Health Foundation for sponsorship of items on the 2017 survey.
CHI also thanks the State Health Access Data Assistance Center (SHADAC) for its assistance in developing survey items and interpreting data.
Finally, we thank the many stakeholders who provided thoughts and ideas throughout the survey development process in 2016.
Topic workbooks are also available, featuring in-depth health data broken down by race/ethnicity, income, education, gender and insurance.
The CHAS is fielded, analyzed and managed by the Colorado Health Institute. CHI contracts with SSRS to conduct the survey.
The survey is primarily funded by The Colorado Trust.
Please contact Jeff Bontrager at [email protected] for information on sponsorship opportunities for the 2019 CHAS.
The CHAS: Online and Interactive
CHAS data are available in a number of formats to make them as useful as possible.
Coloradohealthinstitute.org hosts all the data as well as a library of analyses, interactive graphics, the survey questionnaire and a detailed methods document.
The CHAS page on CHI’s website features interactive dashboards and maps. Excel workbooks with data at the regional level, based on the state’s 21 Health Statistics Regions (HSRs), are available. Users can explore in detail how Coloradans are doing on health coverage, access and status in their own region and compare that data to the state average.
coloradohealthinstitute.org • #2017CHAS

2017
HEALTH CARE VIEWS
HEALTH OF COLORADANS
ACCESS TO CAREHEALTH INSURANCE COVERAGE
TABLE OF CONTENTS
8 Trends in Coverage
10 Marketplace/Individual Market
11 Churn
12 The Uninsured: Where They Live
13 Reasons for Being Uninsured
14 A Portrait of Colorado’s Remaining Uninsured
17 Satisfaction With Health Insurance
18 Affordability
20 Problems Paying Medical Bills
21 Use of Health Care
22 Barriers to Care
24 Emergency Department Use
25 General Health
26 Mental Health
27 Substance Use
28 Oral Health
29 Aging in Colorado
30 Views on the Health Care System
4 The CHAS: A Primer 5 Introduction 6 Top 10 Takeaways

4
The Colorado Health Access Survey — the CHAS — is the premier source of information on health insurance coverage, access to health care and use of health care services in Colorado.
More than 10,000 households in the state have been interviewed every other year since 2009, allowing comparisons across a time marked by sweeping changes in health policy.
The 2017 CHAS is a telephone survey — both cell phones and landlines — of 10,029 randomly selected households in Colorado. Sixty percent of the sample
was cell phones and 40 percent was landlines. It was administered between February 9 and May 21 by Social Science Research Solutions (SSRS), an independent research company. The survey was administered in English and Spanish. Survey data were weighted to accurately reflect the demographics and distribution of the state’s population.
New questions were added to the 2017 survey to help assess the continuing impact of federal and state health reforms in Colorado, including questions about access to care, use of mental health care and wait times for both specialist care and general doctor care.
THE CHAS: A PRIMER
Insurance Terminology Private InsuranceAlso known as commercial insurance, this is insurance provided through an employer or purchased by an individual.
• Employer-Sponsored Insurance (ESI): Health insurance that is offered through an employer. Generally, employees will pay a portion of the premium price, often through a payroll deduction. This category includes TRICARE and other military coverage options.
• Individual Market: Health insurance purchased by an individual from a broker or from an insurance company directly, including student plans. With the online marketplace under the ACA, Coloradans can also comparison shop and buy insurance through Connect for Health Colorado, the state-based marketplace, otherwise known as the exchange. ACA subsidies and tax credits are available only on marketplace plans.
Public Insurance• Medicaid (Health First Colorado): A federal-state program
that provides health insurance primarily to low-income people. The term “Medicaid” and the program’s new name, Health First Colorado, were both used in the survey language.
• Child Health Plan Plus (CHP+): A federal-state health insurance program for low-income children and pregnant women. It is for people who earn too much to qualify for Medicaid but not enough to pay for private health insurance.
• Medicare: The federal health insurance program for seniors who are 65 or older and people with disabilities. Everyone in those categories qualifies for Medicare, regardless of income or assets.
Other Insurance
• This category includes Railroad Retirement Plans and anyone who selected “other.”
Uninsured
• This category includes people who indicate they have no insurance or reported Indian Health Service as their sole form of coverage.
Statistically Speaking
CHI identifies year-to-year changes that are significant in this analysis. But what exactly does that mean? It means the change has statistical significance, and that we are relatively certain it is not due to chance alone. Small differences may result from random coincidence in who was surveyed rather than indicating a change in Colorado’s population as a whole.
If there is at least a five percent chance that our result is coincidental, we do not consider it to be significant. In these cases, we are careful in our interpretation to indicate that despite a change in numbers, there may not be an actual difference. For example, while the 2015 uninsured rate was 6.7 percent and the 2017 uninsured rate is 6.5 percent, this is not a significant difference, so we refer to the rates as essentially unchanged.
2017 Methodology Update
CHI revised the methodology for calculating household income. Previously, the calculation was based on self-reported household income for the prior month, which was multiplied by 12 to arrive at annual household income. In the new method, the calculation is based on self-reported annual household income for the prior year. The updated method provides data more closely aligned with other sources, including the American Community Survey. Past CHAS estimates were updated to allow for accurate comparisons.

2017 COLORADO HEALTH ACCESS SURVEY
5
Having health insurance is the new normal for
most Coloradans. Colorado has managed to maintain its historic level of coverage
despite political uncertainty and rising insurance premiums.
The 2017 Colorado Health Access Survey (CHAS) finds that the state’s insurance rate is 93.5 percent, essentially unchanged from the all-time high of 93.3 percent set in 2015. The uninsurance rate is 6.5 percent, basically unchanged from 2015’s all-time low of 6.7 percent.
For the first time ever, more than five million Coloradans have health insurance.
In spite of the uncertainty in 2017, the Affordable Care Act (ACA) gains first seen in the 2015 CHAS are holding. And many Coloradans are benefiting from the advances in coverage. Comparing Colorado’s pre-ACA landscape of 2013 with the post-ACA landscape of 2017 shows the stark changes.
The percentage of Hispanic Coloradans without insurance, for example, has plummeted to 10.4 percent from 21.8 percent. The state’s “young invincibles,” just starting their careers and often struggling to afford insurance, have seen their uninsured rate drop to 12.3 percent from 25.6 percent. Coloradans below the poverty line now have an uninsured rate of 8.1 percent, down from 21.7 percent in 2013. And kids are still one of Colorado’s best success stories. Just 3.0 percent of them don’t have health insurance.
The 2017 CHAS marks the fifth biennial household survey in Colorado. Looking back at all five paints a picture of Colorado’s health insurance odyssey over a decade of ground-breaking health policy changes.
2009 CHASHealth reform efforts are picking up steam in Washington. But in Colorado, leaders have already made changes, assessing Colorado hospitals with a fee to fund expanded eligibility for Medicaid and
Child Health Plan Plus (CHP+). The survey, called the Colorado Household Survey at the time, finds that 678,000 Coloradans don’t have health insurance. The uninsured rate is 13.5 percent.
2011 CHAS
By the time the 2011 CHAS hits the field, the contentious debate over passage of the ACA is over. President Barack Obama signs it into law in March 2010. Even so, most provisions aren’t in place. And Colorado continues to suffer from the fall-out of the Great Recession, which ended nationally in June 2009. The number of uninsured Coloradans climbs to 829,000. The uninsured rate is 15.8 percent, the highest it will reach in the five issues of the CHAS.
2013 CHAS
As the nation heads toward 2014, when most ACA provisions go into effect, this survey provides baseline data to measure future changes in coverage, health care access and health care use. The uninsured rate dips a bit to 14.3 percent, and 741,000 Coloradans don’t have health insurance.
2015 CHAS
The ACA is in full swing, and the impact in Colorado is dramatic. The percentage of Coloradans without health insurance plummets to 6.7 percent. Just 353,000 are without coverage.
2017 CHAS
Colorado holds onto its gains, but the ACA has barely survived attempts to repeal it under the new Trump administration.
Looking ahead, the CHAS will help to answer this question: Will having health insurance remain Colorado’s new normal?

6
1. Historic Gains MaintainedColorado has retained its historic level of health insurance coverage despite political uncertainty in the marketplace and rising insurance premiums. The 2017 insurance rate is 93.5 percent, essentially unchanged from 2015. The uninsurance rate is 6.5 percent, also basically unchanged.
2. Five Million StrongMore than five million Coloradans now have health insurance — 5,040,164 to be exact — the first time Colorado has topped the five million mark.
3. Pre-ACA and Post-ACA: 600,000 Additional InsuredAlmost 600,000 more Coloradans have health insurance in 2017 than in 2013, just before the launch of the Affordable Care Act. This is about the combined populations of Colorado Springs and Fort Collins.
4. Once Vulnerable, Still VulnerableAbout 350,000 Coloradans still do not have health insurance. These final uninsured are among the state’s most vulnerable and hardest to reach. CHI estimates that as many as 25 percent don’t have documentation, making them ineligible for most public insurance and unable to use the marketplace. About 61,000 are under the poverty line, nearly 50,000 don’t have a high school diploma, and about 115,000 are Hispanic. (Note: These categories overlap.)
5. Steps in the Right Direction The uninsured rate among Hispanics is 10.4 percent, nearly double the 5.4 percent uninsured rate of non-Hispanic white Coloradans. But the good news is that the Hispanic uninsured rate has dropped by more than half since 2011, before the ACA, when it stood at 26.3 percent.
2017 COLORADO HEALTH ACCESS SURVEY
TOP 10 TAKEAWAYS
The 2017 CHAS is filled with numbers. But we should not lose sight of the fact that each number represents a Coloradan — and tells a story. Who has health insurance? Who doesn’t? Who is receiving
timely, efficient and affordable health care? Who, on the other hand, still struggles to pay medical bills? And finally, is Colorado taking the right steps and making the best decisions for a healthier future?
2017 ColoradoInsurance Rate
93.5%

2017 COLORADO HEALTH ACCESS SURVEY
7
6. A Stabilizing Health SystemColorado’s health care system appears to be successfully absorbing the influx of newly insured. A new CHAS question for 2017 finds that the median wait time is two days for a doctor’s appointment and nine days for a specialist appointment. Those appear to be below wait times in other parts of the nation. And the rate of people who said they couldn’t see a doctor as soon as they needed fell to 15.7 percent after spiking to 18.7 percent in 2015.
7. Affordable: Not YetThe Affordable part of the Affordable Care Act is still elusive in Colorado. The high cost of insurance continues to be the No. 1 reason for not having health insurance, with 78.4 percent of the uninsured citing it as the reason. And 10.1 percent of Coloradans say they didn’t get needed doctor care because it was too expensive, the same rate as 2015. A bright spot is dental care: 15.8 percent say they skipped it because it cost too much, down from 22.9 percent in 2011, before the ACA.
8. Medicaid: A Positive Check-UpHundreds of thousands of Coloradans gained insurance under the ACA’s expanded Medicaid eligibility between the 2013 CHAS and the 2017 CHAS. And a quick check-up finds that many of these new Medicaid clients are doing well. Nine of 10 are happy with the range of services covered, trailing only Medicare. Eight of 10 are happy with their choice of doctors, a better rate than those with individual coverage but trailing employer-sponsored insurance and Medicare. Finally, 81.0 percent of Medicaid clients say their family’s needs are being met by the health care system, higher than any insurance type, including employer-sponsored insurance.
9. Dazed and ConfusedEven with plenty of outreach efforts around enrollment, one of seven uninsured Coloradans says they don’t know how to get insurance, a rate that has remained unchanged from 2015. And the use of preventive care has remained steady at 62.4 percent, even though many preventive services are now covered as essential health benefits with no cost-sharing.
10. Healthy-ishColoradans tell CHAS they think they’re pretty healthy: about one third (32.7 percent) list their health as excellent and another 29.8 percent say it’s very good. But these assessments have changed little over the past five surveys, even with the big jump in health insurance, leaving room for improvement. Meanwhile, 88.2 percent of Coloradans say their mental health is good (fewer than eight days of poor mental health in the past month). For oral health, it’s 83.8 percent when excellent, very good and good are combined.
Bonus Takeaway: Congratulations, Douglas CountyDouglas County, with its confluence of high income and high employment, climbed to an astonishing health insurance coverage rate of 98.6 percent. That leaves just 1.4 percent of its population — about 4,500 residents — without health insurance.

8
Trends in CoveragePicture Colorado in 2013, before most of the Affordable Care Act kicked in. Almost 741,000 Coloradans were without health insurance — one of every seven residents. But a new portrait of Colorado’s health insurance landscape is emerging, thanks to the 2017 CHAS. This fifth biennial survey reveals that the uninsurance rate has fallen by more than half to 6.5 percent. That’s a decline of 7.8 percentage
points from 2013. Just 350,000 Coloradans don’t have health insurance in 2017. The five surveys show a shift in the type of coverage, with a continuing decline in insurance gained through jobs and an increase in public insurance. Most groups, including the state’s lowest income, have benefited. Other coverage changes are becoming apparent as well. Dental insurance, for example, is on the rise.
2009
201 1
2013
2015
2017
Colorado’s Changing Health Coverage Landscape HEALTH INSURANCE COVERAGE, ALL AGES, 2009-2017
n Employer-Sponsored n Medicare n Medicaid n CHP+ n Individual Insurance n Other Insurance n Uninsured
57.7%
51.1%
52.6%
50.9%
49.4%
9.7%
11.4%
11.4%
12.9%
14.4%
9.1%
1.3%
0.9%
1.2%
1.4%
1.1%
1.5%
0.8%
0.8%
0.5%
0.7%
12.2%
11.6%
19.9%
19.9%
7.3%
7.7%
8.2%
7.7%
8.1%
13.5%
15.8%
14.3%
6.7%
6.5%
2009 2011 2013 2015 2017
Uninsured Rate Hovers at Historic Low
0%
5%
10%
15%
20%
13.5%15.8%
6.7%
6.5%
14.3%
HEALTH INSURANCE COVERAGE

2017 COLORADO HEALTH ACCESS SURVEY
9
STANDOUT STATISTICS
Insured Coloradans Head Higher; Uninsured Coloradans Drop
Dental Insurance Hits All-Time High
of Coloradans are covered by employer-sponsored insurance — the first time it’s dipped below 50 percent since the 2009 CHAS.
of Coloradans are covered by Medicare, the highest since 2009.
One of Seven children under age 18 are without dental insurance.
49.4% 14.4%
0
1M
2M
3M
4M
5M2009
4,332,000Insured
20114,409,000
Insured
20154,942,000
Insured
20175,040,000
Insured
2009678,000Uninsured
2011829,000Uninsured
2013741,000Uninsured 2015
353,000Uninsured
2017350,000Uninsured
BY THE NUMBERS
20134,447,000
Insured
3M
4M
2009 2011 2013 2015 2017
3,108,000 3,098,000 3,153,000
3,675,000 3,727,000
10
HEALTH INSURANCE COVERAGE
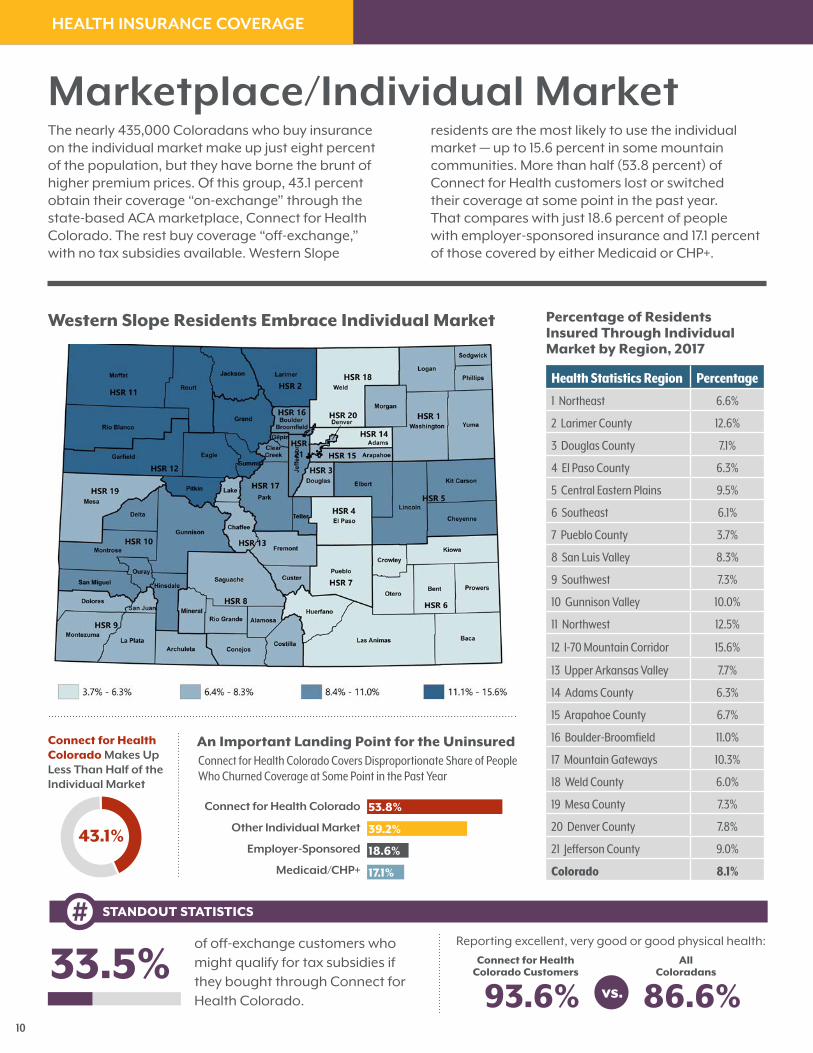
Marketplace/Individual MarketThe nearly 435,000 Coloradans who buy insurance on the individual market make up just eight percent of the population, but they have borne the brunt of higher premium prices. Of this group, 43.1 percent obtain their coverage “on-exchange” through the state-based ACA marketplace, Connect for Health Colorado. The rest buy coverage “off-exchange,” with no tax subsidies available. Western Slope
residents are the most likely to use the individual market — up to 15.6 percent in some mountain communities. More than half (53.8 percent) of Connect for Health customers lost or switched their coverage at some point in the past year. That compares with just 18.6 percent of people with employer-sponsored insurance and 17.1 percent of those covered by either Medicaid or CHP+.
STANDOUT STATISTICS
of off-exchange customers who might qualify for tax subsidies if they bought through Connect for Health Colorado.
Reporting excellent, very good or good physical health:
33.5%
Connect for Health Colorado Makes Up Less Than Half of the Individual Market
Connect for Health Colorado Covers Disproportionate Share of People Who Churned Coverage at Some Point in the Past Year
Western Slope Residents Embrace Individual Market
Connect for Health Colorado Customers
All Coloradans
93.6% 86.6%vs.
Percentage of Residents Insured Through Individual Market by Region, 2017
An Important Landing Point for the Uninsured
Health Statistics Region Percentage
1 Northeast 6.6%
2 Larimer County 12.6%
3 Douglas County 7.1%
4 El Paso County 6.3%
5 Central Eastern Plains 9.5%
6 Southeast 6.1%
7 Pueblo County 3.7%
8 San Luis Valley 8.3%
9 Southwest 7.3%
10 Gunnison Valley 10.0%
11 Northwest 12.5%
12 I-70 Mountain Corridor 15.6%
13 Upper Arkansas Valley 7.7%
14 Adams County 6.3%
15 Arapahoe County 6.7%
16 Boulder-Broomfield 11.0%
17 Mountain Gateways 10.3%
18 Weld County 6.0%
19 Mesa County 7.3%
20 Denver County 7.8%
21 Jefferson County 9.0%
Colorado 8.1%
43.1%
Connect for Health Colorado
Other Individual Market
Employer-Sponsored
Medicaid/CHP+
53.8%
39.2%
18.6%
17.1%

2017 COLORADO HEALTH ACCESS SURVEY
11
ChurnAbout one of six Coloradans (16.5 percent) switched health insurance or lost coverage altogether in the past year — events known as “churn.” Churn is an important measure because it can result in a disruption of health care, either by limiting access to services or requiring a change of providers. Churn has become more common since 2013,
when it stood at 11.8 percent. When Coloradans do find themselves uninsured, it is often for less than six months — such as the time between jobs. The CHAS still finds a chronically uninsured population, however, with 28.1 percent of the uninsured saying they have been without insurance for longer than five years.
STANDOUT STATISTICS
uninsured Coloradans had coverage at some point in the past 12 months but lost it.
of Coloradans did not have coverage for the entire past year (6.5 percent were uninsured when survey was administered).
One of Three 4.4%
<6 Months 6-11 Months 1 Year 2 Years 3-5 Years >5 Years Never Insured0%
10%
20%
30%
Being Uninsured: Either a Short-Term Proposition or a Long-Term Problem
More Coloradans Experiencing Insurance Churn Since ACA
22.1%
9.3% 9.4% 9.7%12.0%
28.1%
9.4%
2015 churn: 14.3%
2013 churn: 11.8%
53.4% 11.7% 10.5% 7.6%299,000 People
65,000 People
59,000 People
43,000 People
Lost prior employer coverage
Lost prior other
coverage
Found plan more suited to
their needs
Were no longer able to afford
coverage
16.5%2017 churn
Among Those Who Experienced Churn . . .
The remaining 16.7 percent cite other reasons.
12
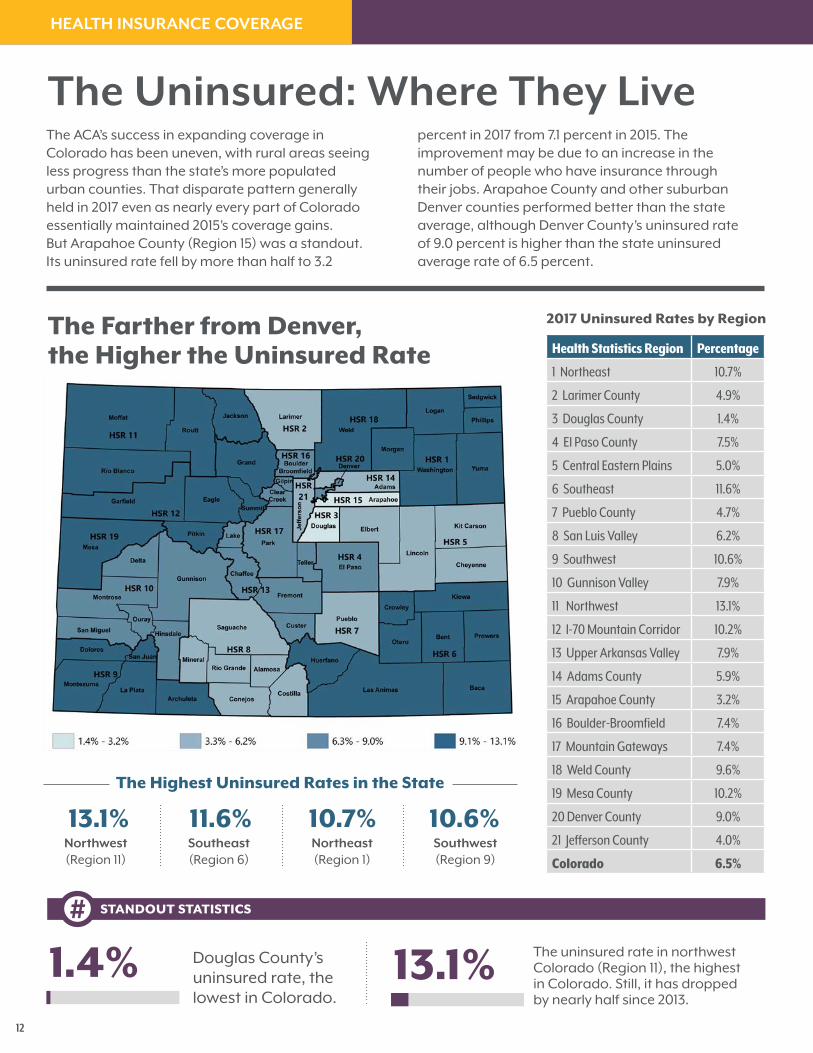
The Uninsured: Where They LiveThe ACA’s success in expanding coverage in Colorado has been uneven, with rural areas seeing less progress than the state’s more populated urban counties. That disparate pattern generally held in 2017 even as nearly every part of Colorado essentially maintained 2015’s coverage gains. But Arapahoe County (Region 15) was a standout. Its uninsured rate fell by more than half to 3.2
percent in 2017 from 7.1 percent in 2015. The improvement may be due to an increase in the number of people who have insurance through their jobs. Arapahoe County and other suburban Denver counties performed better than the state average, although Denver County’s uninsured rate of 9.0 percent is higher than the state uninsured average rate of 6.5 percent.
Douglas County’s uninsured rate, the lowest in Colorado.
Northwest (Region 11)
Southeast (Region 6)
Northeast (Region 1)
Southwest (Region 9)
The uninsured rate in northwest Colorado (Region 11), the highest in Colorado. Still, it has dropped by nearly half since 2013.
1.4% 13.1%
STANDOUT STATISTICS
The Farther from Denver, the Higher the Uninsured Rate
The Highest Uninsured Rates in the State
13.1% 11.6% 10.7% 10.6%
2017 Uninsured Rates by Region
Health Statistics Region Percentage
1 Northeast 10.7%
2 Larimer County 4.9%
3 Douglas County 1.4%
4 El Paso County 7.5%
5 Central Eastern Plains 5.0%
6 Southeast 11.6%
7 Pueblo County 4.7%
8 San Luis Valley 6.2%
9 Southwest 10.6%
10 Gunnison Valley 7.9%
11 Northwest 13.1%
12 I-70 Mountain Corridor 10.2%
13 Upper Arkansas Valley 7.9%
14 Adams County 5.9%
15 Arapahoe County 3.2%
16 Boulder-Broomfield 7.4%
17 Mountain Gateways 7.4%
18 Weld County 9.6%
19 Mesa County 10.2%
20 Denver County 9.0%
21 Jefferson County 4.0%
Colorado 6.5%
HEALTH INSURANCE COVERAGE

2017 COLORADO HEALTH ACCESS SURVEY
13
Reasons for Being UninsuredAlthough the ACA boosted the number of Coloradans with health insurance, it has done little to change the top reasons why the remaining uninsured say they don’t have coverage. Cost is by far the leading reason, cited by nearly four of five of the uninsured (78.4 percent). This didn’t change between 2015 and 2017, but has dropped steadily since 2009, when 88.4 percent of uninsured Coloradans cited cost as a
reason. The second-leading set of reasons for being uninsured is related to eligibility. People go uncovered when a working family member changes jobs (35.8 percent) or is not eligible for job-based insurance (33.0 percent). The third reason centers on navigating the complex insurance system. This includes those who say they don’t need insurance (23.6 percent) and don’t know how to get it (14.4 percent).
Eligibility
Navigability
Cost
6.8%
STANDOUT STATISTICS
Cost, Eligibility Remain Top Reasons for Lacking Coverage
Number of Uninsured Who Say They Can’t Afford Insurance Drops
2009 2011 2013 2015 2017
586,000
667,000
591,000
280,000 262,000
2017 26.4%
14.9%2015
The percentage of people citing cost
as the reason for lacking coverage dropped steadily
from 88.4% in 2009 to 78.4% in 2017.
2009 2011 2013 2015 2017
Insured family member lost job or changed job 36.7% 39.3% 39.8% 25.7% 35.8%
Insured family member no longer part of family 8.5% 8.4% 7.1% 11.9% 7.0%
Working family member not offered or not eligible for insurance 41.0% 40.6% 30.3% 29.4% 33.0%
Lost eligibility for Medicaid or CHP+ 18.9% 17.4% 17.0% 14.9% 26.4%
Traded health insurance for another benefit or higher pay 3.0% 3.0% 5.4% 6.1% 3.5%
Costs too much 88.4% 84.6% 82.0% 82.2% 78.4%
Don’t need health insurance 11.1% 13.5% 24.9% 20.8% 23.6%
Don’t know how to get insurance 13.8% 17.4% 17.2% 14.1% 14.4%
Can’t get health insurance because of a pre-existing condition 14.2% 12.5% 6.1% 8.7% 6.8%
Percentage of Coloradans who say they are uninsured because they lost eligibility for Medicaid or CHP+
of the uninsured mistakenly say they can’t get coverage because of a pre-existing condition. The ACA prohibits insurers from denying coverage based on pre-existing conditions.

14
A Portrait of Colorado’s Remaining Uninsured Even as Colorado holds on to its historically low uninsured rate, 350,000 people don’t have health insurance. Who are they? The state’s most vulnerable residents tend to be disproportionately represented in this group. Low-income and Hispanic
Coloradans, as well as non-citizens and “young invincibles,” made substantial gains in coverage in 2015. Two years later, many of these Coloradans still have the highest uninsured rates, but the gaps are narrowing.
IncomeThe ACA, by expanding Medicaid eligibility and offering tax subsidies to make private insurance more affordable, made it possible for those with the lowest incomes to get coverage. The uninsured rate among Coloradans below the poverty level, for instance, fell to 8.1 percent in 2017 from 21.7 percent in 2013. Between that and twice the poverty level,
or about $48,600 a year for a family of four, the uninsurance rate fell to 9.1 percent in 2017 from 28.3 percent in 2013. Even so, disparities in coverage based on income remain. The uninsured rate for Coloradans below the poverty level is twice the 4.0 percent rate of those above 400 percent of the poverty level.
Lower-Income Coloradans Still More Likely to Be Uninsured
At or Below 100% FPL 101 to 200% FPL 201 to 300% FPL 301 to 400% FPL More than 400% FPL
0%
5%
10%
15%
20%
25%
30%
n 2009 n 2011 n 2013 n 2015 n 2017
26.3
%
23.8
%
18.2
%
12.2
%
5.8%
27.2
%
28.5
%
19.7
%
12.6
%
4.9%
21.7
%
28.3
%
19.6
%
11.5%
5.3%
9.9% 10
.6%
6.6% 8.
6%
3.1%
8.1% 9.
1% 9.7%
6.4%
4.0%
HEALTH INSURANCE COVERAGE
2017 COLORADO HEALTH ACCESS SURVEY
15
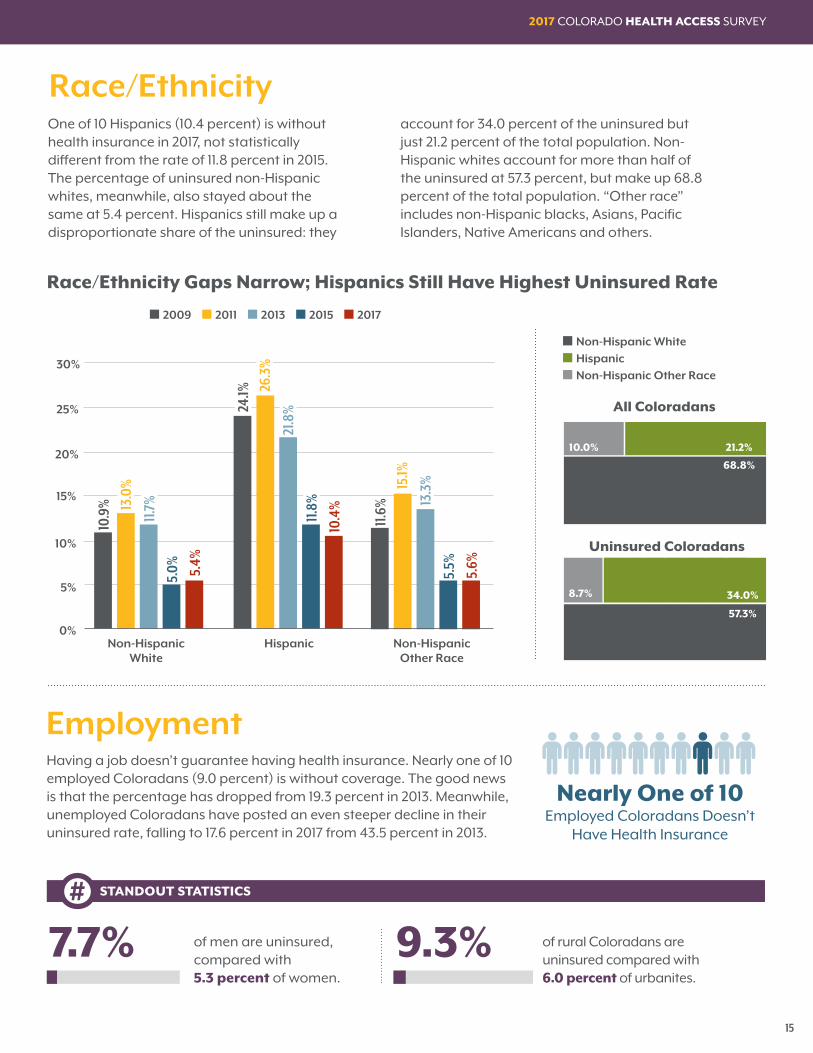
Race/EthnicityOne of 10 Hispanics (10.4 percent) is without health insurance in 2017, not statistically different from the rate of 11.8 percent in 2015. The percentage of uninsured non-Hispanic whites, meanwhile, also stayed about the same at 5.4 percent. Hispanics still make up a disproportionate share of the uninsured: they
account for 34.0 percent of the uninsured but just 21.2 percent of the total population. Non-Hispanic whites account for more than half of the uninsured at 57.3 percent, but make up 68.8 percent of the total population. “Other race” includes non-Hispanic blacks, Asians, Pacific Islanders, Native Americans and others.
EmploymentHaving a job doesn’t guarantee having health insurance. Nearly one of 10 employed Coloradans (9.0 percent) is without coverage. The good news is that the percentage has dropped from 19.3 percent in 2013. Meanwhile, unemployed Coloradans have posted an even steeper decline in their uninsured rate, falling to 17.6 percent in 2017 from 43.5 percent in 2013.
STANDOUT STATISTICS
of men are uninsured, compared with 5.3 percent of women.
of rural Coloradans are uninsured compared with 6.0 percent of urbanites.
7.7% 9.3%
Race/Ethnicity Gaps Narrow; Hispanics Still Have Highest Uninsured Rate
Non-Hispanic White
Hispanic
Non-Hispanic Other Race
0%
5%
10%
15%
20%
25%
30%
n 2009 n 2011 n 2013 n 2015 n 2017
n Non-Hispanic White
n Hispanic
n Non-Hispanic Other Race
10.9
%
24.1%
11.6%13
.0%
26.3
%
15.1%
11.7%
21.8
%
13.3
%
5.0%
11.8%
5.5%5.4%
10.4
%
5.6%
All Coloradans
Uninsured Coloradans
Nearly One of 10 Employed Coloradans Doesn’t
Have Health Insurance
8.7%
10.0%
34.0%
68.8%
21.2%
57.3%
16
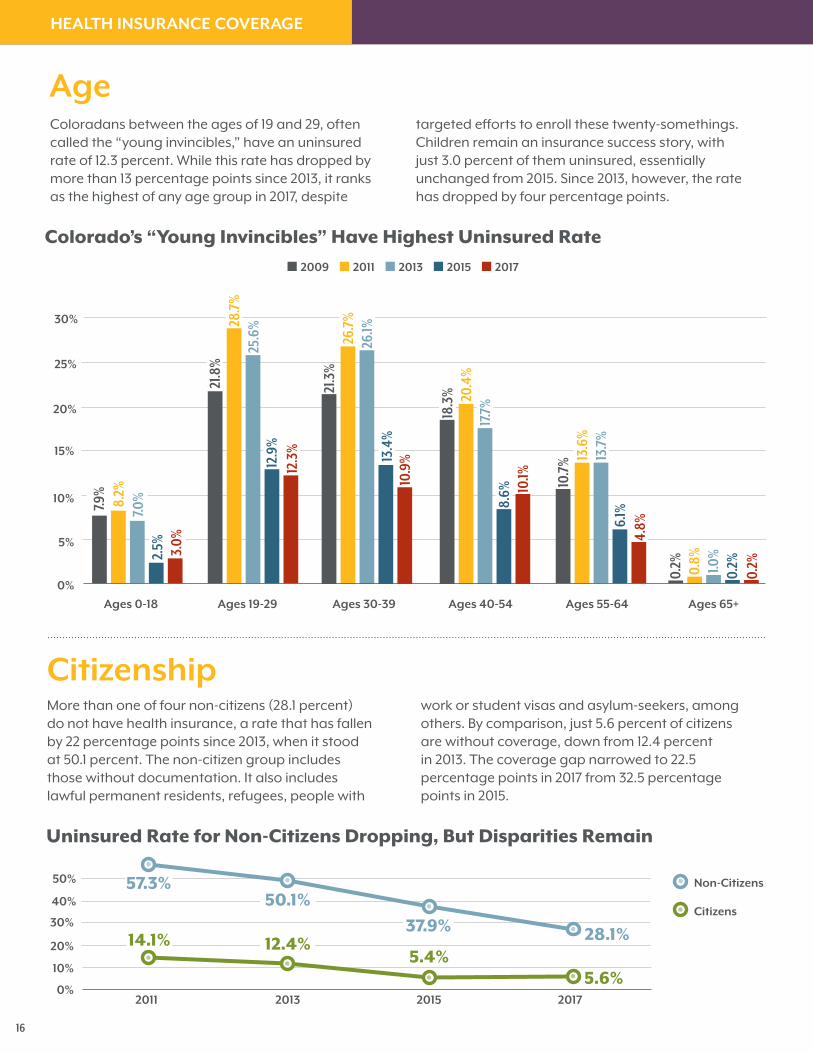
CitizenshipMore than one of four non-citizens (28.1 percent) do not have health insurance, a rate that has fallen by 22 percentage points since 2013, when it stood at 50.1 percent. The non-citizen group includes those without documentation. It also includes lawful permanent residents, refugees, people with
work or student visas and asylum-seekers, among others. By comparison, just 5.6 percent of citizens are without coverage, down from 12.4 percent in 2013. The coverage gap narrowed to 22.5 percentage points in 2017 from 32.5 percentage points in 2015.
AgeColoradans between the ages of 19 and 29, often called the “young invincibles,” have an uninsured rate of 12.3 percent. While this rate has dropped by more than 13 percentage points since 2013, it ranks as the highest of any age group in 2017, despite
targeted efforts to enroll these twenty-somethings. Children remain an insurance success story, with just 3.0 percent of them uninsured, essentially unchanged from 2015. Since 2013, however, the rate has dropped by four percentage points.
Colorado’s “Young Invincibles” Have Highest Uninsured Rate
Ages 0-18 Ages 19-29 Ages 30-39 Ages 40-54 Ages 55-64 Ages 65+
0%
5%
10%
15%
20%
25%
30%
n 2009 n 2011 n 2013 n 2015 n 2017
7.9%
21.8
%
21.3
%
18.3
%
10.7
%
0.2%
8.2%
28.7
%
26.7
%
20.4
%
13.6
%
0.8%
7.0%
25.6
%
26.1%
17.7
%
13.7
%
1.0%2.
5%
12.9
%
13.4
%
8.6%
6.1%
0.2%
3.0%
12.3
%
10.9
%
10.1%
4.8%
0.2%
2011 2013 2015 20170%
10%
20%
30%
40%
50%
Uninsured Rate for Non-Citizens Dropping, But Disparities Remain
57.3%
14.1%
50.1%
12.4%37.9%
5.4%28.1%
5.6%
Non-Citizens
Citizens
HEALTH INSURANCE COVERAGE
2017 COLORADO HEALTH ACCESS SURVEY
17
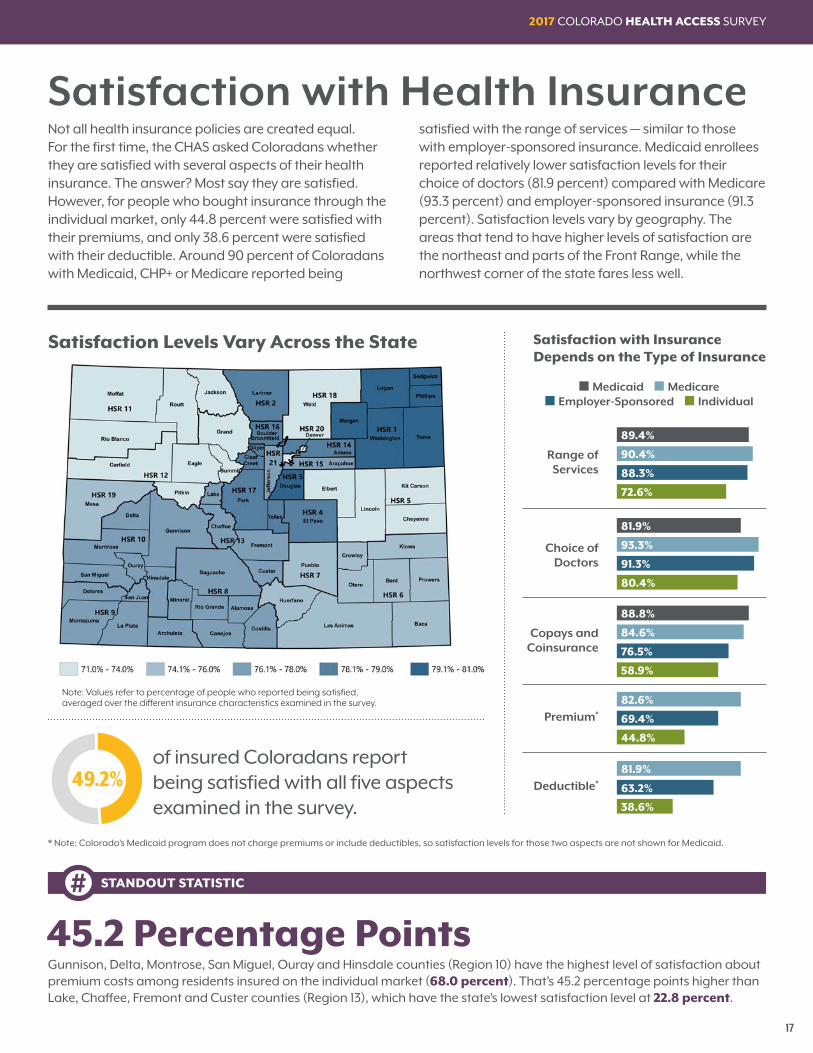
Satisfaction with Health InsuranceNot all health insurance policies are created equal. For the first time, the CHAS asked Coloradans whether they are satisfied with several aspects of their health insurance. The answer? Most say they are satisfied. However, for people who bought insurance through the individual market, only 44.8 percent were satisfied with their premiums, and only 38.6 percent were satisfied with their deductible. Around 90 percent of Coloradans with Medicaid, CHP+ or Medicare reported being
satisfied with the range of services — similar to those with employer-sponsored insurance. Medicaid enrollees reported relatively lower satisfaction levels for their choice of doctors (81.9 percent) compared with Medicare (93.3 percent) and employer-sponsored insurance (91.3 percent). Satisfaction levels vary by geography. The areas that tend to have higher levels of satisfaction are the northeast and parts of the Front Range, while the northwest corner of the state fares less well.
Satisfaction with Insurance Depends on the Type of Insurance
Satisfaction Levels Vary Across the State
STANDOUT STATISTIC
Gunnison, Delta, Montrose, San Miguel, Ouray and Hinsdale counties (Region 10) have the highest level of satisfaction about premium costs among residents insured on the individual market (68.0 percent). That’s 45.2 percentage points higher than Lake, Chaffee, Fremont and Custer counties (Region 13), which have the state’s lowest satisfaction level at 22.8 percent.
of insured Coloradans report being satisfied with all five aspects examined in the survey.
45.2 Percentage Points
* Note: Colorado’s Medicaid program does not charge premiums or include deductibles, so satisfaction levels for those two aspects are not shown for Medicaid.
Range of Services
Choice of Doctors
Copays and Coinsurance
Premium*
Deductible*
n Medicaid n Medicare n Employer-Sponsored n Individual
89.4%
90.4%
88.3%
72.6%
81.9%
93.3%
91.3%
80.4%
88.8%
84.6%
76.5%
58.9%
82.6%
69.4%
44.8%
81.9%
63.2%
38.6%
49.2%
Note: Values refer to percentage of people who reported being satisfied, averaged over the different insurance characteristics examined in the survey.
18
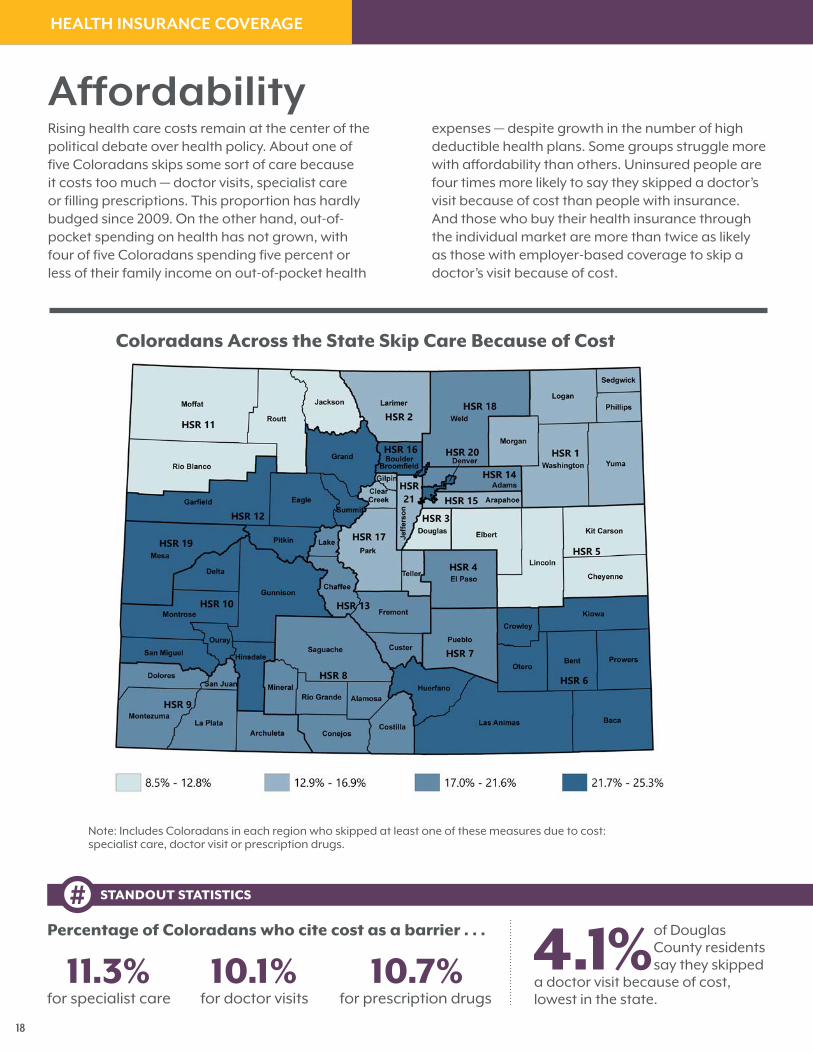
AffordabilityRising health care costs remain at the center of the political debate over health policy. About one of five Coloradans skips some sort of care because it costs too much — doctor visits, specialist care or filling prescriptions. This proportion has hardly budged since 2009. On the other hand, out-of-pocket spending on health has not grown, with four of five Coloradans spending five percent or less of their family income on out-of-pocket health
expenses — despite growth in the number of high deductible health plans. Some groups struggle more with affordability than others. Uninsured people are four times more likely to say they skipped a doctor’s visit because of cost than people with insurance. And those who buy their health insurance through the individual market are more than twice as likely as those with employer-based coverage to skip a doctor’s visit because of cost.
STANDOUT STATISTICS
for specialist care for doctor visits for prescription drugs
4.1% of Douglas County residents say they skipped
a doctor visit because of cost, lowest in the state.
11.3% 10.1% 10.7%Percentage of Coloradans who cite cost as a barrier . . .
Coloradans Across the State Skip Care Because of Cost
Note: Includes Coloradans in each region who skipped at least one of these measures due to cost: specialist care, doctor visit or prescription drugs.
HEALTH INSURANCE COVERAGE
2017 COLORADO HEALTH ACCESS SURVEY
19
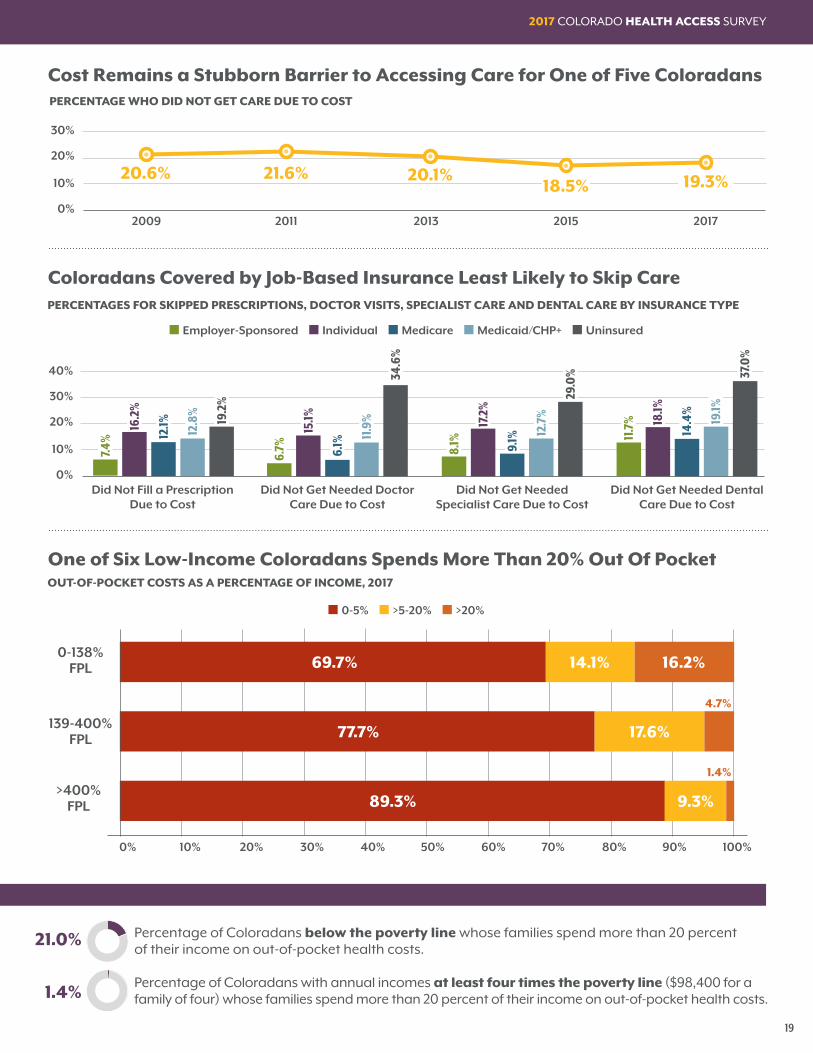
Percentage of Coloradans below the poverty line whose families spend more than 20 percent of their income on out-of-pocket health costs.
Percentage of Coloradans with annual incomes at least four times the poverty line ($98,400 for a family of four) whose families spend more than 20 percent of their income on out-of-pocket health costs.
21.0%
1.4%
2009 2011 2013 2015 2017
Did Not Fill a Prescription Due to Cost
Did Not Get Needed Doctor Care Due to Cost
Did Not Get Needed Specialist Care Due to Cost
Did Not Get Needed Dental Care Due to Cost
0%
0%
0% 10% 20% 30% 40% 50% 60% 70% 80% 90% 100%
10%
10%
20%
20%
30%
30%
40%
20.6% 21.6% 20.1%18.5% 19.3%
Cost Remains a Stubborn Barrier to Accessing Care for One of Five Coloradans
Coloradans Covered by Job-Based Insurance Least Likely to Skip Care
One of Six Low-Income Coloradans Spends More Than 20% Out Of Pocket
PERCENTAGE WHO DID NOT GET CARE DUE TO COST
PERCENTAGES FOR SKIPPED PRESCRIPTIONS, DOCTOR VISITS, SPECIALIST CARE AND DENTAL CARE BY INSURANCE TYPE
OUT-OF-POCKET COSTS AS A PERCENTAGE OF INCOME, 2017
7.4%
6.7% 8.
1% 11.7
%16.2
%
15.1% 17.2
%
18.1%
12.1%
6.1% 9.1% 14
.4%
12.8
%
11.9
%
12.7
% 19.1%
19.2
%
34.6
%
29.0
% 37.0
%
n Employer-Sponsored n Individual n Medicare n Medicaid/CHP+ n Uninsured
n 0-5% n >5-20% n >20%
69.7%
77.7%
89.3%
14.1%
17.6%
9.3%
16.2%
4.7%
1.4%
0-138% FPL
139-400% FPL
>400% FPL

20
Problems Paying Medical Bills
Fewer People in Colorado are Struggling to Pay Their Medical Bills …
. . . But Residents of Some Areas Are Seeing More Problems
STANDOUT STATISTICS
Paying medical bills can overwhelm a family’s budget — especially for the uninsured. But even people with health insurance face high co-pays, co-insurance or deductibles when illness hits. The good news is the percentage of Coloradans who report problems paying their medical bills fell to 14.0 percent in 2017 from 21.9 percent in 2009. However, this progress has been uneven across the state. Most areas have fewer residents
struggling to pay medical bills, but the rate climbed in the southeast and southwest corners of the state and some urban areas along the Front Range. Difficulty paying medical bills impacts household budgets, with 67.6 percent of Coloradans encountering problems paying medical bills reporting they are saving less money or taking money out of savings, followed by taking on credit card debt at 46.2 percent
Difference in percentage of people with insurance (21.6 percent) and those without (13.5 percent) who are having problems paying their medical bills.
of rural Coloradans report problems paying their medical bills vs. 13.6 percent of urban Coloradans.
8.1 Percentage Points16.4%
2009 2011 2013 2015 20170%
10%
20%
30%
21.9% 21.2% 18.1%
67.6%
46.2%
37.2%
30.5%
5.4%
15.7%
15.2% 14.0%
Of the 14.0% Who Had Problems Paying ...
Saved less or took funds out of savings
Took on credit card debt
Were unable to pay for necessities like food, heat or rent
Added hours or took another job
Declared bankruptcy
Took out a loan
Percentage change in proportion reporting problems paying, 2015-2017
ACCESS TO HEALTH CARE

2017 COLORADO HEALTH ACCESS SURVEY
21
Coloradans show little sign of changing their health care habits. The 2017 CHAS finds the percentage of residents seeing a specialist (36.8 percent) is about the same as in 2015. Preventive care, however, dipped from 66.1 percent to 62.4 percent. Experts expected big coverage gains would produce a surge in health care consumption. That hasn’t happened, at least so far. Perhaps it’s because Colorado is a healthy state, so residents need less care. High
deductibles may make treatment too expensive, or maybe it’s not well known that preventive care carries no co-pays. A widening gap exists between those with insurance and those without it. About 83.5 percent of people with employer-sponsored plans had at least one health care visit in the previous 12 months compared with 41 percent of uninsured Coloradans. That 42.5-point gap is up from 33.3 points in 2013.
Use of Health Care
of Coloradans have a usual source of care.
of Coloradans — 843,000 residents — don’t have a usual source of care.
84.2% 15.8%
Employer-Sponsored Individual Medicaid Uninsured
n Health Care Professional Visit n Specialist Visit n Preventive Visit
Top Reasons Coloradans Don’t Have a Usual Source of Care
83.5% 77.0% 77.9% 41.0%
36.8% 32.5% 34.4% 12.2%
66.4% 61.0% 58.2% 25.8%
Coloradans with Employer-Sponsored Insurance are the Most Likely to Get Health Care; the Uninsured are Least Likely
Coloradans Without a Usual Source of Care Who Don’t Plan to Visit a Doctor, Even if Sick
STANDOUT STATISTICS
49.8%Haven’t had
any problems
8.3%Don’t plan to see a doctor,
even when sick
5.9%Don’t have insurance
or dropped by provider
4.9%Can’t afford it
4.3%Don’t have an
established physician
Others: No doctors take my insurance
(4.2%); New to area (3.2%); Doctor’s office
is not convenient (2.1%); Don’t like or trust doctors (1.6%)
Non-Hispanic
White
Hispanic Other < 100% FPL
101 to 200%
FPL
201 to 300%
FPL
301 to 400%
FPL
> 400% FPL
Race / Ethnicity Income
0%
5%
10%
15%
20%
10.3%9.2% 9.0%
2.3%
8.6%8.9% 8.7%
3.8%

22
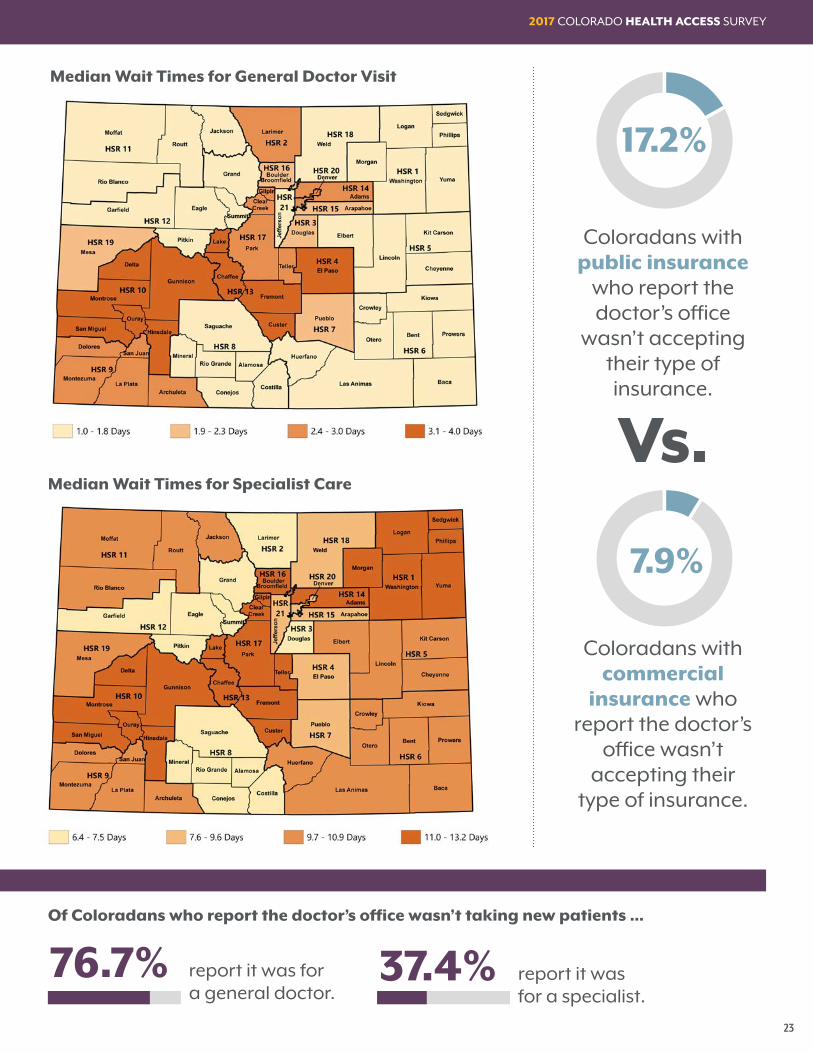
Barriers to CareHaving more Coloradans with health insurance knocks down one big barrier to receiving timely, affordable and efficient health care. But others remain. Getting a timely appointment is still tough for some, with 15.7 percent saying it’s why they didn’t get care, although it has fallen by three percentage points since 2015. Nearly 23 percent of Medicaid clients report not getting care because the doctor’s
office wasn’t taking their insurance, a rate that has stayed consistently higher than employer-sponsored and private insurance. A new CHAS question about wait times appears to show the influx of insured residents isn’t straining the health care system. Coloradans report a median wait time of two days for a general doctor appointment and nine days for a specialist appointment.
In the past 12 months … 2009 2011 2013 2015 2017
You couldn’t get an appointment as soon as you needed one 16.8% 16.4% 15.0% 18.7% 15.7%
The doctor’s office wasn’t accepting patients with your type of insurance* 8.0% 8.4% 7.1% 9.7% 11.4%
The doctor’s office wasn’t accepting new patients 8.0% 9.2% 8.4% 9.2% 11.3%
You lacked transportation to the doctor’s office or it was too far away N/A N/A 4.4% 4.7% 5.5%
You couldn’t take time off work** N/A N/A 10.1% 10.6% 12.0%
You couldn’t find child care*** N/A N/A 4.0% 7.9% 10.0%
STANDOUT STATISTICS
report it was for a general doctor appointment.
report it was for a specialist appointment.
72.5% 43.3%Of Coloradans unable to get an appointment as soon as one was needed…
Not Getting an Appointment Ranks as Biggest Barrier to Care
Medicaid Members Most Likely to Say Providers Won’t Accept Their Insurance
* Asked of currently insured ** Asked of employed adults and parents *** Asked of those with children
Employer- Sponsored
Medicare Medicaid CHP+ Individual Insurance0%
10%
20%
30%
5.8% 8.
1%
19.7
% 24.1%
5.1%
5.3% 7.6
%
23.3
%
13.1%
6.3%
4.9% 6.
7%
17.2
%
9.5%
7.2%
5.4% 8.
7%
19.9
%
14.8
%
12.5
%
6.6% 9.
8%
22.8
%
12.9
%
16.2
%
n 2009 n 2011 n 2013 n 2015 n 2017
ACCESS TO HEALTH CARE
2017 COLORADO HEALTH ACCESS SURVEY
23
7.9%
17.2%
report it was for a general doctor.
report it was for a specialist.
76.7% 37.4%Of Coloradans who report the doctor’s office wasn’t taking new patients ...
Median Wait Times for General Doctor Visit
Median Wait Times for Specialist Care
Coloradans with public insurance
who report the doctor’s office
wasn’t accepting their type of insurance.
Vs.
Coloradans with commercial
insurance who report the doctor’s
office wasn’t accepting their
type of insurance.

24
Access to an emergency department (ED) can provide peace of mind. But it is an expensive place to get health care, particularly if it’s not an emergency or if there are more appropriate care options. The percentage of Coloradans who visit an ED — 21.8 percent — has held steady since 2009. In encouraging news, the percentage who say their ED visit was for a non-emergency is declining, falling to 36.4 percent in 2017 from 43.7 percent in
2009. For those who did use the ED even though they could have been treated in a doctor’s office, nearly three of four (72.4 percent) report a top reason was needing care outside of normal hours. About 36.5 percent of Medicaid enrollees use the ED, more than three times the rate of uninsured Coloradans. ED use among the uninsured, in fact, dropped to 10.9 percent in 2017 from 18.3 percent in 2009.
Emergency Department Use
2009
20.2%
43.7%2009
44.1%2011 41.1%
201340.2%
2015 36.4%2017
2011
22.3% 2013
19.5%
2015
21.7%2017
21.8%
Top Reasons for Non-Emergency ED Visits, 2017
STANDOUT STATISTICS
... But Non-Emergency ED Visits Are Declining*
Emergency Department Visits by Coloradans Aren’t Changing . . .
of Coloradans covered by individual insurance used the ED.
of Coloradans go to an urgent care center for their health care, double the rate in 2009.
14.5% 6.4%
Needed Care Outside of
Normal Hours
More Convenient
Unable to Get Appointment Soon Enough
Was Told By Doctor to
Go to ED
Increase in convenience as reason for ED visit for non-emergency from 2015 to 2017.72.4% 61.4% 59.0% 33.0%
8.6 POINT
* Percentage of ED users whose last visit was for non-emergency
ACCESS TO HEALTH CARE

2017 COLORADO HEALTH ACCESS SURVEY
25
General HealthColorado consistently ranks among the nation’s healthiest states, and 86.6 percent of Coloradans now report excellent, very good or good health — a figure that has stayed steady since 2009. Within Colorado, however, health disparities persist even after the policy reforms of the past decade. In 2017, the health of lower-income Coloradans is
little changed from 2015 and remains worse than those with higher incomes. About 14.4 percent of women report fair or poor health compared with 12.4 percent of men. Some regions and groups fare worse than others. People are more likely to report fair or poor health if they are older, Hispanic, enrolled in Medicaid or live on the Eastern Plains.
Lower Incomes, Worse Health,* 2017
Fair or Poor Health: Most Likely in Southeastern ColoradoREPORTED FAIR OR POOR GENERAL HEALTH STATUS, BY REGION
of Coloradans report excellent, very good or good health
STANDOUT STATISTICS
of Medicaid and CHP+ members report fair or poor health compared with 20.1 percent of Medicare members, 16.9 percent of the uninsured and 7.1 percent of people with employer-sponsored insurance.
of 50- to 64-year-olds report fair or poor health, the highest rate among age groups.
25.3%
23.8%
14.7%
7.5%
22.5%
0-138% FPL
139%-400% FPL
MORE THAN 400%FPL
HEALTH OF COLORADANS
86.6%
* Reporting fair or poor health
26
STANDOUT STATISTICS
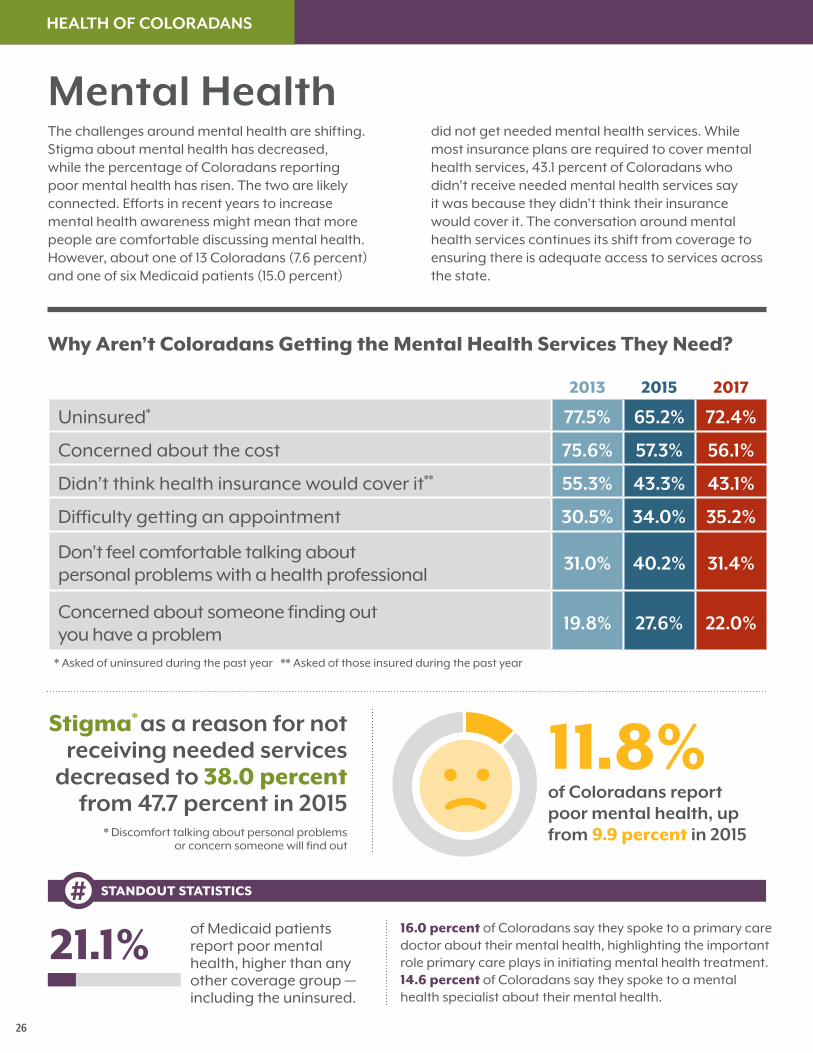
Mental HealthThe challenges around mental health are shifting. Stigma about mental health has decreased, while the percentage of Coloradans reporting poor mental health has risen. The two are likely connected. Efforts in recent years to increase mental health awareness might mean that more people are comfortable discussing mental health. However, about one of 13 Coloradans (7.6 percent) and one of six Medicaid patients (15.0 percent)
did not get needed mental health services. While most insurance plans are required to cover mental health services, 43.1 percent of Coloradans who didn’t receive needed mental health services say it was because they didn’t think their insurance would cover it. The conversation around mental health services continues its shift from coverage to ensuring there is adequate access to services across the state.
of Coloradans report poor mental health, up from 9.9 percent in 2015
2013 2015 2017
Uninsured* 77.5% 65.2% 72.4%
Concerned about the cost 75.6% 57.3% 56.1%
Didn’t think health insurance would cover it** 55.3% 43.3% 43.1%
Difficulty getting an appointment 30.5% 34.0% 35.2%
Don’t feel comfortable talking about personal problems with a health professional
31.0% 40.2% 31.4%
Concerned about someone finding out you have a problem
19.8% 27.6% 22.0%
* Asked of uninsured during the past year ** Asked of those insured during the past year
Why Aren’t Coloradans Getting the Mental Health Services They Need?
of Medicaid patients report poor mental health, higher than any other coverage group — including the uninsured.
16.0 percent of Coloradans say they spoke to a primary care doctor about their mental health, highlighting the important role primary care plays in initiating mental health treatment. 14.6 percent of Coloradans say they spoke to a mental health specialist about their mental health.
21.1%
11.8%Stigma* as a reason for not
receiving needed services decreased to 38.0 percent
from 47.7 percent in 2015* Discomfort talking about personal problems
or concern someone will find out
HEALTH OF COLORADANS

2017 COLORADO HEALTH ACCESS SURVEY
27
STANDOUT STATISTICS
Substance UseThe CHAS data underscore Colorado’s lack of adequate substance use treatment options. Some 67,000 Coloradans say they needed treatment for drug or alcohol use in the past 12 months but did not receive it. Likely, even more Coloradans need treatment but are not ready to seek it. Substance use treatment is an essential health benefit under the ACA, meaning that most insurance plans, including Medicaid, are required to cover it. Even so, more than half of the insured
Coloradans who aren’t getting the treatment they need say it’s because they don’t think their insurance will cover it. As expected, the uninsured are the most likely to not get needed substance use treatment, at 4.0 percent, but Medicaid enrollees follow at 2.9 percent. Colorado lost 880 people to drug overdoses in 2015, according to the Colorado Department of Public Health and Environment. Access to substance use treatment is critical to reducing that number.
say stigma about substance use kept them from receiving needed care.
59.2%
Cost Tops the List of Reasons Why People Did Not Receive Needed Substance Use Services67,000
Coloradansneeded but did not get services for alcohol or drug use
CommercialInsurance
Medicaid Uninsured
* Asked of those insured during the past year
41.3%
You did not feel comfortable talking with a health professional about your personal problems
43.9%
You were concerned about what would happen if someone found out you had a problem
20.5%You had a hard time getting an appointment
52.8%
You did not think your health insurance would cover it*
54.1%You were concerned about the cost of treatment
Percentage Not Receiving Needed Services
The 18- to 29-year-old age group had the highest percentage of those who didn’t receive needed services at 2.4 percent, followed by the 30-49 age group at 2.1 percent.
4.0%2.9%1.2%
28
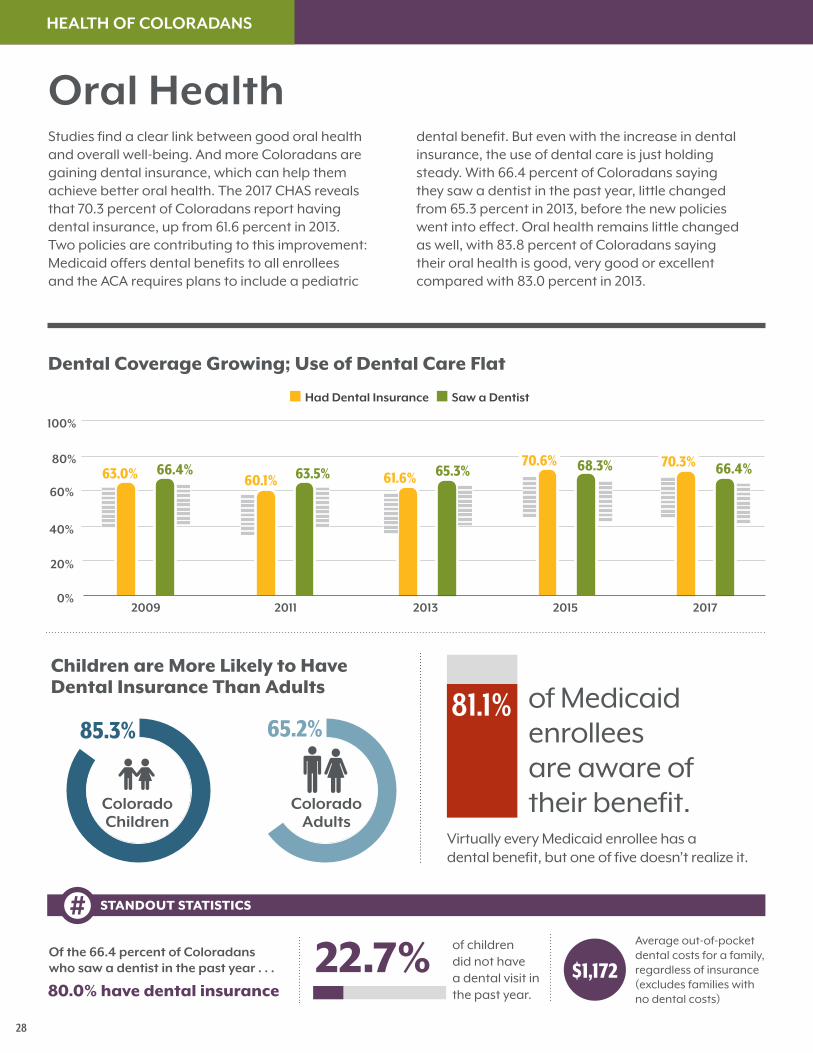
Oral HealthStudies find a clear link between good oral health and overall well-being. And more Coloradans are gaining dental insurance, which can help them achieve better oral health. The 2017 CHAS reveals that 70.3 percent of Coloradans report having dental insurance, up from 61.6 percent in 2013. Two policies are contributing to this improvement: Medicaid offers dental benefits to all enrollees and the ACA requires plans to include a pediatric
of children did not have a dental visit in the past year.
Average out-of-pocket dental costs for a family, regardless of insurance (excludes families with no dental costs)
22.7%
68.3% 66.4%
dental benefit. But even with the increase in dental insurance, the use of dental care is just holding steady. With 66.4 percent of Coloradans saying they saw a dentist in the past year, little changed from 65.3 percent in 2013, before the new policies went into effect. Oral health remains little changed as well, with 83.8 percent of Coloradans saying their oral health is good, very good or excellent compared with 83.0 percent in 2013.
Children are More Likely to Have Dental Insurance Than Adults
Dental Coverage Growing; Use of Dental Care Flat
2009 2011 2013 2015 20170%
20%
40%
60%
80%
100%
65.2%85.3%
STANDOUT STATISTICS
$1,172
n Had Dental Insurance n Saw a Dentist
63.0% 60.1% 61.6%70.6%
66.4% 63.5% 65.3%70.3%
Colorado Children
Colorado Adults
of Medicaid enrollees are aware of their benefit.
Virtually every Medicaid enrollee has a dental benefit, but one of five doesn’t realize it.
81.1%
Of the 66.4 percent of Coloradans who saw a dentist in the past year . . .
80.0% have dental insurance
HEALTH OF COLORADANS
2017 COLORADO HEALTH ACCESS SURVEY
29
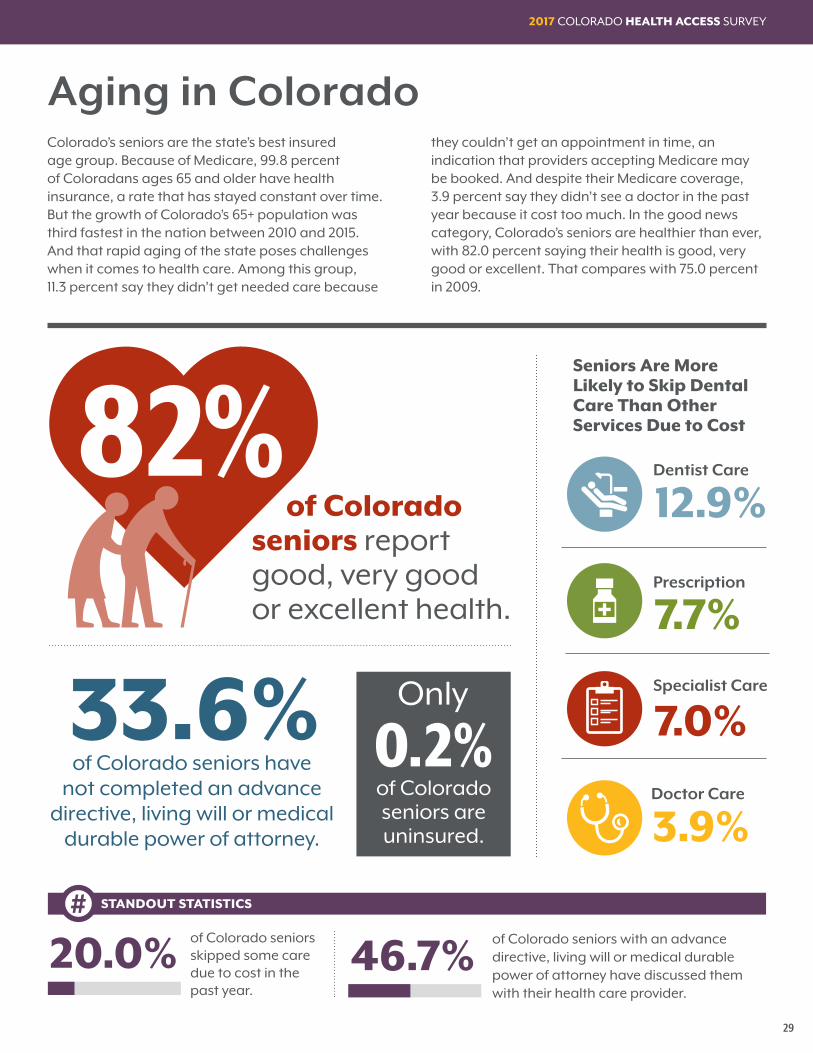
Colorado’s seniors are the state’s best insured age group. Because of Medicare, 99.8 percent of Coloradans ages 65 and older have health insurance, a rate that has stayed constant over time. But the growth of Colorado’s 65+ population was third fastest in the nation between 2010 and 2015. And that rapid aging of the state poses challenges when it comes to health care. Among this group, 11.3 percent say they didn’t get needed care because
they couldn’t get an appointment in time, an indication that providers accepting Medicare may be booked. And despite their Medicare coverage, 3.9 percent say they didn’t see a doctor in the past year because it cost too much. In the good news category, Colorado’s seniors are healthier than ever, with 82.0 percent saying their health is good, very good or excellent. That compares with 75.0 percent in 2009.
of Colorado seniors have not completed an advance
directive, living will or medical durable power of attorney.
Aging in Colorado
Seniors Are More Likely to Skip Dental Care Than Other Services Due to Cost
STANDOUT STATISTICS
of Colorado seniors skipped some care due to cost in the past year.
20.0% 46.7%of Colorado seniors with an advance directive, living will or medical durable power of attorney have discussed them with their health care provider.
of Colorado seniors report good, very good or excellent health.
of Colorado seniors are uninsured.
0.2%
82%
3.9%Doctor Care
7.0%Specialist CareOnly
7.7%Prescription
12.9%Dentist Care

30
HEALTH CARE VIEWS
Three of four Coloradans are happy with the state’s health care system, saying it meets the needs of their families. This is consistent with 2015 findings, when statewide happiness with the system increased to 74.6 percent from 69.1 percent in 2013. Coloradans covered by Medicaid are the most likely to say the system does a good job of caring for their families, at 81.0 percent. The uninsured are least likely at 33.8
percent. The percentage of those who think the system meets the needs of most Coloradans — a proxy for feelings about the ACA — dropped to 48.4 percent in 2017 from 51.2 percent in 2015. Only around one third (34.8 percent) of people in the individual insurance market, many of whom have seen their insurance premiums rise over the past years, think the health system is working for Colorado.
Views on the Health Care System
of Coloradans below the poverty level think the health care system meets the needs of all Coloradans, highest of any income group.
of Coloradans feel a doctor or other provider judged or treated them unfairly.
Agree that the Current Health System Meets Needs of ...
My Family All ColoradansEmployer- Sponsored
62.9% 7.0%
STANDOUT STATISTICS
Medicare
Medicaid
CHP+
Individual
Other
Uninsured
n 2013 n 2015 n 2017
80.5%
81.6%
80.4%
75.9%77.3%
81.0%
64.2%
74.6%
76.9%
62.3%
56.0%
60.0%
69.0%
63.9%
34.5%37.5%
33.8%
76.3%78.6%
79.5%
45.7%
49.1%
45.5%
48.4%
51.7%
49.1%
52.3%
61.9%
65.2%
42.7%
63.5%
66.9%
35.5%
41.1%
34.8%
41.0%
56.3%
14.1%
34.5%41.6%
32.4%
59.9%


The Colorado Health Institute is a trusted source of independent and objective health information, data and analysis for the state’s health care leaders. The Colorado Health Institute is funded by the
Caring for Colorado Foundation, Rose Community Foundation, The Colorado Trust and the Colorado Health Foundation.
303 E. 17th Ave., Suite 930, Denver, CO 80203 • 303.831.4200 coloradohealthinstitute.org
The Colorado Trust, a foundation dedicated to achieving health equity, provides funding for the CHAS. The Trust believes all
Coloradans should have fair and equal opportunities to lead healthy, productive lives regardless of race, ethnicity, income or where we live.
#2017CHAS