Embed Size (px)
Citation preview

Colorado Water » January 2020 I
Colorado WaterJune 2020
HYDROLOGY DAYS 2020

Features—Hydrology Days 2020
2
Cooperators include the Colorado State Forest Service, the Colorado Climate Center, and CSU’s Water Resources Archive.
The contents do not necessarily re�ect the views and policies of these agencies, nor does mention of trade names or commercial products constitute their endorsement by the U.S. Government and Colorado State University. CSU is an equal opportunity university.
Table of CONTENTS
On the cover
—Herbert Hoover National Historic SitePhoto courtesy of National Park Service
References can be found in the online version of this newsletter at watercenter.colostate.edu/water-news
Volume 37, Issue 2
Colorado Water is a publication of the Colorado
newsletter is devoted to highlighting water research and activities at CSU and throughout Colorado.
Published byColorado Water CenterReagan Waskom, Director
EditorsJulie Kallenberger, Sarah Millonig, and Emily Pantoja DesignAngelique Giraud
Production DirectorNancy Grice
Supported by
part by the U.S. Department of the Interior Geological Survey, through the Colorado Water Center; College of Agriculture, Warner College of Natural Resources, Agricultural Experiment Station, and Colorado State University Extension.
watercenter.colostate.edu
40th Annual AGU Hydrology Days Conference Presentations
Remembering Dr. Jorge A. Ramírez: Contributions to Hydrological Sciences and Engineering By Jose D. Salas and Matthew C. Carney
Fresh Snow Density from the Fort Collins Colorado Meteorological Station and New MeasurementsBy Marcee Meinhardt and Steven R. Fassnacht
Options for Optimizing Limited On-Farm Irrigation in the Northern Great Plains By Louise H. Comas, Sean M. Gleason, Thomas J. Trout, Jon Altenhofen, Huihui Zhang, Kendall C. DeJonge, and Kyle R. Douglas-Mankin
Comparing the Field-Level Profitability of Irrigated Cropping Activities for Temporary Water LeasesBy Daniel Mooney, Joey Blumberg, and Timothy Kelley
Fort Collins’s Forgotten Flood By Tristan Purdy
The Hydro-Social Implications of Water Metaphors in Poetry: Transmogrification Challenges in an Example from the Medieval Spanish RomanceroBy Mackenzie C. Warden, Steven R. Fassnacht, and Jonathan E. Carlyon
3
10
7
12
16
18

Hydrology Days Committee LETTER
Mazdak ArabiChair, AGU Hydrology DaysDirector, One Water Solutions Institute
Colorado Water » June 2020 1
n the face of the 2019 novel Coronavirus pandemic, the 40th Annual AGU Hydrology Days meeting was held online. The platform provided support to our vibrant water-related research community and leading scientists in the field.
The sessions were extraordinarily successful with not only cutting-edge research presentations, but also participation by highly engaged audiences from interdis-ciplinary fields. The two-day online conference was attended by 179 participants from over 33 organizations, including 10 academic institutions, two international institutions, five federal agencies, five local governmental agencies, four
non-profits organizations, and several private/consulting firms. The program o�ered 21 webinar presentations covering interdisciplinary topics, including 14 student presentations.
Abstracts presented during the webinar on April 13-14, 2020 have been published online in the 2020 Hydrology Days proceedings. The technical program is available on CSU Mountain Scholar for citation and webinar recordings are available on the Hydrology Days website. Our gratitude goes to everyone who attended. It would not have been successful without your support.
The organizing committee looks forward to March 8-10, 2021 during which time we hope to resume the meeting in-person and continue to enhance our vibrant research community. The committee plans to retain the award-winning, world-class keynote speakers. Presenters are invited to resubmit their abstracts for consideration in the 2021 event.
In Memory: Jorge Alberto RamírezOur esteemed colleague and dear friend Dr. Jorge Alberto Ramírez, professor of Civil Engineering at Colorado State University (CSU), passed away on March 28, 2020 in Fort Collins, surrounded by family. He was 65 years old.
For nearly 20 years Dr. Ramírez served as the organizer of the internationally recognized Hydrology Days Conference which brings world renowned experts to the CSU campus each spring semester. He took on Hydrology Days and raised the bar to serve students and University partners at a higher level.
Over three decades of service to CSU, Dr. Ramírez led numerous research, education, and training e�orts to establish CSU as a leader in water science and technology. His academic scholarship substantially expanded the University’s research reputation in the fields of hydrology, hydrometeorology, and water resources planning and management, benefitting not only CSU students and his fellow faculty members, but the profession as a whole.
Ramírez Memorial ScholarshipJorge will be deeply missed but lives on forever in our hearts and minds. A memorial scholarship for Dr. Ramírez is being created for Civil and Environmental Engineering graduate students at CSU. The scholarship will create a legacy in Ramírez’s name that will benefit students and advance the fields to which he devoted his life.
Adapting to Change and Navigating the Challenging Waters of COVID-19 Adapting to Change and Navigating the Challenging Waters of COVID-19

2 Colorado Water » June 2020
40th Annual AGU Hydrology Days Conference Presentations
April 13 - 14, 2020
Name of Presenter Presentation Title A�liation
Daniel Mooney Comparing the Field-Level Profitability of Irrigated Cropping Activities for Temporary Water Transfers Colorado State University
Kyle Douglas-Mankin A Vision for Water-Limited Agroecological Systems Research USDA - Agricultural Research Service
Joseph Pugh Quantifying Uncertainty in the Measurement of Turbulent Flows to Enhance Water Resource Management Colorado State University
Alireza Fakhri Large-Scale Particle Image Velocimetry for Determining Vena Contracta Dimensions in Contracted Channels Colorado State University
Daniel White Range-Wide Habitat Assessment of Greenback Cutthroat Trout Under Altered Hydrologic Flow Regimes Colorado State University
Eric Roads Quantifying the Mass of Contaminants in Low-K Zones from Cryogenically Frozen Cores Colorado State University
Joseph Binder Developing a Method to Measure and Predict Moisture-Variable Soil Strength Colorado State University
Joel Sholtes The Potential for Restoring Thermal Refuges in Rivers for Cold-Water Fishes
Colorado Mesa University & University of Colorado Boulder
Meshal Alothman Improving Spatially Distributed Travel Time Methods for Hydrograph Prediction by Better Accounting for Upstream Flow Contributions
Colorado State University
Hadi Heidari Assessing the Impacts of Climate Changes on the Regional Hydroclimatic Conditions of U.S. River Basin Over the 21st Century Colorado State University
David Woodson Temperature Informed, Mid-Term Flow Forecasts for the Upper Colorado River University of Colorado Boulder
Jessica Seersma Hydraulic Modeling Approaches and Challenges for Complex Floodplain Analysis of Cascading Dams within a Canal Colorado State University
Katie Knight Using Dual-Drainage Modeling to Assess the Impact of Green Stormwater Infrastructure Networks on Events of Roadway Flooding
Colorado State University
Landon Marston Mapping and Modeling of lnterbasin Water Transfers within the United States Kansas State University
Ryan McManamay Development of a Long-Term Back-Casted Dataset of Water Use for Agriculture, Electric Power, and Public Supply Sectors in the Conterminous United States
Baylor University
Elsa Culler A Data-Driven Approach to Identifying Post-Fire Landslide Triggers University of Colorado Boulder
Elaina Passero Decision Support System Evaluating Habitat in Alternative Flow Scenarios Colorado State University
Mahshid Ghanbari Increasing Risks of Compound Flooding under Climate Change and Sea Level Rise Scenarios Colorado State University
Megan Fowler Predictability of Soil Moisture in Northern California University of Colorado Boulder & NOAA ESRL/PSD
Marcee Meinhardt The Density of Fresh Snow in Fort Collins, Colorado USA Colorado State University
Steven Fassnacht How Do We Define Climate Change? Considering the Temporal Resolution of Niveo-Meteorological Data Colorado State University

Contributions to Hydrological Sciences and Engineering
Remembering Dr. Jorge A. Ramírez:
Jose D. Salas, Colorado State UniversityMatthew C. Carney, Bechtel Corporation
▼
nown as “Jorge” to his fellow faculty members and his students at Colorado State University (CSU), Professor Jorge A. Ramírez taught and
inspired a generation of hydrologists and water resourc-es engineers and scientists in diverse subjects including physical hydrology, hydrometeorology, climate science, agricultural and soil science, engineering hydrology and hydraulics, eco-hydrology, geosciences, natural resourc-es, and water resources planning and management. Jorge graduated with a Civil Engineering degree from the National University of Colombia, Medellin, and with master’s and doctoral degrees from Massachusetts Institute of Technology (MIT). Prior to joining the faculty of the Civil and Environmental Engineering department at CSU in 1990, Jorge conducted post-doctoral research at MIT and served as a hydrology consultant to NASA in Huntsville, Alabama.
Jorge’s research interests have been both varied in scope and profound in their implications. Through the years, Jorge was steadily productive, writing many refereed journal publications and chapters of books and handbooks. He often co-authored with graduate students and collaborators and has been frequently cited in the literature. A few examples of his research with his graduate students and other collaborators are summarized here.
Jorge and Dr. Mike Hobbins of NOAA, then a graduate student from the United Kingdom, overturned previously held assumptions regarding evapotranspiration (ET) and potential evapotranspiration (PET) and developed a new estimation procedure for ET enabling estimation of this component of the hydrologic cycle across regional scales and in arid and humid regions without regard to remotely sensed data or local calibration of parameters. Additionally, Ramírez and Hobbins demonstrated that PET is declining across the conterminous United States (CONUS), clarified the oft-quoted evaporation paradox (e.g., PET declines as temperature increases), and opened the way for a rigorous examination of the e�ects of hydrometeorological variability on the land surface. Furthermore, they highlighted the danger of using temperature-based PET estimates and demonstrated that the relationship between ET and a fully physical PET
changes across the hydrologic spectrum. More recently, a rigorous decomposition of the variability of fully physical PET across CONUS and the globe showed that wind speed dominates the variability of PET more than temperature in many arid regions. Their work has also resulted in developing a new drought index that provides early warning and decision support to drought-a�ected
Colorado Water » June 2020 3
Jorge Ramírez at his recognition ceremony at Hydrology Days 2019. Photo courtesy of John Eisele, CSU Creative Services.

Figure 1. Luncheon at the Awards Reception of the Environmental and Water Resources Institute of the American Society of Civil Engineers (EWRI/ASCE) World Congress in Pittsburgh, PA, 2019. Shown in the picturearound the table (left to right) are Judith Sunantara, Jorge Ramírez, his three sons (Sebastian, Alejandro, and Felipe), Antonino Cancelliere, and Jose Salas. Photo courtesy of Jose Salas and Matthew Carney.
Colorado Water » June 20204
adopted worldwide, particularly in arid and food-insecure regions. Relevant publications related to the subject include Hobbins et al., (2001a, 2001b, 2004) and Ramírez et al. (2005).
Early on as a graduate student at MIT, one of Jorge’s first insights was into the nature of thunderstorms (cumulus clouds), which he recognized were regularly spaced as opposed to the previously presumed cluster-ing. He showed that the regular spacing was a conse-quence of the e�ect that cumulus clouds have in stabilizing the atmosphere in their vicinity, thereby reducing the potential for further cumulus clouds to form. Working with Dr. Rafael Bras, his academic advisor at MIT, Jorge investigated the potential of Neyman-Scott cluster models to optimize irrigation scheduling using measured soil moisture, available irrigation water, and time since the last rainfall occurrence. Subsequently at CSU, working with then-graduate student Judith Sunan-tara of Indonesia, this work was extended to include optimal seasonal multi-crop irrigation water allocation and optimal stochastic intra-seasonal irrigation schedul-ing. This was achieved using a two-stage decomposition approach based on a stochastic dynamic programming methodology. The improved method was demonstrated in a case study in Colorado’s San Luis Valley (Sunantara and Ramírez, 1997).
Professors Ramírez and Salas, co-principal investiga-tors of a USAID project in Egypt, conducted several hydrologic studies of the Nile River system. Jorge and
Dr. Peter Molnar of the Swiss Federal Institute of Tech-nology in Zurich, then a graduate student from Slovakia, analyzed the operations of the Nile River using a computer model of the system developed at CSU. In another study, Peter and Jorge studied trends in precipi-tation and streamflow in the Rio Puerco Basin in New Mexico and examined how streamflow trends may influence or be influenced by changes in channel erosion (Molnar and Ramírez, 2001). Furthermore, investigating the e�ects of energy dissipation on channel properties of a river network, they found that the rate of energy dissipation per unit channel area is maintained nearly constant throughout river networks. Extending the groundbreaking work of Leopold and Maddock, Peter and Jorge proposed that this is evidence of a hypothesis of local optimality which explains the average behavior and adjustment of channel characteristics in natural river systems (Molnar and Ramírez, 1998a and 1998b).
Likewise, Jorge and Professor Boosik Kang of Dank-ook University, then a graduate student from South Korea, studied the response of streamflow to weather variability under climate change in the Colorado Rockies, finding that the relative impact of long-term rainfall variation associated with climate change on total runo� and peak flow can be much greater than the magnitude of the rainfall variation itself, and that the magnitude of the impact depends strongly on the magnitude of the associated change in ET (Kang and Ramírez, 2010).

Jorge and Professor Fritz Fiedler of the University of Idaho, then a graduate student from New Hampshire, developed a numerical method based on the MacCor-mack finite di�erence scheme for simulating two-dimen-sional discontinuous shallow flow over an infiltrating surface. Their method accounted for spatially varying infiltration rates and enabled the e�ects of microtopog-raphy on overland flows to be simulated using hydrody-namic flow equations. The method was verified against a high-resolution data set collected on plots of semi-arid grassland in northeastern Colorado. These investiga-tions revealed that small-scale surface interactions, i.e. the so-called “run-on” phenomenon, are a significant component of the observed e�ects of grazing, as well as a factor in the hydrologic response of grasslands (Fiedler et al, 2002). Following this work, Jorge and Dr. David Ra� of the U.S. Bureau of Reclamation, then a graduate student, developed a new model for hillslope hydrology using the over-land flow equations, Richards equation for infiltration, and a sediment detachment and transport component. Their research also compared results of analytical, numerical, and physical experi-ments (Ra� and Ramírez, 2005).
Jorge and Dr. Sharika Senarath, then a graduate student from Sri-Lanka, developed a statistical-dynamical
parameterization of vegetation canopy interception at the regional scale—such as that of global climate models—to account for spatial variability of rainfall intensity and precipitation depth as well as leaf surface and vegetation cover. This parameterization was incor-porated into a soil-plant-atmosphere model based on the physical parameterizations used in the National Center for Atmospheric Research Community Climate Model (Ramírez and Senarath, 2000). Subsequently, Jorge and the late Dr. John Kochendorfer, then a gradu-ate student from Illinois, developed a monthly operation-al version of Eagleson’s seminal statistical-dynamical water balance model called the Statistical-Dynamical Ecohydrology Model (SDEM). The tool’s capability to characterize the seasonal dynamics of the local-scale soil-water balance was confirmed for two grassland sites in the U.S. Great Plains. The SDEM model provides a framework for studying the controls of soil texture and climate on vegetation density and evapotranspira-tion (Kochendorfer and Ramírez, 2005; 2008a, 2008b; 2010a, 2010b).
Jorge, Dr. Romano Foti, then a graduate student from Italy, and Dr. Tom Brown of the USDA’s Rocky Mountain Research Station, quantified the vulnerability of the water supply to shortages for the CONUS through the 21st century. They developed a framework to quantify and propagate water supply and water demand variability and uncertainty. The framework accounted for four sets of paramaters: 1) land-surface and atmosphere interac-tions, 2) climate and soil moisture controls on vegetation, 3) optimal management of water resources across the U.S. water network, and 4) environmental and socio-eco-nomic feedbacks and drivers of climatic variability and change. Their study projected that the Southwest region, High Plains region, and California would be the most vulnerable areas of the U.S. to water supply shortages in the 21st century, and that the increase in vulnerability to shortage in most of the U.S. is influenced more by changes in water supply than changes in water demand. This study received the Colorado Governor’s Recogni-tion Award for High Impact Research (Brown, et al., 2013; Foti et al. 2014a and 2014b).
In another study, Romano and Jorge developed an explicit mechanistic model for the formation and evolu-tion of self-organized vegetation patterns in arid landscapes. They validated the model on naturally formed patterns in Niger and Somalia and provided a detailed analysis of the sensitivity of the patterns’ characteristics to climate and hydraulic parameters, showing that run-on infiltration and facilitation/inhibition feedback among adjacent vegetation groups are the primary drivers of the phenomenon (Foti and Ramírez, 2012). Furthermore, Quebbeman and Ramírez studied the photosynthesis process and fluxes of carbon dioxide and water vapor in the terrestrial biosphere. Assuming that a limited amount of leaf nitrogen is allocated optimally in the various components of the photosyn-thetic system, the approach enables researchers to
Colorado Water » June 2020 5
Jorge Ramírez giving a presentation at Hydrology Days 2019. Photo courtesy of Hydrology Days planning committee.

Figure 2. During Hydrology Days 2006 (left to right) are Jose Salas, David Tarboton, Elfatih Eltahir, John Kochendorfer, Oli Sveinsson, Shafiqul Islam, Rafael Bras, and Jorge Ramírez. Photo courtesy of Jose Salas and Matthew Carney.
to ascribe the response of leaf-level photosynthetic capacity to varying environmental and resource supply conditions and provides improved estimates of carbon and water fluxes in the soil-plant-atmosphere continuum (Quebbeman and Ramírez, 2016).
Jorge, Dr. Ernesto Trujillo of University of California Merced, then a graduate student from Colombia, and Dr. Kelly Elder, a CSU collaborator, studied the scaling characteristics of the spatial distribution of snow depth in mountain environments, finding that snow depth exhibits self-a�ne behavior with power-law scaling over two distinct spatial regimes. They concluded when snowfall interception is a dominant control of snow distribution, vegetation characteristics determine the break in scaling behavior. When snow redistribution by wind is dominant, the interaction between winds, topography, and vegeta-tion determine the behavior. This work has implications for how snow is represented in hydrological models. Mountain snowmelt is the predominant source of water supply in many arid and semi-arid areas of the western U.S. (Trujillo et al., 2009).
The outstanding quality of Jorge’s teaching and research has been recognized with many awards from CSU including the 2012 Professor of the Year Award from CSU’s Honors Program and the 2011 George T. Abel Research Excellence Award from the Walter Scott, Jr. College of Engineering. The American Geophysical Union (AGU) recognized him for excellence in referring papers submitted to Water Resources Research (WRR) and the WRR Editor’s Choice Award in 2014. Further-more, the Environmental and Water Resources Institute (EWRI) of the American Society of Civil Engineers (ASCE) recognized him with two Best Research Paper Awards in 1997 and 2004 and EWRI/ASCE awarded Dr. Ramírez with the 2019 Arid Lands Hydraulic Engineering Award (Figure 1). However, past awards do not capture the essence of Jorge’s most important traits: setting the gold
standard for excellence in teaching—Jorge’s thorough preparation for and perfection in teaching each of his classes is legendary at CSU—while incorporating the most exciting and thought-provoking research findings into each class he taught. He also inspired students with his spirit for discovering the unknows and reaching new heights.
Another of Jorge’s major contributions is the annual AGU Hydrology Days conference at CSU, which he organized with the help of other CSU faculty for almost 20 years. Each year this conference has brought togeth-er many prominent hydrologic and water resources engineering researchers to speak at CSU and provide great inspiration, opportunity, and motivation to partici-pating students, water scientists, and engineers. Past speakers have included Rafael Bras, Wilfried Brutsaert, Dara Entekhabi, Efi Foufoula-Georgiou, Ignacio Rodri-guez-Iturbe, Dennis Lettenmaier, Jean-Yves Parlange, George Pinder, Andrea Rinaldo, Jose Salas, Stanley Schumm, Vijay Singh, Richard Vogel, Upmanu Lall, Renzo Rosso, Steve Burges, and many others (Figure 2).
Thank you, Jorge, for your many contributions.
Your legacy will be remembered for years to come.
Colorado Water » June 20206

Fresh Snow Density from the Fort Collins Colorado Meteorological Station and New Measurements
Fresh Snow Density from the Fort Collins Colorado Meteorological Station and New Measurements
Marcee Meinhardt, Fish, Wildlife & Conservation Biology, Colorado State UniversitySteven R. Fassnacht, Ecosystem Science and Sustainability and Natural Resources Ecology Lab,
Colorado State University, Cooperative Institute for Research in the Atmosphere
IntroductionSnow depth (ds) is a snowpack property that is easy to understand and measure. However, the depth of snow does not tell the whole story. From a water resources perspective, we want to know how much water is stored in the snowpack. This is snow water equivalent (SWE), and historically, snow depth measurements have been converted to SWE using a standard 10:1 ratio, equating to a fresh snow density (ρs-fresh) of 100 kg/m3. Past research, such as the Hedstrom-Pomeroy 1998 (HP98) equation that is used extensively in the literature, has correlated fresh snow density (ρs-fresh) with air temperature (Ta), illustrating that ρs-fresh decreases as the air temperature gets colder. Our research focused on SWE of freshly accumulated snow with three objectives: 1) use over 100 years of local daily meteorological data to evaluate Ta and ρs-fresh patterns over the year, 2) explore the correlation between Ta and ρs-fresh, and 3) compare snow-fo-cused data collected in 2019-2020 to the local historic data.
Study AreaThis research used local data from Fort Collins, Colorado at an elevation of 5,000 feet (1,500 meters). While the snowpack is intermittent in Fort Collins and
across the eastern Plains of Colorado, most winters include six or more substantial snowfall events. However, at many locations snow depth is measured, but not SWE, unlike at the high elevation snow telemetry stations located across the Southern Rocky Mountains and the western U.S.
MethodologyThis research study used daily meteorological data recorded at the Colorado State University meteorological station since 1889. Data were acquired from NOAA’s National Centers for Environmental Information, and included daily maximum and minimum air temperature, precipitation, and snowfall. Here, snowfall is defined as the depth of fresh snow measu- red manually when snow occurred.
The first step was data quality control to identify and remove erroneous data points. No such days were identified as this dataset was quality controlled prior to archiving. We only evaluated days when a snowfall occurred, so all other days were removed. Mean daily air temperature was computed from average of the daily maximum and minimum temperatures. SWE was not recorded until recently at the meteorological station, so precipi-tation measurements were used to represent SWE. The daily ρs-fresh
was calculated as the ratio of SWE to ds. Initially, daily ρs-fresh was plotted versus Ta for all snowfall events, then the mean of each variable was computed per calendar day. As has been done in other climatic environments, a best fit curve was found for the ρs-fresh vs. Ta data.
Colorado Water » June 2020 7
Figure 1. During an April 2020 snowfall event in Fort Collins, Marcee Meinhardt measures SWE by weighing the snow in the fresh snow sampler.

We conducted manual measure-ments of SWE and ds with a fresh snow sampler in Fort Collins during five snow events that occurred during the 2019-2020 winter (Figure 1). We noted the start and end time for each snowfall event, and the time of sampling. Air temperature was recorded at 10-minute intervals near the sampling site. Storm mean, maximum, and minimum tempera-tures were computed. The ρs-fresh per snowfall event was computed as above. Since multiple samples were collected, the mean, maxi-mum, and minimum ρs-fresh were computed. These new field measurements were compared to the daily meteorological station derived data.
ResultsIn total, there were 2,390 snowfall observations recorded during the 100+ year historic dataset. Although there were ample amounts of snowfall events, only about 10% of them reflected the 10:1 ds to SWE ratio (100 kg/m3) with most ρs-fresh values being less dense than 10:1 (Figure 2a).
Over the course of the colder months, there is a pattern of Ta decreasing until mid-January then a steady increase (Figure 2b), but with much daily variation. The pattern of ρs-fresh over the cold months is quite similar to that of Ta (Figure 2c), and the best fit lines have corre-sponding shapes. Thus, there is a decrease in ρs-fresh with decreased
Ta (Figure 3). There is much scatter and a best fit curve had a coe�cient of determination (R2) of only 0.13: ρs-fresh(all) = 83.1 + 3.31xTa + 0.13xTa
2.When the historic data were
averaged per calendar day and several outliers (ρs-fresh<20 and ρs-fresh> 250 kg/m3) were removed, the best fit curve between ρs-fresh versus Ta was: ρs-fresh(mean) = 131 + 10.7xTa + 0.5xTa2, with a coe�cient of deter-mination of 0.39, and the fit was statistically significant at the p<0.01 level (Figure 4). The local snow field data collected from the 2019-2020 winter was plotted with error bars denoting the maximum and minimum temperature over each snowfall event (Figure 4).
Colorado Water » May 2020
Figure 2. a) The number of fresh snow observations per month categorized by those denser than, equal to, and lighter than 100 kg/m3, b) the pattern of daily mean air temperature with day of year during snowfall events, and c) the pattern of fresh snow density with day of year during snowfall events.
Colorado Water » June 20208

DiscussionWhile air temperature and fresh snow density varies daily, both follow a similar monthly “hap-py-faced” pattern (Figure 2b and 2c). The two variables are correlat-ed, but with much noise (Figure 3). When ρs-fresh and Ta are averaged to the calendar day, the result is a significant correlation that is similar to previous research, such as the HP98 equation (Figure 4). The HP98 equation illustrates a lower fresh snow density for a specific tempera-ture than we found from the mean daily Fort Collins meteorological data, but higher fresh snow density when compared to using all snowfall data. This is interesting since the HP98 equation is based on ρs-fresh measurements taken in wetter environments (Diamond-Lowry, 1953; Schmidt-Gluns, 1991). The five meas- urements taken in 2019-2020 lie between the ρs-fresh (all) and HP98 curves (Figure 4). However, the air temperature varied up to 6.5 oC over the course of individual snowfall events.
To improve the ρs-fresh vs. Ta correlation, variation in air tempera-ture and other meteorological variables, such as humidity and wind speed, could be considered. Fine resolution meteorological modeling should improve ρs-fresh forecasting
through the use of simulated atmospheric profiles, but such model data are not readily available. Regardless, manual on-the-ground measurements are necessary to develop and evaluate fresh snow density estimates.
Figure 4. Fresh snow density versus air temperature averaged per calendar day.
Colorado Water » May 2020 33
3
Figure 3. Fresh snow density versus mean air temperature for all recorded snowfall events at the Fort Collins, Colorado meteorological station based on daily observations.
Colorado Water » June 2020 9

ield corn is the preferred agronomic crop for many irrigated farms in the Northern
Great Plains, but many farms do not have enough irrigation water to maximize yield on all acres in all years. Grain yield drops quickly with the reduction in water when crop water use is below 80% of the water needed to produce maximum yield (Comas et al., 2019) (Figure 1). Current grain and water prices and production costs result in net farm income losses with limited irrigation unless income is supported in other ways, such as through incentives for deficit irrigation, Alternative Transfer Methods (ATMs), and water leases (Manning et al., 2018; Trout and Manning, 2019).
There are a few options for farms, depending on when the shortfall in water supply is realized, and more
options if incentives or water leases are included. Additionally, alterna-tive crops that require less irrigation and at di�erent times than the critical periods needed by corn may also help optimize limited agricultural water.
Planning to Use Less IrrigationRegulated deficit irrigation (RDI) are strategic irrigation shortfalls within the season during targeted growth stages. To a degree, RDI can maintain economic yields while saving crop water use. After plants are established, the most critical
growth period to apply irrigation for corn is during pollination and early seed set, followed by the grain filling as the second most critical period, after kernel milk stage but prior to maturity. We achieved similar yield to fully irrigating with approximately 17% less crop water used by applying targeted irrigation shortfall in the last half of the vegetative stage (the 5-week period prior to tassel) (Figure 1). In 2019, grain corn sold at about $4/bushel, netting about $2/bushel per Colorado State University produc-tion cost tables. Incentives at $350/acre-foot of the 17% saved water and maintaining yield would give producers a 30% increase in net profit over fully irrigating.
Many producers, however, lack flexibility to apply RDI. Sprinkler systems often lack the capacity to
Options for Optimizing Limited On-Farm Irrigation in the
Northern Great Plains
Options for Optimizing Limited On-Farm Irrigation in the
Northern Great PlainsLouise H. Comas, Sean M. Gleason, Thomas J. Trout, Huihui Zhang, Kendall C. DeJonge, and
Kyle R. Douglas-Mankin, USDA, Agricultural Research Service, Water Management and Systems Research UnitJon Altenhofen, Northern Colorado Water Conservancy District
Colorado Water » June 202010
Field corn growing at the USDA-ARS Limited Irrigation Research Farm in Greeley, CO under full and limited irrigation. Photos courtesy of L. Comas, K. DeJonge, C. Hunter, T. Trout, K. Yemoto, Agron.Missouri.

Colorado Water » May 2020Colorado Water » May 2020
refill the soil in a short period of time after the corn root zone is substan-tially depleted; but producers could perhaps apply RDI if irrigation capacity could be increased. Furrow systems require water to reach the end of the field, but producers could achieve RDI by supplying fewer irrigations, assuming these irriga-tions can be accommodated by the ditch schedule.
Alternatives to RDI When Short-falls are Known Prior to PlantingIf a farm needs to use less water, fully irrigating a smaller portion of a farm in field corn may be economi-cally and logistically preferable to RDI, but producing an alternative crop on the remainder of the farm could o�set some of the drawbacks
of fallow (such as weed manage-ment) or otherwise contribute towards fixed land costs (Trout and Manning, 2019). Silage corn uses less water because its season is shorter by about one month or more. Sorghum is one alternative since it’s planted on a similar row spacing as corn, but it has a shorter season. Maximum grain sorghum yield in Greeley, CO required approximately 65% of the crop water use of field corn, with forage sorghum using even less water.
Likewise, dry beans and wheat use less water than corn due to their shorter season, but they also require di�erent equipment. Other options include grain or hay millet, which is extremely productive with little water in a short season,
although it’s typically planted on a similar spacing to wheat. Grain millet currently has a limited market, but it stores well and has had price peaks at recurrent intervals. Hay crops can provide additional opportunities, especially if used on the farm. Alternatively, hay production would need to meet quantity needs of large cattle operations.
Options When Unplanned Water Shortfalls Occur After PlantingSignificant yield losses can occur when corn is fully irrigated through the first half of the growing season but has limited irrigation during grain fill. If there is risk of irrigation shortfall later in the season and flexibility in irrigation scheduling, it may be prudent to reduce applica-tions during the late vegetative period rather than risk irrigation shortfall at the end of the season (Comas et al., 2019) (Figure 1).
ConclusionIrrigation shortfalls can be used strategically, to a degree, to save agricultural water or to serve as important bu�ers from worse yield losses resulting from late-season shortfalls. However, if water shortag-es are anticipated, planting corn on a smaller portion of the farm and alternative or short-season crops (if late-season shortfalls are expected) on the remainder may be optimal.
Economic models based on crop water productivity and cost analyses provide guidance on the prices needed to augment farm income for profitability (Manning et al., 2018; Trout and Manning, 2019) and to inform ATMs and Augmented Deficit Fallowing programs. Assistance for optimizing on-farm water use, such as the Natural Resources Conserva-tion Service Agricultural Manage-ment Assistance program, may also provide improved irrigation flexibility. Ultimately, economic models that can evaluate multiple options and diverse solutions will be useful tools for decision-making considering the volatility of the prices and costs involved.
Figure 1. The relationship between harvested corn grain yield and annual evapo-transpiration (ET) used by the cropping system from planting to grain maturity. Each point represents data from an average of four treatment plots. Color-coded treatments display percentage of irrigation less than full for late vegetative period/grain fill period. Blue arrows highlight treatments with water savings (approximately 17%) that maintained full yield (treatment 65/80). Red brackets highlight treatments with similar water use but less yield due to water shortages at the end of the season during grain-filling. The numbers in bold under these points give actual ET during the targeted stress periods.
Colorado Water » June 2020 11

Comparing the Field-Level Profitability of Irrigated Cropping Activities for
Temporary Water Leases
Comparing the Field-Level Profitability of Irrigated Cropping Activities for
Temporary Water LeasesDaniel Mooney and Joey Blumberg, Agricultural and Resource Economics, Colorado State University
Timothy Kelley, New Mexico Public Regulation Commission
Colorado Water » June 202012
IntroductionColorado’s 2015 Water Plan calls for 50,000 acre-feet of agricultural water sharing by 2030 through alternative transfer methods (ATMs). Currently, water is perma-nently leaving farmland through “buy and dry” transactions in which municipalities or others purchase farms for the attached water rights. ATMs seek to expand voluntary transfers via temporary leases where water remains attached to the farmland, thus mitigating agricultural dry-up while helping
meet the needs of growing urban populations.
To evaluate potential farm responses to ATMs, we developed a framework to compare the profitability of irrigated cropping activities for temporary water transfers. In doing so, we account-ed for di�erences in water leasing potential and economic risk. We illustrate the framework here by presenting a field-level case study of 13 alternate cropping activities typical for eastern Colorado.
Case StudyWe considered a farm with water rights on a 136-acre center pivot. Figure 1 shows the estimated Consumptive Use (CU) for di�erent crops. For example, one acre of corn requires an estimated 23.9 inches per season, with around 60% from irrigation, and CU for the full pivot is about 270 acre-feet. We further assume the farm obtained an Agricultural Water Protection (AWP) Water Right to lease water.
The case study compared the field-level profitability of 13 irrigated
In Colorado, water connected to the prior appropriation system must be put to beneficial use or the water right holder risks having their allotment reduced. In agriculture this has traditionally meant using surface water or tributary groundwater for irrigated crop production. The 2016 Colorado House Bill 16-1228 created what are known as Agricultural Water Protection (AWP) Water Rights. These rights allow farms with senior irrigation rights in eastern Colorado (Water Divisions 1 or 2) to lease up to 50% of their Historic Consumptive Use (HCU) to other types of beneficial use within the same division and for up to three years. The portion that remains on the farm is used for irrigated crop production.

cropping activities di�ering by crop, harvest, and irrigation treat-ments. The resulting pivot configu-rations (Figure 2) and estimated CU savings (i.e. water available for lease) (Figure 3) were examined. The 13th activity is primarily rainfed grass hay on the full pivot (not shown).
Configurations are based on an HCU of 270 acre-feet, up to half being transferrable. Rotational fallow limited irrigated crops to two-thirds of the land area under full irrigation, with the remainder in hay. Fully-irrigated alfalfa has a higher CU than corn, so only 45% of the pivot could be used when managed for three cuts to remain within the Historic Consumptive Use (HCU). Note that grass hay achieves a modest yield in eastern Colorado under primarily rain-fed conditions.
CU savings in Figure 3 arise from several sources. Fallowing reduces irrigation area, deficit irrigation reduces CU to 80% of full irrigation, and early harvest reduces CU if evapotranspiration (ET) is terminat-ed thereafter. For example, corn for silage can be harvested about one month earlier than grain. Terminat-ing ET after two cuts of alfalfa similarly provides savings.
For primarily rain-fed grass hay, the maximum transfer of 50% HCU (135 acre-feet) was possible. Estimated CU from precipitation and soil water sources was only 121 acre-feet, implying that 14 acre-feet (1.2 inches/acre) of irrigation remain available. For consistency, we accounted for this same depth in all grass hay areas.
MethodsWe obtained risk-adjusted profitabil-ity estimates called ‘certainty equivalents’ (CE, $USD) and breakeven water prices (WP, $USD/acre-foot) by activity using stochastic budgeting methods.
First, we analyzed distributions of precipitation, yields, and prices for 2000–2017. Second, we simulated net returns above variable costs (NR, $USD) and risk premiums (RP, $USD) for crop production,
Colorado Water » May 2020Colorado Water » June 2020 13
Figure 1. Estimated Consumptive Use (CU) for Di�erent Crops in Eastern Colorado. Values within bars indicate expected CU sources. Growing seasons vary in length so expected precipitation also varies. Values are calibrated to a well-drained silt loam soil near Greeley, CO.
Figure 2. Planting Configurations. Circles represent the 136-acre center-pivot field (85% of a quarter section) partitioned by cropping activity. The selected activities vary by crop, harvest, and irrigation treatments.

Colorado Water » May 2020
Table 1. Summary of Net Returns Above Variable Cost (NR), Risk Premiums (RP), and Certainty Equivalents (CE) by Activity (all prices in 2017 $USD).
Colorado Water » June 202014
Figure 3. Sources of Estimated Consumptive Use (CU) by Planting Configuration of the 270 acre-foot HCU baseline. Values within bars indicate estimated CU sources and CU savings (di�erence between the HCU baseline and the estimated CU from soil, precipitation, and irrigation sources).
where CE=NR–RP. Third, we calculated breakeven water prices as WPA=(CEZ–CEA)/WSA for an activity A, where Z is fully-irrigated corn and WSA is CU savings.
Crop production outcomes are uncertain, and RP monetizes producers’ distaste for this risk. Fully-irrigated corn is the most profitable activity on average and is used as the reference activity for breakeven comparisons.
Results and Discussion Table 1 summarizes how each activity performed based only on returns to crop production. Risk averse producers will accept a lower return with certainty as compared to a higher expected return that includes some uncertain-ty, and it follows that CE is less than NR. For example, deficit irrigation decreases average yields (decreas-ing NR) and increases yield variabili-ty (increasing RP) as compared to full irrigation.
Figure 4 illustrates tradeo�s between risk-adjusted crop returns and CU savings for temporary water leasing for 270-foot HCU. Activities for which no other points lie to the
north (neither more profitable) and east (nor o�er more water) form a production possibilities curve or ‘e�cient set’ of favorable choices.
Corn grain and two-cut alfalfa form this set in all years. Rotational fallow performed better in low rainfall years, and deficit irrigation in high years.
Crop Harvest Irrigation NR RP CE Corn Grain Full Irrigation $407 $18 $389 Corn Grain Rotational Fallow $289 $11 $278 Corn Grain Deficit Irrigation $280 $22 $258 Corn Silage Full Irrigation $267 $32 $235 Corn Silage Rotational Fallow $179 $23 $156 Corn Silage Deficit Irrigation $160 $44 $117 Alfalfa Three cuts Full Irrigation $295 $10 $285 Alfalfa Three cuts Rotational Fallow $198 $10 $188 Alfalfa Three cuts Deficit Irrigation $183 $19 $165 Alfalfa Two cuts Full Irrigation $252 $17 $235 Alfalfa Two cuts Rotational Fallow $185 $10 $176 Alfalfa Two cuts Deficit Irrigation $160 $21 $139 Grass Hay Primarily Rainfed $28 $4 $24

Colorado Water » May 2020Colorado Water » June 2020 15
Figure 4. Risk-Adjusted Tradeo� Frontiers. Symbols denote the selected activities. Activities organized left to right along a tradeo� curve that transitions from combinations of high crop profit/low quantity water transfers to low crop profit/high quantity water transfers.
Figure 5. Breakeven Water Lease Prices ($/acre-foot in 2017 USD) for Leased CU Savings. These values can be interpreted as the average value of forgone crop returns per leased acre-foot of water.
Figure 5 relates breakeven water price per leased acre-foot of CU. From an economic perspective, a producer would be indi�erent between using potential CU savings for crop production versus water transfers if o�ered a lease price equal to the breakeven price. However, fixed cost considerations and other local and personal factors would likely influence actual producer decisions.
AcknowledgmentsThis study builds on methodology developed while Timothy Kelley was a master’s student in Agricultural and Resource Economics at Colora-do State University (CSU) and as part of a CSU research project entitled “Arid Climate Water Management Strategies: Joint Sustainability of Irrigated Agriculture and Other Societal Water Uses in eastern Colorado” supported by the Platte River Water Develop-ment Authority.

3
Fort Collins’s Forgotten Flood
Tristan Purdy, History, Colorado State University
n the morning of May 20, 1904, dark clouds over the Cache la Poudre Watershed burst, dumping inches of rain in just hours. That afternoon, funneling down
canyon walls and merging in the Poudre River, flood water barreled toward Fort Collins. Although a phone call from up canyon warned those along the river’s lowlands of the charging water, an act that saved countless lives, the swollen river ripped away bridges and fences and uprooted fields and homes. Once the storm subsided and the river retreated, the flood had left its mark, becoming the Poudre’s highest and most destructive recorded flood; and yet few in Fort Collins have heard of the 1904 flood (McKee and Doesken, 1997).
Fort Collins residents began forgetting the 1904 flood almost immediately after it occurred. Its disap-pearance, however, was anything but accidental. Rather, the city forgot on purpose since downplaying the disaster allowed city planners to avoid confronting di�cult questions regarding why it was the city’s laboring-class of German-Russian immigrants who lost the most in the disaster (Steinberg, 2006).
Before the floodwater even receded, local residents threw themselves into the relief e�ort. Citizens and community institutions provided food, shelter, and clothing for the dispossessed. In the following days, city and county government began pooling funds for road and bridge reconstruction. Within a week, construction teams began erecting steel bridges to reconnect the Poudre’s banks. As the Weekly Courier proudly noted, the community was bouncing back, and doing so without accepting “a cent of foreign aid.”
Rapid response displayed the city’s resiliency, and local press amplified these trends to its readers. In the disaster’s wake, the Fort Collins Express and the Weekly Courier published front page stories on the flood that outlined the day’s drama, estimated the financial toll, and celebrated the speed and determina-tion of local relief e�orts. After running these stories, neither paper published on the flood again. In the matter of just a week, it appeared as if the city’s largest
Colorado Water » June 202016
Historical topographical map of Fort Collins from 1906 courtesy of USGS through Wikimedia Commons.
Colorado Water » May 2020Colorado Water » May 2020
disaster to date was already so far in the rear-view mirror that there was no reason to bring it back up.
As weeks turned to months, and months to years, the flood further slipped out of public memory. For example, local historian Ansel Watrous’s 1911 volume, The History of Larimer County, referenced the 1904 flood only in passing (Table 1). Across 504 pages, a flood he experienced firsthand just five years earlier only appeared three times. Like the newspapers, Watrous treated the flood as merely a blip in the city’s history (Watrous, 1911).
But what did residents stand to gain by forgetting? First, it shouldn’t be overlooked that while the flood destroyed infrastructure, fields, and housing along the lowlands, much of the city sat high enough to avoid the river’s wrath. Had Fort Collins not relocated after the 1864 flood, this would be a di�erent story. More importantly though, there was real incentive to move on as quickly as possible. Dwelling on the flood wouldn’t replant profitable sugar beets or rebuild railway bridges. Brooding wouldn’t stimulate economic growth and excite outside investors. For the growing city, moving on quickly provided the most expedient route back to the sugar-fueled growth pattern that had recently enveloped the city (Laflin, 2005).
Focusing on resiliency and rushing to move on from the disaster also conveniently circum-vented reflection. Fort Collins residents’ disaster response left little room for contemplating uncomfortable questions. Nowhere in Fort Collins’s resiliency narratives was there consideration as to why the city allowed German-Russian families to settle and build along the lowlands lining the river—lowlands that flooded in 1864, 1891, and 1902.
How communities plan for and respond to flooding along the Front Range has evolved over the last century. Today, the Front Range boasts some of the most proactive flood-planning communities in the country; but it still floods here to
disastrous consequence. In both the Spring Creek flood of 1997 and the Front Range floods of 2013, the hardest hit were working class residents in mobile home parks. As our communities have recovered from these disasters, have we also considered the plight of those who
burdened a disproportionate amount of the loss? Have we grappled with and worked to counter the power structures that placed communities of lower socio-economic standing along the lowlands of our flood-prone water-ways (Grigg et al., 1997)?
Table 1. The number of references to flooding in Watrous’s History of Larimer County. Text mining application used to create table: Voyant Tools.
Colorado Water » June 2020 17
Search Term Reference Frequency Flood (prefix—includes flooding floods, etc.) 43 Flood of 1864 10 Flood of 1904 3
Sugar Beet Neighborhood in Fort Collins, 1915. Photo courtesy of Hine, Lewis Wickes.
Spring Creek Flood, 1997. Photo courtesy of Ron Phillips, City of Fort Collins and the Fort Collins Museum of Discovery.

hroughout history and across the world, water has played an integral role in life. Refer-
ences to water can be found scattered among writings in history. This work examines the correlation between water and humans by addressing the question: “Can we extract past ecological, hydrological, and climatological data from past writings?” The medieval tome of Spanish poetry, called the Romance-ro, is more than 1,200 pages in length and contains 22 references to the Ebro River in eastern Spain. The poetry has been scanned from the original hard copy and is currently stored in a portable document format (PDF) file. Howev-er, the text are not alpha-numeric data and therefore, they must be transmogrified into actual text. Here, we use the first occurrence of the Ebro (Romancero starting on page 34) to outline the challenges of transmogrification and provide an illustration of the hydro-social implications within the metaphors of said poem.
Methodology There are various challenges with the transmogrification into language that can be used to assess the water metaphors (Figure 1). To pursue the philology of the text, there were four steps: 1) we used
The Hydro-Social Implications of Water Metaphors in Poetry:
Transmogrification Challenges in an Example from the Medieval Spanish Romancero
The Hydro-Social Implications of Water Metaphors in Poetry:
Transmogrification Challenges in an Example from the Medieval Spanish Romancero
Mackenzie C. Warden, Ecosystem Science and Sustainability, Colorado State UniversitySteven R. Fassnacht, Ecosystem Science and Sustainability and Natural Resources Ecology
Lab, Colorado State University, Cooperative Institute for Research in the AtmosphereJonathan E. Carlyon, Languages, Literatures, and Cultures, Colorado State University
Colorado Water » June 202018
Medieval Spanish Example Capitulation: This appears at the beginning of a poem and is not recognized by software programs.
Splotches in text: These cannot be interpreted with software and need context clues to correct.
Medieval Spanish Present Day Correction Example
u v nueuo to nuevo v u vn to un z c dize to dice ç s or z Zaragoça to
Zaragoza f s Vofostras to
vosotras b v buelta to Vuelta Command Form: This is present in modern day Spanish as well. However, sometimes certain letters are switched around.
lleualdas to llevadlas
Lack of accents Balcon to balcón Words without present day translation
celogia
Table 1. List of erroneous marking issues found in the original text and possible corrections.
Table 2. List of language and font modernization issues found in the original text and possible corrections.

Colorado Water » May 2020Colorado Water » May 2020
Colorado Water » June 2020 19
Figure 1. The process of transmogrification and translating.
PDF-to-text conversion software, 2) we corrected erroneous markings (Table 1), 3) we adjusted text from the medieval to modern Spanish (Table 2), and 4) the translation of the poem into English (Figure 1). After translation into English, key terms relating to the hydrology, ecology, and climatology were identified as well as terms relating water and humans.
The second step is common in generating transformable data from scanned documents using Optical Character Recognition. Here, the main problems were capitulation, which is a stylist issue from the era during which the poetry was written,
and splotches that are caused by the age and handling of the docu-ment that was scanned. The Roman-cero is over 500 years old (Table 1).
The text translation from the medieval to present day Spanish were based on language and font di�erences (Table 2). One of the most common font changes was “f” to “s” in the text. For example, words like sus and vosotros will be spelled with what was transcribed as an “f” instead of an “s,” causing the word to appear as fus and vofotros, respectively. Other changes that must be made to the text for translation to be possible can be seen in Table 2. Certain words in the
text do not have present-day translations. To figure out the proper translation, context clues must be used. The other di�culty is the vosotros conjugation. This conjuga-tion is not used in many Spanish speaking cultures other than Spain. The vosotros conjugation roughly translates to “you guys.”
ResultsIn this poem, the Ebro is more of a friend than a natural entity. The Captain speaks to the Ebro in Tudela, Spain while his love remains in Zaragoza. He bids the river to carry his tears to the balcony of his love and begins to pour his thoughts
1) Original Text
2) Corrected Text
2) Text as Characters
4) Text in English
Con sus mansas ondas Ebroparecía que llamabaa la esquina de un jardínfrontero de su ventana:el Moro finge que sonamigos que le avisaban,que pasan por Zaragoza,y que vea si algo manda.
Amadas ondras, les dice,de vosotras fio el alma,Y estas lagrimas os fio,sino son muchas, llevadlas.
With its calm waves Ebroseemed to be callingto the corner of a gardenopposite of your windowthe Moorish pretend that they arefriends who warned him,to pass through Zaragoza,and to see whether something rules.
Beloved waves, they say,your soul is trustedand these tears I trust you,but they are many, carry them.
Humans interact and have a relationship with water no matter where they are on the planet.
Colorado Water » May 2020Colorado Water » May 2020
Colorado Water » June 202020
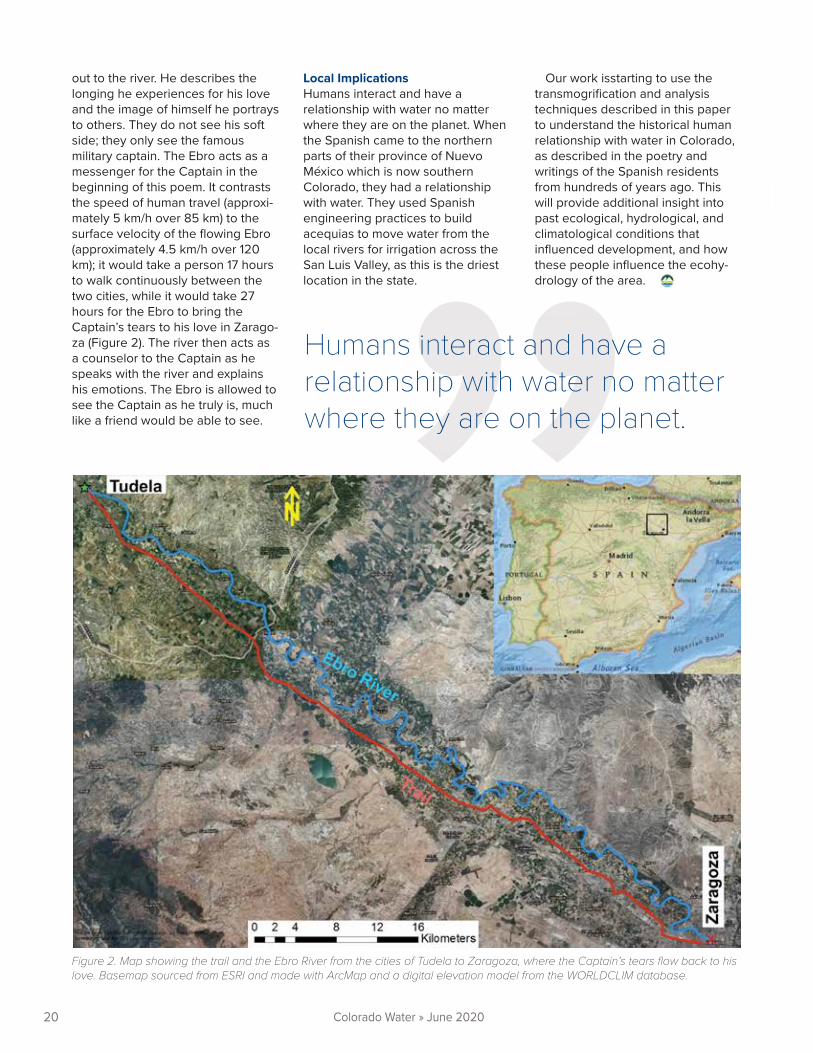
Figure 2. Map showing the trail and the Ebro River from the cities of Tudela to Zaragoza, where the Captain’s tears flow back to his love. Basemap sourced from ESRI and made with ArcMap and a digital elevation model from the WORLDCLIM database.
out to the river. He describes the longing he experiences for his love and the image of himself he portrays to others. They do not see his soft side; they only see the famous military captain. The Ebro acts as a messenger for the Captain in the beginning of this poem. It contrasts the speed of human travel (approxi-mately 5 km/h over 85 km) to the surface velocity of the flowing Ebro (approximately 4.5 km/h over 120 km); it would take a person 17 hours to walk continuously between the two cities, while it would take 27 hours for the Ebro to bring the Captain’s tears to his love in Zarago-za (Figure 2). The river then acts as a counselor to the Captain as he speaks with the river and explains his emotions. The Ebro is allowed to see the Captain as he truly is, much like a friend would be able to see.
Local ImplicationsHumans interact and have a relationship with water no matter where they are on the planet. When the Spanish came to the northern parts of their province of Nuevo México which is now southern Colorado, they had a relationship with water. They used Spanish engineering practices to build acequias to move water from the local rivers for irrigation across the San Luis Valley, as this is the driest location in the state.
Our work isstarting to use the transmogrification and analysis techniques described in this paper to understand the historical human relationship with water in Colorado, as described in the poetry and writings of the Spanish residents from hundreds of years ago. This will provide additional insight into past ecological, hydrological, and climatological conditions that influenced development, and how these people influence the ecohy-drology of the area.

Colorado Water Center
1033 Campus Delivery
Fort Collins, Colorado 80523-1033
Visit Our Website Colorado Water Center: watercenter.colostate.edu
Photo courtesy of USGS/Unsplash
NONPROFITORGANIZATION
U.S. POSTAGEPAID
Fort Collins, Colorado 80523Permit Number 19
Colorado Water Online Visit watercenter.colostate.edu/water-news to access a PDF version of our current newsletter. To download past issues of our newsletter, click on Newsletter Archives.
Attention Subscribers Please help us keep our distribution list up to date. If you prefer to receive the newsletter electronical-ly or have a name/address change, please visit watercenter.colostate.edu and click on Subscriptions.
Colorado Water is financed in part by the U.S. Department of the Interior Geological Survey through the Colorado Water Center, College of Agriculture, College of Engineering, Warner College of Natural Resources, Agricultural Experiment Station, and Colorado State University Extension.