Embed Size (px)
DESCRIPTION
Colors: Desktop Monitor to the Big Screen (& back). Alan Edelman Dept of Mathematics: MIT MIT Laboratory for Computer Science Frank Wang Arun Rao (Pixar). Graphics Lunch April 25, 2003. Other Topics Not Covered Today. Parallel MATLAB The Bohemian Dome. - PowerPoint PPT Presentation
Citation preview
Colors:Colors:Desktop Monitor toDesktop Monitor to
the Big Screen (& back)the Big Screen (& back)
Alan EdelmanAlan EdelmanDept of Mathematics: MITDept of Mathematics: MIT
MIT Laboratory for Computer ScienceMIT Laboratory for Computer Science
Frank Wang Frank Wang
Arun Rao (Pixar)Arun Rao (Pixar)
Graphics Lunch
April 25, 2003
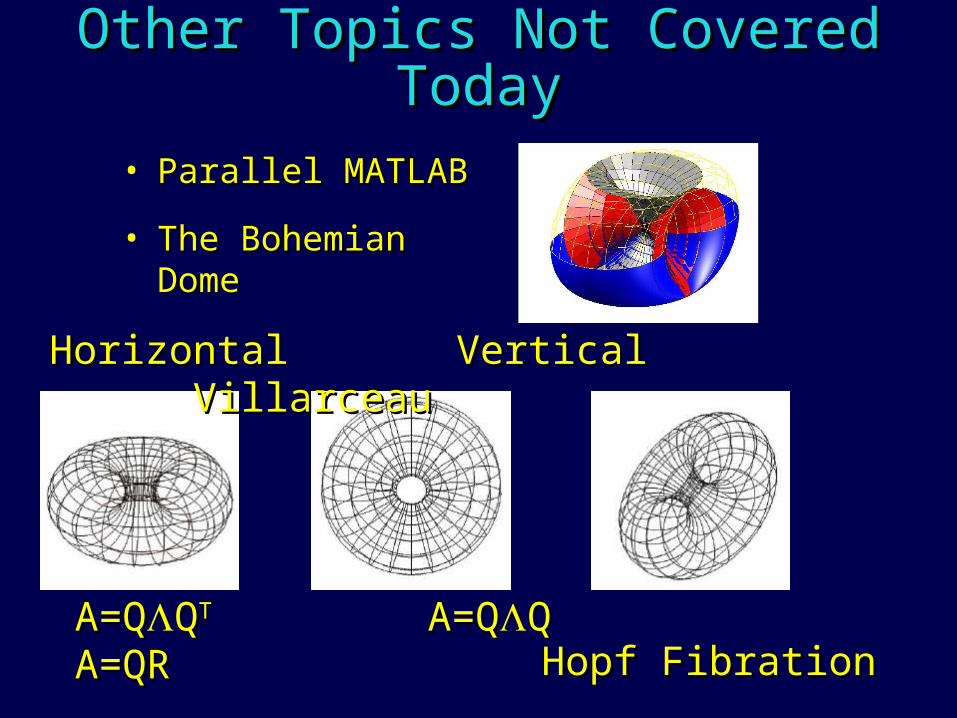
Other Topics Not Covered TodayOther Topics Not Covered Today
• Parallel MATLABParallel MATLAB
• The Bohemian The Bohemian DomeDome
A=QA=QQQTT A=Q A=QQ A=QRQ A=QRHopf FibrationHopf Fibration
Horizontal Vertical Horizontal Vertical VillarceauVillarceau
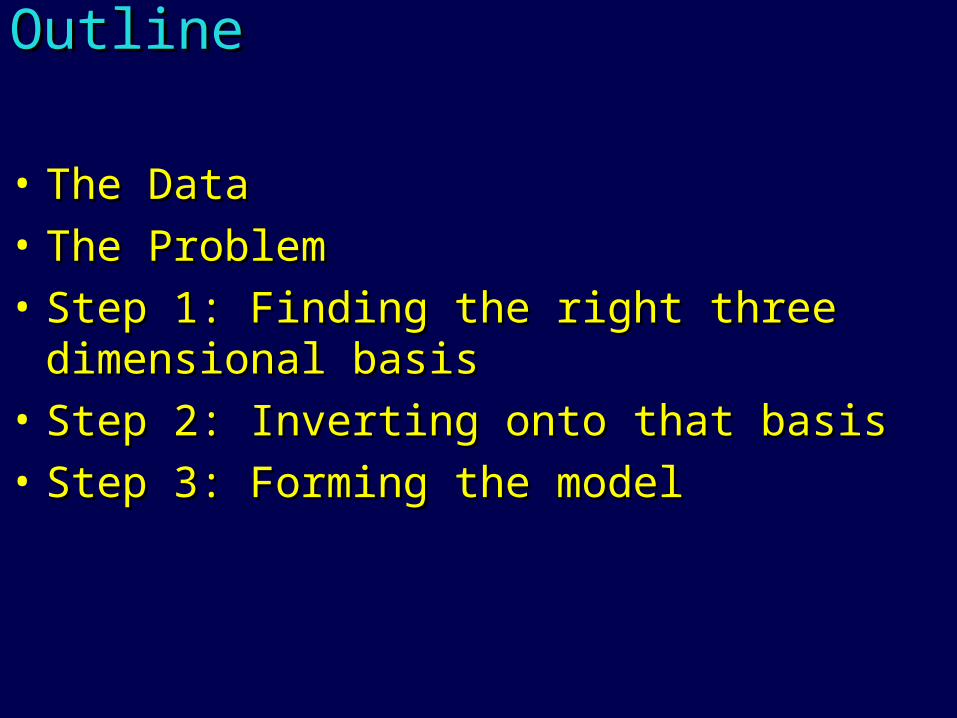
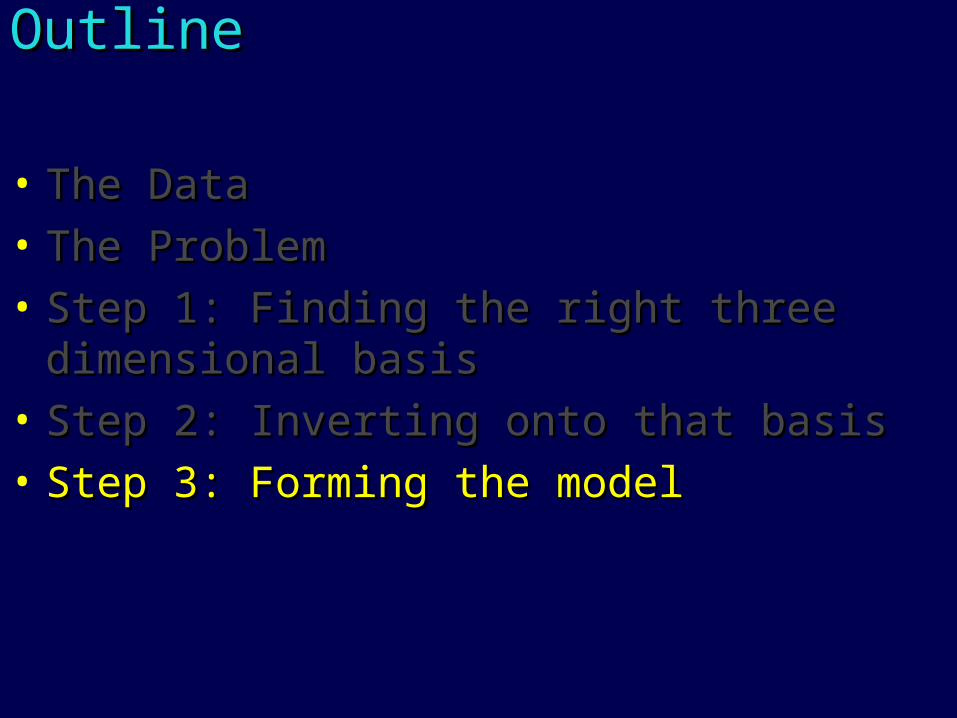
OutlineOutline
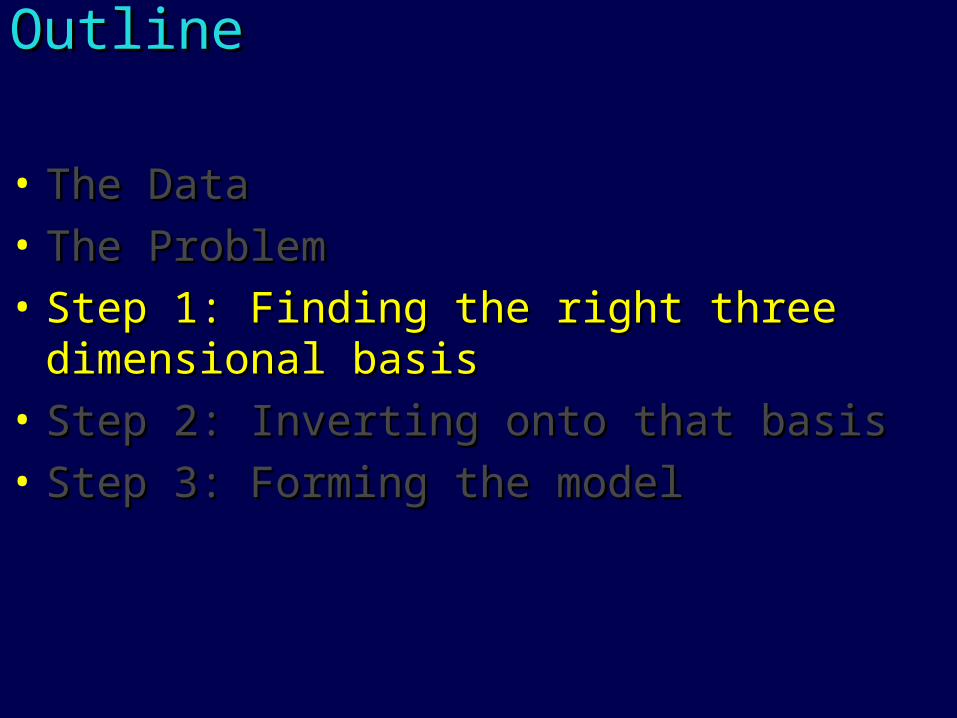
• The DataThe Data• The ProblemThe Problem• Step 1: Finding the right three Step 1: Finding the right three
dimensional basisdimensional basis• Step 2: Inverting onto that basisStep 2: Inverting onto that basis• Step 3: Forming the modelStep 3: Forming the model
OutlineOutline
• The DataThe Data• The ProblemThe Problem• Step 1: Finding the right three Step 1: Finding the right three
dimensional basisdimensional basis• Step 2: Inverting onto that basisStep 2: Inverting onto that basis• Step 3: Forming the modelStep 3: Forming the model
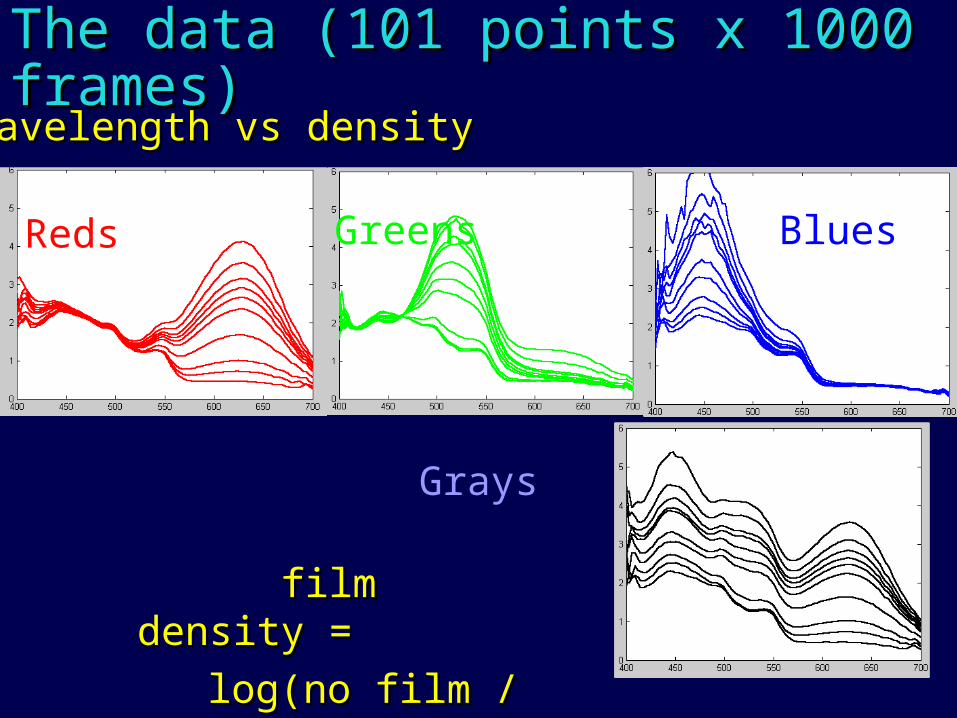
The data (101 points x 1000 The data (101 points x 1000 frames)frames)
Reds Greens Blues
Grays
wavelength vs densitywavelength vs density
film density =film density =
log(no film / with log(no film / with film)film)
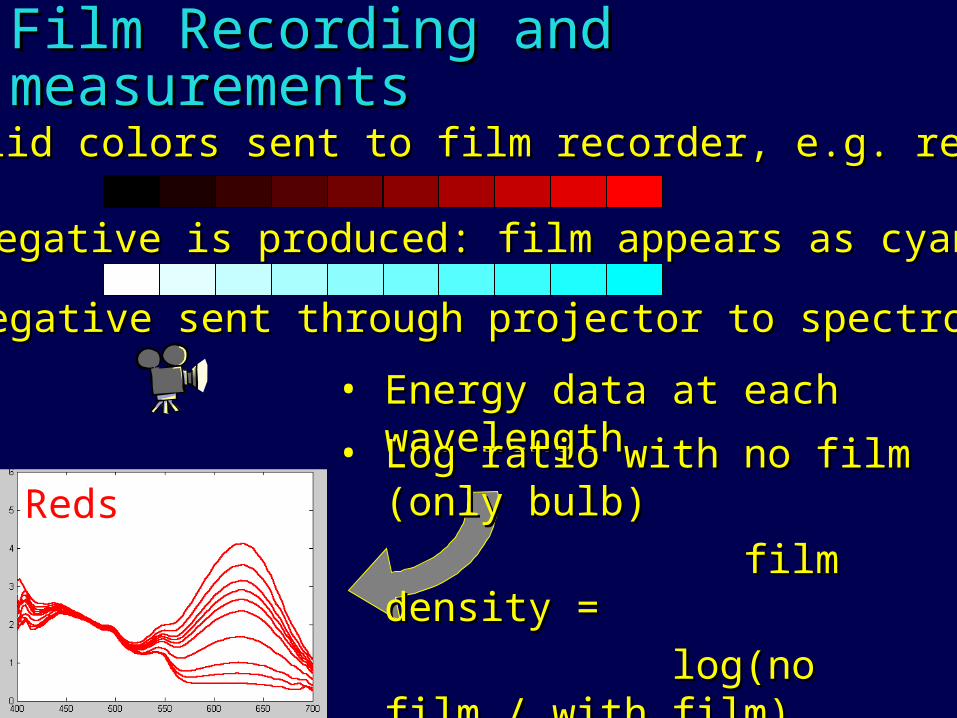
Film Recording and Film Recording and measurementsmeasurements
Reds
• Solid colors sent to film recorder, e.g. redsSolid colors sent to film recorder, e.g. reds
• Negative is produced: film appears as cyansNegative is produced: film appears as cyans
• Negative sent through projector to spectrometerNegative sent through projector to spectrometer
• Energy data at each Energy data at each wavelengthwavelength• Log ratio with no film (only Log ratio with no film (only bulb)bulb)
film density =film density =
log(no film / with film)log(no film / with film)
OutlineOutline
• The DataThe Data• The ProblemThe Problem• Step 1: Finding the right three Step 1: Finding the right three
dimensional basisdimensional basis• Step 2: Inverting onto that basisStep 2: Inverting onto that basis• Step 3: Forming the modelStep 3: Forming the model
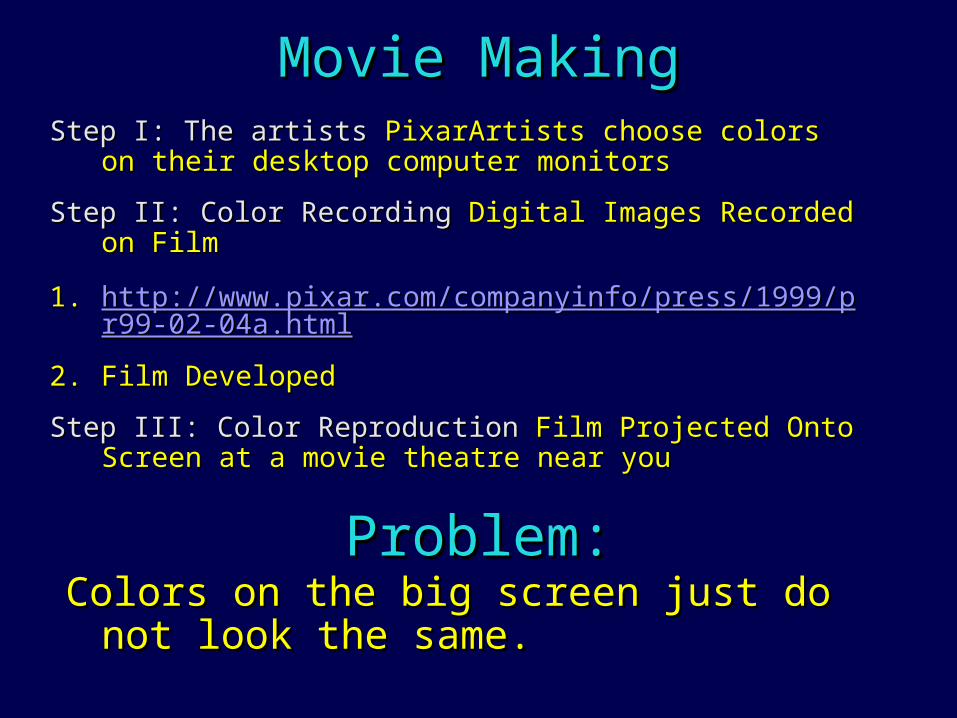
Movie MakingMovie MakingStep I: The artists Step I: The artists PixarArtists choose colors on their PixarArtists choose colors on their
desktop computer monitorsdesktop computer monitors
Step II: Color Recording Step II: Color Recording Digital Images Recorded on FilmDigital Images Recorded on Film
1.1. http://www.pixar.com/companyinfo/press/1999/pr99-http://www.pixar.com/companyinfo/press/1999/pr99-02-04a.html02-04a.html
2.2. Film DevelopedFilm Developed
Step III: Color Reproduction Step III: Color Reproduction Film Projected Onto Screen Film Projected Onto Screen at a movie theatre near youat a movie theatre near you
Problem:Problem:Colors on the big screen just do not look Colors on the big screen just do not look
the same.the same.

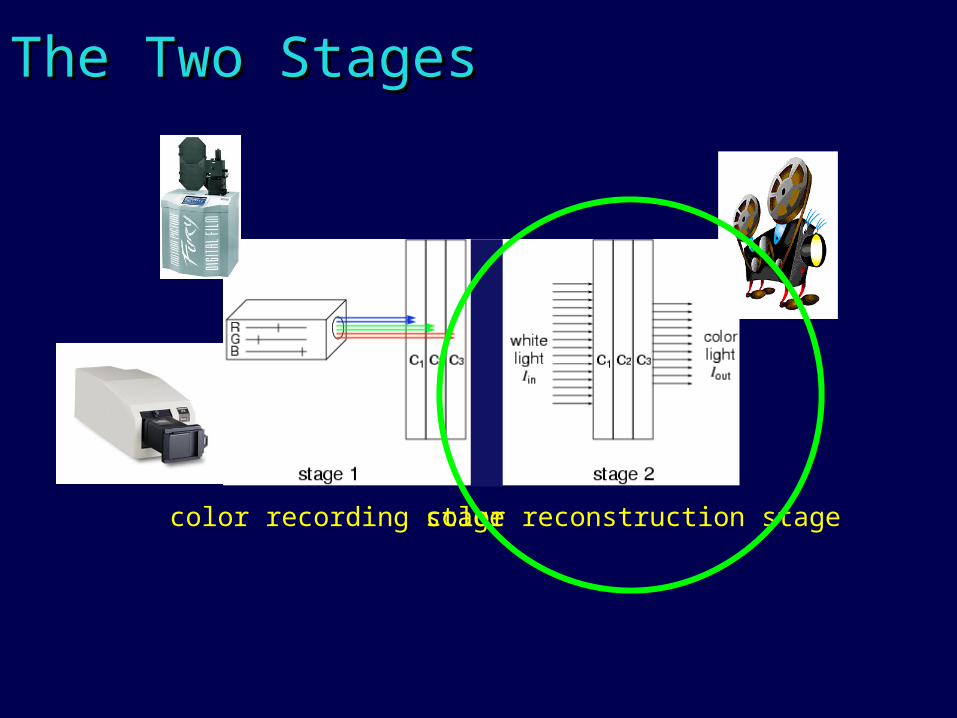
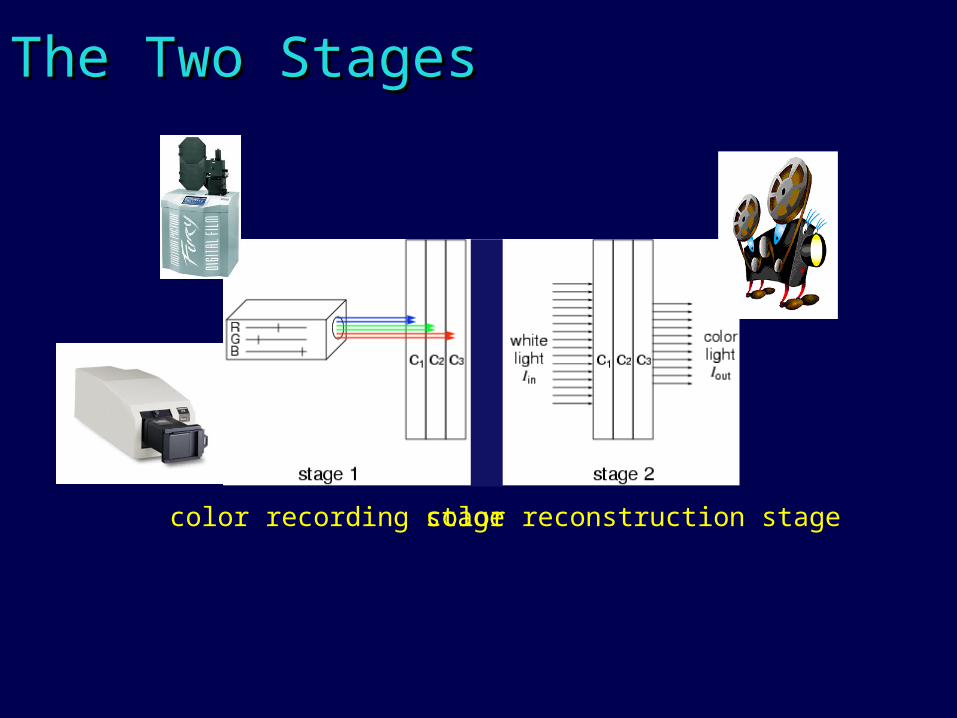
The Two StagesThe Two Stages
color recording stage color reconstruction stage
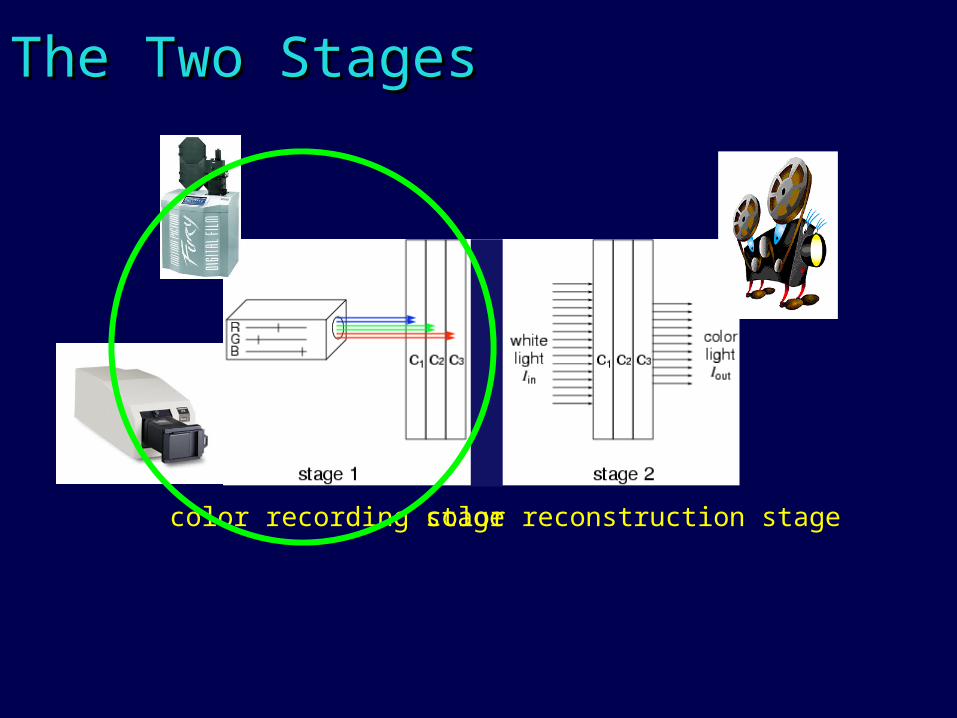
The Two StagesThe Two Stages
color recording stage color reconstruction stage
Models, Algorithms, NumericsModels, Algorithms, Numerics• physically based models physically based models
• numerical techniquesnumerical techniques
To invert the color reproduction & To invert the color reproduction & recording steps.recording steps.
OutlineOutline
• The DataThe Data• The ProblemThe Problem• Step 1: Finding the right three Step 1: Finding the right three
dimensional basisdimensional basis• Step 2: Inverting onto that basisStep 2: Inverting onto that basis• Step 3: Forming the modelStep 3: Forming the model
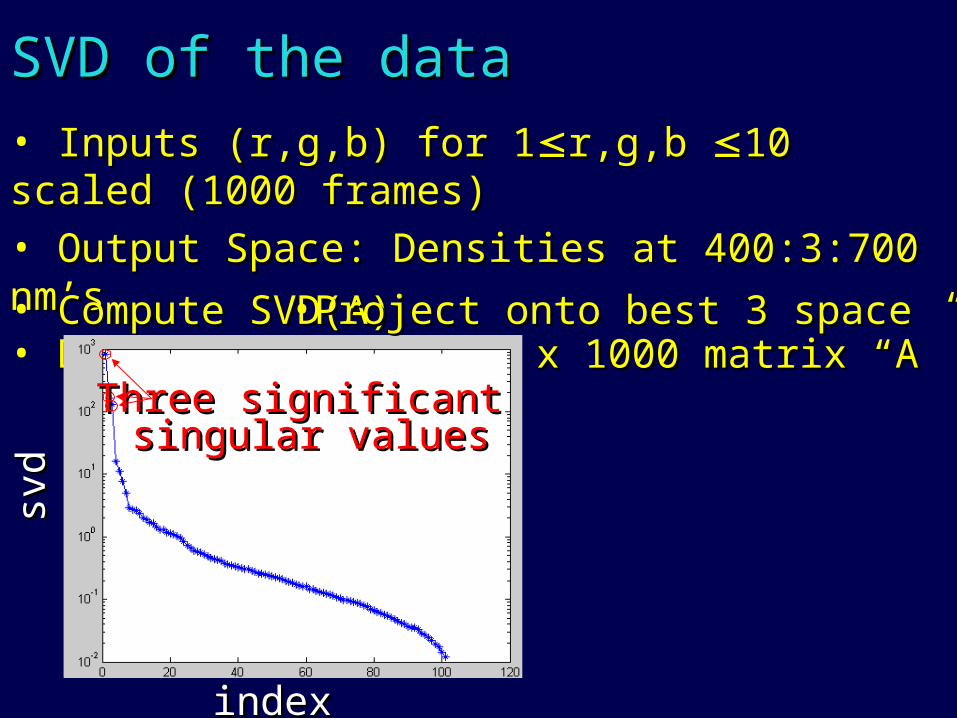
SVD of the dataSVD of the data• Inputs (r,g,b) for 1Inputs (r,g,b) for 1r,g,b r,g,b 10 scaled (1000 10 scaled (1000 frames)frames)• Output Space: Densities at 400:3:700 nm’sOutput Space: Densities at 400:3:700 nm’s• Data Structure: 101 x 1000 matrix “A”Data Structure: 101 x 1000 matrix “A”• Compute SVD(A)Compute SVD(A)
indexindex
svd
svd
•Project onto best 3 spaceProject onto best 3 space
Three significantThree significant singular valuessingular values
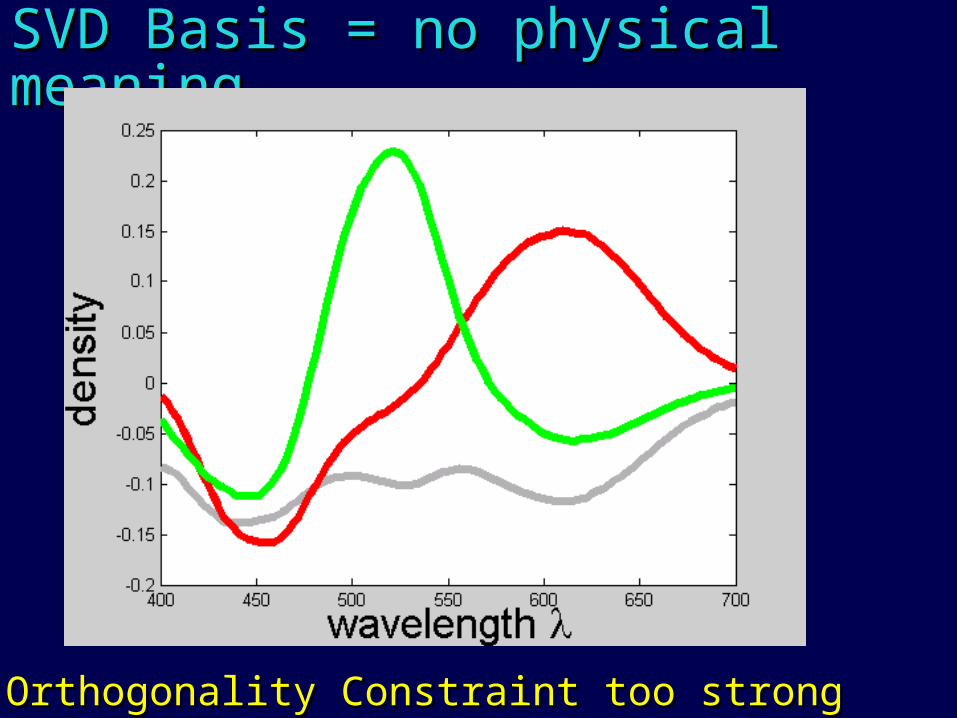
SVD Basis = no physical SVD Basis = no physical meaningmeaning
Orthogonality Constraint too strongOrthogonality Constraint too strong
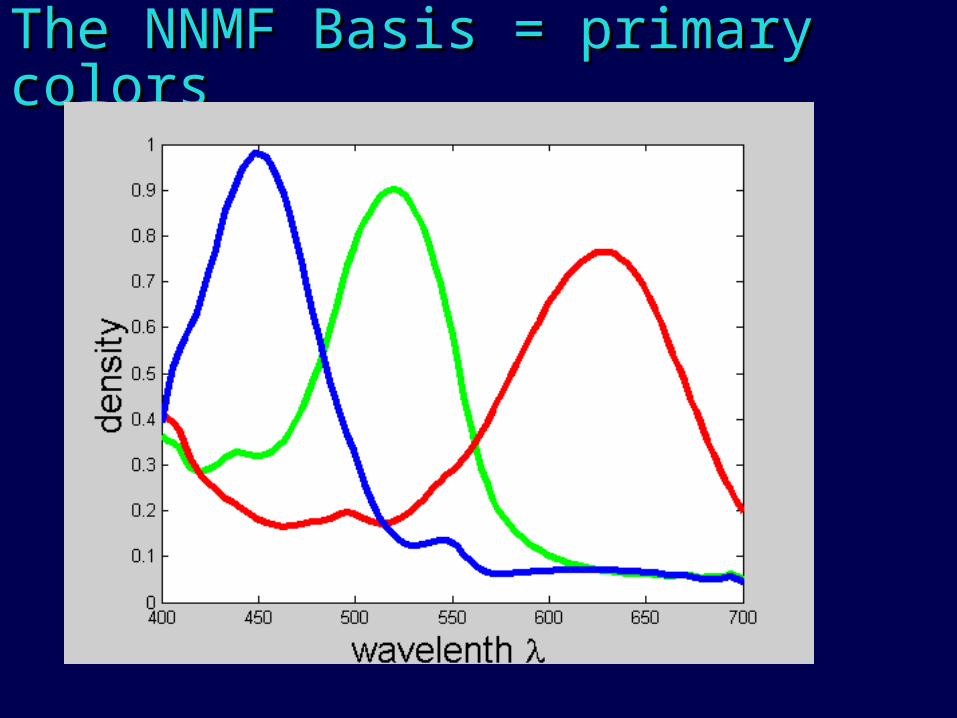
The NNMF Basis = primary colorsThe NNMF Basis = primary colors
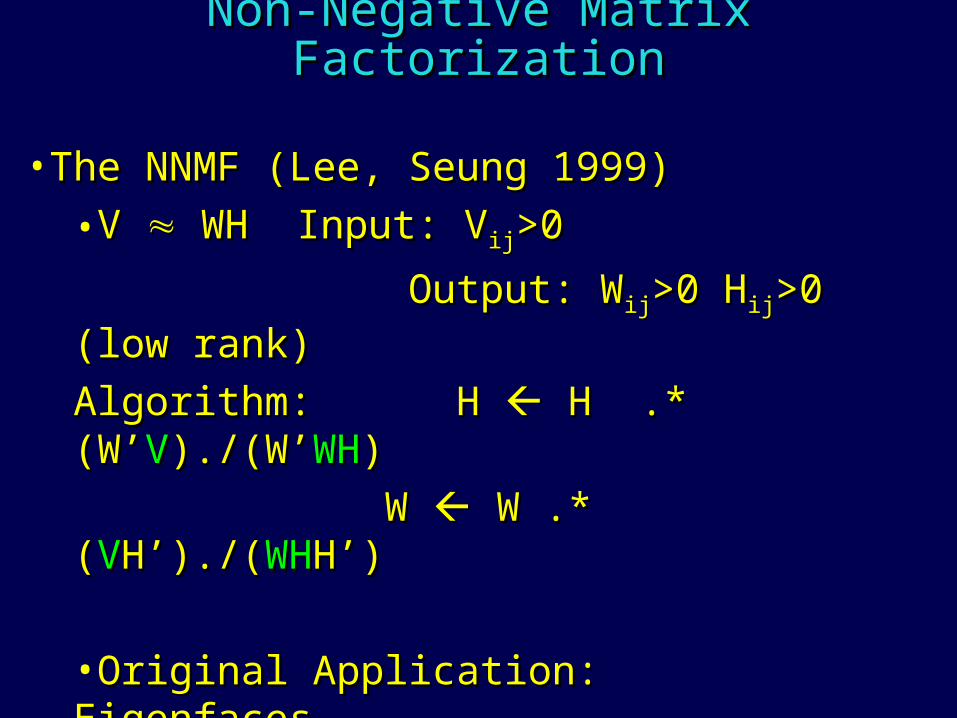
Non-Negative Matrix FactorizationNon-Negative Matrix Factorization
•The NNMF (Lee, Seung 1999)The NNMF (Lee, Seung 1999)
•V V WH Input: V WH Input: Vijij>0>0
Output: WOutput: Wijij>0 H>0 Hijij>0 (low >0 (low rank)rank)
Algorithm: H Algorithm: H H .* H .* (W’(W’VV)./(W’)./(W’WHWH))
W W W .* W .* ((VVH’)./(H’)./(WHWHH’)H’)
•Original Application: EigenfacesOriginal Application: Eigenfaces
•New Algorithm: Project SVD Into Cone New Algorithm: Project SVD Into Cone using Convex Hull Algorithmusing Convex Hull Algorithm
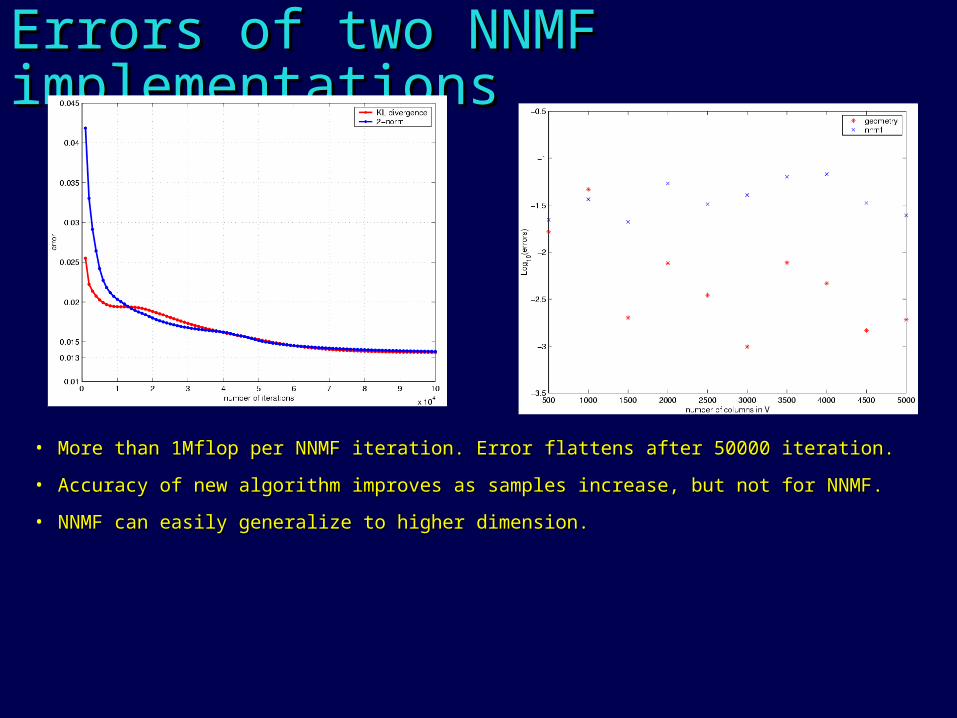
Errors of two NNMF Errors of two NNMF implementationsimplementations
• More than 1Mflop per NNMF iteration. Error flattens after 50000 iteration.More than 1Mflop per NNMF iteration. Error flattens after 50000 iteration.
• Accuracy of new algorithm improves as samples increase, but not for NNMF. Accuracy of new algorithm improves as samples increase, but not for NNMF.
• NNMF can easily generalize to higher dimension.NNMF can easily generalize to higher dimension.
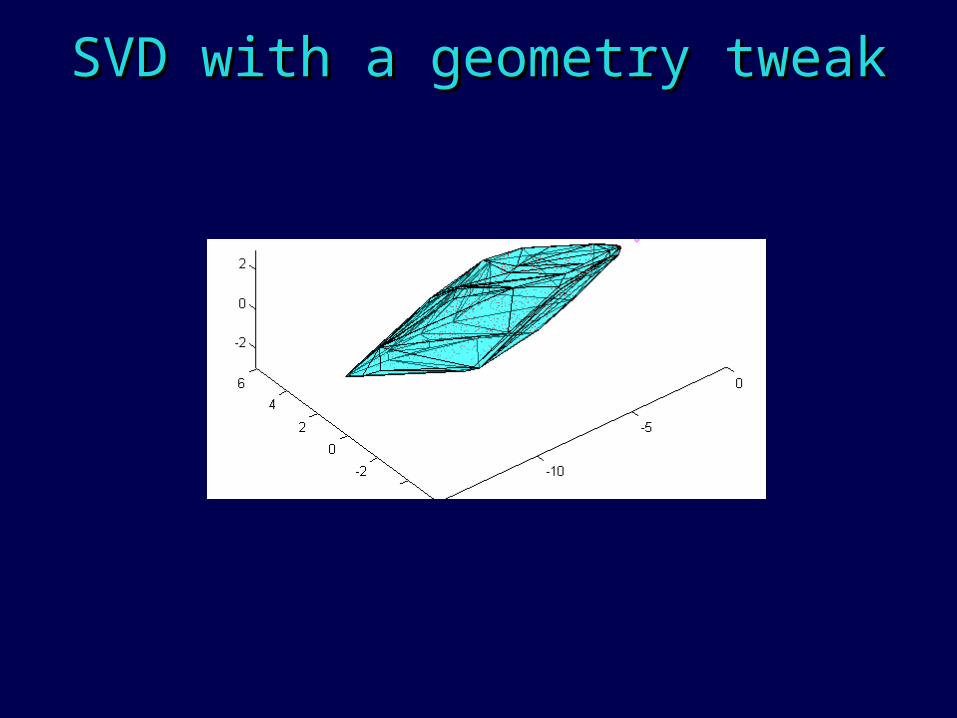
SVD with a geometry tweakSVD with a geometry tweak
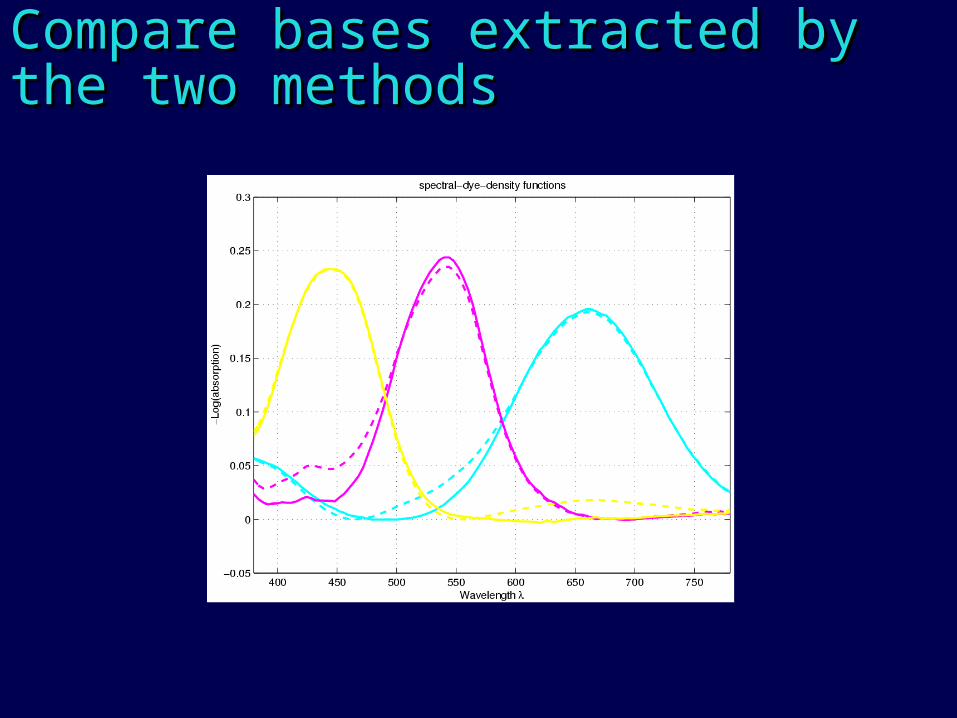
Compare bases extracted by the Compare bases extracted by the two methodstwo methods
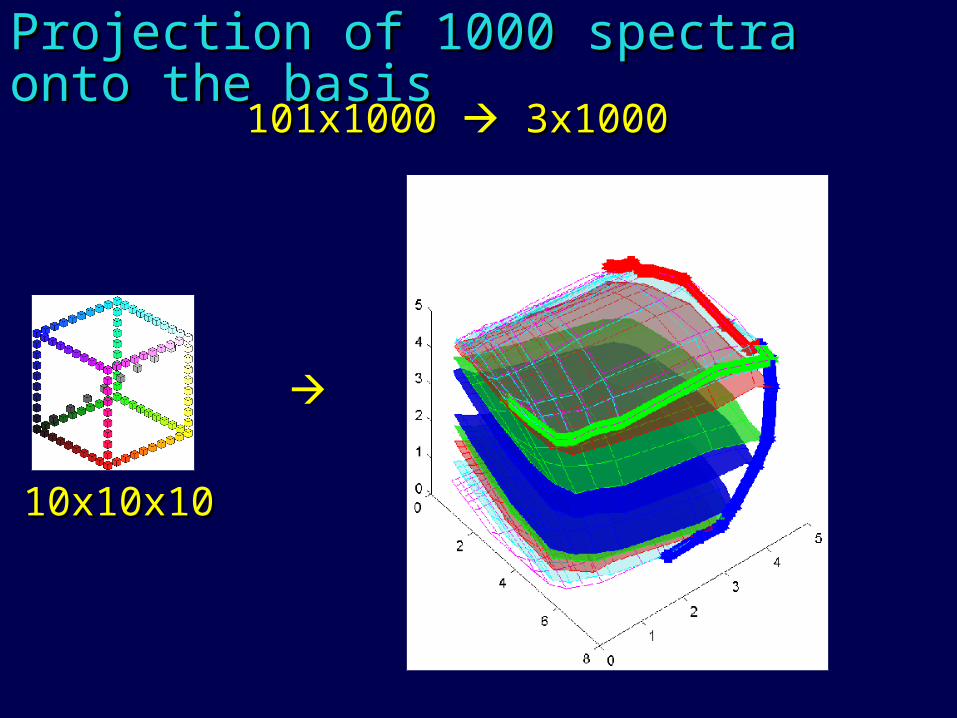
Projection of 1000 spectra onto the Projection of 1000 spectra onto the basisbasis
101x1000 101x1000 3x1000 3x1000
10x10x1010x10x10
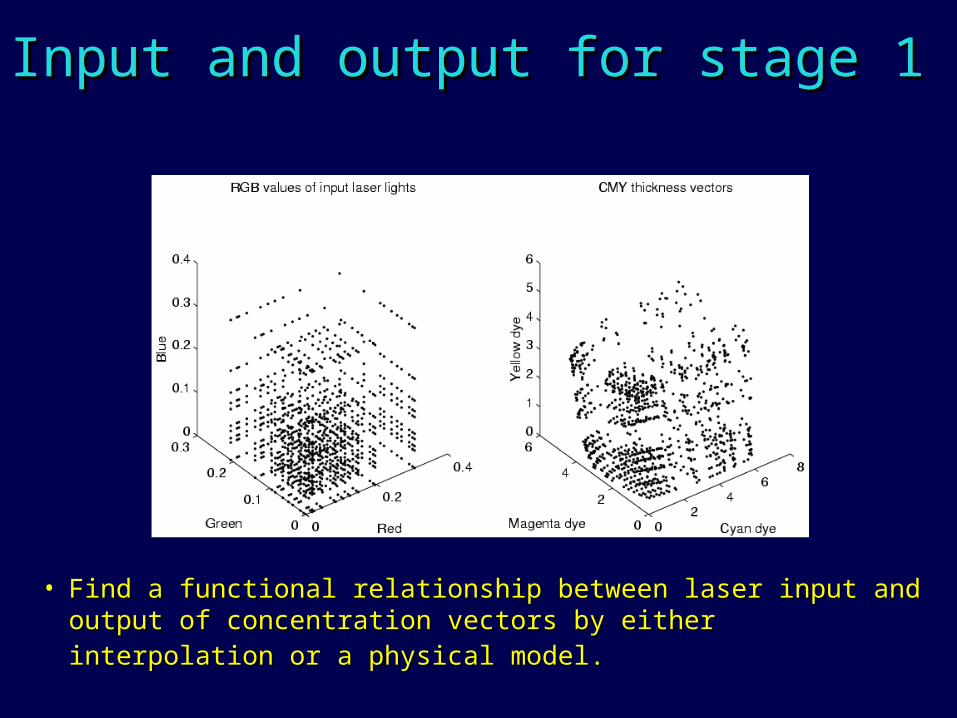
Input and output for stage 1Input and output for stage 1
• Find a functional relationship between laser input and output Find a functional relationship between laser input and output of concentration vectors by either interpolation or a physical of concentration vectors by either interpolation or a physical model.model.
OutlineOutline
• The DataThe Data• The ProblemThe Problem• Step 1: Finding the right three Step 1: Finding the right three
dimensional basisdimensional basis• Step 2: Inverting onto that basisStep 2: Inverting onto that basis• Step 3: Forming the modelStep 3: Forming the model
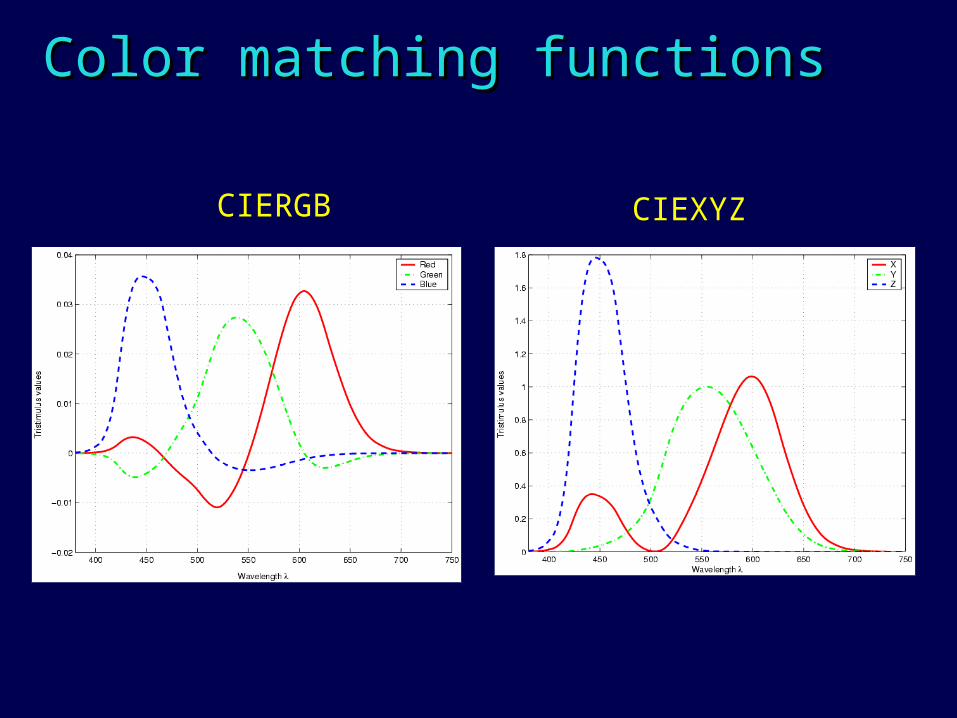
Color matching functionsColor matching functions
CIERGB CIEXYZ
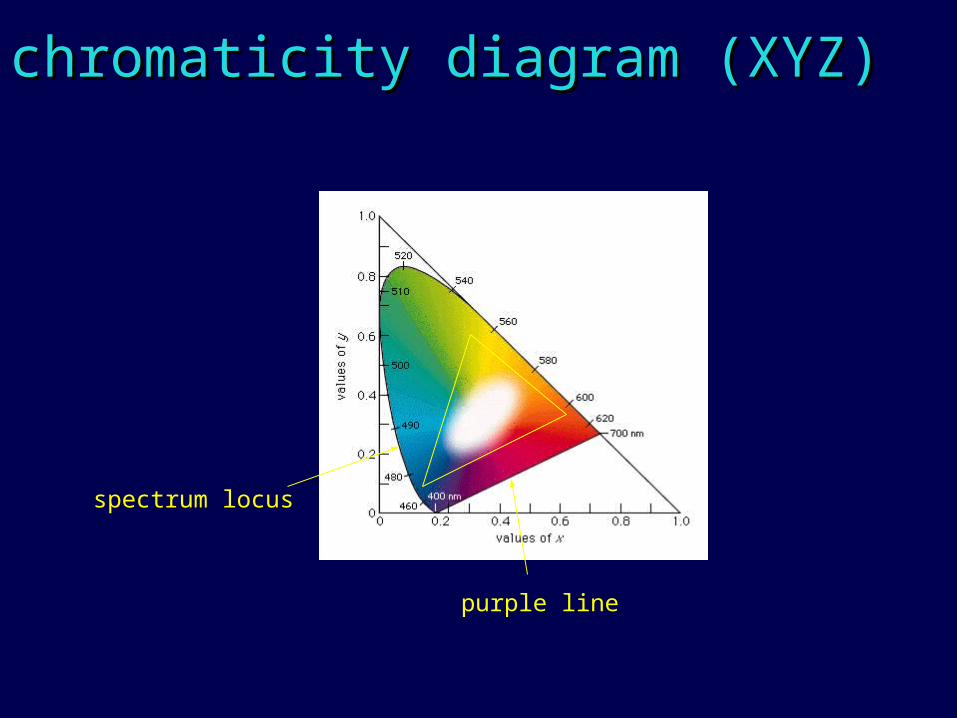
chromaticity diagram (XYZ)chromaticity diagram (XYZ)
spectrum locus
purple line
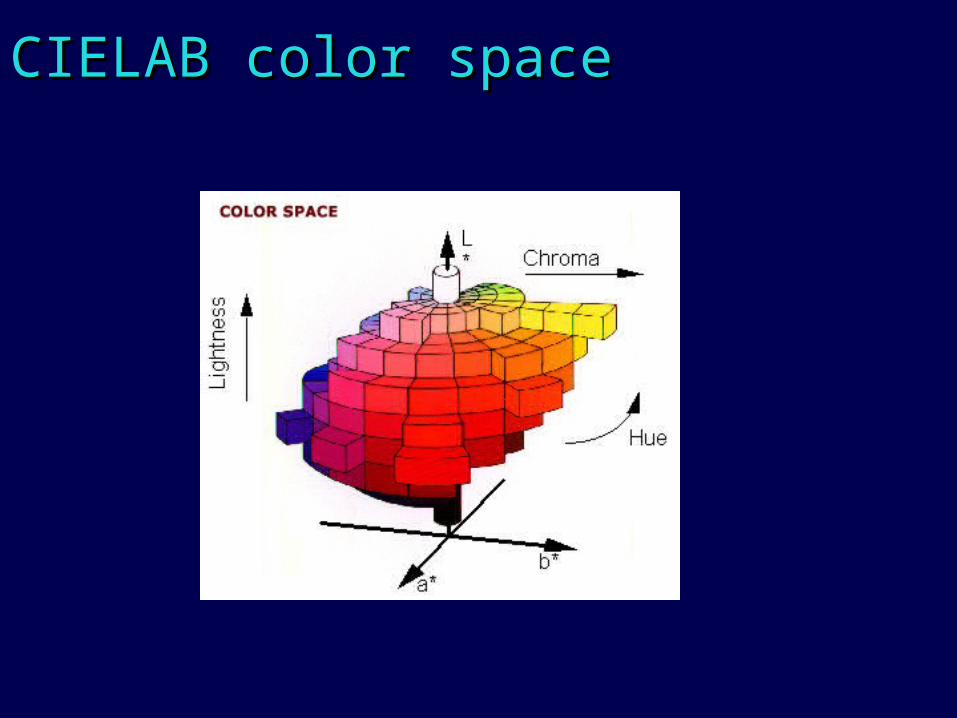
CIELAB color spaceCIELAB color space
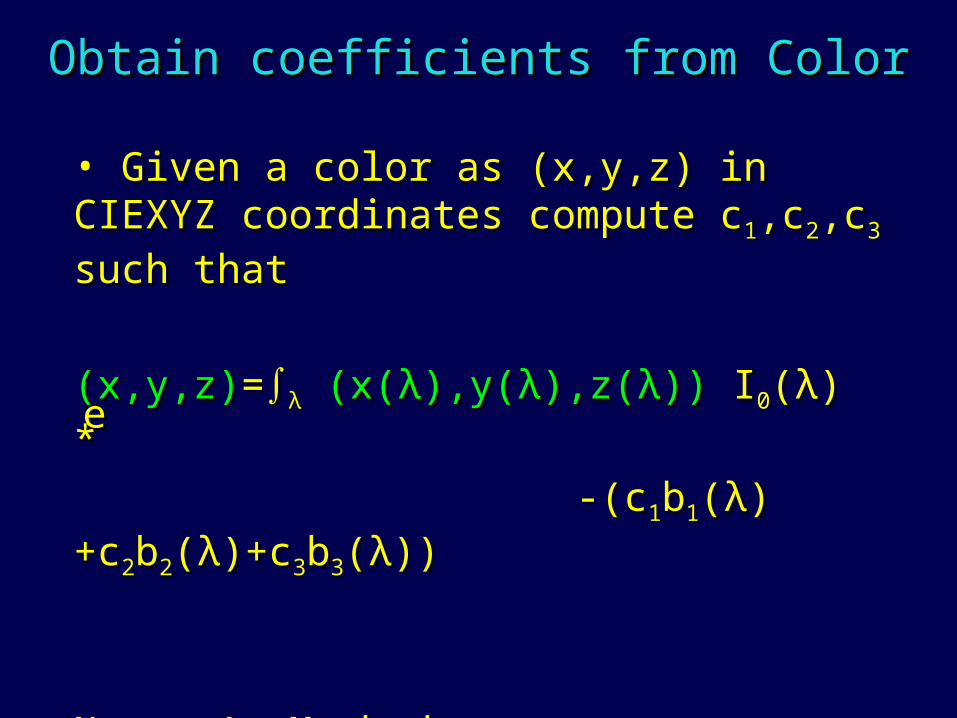
Obtain coefficients from ColorObtain coefficients from Color
• Given a color as (x,y,z) in CIEXYZ Given a color as (x,y,z) in CIEXYZ coordinates compute ccoordinates compute c11,c,c22,c,c33 such that such that
(x,y,z)(x,y,z)==∫∫λλ (x((x(λλ),y(),y(λλ),z(),z(λλ)))) I I00((λλ) ) **
-(c-(c11bb11((λλ)+c)+c22bb22((λλ)+c)+c33bb33((λλ))))
Newton’s MethodNewton’s Method
e de dλλ
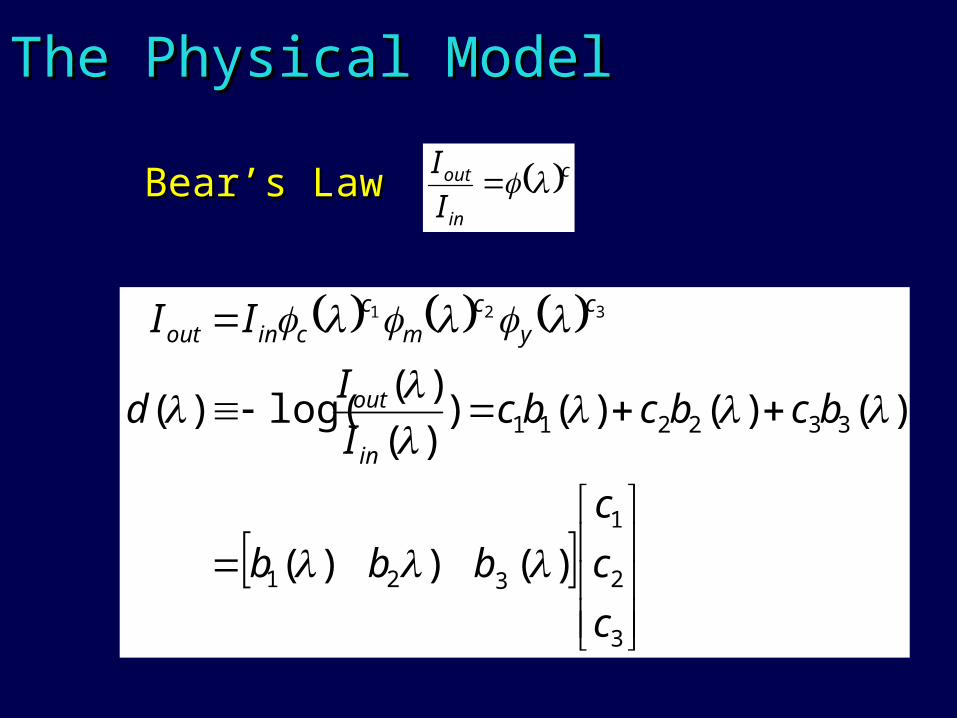
The Physical ModelThe Physical Model
cin
out
I
I
3
2
1
321
332211
)())(
)()()())(
)(log()(
321
c
c
c
bbb
bcbcbcI
Id
II
in
out
cy
cm
ccinout
Bear’s LawBear’s Law
OutlineOutline
• The DataThe Data• The ProblemThe Problem• Step 1: Finding the right three Step 1: Finding the right three
dimensional basisdimensional basis• Step 2: Inverting onto that basisStep 2: Inverting onto that basis• Step 3: Forming the modelStep 3: Forming the model
The Two StagesThe Two Stages
color recording stage color reconstruction stage
The Two StagesThe Two Stages
color recording stage color reconstruction stage
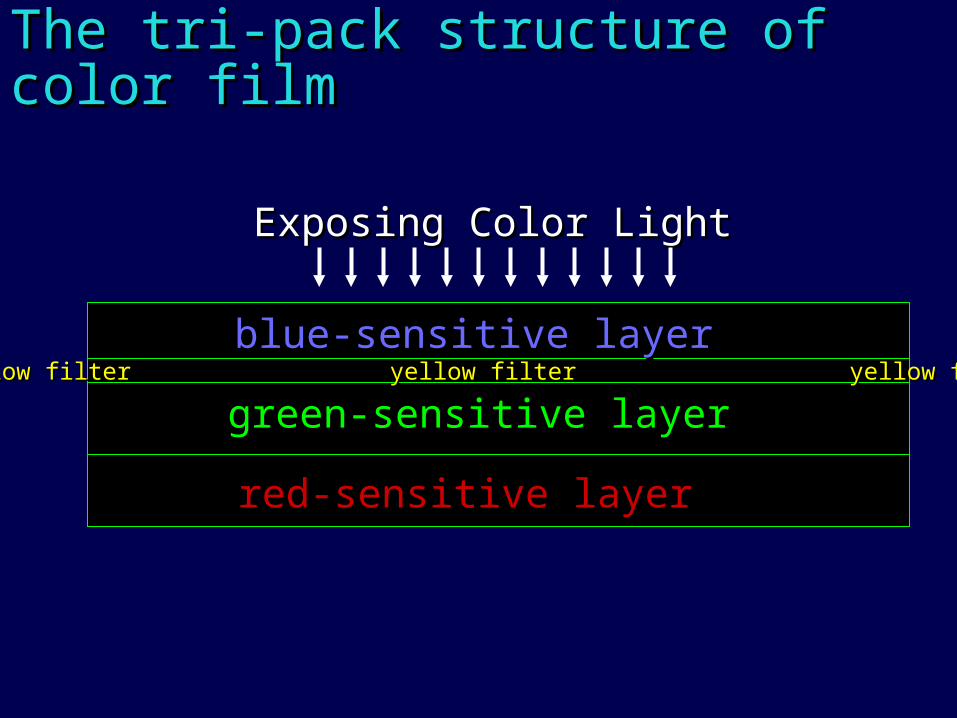
The tri-pack structure of color filmThe tri-pack structure of color film
Exposing Color LightExposing Color Light
blue-sensitive layerblue-sensitive layer
green-sensitive layergreen-sensitive layer
red-sensitive layerred-sensitive layer
yellow filter yellow filter yellow filteryellow filter yellow filter yellow filter
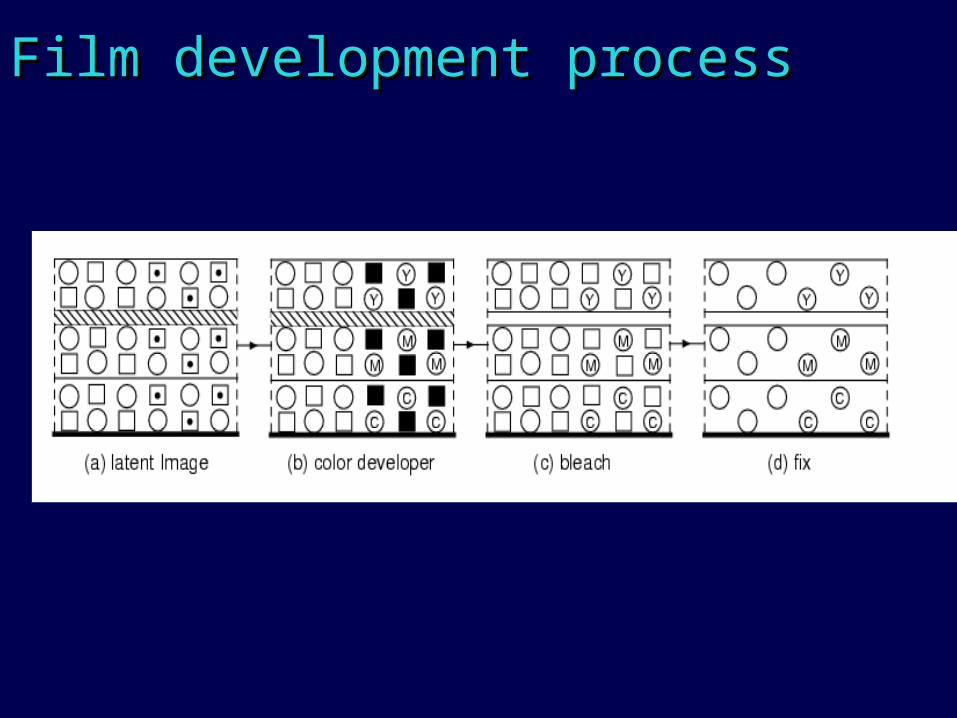
Film development processFilm development process
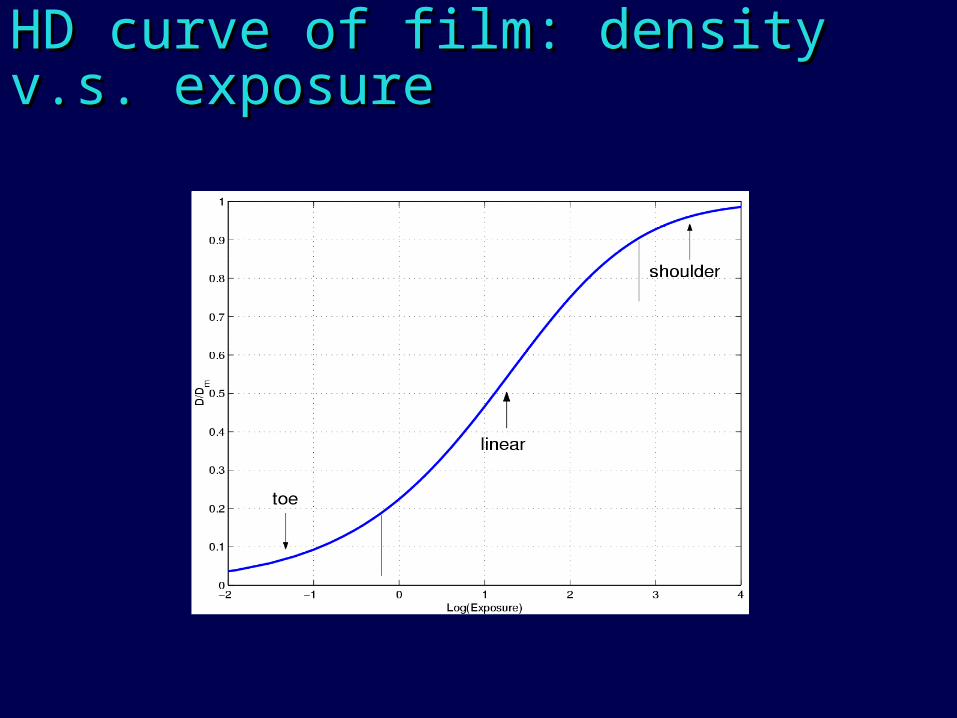
HD curve of film: density v.s. HD curve of film: density v.s. exposureexposure
Physical effects motivates co-Physical effects motivates co-linear fitlinear fit
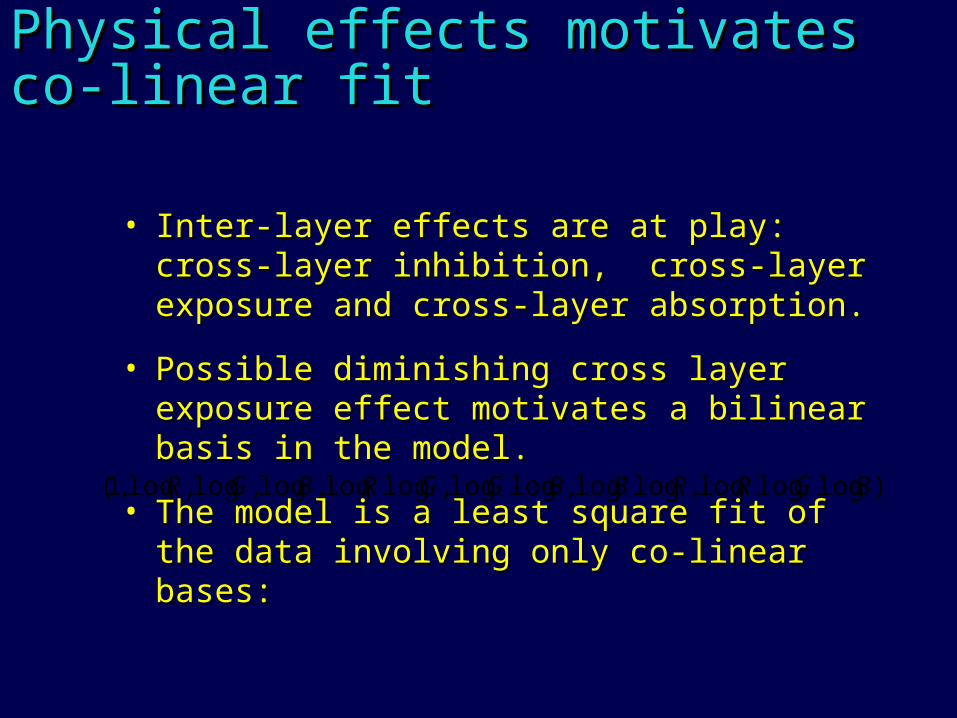
)logloglog,loglog,loglog,loglog,log,log,log,1( BGRRBBGGRBGR
• Inter-layer effects are at play: cross-Inter-layer effects are at play: cross-layer inhibition, cross-layer exposure layer inhibition, cross-layer exposure and cross-layer absorption.and cross-layer absorption.
• Possible diminishing cross layer Possible diminishing cross layer exposure effect motivates a bilinear exposure effect motivates a bilinear basis in the model. basis in the model.
• The model is a least square fit of the The model is a least square fit of the data involving only co-linear bases:data involving only co-linear bases:
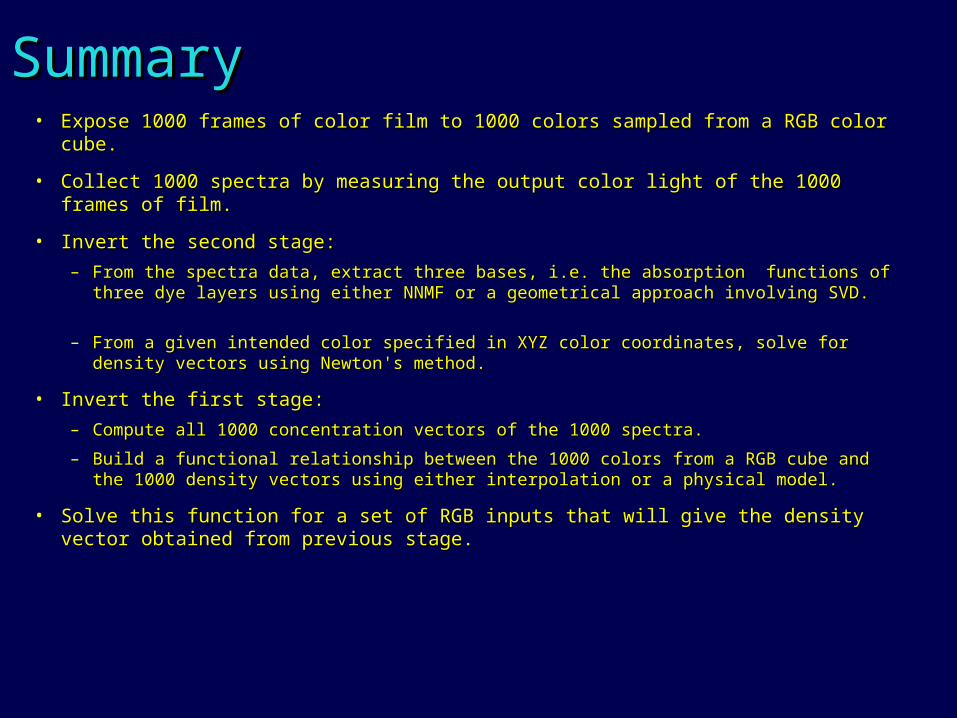
SummarySummary• Expose 1000 frames of color film to 1000 colors sampled from a RGB color Expose 1000 frames of color film to 1000 colors sampled from a RGB color
cube. cube.
• Collect 1000 spectra by measuring the output color light of the 1000 frames of Collect 1000 spectra by measuring the output color light of the 1000 frames of film.film.
• Invert the second stage: Invert the second stage:
– From the spectra data, extract three bases, i.e. the absorption functions of three From the spectra data, extract three bases, i.e. the absorption functions of three dye layers using either NNMF or a geometrical approach involving SVD. dye layers using either NNMF or a geometrical approach involving SVD.
– From a given intended color specified in XYZ color coordinates, solve for density From a given intended color specified in XYZ color coordinates, solve for density vectors using Newton's method. vectors using Newton's method.
• Invert the first stage: Invert the first stage:
– Compute all 1000 concentration vectors of the 1000 spectra. Compute all 1000 concentration vectors of the 1000 spectra.
– Build a functional relationship between the 1000 colors from a RGB cube and the Build a functional relationship between the 1000 colors from a RGB cube and the 1000 density vectors using either interpolation or a physical model. 1000 density vectors using either interpolation or a physical model.
• Solve this function for a set of RGB inputs that will give the density vector Solve this function for a set of RGB inputs that will give the density vector obtained from previous stage. obtained from previous stage.