Embed Size (px)
Citation preview
Colour palette for PowerPoint presentations
Actuarial Bright Green R148 G166 B31
Actuarial Slate R32 G44 B52 *
Secondary Olive Green R120 G162 B47
Secondary colour palette
Primary colour palette
Secondary Bottle Green R0 G147 B127
Secondary Turquoise R0 G138 B176
Secondary Aqua Blue R26 G160 B170
Secondary Pastel Green R126 G205 B195
Secondary Light Purple R123 G149 B174*
Secondary Purple R97 G107 B156
Secondary Ecru R186 G163 B171
Secondary Yellow R215 G176 B18
Secondary Orange R213 G135 B43
Secondary Red R238 G52 B36
Secondary Rubine Red R226 G1 B119
*This colour reference is for screen presentations only
A better Bootstrap, Mack, and the ELRF and PTF modelling Frameworks • Bootstrap technique- a powerful diagnostic tool for testing a
model; • The Bootstrap is a technique not a model; • When is the Bootstrap technique needed or necessary? • Bootstrap samples (are supposed to) replicate the statistical
features of the real loss development (array); • Two Families of models:
o Extended Link Ratio Family (ELRF) that includes Mack, Murphy and extensions/derivatives thereof;
o Probabilistic Trend Family (PTF) that fit a distribution to every cell, equivalently fit the trends in the three directions and the quality of the volatility about the trend structure
1
Colour palette for PowerPoint presentations
Actuarial Bright Green R148 G166 B31
Actuarial Slate R32 G44 B52 *
Secondary Olive Green R120 G162 B47
Secondary colour palette
Primary colour palette
Secondary Bottle Green R0 G147 B127
Secondary Turquoise R0 G138 B176
Secondary Aqua Blue R26 G160 B170
Secondary Pastel Green R126 G205 B195
Secondary Light Purple R123 G149 B174*
Secondary Purple R97 G107 B156
Secondary Ecru R186 G163 B171
Secondary Yellow R215 G176 B18
Secondary Orange R213 G135 B43
Secondary Red R238 G52 B36
Secondary Rubine Red R226 G1 B119
*This colour reference is for screen presentations only
Summary- Link Ratio Methods including Mack and relatives thereof
• Link ratio methods - Mack & Murphy & quasi-Poisson GLM are structure-less, information free, no descriptors of the features in the data. Give incorrect calendar period liability stream;
• On updating, estimates of mean ultimates may be grossly inconsistent;
• Bootstrap samples generated from Mack method are easily distinguishable from the real data;
• Mack, equivalently, volume weighted average (CL) link ratios do not distinguish between development and accident periods! It’s the same arithmetic irrespective of the statistical features in the data;
2
Colour palette for PowerPoint presentations
Actuarial Bright Green R148 G166 B31
Actuarial Slate R32 G44 B52 *
Secondary Olive Green R120 G162 B47
Secondary colour palette
Primary colour palette
Secondary Bottle Green R0 G147 B127
Secondary Turquoise R0 G138 B176
Secondary Aqua Blue R26 G160 B170
Secondary Pastel Green R126 G205 B195
Secondary Light Purple R123 G149 B174*
Secondary Purple R97 G107 B156
Secondary Ecru R186 G163 B171
Secondary Yellow R215 G176 B18
Secondary Orange R213 G135 B43
Secondary Red R238 G52 B36
Secondary Rubine Red R226 G1 B119
*This colour reference is for screen presentations only
Summary
• PTF (and MPTF) modeling framework for building single-/multi-triangle models that can capture trend structure and volatility in real data- the latter also the three types of correlations
• Identified model in PTF framework describes the trend structure and volatility succinctly (four pictures). All assumptions tested and validated.
• Model satisfies axiomatic trend properties of every real datset • Real loss triangle can be regarded as sample path from fitted
probabilistic model. Can’t tell the difference between real and simulated triangles. Also Bootstrap samples are indistinguishable from the real data
3
Colour palette for PowerPoint presentations
Actuarial Bright Green R148 G166 B31
Actuarial Slate R32 G44 B52 *
Secondary Olive Green R120 G162 B47
Secondary colour palette
Primary colour palette
Secondary Bottle Green R0 G147 B127
Secondary Turquoise R0 G138 B176
Secondary Aqua Blue R26 G160 B170
Secondary Pastel Green R126 G205 B195
Secondary Light Purple R123 G149 B174*
Secondary Purple R97 G107 B156
Secondary Ecru R186 G163 B171
Secondary Yellow R215 G176 B18
Secondary Orange R213 G135 B43
Secondary Red R238 G52 B36
Secondary Rubine Red R226 G1 B119
*This colour reference is for screen presentations only
Summary
• Two LOBs written by the same company rarely have the same trend structure (including in the calendar year direction) and often process (volatility) correlation is either zero or very low. Reserve distribution correlation is often zero and if significant quite low.
• No two companies are the same in respect of trend structure, and process (volatility) correlation is often zero (for the ‘same’ LOB).
• No company is the same as the industry, unless it is a very large proportion of the industry.
• All the above are demonstrated with real life data.
4
Colour palette for PowerPoint presentations
Actuarial Bright Green R148 G166 B31
Actuarial Slate R32 G44 B52 *
Secondary Olive Green R120 G162 B47
Secondary colour palette
Primary colour palette
Secondary Bottle Green R0 G147 B127
Secondary Turquoise R0 G138 B176
Secondary Aqua Blue R26 G160 B170
Secondary Pastel Green R126 G205 B195
Secondary Light Purple R123 G149 B174*
Secondary Purple R97 G107 B156
Secondary Ecru R186 G163 B171
Secondary Yellow R215 G176 B18
Secondary Orange R213 G135 B43
Secondary Red R238 G52 B36
Secondary Rubine Red R226 G1 B119
*This colour reference is for screen presentations only
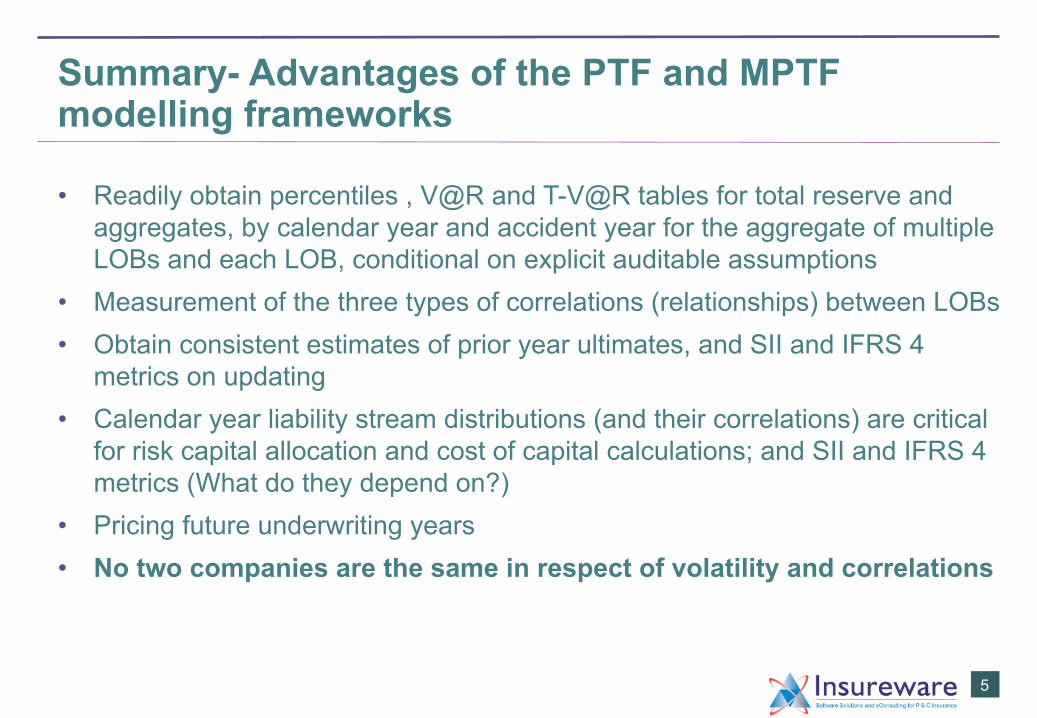
Summary- Advantages of the PTF and MPTF modelling frameworks
• Readily obtain percentiles , V@R and T-V@R tables for total reserve and aggregates, by calendar year and accident year for the aggregate of multiple LOBs and each LOB, conditional on explicit auditable assumptions
• Measurement of the three types of correlations (relationships) between LOBs • Obtain consistent estimates of prior year ultimates, and SII and IFRS 4
metrics on updating • Calendar year liability stream distributions (and their correlations) are critical
for risk capital allocation and cost of capital calculations; and SII and IFRS 4 metrics (What do they depend on?)
• Pricing future underwriting years • No two companies are the same in respect of volatility and correlations
5

Colour palette for PowerPoint presentations
Actuarial Bright Green R148 G166 B31
Actuarial Slate R32 G44 B52 *
Secondary Olive Green R120 G162 B47
Secondary colour palette
Primary colour palette
Secondary Bottle Green R0 G147 B127
Secondary Turquoise R0 G138 B176
Secondary Aqua Blue R26 G160 B170
Secondary Pastel Green R126 G205 B195
Secondary Light Purple R123 G149 B174*
Secondary Purple R97 G107 B156
Secondary Ecru R186 G163 B171
Secondary Yellow R215 G176 B18
Secondary Orange R213 G135 B43
Secondary Red R238 G52 B36
Secondary Rubine Red R226 G1 B119
*This colour reference is for screen presentations only
Variability and Uncertainty
• different concepts; not interchangeable
“Variability is a phenomenon in the physical world to be measured, analyzed and where appropriate explained. By contrast uncertainty is an aspect of knowledge.” – Sir David Cox
6
Colour palette for PowerPoint presentations
Actuarial Bright Green R148 G166 B31
Actuarial Slate R32 G44 B52 *
Secondary Olive Green R120 G162 B47
Secondary colour palette
Primary colour palette
Secondary Bottle Green R0 G147 B127
Secondary Turquoise R0 G138 B176
Secondary Aqua Blue R26 G160 B170
Secondary Pastel Green R126 G205 B195
Secondary Light Purple R123 G149 B174*
Secondary Purple R97 G107 B156
Secondary Ecru R186 G163 B171
Secondary Yellow R215 G176 B18
Secondary Orange R213 G135 B43
Secondary Red R238 G52 B36
Secondary Rubine Red R226 G1 B119
*This colour reference is for screen presentations only
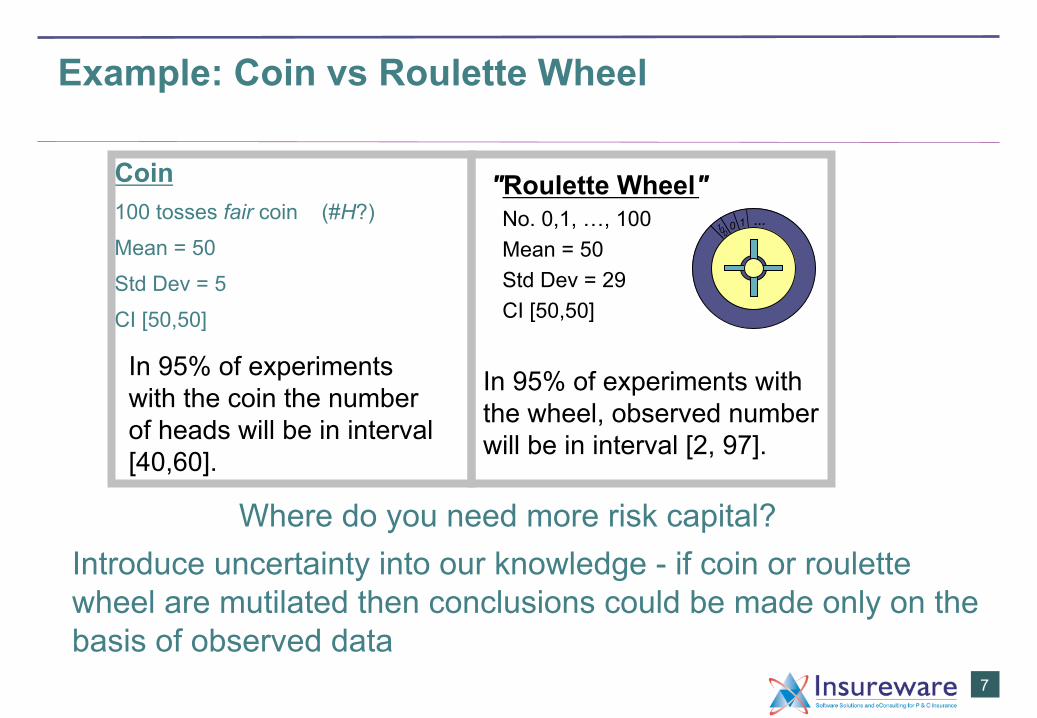
Example: Coin vs Roulette Wheel
Where do you need more risk capital? Introduce uncertainty into our knowledge - if coin or roulette wheel are mutilated then conclusions could be made only on the basis of observed data
7
Coin 100 tosses fair coin (#H?)
Mean = 50
Std Dev = 5
CI [50,50]
"Roulette Wheel" No. 0,1, …, 100 Mean = 50 Std Dev = 29 CI [50,50]
In 95% of experiments with the coin the number of heads will be in interval [40,60].
In 95% of experiments with the wheel, observed number will be in interval [2, 97].
… 1 0 1 0 0
Colour palette for PowerPoint presentations
Actuarial Bright Green R148 G166 B31
Actuarial Slate R32 G44 B52 *
Secondary Olive Green R120 G162 B47
Secondary colour palette
Primary colour palette
Secondary Bottle Green R0 G147 B127
Secondary Turquoise R0 G138 B176
Secondary Aqua Blue R26 G160 B170
Secondary Pastel Green R126 G205 B195
Secondary Light Purple R123 G149 B174*
Secondary Purple R97 G107 B156
Secondary Ecru R186 G163 B171
Secondary Yellow R215 G176 B18
Secondary Orange R213 G135 B43
Secondary Red R238 G52 B36
Secondary Rubine Red R226 G1 B119
*This colour reference is for screen presentations only
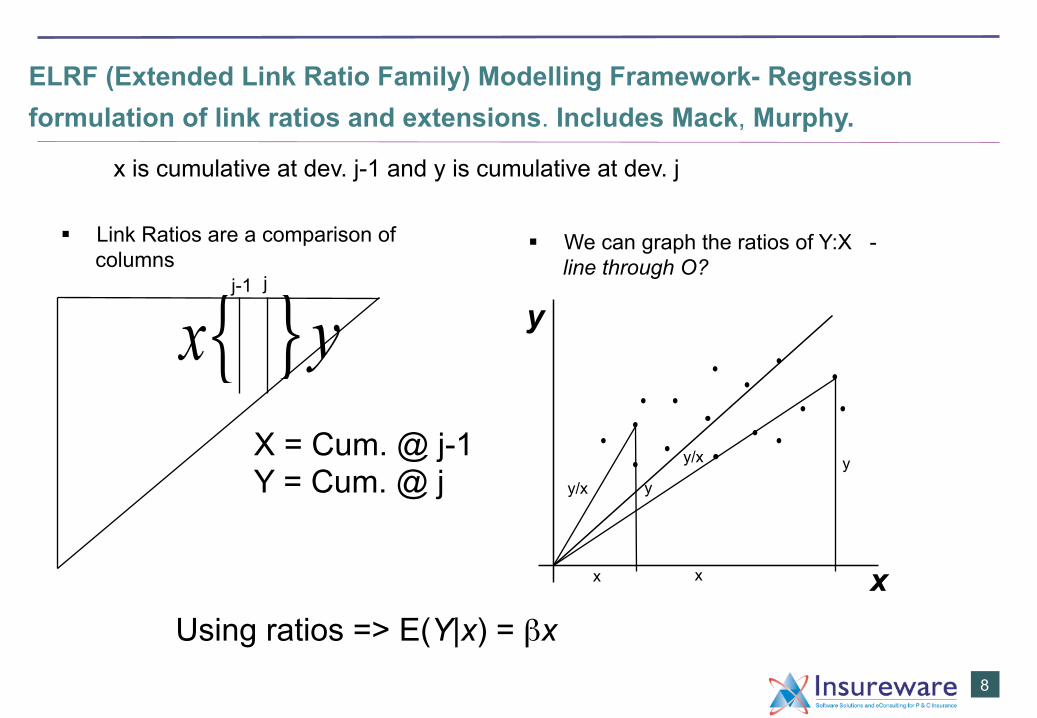
ELRF (Extended Link Ratio Family) Modelling Framework- Regression formulation of link ratios and extensions. Includes Mack, Murphy.
8
•
•• •
••
••
••
•
•
••
• •
}y{xX = Cum. @ j-1 Y = Cum. @ j
§ Link Ratios are a comparison of columns
j-1 j
y
x
§ We can graph the ratios of Y:X - line through O?
y/x y
x
y
x
y/x
Using ratios => E(Y|x) = βx
x is cumulative at dev. j-1 and y is cumulative at dev. j
Colour palette for PowerPoint presentations
Actuarial Bright Green R148 G166 B31
Actuarial Slate R32 G44 B52 *
Secondary Olive Green R120 G162 B47
Secondary colour palette
Primary colour palette
Secondary Bottle Green R0 G147 B127
Secondary Turquoise R0 G138 B176
Secondary Aqua Blue R26 G160 B170
Secondary Pastel Green R126 G205 B195
Secondary Light Purple R123 G149 B174*
Secondary Purple R97 G107 B156
Secondary Ecru R186 G163 B171
Secondary Yellow R215 G176 B18
Secondary Orange R213 G135 B43
Secondary Red R238 G52 B36
Secondary Rubine Red R226 G1 B119
*This colour reference is for screen presentations only
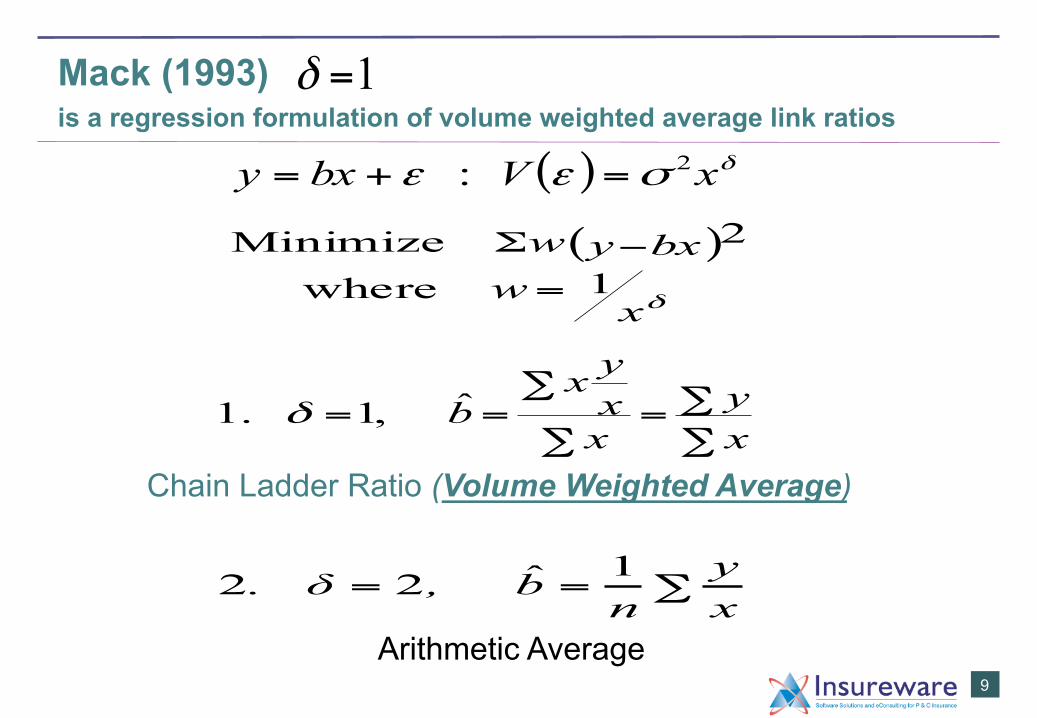
Mack (1993) is a regression formulation of volume weighted average link ratios
Chain Ladder Ratio (Volume Weighted Average)
9
( ) δσεε xVbxy 2 : =+=
∑∑=
∑
∑==
xy
xxyx
b̂ ,1 .1 δ
∑==xy
nb, . δ 1ˆ22
( )δx
wbxyw
1 where
2 Minimize=
−Σ
Arithmetic Average
1=δ
Colour palette for PowerPoint presentations
Actuarial Bright Green R148 G166 B31
Actuarial Slate R32 G44 B52 *
Secondary Olive Green R120 G162 B47
Secondary colour palette
Primary colour palette
Secondary Bottle Green R0 G147 B127
Secondary Turquoise R0 G138 B176
Secondary Aqua Blue R26 G160 B170
Secondary Pastel Green R126 G205 B195
Secondary Light Purple R123 G149 B174*
Secondary Purple R97 G107 B156
Secondary Ecru R186 G163 B171
Secondary Yellow R215 G176 B18
Secondary Orange R213 G135 B43
Secondary Red R238 G52 B36
Secondary Rubine Red R226 G1 B119
*This colour reference is for screen presentations only
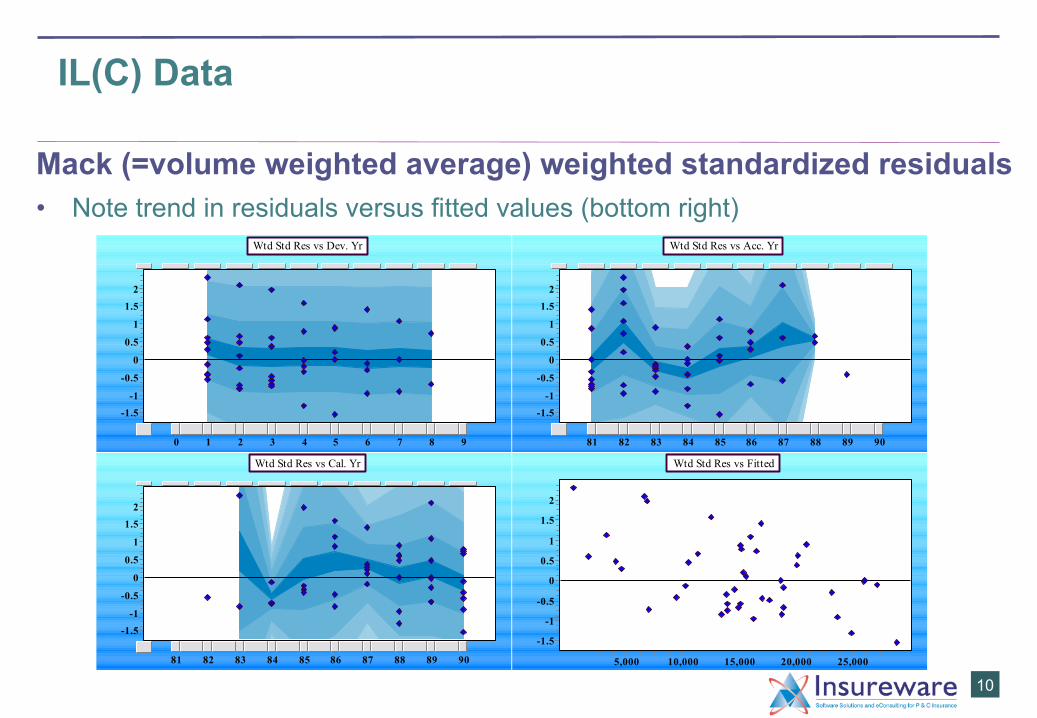
IL(C) Data
Mack (=volume weighted average) weighted standardized residuals • Note trend in residuals versus fitted values (bottom right)
10
Wtd Std Res vs Dev. Yr
0 1 2 3 4 5 6 7 8 9
-1.5-1
-0.5
0
0.5
1
1.52
Wtd Std Res vs Acc. Yr
81 82 83 84 85 86 87 88 89 90
-1.5-1
-0.5
0
0.5
1
1.52
Wtd Std Res vs Cal. Yr
81 82 83 84 85 86 87 88 89 90
-1.5-1
-0.5
0
0.5
1
1.52
Wtd Std Res vs Fitted
5,000 10,000 15,000 20,000 25,000
-1.5
-1
-0.5
0
0.5
1
1.5
2
Colour palette for PowerPoint presentations
Actuarial Bright Green R148 G166 B31
Actuarial Slate R32 G44 B52 *
Secondary Olive Green R120 G162 B47
Secondary colour palette
Primary colour palette
Secondary Bottle Green R0 G147 B127
Secondary Turquoise R0 G138 B176
Secondary Aqua Blue R26 G160 B170
Secondary Pastel Green R126 G205 B195
Secondary Light Purple R123 G149 B174*
Secondary Purple R97 G107 B156
Secondary Ecru R186 G163 B171
Secondary Yellow R215 G176 B18
Secondary Orange R213 G135 B43
Secondary Red R238 G52 B36
Secondary Rubine Red R226 G1 B119
*This colour reference is for screen presentations only
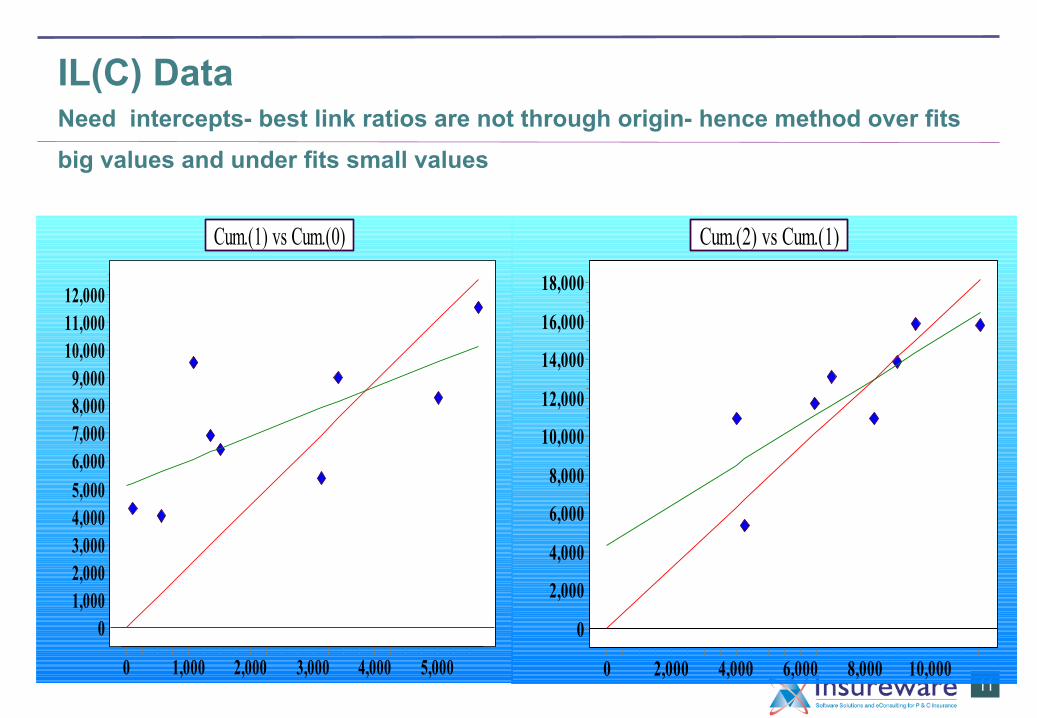
IL(C) Data Need intercepts- best link ratios are not through origin- hence method over fits big values and under fits small values
Cum.(1) vs Cum.(0)
0 1,000 2,000 3,000 4,000 5,000
01,0002,0003,0004,0005,0006,0007,0008,0009,00010,00011,00012,000
11
Cum.(2) vs Cum.(1)
0 2,000 4,000 6,000 8,000 10,000
0
2,000
4,000
6,000
8,000
10,000
12,000
14,000
16,000
18,000
Colour palette for PowerPoint presentations
Actuarial Bright Green R148 G166 B31
Actuarial Slate R32 G44 B52 *
Secondary Olive Green R120 G162 B47
Secondary colour palette
Primary colour palette
Secondary Bottle Green R0 G147 B127
Secondary Turquoise R0 G138 B176
Secondary Aqua Blue R26 G160 B170
Secondary Pastel Green R126 G205 B195
Secondary Light Purple R123 G149 B174*
Secondary Purple R97 G107 B156
Secondary Ecru R186 G163 B171
Secondary Yellow R215 G176 B18
Secondary Orange R213 G135 B43
Secondary Red R238 G52 B36
Secondary Rubine Red R226 G1 B119
*This colour reference is for screen presentations only
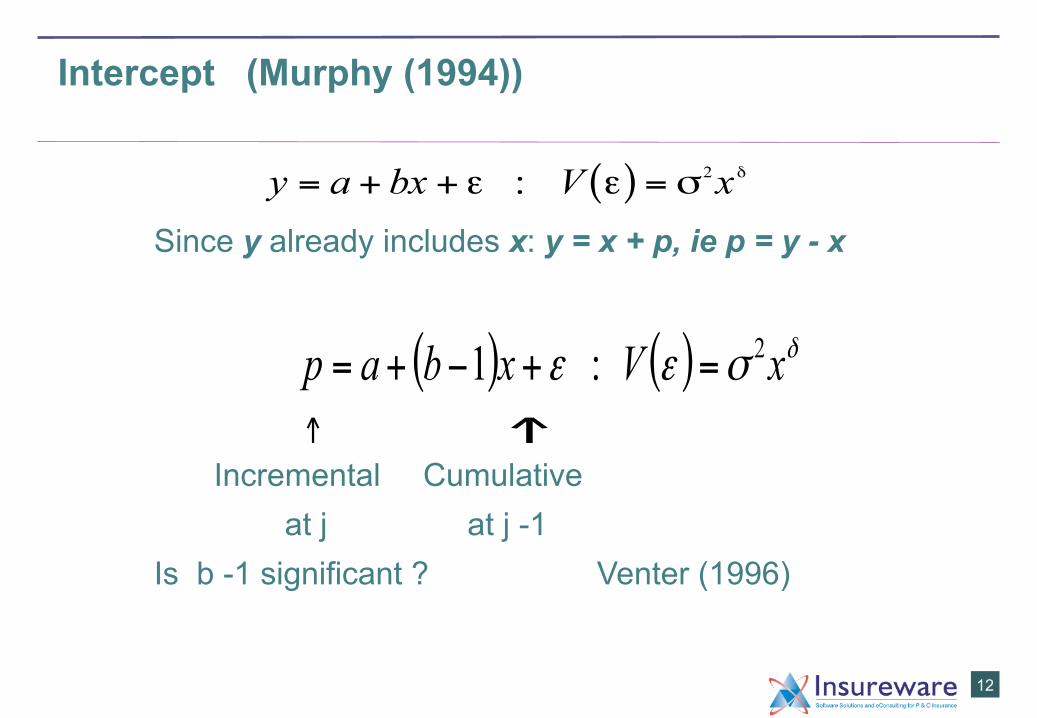
Intercept (Murphy (1994))
Since y already includes x: y = x + p, ie p = y - x
Incremental Cumulative at j at j -1 Is b -1 significant ? Venter (1996)
12
( )y a bx V x= + + =ε ε σ δ : 2
↑↑
( ) ( ) δσεε xVxbap 2 : 1 =+−+=
Colour palette for PowerPoint presentations
Actuarial Bright Green R148 G166 B31
Actuarial Slate R32 G44 B52 *
Secondary Olive Green R120 G162 B47
Secondary colour palette
Primary colour palette
Secondary Bottle Green R0 G147 B127
Secondary Turquoise R0 G138 B176
Secondary Aqua Blue R26 G160 B170
Secondary Pastel Green R126 G205 B195
Secondary Light Purple R123 G149 B174*
Secondary Purple R97 G107 B156
Secondary Ecru R186 G163 B171
Secondary Yellow R215 G176 B18
Secondary Orange R213 G135 B43
Secondary Red R238 G52 B36
Secondary Rubine Red R226 G1 B119
*This colour reference is for screen presentations only
Incr.(2) vs Cum.(1)
Corr. = 0.065, P-value = 0.8786,000 8,000 10,000
1,5002,0002,5003,0003,5004,0004,5005,0005,5006,0006,500
Incr.(1) vs Cum.(0)
Corr. = -0.117, P-value = 0.7641,000 2,000 3,000 4,000 5,000
2,5003,0003,5004,0004,5005,0005,5006,0006,5007,0007,5008,000
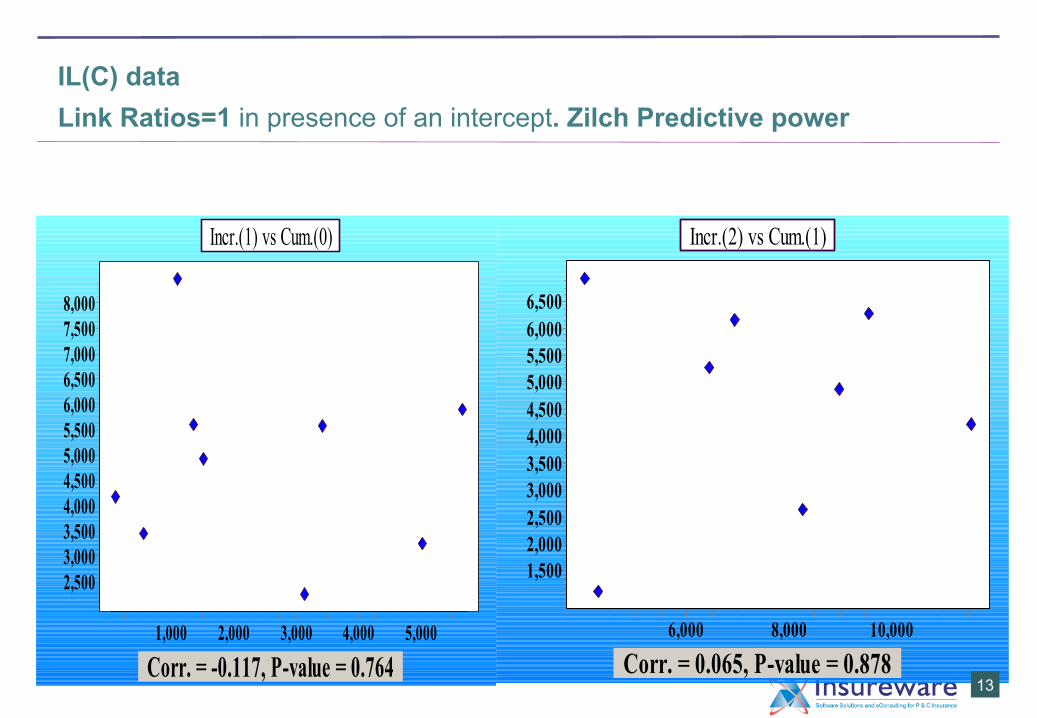
IL(C) data Link Ratios=1 in presence of an intercept. Zilch Predictive power
13
Incremental incurred not correlated to previous period cumulatives!
Colour palette for PowerPoint presentations
Actuarial Bright Green R148 G166 B31
Actuarial Slate R32 G44 B52 *
Secondary Olive Green R120 G162 B47
Secondary colour palette
Primary colour palette
Secondary Bottle Green R0 G147 B127
Secondary Turquoise R0 G138 B176
Secondary Aqua Blue R26 G160 B170
Secondary Pastel Green R126 G205 B195
Secondary Light Purple R123 G149 B174*
Secondary Purple R97 G107 B156
Secondary Ecru R186 G163 B171
Secondary Yellow R215 G176 B18
Secondary Orange R213 G135 B43
Secondary Red R238 G52 B36
Secondary Rubine Red R226 G1 B119
*This colour reference is for screen presentations only
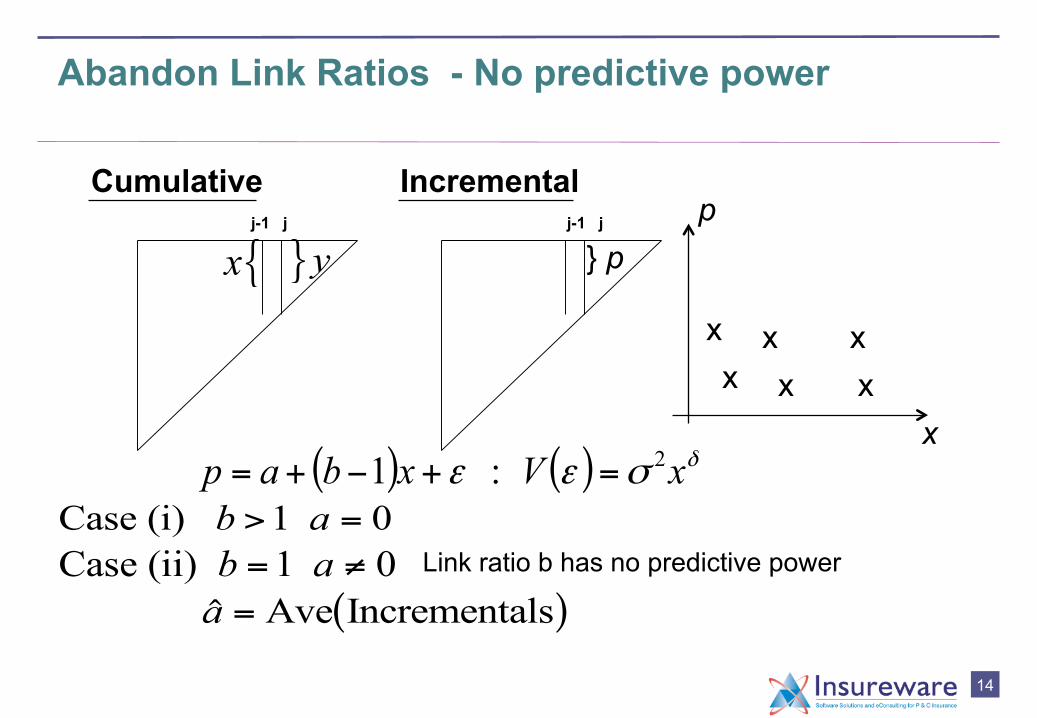
Abandon Link Ratios - No predictive power
14
Case (ii) b a= ≠1 0
( ) ( ) δσεε xVxbap 2 : 1 =+−+=Case (i) b a> =1 0
( )a = Ave Incrementals
}y{x j-1 j j-1 j
} p
x x x x
x x
x
p Cumulative Incremental
Link ratio b has no predictive power
Colour palette for PowerPoint presentations
Actuarial Bright Green R148 G166 B31
Actuarial Slate R32 G44 B52 *
Secondary Olive Green R120 G162 B47
Secondary colour palette
Primary colour palette
Secondary Bottle Green R0 G147 B127
Secondary Turquoise R0 G138 B176
Secondary Aqua Blue R26 G160 B170
Secondary Pastel Green R126 G205 B195
Secondary Light Purple R123 G149 B174*
Secondary Purple R97 G107 B156
Secondary Ecru R186 G163 B171
Secondary Yellow R215 G176 B18
Secondary Orange R213 G135 B43
Secondary Red R238 G52 B36
Secondary Rubine Red R226 G1 B119
*This colour reference is for screen presentations only
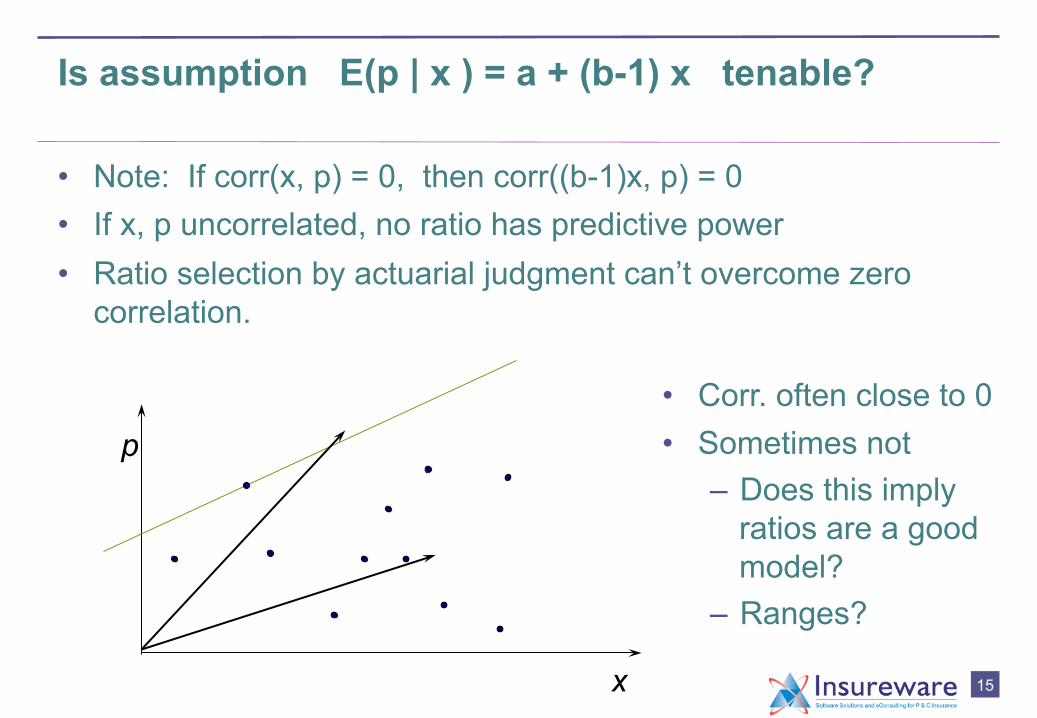
Is assumption E(p | x ) = a + (b-1) x tenable?
• Note: If corr(x, p) = 0, then corr((b-1)x, p) = 0 • If x, p uncorrelated, no ratio has predictive power • Ratio selection by actuarial judgment can’t overcome zero
correlation.
• Corr. often close to 0 • Sometimes not
– Does this imply ratios are a good model?
– Ranges?
15
p
x
Colour palette for PowerPoint presentations
Actuarial Bright Green R148 G166 B31
Actuarial Slate R32 G44 B52 *
Secondary Olive Green R120 G162 B47
Secondary colour palette
Primary colour palette
Secondary Bottle Green R0 G147 B127
Secondary Turquoise R0 G138 B176
Secondary Aqua Blue R26 G160 B170
Secondary Pastel Green R126 G205 B195
Secondary Light Purple R123 G149 B174*
Secondary Purple R97 G107 B156
Secondary Ecru R186 G163 B171
Secondary Yellow R215 G176 B18
Secondary Orange R213 G135 B43
Secondary Red R238 G52 B36
Secondary Rubine Red R226 G1 B119
*This colour reference is for screen presentations only
x
x x
x
x
x
x x
16
j-1 j
} p }y{x
j-1 j
w
90 91 92
Cumulative Incremental
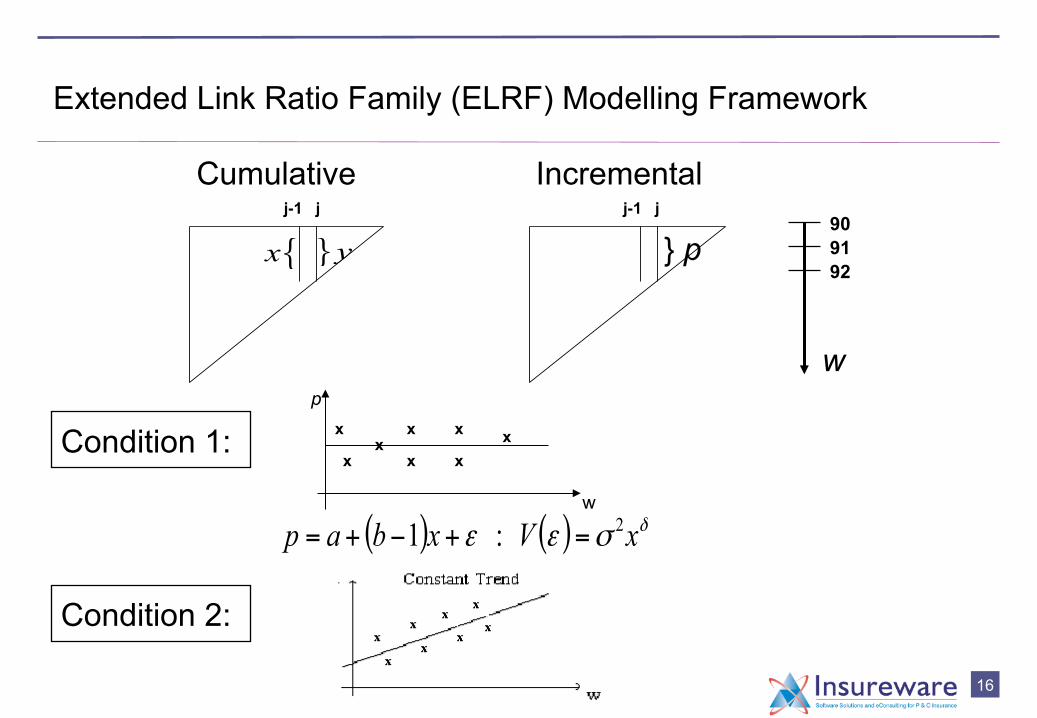
Condition 1: p
w
Condition 2:
( ) ( ) δσεε xVxbap 2 : 1 =+−+=
Extended Link Ratio Family (ELRF) Modelling Framework
Colour palette for PowerPoint presentations
Actuarial Bright Green R148 G166 B31
Actuarial Slate R32 G44 B52 *
Secondary Olive Green R120 G162 B47
Secondary colour palette
Primary colour palette
Secondary Bottle Green R0 G147 B127
Secondary Turquoise R0 G138 B176
Secondary Aqua Blue R26 G160 B170
Secondary Pastel Green R126 G205 B195
Secondary Light Purple R123 G149 B174*
Secondary Purple R97 G107 B156
Secondary Ecru R186 G163 B171
Secondary Yellow R215 G176 B18
Secondary Orange R213 G135 B43
Secondary Red R238 G52 B36
Secondary Rubine Red R226 G1 B119
*This colour reference is for screen presentations only
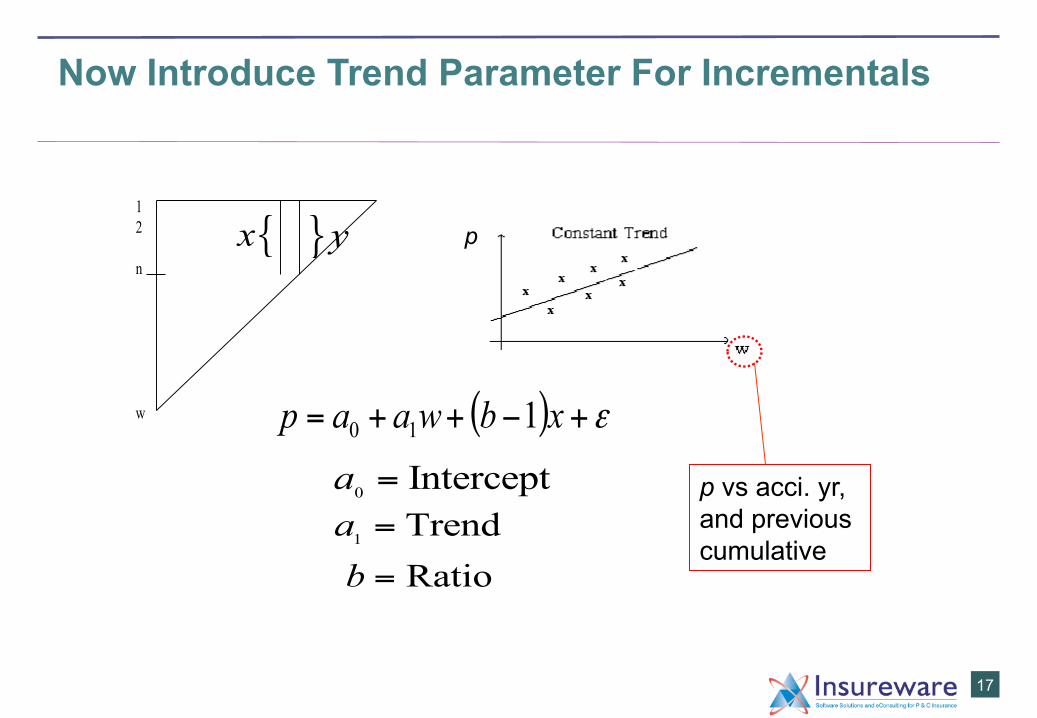
Now Introduce Trend Parameter For Incrementals
17
12
n
w
{x }y
( ) ε+−++= xbwaap 110
a0 = Intercepta1 = Trendb = Ratio
p
p vs acci. yr, and previous cumulative
Colour palette for PowerPoint presentations
Actuarial Bright Green R148 G166 B31
Actuarial Slate R32 G44 B52 *
Secondary Olive Green R120 G162 B47
Secondary colour palette
Primary colour palette
Secondary Bottle Green R0 G147 B127
Secondary Turquoise R0 G138 B176
Secondary Aqua Blue R26 G160 B170
Secondary Pastel Green R126 G205 B195
Secondary Light Purple R123 G149 B174*
Secondary Purple R97 G107 B156
Secondary Ecru R186 G163 B171
Secondary Yellow R215 G176 B18
Secondary Orange R213 G135 B43
Secondary Red R238 G52 B36
Secondary Rubine Red R226 G1 B119
*This colour reference is for screen presentations only
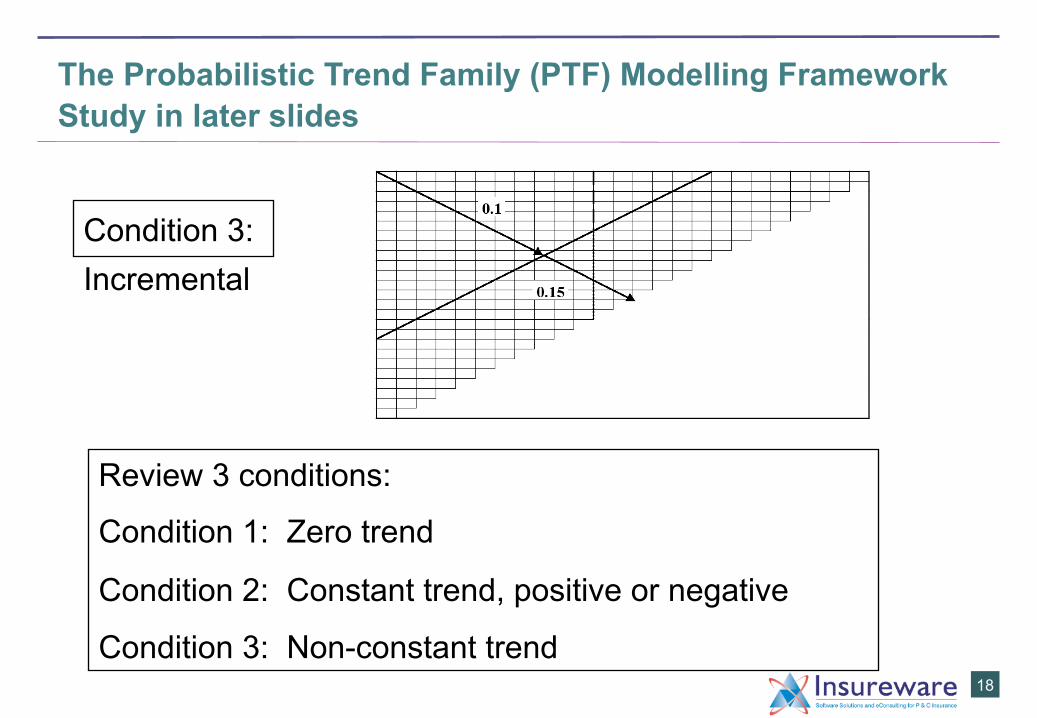
The Probabilistic Trend Family (PTF) Modelling Framework Study in later slides
18
Condition 3: Incremental
Review 3 conditions:
Condition 1: Zero trend
Condition 2: Constant trend, positive or negative
Condition 3: Non-constant trend
Colour palette for PowerPoint presentations
Actuarial Bright Green R148 G166 B31
Actuarial Slate R32 G44 B52 *
Secondary Olive Green R120 G162 B47
Secondary colour palette
Primary colour palette
Secondary Bottle Green R0 G147 B127
Secondary Turquoise R0 G138 B176
Secondary Aqua Blue R26 G160 B170
Secondary Pastel Green R126 G205 B195
Secondary Light Purple R123 G149 B174*
Secondary Purple R97 G107 B156
Secondary Ecru R186 G163 B171
Secondary Yellow R215 G176 B18
Secondary Orange R213 G135 B43
Secondary Red R238 G52 B36
Secondary Rubine Red R226 G1 B119
*This colour reference is for screen presentations only
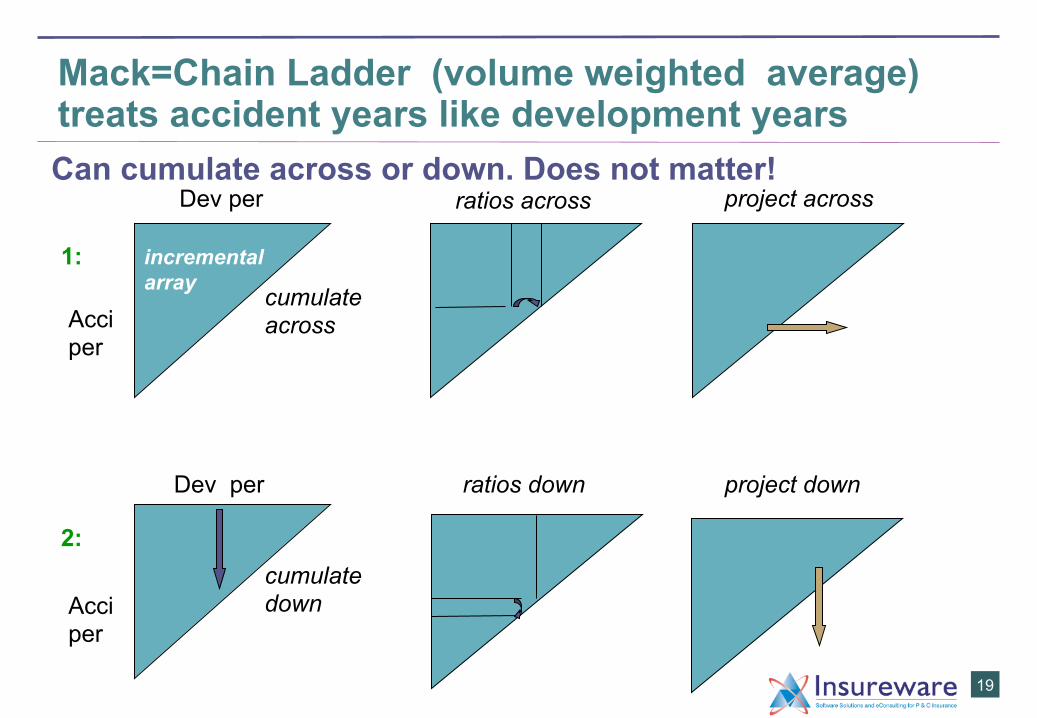
Mack=Chain Ladder (volume weighted average) treats accident years like development years Can cumulate across or down. Does not matter!
19
Dev per
Acci per
ratios across
Dev per
Acci per
cumulate across
cumulate down
ratios down project down
incremental array
2:
1:
project across
Colour palette for PowerPoint presentations
Actuarial Bright Green R148 G166 B31
Actuarial Slate R32 G44 B52 *
Secondary Olive Green R120 G162 B47
Secondary colour palette
Primary colour palette
Secondary Bottle Green R0 G147 B127
Secondary Turquoise R0 G138 B176
Secondary Aqua Blue R26 G160 B170
Secondary Pastel Green R126 G205 B195
Secondary Light Purple R123 G149 B174*
Secondary Purple R97 G107 B156
Secondary Ecru R186 G163 B171
Secondary Yellow R215 G176 B18
Secondary Orange R213 G135 B43
Secondary Red R238 G52 B36
Secondary Rubine Red R226 G1 B119
*This colour reference is for screen presentations only
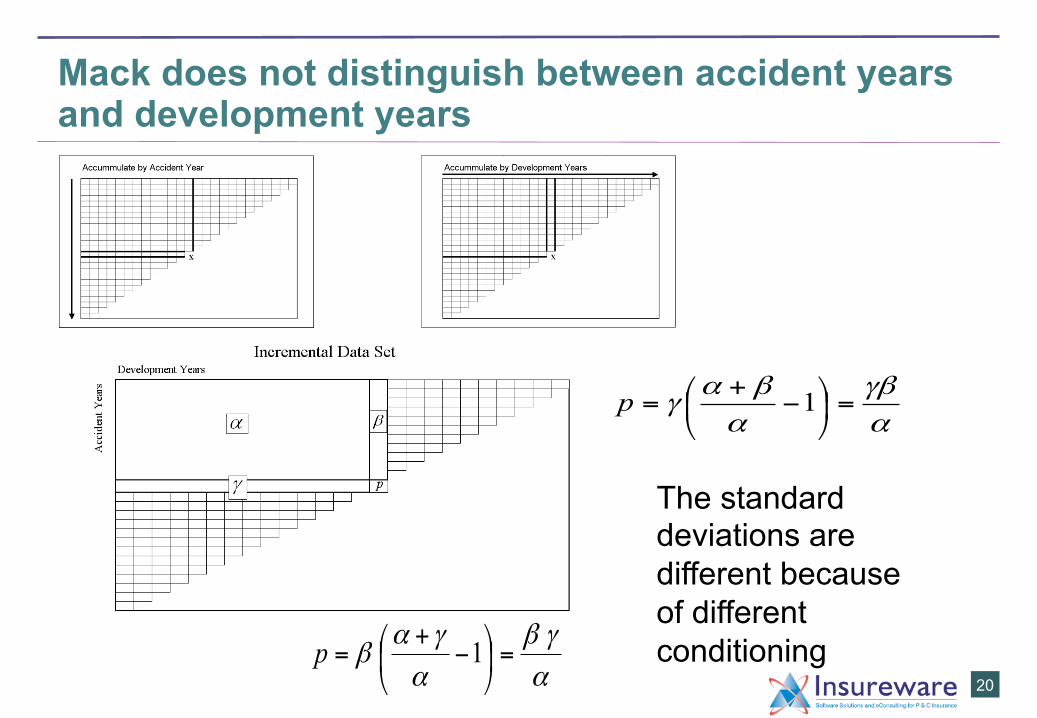
Mack does not distinguish between accident years and development years
20
αγβ
αβα
γ =⎟⎠
⎞⎜⎝
⎛ −+
= 1p
αγβ
αγα
β =⎟⎠
⎞⎜⎝
⎛ −+
= 1p
The standard deviations are different because of different conditioning
Colour palette for PowerPoint presentations
Actuarial Bright Green R148 G166 B31
Actuarial Slate R32 G44 B52 *
Secondary Olive Green R120 G162 B47
Secondary colour palette
Primary colour palette
Secondary Bottle Green R0 G147 B127
Secondary Turquoise R0 G138 B176
Secondary Aqua Blue R26 G160 B170
Secondary Pastel Green R126 G205 B195
Secondary Light Purple R123 G149 B174*
Secondary Purple R97 G107 B156
Secondary Ecru R186 G163 B171
Secondary Yellow R215 G176 B18
Secondary Orange R213 G135 B43
Secondary Red R238 G52 B36
Secondary Rubine Red R226 G1 B119
*This colour reference is for screen presentations only
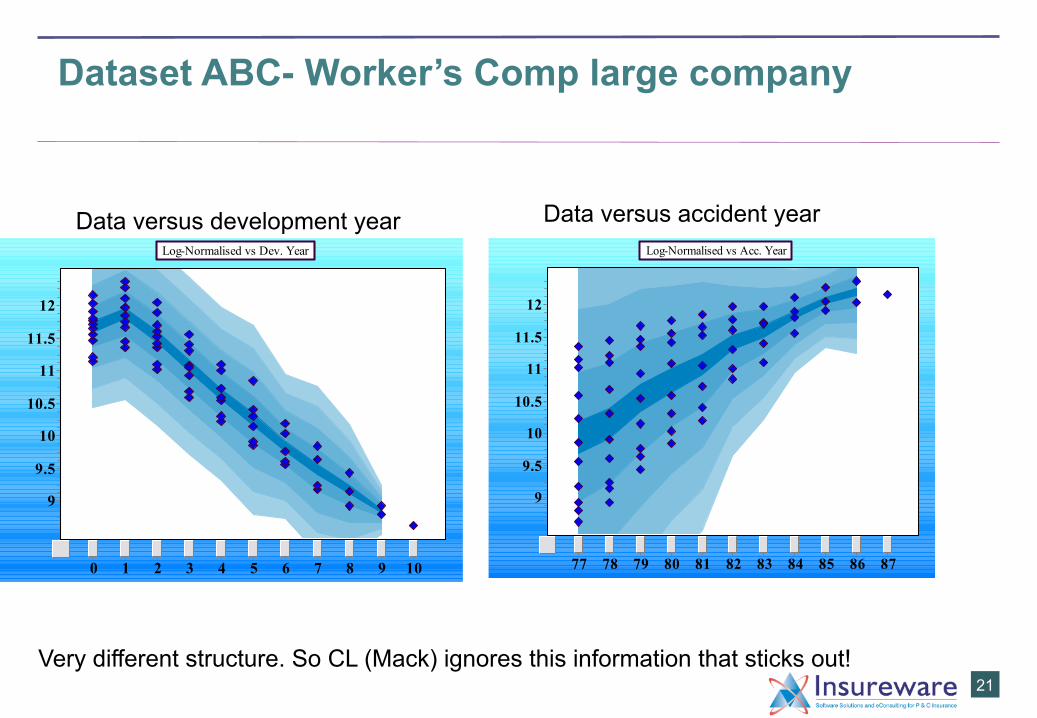
Dataset ABC- Worker’s Comp large company
Log-Normalised vs Dev. Year
0 1 2 3 4 5 6 7 8 9 10
9
9.5
10
10.5
11
11.5
12
21
Data versus development year Log-Normalised vs Acc. Year
77 78 79 80 81 82 83 84 85 86 87
9
9.5
10
10.5
11
11.5
12
Data versus accident year
Very different structure. So CL (Mack) ignores this information that sticks out!
Colour palette for PowerPoint presentations
Actuarial Bright Green R148 G166 B31
Actuarial Slate R32 G44 B52 *
Secondary Olive Green R120 G162 B47
Secondary colour palette
Primary colour palette
Secondary Bottle Green R0 G147 B127
Secondary Turquoise R0 G138 B176
Secondary Aqua Blue R26 G160 B170
Secondary Pastel Green R126 G205 B195
Secondary Light Purple R123 G149 B174*
Secondary Purple R97 G107 B156
Secondary Ecru R186 G163 B171
Secondary Yellow R215 G176 B18
Secondary Orange R213 G135 B43
Secondary Red R238 G52 B36
Secondary Rubine Red R226 G1 B119
*This colour reference is for screen presentations only
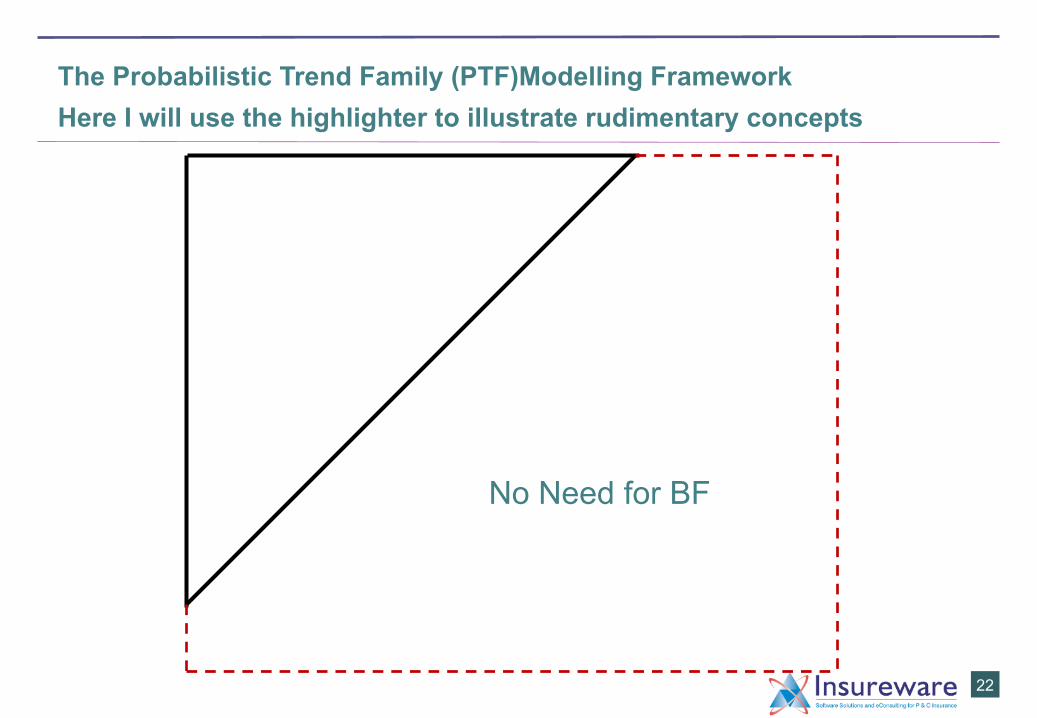
The Probabilistic Trend Family (PTF)Modelling Framework Here I will use the highlighter to illustrate rudimentary concepts
22
No Need for BF
Colour palette for PowerPoint presentations
Actuarial Bright Green R148 G166 B31
Actuarial Slate R32 G44 B52 *
Secondary Olive Green R120 G162 B47
Secondary colour palette
Primary colour palette
Secondary Bottle Green R0 G147 B127
Secondary Turquoise R0 G138 B176
Secondary Aqua Blue R26 G160 B170
Secondary Pastel Green R126 G205 B195
Secondary Light Purple R123 G149 B174*
Secondary Purple R97 G107 B156
Secondary Ecru R186 G163 B171
Secondary Yellow R215 G176 B18
Secondary Orange R213 G135 B43
Secondary Red R238 G52 B36
Secondary Rubine Red R226 G1 B119
*This colour reference is for screen presentations only
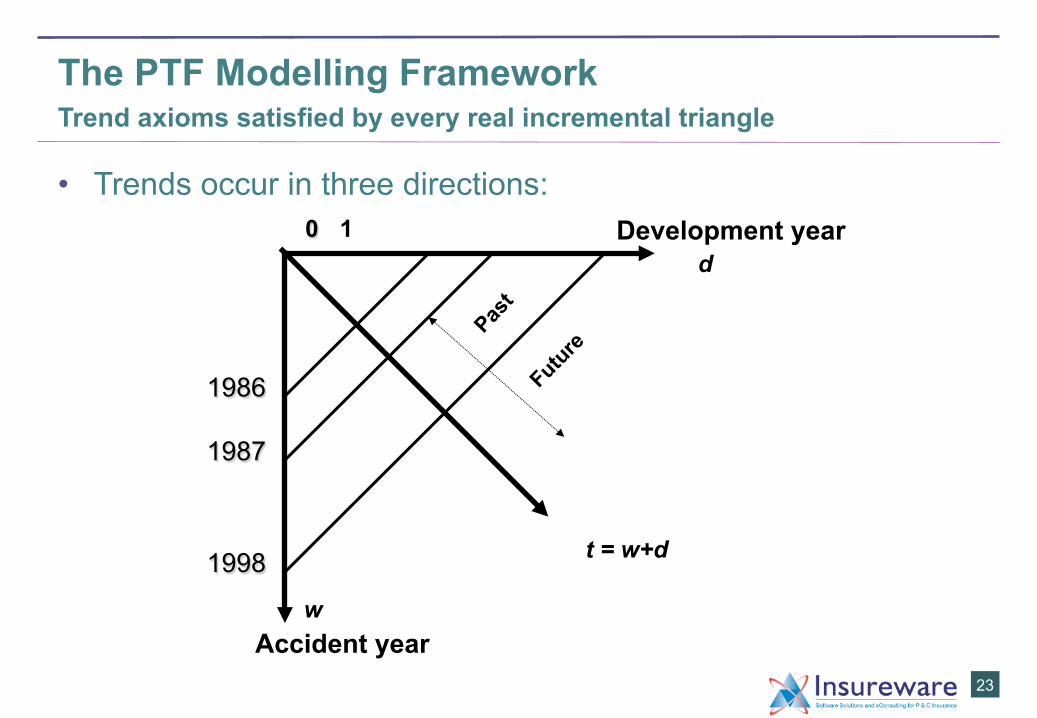
The PTF Modelling Framework Trend axioms satisfied by every real incremental triangle
• Trends occur in three directions:
23
1 0 d
t = w+d
Development year
Accident year w
1986
1987
1998
Colour palette for PowerPoint presentations
Actuarial Bright Green R148 G166 B31
Actuarial Slate R32 G44 B52 *
Secondary Olive Green R120 G162 B47
Secondary colour palette
Primary colour palette
Secondary Bottle Green R0 G147 B127
Secondary Turquoise R0 G138 B176
Secondary Aqua Blue R26 G160 B170
Secondary Pastel Green R126 G205 B195
Secondary Light Purple R123 G149 B174*
Secondary Purple R97 G107 B156
Secondary Ecru R186 G163 B171
Secondary Yellow R215 G176 B18
Secondary Orange R213 G135 B43
Secondary Red R238 G52 B36
Secondary Rubine Red R226 G1 B119
*This colour reference is for screen presentations only
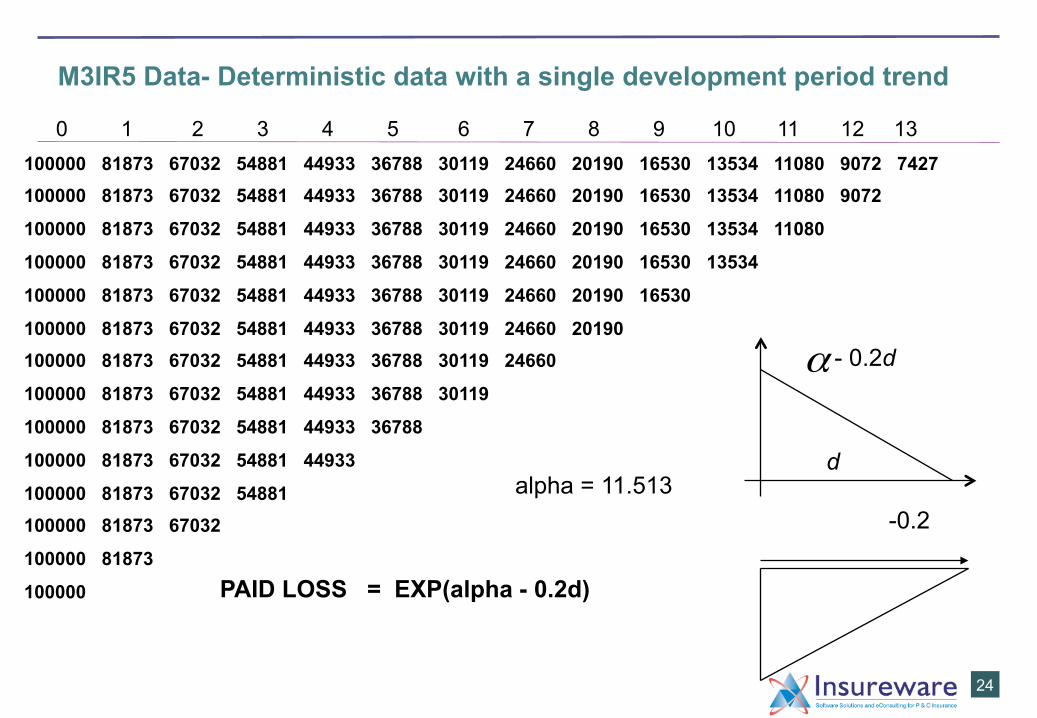
M3IR5 Data- Deterministic data with a single development period trend
100000 81873 67032 54881 44933 36788 30119 24660 20190 16530 13534 11080 9072 7427 100000 81873 67032 54881 44933 36788 30119 24660 20190 16530 13534 11080 9072
100000 81873 67032 54881 44933 36788 30119 24660 20190 16530 13534 11080
100000 81873 67032 54881 44933 36788 30119 24660 20190 16530 13534
100000 81873 67032 54881 44933 36788 30119 24660 20190 16530
100000 81873 67032 54881 44933 36788 30119 24660 20190 100000 81873 67032 54881 44933 36788 30119 24660
100000 81873 67032 54881 44933 36788 30119
100000 81873 67032 54881 44933 36788
100000 81873 67032 54881 44933
100000 81873 67032 54881 100000 81873 67032
100000 81873
100000
24
0 1 2 3 4 5 6 7 8 9 10 11 12 13
α - 0.2d
d
PAID LOSS = EXP(alpha - 0.2d)
-0.2 alpha = 11.513
Colour palette for PowerPoint presentations
Actuarial Bright Green R148 G166 B31
Actuarial Slate R32 G44 B52 *
Secondary Olive Green R120 G162 B47
Secondary colour palette
Primary colour palette
Secondary Bottle Green R0 G147 B127
Secondary Turquoise R0 G138 B176
Secondary Aqua Blue R26 G160 B170
Secondary Pastel Green R126 G205 B195
Secondary Light Purple R123 G149 B174*
Secondary Purple R97 G107 B156
Secondary Ecru R186 G163 B171
Secondary Yellow R215 G176 B18
Secondary Orange R213 G135 B43
Secondary Red R238 G52 B36
Secondary Rubine Red R226 G1 B119
*This colour reference is for screen presentations only
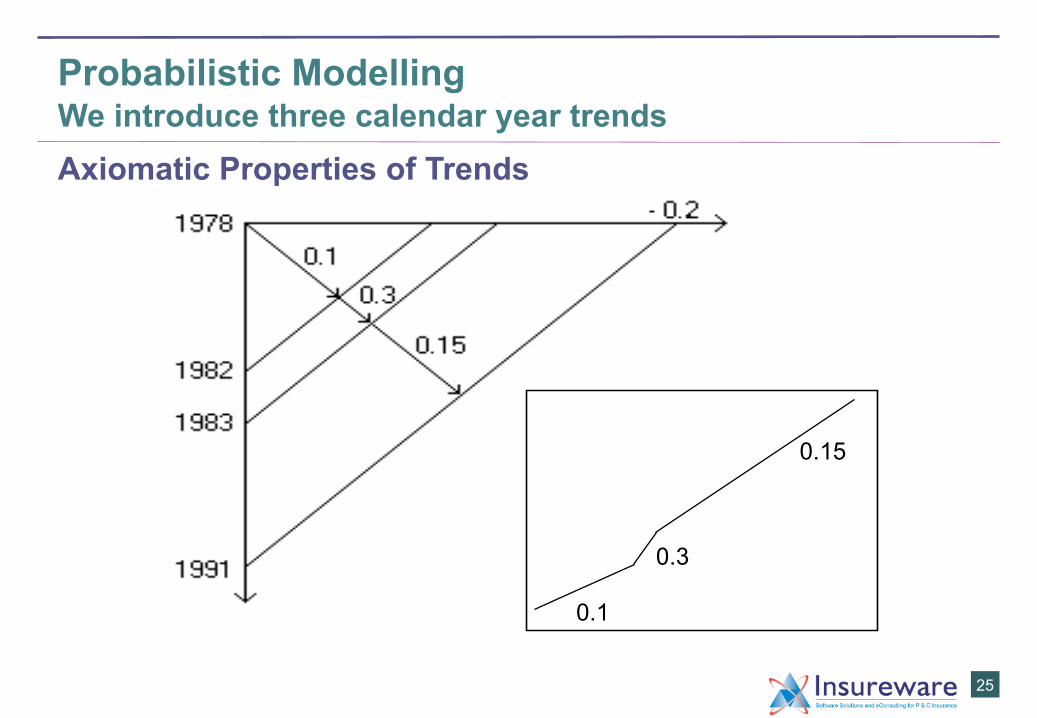
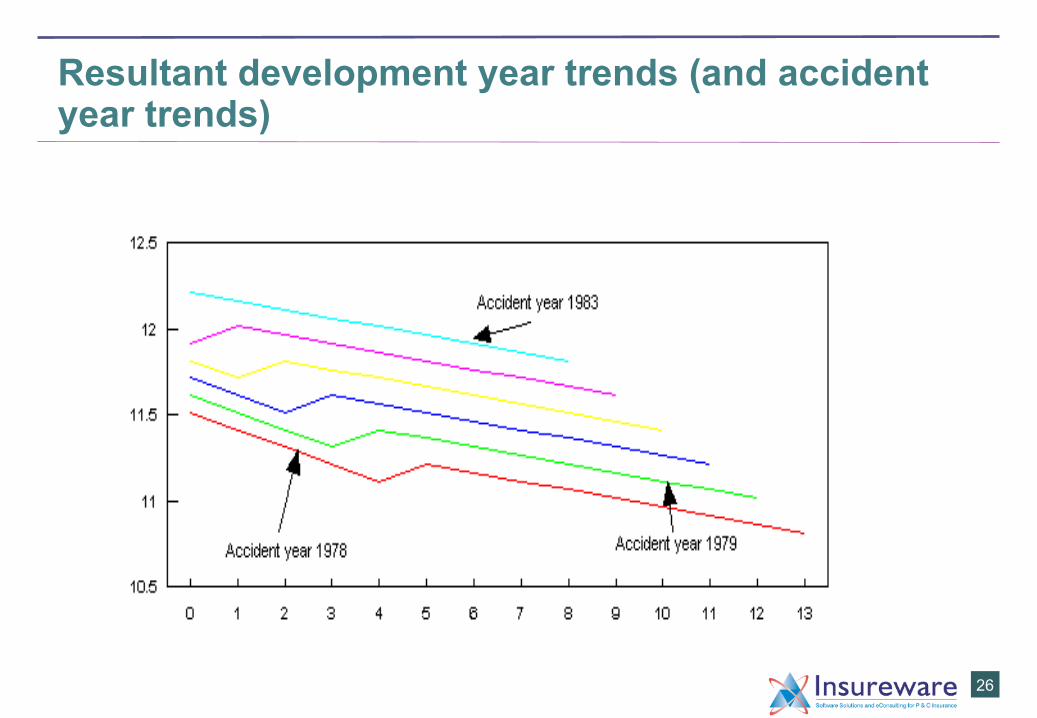
Probabilistic Modelling We introduce three calendar year trends Axiomatic Properties of Trends
25
0.1
0.3
0.15
Colour palette for PowerPoint presentations
Actuarial Bright Green R148 G166 B31
Actuarial Slate R32 G44 B52 *
Secondary Olive Green R120 G162 B47
Secondary colour palette
Primary colour palette
Secondary Bottle Green R0 G147 B127
Secondary Turquoise R0 G138 B176
Secondary Aqua Blue R26 G160 B170
Secondary Pastel Green R126 G205 B195
Secondary Light Purple R123 G149 B174*
Secondary Purple R97 G107 B156
Secondary Ecru R186 G163 B171
Secondary Yellow R215 G176 B18
Secondary Orange R213 G135 B43
Secondary Red R238 G52 B36
Secondary Rubine Red R226 G1 B119
*This colour reference is for screen presentations only
Resultant development year trends (and accident year trends)
26
hidden block
Colour palette for PowerPoint presentations
Actuarial Bright Green R148 G166 B31
Actuarial Slate R32 G44 B52 *
Secondary Olive Green R120 G162 B47
Secondary colour palette
Primary colour palette
Secondary Bottle Green R0 G147 B127
Secondary Turquoise R0 G138 B176
Secondary Aqua Blue R26 G160 B170
Secondary Pastel Green R126 G205 B195
Secondary Light Purple R123 G149 B174*
Secondary Purple R97 G107 B156
Secondary Ecru R186 G163 B171
Secondary Yellow R215 G176 B18
Secondary Orange R213 G135 B43
Secondary Red R238 G52 B36
Secondary Rubine Red R226 G1 B119
*This colour reference is for screen presentations only
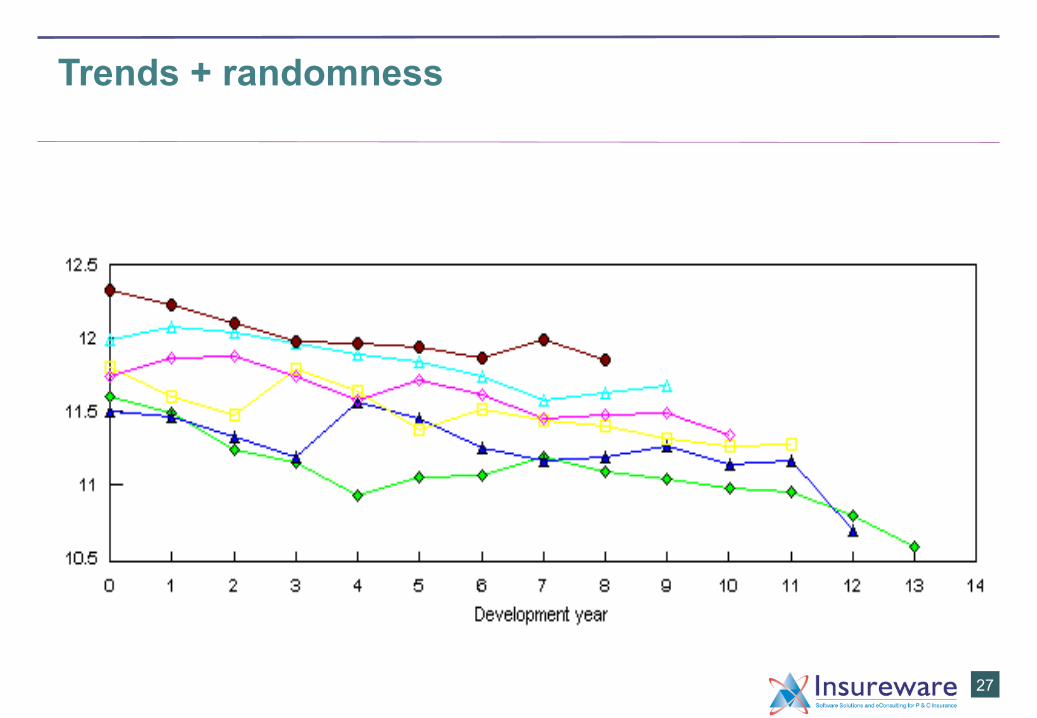
Trends + randomness
27
hidden block
Colour palette for PowerPoint presentations
Actuarial Bright Green R148 G166 B31
Actuarial Slate R32 G44 B52 *
Secondary Olive Green R120 G162 B47
Secondary colour palette
Primary colour palette
Secondary Bottle Green R0 G147 B127
Secondary Turquoise R0 G138 B176
Secondary Aqua Blue R26 G160 B170
Secondary Pastel Green R126 G205 B195
Secondary Light Purple R123 G149 B174*
Secondary Purple R97 G107 B156
Secondary Ecru R186 G163 B171
Secondary Yellow R215 G176 B18
Secondary Orange R213 G135 B43
Secondary Red R238 G52 B36
Secondary Rubine Red R226 G1 B119
*This colour reference is for screen presentations only
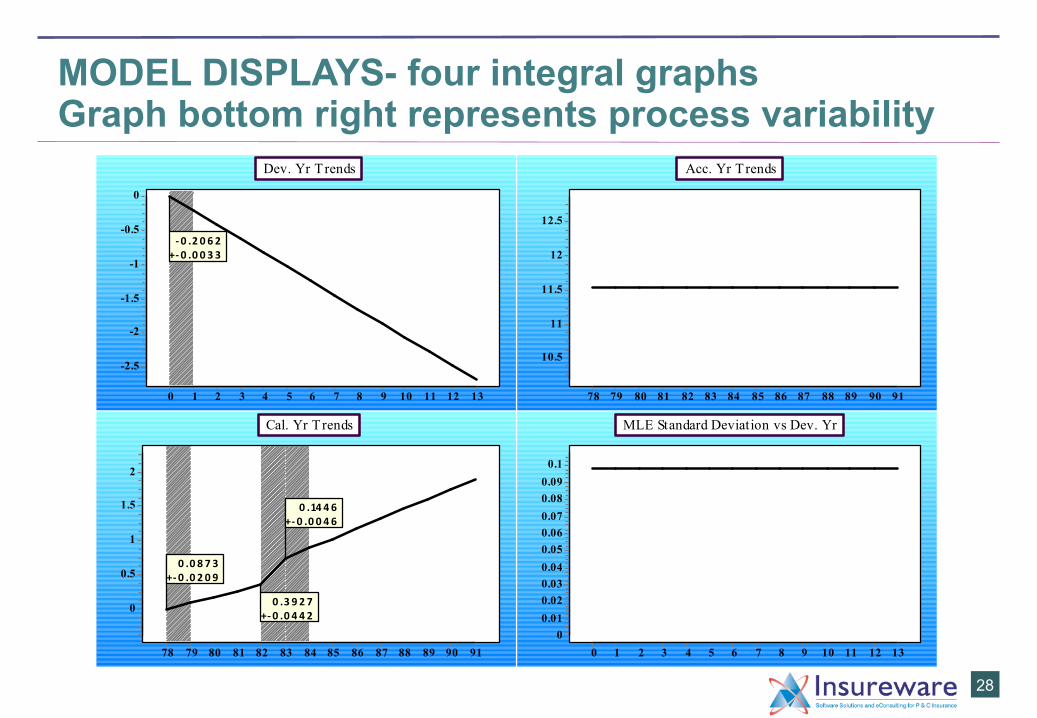
MODEL DISPLAYS- four integral graphs Graph bottom right represents process variability
28
Dev. Yr Trends
0 1 2 3 4 5 6 7 8 9 10 11 12 13
-2.5
-2
-1.5
-1
-0.5
0
-‐ 0 .2 0 6 2+-‐ 0 .0 0 3 3
Acc. Yr Trends
78 79 80 81 82 83 84 85 86 87 88 89 90 91
10.5
11
11.5
12
12.5
Cal. Yr Trends
78 79 80 81 82 83 84 85 86 87 88 89 90 91
0
0.5
1
1.5
2
0 .0 8 7 3+-‐ 0 .0 2 0 9
0 .3 9 2 7+-‐ 0 .0 4 4 2
0 .14 4 6+-‐ 0 .0 0 4 6
MLE Standard Deviation vs Dev. Yr
0 1 2 3 4 5 6 7 8 9 10 11 12 130
0.010.020.030.040.050.060.070.080.090.1
Colour palette for PowerPoint presentations
Actuarial Bright Green R148 G166 B31
Actuarial Slate R32 G44 B52 *
Secondary Olive Green R120 G162 B47
Secondary colour palette
Primary colour palette
Secondary Bottle Green R0 G147 B127
Secondary Turquoise R0 G138 B176
Secondary Aqua Blue R26 G160 B170
Secondary Pastel Green R126 G205 B195
Secondary Light Purple R123 G149 B174*
Secondary Purple R97 G107 B156
Secondary Ecru R186 G163 B171
Secondary Yellow R215 G176 B18
Secondary Orange R213 G135 B43
Secondary Red R238 G52 B36
Secondary Rubine Red R226 G1 B119
*This colour reference is for screen presentations only
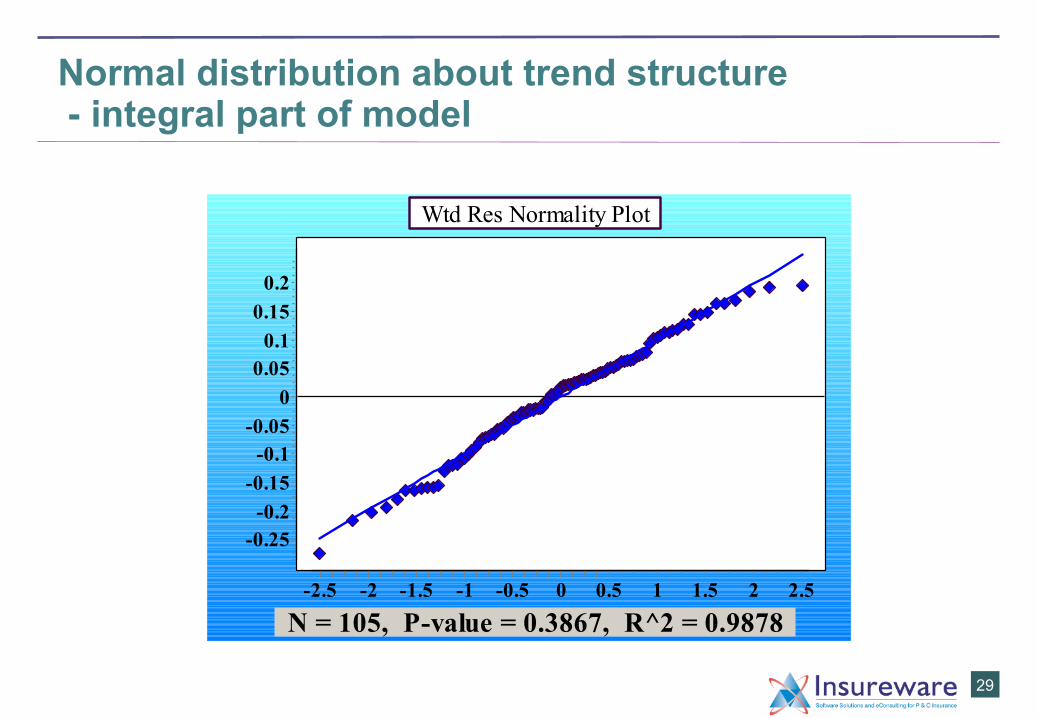
Normal distribution about trend structure - integral part of model
Wtd Res Normality Plot
N = 105, P-value = 0.3867, R^2 = 0.9878-2.5 -2 -1.5 -1 -0.5 0 0.5 1 1.5 2 2.5
-0.25-0.2
-0.15-0.1
-0.050
0.050.1
0.150.2
29
Colour palette for PowerPoint presentations
Actuarial Bright Green R148 G166 B31
Actuarial Slate R32 G44 B52 *
Secondary Olive Green R120 G162 B47
Secondary colour palette
Primary colour palette
Secondary Bottle Green R0 G147 B127
Secondary Turquoise R0 G138 B176
Secondary Aqua Blue R26 G160 B170
Secondary Pastel Green R126 G205 B195
Secondary Light Purple R123 G149 B174*
Secondary Purple R97 G107 B156
Secondary Ecru R186 G163 B171
Secondary Yellow R215 G176 B18
Secondary Orange R213 G135 B43
Secondary Red R238 G52 B36
Secondary Rubine Red R226 G1 B119
*This colour reference is for screen presentations only
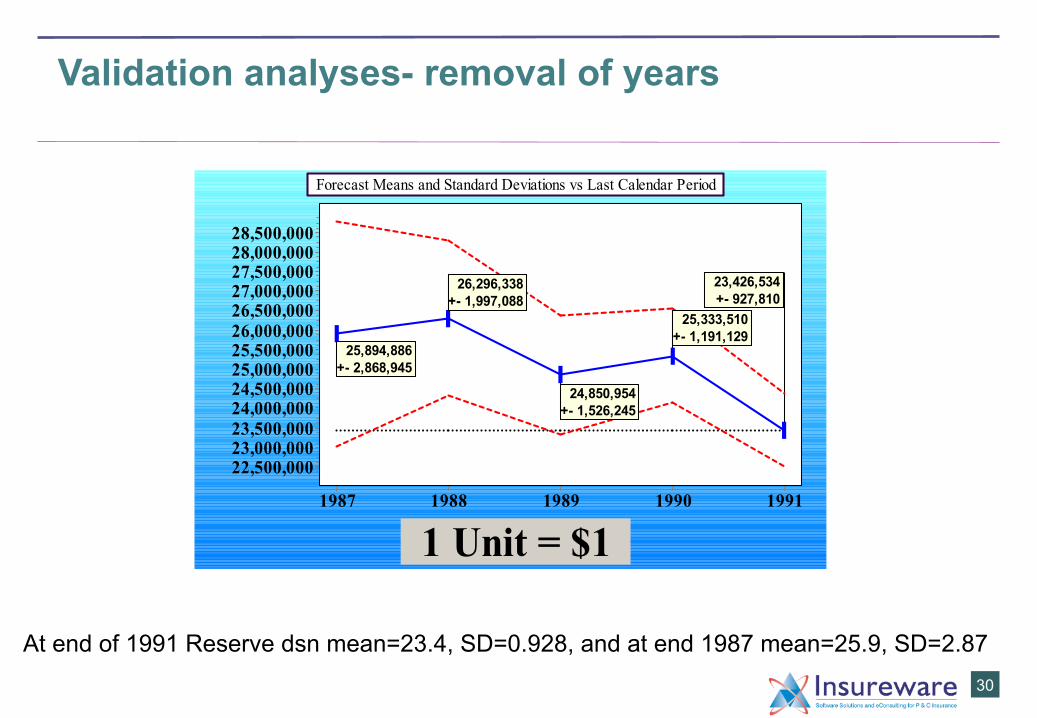
Validation analyses- removal of years
Forecast Means and Standard Deviations vs Last Calendar Period
1 Unit = $11987 1988 1989 1990 1991
22,500,00023,000,00023,500,00024,000,00024,500,00025,000,00025,500,00026,000,00026,500,00027,000,00027,500,00028,000,00028,500,000
25,894,886+- 2,868,945
26,296,338+- 1,997,088
24,850,954+- 1,526,245
25,333,510+- 1,191,129
23,426,534+- 927,810
30
At end of 1991 Reserve dsn mean=23.4, SD=0.928, and at end 1987 mean=25.9, SD=2.87
Colour palette for PowerPoint presentations
Actuarial Bright Green R148 G166 B31
Actuarial Slate R32 G44 B52 *
Secondary Olive Green R120 G162 B47
Secondary colour palette
Primary colour palette
Secondary Bottle Green R0 G147 B127
Secondary Turquoise R0 G138 B176
Secondary Aqua Blue R26 G160 B170
Secondary Pastel Green R126 G205 B195
Secondary Light Purple R123 G149 B174*
Secondary Purple R97 G107 B156
Secondary Ecru R186 G163 B171
Secondary Yellow R215 G176 B18
Secondary Orange R213 G135 B43
Secondary Red R238 G52 B36
Secondary Rubine Red R226 G1 B119
*This colour reference is for screen presentations only
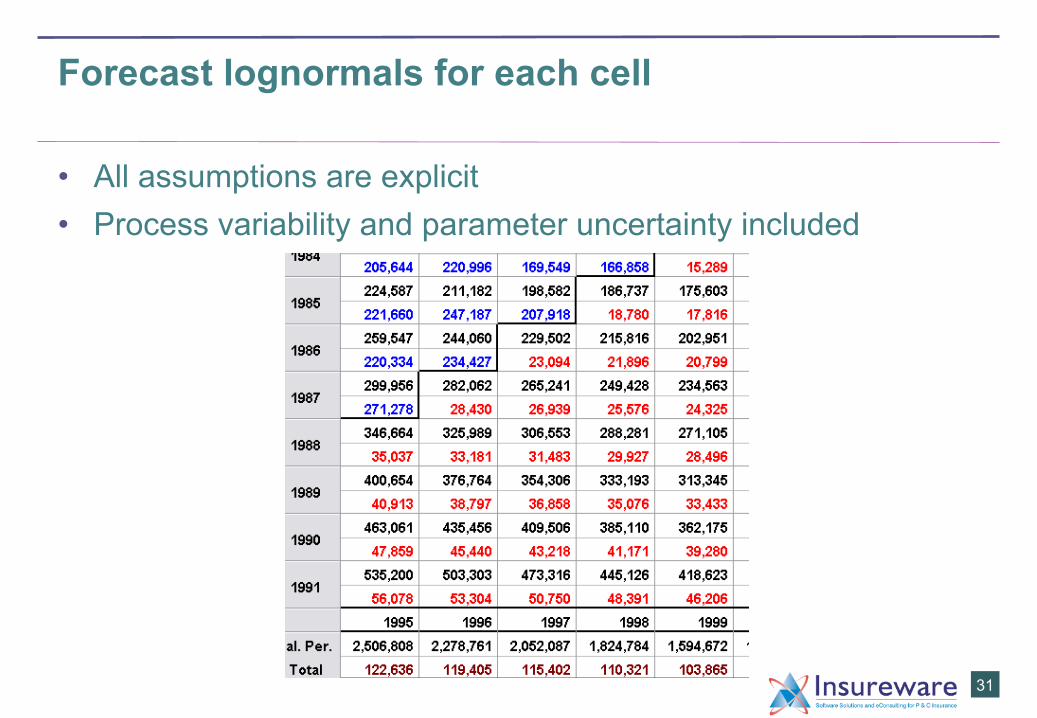
Forecast lognormals for each cell
• All assumptions are explicit • Process variability and parameter uncertainty included
31
Colour palette for PowerPoint presentations
Actuarial Bright Green R148 G166 B31
Actuarial Slate R32 G44 B52 *
Secondary Olive Green R120 G162 B47
Secondary colour palette
Primary colour palette
Secondary Bottle Green R0 G147 B127
Secondary Turquoise R0 G138 B176
Secondary Aqua Blue R26 G160 B170
Secondary Pastel Green R126 G205 B195
Secondary Light Purple R123 G149 B174*
Secondary Purple R97 G107 B156
Secondary Ecru R186 G163 B171
Secondary Yellow R215 G176 B18
Secondary Orange R213 G135 B43
Secondary Red R238 G52 B36
Secondary Rubine Red R226 G1 B119
*This colour reference is for screen presentations only
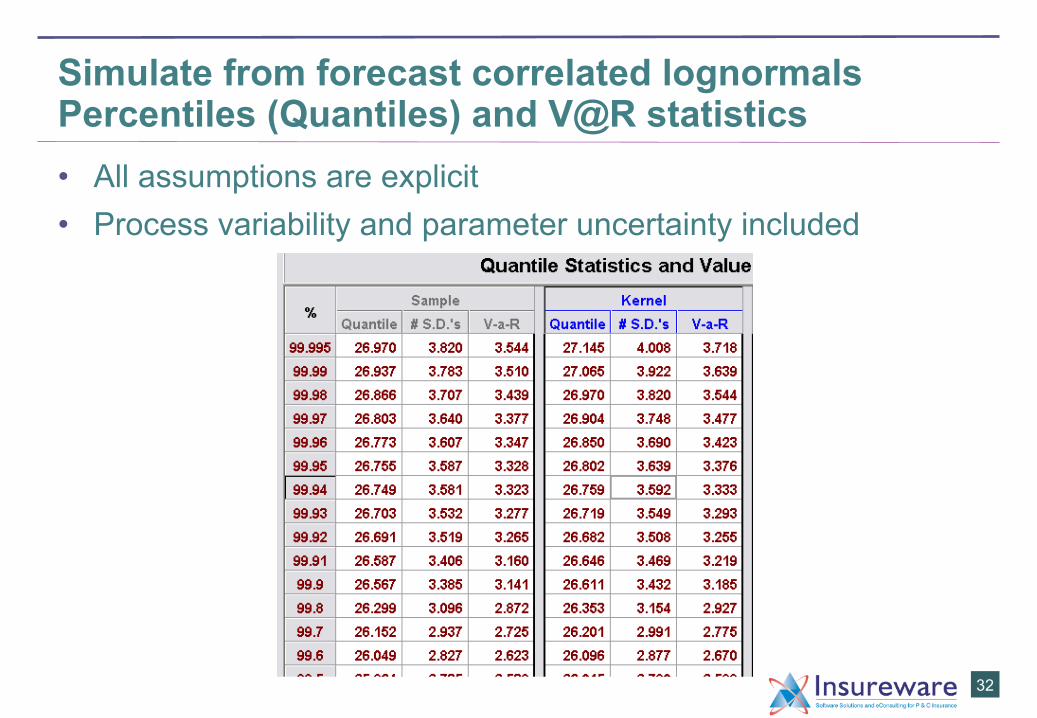
Simulate from forecast correlated lognormals Percentiles (Quantiles) and V@R statistics • All assumptions are explicit • Process variability and parameter uncertainty included
32
Colour palette for PowerPoint presentations
Actuarial Bright Green R148 G166 B31
Actuarial Slate R32 G44 B52 *
Secondary Olive Green R120 G162 B47
Secondary colour palette
Primary colour palette
Secondary Bottle Green R0 G147 B127
Secondary Turquoise R0 G138 B176
Secondary Aqua Blue R26 G160 B170
Secondary Pastel Green R126 G205 B195
Secondary Light Purple R123 G149 B174*
Secondary Purple R97 G107 B156
Secondary Ecru R186 G163 B171
Secondary Yellow R215 G176 B18
Secondary Orange R213 G135 B43
Secondary Red R238 G52 B36
Secondary Rubine Red R226 G1 B119
*This colour reference is for screen presentations only 33
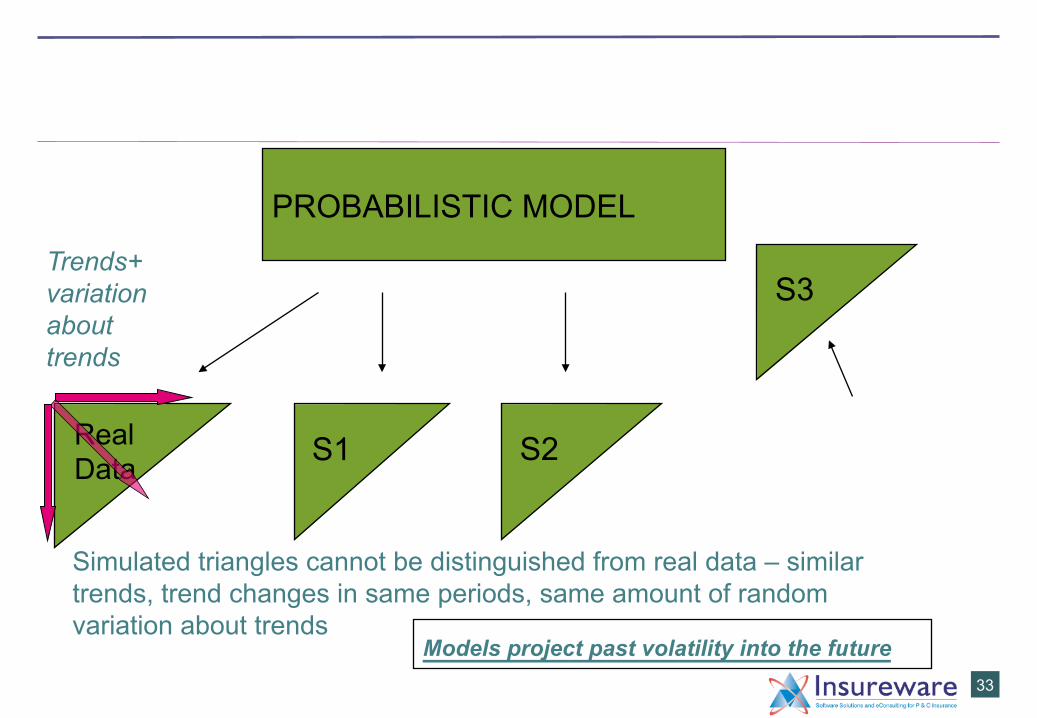
PROBABILISTIC MODEL
Real Data S1 S2
Simulated triangles cannot be distinguished from real data – similar trends, trend changes in same periods, same amount of random variation about trends
S3
Models project past volatility into the future
Trends+ variationabout trends
Colour palette for PowerPoint presentations
Actuarial Bright Green R148 G166 B31
Actuarial Slate R32 G44 B52 *
Secondary Olive Green R120 G162 B47
Secondary colour palette
Primary colour palette
Secondary Bottle Green R0 G147 B127
Secondary Turquoise R0 G138 B176
Secondary Aqua Blue R26 G160 B170
Secondary Pastel Green R126 G205 B195
Secondary Light Purple R123 G149 B174*
Secondary Purple R97 G107 B156
Secondary Ecru R186 G163 B171
Secondary Yellow R215 G176 B18
Secondary Orange R213 G135 B43
Secondary Red R238 G52 B36
Secondary Rubine Red R226 G1 B119
*This colour reference is for screen presentations only
Dataset ABC: The PTF model
Dev. Yr Trends
0 1 2 3 4 5 6 7 8 9 10
-3
-2.5
-2
-1.5
-1
-0.5
00 .16 6 1
+-‐ 0 .0 13 4
-‐ 0 .3 9 9 4+-‐ 0 .0 13 1
-‐ 0 .4 6 9 2+-‐ 0 .0 0 5 4
-‐ 0 .3 9 4 4+-‐ 0 .0 0 9 0
-‐ 0 .3 3 6 2+-‐ 0 .0 10 0
Acc. Yr Trends
77 78 79 80 81 82 83 84 85 86 87
9.5
10
10.5
11
11.5
12
12.5
13
0 .16 10+-‐ 0 .0 13 1
0 .0 4 7 3+-‐ 0 .0 10 5
0 .0 6 9 1+-‐ 0 .0 14 9
-‐ 0 .0 6 9 1+-‐ 0 .0 14 9
-‐ 0 .0 4 7 3+-‐ 0 .0 10 5
Cal. Yr Trends
77 78 79 80 81 82 83 84 85 86 87
-1
-0.5
0
0.5
1
1.5
2
0 .0 6 5 2+-‐ 0 .0 0 3 5
0 .10 8 3+-‐ 0 .0 12 3
0 .16 9 1+-‐ 0 .0 0 7 4
MLE Variance vs Dev. Yr
0 1 2 3 4 5 6 7 8 9 100
1e-4
2e-4
3e-4
4e-4
5e-4
6e-4
7e-4
8e-4
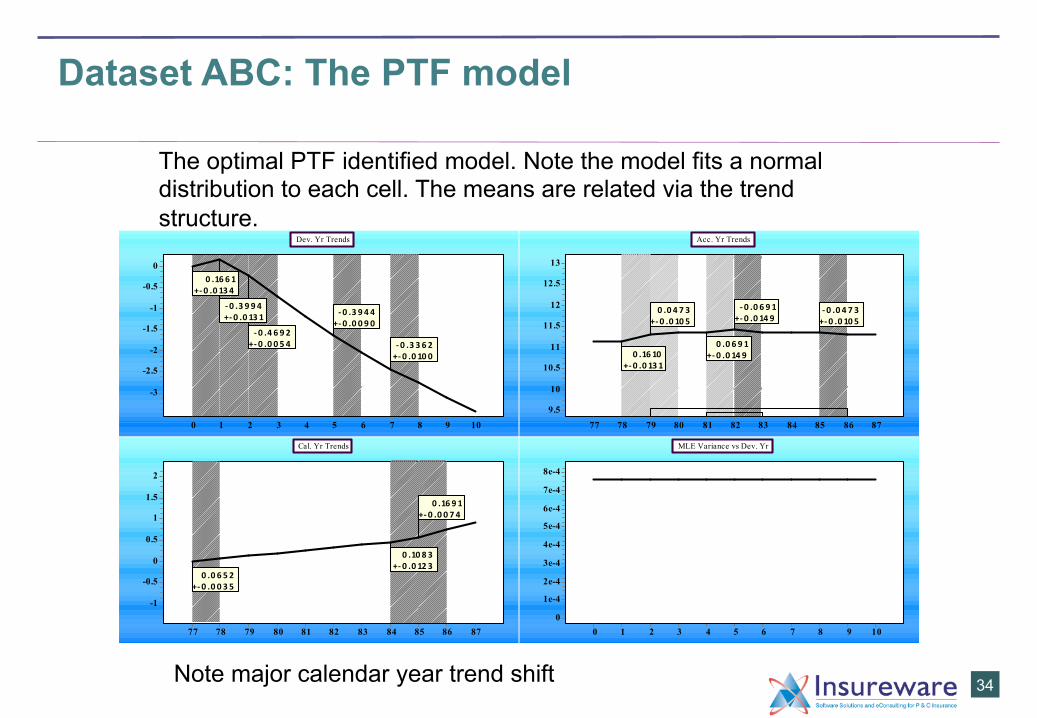
34 Note major calendar year trend shift
The optimal PTF identified model. Note the model fits a normal distribution to each cell. The means are related via the trend structure.
Colour palette for PowerPoint presentations
Actuarial Bright Green R148 G166 B31
Actuarial Slate R32 G44 B52 *
Secondary Olive Green R120 G162 B47
Secondary colour palette
Primary colour palette
Secondary Bottle Green R0 G147 B127
Secondary Turquoise R0 G138 B176
Secondary Aqua Blue R26 G160 B170
Secondary Pastel Green R126 G205 B195
Secondary Light Purple R123 G149 B174*
Secondary Purple R97 G107 B156
Secondary Ecru R186 G163 B171
Secondary Yellow R215 G176 B18
Secondary Orange R213 G135 B43
Secondary Red R238 G52 B36
Secondary Rubine Red R226 G1 B119
*This colour reference is for screen presentations only
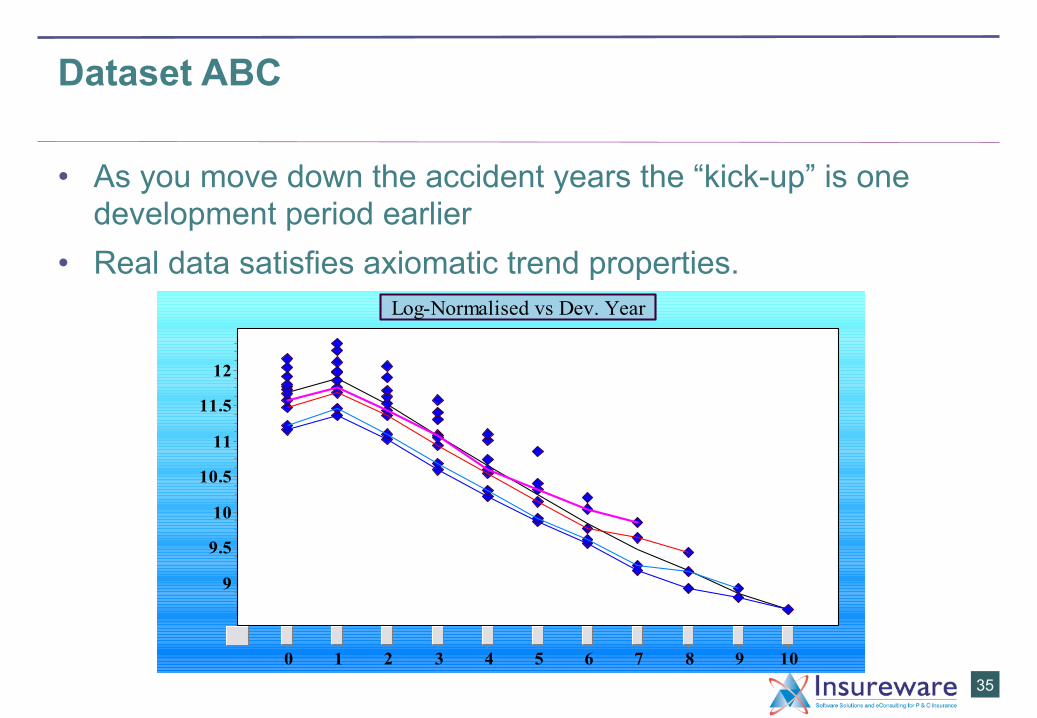
Dataset ABC
• As you move down the accident years the “kick-up” is one development period earlier
• Real data satisfies axiomatic trend properties.
35
Log-Normalised vs Dev. Year
0 1 2 3 4 5 6 7 8 9 10
9
9.5
10
10.5
11
11.5
12
Colour palette for PowerPoint presentations
Actuarial Bright Green R148 G166 B31
Actuarial Slate R32 G44 B52 *
Secondary Olive Green R120 G162 B47
Secondary colour palette
Primary colour palette
Secondary Bottle Green R0 G147 B127
Secondary Turquoise R0 G138 B176
Secondary Aqua Blue R26 G160 B170
Secondary Pastel Green R126 G205 B195
Secondary Light Purple R123 G149 B174*
Secondary Purple R97 G107 B156
Secondary Ecru R186 G163 B171
Secondary Yellow R215 G176 B18
Secondary Orange R213 G135 B43
Secondary Red R238 G52 B36
Secondary Rubine Red R226 G1 B119
*This colour reference is for screen presentations only
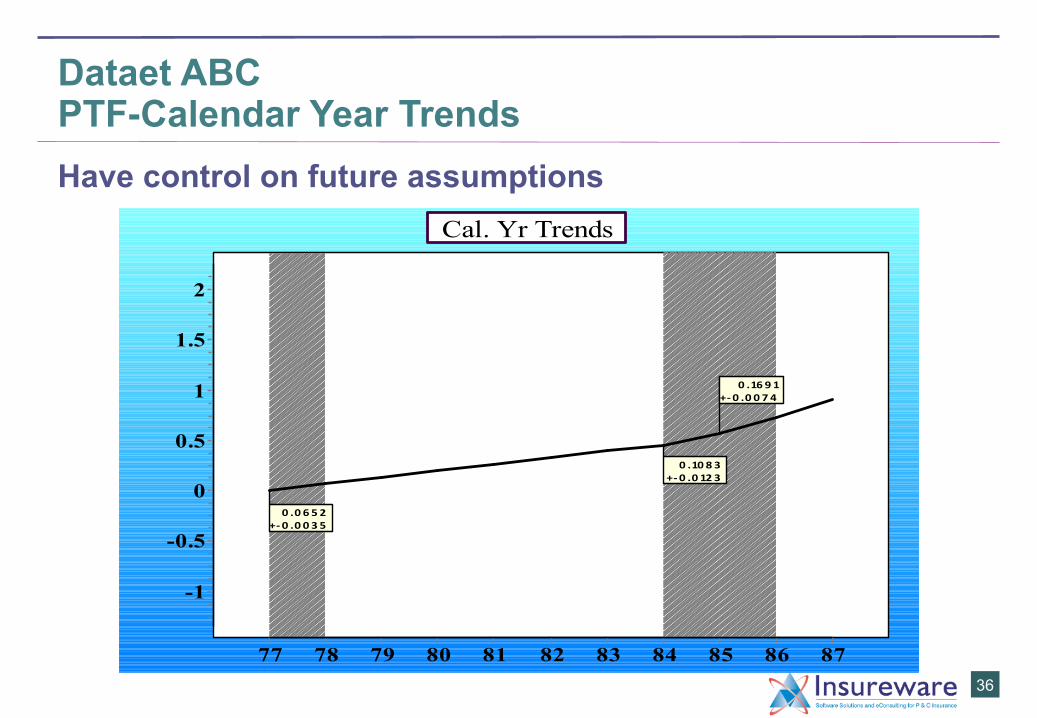
Dataet ABC PTF-Calendar Year Trends Have control on future assumptions
36
Cal. Yr Trends
77 78 79 80 81 82 83 84 85 86 87
-1
-0.5
0
0.5
1
1.5
2
0 .0 6 5 2+-‐0 .0 0 3 5
0 .10 8 3+-‐0 .0 12 3
0 .16 9 1+-‐0 .0 0 7 4
Colour palette for PowerPoint presentations
Actuarial Bright Green R148 G166 B31
Actuarial Slate R32 G44 B52 *
Secondary Olive Green R120 G162 B47
Secondary colour palette
Primary colour palette
Secondary Bottle Green R0 G147 B127
Secondary Turquoise R0 G138 B176
Secondary Aqua Blue R26 G160 B170
Secondary Pastel Green R126 G205 B195
Secondary Light Purple R123 G149 B174*
Secondary Purple R97 G107 B156
Secondary Ecru R186 G163 B171
Secondary Yellow R215 G176 B18
Secondary Orange R213 G135 B43
Secondary Red R238 G52 B36
Secondary Rubine Red R226 G1 B119
*This colour reference is for screen presentations only
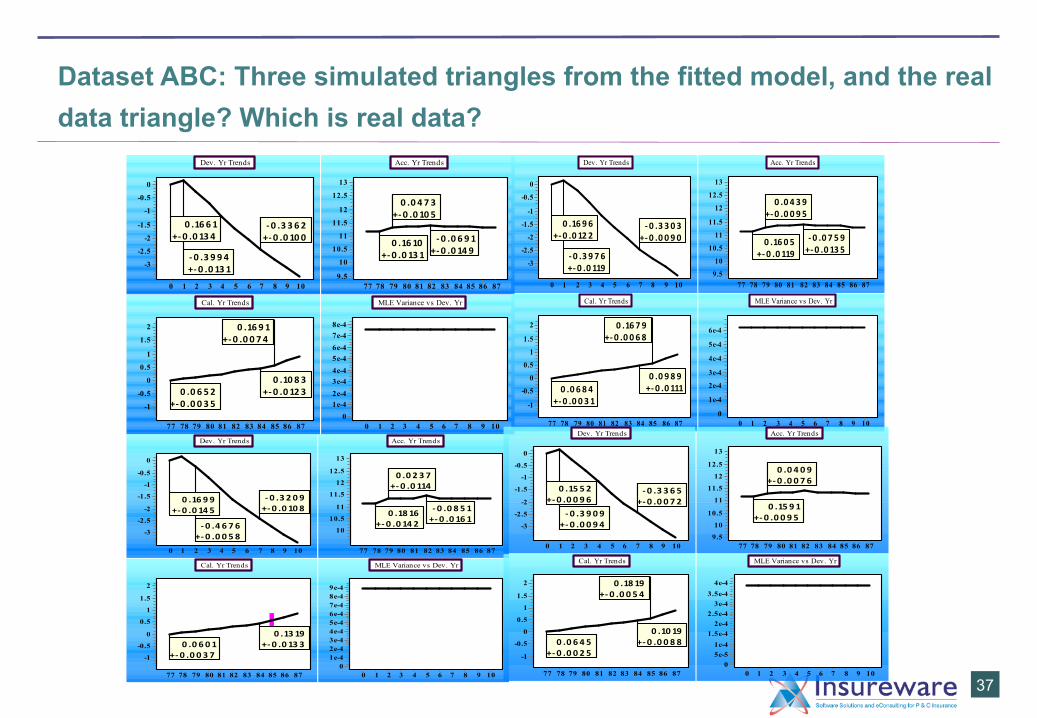
Dataset ABC: Three simulated triangles from the fitted model, and the real data triangle? Which is real data?
Dev. Yr Trends
0 1 2 3 4 5 6 7 8 9 10
-3
-2.5
-2
-1.5
-1
-0.5
0
0 .16 6 1+-‐ 0 .0 13 4
-‐ 0 .3 9 9 4+-‐ 0 .0 13 1
-‐ 0 .3 3 6 2+-‐ 0 .0 10 0
Acc. Yr Trends
77 78 79 80 81 82 83 84 85 86 879.5
10
10.5
11
11.5
12
12.5
13
0 .16 10+-‐ 0 .0 13 1
0 .0 4 7 3+-‐ 0 .0 10 5
-‐ 0 .0 6 9 1+-‐ 0 .0 14 9
Cal. Yr Trends
77 78 79 80 81 82 83 84 85 86 87
-1
-0.5
0
0.5
1
1.5
2
0 .0 6 5 2+-‐ 0 .0 0 3 5
0 .10 8 3+-‐ 0 .0 12 3
0 .16 9 1+-‐ 0 .0 0 7 4
MLE Variance vs Dev. Yr
0 1 2 3 4 5 6 7 8 9 100
1e-42e-43e-44e-45e-46e-47e-48e-4
37
Dev. Yr Trends
0 1 2 3 4 5 6 7 8 9 10
-3
-2.5
-2
-1.5
-1
-0.5
0
0 .16 9 6+-‐ 0 .0 12 2
-‐ 0 .3 9 7 6+-‐ 0 .0 119
-‐ 0 .3 3 0 3+-‐ 0 .0 0 9 0
Acc. Yr Trends
77 78 79 80 81 82 83 84 85 86 879.5
10
10.5
11
11.5
12
12.5
13
0 .16 0 5+-‐ 0 .0 119
0 .0 4 3 9+-‐ 0 .0 0 9 5
-‐ 0 .0 7 5 9+-‐ 0 .0 13 5
Cal. Yr Trends
77 78 79 80 81 82 83 84 85 86 87
-1
-0.5
0
0.5
1
1.5
2
0 .0 6 8 4+-‐ 0 .0 0 3 1
0 .0 9 8 9+-‐ 0 .0 111
0 .16 7 9+-‐ 0 .0 0 6 8
MLE Variance vs Dev. Yr
0 1 2 3 4 5 6 7 8 9 100
1e-4
2e-4
3e-4
4e-4
5e-4
6e-4
Dev. Yr Trends
0 1 2 3 4 5 6 7 8 9 10
-3
-2.5
-2
-1.5
-1
-0.5
0
0 .16 9 9+-‐ 0 .0 14 5
-‐ 0 .4 6 7 6+-‐ 0 .0 0 5 8
-‐ 0 .3 2 0 9+-‐ 0 .0 10 8
Acc. Yr Trends
77 78 79 80 81 82 83 84 85 86 87
10
10.5
11
11.5
12
12.5
13
0 .18 16+-‐ 0 .0 14 2
0 .0 2 3 7+-‐ 0 .0 114
-‐ 0 .0 8 5 1+-‐ 0 .0 16 1
Cal. Yr Trends
77 78 79 80 81 82 83 84 85 86 87
-1
-0.5
0
0.5
1
1.5
2
0 .0 6 0 1+-‐ 0 .0 0 3 7
0 .13 19+-‐ 0 .0 13 3
MLE Variance vs Dev. Yr
0 1 2 3 4 5 6 7 8 9 100
1e-42e-43e-44e-45e-46e-47e-48e-49e-4
Dev. Yr Trends
0 1 2 3 4 5 6 7 8 9 10
-3
-2.5
-2
-1.5
-1
-0.5
0
0 .15 5 2+-‐ 0 .0 0 9 6
-‐ 0 .3 9 0 9+-‐ 0 .0 0 9 4
-‐ 0 .3 3 6 5+-‐ 0 .0 0 7 2
Acc. Yr Trends
77 78 79 80 81 82 83 84 85 86 879.5
10
10.5
11
11.5
12
12.5
13
0 .15 9 1+-‐ 0 .0 0 9 5
0 .0 4 0 9+-‐ 0 .0 0 7 6
Cal. Yr Trends
77 78 79 80 81 82 83 84 85 86 87
-1
-0.5
0
0.5
1
1.5
2
0 .0 6 4 5+-‐ 0 .0 0 2 5
0 .10 19+-‐ 0 .0 0 8 8
0 .18 19+-‐ 0 .0 0 5 4
MLE Variance vs Dev. Yr
0 1 2 3 4 5 6 7 8 9 100
5e-51e-4
1.5e-42e-4
2.5e-43e-4
3.5e-44e-4
Colour palette for PowerPoint presentations
Actuarial Bright Green R148 G166 B31
Actuarial Slate R32 G44 B52 *
Secondary Olive Green R120 G162 B47
Secondary colour palette
Primary colour palette
Secondary Bottle Green R0 G147 B127
Secondary Turquoise R0 G138 B176
Secondary Aqua Blue R26 G160 B170
Secondary Pastel Green R126 G205 B195
Secondary Light Purple R123 G149 B174*
Secondary Purple R97 G107 B156
Secondary Ecru R186 G163 B171
Secondary Yellow R215 G176 B18
Secondary Orange R213 G135 B43
Secondary Red R238 G52 B36
Secondary Rubine Red R226 G1 B119
*This colour reference is for screen presentations only
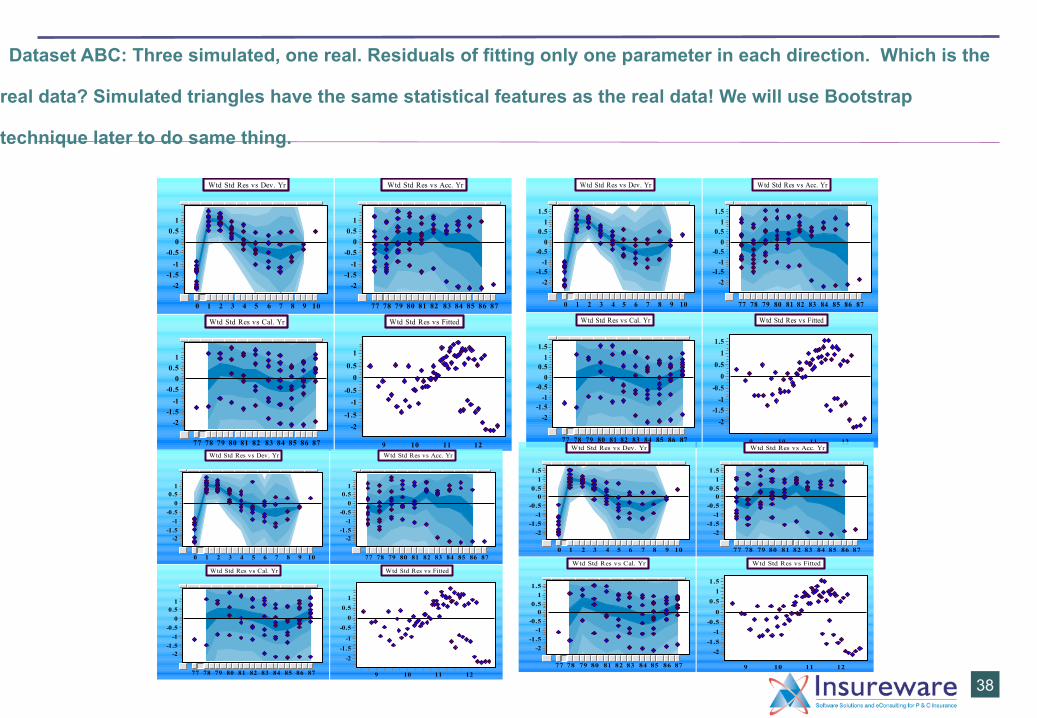
Dataset ABC: Three simulated, one real. Residuals of fitting only one parameter in each direction. Which is the
real data? Simulated triangles have the same statistical features as the real data! We will use Bootstrap
technique later to do same thing.
Wtd Std Res vs Dev. Yr
0 1 2 3 4 5 6 7 8 9 10
-2-1.5-1
-0.50
0.51
Wtd Std Res vs Acc. Yr
77 78 79 80 81 82 83 84 85 86 87
-2-1.5-1
-0.50
0.51
Wtd Std Res vs Cal. Yr
77 78 79 80 81 82 83 84 85 86 87
-2-1.5-1
-0.50
0.51
Wtd Std Res vs Fitted
9 10 11 12
-2-1.5
-1-0.5
00.5
1
38
Wtd Std Res vs Dev. Yr
0 1 2 3 4 5 6 7 8 9 10
-2-1.5-1
-0.50
0.51
1.5
Wtd Std Res vs Acc. Yr
77 78 79 80 81 82 83 84 85 86 87
-2-1.5-1
-0.50
0.51
1.5
Wtd Std Res vs Cal. Yr
77 78 79 80 81 82 83 84 85 86 87
-2-1.5-1
-0.50
0.51
1.5
Wtd Std Res vs Fitted
9 10 11 12
-2-1.5-1
-0.50
0.51
1.5
Wtd Std Res vs Dev. Yr
0 1 2 3 4 5 6 7 8 9 10
-2-1.5-1
-0.50
0.51
Wtd Std Res vs Acc. Yr
77 78 79 80 81 82 83 84 85 86 87
-2-1.5-1
-0.50
0.51
Wtd Std Res vs Cal. Yr
77 78 79 80 81 82 83 84 85 86 87
-2-1.5-1
-0.50
0.51
Wtd Std Res vs Fitted
9 10 11 12
-2-1.5-1
-0.50
0.51
Wtd Std Res vs Dev. Yr
0 1 2 3 4 5 6 7 8 9 10
-2-1.5-1
-0.50
0.51
1.5
Wtd Std Res vs Acc. Yr
77 78 79 80 81 82 83 84 85 86 87
-2-1.5-1
-0.50
0.51
1.5
Wtd Std Res vs Cal. Yr
77 78 79 80 81 82 83 84 85 86 87
-2-1.5-1
-0.50
0.51
1.5
Wtd Std Res vs Fitted
9 10 11 12
-2-1.5-1
-0.50
0.51
1.5
Colour palette for PowerPoint presentations
Actuarial Bright Green R148 G166 B31
Actuarial Slate R32 G44 B52 *
Secondary Olive Green R120 G162 B47
Secondary colour palette
Primary colour palette
Secondary Bottle Green R0 G147 B127
Secondary Turquoise R0 G138 B176
Secondary Aqua Blue R26 G160 B170
Secondary Pastel Green R126 G205 B195
Secondary Light Purple R123 G149 B174*
Secondary Purple R97 G107 B156
Secondary Ecru R186 G163 B171
Secondary Yellow R215 G176 B18
Secondary Orange R213 G135 B43
Secondary Red R238 G52 B36
Secondary Rubine Red R226 G1 B119
*This colour reference is for screen presentations only
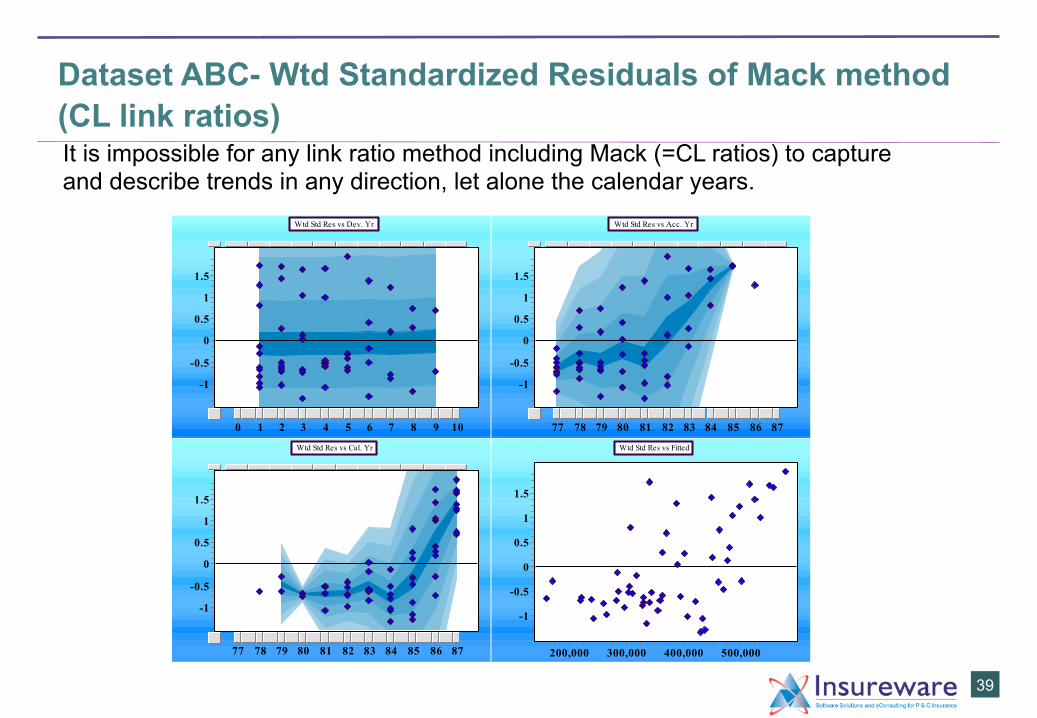
Dataset ABC- Wtd Standardized Residuals of Mack method (CL link ratios)
Wtd Std Res vs Dev. Yr
0 1 2 3 4 5 6 7 8 9 10
-1
-0.5
0
0.5
1
1.5
Wtd Std Res vs Acc. Yr
77 78 79 80 81 82 83 84 85 86 87
-1
-0.5
0
0.5
1
1.5
Wtd Std Res vs Cal. Yr
77 78 79 80 81 82 83 84 85 86 87
-1
-0.5
0
0.5
1
1.5
Wtd Std Res vs Fitted
200,000 300,000 400,000 500,000
-1
-0.5
0
0.5
1
1.5
39
It is impossible for any link ratio method including Mack (=CL ratios) to capture and describe trends in any direction, let alone the calendar years.
Colour palette for PowerPoint presentations
Actuarial Bright Green R148 G166 B31
Actuarial Slate R32 G44 B52 *
Secondary Olive Green R120 G162 B47
Secondary colour palette
Primary colour palette
Secondary Bottle Green R0 G147 B127
Secondary Turquoise R0 G138 B176
Secondary Aqua Blue R26 G160 B170
Secondary Pastel Green R126 G205 B195
Secondary Light Purple R123 G149 B174*
Secondary Purple R97 G107 B156
Secondary Ecru R186 G163 B171
Secondary Yellow R215 G176 B18
Secondary Orange R213 G135 B43
Secondary Red R238 G52 B36
Secondary Rubine Red R226 G1 B119
*This colour reference is for screen presentations only
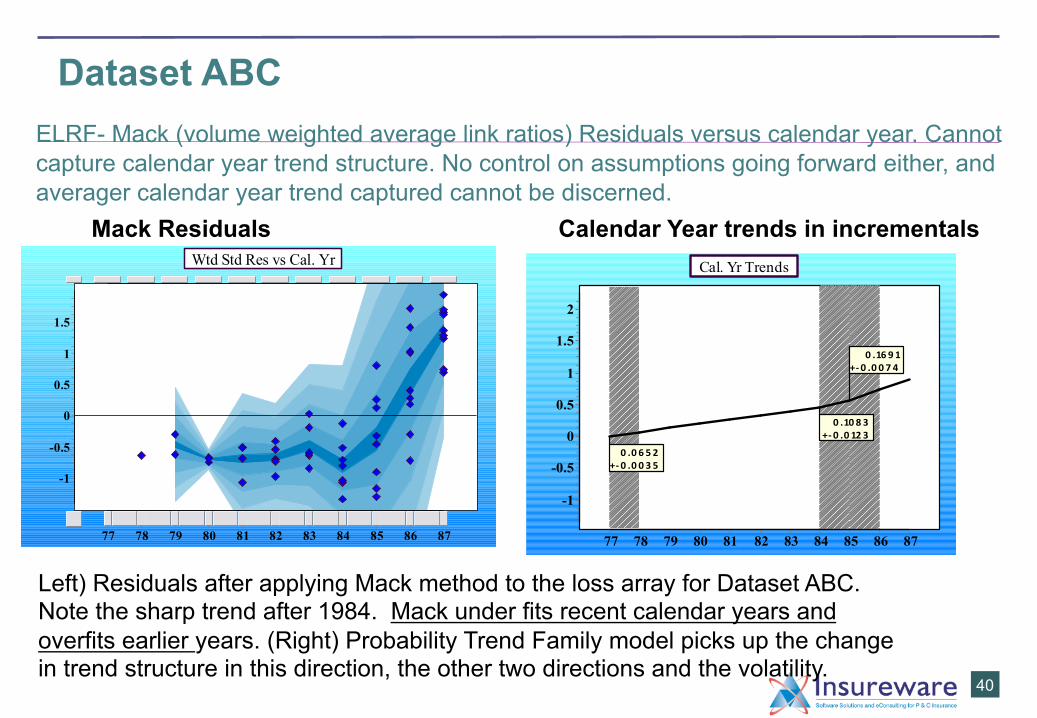
Dataset ABC ELRF- Mack (volume weighted average link ratios) Residuals versus calendar year. Cannot capture calendar year trend structure. No control on assumptions going forward either, and averager calendar year trend captured cannot be discerned.
40
Wtd Std Res vs Cal. Yr
77 78 79 80 81 82 83 84 85 86 87
-1
-0.5
0
0.5
1
1.5
Mack Residuals Cal. Yr Trends
77 78 79 80 81 82 83 84 85 86 87
-1
-0.5
0
0.5
1
1.5
2
0 .0 6 5 2+-‐ 0 .0 0 3 5
0 .10 8 3+-‐ 0 .0 12 3
0 .16 9 1+-‐ 0 .0 0 7 4
Left) Residuals after applying Mack method to the loss array for Dataset ABC. Note the sharp trend after 1984. Mack under fits recent calendar years and overfits earlier years. (Right) Probability Trend Family model picks up the change in trend structure in this direction, the other two directions and the volatility.
Calendar Year trends in incrementals
Colour palette for PowerPoint presentations
Actuarial Bright Green R148 G166 B31
Actuarial Slate R32 G44 B52 *
Secondary Olive Green R120 G162 B47
Secondary colour palette
Primary colour palette
Secondary Bottle Green R0 G147 B127
Secondary Turquoise R0 G138 B176
Secondary Aqua Blue R26 G160 B170
Secondary Pastel Green R126 G205 B195
Secondary Light Purple R123 G149 B174*
Secondary Purple R97 G107 B156
Secondary Ecru R186 G163 B171
Secondary Yellow R215 G176 B18
Secondary Orange R213 G135 B43
Secondary Red R238 G52 B36
Secondary Rubine Red R226 G1 B119
*This colour reference is for screen presentations only
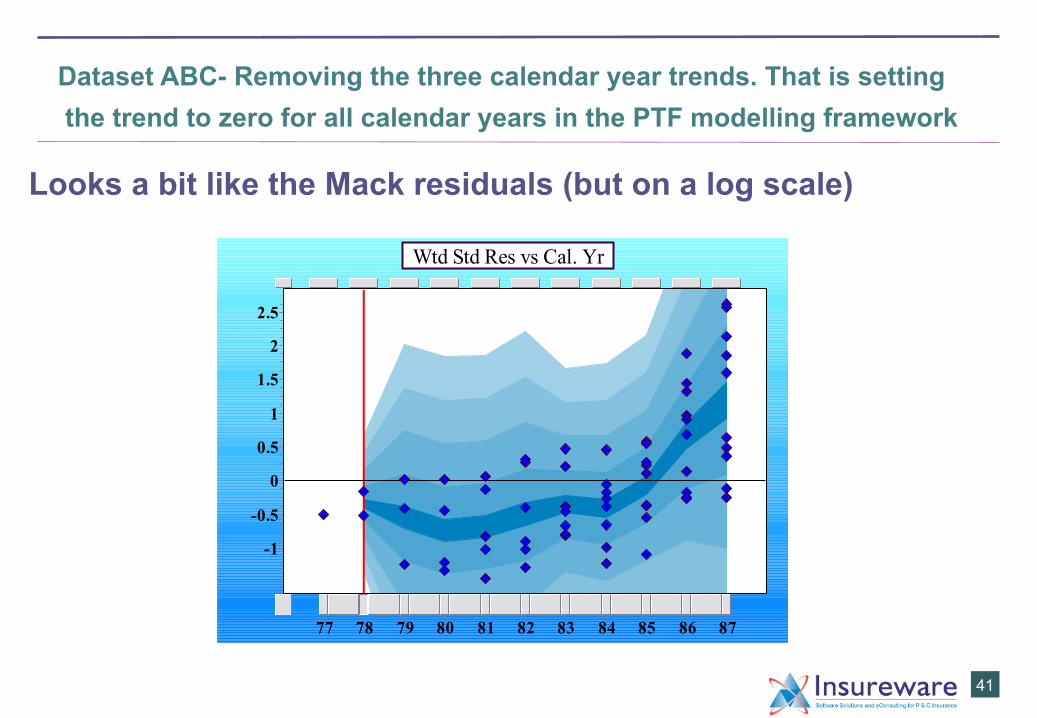
Dataset ABC- Removing the three calendar year trends. That is setting the trend to zero for all calendar years in the PTF modelling framework
Looks a bit like the Mack residuals (but on a log scale)
41
Wtd Std Res vs Cal. Yr
77 78 79 80 81 82 83 84 85 86 87
-1
-0.5
0
0.5
1
1.5
2
2.5
Colour palette for PowerPoint presentations
Actuarial Bright Green R148 G166 B31
Actuarial Slate R32 G44 B52 *
Secondary Olive Green R120 G162 B47
Secondary colour palette
Primary colour palette
Secondary Bottle Green R0 G147 B127
Secondary Turquoise R0 G138 B176
Secondary Aqua Blue R26 G160 B170
Secondary Pastel Green R126 G205 B195
Secondary Light Purple R123 G149 B174*
Secondary Purple R97 G107 B156
Secondary Ecru R186 G163 B171
Secondary Yellow R215 G176 B18
Secondary Orange R213 G135 B43
Secondary Red R238 G52 B36
Secondary Rubine Red R226 G1 B119
*This colour reference is for screen presentations only
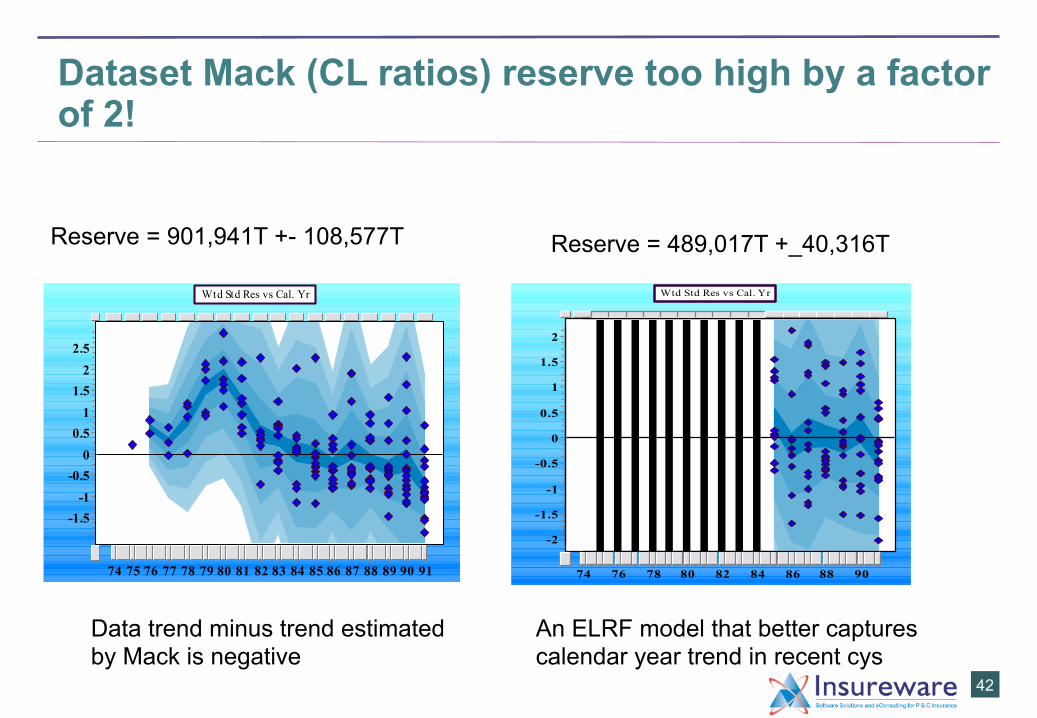
Dataset Mack (CL ratios) reserve too high by a factor of 2!
Wtd Std Res vs Cal. Yr
74 75 76 77 78 79 80 81 82 83 84 85 86 87 88 89 90 91
-1.5-1-0.500.511.522.5
42
Reserve = 901,941T +- 108,577T
Wtd Std Res vs Cal. Yr
74 76 78 80 82 84 86 88 90
-2
-1.5
-1
-0.5
0
0.5
1
1.5
2
Reserve = 489,017T +_40,316T
Data trend minus trend estimated by Mack is negative
An ELRF model that better captures calendar year trend in recent cys
Colour palette for PowerPoint presentations
Actuarial Bright Green R148 G166 B31
Actuarial Slate R32 G44 B52 *
Secondary Olive Green R120 G162 B47
Secondary colour palette
Primary colour palette
Secondary Bottle Green R0 G147 B127
Secondary Turquoise R0 G138 B176
Secondary Aqua Blue R26 G160 B170
Secondary Pastel Green R126 G205 B195
Secondary Light Purple R123 G149 B174*
Secondary Purple R97 G107 B156
Secondary Ecru R186 G163 B171
Secondary Yellow R215 G176 B18
Secondary Orange R213 G135 B43
Secondary Red R238 G52 B36
Secondary Rubine Red R226 G1 B119
*This colour reference is for screen presentations only
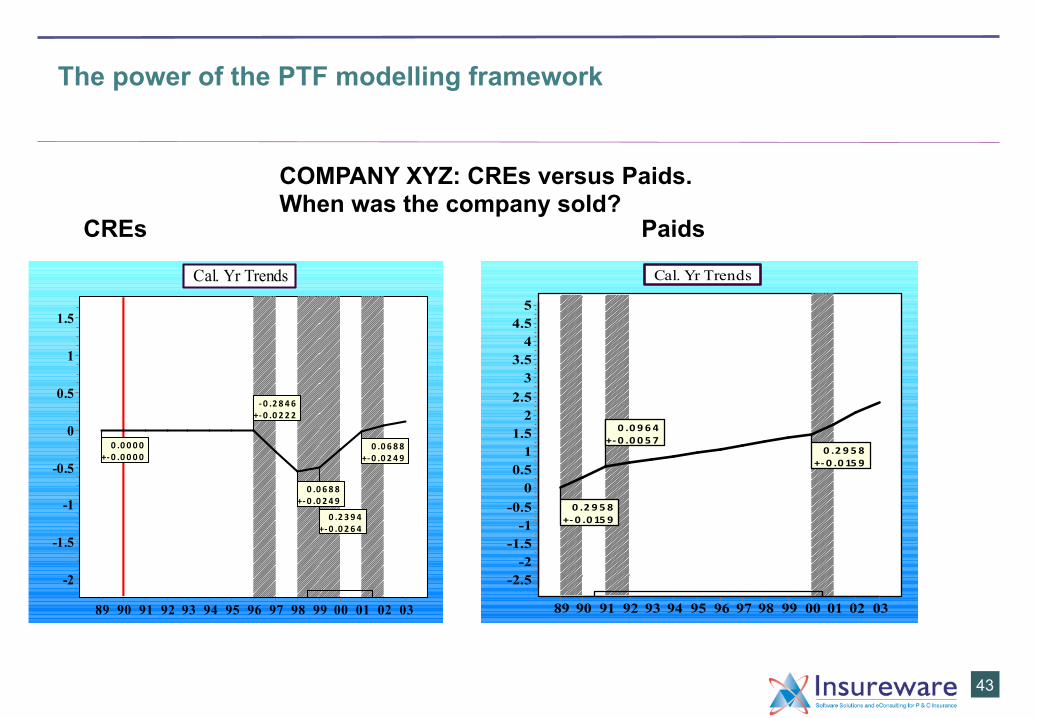
The power of the PTF modelling framework
Cal. Yr Trends
89 90 91 92 93 94 95 96 97 98 99 00 01 02 03
-2
-1.5
-1
-0.5
0
0.5
1
1.5
0 .0 0 0 0+-‐0 .0 0 0 0
-‐0 .2 8 4 6+-‐0 .0 2 2 2
0 .0 6 8 8+-‐0 .0 2 4 9
0 .2 3 9 4+-‐0 .0 2 6 4
0 .0 6 8 8+-‐0 .0 2 4 9
43
COMPANY XYZ: CREs versus Paids. When was the company sold?
Cal. Yr Trends
89 90 91 92 93 94 95 96 97 98 99 00 01 02 03
-2.5-2-1.5-1-0.500.511.522.533.544.55
0 .2 9 5 8+-‐ 0 .0 15 9
0 .0 9 6 4+-‐ 0 .0 0 5 7
0 .2 9 5 8+-‐ 0 .0 15 9
CREs Paids
Colour palette for PowerPoint presentations
Actuarial Bright Green R148 G166 B31
Actuarial Slate R32 G44 B52 *
Secondary Olive Green R120 G162 B47
Secondary colour palette
Primary colour palette
Secondary Bottle Green R0 G147 B127
Secondary Turquoise R0 G138 B176
Secondary Aqua Blue R26 G160 B170
Secondary Pastel Green R126 G205 B195
Secondary Light Purple R123 G149 B174*
Secondary Purple R97 G107 B156
Secondary Ecru R186 G163 B171
Secondary Yellow R215 G176 B18
Secondary Orange R213 G135 B43
Secondary Red R238 G52 B36
Secondary Rubine Red R226 G1 B119
*This colour reference is for screen presentations only
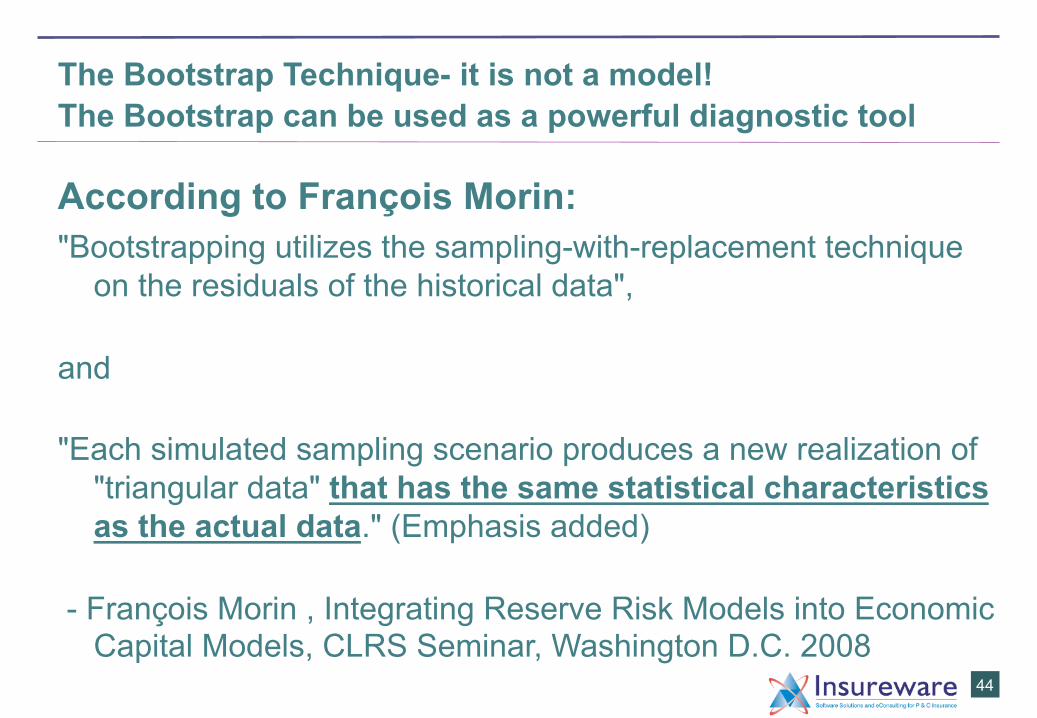
The Bootstrap Technique- it is not a model! The Bootstrap can be used as a powerful diagnostic tool According to François Morin: "Bootstrapping utilizes the sampling-with-replacement technique
on the residuals of the historical data",
and
"Each simulated sampling scenario produces a new realization of "triangular data" that has the same statistical characteristics as the actual data." (Emphasis added)
- François Morin , Integrating Reserve Risk Models into Economic Capital Models, CLRS Seminar, Washington D.C. 2008
44
Colour palette for PowerPoint presentations
Actuarial Bright Green R148 G166 B31
Actuarial Slate R32 G44 B52 *
Secondary Olive Green R120 G162 B47
Secondary colour palette
Primary colour palette
Secondary Bottle Green R0 G147 B127
Secondary Turquoise R0 G138 B176
Secondary Aqua Blue R26 G160 B170
Secondary Pastel Green R126 G205 B195
Secondary Light Purple R123 G149 B174*
Secondary Purple R97 G107 B156
Secondary Ecru R186 G163 B171
Secondary Yellow R215 G176 B18
Secondary Orange R213 G135 B43
Secondary Red R238 G52 B36
Secondary Rubine Red R226 G1 B119
*This colour reference is for screen presentations only
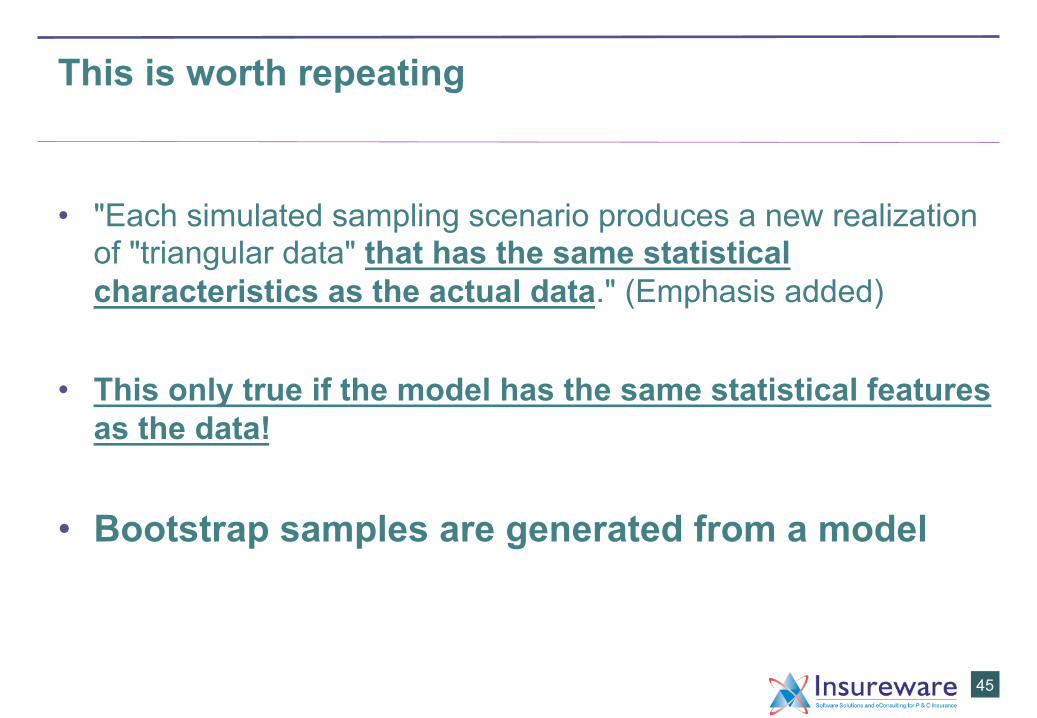
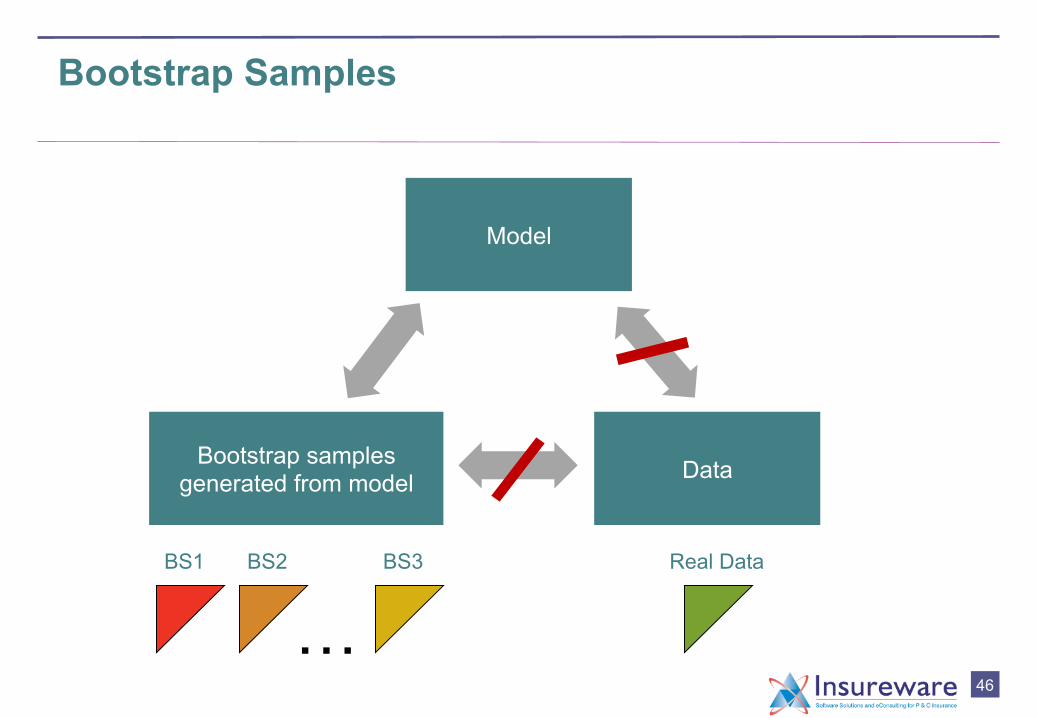
This is worth repeating
• "Each simulated sampling scenario produces a new realization of "triangular data" that has the same statistical characteristics as the actual data." (Emphasis added)
• This only true if the model has the same statistical features as the data!
• Bootstrap samples are generated from a model
45
Colour palette for PowerPoint presentations
Actuarial Bright Green R148 G166 B31
Actuarial Slate R32 G44 B52 *
Secondary Olive Green R120 G162 B47
Secondary colour palette
Primary colour palette
Secondary Bottle Green R0 G147 B127
Secondary Turquoise R0 G138 B176
Secondary Aqua Blue R26 G160 B170
Secondary Pastel Green R126 G205 B195
Secondary Light Purple R123 G149 B174*
Secondary Purple R97 G107 B156
Secondary Ecru R186 G163 B171
Secondary Yellow R215 G176 B18
Secondary Orange R213 G135 B43
Secondary Red R238 G52 B36
Secondary Rubine Red R226 G1 B119
*This colour reference is for screen presentations only
Bootstrap Samples
46
Model
Bootstrap samples generated from model Data
BS1
…BS2 BS3 Real Data
Colour palette for PowerPoint presentations
Actuarial Bright Green R148 G166 B31
Actuarial Slate R32 G44 B52 *
Secondary Olive Green R120 G162 B47
Secondary colour palette
Primary colour palette
Secondary Bottle Green R0 G147 B127
Secondary Turquoise R0 G138 B176
Secondary Aqua Blue R26 G160 B170
Secondary Pastel Green R126 G205 B195
Secondary Light Purple R123 G149 B174*
Secondary Purple R97 G107 B156
Secondary Ecru R186 G163 B171
Secondary Yellow R215 G176 B18
Secondary Orange R213 G135 B43
Secondary Red R238 G52 B36
Secondary Rubine Red R226 G1 B119
*This colour reference is for screen presentations only
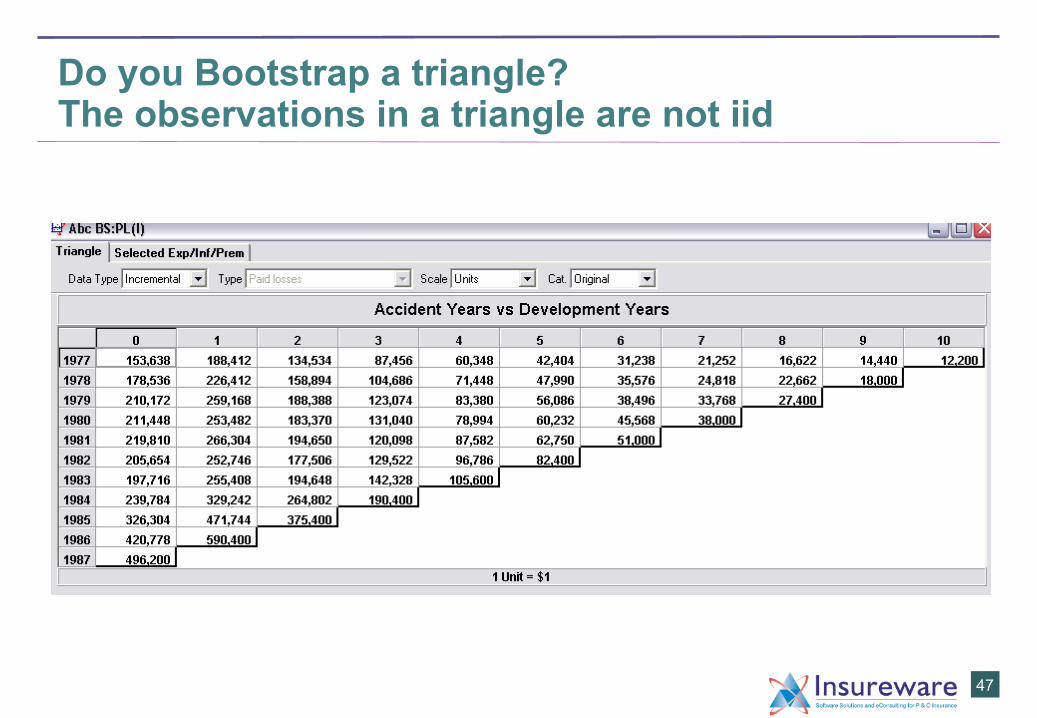
Do you Bootstrap a triangle? The observations in a triangle are not iid
47
Colour palette for PowerPoint presentations
Actuarial Bright Green R148 G166 B31
Actuarial Slate R32 G44 B52 *
Secondary Olive Green R120 G162 B47
Secondary colour palette
Primary colour palette
Secondary Bottle Green R0 G147 B127
Secondary Turquoise R0 G138 B176
Secondary Aqua Blue R26 G160 B170
Secondary Pastel Green R126 G205 B195
Secondary Light Purple R123 G149 B174*
Secondary Purple R97 G107 B156
Secondary Ecru R186 G163 B171
Secondary Yellow R215 G176 B18
Secondary Orange R213 G135 B43
Secondary Red R238 G52 B36
Secondary Rubine Red R226 G1 B119
*This colour reference is for screen presentations only
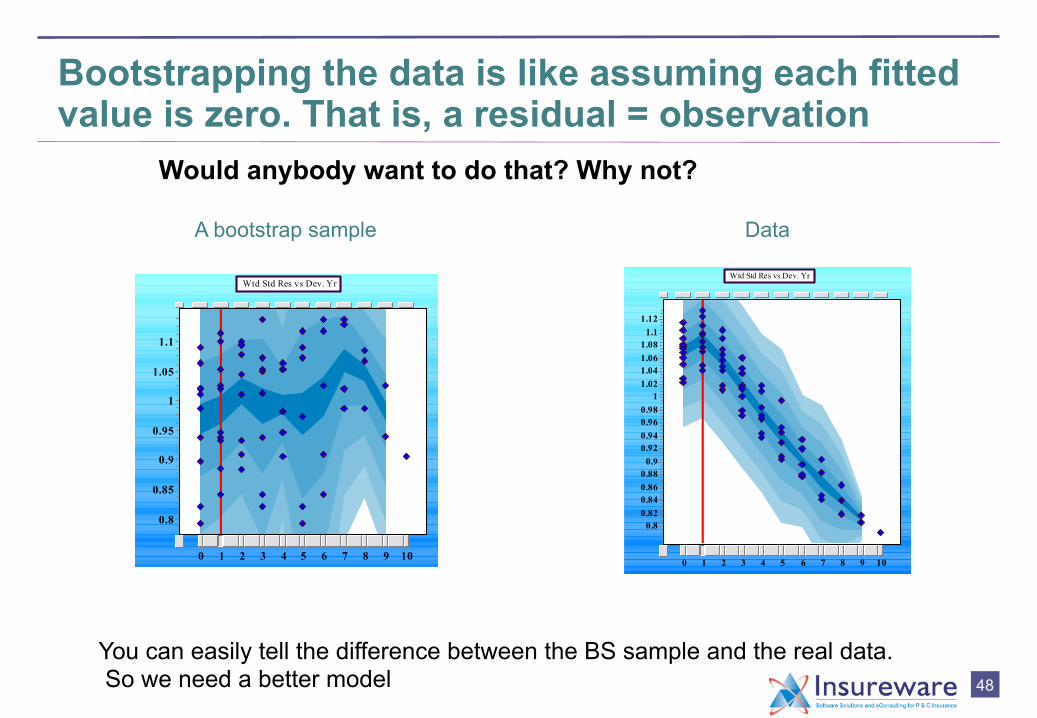
Bootstrapping the data is like assuming each fitted value is zero. That is, a residual = observation
Wtd Std Res vs Dev. Yr
0 1 2 3 4 5 6 7 8 9 10
0.8
0.85
0.9
0.95
1
1.05
1.1
Wtd Std Res vs Dev. Yr
0 1 2 3 4 5 6 7 8 9 10
0.80.820.840.860.880.90.920.940.960.981
1.021.041.061.081.11.12
48
A bootstrap sample Data
You can easily tell the difference between the BS sample and the real data. So we need a better model
Would anybody want to do that? Why not?
Colour palette for PowerPoint presentations
Actuarial Bright Green R148 G166 B31
Actuarial Slate R32 G44 B52 *
Secondary Olive Green R120 G162 B47
Secondary colour palette
Primary colour palette
Secondary Bottle Green R0 G147 B127
Secondary Turquoise R0 G138 B176
Secondary Aqua Blue R26 G160 B170
Secondary Pastel Green R126 G205 B195
Secondary Light Purple R123 G149 B174*
Secondary Purple R97 G107 B156
Secondary Ecru R186 G163 B171
Secondary Yellow R215 G176 B18
Secondary Orange R213 G135 B43
Secondary Red R238 G52 B36
Secondary Rubine Red R226 G1 B119
*This colour reference is for screen presentations only
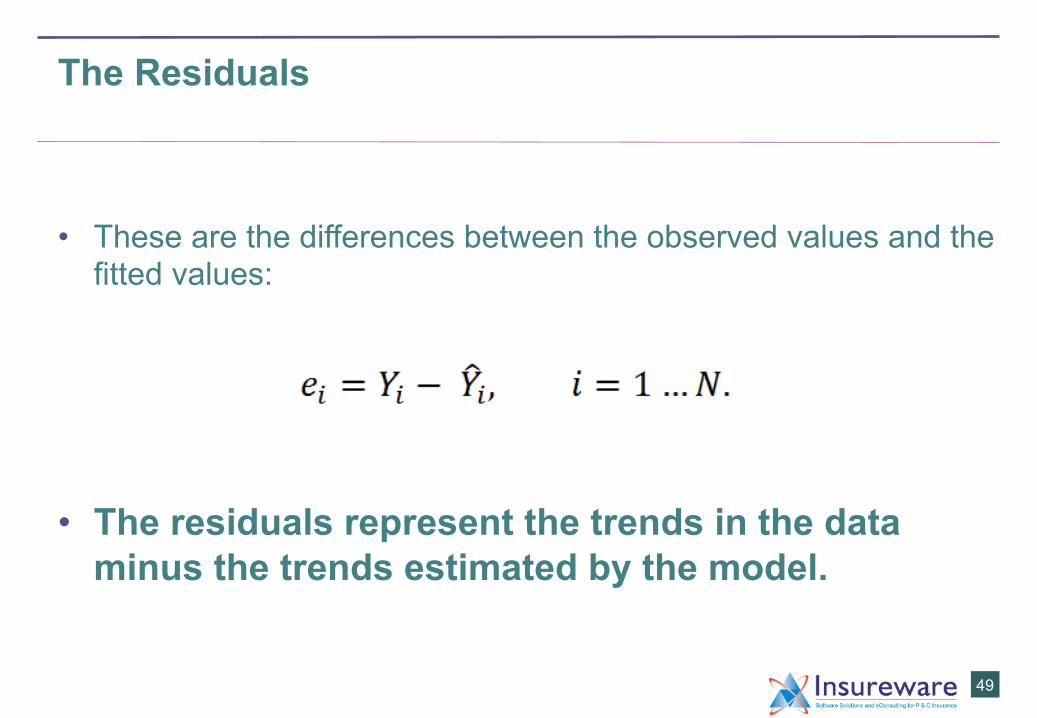
The Residuals
• These are the differences between the observed values and the fitted values:
• The residuals represent the trends in the data minus the trends estimated by the model.
49
Colour palette for PowerPoint presentations
Actuarial Bright Green R148 G166 B31
Actuarial Slate R32 G44 B52 *
Secondary Olive Green R120 G162 B47
Secondary colour palette
Primary colour palette
Secondary Bottle Green R0 G147 B127
Secondary Turquoise R0 G138 B176
Secondary Aqua Blue R26 G160 B170
Secondary Pastel Green R126 G205 B195
Secondary Light Purple R123 G149 B174*
Secondary Purple R97 G107 B156
Secondary Ecru R186 G163 B171
Secondary Yellow R215 G176 B18
Secondary Orange R213 G135 B43
Secondary Red R238 G52 B36
Secondary Rubine Red R226 G1 B119
*This colour reference is for screen presentations only
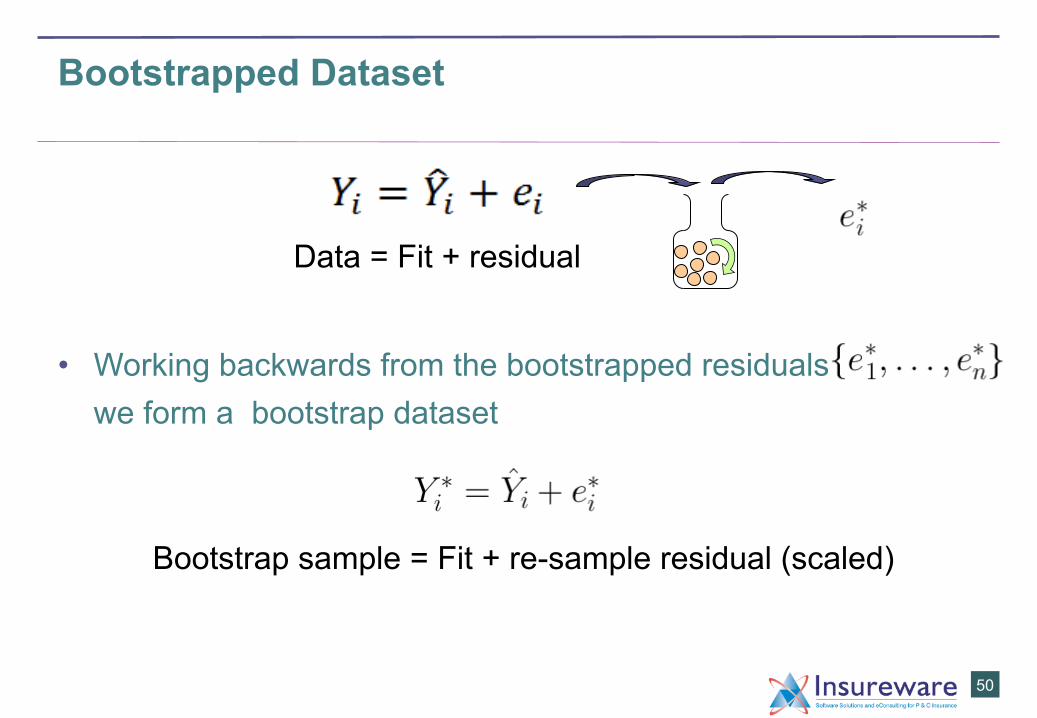
Bootstrapped Dataset
• Working backwards from the bootstrapped residuals we form a bootstrap dataset
50
Data = Fit + residual
Bootstrap sample = Fit + re-sample residual (scaled)
Colour palette for PowerPoint presentations
Actuarial Bright Green R148 G166 B31
Actuarial Slate R32 G44 B52 *
Secondary Olive Green R120 G162 B47
Secondary colour palette
Primary colour palette
Secondary Bottle Green R0 G147 B127
Secondary Turquoise R0 G138 B176
Secondary Aqua Blue R26 G160 B170
Secondary Pastel Green R126 G205 B195
Secondary Light Purple R123 G149 B174*
Secondary Purple R97 G107 B156
Secondary Ecru R186 G163 B171
Secondary Yellow R215 G176 B18
Secondary Orange R213 G135 B43
Secondary Red R238 G52 B36
Secondary Rubine Red R226 G1 B119
*This colour reference is for screen presentations only
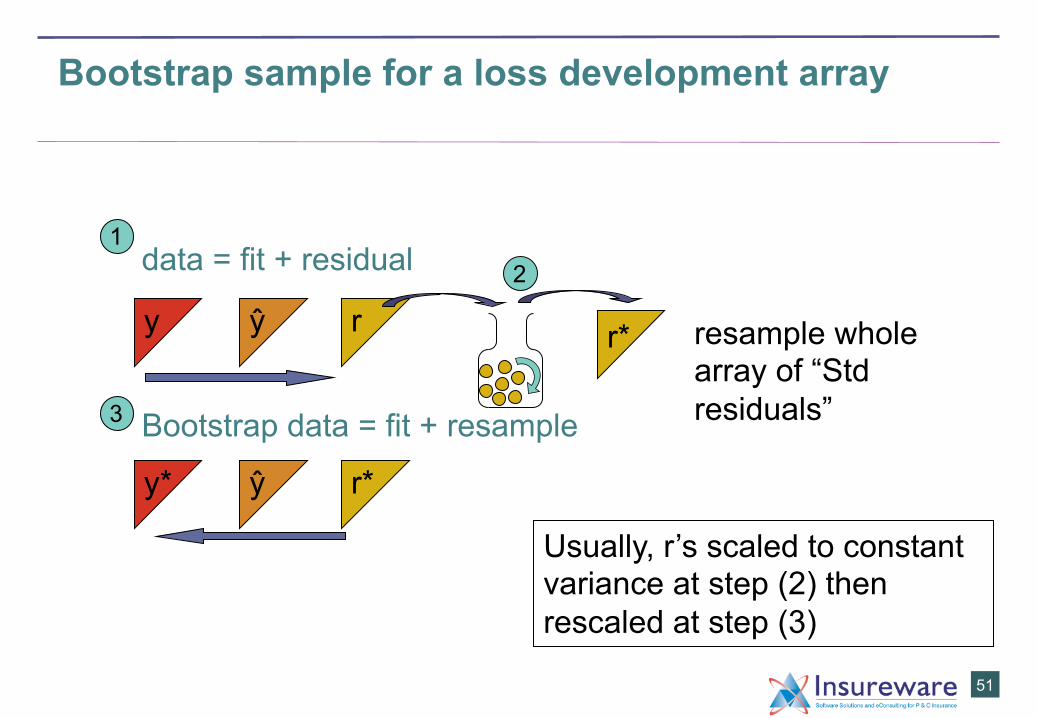
Bootstrap sample for a loss development array
data = fit + residual
=
Bootstrap data = fit + resample
51
y ŷ r resample whole array of “Std residuals”
y* ŷ r*
1 2
3
Usually, r’s scaled to constant variance at step (2) then rescaled at step (3)
r*

Colour palette for PowerPoint presentations
Actuarial Bright Green R148 G166 B31
Actuarial Slate R32 G44 B52 *
Secondary Olive Green R120 G162 B47
Secondary colour palette
Primary colour palette
Secondary Bottle Green R0 G147 B127
Secondary Turquoise R0 G138 B176
Secondary Aqua Blue R26 G160 B170
Secondary Pastel Green R126 G205 B195
Secondary Light Purple R123 G149 B174*
Secondary Purple R97 G107 B156
Secondary Ecru R186 G163 B171
Secondary Yellow R215 G176 B18
Secondary Orange R213 G135 B43
Secondary Red R238 G52 B36
Secondary Rubine Red R226 G1 B119
*This colour reference is for screen presentations only
Mack and the bootstrap (Dataset ABC) The bootstrap as a diagnostic tool
• Mack fitted to the real data contains structure by calendar year
Bootstrap samples from the Mack method lose this structure as it has been randomized!
52
Data
Colour palette for PowerPoint presentations
Actuarial Bright Green R148 G166 B31
Actuarial Slate R32 G44 B52 *
Secondary Olive Green R120 G162 B47
Secondary colour palette
Primary colour palette
Secondary Bottle Green R0 G147 B127
Secondary Turquoise R0 G138 B176
Secondary Aqua Blue R26 G160 B170
Secondary Pastel Green R126 G205 B195
Secondary Light Purple R123 G149 B174*
Secondary Purple R97 G107 B156
Secondary Ecru R186 G163 B171
Secondary Yellow R215 G176 B18
Secondary Orange R213 G135 B43
Secondary Red R238 G52 B36
Secondary Rubine Red R226 G1 B119
*This colour reference is for screen presentations only
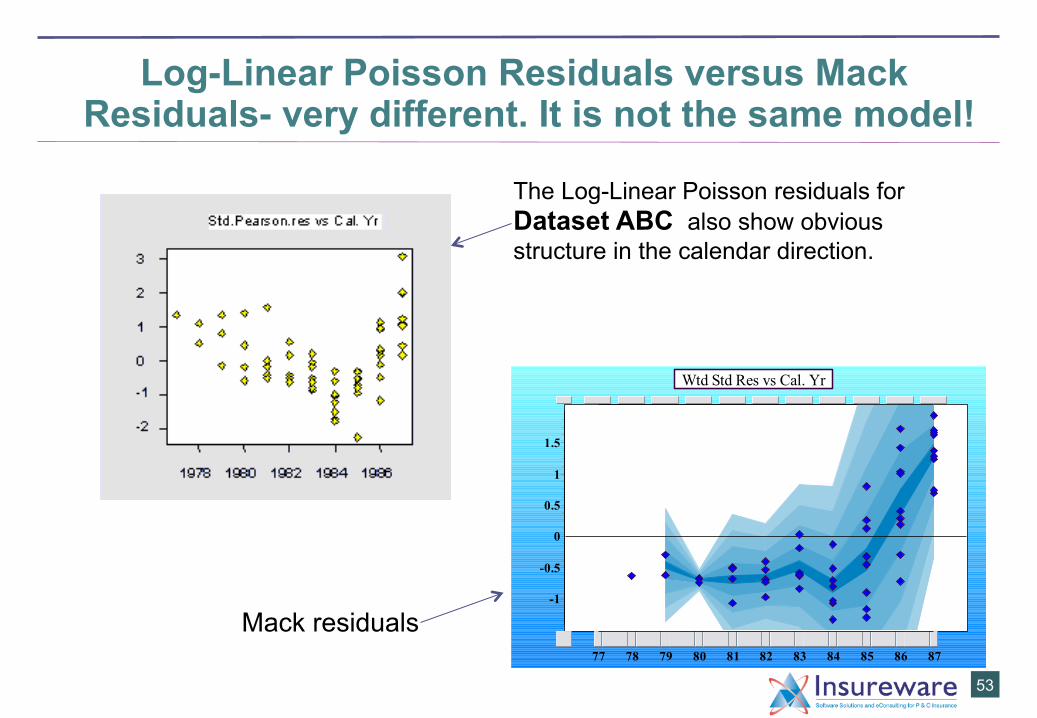
Log-Linear Poisson Residuals versus Mack Residuals- very different. It is not the same model!
53
The Log-Linear Poisson residuals for Dataset ABC also show obvious structure in the calendar direction.
Wtd Std Res vs Cal. Yr
77 78 79 80 81 82 83 84 85 86 87
-1
-0.5
0
0.5
1
1.5
Mack residuals
Colour palette for PowerPoint presentations
Actuarial Bright Green R148 G166 B31
Actuarial Slate R32 G44 B52 *
Secondary Olive Green R120 G162 B47
Secondary colour palette
Primary colour palette
Secondary Bottle Green R0 G147 B127
Secondary Turquoise R0 G138 B176
Secondary Aqua Blue R26 G160 B170
Secondary Pastel Green R126 G205 B195
Secondary Light Purple R123 G149 B174*
Secondary Purple R97 G107 B156
Secondary Ecru R186 G163 B171
Secondary Yellow R215 G176 B18
Secondary Orange R213 G135 B43
Secondary Red R238 G52 B36
Secondary Rubine Red R226 G1 B119
*This colour reference is for screen presentations only
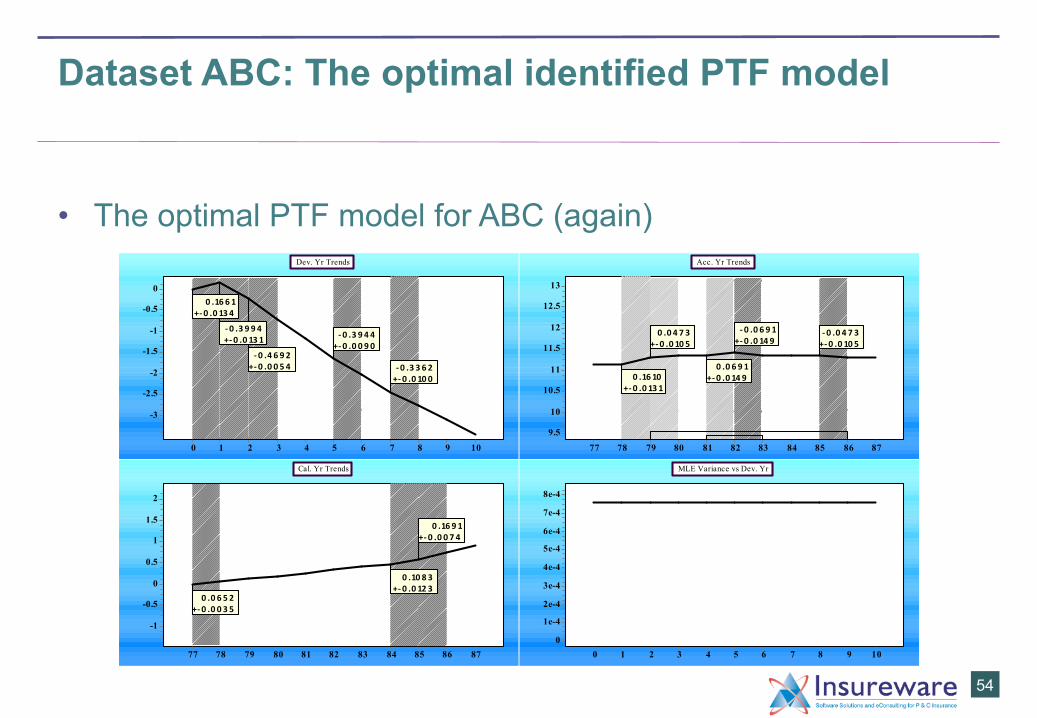
Dataset ABC: The optimal identified PTF model
• The optimal PTF model for ABC (again)
54
Dev. Yr Trends
0 1 2 3 4 5 6 7 8 9 10
-3
-2.5
-2
-1.5
-1
-0.5
00 .16 6 1
+-‐ 0 .0 13 4
-‐ 0 .3 9 9 4+-‐ 0 .0 13 1
-‐ 0 .4 6 9 2+-‐ 0 .0 0 5 4
-‐ 0 .3 9 4 4+-‐ 0 .0 0 9 0
-‐ 0 .3 3 6 2+-‐ 0 .0 10 0
Acc. Yr Trends
77 78 79 80 81 82 83 84 85 86 87
9.5
10
10.5
11
11.5
12
12.5
13
0 .16 10+-‐ 0 .0 13 1
0 .0 4 7 3+-‐ 0 .0 10 5
0 .0 6 9 1+-‐ 0 .0 14 9
-‐ 0 .0 6 9 1+-‐ 0 .0 14 9
-‐ 0 .0 4 7 3+-‐ 0 .0 10 5
Cal. Yr Trends
77 78 79 80 81 82 83 84 85 86 87
-1
-0.5
0
0.5
1
1.5
2
0 .0 6 5 2+-‐ 0 .0 0 3 5
0 .10 8 3+-‐ 0 .0 12 3
0 .16 9 1+-‐ 0 .0 0 7 4
MLE Variance vs Dev. Yr
0 1 2 3 4 5 6 7 8 9 100
1e-4
2e-4
3e-4
4e-4
5e-4
6e-4
7e-4
8e-4
Colour palette for PowerPoint presentations
Actuarial Bright Green R148 G166 B31
Actuarial Slate R32 G44 B52 *
Secondary Olive Green R120 G162 B47
Secondary colour palette
Primary colour palette
Secondary Bottle Green R0 G147 B127
Secondary Turquoise R0 G138 B176
Secondary Aqua Blue R26 G160 B170
Secondary Pastel Green R126 G205 B195
Secondary Light Purple R123 G149 B174*
Secondary Purple R97 G107 B156
Secondary Ecru R186 G163 B171
Secondary Yellow R215 G176 B18
Secondary Orange R213 G135 B43
Secondary Red R238 G52 B36
Secondary Rubine Red R226 G1 B119
*This colour reference is for screen presentations only
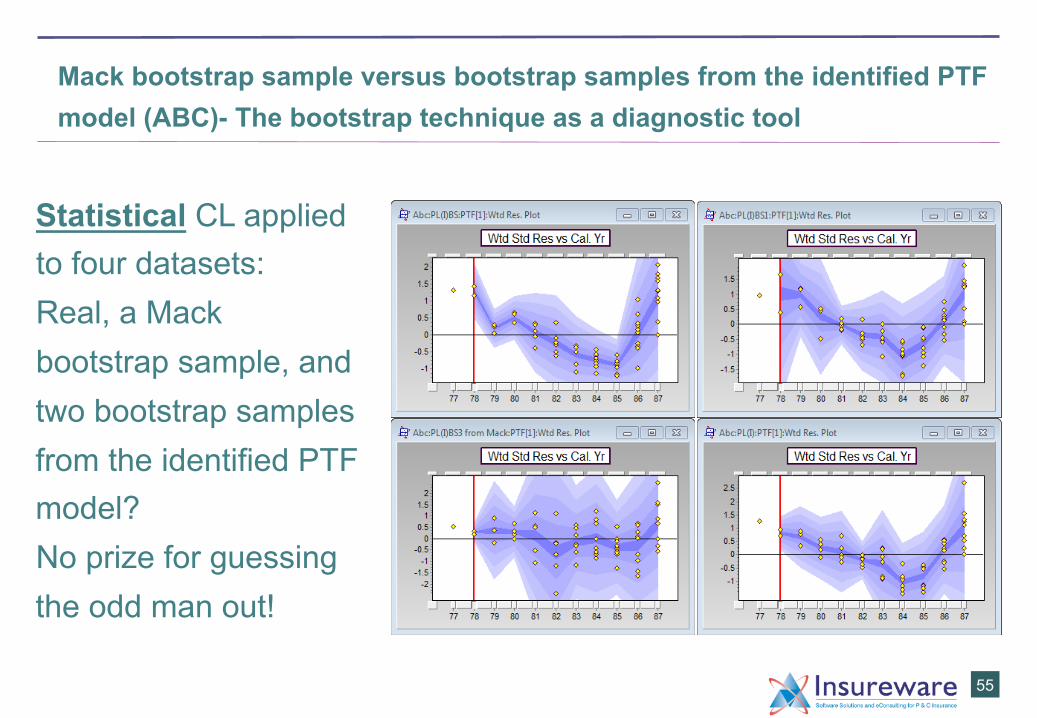
Mack bootstrap sample versus bootstrap samples from the identified PTF model (ABC)- The bootstrap technique as a diagnostic tool
Statistical CL applied to four datasets: Real, a Mack bootstrap sample, and
two bootstrap samples from the identified PTF model? No prize for guessing the odd man out!
55
Colour palette for PowerPoint presentations
Actuarial Bright Green R148 G166 B31
Actuarial Slate R32 G44 B52 *
Secondary Olive Green R120 G162 B47
Secondary colour palette
Primary colour palette
Secondary Bottle Green R0 G147 B127
Secondary Turquoise R0 G138 B176
Secondary Aqua Blue R26 G160 B170
Secondary Pastel Green R126 G205 B195
Secondary Light Purple R123 G149 B174*
Secondary Purple R97 G107 B156
Secondary Ecru R186 G163 B171
Secondary Yellow R215 G176 B18
Secondary Orange R213 G135 B43
Secondary Red R238 G52 B36
Secondary Rubine Red R226 G1 B119
*This colour reference is for screen presentations only
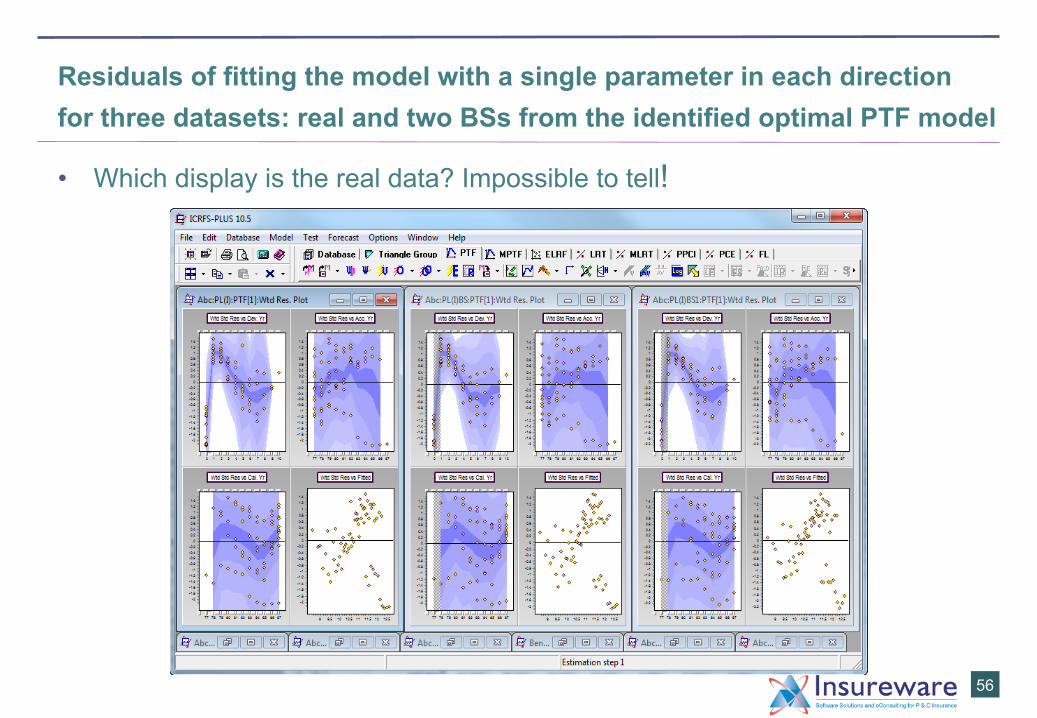
Residuals of fitting the model with a single parameter in each direction for three datasets: real and two BSs from the identified optimal PTF model
• Which display is the real data? Impossible to tell!
56