Embed Size (px)
Citation preview
Colours
Cholamandalam Investment and Finance Company Limited
Corporate Presentation – March 2017
Colours
Table of Contents
Corporate Overview
Business Overview
Funding Profile
Business Enablers
Financial Performance
Subsidiaries
2
Colours
CORPORATE OVERVIEW
3
Colours
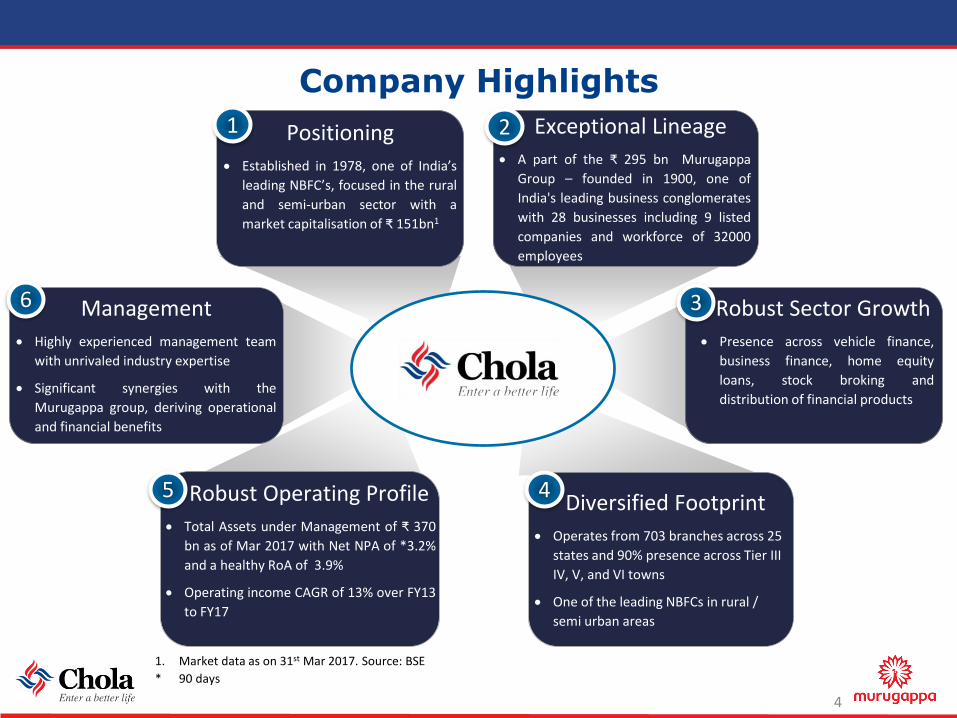
Company Highlights
Positioning
Established in 1978, one of India’s
leading NBFC’s, focused in the rural
and semi-urban sector with a
market capitalisation of ₹ 151bn1
Exceptional Lineage
A part of the ₹ 295 bn Murugappa
Group – founded in 1900, one of
India's leading business conglomerates
with 28 businesses including 9 listed
companies and workforce of 32000
employees
Robust Sector Growth
Presence across vehicle finance,
business finance, home equity
loans, stock broking and
distribution of financial products
Diversified Footprint
Operates from 703 branches across 25
states and 90% presence across Tier III
IV, V, and VI towns
One of the leading NBFCs in rural /
semi urban areas
Robust Operating Profile
Total Assets under Management of ₹ 370
bn as of Mar 2017 with Net NPA of *3.2%
and a healthy RoA of 3.9%
Operating income CAGR of 13% over FY13
to FY17
Management
Highly experienced management team
with unrivaled industry expertise
Significant synergies with the
Murugappa group, deriving operational
and financial benefits
1. Market data as on 31st Mar 2017. Source: BSE
* 90 days
4
1 2
3
45
6
Colours
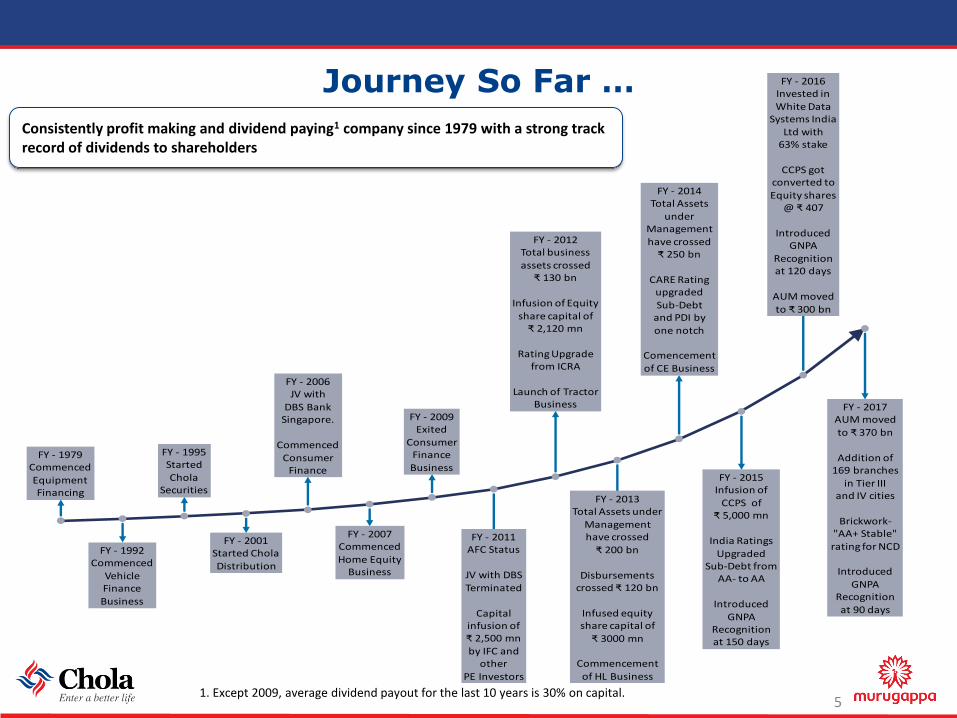
FY - 1979 Commenced Equipment Financing
FY - 1995 Started Chola
Securities
FY - 2006 JV with
DBS Bank Singapore.
Commenced Consumer
Finance
FY - 2009 Exited
Consumer Finance Business
FY - 2012 Total businessassets crossed
₹ 130 bn
Infusion of Equity share capital of
₹ 2,120 mn
Rating Upgrade from ICRA
Launch of TractorBusiness
FY - 2014 Total Assets
under Management have crossed
₹ 250 bn
CARE Rating upgraded Sub-Debt
and PDI by one notch
Comencement
of CE Business
FY - 2016 Invested in White Data
Systems IndiaLtd with
63% stake
CCPS gotconverted toEquity shares
@ ₹ 407
IntroducedGNPA
Recognitionat 120 days
AUM moved to ₹ 300 bn
FY - 1992 Commenced
Vehicle Finance Business
FY - 2001 Started CholaDistribution
FY - 2007 Commenced Home Equity
Business
FY - 2011 AFC Status
JV with DBS Terminated
Capital infusion of ₹ 2,500 mn by IFC and
other PE Investors
FY - 2013 Total Assets under
Management have crossed
₹ 200 bn
Disbursements crossed ₹ 120 bn
Infused equity share capital of
₹ 3000 mn
Commencementof HL Business
FY - 2015 Infusion of
CCPS of ₹ 5,000 mn
India Ratings Upgraded
Sub-Debt from AA- to AA
IntroducedGNPA
Recognitionat 150 days
FY - 2017 AUM moved to ₹ 370 bn
Addition of 169 branches
in Tier III and IV cities
Brickwork-"AA+ Stable" rating for NCD
IntroducedGNPA
Recognitionat 90 days
Journey So Far …
Consistently profit making and dividend paying1 company since 1979 with a strong track record of dividends to shareholders
1. Except 2009, average dividend payout for the last 10 years is 30% on capital.5
Colours
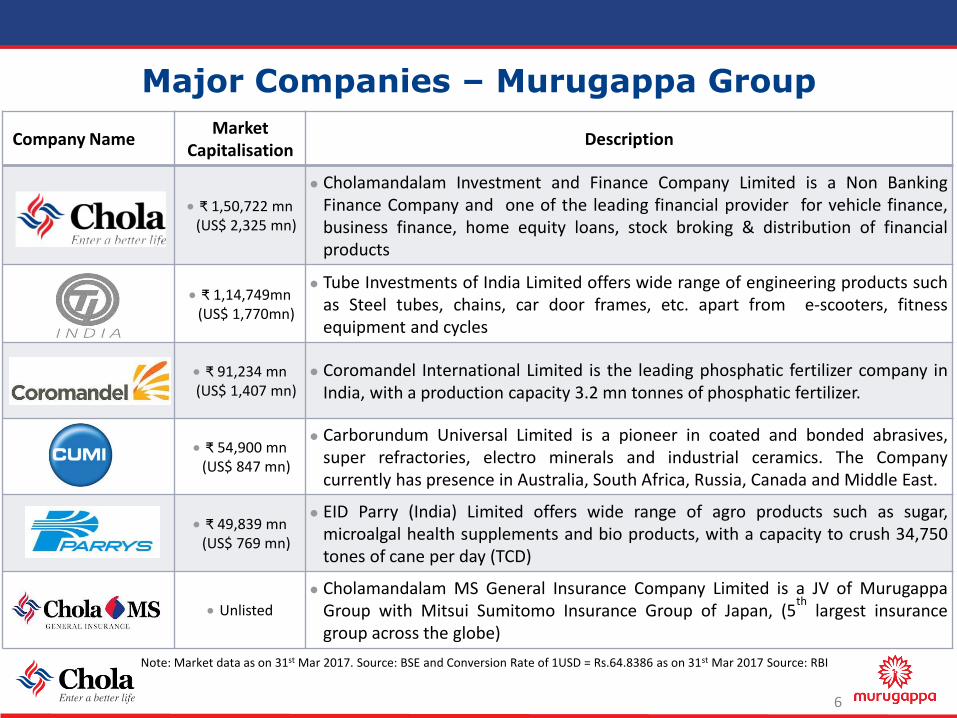
Major Companies – Murugappa Group
Company NameMarket
CapitalisationDescription
₹ 1,50,722 mn(US$ 2,325 mn)
Cholamandalam Investment and Finance Company Limited is a Non BankingFinance Company and one of the leading financial provider for vehicle finance,business finance, home equity loans, stock broking & distribution of financialproducts
₹ 1,14,749mn (US$ 1,770mn)
Tube Investments of India Limited offers wide range of engineering products suchas Steel tubes, chains, car door frames, etc. apart from e-scooters, fitnessequipment and cycles
₹ 91,234 mn(US$ 1,407 mn)
Coromandel International Limited is the leading phosphatic fertilizer company inIndia, with a production capacity 3.2 mn tonnes of phosphatic fertilizer.
₹ 54,900 mn(US$ 847 mn)
Carborundum Universal Limited is a pioneer in coated and bonded abrasives,super refractories, electro minerals and industrial ceramics. The Companycurrently has presence in Australia, South Africa, Russia, Canada and Middle East.
₹ 49,839 mn(US$ 769 mn)
EID Parry (India) Limited offers wide range of agro products such as sugar,microalgal health supplements and bio products, with a capacity to crush 34,750tones of cane per day (TCD)
Unlisted
Cholamandalam MS General Insurance Company Limited is a JV of MurugappaGroup with Mitsui Sumitomo Insurance Group of Japan, (5
thlargest insurance
group across the globe)
Note: Market data as on 31st Mar 2017. Source: BSE and Conversion Rate of 1USD = Rs.64.8386 as on 31st Mar 2017 Source: RBI
6
Colours
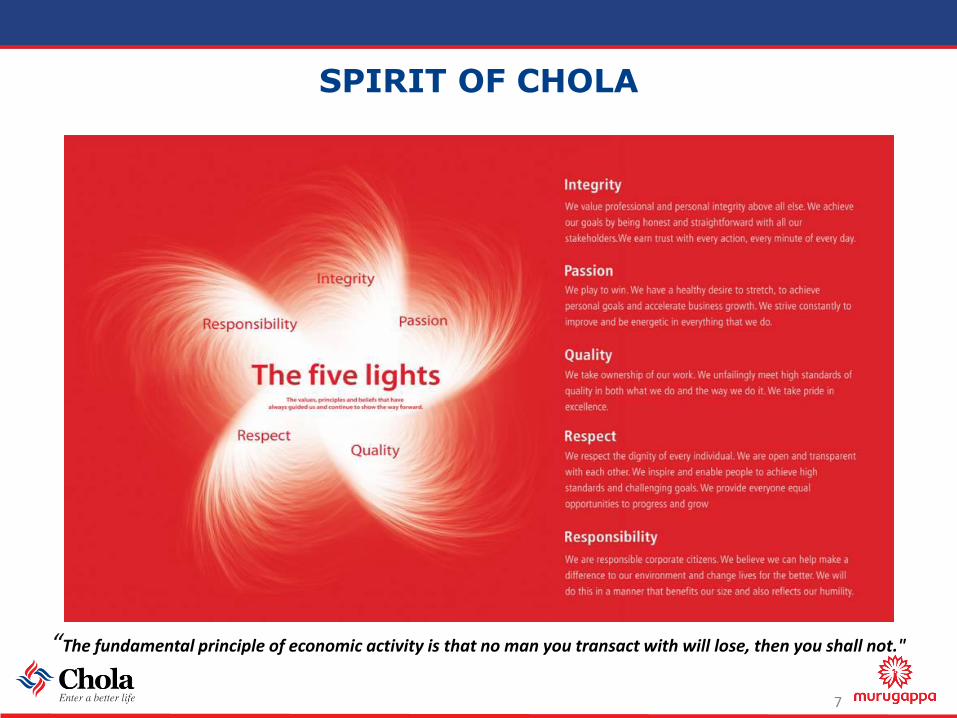
SPIRIT OF CHOLA
“The fundamental principle of economic activity is that no man you transact with will lose, then you shall not."
7
Colours
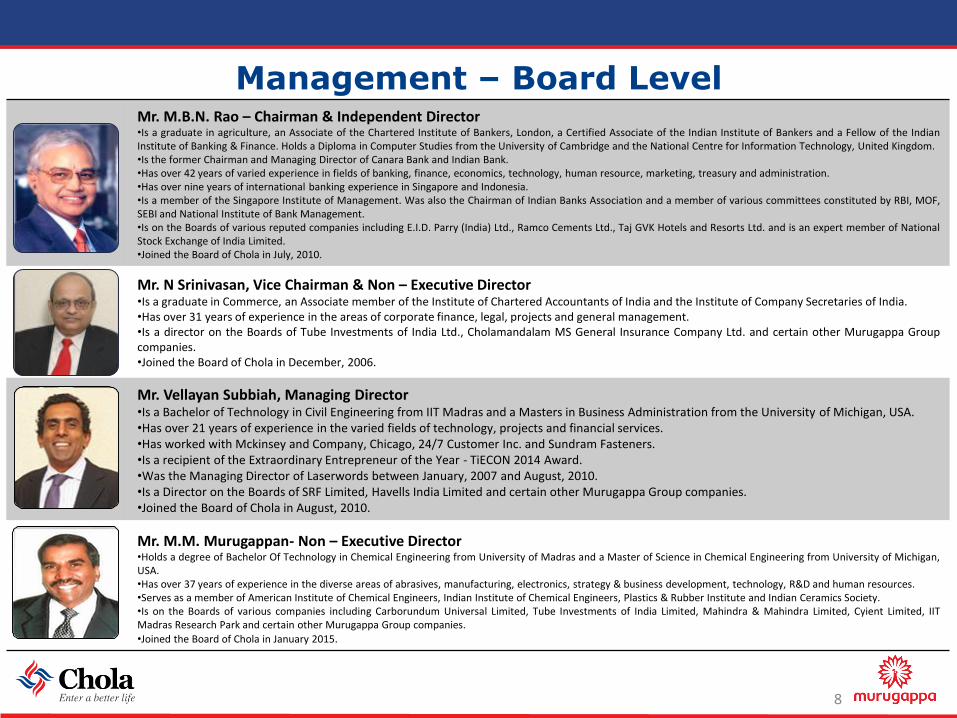
Management – Board LevelMr. M.B.N. Rao – Chairman & Independent Director•Is a graduate in agriculture, an Associate of the Chartered Institute of Bankers, London, a Certified Associate of the Indian Institute of Bankers and a Fellow of the IndianInstitute of Banking & Finance. Holds a Diploma in Computer Studies from the University of Cambridge and the National Centre for Information Technology, United Kingdom.•Is the former Chairman and Managing Director of Canara Bank and Indian Bank.•Has over 42 years of varied experience in fields of banking, finance, economics, technology, human resource, marketing, treasury and administration.•Has over nine years of international banking experience in Singapore and Indonesia.•Is a member of the Singapore Institute of Management. Was also the Chairman of Indian Banks Association and a member of various committees constituted by RBI, MOF,SEBI and National Institute of Bank Management.•Is on the Boards of various reputed companies including E.I.D. Parry (India) Ltd., Ramco Cements Ltd., Taj GVK Hotels and Resorts Ltd. and is an expert member of NationalStock Exchange of India Limited.•Joined the Board of Chola in July, 2010.
Mr. N Srinivasan, Vice Chairman & Non – Executive Director•Is a graduate in Commerce, an Associate member of the Institute of Chartered Accountants of India and the Institute of Company Secretaries of India.•Has over 31 years of experience in the areas of corporate finance, legal, projects and general management.•Is a director on the Boards of Tube Investments of India Ltd., Cholamandalam MS General Insurance Company Ltd. and certain other Murugappa Groupcompanies.•Joined the Board of Chola in December, 2006.
Mr. Vellayan Subbiah, Managing Director•Is a Bachelor of Technology in Civil Engineering from IIT Madras and a Masters in Business Administration from the University of Michigan, USA.•Has over 21 years of experience in the varied fields of technology, projects and financial services.•Has worked with Mckinsey and Company, Chicago, 24/7 Customer Inc. and Sundram Fasteners. •Is a recipient of the Extraordinary Entrepreneur of the Year - TiECON 2014 Award.•Was the Managing Director of Laserwords between January, 2007 and August, 2010.•Is a Director on the Boards of SRF Limited, Havells India Limited and certain other Murugappa Group companies.•Joined the Board of Chola in August, 2010.
Mr. M.M. Murugappan- Non – Executive Director•Holds a degree of Bachelor Of Technology in Chemical Engineering from University of Madras and a Master of Science in Chemical Engineering from University of Michigan,USA.•Has over 37 years of experience in the diverse areas of abrasives, manufacturing, electronics, strategy & business development, technology, R&D and human resources.•Serves as a member of American Institute of Chemical Engineers, Indian Institute of Chemical Engineers, Plastics & Rubber Institute and Indian Ceramics Society.•Is on the Boards of various companies including Carborundum Universal Limited, Tube Investments of India Limited, Mahindra & Mahindra Limited, Cyient Limited, IITMadras Research Park and certain other Murugappa Group companies.
•Joined the Board of Chola in January 2015.
8
Colours
Management – Board Level
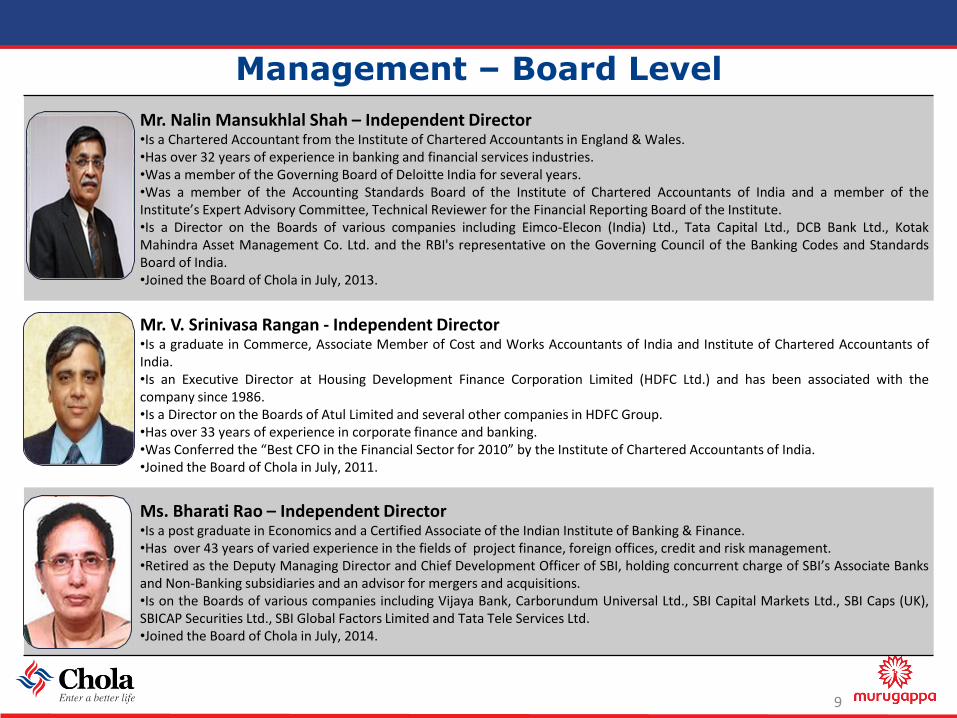
Mr. Nalin Mansukhlal Shah – Independent Director•Is a Chartered Accountant from the Institute of Chartered Accountants in England & Wales.•Has over 32 years of experience in banking and financial services industries.•Was a member of the Governing Board of Deloitte India for several years.•Was a member of the Accounting Standards Board of the Institute of Chartered Accountants of India and a member of theInstitute’s Expert Advisory Committee, Technical Reviewer for the Financial Reporting Board of the Institute.•Is a Director on the Boards of various companies including Eimco-Elecon (India) Ltd., Tata Capital Ltd., DCB Bank Ltd., KotakMahindra Asset Management Co. Ltd. and the RBI's representative on the Governing Council of the Banking Codes and StandardsBoard of India.•Joined the Board of Chola in July, 2013.
Mr. V. Srinivasa Rangan - Independent Director•Is a graduate in Commerce, Associate Member of Cost and Works Accountants of India and Institute of Chartered Accountants ofIndia.•Is an Executive Director at Housing Development Finance Corporation Limited (HDFC Ltd.) and has been associated with thecompany since 1986.•Is a Director on the Boards of Atul Limited and several other companies in HDFC Group.•Has over 33 years of experience in corporate finance and banking.•Was Conferred the “Best CFO in the Financial Sector for 2010” by the Institute of Chartered Accountants of India.•Joined the Board of Chola in July, 2011.
Ms. Bharati Rao – Independent Director•Is a post graduate in Economics and a Certified Associate of the Indian Institute of Banking & Finance.•Has over 43 years of varied experience in the fields of project finance, foreign offices, credit and risk management.•Retired as the Deputy Managing Director and Chief Development Officer of SBI, holding concurrent charge of SBI’s Associate Banksand Non-Banking subsidiaries and an advisor for mergers and acquisitions.•Is on the Boards of various companies including Vijaya Bank, Carborundum Universal Ltd., SBI Capital Markets Ltd., SBI Caps (UK),SBICAP Securities Ltd., SBI Global Factors Limited and Tata Tele Services Ltd.•Joined the Board of Chola in July, 2014.
9
Colours
Corporate Overview
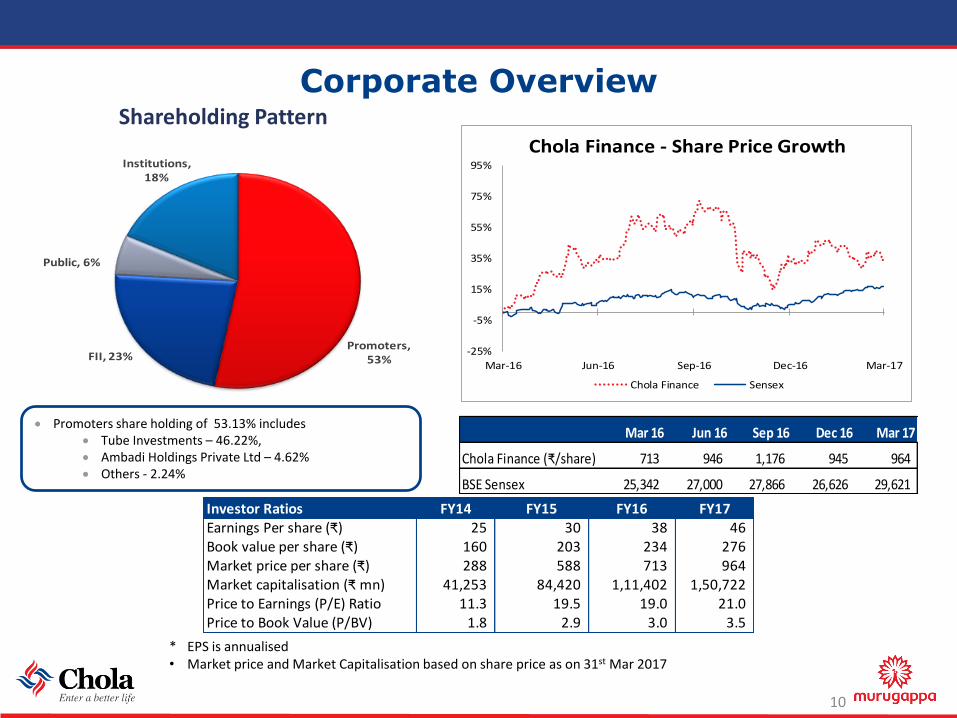
Promoters, 53%FII, 23%
Public, 6%
Institutions, 18%
Promoters share holding of 53.13% includes Tube Investments – 46.22%, Ambadi Holdings Private Ltd – 4.62% Others - 2.24%
Shareholding Pattern
10
-25%
-5%
15%
35%
55%
75%
95%
Mar-16 Jun-16 Sep-16 Dec-16 Mar-17
Chola Finance - Share Price Growth
Chola Finance Sensex
Mar 16 Jun 16 Sep 16 Dec 16 Mar 17
Chola Finance (₹/share) 713 946 1,176 945 964
BSE Sensex 25,342 27,000 27,866 26,626 29,621
Investor Ratios FY14 FY15 FY16 FY17Earnings Per share (₹) 25 30 38 46 Book value per share (₹) 160 203 234 276 Market price per share (₹) 288 588 713 964 Market capitalisation (₹ mn) 41,253 84,420 1,11,402 1,50,722 Price to Earnings (P/E) Ratio 11.3 19.5 19.0 21.0 Price to Book Value (P/BV) 1.8 2.9 3.0 3.5
* EPS is annualised• Market price and Market Capitalisation based on share price as on 31st Mar 2017
Colours
Corporate Overview
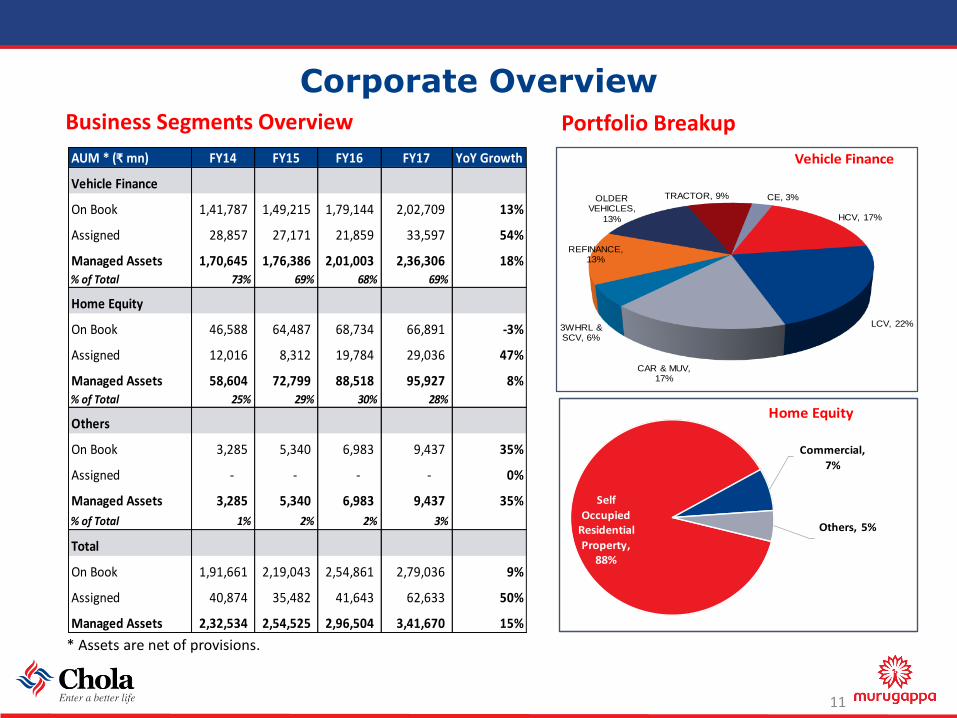
* Assets are net of provisions.
Business Segments Overview
11
HCV, 17%
LCV, 22%
CAR & MUV, 17%
3WHRL & SCV, 6%
REFINANCE, 13%
OLDER VEHICLES,
13%
TRACTOR, 9% CE, 3%
Vehicle Finance
Self
Occupied Residential
Property, 88%
Commercial,
7%
Others, 5%
Home Equity
Portfolio Breakup
AUM * (₹ mn) FY14 FY15 FY16 FY17 YoY Growth
Vehicle Finance
On Book 1,41,787 1,49,215 1,79,144 2,02,709 13%
Assigned 28,857 27,171 21,859 33,597 54%
Managed Assets 1,70,645 1,76,386 2,01,003 2,36,306 18%% of Total 73% 69% 68% 69%
Home Equity
On Book 46,588 64,487 68,734 66,891 -3%
Assigned 12,016 8,312 19,784 29,036 47%
Managed Assets 58,604 72,799 88,518 95,927 8%% of Total 25% 29% 30% 28%
Others
On Book 3,285 5,340 6,983 9,437 35%
Assigned - - - - 0%
Managed Assets 3,285 5,340 6,983 9,437 35%
% of Total 1% 2% 2% 3%
Total
On Book 1,91,661 2,19,043 2,54,861 2,79,036 9%
Assigned 40,874 35,482 41,643 62,633 50%
Managed Assets 2,32,534 2,54,525 2,96,504 3,41,670 15%
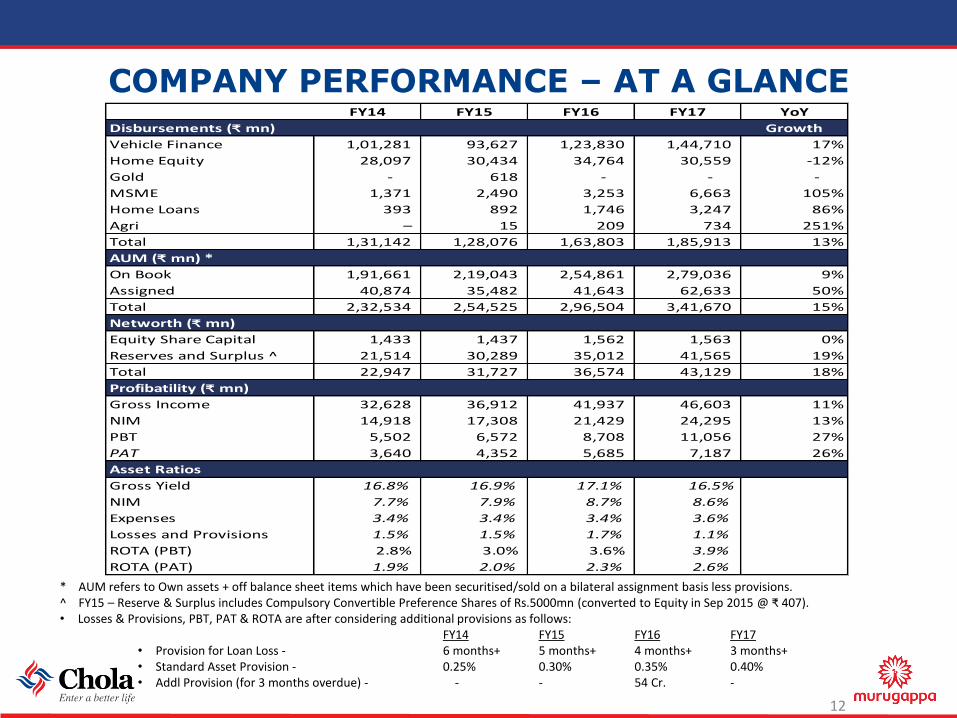
ColoursFY14 FY15 FY16 FY17 YoY
Disbursements (₹ mn) Growth
Vehicle Finance 1,01,281 93,627 1,23,830 1,44,710 17%
Home Equity 28,097 30,434 34,764 30,559 -12%
Gold - 618 - - -
MSME 1,371 2,490 3,253 6,663 105%
Home Loans 393 892 1,746 3,247 86%
Agri – 15 209 734 251%
Total 1,31,142 1,28,076 1,63,803 1,85,913 13%
AUM (₹ mn) *
On Book 1,91,661 2,19,043 2,54,861 2,79,036 9%
Assigned 40,874 35,482 41,643 62,633 50%
Total 2,32,534 2,54,525 2,96,504 3,41,670 15%
Networth (₹ mn)
Equity Share Capital 1,433 1,437 1,562 1,563 0%
Reserves and Surplus ^ 21,514 30,289 35,012 41,565 19%
Total 22,947 31,727 36,574 43,129 18%
Profibatility (₹ mn)
Gross Income 32,628 36,912 41,937 46,603 11%
NIM 14,918 17,308 21,429 24,295 13%
PBT 5,502 6,572 8,708 11,056 27%
PAT 3,640 4,352 5,685 7,187 26%
Asset Ratios
Gross Yield 16.8% 16.9% 17.1% 16.5%
NIM 7.7% 7.9% 8.7% 8.6%
Expenses 3.4% 3.4% 3.4% 3.6%
Losses and Provisions 1.5% 1.5% 1.7% 1.1%
ROTA (PBT) 2.8% 3.0% 3.6% 3.9%
ROTA (PAT) 1.9% 2.0% 2.3% 2.6%
COMPANY PERFORMANCE – AT A GLANCE
* AUM refers to Own assets + off balance sheet items which have been securitised/sold on a bilateral assignment basis less provisions.^ FY15 – Reserve & Surplus includes Compulsory Convertible Preference Shares of Rs.5000mn (converted to Equity in Sep 2015 @ ₹ 407).• Losses & Provisions, PBT, PAT & ROTA are after considering additional provisions as follows:
FY14 FY15 FY16 FY17• Provision for Loan Loss - 6 months+ 5 months+ 4 months+ 3 months+• Standard Asset Provision - 0.25% 0.30% 0.35% 0.40%• Addl Provision (for 3 months overdue) - - - 54 Cr. -
12
Colours
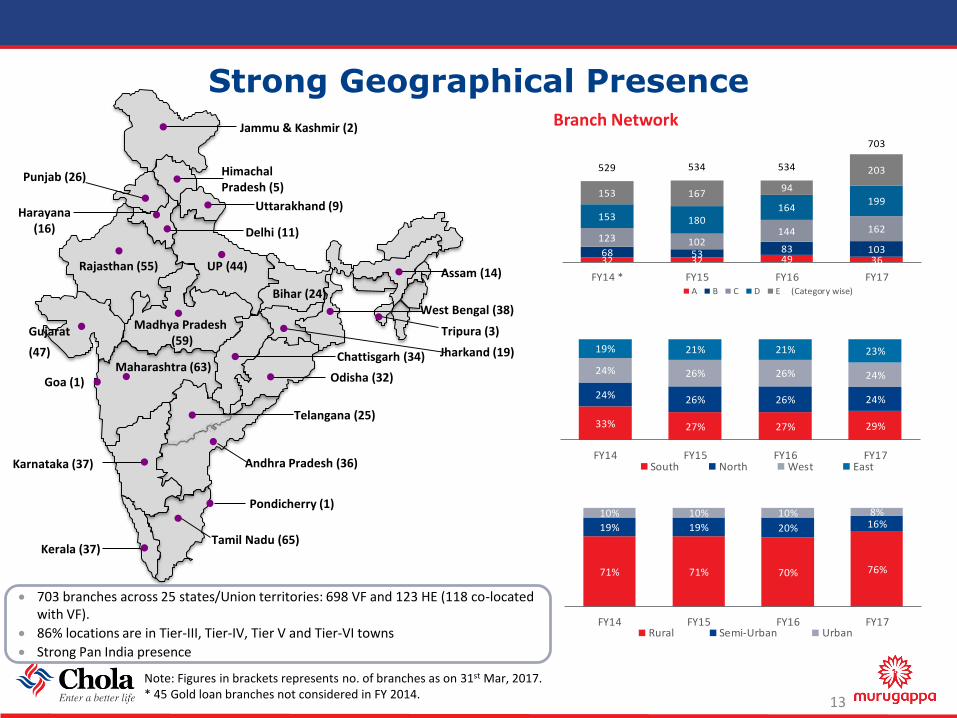
32 32 49 3668 53 83 103
123 102144 162
153 180164
199153 167
94
203529 534 534
703
FY14 * FY15 FY16 FY17A B C D E (Category wise)
Strong Geographical Presence
13
Note: Figures in brackets represents no. of branches as on 31st Mar, 2017.* 45 Gold loan branches not considered in FY 2014.
703 branches across 25 states/Union territories: 698 VF and 123 HE (118 co-located with VF).
86% locations are in Tier-III, Tier-IV, Tier V and Tier-VI towns
Strong Pan India presence
Branch Network
33% 27% 27% 29%
24% 26% 26% 24%
24% 26% 26% 24%
19% 21% 21% 23%
FY14 FY15 FY16 FY17South North West East
71% 71% 70% 76%
19% 19% 20% 16%10% 10% 10% 8%
FY14 FY15 FY16 FY17Rural Semi-Urban Urban
Bihar (24)
Chattisgarh (34) Jharkand (19)
Odisha (32)
West Bengal (38)
Delhi (11)
Punjab (26)
Rajasthan (55) UP (44)
Uttarakhand (9)
Karnataka (37)
Kerala (37)Tamil Nadu (65)
Maharashtra (63)
Pondicherry (1)
Gujarat
(47)
Goa (1)
Madhya Pradesh(59)
Andhra Pradesh (36)
Assam (14)
Harayana(16)
Himachal Pradesh (5)
Telangana (25)
Jammu & Kashmir (2)
Tripura (3)
Colours
Chola - Financial Summary
14
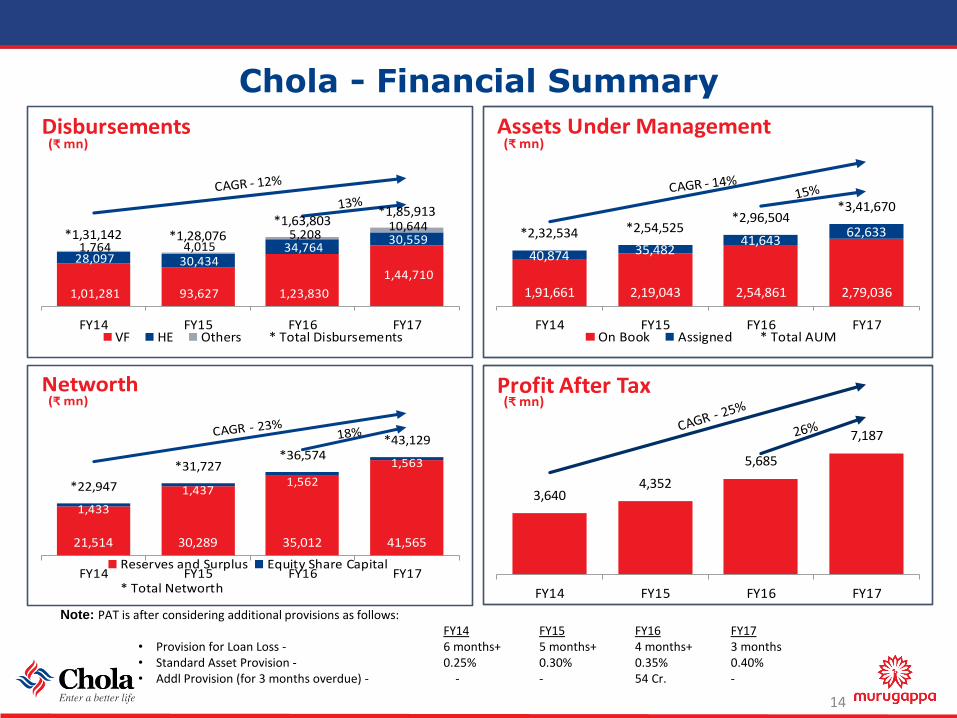
1,01,281 93,627 1,23,830
1,44,710 28,097 30,434
34,764 30,559
1,764 4,015 5,208
10,644 *1,31,142 *1,28,076
*1,63,803*1,85,913
FY14 FY15 FY16 FY17
(₹ mn)Disbursements
VF HE Others * Total Disbursements
1,91,661 2,19,043 2,54,861 2,79,036
40,874 35,48241,643
62,633*2,32,534 *2,54,525*2,96,504
*3,41,670
FY14 FY15 FY16 FY17
(₹ mn)Assets Under Management
On Book Assigned * Total AUM
21,514 30,289 35,012 41,565
1,433
1,4371,562
1,563
*22,947
*31,727*36,574
*43,129
FY14 FY15 FY16 FY17
(₹ mn)Networth
Reserves and Surplus Equity Share Capital
* Total Networth
3,6404,352
5,685
7,187
FY14 FY15 FY16 FY17
(₹ mn)Profit After Tax
Note: PAT is after considering additional provisions as follows:FY14 FY15 FY16 FY17
• Provision for Loan Loss - 6 months+ 5 months+ 4 months+ 3 months• Standard Asset Provision - 0.25% 0.30% 0.35% 0.40%• Addl Provision (for 3 months overdue) - - - 54 Cr. -
Colours
Chola - Financial Summary (Cont’d)
15
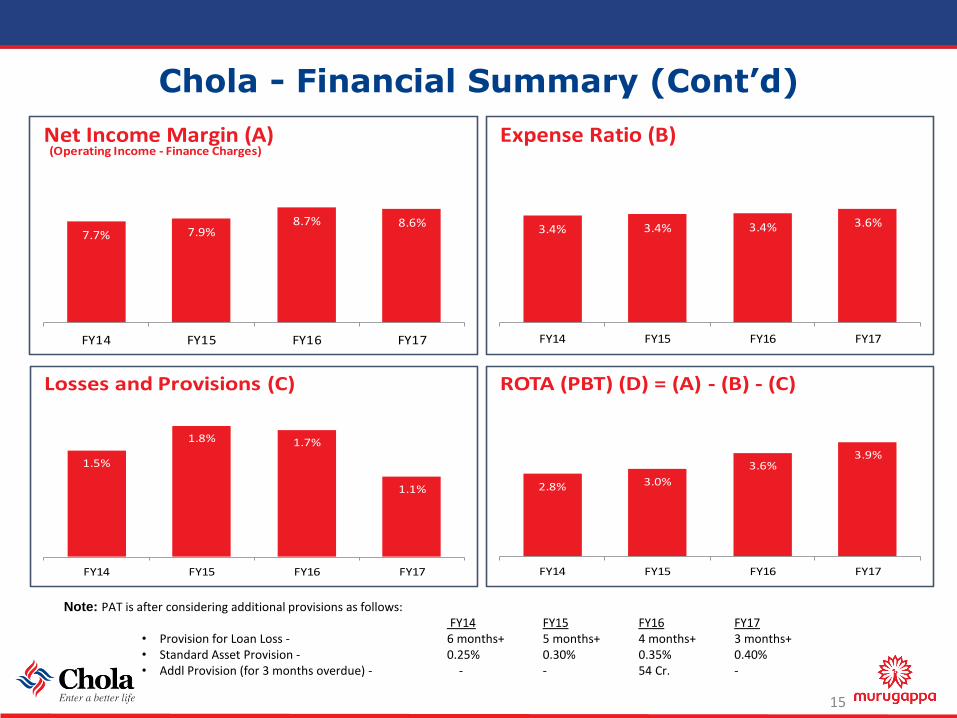
7.7% 7.9%8.7% 8.6%
FY14 FY15 FY16 FY17
(Operating Income - Finance Charges)Net Income Margin (A)
3.4% 3.4% 3.4% 3.6%
FY14 FY15 FY16 FY17
Expense Ratio (B)
1.5%
1.8% 1.7%
1.1%
FY14 FY15 FY16 FY17
Losses and Provisions (C)
2.8% 3.0%
3.6%3.9%
FY14 FY15 FY16 FY17
ROTA (PBT) (D) = (A) - (B) - (C)
Note: PAT is after considering additional provisions as follows:FY14 FY15 FY16 FY17
• Provision for Loan Loss - 6 months+ 5 months+ 4 months+ 3 months+• Standard Asset Provision - 0.25% 0.30% 0.35% 0.40%• Addl Provision (for 3 months overdue) - - - 54 Cr. -
Colours
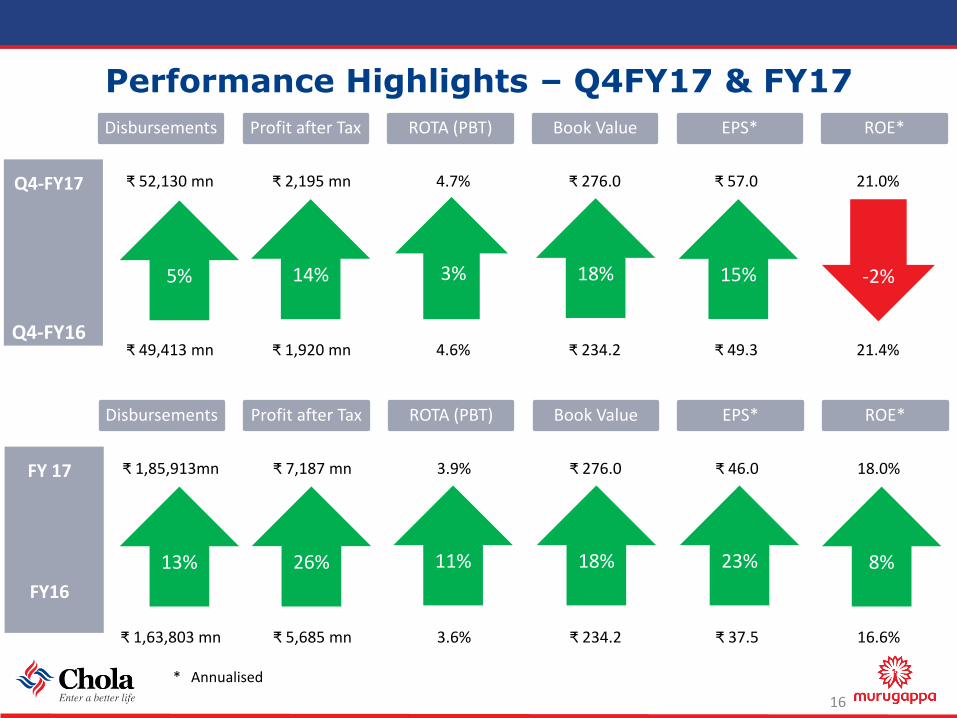
Performance Highlights – Q4FY17 & FY17
Disbursements Profit after Tax ROTA (PBT) Book Value EPS* ROE*
16
Q4-FY17
Q4-FY16
₹ 52,130 mn ₹ 2,195 mn 4.7% ₹ 276.0 ₹ 57.0 21.0%
₹ 49,413 mn ₹ 1,920 mn 4.6% ₹ 234.2 ₹ 49.3 21.4%
14% 18%5%
* Annualised
Disbursements Profit after Tax ROTA (PBT) Book Value EPS* ROE*
FY 17
FY16
₹ 1,85,913mn ₹ 7,187 mn 3.9% ₹ 276.0 ₹ 46.0 18.0%
₹ 1,63,803 mn ₹ 5,685 mn 3.6% ₹ 234.2 ₹ 37.5 16.6%
26% 11% 18% 23% 8%13%
-2%15%3%
Colours
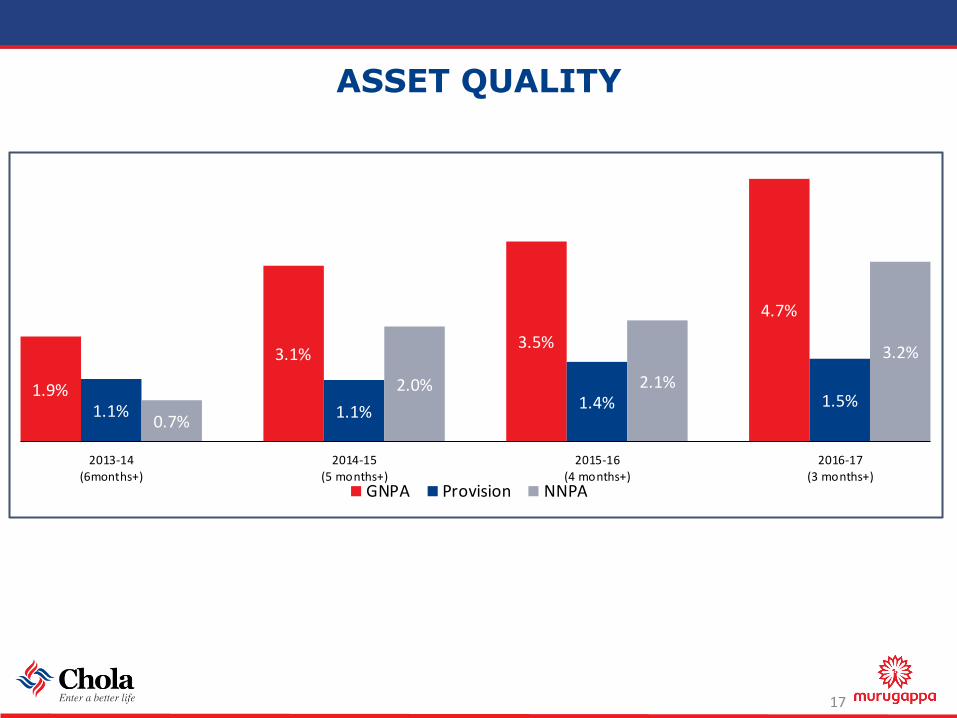
ASSET QUALITY
17
1.9%
3.1%3.5%
4.7%
1.1% 1.1%1.4% 1.5%
0.7%
2.0% 2.1%
3.2%
2013-14
(6months+)
2014-15
(5 months+)
2015-16
(4 months+)
2016-17
(3 months+)GNPA Provision NNPA
Colours
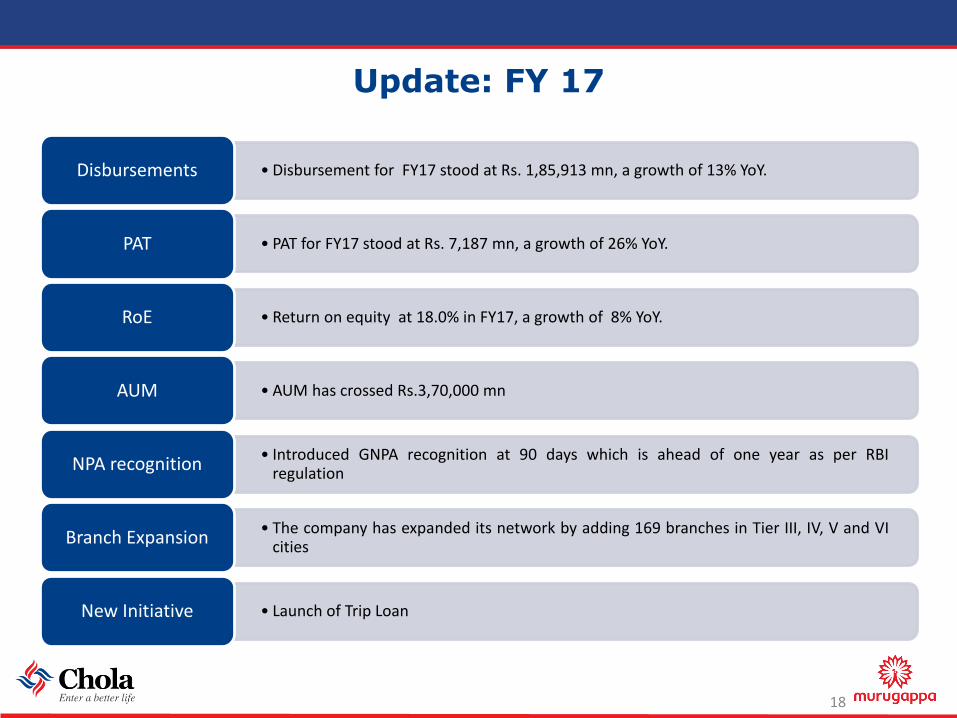
Update: FY 17
18
• Disbursement for FY17 stood at Rs. 1,85,913 mn, a growth of 13% YoY.Disbursements
• PAT for FY17 stood at Rs. 7,187 mn, a growth of 26% YoY.PAT
• Return on equity at 18.0% in FY17, a growth of 8% YoY.RoE
• AUM has crossed Rs.3,70,000 mnAUM
• Introduced GNPA recognition at 90 days which is ahead of one year as per RBIregulation
NPA recognition
• The company has expanded its network by adding 169 branches in Tier III, IV, V and VIcities
Branch Expansion
• Launch of Trip LoanNew Initiative
Colours
BUSINESS OVERVIEW
19
Colours
Vehicle Finance
20
Colours
Vehicle Finance - Industry
21
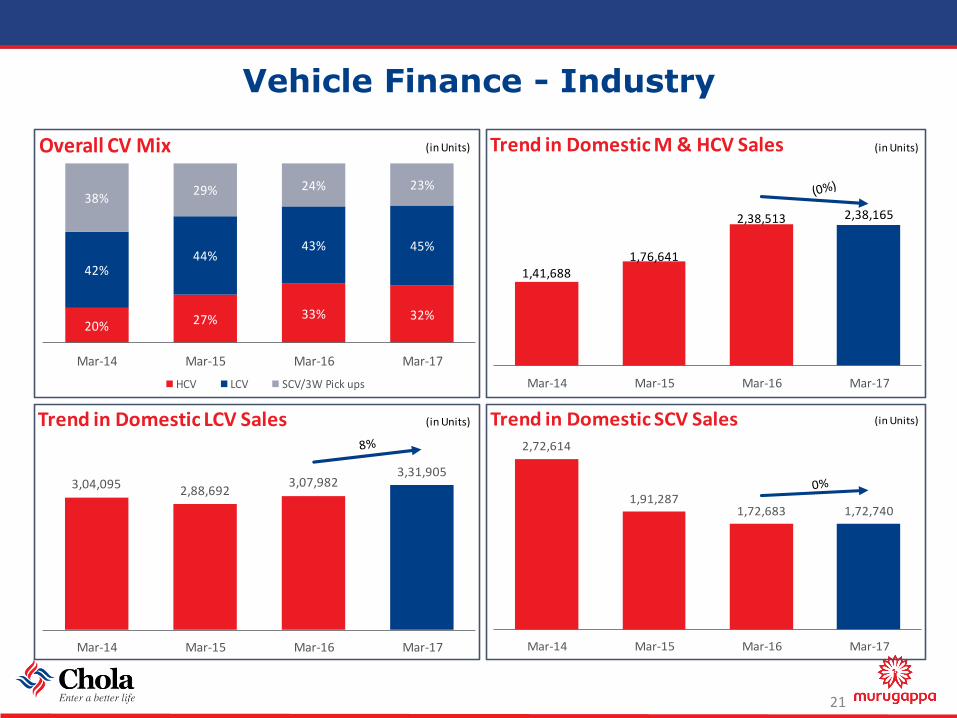
20% 27% 33% 32%
42%44%
43% 45%
38%29% 24% 23%
Mar-14 Mar-15 Mar-16 Mar-17
(in Units)Overall CV Mix
HCV LCV SCV/3W Pick ups
1,41,6881,76,641
2,38,513 2,38,165
Mar-14 Mar-15 Mar-16 Mar-17
(in Units)Trend in Domestic M & HCV Sales
3,04,095 2,88,6923,07,982
3,31,905
Mar-14 Mar-15 Mar-16 Mar-17
(in Units)Trend in Domestic LCV Sales2,72,614
1,91,2871,72,683 1,72,740
Mar-14 Mar-15 Mar-16 Mar-17
(in Units)Trend in Domestic SCV Sales
Colours
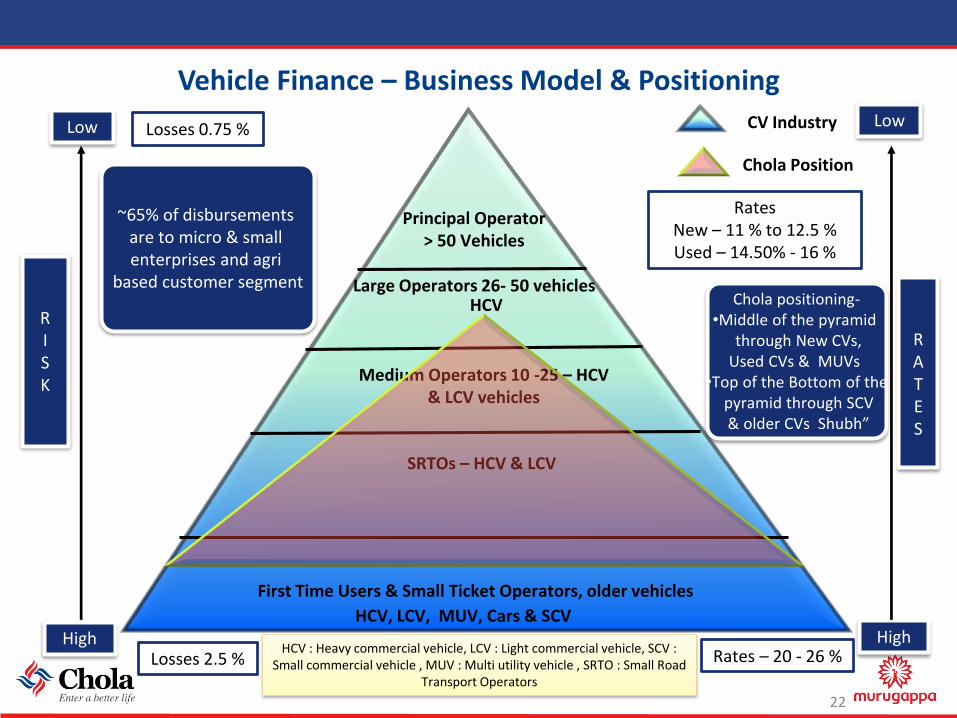
Vehicle Finance – Business Model & Positioning
22
Principal Operator > 50 Vehicles
Large Operators 26- 50 vehicles
Medium Operators 10 -25 – HCV & LCV vehicles
SRTOs – HCV & LCV
First Time Users & Small Ticket Operators, older vehicles
HighHigh
LowLow
RATES
HCV, LCV, MUV, Cars & SCV
HCV RISK
Losses 0.75 %
Rates New – 11 % to 12.5 %Used – 14.50% - 16 %
Rates – 20 - 26 %Losses 2.5 %HCV : Heavy commercial vehicle, LCV : Light commercial vehicle, SCV :
Small commercial vehicle , MUV : Multi utility vehicle , SRTO : Small Road Transport Operators
Chola positioning-•Middle of the pyramid
through New CVs, Used CVs & MUVs
•Top of the Bottom of thepyramid through SCV & older CVs Shubh”
~65% of disbursements are to micro & small enterprises and agri
based customer segment
CV Industry
Chola Position
Colours
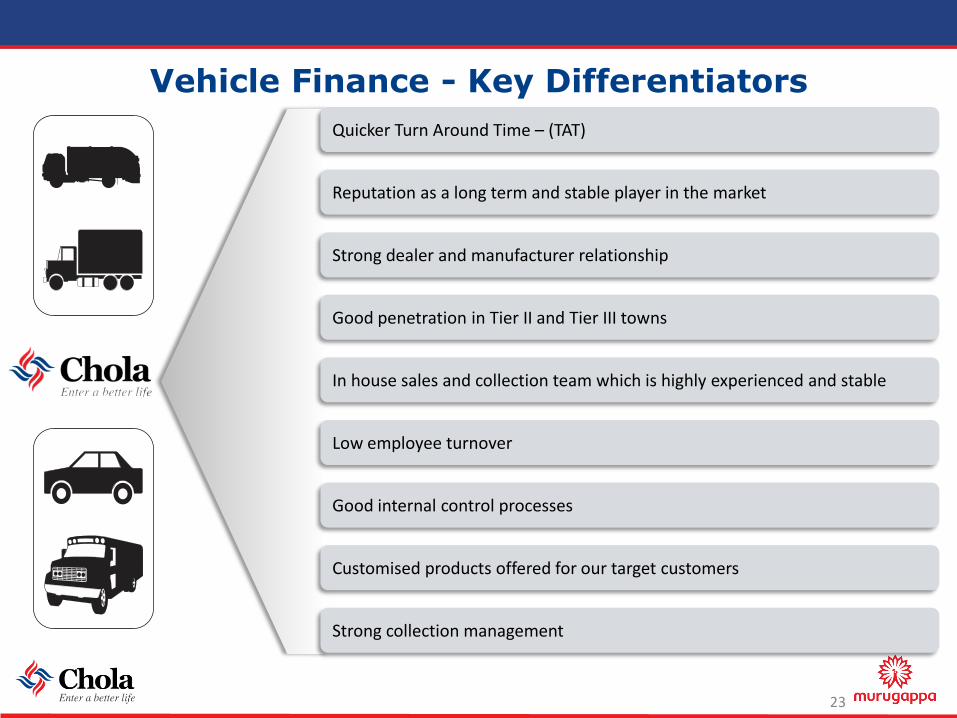
Vehicle Finance - Key Differentiators
23
Quicker Turn Around Time – (TAT)
Reputation as a long term and stable player in the market
Strong dealer and manufacturer relationship
Good penetration in Tier II and Tier III towns
In house sales and collection team which is highly experienced and stable
Low employee turnover
Good internal control processes
Customised products offered for our target customers
Strong collection management
Colours
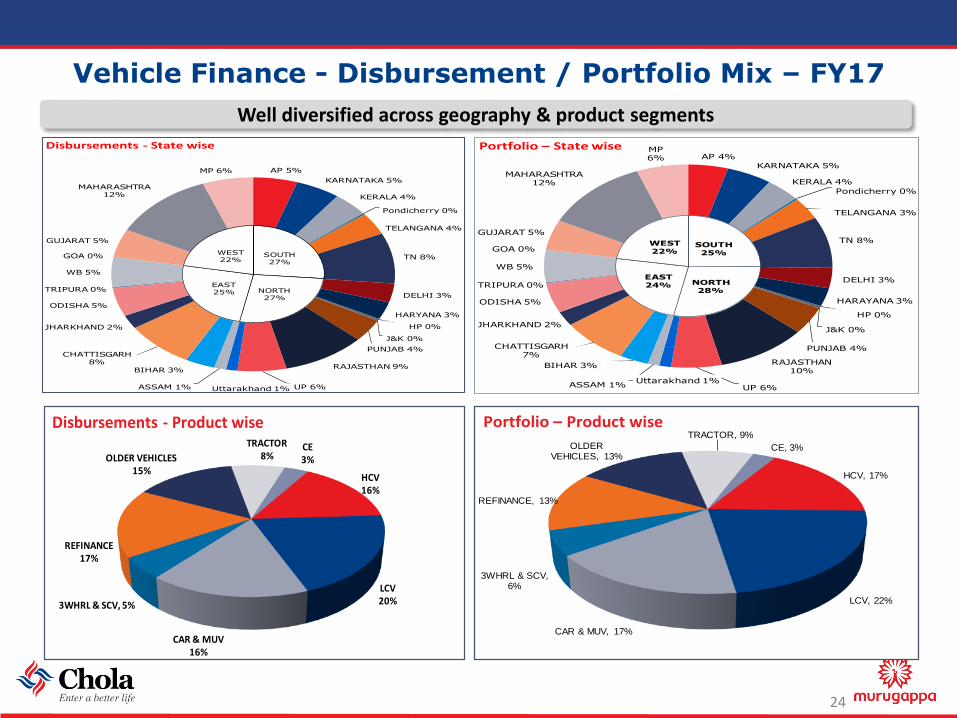
Vehicle Finance - Disbursement / Portfolio Mix – FY17
24
HCV, 17%
LCV, 22%
CAR & MUV, 17%
3WHRL & SCV, 6%
REFINANCE, 13%
OLDER VEHICLES, 13%
TRACTOR, 9%
CE, 3%
Portfolio – Product wise
HCV16%
LCV20%
CAR & MUV16%
3WHRL & SCV, 5%
REFINANCE17%
OLDER VEHICLES15%
TRACTOR8%
CE3%
Disbursements - Product wise
Well diversified across geography & product segments
AP 5%
KARNATAKA 5%
KERALA 4%
Pondicherry 0%
TELANGANA 4%
TN 8%
DELHI 3%
HARYANA 3%
HP 0%
J&K 0%
PUNJAB 4%
RAJASTHAN 9%
UP 6%Uttarakhand 1%ASSAM 1%
BIHAR 3%
CHATTISGARH8%
JHARKHAND 2%
ODISHA 5%
TRIPURA 0%
WB 5%
GOA 0%
GUJARAT 5%
MAHARASHTRA12%
MP 6%
SOUTH27%
NORTH27%
EAST25%
WEST22%
Disbursements - State wiseAP 4%
KARNATAKA 5%
KERALA 4%
Pondicherry 0%
TELANGANA 3%
TN 8%
DELHI 3%
HARAYANA 3%
HP 0%
J&K 0%
PUNJAB 4%
RAJASTHAN10%
UP 6%Uttarakhand 1%
ASSAM 1%
BIHAR 3%
CHATTISGARH7%
JHARKHAND 2%
ODISHA 5%
TRIPURA 0%
WB 5%
GOA 0%
GUJARAT 5%
MAHARASHTRA12%
MP6%
SOUTH25%
NORTH28%
EAST24%
WEST22%
Portfolio – State wise
Colours
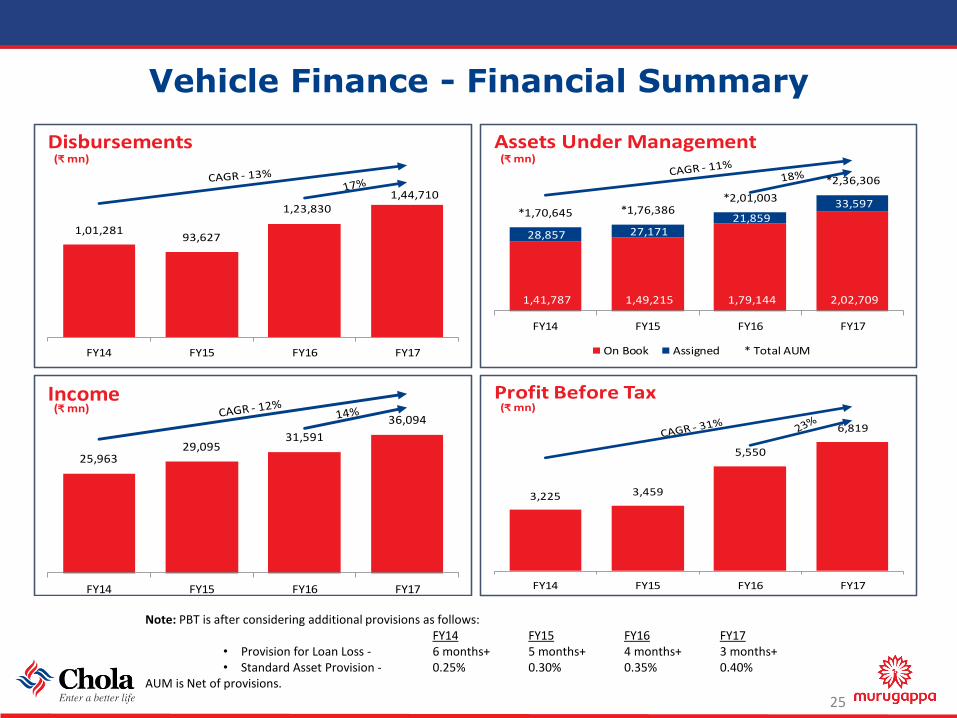
Vehicle Finance - Financial Summary
25
1,01,28193,627
1,23,8301,44,710
FY14 FY15 FY16 FY17
(₹ mn)Disbursements
1,41,787 1,49,215 1,79,144 2,02,709
28,857 27,171 21,859
33,597 *1,70,645 *1,76,386
*2,01,003
*2,36,306
FY14 FY15 FY16 FY17
(₹ mn)Assets Under Management
On Book Assigned * Total AUM
25,96329,095
31,591
36,094
FY14 FY15 FY16 FY17
(₹ mn)Income
3,225 3,459
5,550
6,819
FY14 FY15 FY16 FY17
(₹ mn)Profit Before Tax
Note: PBT is after considering additional provisions as follows:FY14 FY15 FY16 FY17
• Provision for Loan Loss - 6 months+ 5 months+ 4 months+ 3 months+• Standard Asset Provision - 0.25% 0.30% 0.35% 0.40%
AUM is Net of provisions.
Colours
Vehicle Finance - Financial Summary (Cont’d)
26
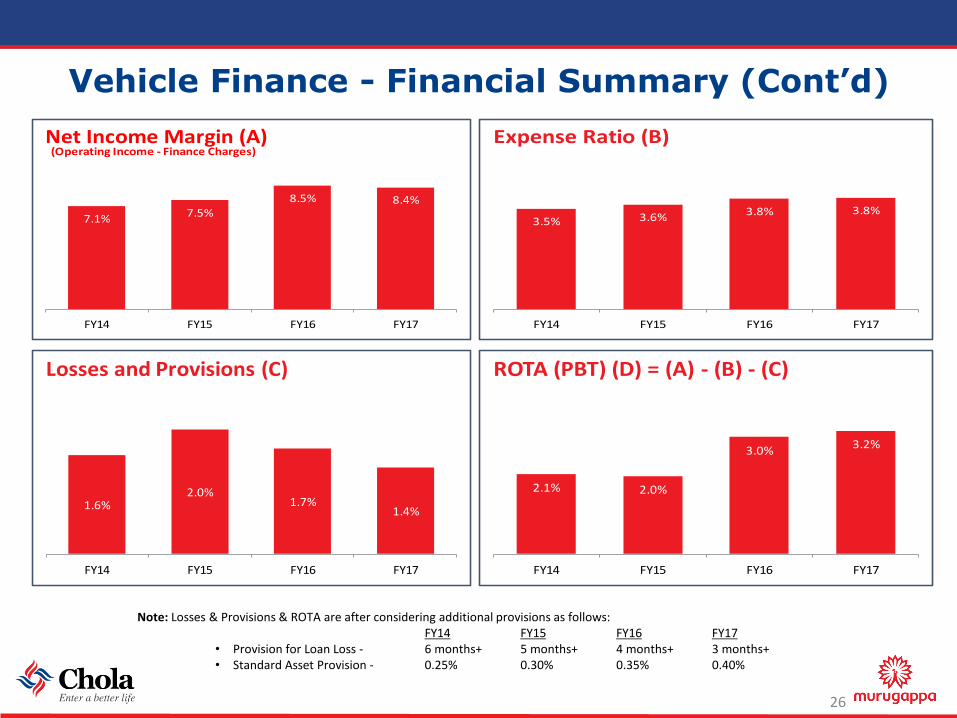
7.1%7.5%
8.5% 8.4%
FY14 FY15 FY16 FY17
(Operating Income - Finance Charges)Net Income Margin (A)
3.5% 3.6%3.8% 3.8%
FY14 FY15 FY16 FY17
Expense Ratio (B)
1.6%2.0%
1.7%1.4%
FY14 FY15 FY16 FY17
Losses and Provisions (C)
2.1% 2.0%
3.0%3.2%
FY14 FY15 FY16 FY17
ROTA (PBT) (D) = (A) - (B) - (C)
Note: Losses & Provisions & ROTA are after considering additional provisions as follows:FY14 FY15 FY16 FY17
• Provision for Loan Loss - 6 months+ 5 months+ 4 months+ 3 months+• Standard Asset Provision - 0.25% 0.30% 0.35% 0.40%
Colours
Home Equity
27
Colours
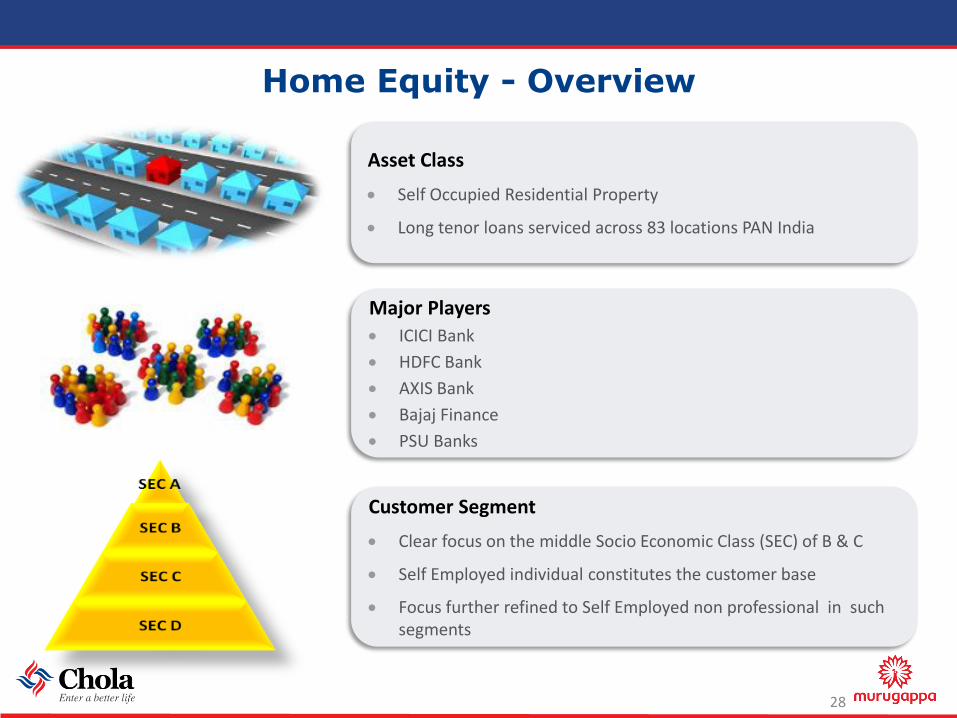
Home Equity - Overview
28
Asset Class
Self Occupied Residential Property
Long tenor loans serviced across 83 locations PAN India
Major Players
ICICI Bank
HDFC Bank
AXIS Bank
Bajaj Finance
PSU Banks
Customer Segment
Clear focus on the middle Socio Economic Class (SEC) of B & C
Self Employed individual constitutes the customer base
Focus further refined to Self Employed non professional in such segments
Colours
Home Equity - Key Differentiators
29
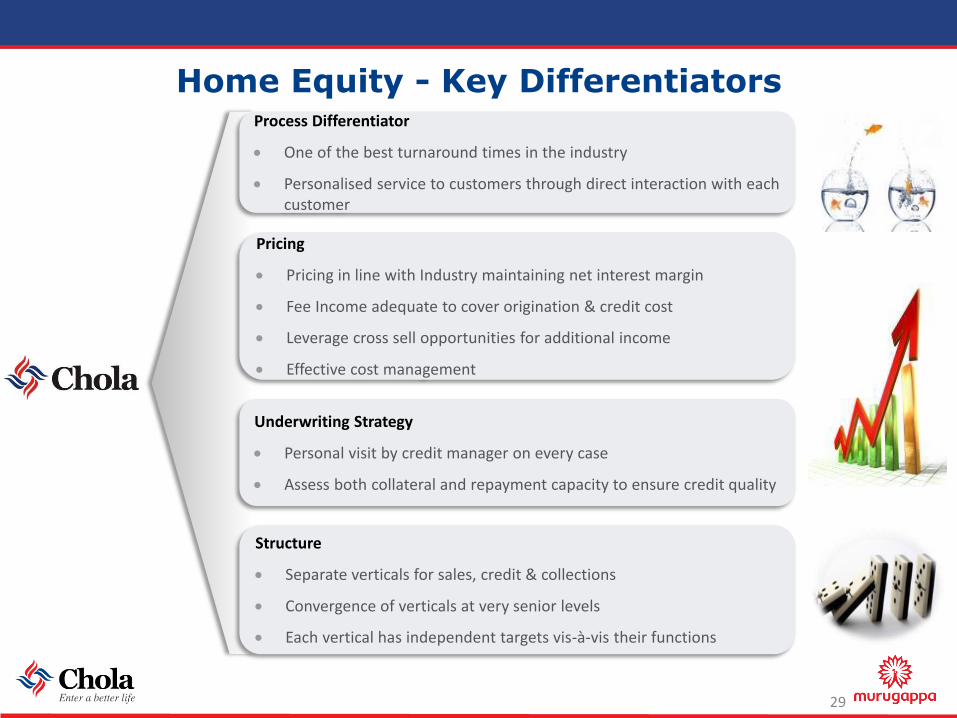
Process Differentiator
One of the best turnaround times in the industry
Personalised service to customers through direct interaction with each customer
Pricing
Pricing in line with Industry maintaining net interest margin
Fee Income adequate to cover origination & credit cost
Leverage cross sell opportunities for additional income
Effective cost management
Underwriting Strategy
Personal visit by credit manager on every case
Assess both collateral and repayment capacity to ensure credit quality
Structure
Separate verticals for sales, credit & collections
Convergence of verticals at very senior levels
Each vertical has independent targets vis-à-vis their functions
Colours
Home Equity - Financial Summary
30
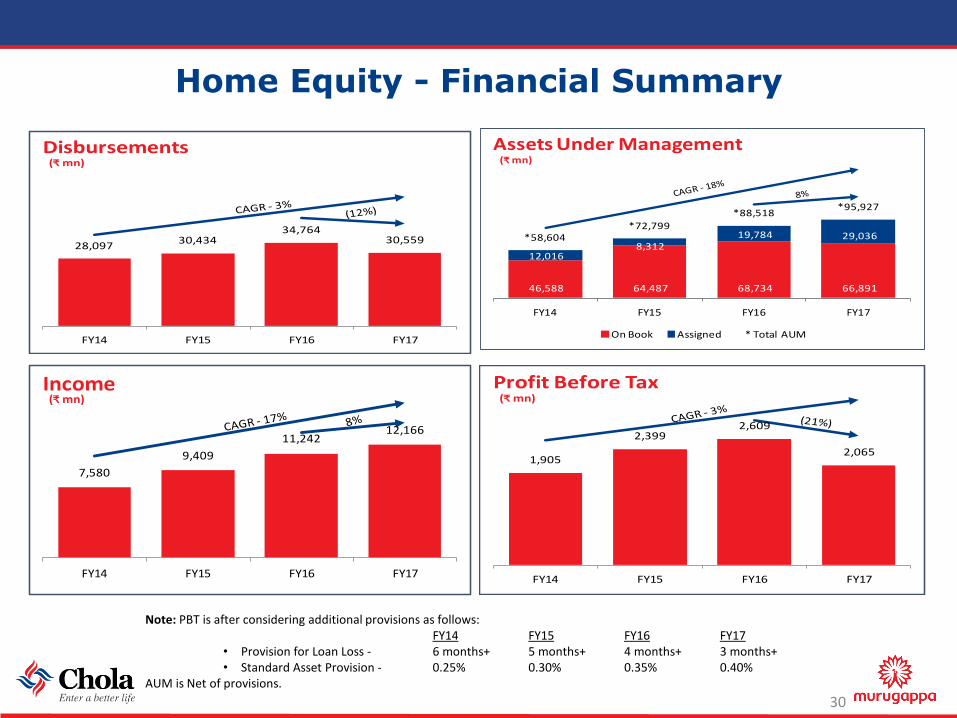
28,09730,434
34,76430,559
FY14 FY15 FY16 FY17
(₹ mn)Disbursements
46,588 64,487 68,734 66,891
12,016 8,312
19,784 29,036 *58,604*72,799
*88,518*95,927
FY14 FY15 FY16 FY17
(₹ mn)
Assets Under Management
On Book Assigned * Total AUM
7,580
9,409
11,24212,166
FY14 FY15 FY16 FY17
(₹ mn)Income
1,905
2,3992,609
2,065
FY14 FY15 FY16 FY17
(₹ mn)Profit Before Tax
Note: PBT is after considering additional provisions as follows:FY14 FY15 FY16 FY17
• Provision for Loan Loss - 6 months+ 5 months+ 4 months+ 3 months+• Standard Asset Provision - 0.25% 0.30% 0.35% 0.40%
AUM is Net of provisions.
Colours
Home Equity - Financial Summary (Cont’d)
31
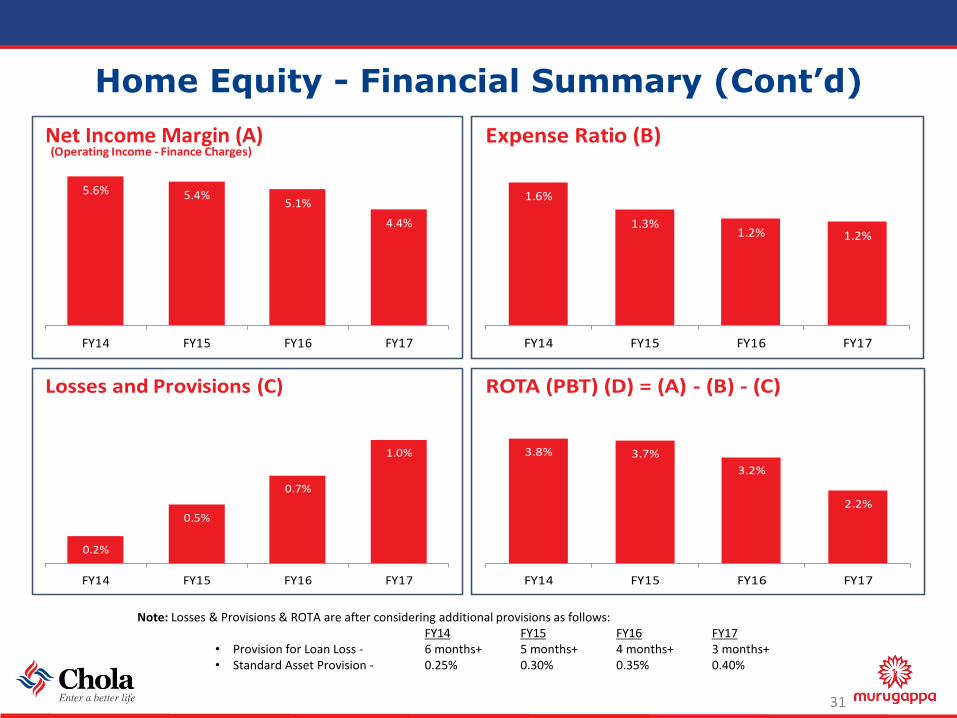
5.6% 5.4%5.1%
4.4%
FY14 FY15 FY16 FY17
(Operating Income - Finance Charges)Net Income Margin (A)
1.6%
1.3%1.2% 1.2%
FY14 FY15 FY16 FY17
Expense Ratio (B)
0.2%
0.5%
0.7%
1.0%
FY14 FY15 FY16 FY17
Losses and Provisions (C)
3.8% 3.7%
3.2%
2.2%
FY14 FY15 FY16 FY17
ROTA (PBT) (D) = (A) - (B) - (C)
Note: Losses & Provisions & ROTA are after considering additional provisions as follows:FY14 FY15 FY16 FY17
• Provision for Loan Loss - 6 months+ 5 months+ 4 months+ 3 months+• Standard Asset Provision - 0.25% 0.30% 0.35% 0.40%
Colours
Funding Profile
32
Colours
CAR, Credit Rating and ALM Statement
33
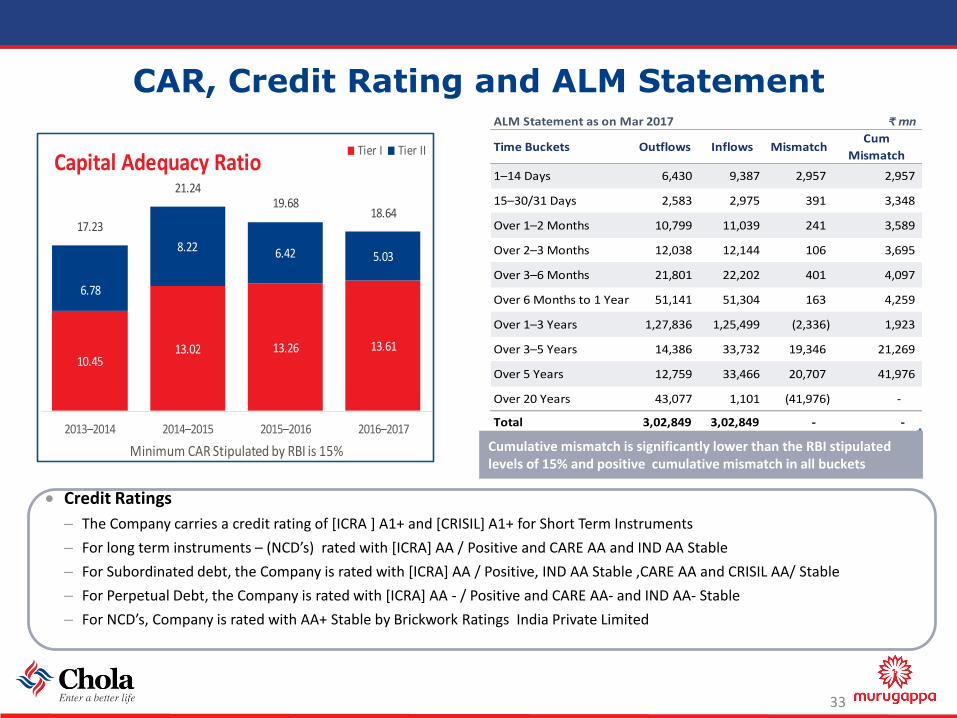
10.4513.02 13.26 13.61
6.78
8.22 6.42 5.03
17.23
21.2419.68
18.64
2013–2014 2014–2015 2015–2016 2016–2017
Minimum CAR Stipulated by RBI is 15%
Capital Adequacy RatioTier I Tier II
ALM Statement as on Mar 2017 ₹ mn
Time Buckets Outflows Inflows MismatchCum
Mismatch
1–14 Days 6,430 9,387 2,957 2,957
15–30/31 Days 2,583 2,975 391 3,348
Over 1–2 Months 10,799 11,039 241 3,589
Over 2–3 Months 12,038 12,144 106 3,695
Over 3–6 Months 21,801 22,202 401 4,097
Over 6 Months to 1 Year 51,141 51,304 163 4,259
Over 1–3 Years 1,27,836 1,25,499 (2,336) 1,923
Over 3–5 Years 14,386 33,732 19,346 21,269
Over 5 Years 12,759 33,466 20,707 41,976
Over 20 Years 43,077 1,101 (41,976) -
Total 3,02,849 3,02,849 - -
Credit Ratings
– The Company carries a credit rating of [ICRA ] A1+ and [CRISIL] A1+ for Short Term Instruments
– For long term instruments – (NCD’s) rated with [ICRA] AA / Positive and CARE AA and IND AA Stable
– For Subordinated debt, the Company is rated with [ICRA] AA / Positive, IND AA Stable ,CARE AA and CRISIL AA/ Stable
– For Perpetual Debt, the Company is rated with [ICRA] AA - / Positive and CARE AA- and IND AA- Stable
– For NCD’s, Company is rated with AA+ Stable by Brickwork Ratings India Private Limited
Cumulative mismatch is significantly lower than the RBI stipulated levels of 15% and positive cumulative mismatch in all buckets
Colours
Diversified Borrowings Profile
34
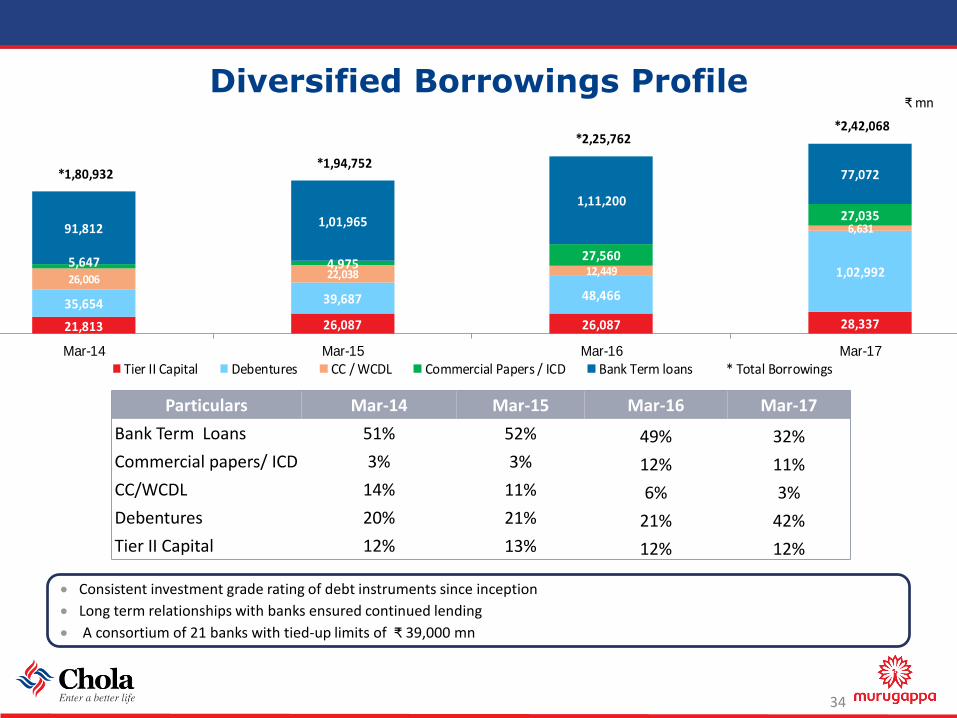
Particulars Mar-14 Mar-15 Mar-16 Mar-17
Bank Term Loans 51% 52% 49% 32%
Commercial papers/ ICD 3% 3% 12% 11%
CC/WCDL 14% 11% 6% 3%
Debentures 20% 21% 21% 42%
Tier II Capital 12% 13% 12% 12%
Consistent investment grade rating of debt instruments since inception
Long term relationships with banks ensured continued lending
A consortium of 21 banks with tied-up limits of ₹ 39,000 mn
21,813 26,087 26,087 28,337
35,654 39,687 48,466
1,02,99226,006 22,038 12,449
6,631
5,647 4,97527,560
27,03591,812 1,01,965
1,11,200
77,072*1,80,932 *1,94,752
*2,25,762 *2,42,068
Mar-14 Mar-15 Mar-16 Mar-17
Tier II Capital Debentures CC / WCDL Commercial Papers / ICD Bank Term loans * Total Borrowings
₹ mn
Colours
Business Enablers
35
Colours
Technology
36
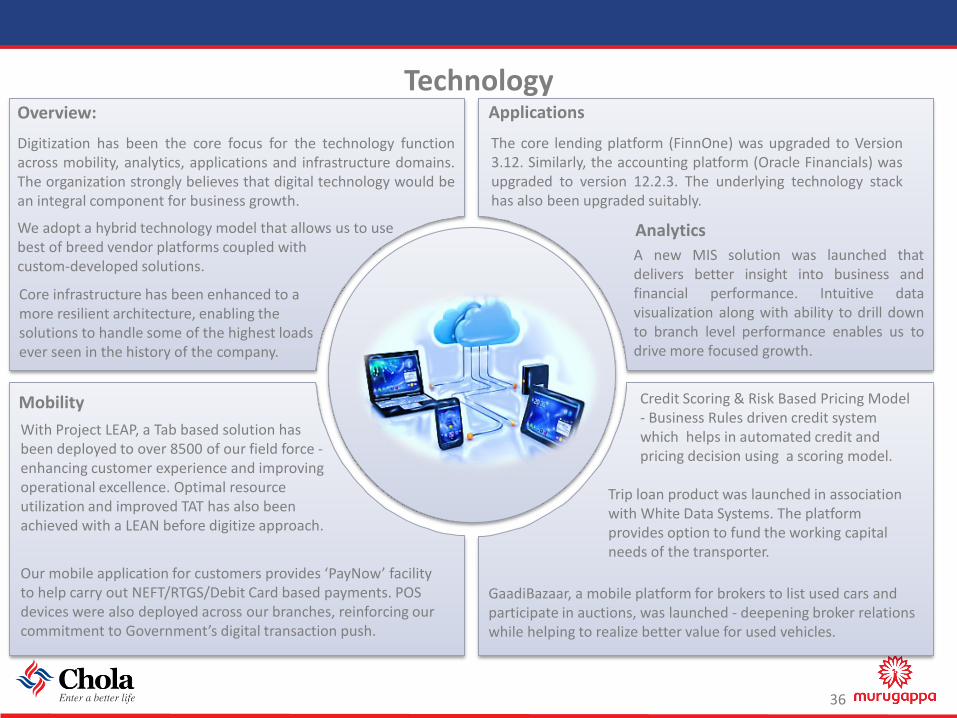
Mobility
ApplicationsOverview:
Digitization has been the core focus for the technology functionacross mobility, analytics, applications and infrastructure domains.The organization strongly believes that digital technology would bean integral component for business growth.
We adopt a hybrid technology model that allows us to usebest of breed vendor platforms coupled withcustom-developed solutions.
With Project LEAP, a Tab based solution has been deployed to over 8500 of our field force -enhancing customer experience and improving operational excellence. Optimal resource utilization and improved TAT has also been achieved with a LEAN before digitize approach.
Our mobile application for customers provides ‘PayNow’ facility to help carry out NEFT/RTGS/Debit Card based payments. POS devices were also deployed across our branches, reinforcing our commitment to Government’s digital transaction push.
Credit Scoring & Risk Based Pricing Model - Business Rules driven credit system which helps in automated credit and pricing decision using a scoring model.
GaadiBazaar, a mobile platform for brokers to list used cars and participate in auctions, was launched - deepening broker relations while helping to realize better value for used vehicles.
Trip loan product was launched in association with White Data Systems. The platform provides option to fund the working capital needs of the transporter.
A new MIS solution was launched thatdelivers better insight into business andfinancial performance. Intuitive datavisualization along with ability to drill downto branch level performance enables us todrive more focused growth.
Analytics
The core lending platform (FinnOne) was upgraded to Version3.12. Similarly, the accounting platform (Oracle Financials) wasupgraded to version 12.2.3. The underlying technology stackhas also been upgraded suitably.
Core infrastructure has been enhanced to a more resilient architecture, enabling the solutions to handle some of the highest loads ever seen in the history of the company.
Colours
Risk Management
37
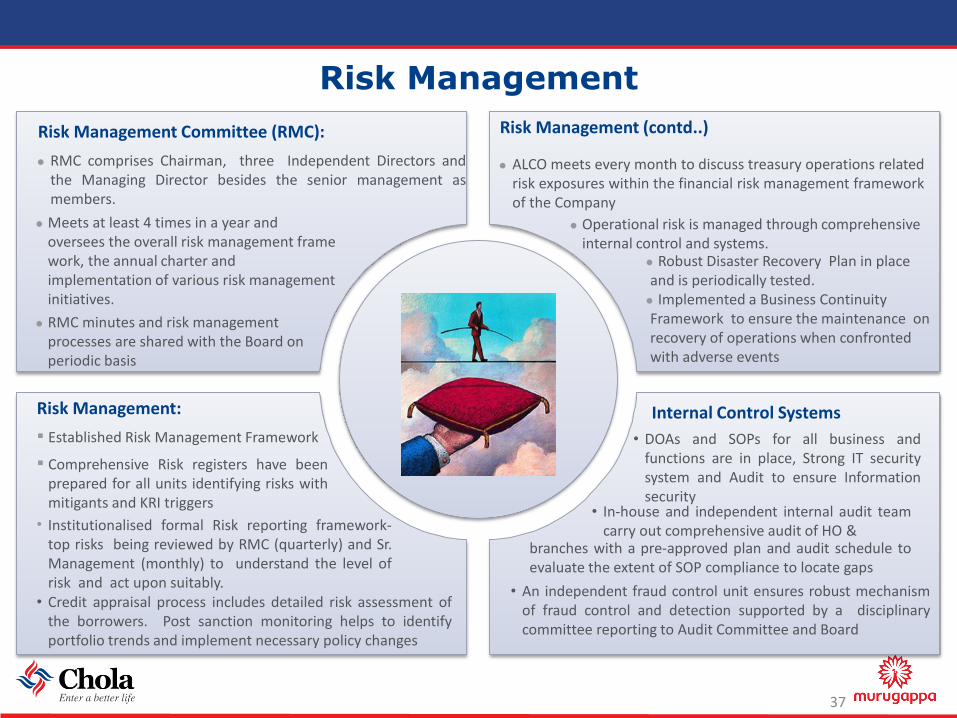
Risk Management Committee (RMC):
RMC comprises Chairman, three Independent Directors andthe Managing Director besides the senior management asmembers.
Risk Management (contd..)
ALCO meets every month to discuss treasury operations relatedrisk exposures within the financial risk management frameworkof the Company
Meets at least 4 times in a year and oversees the overall risk management frame work, the annual charter and implementation of various risk management initiatives.
RMC minutes and risk management processes are shared with the Board on periodic basis
Risk Management:
Established Risk Management Framework
Comprehensive Risk registers have beenprepared for all units identifying risks withmitigants and KRI triggers
Robust Disaster Recovery Plan in place and is periodically tested.
Implemented a Business Continuity Framework to ensure the maintenance on recovery of operations when confronted with adverse events
• DOAs and SOPs for all business andfunctions are in place, Strong IT securitysystem and Audit to ensure Informationsecurity
Operational risk is managed through comprehensive internal control and systems.
• Institutionalised formal Risk reporting framework-top risks being reviewed by RMC (quarterly) and Sr.Management (monthly) to understand the level ofrisk and act upon suitably.
• Credit appraisal process includes detailed risk assessment ofthe borrowers. Post sanction monitoring helps to identifyportfolio trends and implement necessary policy changes
• In-house and independent internal audit teamcarry out comprehensive audit of HO &
branches with a pre-approved plan and audit schedule toevaluate the extent of SOP compliance to locate gaps
• An independent fraud control unit ensures robust mechanismof fraud control and detection supported by a disciplinarycommittee reporting to Audit Committee and Board
Internal Control Systems
Colours
Financial Performance
38
Colours
Profit and Loss Account
39
₹ mn
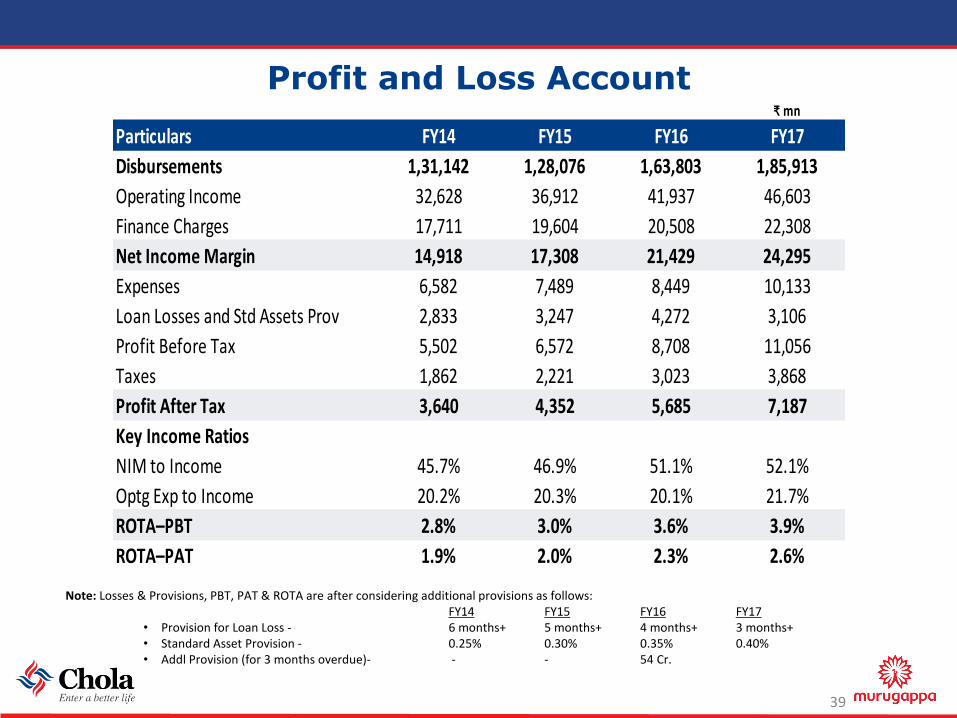
Particulars FY14 FY15 FY16 FY17
Disbursements 1,31,142 1,28,076 1,63,803 1,85,913
Operating Income 32,628 36,912 41,937 46,603
Finance Charges 17,711 19,604 20,508 22,308
Net Income Margin 14,918 17,308 21,429 24,295
Expenses 6,582 7,489 8,449 10,133
Loan Losses and Std Assets Prov 2,833 3,247 4,272 3,106
Profit Before Tax 5,502 6,572 8,708 11,056
Taxes 1,862 2,221 3,023 3,868
Profit After Tax 3,640 4,352 5,685 7,187
Key Income Ratios
NIM to Income 45.7% 46.9% 51.1% 52.1%
Optg Exp to Income 20.2% 20.3% 20.1% 21.7%
ROTA–PBT 2.8% 3.0% 3.6% 3.9%
ROTA–PAT 1.9% 2.0% 2.3% 2.6%
Note: Losses & Provisions, PBT, PAT & ROTA are after considering additional provisions as follows:FY14 FY15 FY16 FY17
• Provision for Loan Loss - 6 months+ 5 months+ 4 months+ 3 months+• Standard Asset Provision - 0.25% 0.30% 0.35% 0.40%• Addl Provision (for 3 months overdue)- - - 54 Cr.
Colours
Balance Sheet
40
₹ mn
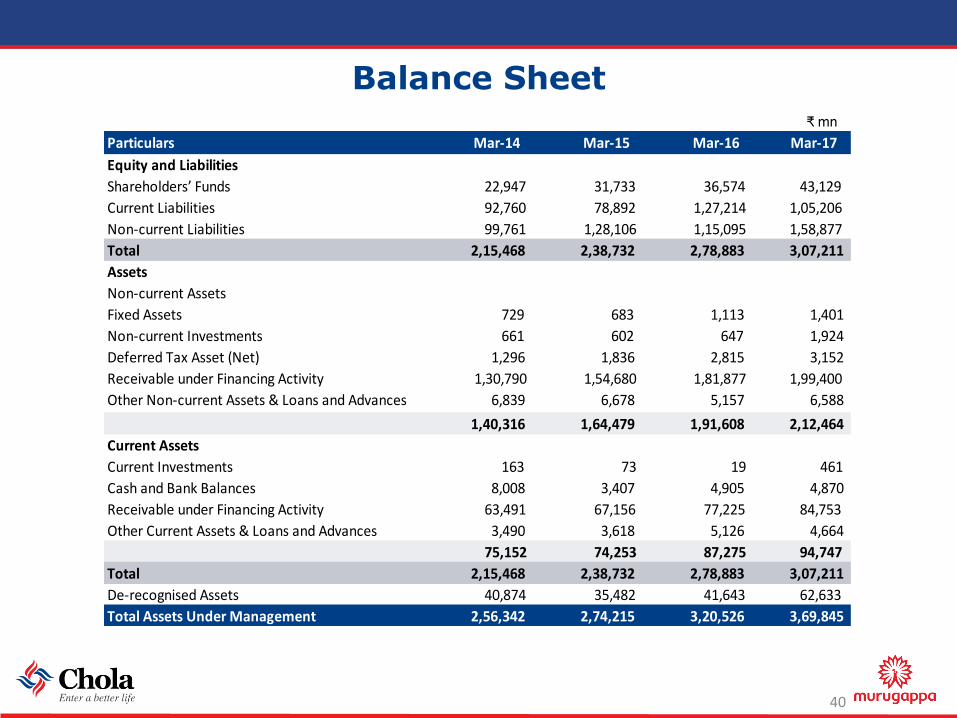
Particulars Mar-14 Mar-15 Mar-16 Mar-17
Equity and Liabilities
Shareholders’ Funds 22,947 31,733 36,574 43,129
Current Liabilities 92,760 78,892 1,27,214 1,05,206
Non-current Liabilities 99,761 1,28,106 1,15,095 1,58,877
Total 2,15,468 2,38,732 2,78,883 3,07,211
Assets
Non-current Assets
Fixed Assets 729 683 1,113 1,401
Non-current Investments 661 602 647 1,924
Deferred Tax Asset (Net) 1,296 1,836 2,815 3,152
Receivable under Financing Activity 1,30,790 1,54,680 1,81,877 1,99,400
Other Non-current Assets & Loans and Advances 6,839 6,678 5,157 6,588
1,40,316 1,64,479 1,91,608 2,12,464
Current Assets
Current Investments 163 73 19 461
Cash and Bank Balances 8,008 3,407 4,905 4,870
Receivable under Financing Activity 63,491 67,156 77,225 84,753
Other Current Assets & Loans and Advances 3,490 3,618 5,126 4,664
75,152 74,253 87,275 94,747
Total 2,15,468 2,38,732 2,78,883 3,07,211
De-recognised Assets 40,874 35,482 41,643 62,633
Total Assets Under Management 2,56,342 2,74,215 3,20,526 3,69,845
Colours
Subsidiaries
41
Colours
Subsidiaries
42
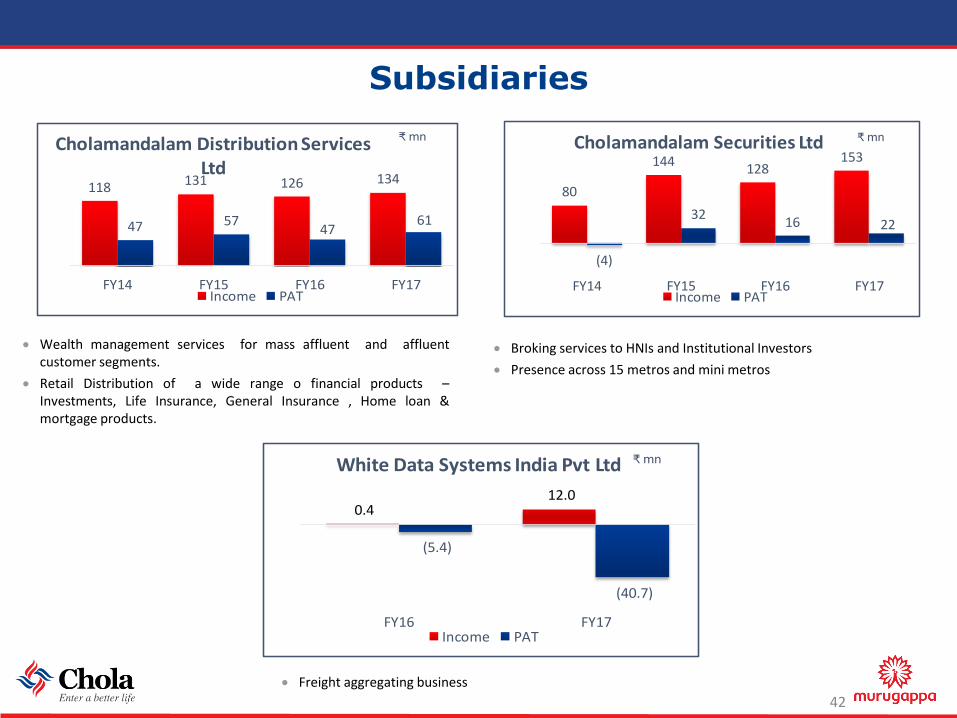
Wealth management services for mass affluent and affluentcustomer segments.
Retail Distribution of a wide range o financial products –Investments, Life Insurance, General Insurance , Home loan &mortgage products.
Broking services to HNIs and Institutional Investors
Presence across 15 metros and mini metros
118 131 126 134
47 57 47
61
FY14 FY15 FY16 FY17
Cholamandalam Distribution Services Ltd
Income PAT
₹ mn
80
144128
153
(4)
32 16 22
FY14 FY15 FY16 FY17
Cholamandalam Securities Ltd
Income PAT
₹ mn
0.4 12.0
(5.4)
(40.7)
FY16 FY17
White Data Systems India Pvt Ltd
Income PAT
₹ mn
Freight aggregating business
Colours
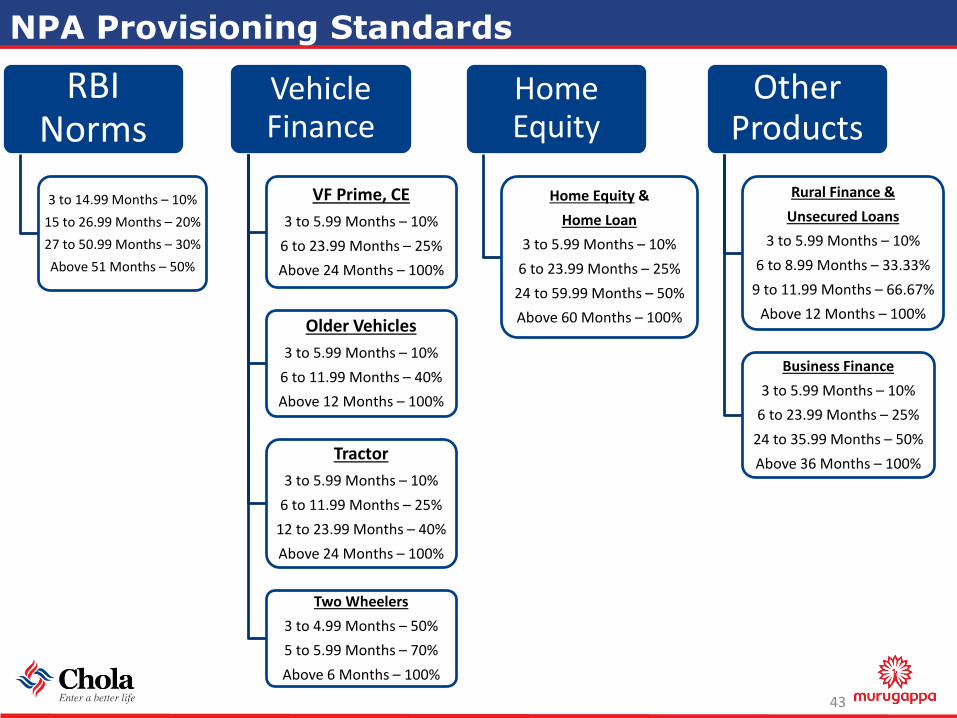
NPA Provisioning Standards
43
RBI Norms
3 to 14.99 Months – 10%
15 to 26.99 Months – 20%
27 to 50.99 Months – 30%
Above 51 Months – 50%
Vehicle Finance
VF Prime, CE
3 to 5.99 Months – 10%
6 to 23.99 Months – 25%
Above 24 Months – 100%
Older Vehicles
3 to 5.99 Months – 10%
6 to 11.99 Months – 40%
Above 12 Months – 100%
Tractor
3 to 5.99 Months – 10%
6 to 11.99 Months – 25%
12 to 23.99 Months – 40%
Above 24 Months – 100%
Two Wheelers
3 to 4.99 Months – 50%
5 to 5.99 Months – 70%
Above 6 Months – 100%
Home Equity
Home Equity &
Home Loan
3 to 5.99 Months – 10%
6 to 23.99 Months – 25%
24 to 59.99 Months – 50%
Above 60 Months – 100%
Other Products
Rural Finance &
Unsecured Loans
3 to 5.99 Months – 10%
6 to 8.99 Months – 33.33%
9 to 11.99 Months – 66.67%
Above 12 Months – 100%
Business Finance
3 to 5.99 Months – 10%
6 to 23.99 Months – 25%
24 to 35.99 Months – 50%
Above 36 Months – 100%
Colours
Contact Us
44
Our Registered Office:
Cholamandalam Investment and Finance Company Limited (Chola),
Dare House 1st Floor, No. 2, NSC Bose Road, Parrys,
Chennai 600001.
Toll free number : 1800-200-4565 (9 AM to 7 PM)
Land Line: 044 – 3000 7172
http://www.cholamandalam.com
Email-ID :
Sujatha P-Sr. Vice President & Company Secretary – [email protected]
Arulselvan D-Executive Vice President & CFO – [email protected]
Colours
Disclaimer• Certain statements included in this presentation may be forward looking statements made based on management’s current
expectations and beliefs concerning future developments and their potential effects upon Cholamandalam Investment and
Finance Company Ltd and its subsidiaries. There can be no assurance that future developments affecting Cholamandalam
Investment and Finance Company Ltd and its subsidiaries will be those anticipated by management. These forward-looking
statements are not a guarantee of future performance and involve risks and uncertainties, and there are important factors that
could cause actual results to differ, possibly materially, from expectations reflected in such forward-looking statements.
Cholamandalam Investment and Finance Company Ltd does not intend and is under no obligation, to update any particular
forward-looking statement included in this presentation.
• The facts and figures mentioned in this presentation is for informational purposes only and does not constitute or form part of,
and should not be construed as, an offer or invitation to sell securities of the Company, or the solicitation of any bid from you or
any investor or an offer to subscribe for or purchase securities of the Company, and nothing contained herein shall form the basis
of or be relied on in connection with any contract or commitment whatsoever. Nothing in the foregoing shall constitute and/or
deem to constitute an offer or an invitation to an offer, to be made to the Indian public or any section thereof or any other
jurisdiction through this presentation, and this presentation and its contents should not be construed to be a prospectus in India
or elsewhere. This document has not been and will not be reviewed or approved by any statutory or regulatory authority in India
or any other jurisdiction or by any stock exchanges in India or elsewhere. This document and the contents hereof are restricted for
only the intended recipient(s). This document and the contents hereof should not be (i) forwarded or delivered or transmitted in
any manner whatsoever, to any other person other than the intended recipient(s); or (ii) reproduced in any manner whatsoever.
Any forwarding, distribution or reproduction of this document in whole or in part is unauthorised.
• The information in this document is being provided by the Company and is subject to change without notice. The information in
this presentation has not been independently verified. No representation or warranty, express or implied, is made to the accuracy,
completeness or fairness of the presentation and the information contained herein and no reliance should be placed on such
information. The Company or any other parties whose names appear herein shall not be liable for any statements made herein or
any event or circumstance arising therefrom.
45
Colours
Thank You