Embed Size (px)
Citation preview
COLT Telecom Group plc Annual Report 2004
2
Chairman’s overview .............................................................. 4
Chief Executive Officer’s review of operations ................... 6
Corporate and social responsibility review ....................... 18
Financial review .................................................................... 20
The Board of Directors ......................................................... 26
Report of the Board of Directors ......................................... 28
Corporate governance statement ....................................... 30
The Directors’ remuneration report .................................... 35
Auditors’ report ..................................................................... 40
Financial statements ............................................................ 41
Selected financial information ............................................ 81
Investor information ............................................................. 85
COLT’s European offices ..................................................... 86
Table of contents
3
COLT’s Future in Focus
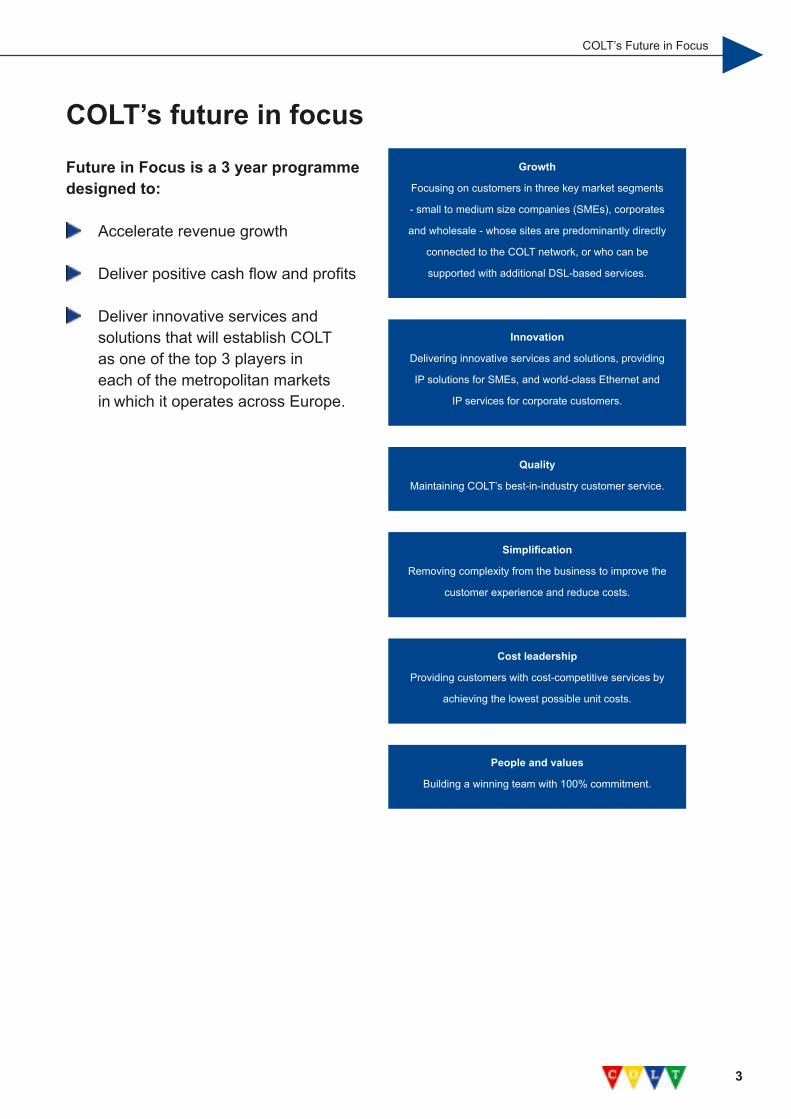
Innovation
Delivering innovative services and solutions, providing
IP solutions for SMEs, and world-class Ethernet and
IP services for corporate customers.
Quality
Maintaining COLT’s best-in-industry customer service.
Simplification
Removing complexity from the business to improve the
customer experience and reduce costs.
Growth
Focusing on customers in three key market segments
- small to medium size companies (SMEs), corporates
and wholesale - whose sites are predominantly directly
connected to the COLT network, or who can be
supported with additional DSL-based services.
Cost leadership
Providing customers with cost-competitive services by
achieving the lowest possible unit costs.
COLT’s future in focusFuture in Focus is a 3 year programme designed to:
Accelerate revenue growth
Deliver positive cash flow and profits
Deliver innovative services and solutions that will establish COLT as one of the top 3 players in each of the metropolitan markets in which it operates across Europe.
People and values
Building a winning team with 100% commitment.
4
2004 was a tough year for the telecommunications
industry and for COLT. Demand was weak, competition
intense, pricing pressure continued and the pace of
technological change was rapid. Within this environment
COLT made less progress than we would have liked and
key revenue, margin and EBITDA goals were not met.
Financial Position
Nevertheless, much was achieved. Revenue reached £1,214.0
million, an increase of 7% on a constant currency basis (and
excluding our Fitec subsidiary, which was sold in December
2003). This compares with a 6% constant currency growth in
revenues in 2003. Additionally, whilst COLT is still loss-making,
2004 was the third consecutive year in which losses declined,
reducing by 15% from 2003’s level to £114.6 million.
Furthermore COLT remains a leader in customer service,
winning the World Communication Award for Customer Care
for an unprecedented fourth year in a row. We also became
the first telecommunications company to achieve, across
Europe, ISO recognition for managing information security and
service assurance.
Disappointingly, our revenue mix in 2004 deteriorated due
to a faster rate of growth in low margin revenues from other
telecommunication carriers and insufficient growth in higher
margin data services. Combined with price and cost pressure,
this led to a reduction in gross margins before depreciation
from 34.2% to 33.0%.
After considerable progress in containing costs in 2003, it was
more difficult to make much headway in 2004 and in some
areas, particularly SG&A, costs rose faster than we would have
liked. To some extent, the development of our Indian operation
in Gurgaon, near Delhi, is starting to have a short term adverse
impact on costs. Over the longer term, however, we believe our
Indian development will lead to a significant reduction in costs
as well as enabling us to benefit from the substantial pool of
talent which exists in India.
Free cash outflow improved from £30.4 million in 2003 to
£9.5 million in 2004. We remain on track to be free cash flow
positive on a sustainable basis during 2005. Reflecting the
confidence we have in the financial strength of COLT we
purchased in the market and redeemed early £416.2 million
of our bonds, including £80.9 million since the end of the year.
These actions will save £31.1 million of net interest over the
next three years. Taking into account the bonds repurchased
since the end of the year we have pro forma cash and liquid
resources of £371.8 million.
As a result of the weaker revenue mix and increased costs
EBITDA fell from £163.4 million in 2003 to £153.7 million
in 2004.
Management and Board
With the initial reorganisation and rationalisation of COLT’s
activities completed, Steve Akin, our CEO for the past two
years, finished his assignment and returned to FMR Corp.
in Boston at the end of August. I would like to thank Steve
for his hard work, enthusiasm and commitment to COLT
and for everything he achieved in what was a particularly
challenging environment.
Chairman’s overview
“The business environment remains challenging with no
real signs of improvement and therefore it is down to the
management team to ensure that we can successfully
execute our strategy. Our goals are to grow revenue,
introduce more innovative services and technologies,
improve our product mix and margins, contain costs and
achieve significant improvements in EBITDA and cash flow.”
Barry Bateman Chairman
5
We appointed Jean-Yves Charlier to succeed Steve as CEO of
COLT on 30 August. Jean-Yves has made significant progress
in his first few months in re-shaping COLT for its next phase
of growth and has strengthened the management team by
adding new heads of the UK, France and Sales and Marketing.
Jean-Yves also undertook a major review of COLT’s strategic
direction in his first months on board and this will provide the
blueprint for the growth of COLT over the next few years.
We also appointed Tony Bates as Chief Administrative and
Financial Officer and he joined the Board in May.
Jim Curvey and Paul Chisholm both retired from the Board at
the end of 2004. Jim and Paul were responsible for taking the
original idea for COLT and translating it into the pan-European
company it is today and we owe both of them many thanks
for their vision, hard work and dedication. John Remondi and
Gene Gabbard joined the Board as non-executive directors
at the turn of the year, and I know we will all benefit from their
counsel and expertise going forward.
The COLT Board therefore consists predominantly of
non-executive directors, drawn from UK, European and
US backgrounds, and with a diverse mixture of telecoms,
technology, industrial, consumer and financial experience.
The Board brings insight, integrity and independence of
thought to the decision-making process. Our common goal is
to do what is in the best interests of all of our shareholders.
Outlook
2004 has been a transition year for COLT. We have a new
management team, we have re-focused our strategy and
have begun to position COLT for its next phase of growth
and development.
The business environment remains challenging with no
real signs of improvement and therefore it is down to the
management team to ensure that we can successfully execute
our strategy. Our goals are to grow revenue, introduce more
innovative services and technologies, improve our product
mix and margins, contain costs and achieve significant
improvements in EBITDA and cash flow.
Our focus on execution and the re-invigoration of our people
under Jean-Yves Charlier’s leadership gives me confidence
that we will continue to make progress.
Finally, I would like to thank all our management team and
employees for their hard work and enthusiasm in what was a
particularly difficult year and I know they will rise to the many
challenges that 2005 will bring.
Barry Bateman Chairman
Chairman’s overview
6
2004 has been a transition year for COLT and the company
enters 2005 well prepared to move out of a phase of cash
consumption into one of cash generation and renewed growth.
It has been an honour to be appointed to lead COLT at such an
exciting time in its development as we implement our new strategic
roadmap - Future in Focus - focused on profitable growth.
We began the year in a strong position with growing revenues,
stable margins and a cost base that had been reduced
dramatically. However, as we moved through the second
quarter we began to experience slower overall growth and this
trend has continued. Conditions in the UK and France were
particularly difficult at this time but our business in both these
countries are starting to be back on track.
The lower growth initially reflected slower sales of some of our
higher margin voice products. We were unable to compensate
for this by accelerating growth in data products. We stabilised this
situation in the third and fourth quarters but the overall impact has
been to put pressure on margins for the year as a whole.
Jean-Yves Charlier Chief Executive Officer
Chief Executive Officer’s review of operations
7
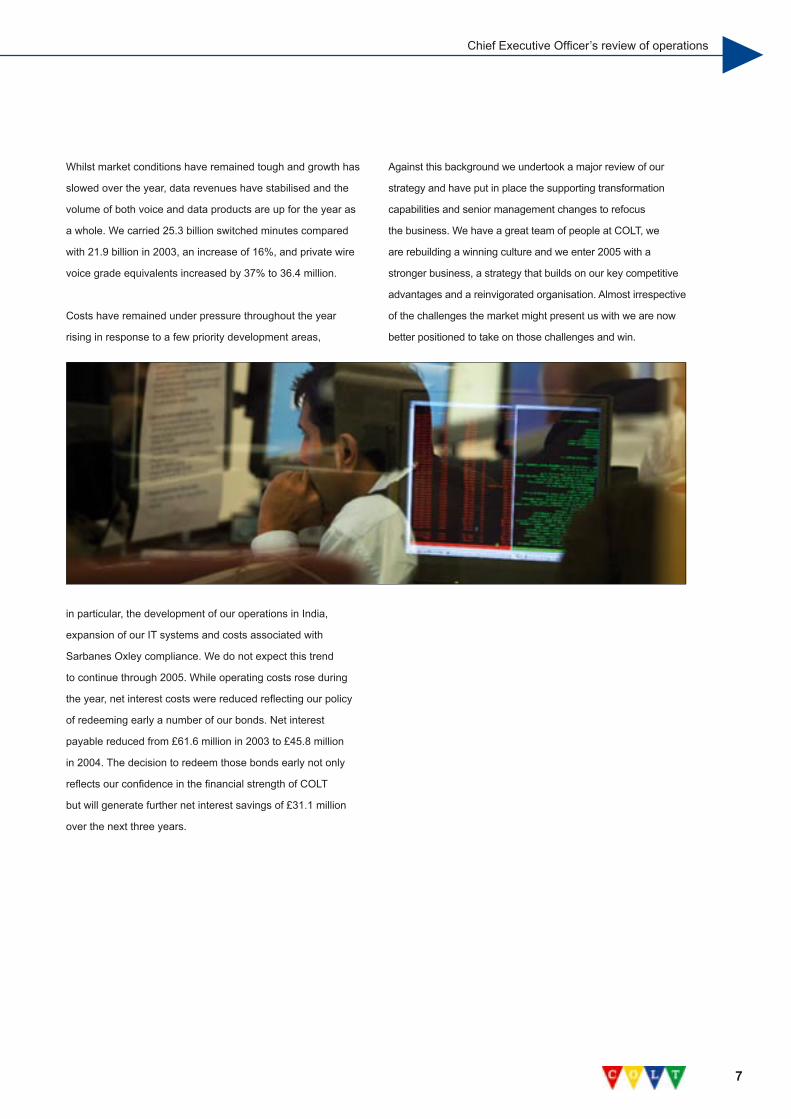
Whilst market conditions have remained tough and growth has
slowed over the year, data revenues have stabilised and the
volume of both voice and data products are up for the year as
a whole. We carried 25.3 billion switched minutes compared
with 21.9 billion in 2003, an increase of 16%, and private wire
voice grade equivalents increased by 37% to 36.4 million.
Costs have remained under pressure throughout the year
rising in response to a few priority development areas,
in particular, the development of our operations in India,
expansion of our IT systems and costs associated with
Sarbanes Oxley compliance. We do not expect this trend
to continue through 2005. While operating costs rose during
the year, net interest costs were reduced reflecting our policy
of redeeming early a number of our bonds. Net interest
payable reduced from £61.6 million in 2003 to £45.8 million
in 2004. The decision to redeem those bonds early not only
reflects our confidence in the financial strength of COLT
but will generate further net interest savings of £31.1 million
over the next three years.
Against this background we undertook a major review of our
strategy and have put in place the supporting transformation
capabilities and senior management changes to refocus
the business. We have a great team of people at COLT, we
are rebuilding a winning culture and we enter 2005 with a
stronger business, a strategy that builds on our key competitive
advantages and a reinvigorated organisation. Almost irrespective
of the challenges the market might present us with we are now
better positioned to take on those challenges and win.
Chief Executive Officer’s review of operations

8
While market conditions remained tough during 2004 this
did not prevent COLT from continuing to grow our business
and investing in the development of our products, networks,
systems and people for the long term benefit of our customers
and shareholders.
Network
COLT is a leading provider of advanced business
communications solutions across Europe. During the year we
made net capital investments of £124.7 million in our pan-
European network, services and systems ensuring that we
continue to offer the best fibre network with access in the 32
Metropolitan Area Networks (MANs) the company operates
across 13 countries in Europe. Our fully owned and managed
20,000 km network is IP and Ethernet enabled, making it one
of the most advanced communications infrastructures in the
world, and has a unique data centre infrastructure with
11 world-class facilities across Europe.
Our network strength enables customers to reduce the number
of their communication suppliers while remaining confident that
our solutions respond flexibly to their business growth.
Products and services
Throughout 2004 we continued to enhance our product
and services portfolio to ensure that customers’ needs
are met.
In March, COLT Conferencing was launched in 11 of the
13 markets in which we operate across Europe. COLT
Conferencing allows customers to hold virtual meetings via the
phone or web integrating audio, visual, interactive and real-
time capabilities round the clock.
We gained more than 200 new customers for our LANLink
International and LANLink National Ethernet services in the
first year from their launch in 2003. Driven by this success and
an identified demand for leading high-speed disaster recovery
services, in May, we expanded these two services to a 1Gbps
capacity. Many companies use the simplicity of Ethernet as a
stage to migrating towards IP VPN solutions. Others use high
bandwidth Ethernet to provide secure and fast connections as
part of a business continuity and disaster recovery solution.
Analysts have identified the business continuity and disaster
recovery market as a growth area. The market will be fuelled in
particular by the financial sector – a traditional area of strength
for COLT – which is obliged to store its data securely under the
new Basel II Accord to minimise operational risks.
Chief Executive Officer’s review of operations

9
Chief Executive Officer’s review of operations
10
Chief Executive Officer’s review of operationsIn June, we launched COLT High Speed Service (HSS) in the
UK, Germany, France, the Netherlands and Belgium. COLT
HSS is a metropolitan optical service that enables customers
to combine many different protocols and applications on a
single, secure, cost-effective platform. It supports all types of IT
architecture consolidation projects including disaster recovery,
business continuity and server consolidation and clustering.
One of the key initiatives in the strategic direction – ‘Future
in Focus’ - announced in October is designed to re-establish
COLT as a driving force for innovation.
The first product to be launched in support of this initiative was
COLT SecureIT for small and medium sized organisations
(SMEs), the first in a portfolio of services to extend our IP
management services to the local area network (LAN) and
desktop environment.
As communications infrastructure becomes increasingly
time-consuming and costly to manage, SMEs are looking for
a simple-to-deploy, reliable and affordable service to manage
their infrastructure for them. We are able to provide this service
by extending the robustness and quality of our network to the
LAN and desktop environment.
With COLT SecureIT, SMEs benefit from having their IP
infrastructure and devices managed for them and access to
the latest functionality and security, charged for on a fixed
price per user monthly fee. For the first time, customers will
have access to a service desk providing a single point
of contact for all services offered, regardless of user
location. Features include messaging, managed security
with the latest virus and anti-spam software, automated daily
back-up, mobility services and proactive monitoring around
the clock.
Initially available in the UK, COLT SecureIT will form one of
the components of the new bundled communications and IP
management service for SMEs, scheduled for launch in all
European markets in 2005. The service offers a menu of voice,
data, security and desktop support services as required by the
customer, based on a fixed monthly price to help customers
manage their costs more predictably. Customers cite the
predictable monthly cost as one of the biggest reasons for
choosing the solution.
As a further example of product development in line with our
commitment to deliver innovative services, as outlined in our
‘Future in Focus’ strategic direction, in November the company
strengthened its lead in Ethernet networking with the launch of
three new services that support LAN-to-LAN connectivity across
Europe more simply and cost effectively than previously possible.
In doing so, we became the first network in Europe to offer a
meshed Ethernet VPN; an ultra-high speed, feature-rich IP-over-
Ethernet service and a hub and spoke solution that extends across
cities and countries all made possible because of the extensive,
modern fibre network, including last-mile access to the building,
which COLT operates across Europe’s 32 key business centres.
We believe that it is only through developments in Ethernet
that the telecoms industry can respond to customers’ needs
for on-demand applications, data back-up and consolidation
of multiple networks. With our ability to facilitate bandwidth
upgrades in days rather than weeks, Ethernet is able to link
11
office networks and related data centre facilities together
simply and seamlessly in a virtual local area network (LAN)
environment - liberating businesses from geographical
constraints and providing affordable bandwidth on-demand to
support their growth.
By creating services that put Ethernet at the core of the
communications infrastructure, We are challenging the more
traditional, more expensive, high maintenance wide area
networking (WAN) services such as leased lines, ATM and
frame relay. We believe that Ethernet will also reposition
IP VPN to a supporting role, serving branch sites, with lower
bandwidth requirements.
While it has been possible to extend the speed and simplicity
of Ethernet technology into the wide area network on a point-
to-point basis, we are making Ethernet technology available
in a virtual network topology, modified quickly and easily to
accommodate the addition of new operations, applications
and related sites such as data centres. It is also our objective
to provide integrated high-speed Ethernet and data centre
solutions for the corporate market place across Europe.
Our Data Centre Solutions portfolio will focus on providing
customers with managed hosting, messaging, security, storage
and disaster recovery services.
Since the end of the year we have continued to innovate and
have plans in place to launch our IP voice service during 2005,
Europe’s first fully managed ‘business-class’ voice over internet
protocol (VoIP) service, providing significant functionality as
well as cost savings for our customers.
COLT IP Voice combines the power and breadth of our pan
European fibre network with the sophisticated features users
would expect of their PABX systems embedded in the network
itself, using Siemens’ IP technology. The service responds to the
pressures on business to drive down their communication costs
while delivering greater productivity and supporting changing
employment trends, particularly around remote working.
Best-in-industry customer service
2004 was another year when COLT won international industry
awards. Chief among these was the World Communication
Award for Best Customer Care which we won for the fourth
year running; a unique achievement in the history of these
awards and a reflection of the emphasis the company places on
customer service.
Chief Executive Officer’s review of operations
Chief Executive Officer’s review of operationsIn the Netherlands, COLT was the only fixed network
operator to be named ‘Best in Class’ in the Information and
Communications Technology category in the annual survey
conducted among 600 CEOs and CIOs of leading businesses
by Management Team magazine.
In Switzerland, COLT was ranked first in the fixed network
telephony category gaining a Gold Medal and second in the
corporate networks and ISP/Internet categories in the BILANZ
telecom rating 2004.
In the UK, COLT was awarded the Chairman’s Cup in the
Corporation of London’s 17th annual Considerate Contractors
Scheme (CCS). COLT was awarded the top prize for its work in
the City of London after enjoying consistent success securing
gold awards every year since joining in 1993 – a record not
matched by any other utility.
The Chairman’s Cup is a special award which recognises
organisations that promote the ideals of the CCS. Awarded to
utilities, highways and street works contractors, and building
and demolition teams, the award to COLT recognises our long
tradition of promoting the CCS scheme to our contractors to
improve performance on the street and also demonstrates the
company’s dedication to quality of service.
The award is added to the 13 Gold & Best Utility Awards that
COLT has won since the company began operations in 1993.
Further recognition of our commitment to the highest standards
of customer service, came in February when the company
achieved the internationally recognised BS7799 (ISO17799)
standard for Information Security Management and received
accreditation from the British Standards Institute (BSI) for the
Powergate and Princes Court Data Solution Centres (DSCs).
In August, that accreditation was extended to include all of
our DSCs across Europe and COLT Network Management,
Administration and Support. This effectively demonstrates that
the information management system relating to end-to-end
services is of a recognised and measurable standard. COLT
achieved this accreditation with zero non-compliances to the
standard – an exceptional achievement.
By achieving these standards we became the first
telecommunications company to achieve across Europe
the internationally recognised BS7799 (ISO17799) and
ISO9001:2000 standards for managing information security
and service assurance.
Our billing and metering system has also received the British
Standards Institute recommended approval under the Total
Metering and Billing systems (TMBS) initiative.
12

Customers
COLT is a customer-centric organisation serving over
50,000 customers. In the course of 2004 we continued to
gain new customers while winning renewal business from
existing customers.
Our success is geared towards meeting the requirements of
our current and future customers whether that is by providing
simple connectivity or complex data solutions. By listening to
the market and understanding our customers COLT provides
services they value.
We have built a strong customer base over the years. Notable
new wins and significant extensions to existing contracts
during 2004 include such well-known names as Rentokil Initial,
Deutsche Bank, BNP Paribas; Dell Computer Corporation,
SONY, AOL Europe, lastminute.com, Genesys, LIFFE,
and Commerzbank.
We also has a strong wholesale customer base serving other
telecoms operators and service providers across Europe.
In the year, the number of wholesale customers grew by
more than 20 per cent from just under 1,000 to 1,200 by the
year end.
Businesses all over Europe recognise the benefits of being a
COLT customer.
COLT in India
Early in 2004 we stated that we would set up an operation in
India to help increase profitable revenue growth as well as
control operating costs and capital expenditure. That operation
was officially opened in September, with a traditional ‘Puja’
celebration, in Gurgaon, outside New Delhi and by the end of
the year had 201 employees. COLT India is a key part of our
strategy aimed at reducing costs and providing new services
that would be uneconomic to provide from Europe.
Our off-shoring model is different than most of those
implemented by companies in the telecommunications and
technology industries in Europe. We continue to operate
our customer contact centres in Europe to ensure the best
customer experience whilst transferring to India our processing
work to achieve significant cost savings as well as improve
operational efficiency.
A broad range of work will be done in India across many
different business areas and functions. Examples of the kind
of work being carried out include: a unit to handle fault calls
related to COLT internal desktop and system problems; a
Security Operations Centre - monitoring customer networks
for intrusion violations and taking remedial actions to protect
network boundaries; a Data Cleansing unit that is cleansing our
systems of redundant or duplicated information and correcting
inaccurate records; some billing operations; processing invoices
for payment in the country of origin; design and updates to the
company’s websites; some network management tasks such
as monitoring utilisation of the network and recommending
upgrades or optimisation projects to ensure optimum use
of assets; and designing bespoke network configurations in
support of Sales and Change Management - co-ordinating and
scheduling changes within the network.
Through 2005 the aim is to expand operations in India to
support the business in Europe.
13
Chief Executive Officer’s review of operations

14
Organisation
The senior management team was further strengthened
with the appointments of Tim Wort and Richard Blaustein as
Managing Directors for UK and France respectively.
Detlef Spang was appointed to lead a combined sales and
marketing function and Tanuja Randery was appointed to head
a newly created transformation office. Since the end of the
year we have appointed Bruce King as Managing Director for
Human Resources.
These appointments were accompanied by a reorganisation
of the company into four regional groupings with the major
markets of Germany, the UK and France becoming distinct
units reporting directly to the CEO and a further grouping of
strategic markets comprising the 10 other countries in the
group whose Managing Director also reports directly to the
CEO. These changes position COLT to deliver on the strategic
initiatives announced in October. Named Future in Focus,
these initiatives form the roadmap for the future: to accelerate
revenue growth; deliver positive cash flow and profits; and
re-establish COLT as an innovator and as one of the top three
players in each of the metropolitan markets in which it operates
across Europe.
An important element of that strategic direction was the
formation of a transformation office tasked with facilitating the
successful implementation of COLT’s key strategic initiatives
and to coordinate these initiatives between departmental
functions and countries across Europe.
The rationale behind the transformation office is that while
many companies succeed in defining their strategy, they can
face significant challenges in implementing those plans and
priorities. The transformation office is a crucial function in
ensuring COLT is focused on implementing the strategic
initiatives in a consistent manner throughout the company.
A STRATEGY BUILT ON COMPETITIVE ADVANTAGE
The strategic initiatives we have put in place are built upon our
long-term competitive advantages.
The best fibre network with access in Europe
COLT has the best fibre network with access in Europe. Our
networks are IP and Ethernet enabled. We have over 10,000
of Europe’s key business buildings directly connected to our
32 metropolitan area networks across Europe. The depth of
coverage we offer is reflected by the fact that we are either
number one or number two in terms of buildings connected to
each of our metropolitan networks. Our 32 metropolitan area
networks are integrated into our pan-European backbone and
11 Data Solution Centres offering a breadth of end-to-end
service capability that is second to none.
15
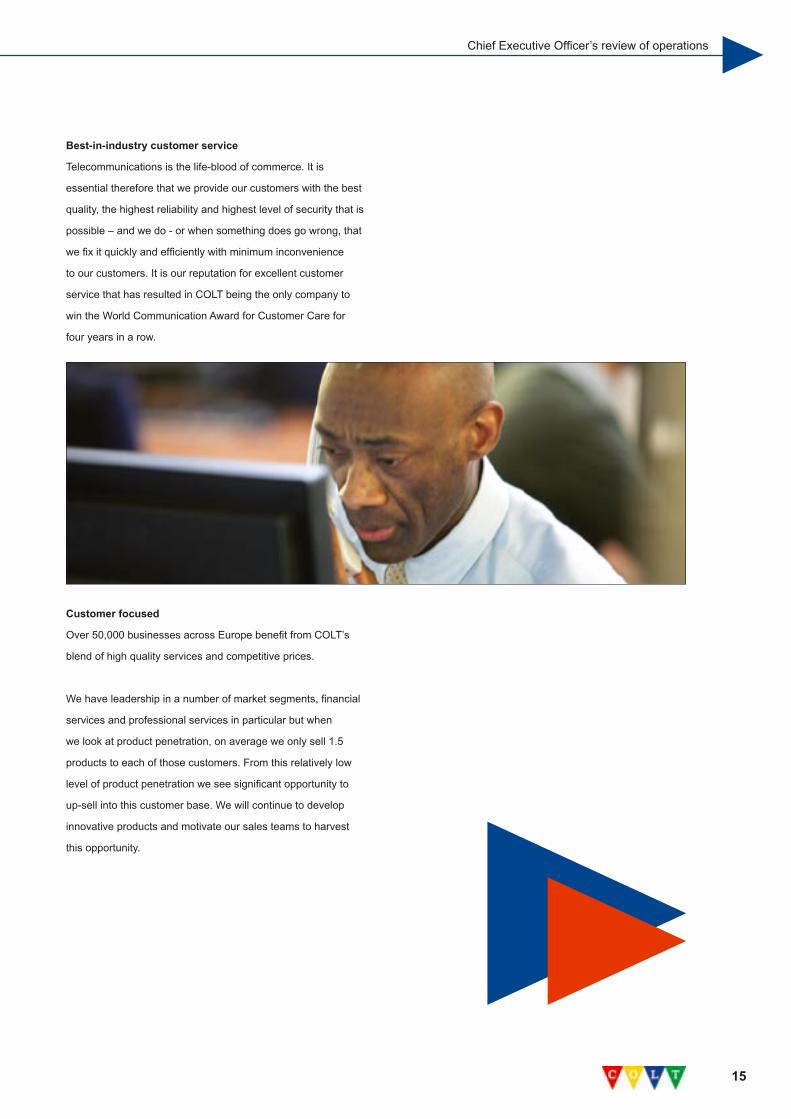
Best-in-industry customer service
Telecommunications is the life-blood of commerce. It is
essential therefore that we provide our customers with the best
quality, the highest reliability and highest level of security that is
possible – and we do - or when something does go wrong, that
we fix it quickly and efficiently with minimum inconvenience
to our customers. It is our reputation for excellent customer
service that has resulted in COLT being the only company to
win the World Communication Award for Customer Care for
four years in a row.
Customer focused
Over 50,000 businesses across Europe benefit from COLT’s
blend of high quality services and competitive prices.
We have leadership in a number of market segments, financial
services and professional services in particular but when
we look at product penetration, on average we only sell 1.5
products to each of those customers. From this relatively low
level of product penetration we see significant opportunity to
up-sell into this customer base. We will continue to develop
innovative products and motivate our sales teams to harvest
this opportunity.
Chief Executive Officer’s review of operations

16
Financial stability
Over the years we have invested some £3 billion in our
networks, products, support services and building our customer
base. We are not only asset rich but we also have a strong
cash position with £371.8 million of cash and liquid resources,
taking into account the early redemption of £80.9 million of
bonds in January. We are on track to be free cash flow positive
on a sustainable basis during 2005 and we have the resources
to continue to grow and expand and meet our customers’
needs for innovative products and services.
FUTURE IN FOCUS: OUR STRATEGIC IMPERATIVES
The key to success is to define and target the market
opportunity and develop the products and go-to-market plans
which build on our competitive advantages. It is this approach
that lies at the heart of our strategy.
We estimate that the value of our target market for the corporate
and SME segments, that is those customers and potential
customers who are located within 500 metres of our networks, is
approximately £4 billion for business voice and data services.
We currently have an estimated 10% share of this market
which leaves significant headroom for growth. Additionally, we
are already well positioned in the wholesale segment of the
market and see considerable opportunity to expand the Data
Centre Solutions part of our business.
We have a clearly defined road map that sets out our future
strategic direction. It builds on the core strengths of our
pan-European backbone, 32 metropolitan area networks with
fibre access and best-in-industry customer service. We aim
to once again position COLT as an innovating force for the
SME and Corporate markets across Europe whilst maximising
profitable revenues through better utilisation of our existing
assets and improved execution.

17
Growth
We will focus on on-net growth, exploiting the unrivalled fibre
access, depth, breadth and quality of our networks but at the
same time will use DSL technology to access secondary sites
that are not in the “sweet spot” target market of customers
located within 500 metres of our network.
Innovation
We will deliver innovative solutions and services with a focus on
making IP work for SMEs and on providing world-class Ethernet
and IP services for Corporate customers across Europe.
Quality
We will continue to provide the best-in-industry customer
service for which COLT is already renowned.
Simplification
We will remove complexity from the business in order
to stream-line our cost base further and improve the
customer experience.
Cost leadership
We will focus on improving operational efficiencies and
achieve the lowest possible unit costs to enable the delivery
of our profitability goals whist providing customers with cost
competitive services.
People and values
We will keep our people informed and involved in the
development and execution of our strategy. As I travel around
COLT and meet more and more people and tell them about
our plans I am getting increasingly positive feedback. After a
couple of very tough years, morale is once again on the up.
As COLT grows, top quality people are needed to deal with
customers, to manage processes and to differentiate us in the
market place. To be a winning company we need winning
people giving 100% commitment. The development of our
people is of paramount importance and a key component of
our strategy.
Conclusion
Whilst 2004 has been a tough year we now have the strategy,
people and plans in place to grow and be successful in 2005
and beyond.
Chief Executive Officer’s review of operations

18
There are no currently identified social, environmental
or ethical risks that would have a material impact on
COLT’s business.
Environment
Telecommunication services is a low environmental
impact industry. Nevertheless COLT is committed to using
working practices designed to protect and safeguard
the environment.
In recognition of the care COLT takes when undertaking
network construction activities it was awarded the top
accolade, The Chairman’s Cup, by the Chairman of
the Planning and Transportation Committee of the
Corporation of London for considerate contracting.
Indeed, every year since COLT was founded in 1993
it has secured a Gold Award, a record unmatched by
any other organisation. COLT is also included in the
FTSE4Good Indices.
Environmental impacts most relevant to COLT include
energy and fuel use, the storage of fuel oil for generators,
water use and waste generation. COLT has processes
in place to recycle as much waste material as is
possible. All services are provided and delivered in a
manner calculated to ensure that there is no inappropriate
waste and with a heightened awareness of the
environmental issues and the potential effects on the
community generally.
Employees
COLT aims to maximise every opportunity for employees
to share in its success, from owning shares to taking
responsibility at the earliest opportunity and being part of
a winning team. This objective is underpinned by an
employment approach which measures each individual by
their personal contribution to our success. To this end we
introduced a new Performance Management process in 2004
which focuses on setting and aligning individual objectives
with our overall strategy.
Corporate and social responsibility review
19
COLT’s culture is one of equality of opportunity in both
recruitment and promotion. COLT is committed to attracting
and retaining the best people based upon ability and merit.
COLT is conscious of its obligations to disabled persons and
makes every effort to ensure they receive equal opportunities
and are not discriminated against on grounds of their
disability. It is policy that disabled people receive full and fair
consideration for all job vacancies for which they are suitable
applicants. Employees who become disabled during their
working life will be retained in employment wherever possible
and will be given help with any necessary rehabilitation and
retraining. Where practicable, equipment and procedures will
be modified in order to make full use of an individual’s abilities.
Policy is to keep employees as fully informed as possible
on matters which affect them through direct face-to-face
briefings, Works Councils and other established procedures
for communication.
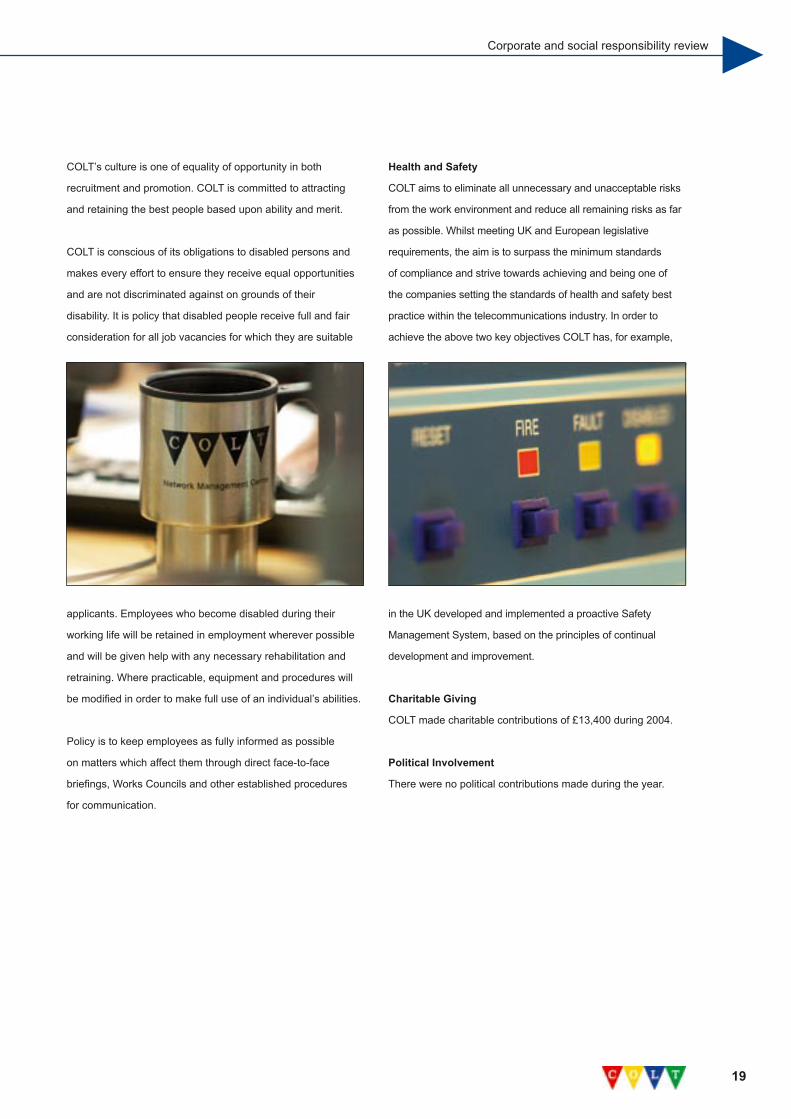
Health and Safety
COLT aims to eliminate all unnecessary and unacceptable risks
from the work environment and reduce all remaining risks as far
as possible. Whilst meeting UK and European legislative
requirements, the aim is to surpass the minimum standards
of compliance and strive towards achieving and being one of
the companies setting the standards of health and safety best
practice within the telecommunications industry. In order to
achieve the above two key objectives COLT has, for example,
in the UK developed and implemented a proactive Safety
Management System, based on the principles of continual
development and improvement.
Charitable Giving
COLT made charitable contributions of £13,400 during 2004.
Political Involvement
There were no political contributions made during the year.
Corporate and social responsibility review
2020
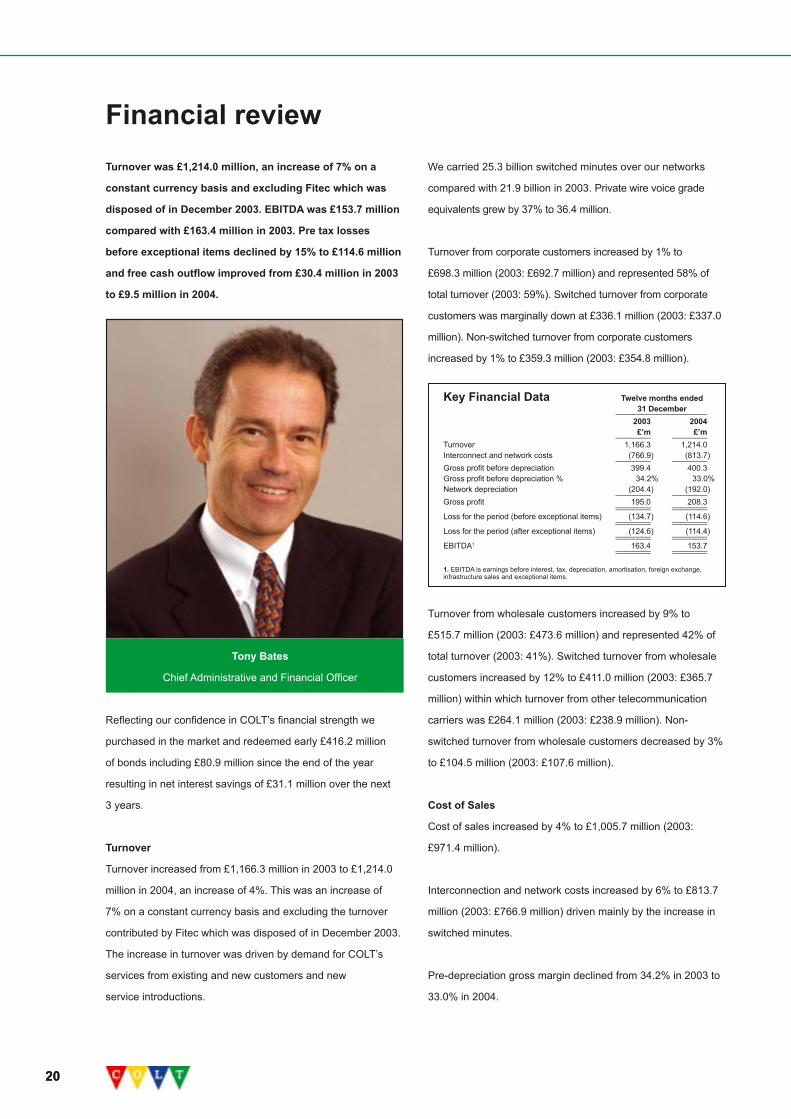
Tony Bates
Chief Administrative and Financial Officer
Turnover was £1,214.0 million, an increase of 7% on a
constant currency basis and excluding Fitec which was
disposed of in December 2003. EBITDA was £153.7 million
compared with £163.4 million in 2003. Pre tax losses
before exceptional items declined by 15% to £114.6 million
and free cash outflow improved from £30.4 million in 2003
to £9.5 million in 2004.
Reflecting our confidence in COLT’s financial strength we
purchased in the market and redeemed early £416.2 million
of bonds including £80.9 million since the end of the year
resulting in net interest savings of £31.1 million over the next
3 years.
Turnover
Turnover increased from £1,166.3 million in 2003 to £1,214.0
million in 2004, an increase of 4%. This was an increase of
7% on a constant currency basis and excluding the turnover
contributed by Fitec which was disposed of in December 2003.
The increase in turnover was driven by demand for COLT’s
services from existing and new customers and new
service introductions.
We carried 25.3 billion switched minutes over our networks
compared with 21.9 billion in 2003. Private wire voice grade
equivalents grew by 37% to 36.4 million.
Turnover from corporate customers increased by 1% to
£698.3 million (2003: £692.7 million) and represented 58% of
total turnover (2003: 59%). Switched turnover from corporate
customers was marginally down at £336.1 million (2003: £337.0
million). Non-switched turnover from corporate customers
increased by 1% to £359.3 million (2003: £354.8 million).
Turnover from wholesale customers increased by 9% to
£515.7 million (2003: £473.6 million) and represented 42% of
total turnover (2003: 41%). Switched turnover from wholesale
customers increased by 12% to £411.0 million (2003: £365.7
million) within which turnover from other telecommunication
carriers was £264.1 million (2003: £238.9 million). Non-
switched turnover from wholesale customers decreased by 3%
to £104.5 million (2003: £107.6 million).
Cost of Sales
Cost of sales increased by 4% to £1,005.7 million (2003:
£971.4 million).
Interconnection and network costs increased by 6% to £813.7
million (2003: £766.9 million) driven mainly by the increase in
switched minutes.
Pre-depreciation gross margin declined from 34.2% in 2003 to
33.0% in 2004.
Financial review
Key Financial Data Twelve months ended 31 December _____________________ 2003 2004 £’m £’m ________ ________Turnover 1,166.3 1,214.0Interconnect and network costs (766.9) (813.7) ________ ________Gross profit before depreciation 399.4 400.3Gross profit before depreciation % 34.2% 33.0%Network depreciation (204.4) (192.0) ________ ________Gross profit 195.0 208.3 ________ ________ ________ ________Loss for the period (before exceptional items) (134.7) (114.6) ________ ________ ________ ________Loss for the period (after exceptional items) (124.6) (114.4) ________ ________ ________ ________EBITDA1 163.4 153.7 ________ ________ ________ ________
1. EBITDA is earnings before interest, tax, depreciation, amortisation, foreign exchange, infrastructure sales and exceptional items.

2121
Financial review
Network depreciation decreased by 6% to £192.0 million
(2003: £204.4 million). This decrease reflected the effect of
some assets being fully depreciated, partially offset by further
investment in fixed assets to support the growth in demand for
services and new service developments.
Operating Expenses
Operating expenses increased by 1% to £277.2 million (2003:
£274.5 million).
Selling, general and administrative (SG&A) expenses
increased by 5% to £246.6 million (2003: £235.9 million).
SG&A expenses as a proportion of turnover were 20% (2003:
20%). The increase in SG&A expenses reflected the initial
costs associated with the establishment of COLT’s presence
in India, increased personnel costs and costs associated with
Sarbanes-Oxley compliance.
Other depreciation and amortisation decreased by 21% to £30.5
million (2003: £38.5 million). This reduction reflects the effect of
some assets being fully depreciated, partially offset by increased
investment in customer service and other support systems.
Interest Receivable, Interest Payable and Similar Charges
Interest receivable decreased by 21% to £21.0 million
(2003: £26.7 million). The decrease was as a result of
reduced average balances of cash and investments in liquid
resources following the redemption of some of the Company’s
outstanding Notes during 2003 and 2004 partially offset by
higher interest rates and an improvement in currency mix.
Interest payable and similar charges decreased by 24% to
£66.8 million (2003: £88.3 million). This decrease was
primarily due to the reduction in debt levels following the
redemption of some of the Company’s outstanding Notes
during 2003 and 2004.
Interest payable and similar charges included £30.2 million
(2003: £34.4 million) of interest and accretion on convertible
debt and £35.0 million (2003: £51.7 million) of interest
and expense accretion on non-convertible debt. There was
also £1.6 million of other interest and unwinding of discounts
on provisions.
Gain on Redemption of Debt
Gains arising on the early redemption of £335.3 million of debt
were £0.2 million (2003: £7.6 million).
Exchange Gains
There were no net exchange gains or losses (2003: gain of
£6.4 million). The exchange gains in the prior year were
due primarily to movements in the British pound relative to
the U.S. dollar on cash and debt balances denominated
in U.S. dollars.
Tax on Loss on Ordinary Activities
COLT had no taxable profits in either 2003 or 2004.
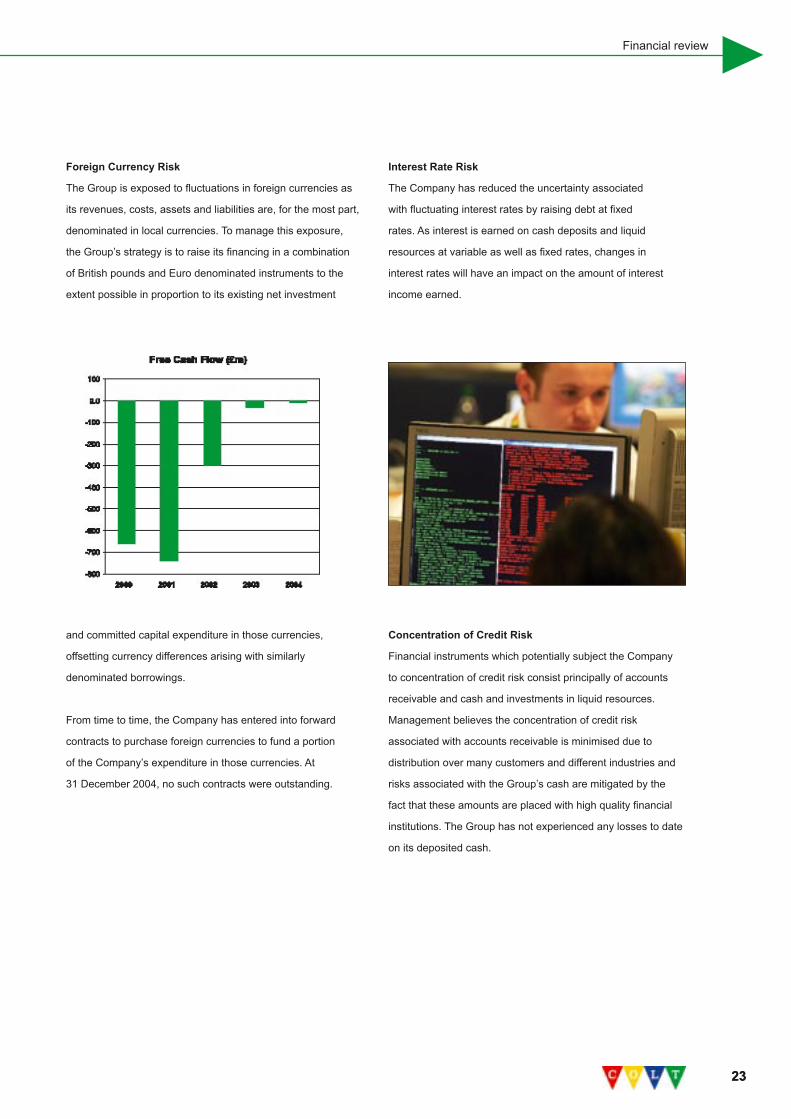
LIQUIDITY AND CAPITAL RESOURCES
There was a free cash outflow of £9.5 million (2003: outflow of
£30.4 million). This improvement in free cash flow was driven
by reduced capital expenditure, reduced interest payments, an
improvement in working capital and lower payments against
provisions. COLT expects to achieve sustainable positive free
cash flow during 2005.
Net cash outflow from financing was £334.7 million (2003:
outflow of £142.8 million).
“ We have a strong balance sheet and improved cash
flow and are well positioned to make further progress
during 2005 and beyond.”
Tony Bates
Chief Administrative and Financial Officer
2222
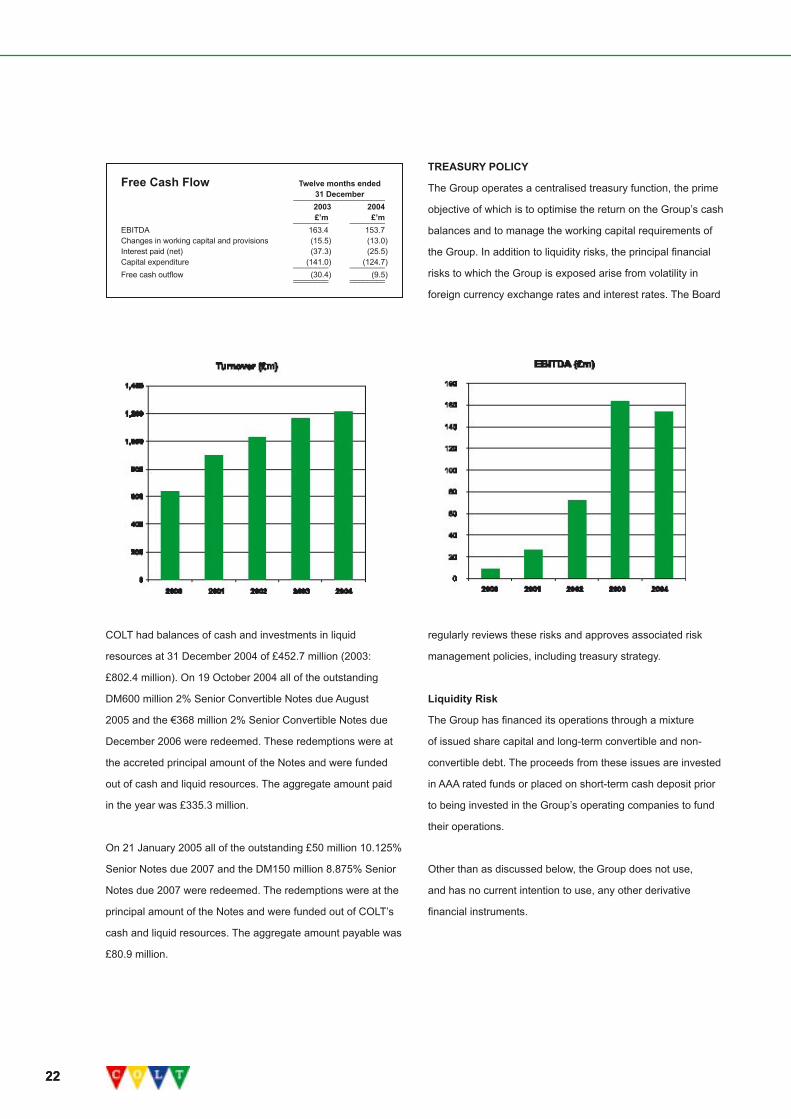
COLT had balances of cash and investments in liquid
resources at 31 December 2004 of £452.7 million (2003:
£802.4 million). On 19 October 2004 all of the outstanding
DM600 million 2% Senior Convertible Notes due August
2005 and the €368 million 2% Senior Convertible Notes due
December 2006 were redeemed. These redemptions were at
the accreted principal amount of the Notes and were funded
out of cash and liquid resources. The aggregate amount paid
in the year was £335.3 million.
On 21 January 2005 all of the outstanding £50 million 10.125%
Senior Notes due 2007 and the DM150 million 8.875% Senior
Notes due 2007 were redeemed. The redemptions were at the
principal amount of the Notes and were funded out of COLT’s
cash and liquid resources. The aggregate amount payable was
£80.9 million.
TREASURY POLICY
The Group operates a centralised treasury function, the prime
objective of which is to optimise the return on the Group’s cash
balances and to manage the working capital requirements of
the Group. In addition to liquidity risks, the principal financial
risks to which the Group is exposed arise from volatility in
foreign currency exchange rates and interest rates. The Board
regularly reviews these risks and approves associated risk
management policies, including treasury strategy.
Liquidity Risk
The Group has financed its operations through a mixture
of issued share capital and long-term convertible and non-
convertible debt. The proceeds from these issues are invested
in AAA rated funds or placed on short-term cash deposit prior
to being invested in the Group’s operating companies to fund
their operations.
Other than as discussed below, the Group does not use,
and has no current intention to use, any other derivative
financial instruments.
Free Cash Flow Twelve months ended 31 December _____________________ 2003 2004 £’m £’m ________ ________EBITDA 163.4 153.7Changes in working capital and provisions (15.5) (13.0)Interest paid (net) (37.3) (25.5)Capital expenditure (141.0) (124.7) ________ ________Free cash outflow (30.4) (9.5) ________ ________ ________ ________
2323
Financial review
Foreign Currency Risk
The Group is exposed to fluctuations in foreign currencies as
its revenues, costs, assets and liabilities are, for the most part,
denominated in local currencies. To manage this exposure,
the Group’s strategy is to raise its financing in a combination
of British pounds and Euro denominated instruments to the
extent possible in proportion to its existing net investment
and committed capital expenditure in those currencies,
offsetting currency differences arising with similarly
denominated borrowings.
From time to time, the Company has entered into forward
contracts to purchase foreign currencies to fund a portion
of the Company’s expenditure in those currencies. At
31 December 2004, no such contracts were outstanding.
Interest Rate Risk
The Company has reduced the uncertainty associated
with fluctuating interest rates by raising debt at fixed
rates. As interest is earned on cash deposits and liquid
resources at variable as well as fixed rates, changes in
interest rates will have an impact on the amount of interest
income earned.
Concentration of Credit Risk
Financial instruments which potentially subject the Company
to concentration of credit risk consist principally of accounts
receivable and cash and investments in liquid resources.
Management believes the concentration of credit risk
associated with accounts receivable is minimised due to
distribution over many customers and different industries and
risks associated with the Group’s cash are mitigated by the
fact that these amounts are placed with high quality financial
institutions. The Group has not experienced any losses to date
on its deposited cash.
2424
Sensitivity Analysis
As a result of the procedures the Company has implemented
to manage foreign currency exchange and interest rate risk as
described above, a 10% change in the value of British pounds
relative to other currencies would lead to a corresponding
change in the fair value of its foreign currency denominated
financial instruments of approximately £53.7 million. A 10%
change in interest rates across all maturities would lead
to a corresponding change in the Company’s earnings of
approximately £4.6 million based on the interest bearing assets
and liabilities held during 2004.
INTERNATIONAL FINANCIAL REPORTING STANDARDS
COLT will be required to report under International Financial
Reporting Standards (“IFRS”) for quarterly reporting from the
quarter ending 31 March 2005 and in the 2005 Annual Report.
The Group has undertaken a project to manage the transition
from existing UK Generally Accepted Accounting Principles
(UK GAAP) to IFRS.
The major areas of difference between UK GAAP and IFRS
which will impact the Group’s profit and loss account or
balance sheet are the following.
Convertible Debt
Under IFRS 32 “Financial instruments: Disclosure and
presentation” the interest charge on convertible debt is
increased to equal the interest charge on equivalent debt which
does not have conversion rights.
Under UK GAAP, COLT included the liability in respect of the
convertible debt within long-term creditors. Under IFRS it is
necessary to allocate the convertible debt between the element
which is deemed to relate to debt and the element which is
deemed to relate to the conversion rights. The element of the
debt which relates to the conversion rights will be classified
in equity in the Group’s balance sheet and has the impact of
increasing the net assets of the Group.
It will also be necessary to restate the gain or loss on debt
redeemed or repurchased since 1 January 2004.

2525
Financial review
Installation Fees Revenue Recognition
Under IFRS all installation fees charged will be taken to
the profit and loss account over the expected length of the
customer relationship period. Under UK GAAP the revenue
was recognised in the same period as the related costs.
Share Option Schemes
Under UK GAAP, COLT did not suffer a profit and loss
charge in respect of its share option plans. Under IFRS 2
“Share based payments” the Group is required to charge
the profit and loss account with the fair value of the options
issued. The charge is spread over the vesting period. An
exemption applies for options which were granted prior to
7 November 2002.
Goodwill
Under IFRS goodwill will not be subject to annual amortisation
but will require an annual impairment test.
Tony Bates
Chief Administrative and Financial Officer
26
COLT Telecom Group plc Board of DirectorsAndreas Barth - non-executive
Director, 60, was appointed to
the Board on 1 September 2003.
Andreas is chairman of the board of
BOG Management and a member
of the supervisory board of TDS
Informationstechnologie. Andreas
was previously senior vice-president
of Compaq Computer Corporation
and has also worked for Thomson-
CSF, Texas Instruments and Ford.
Barry Bateman - Chairman, 59,
was appointed to the Board on
27 September 1996 and as
Chairman on 1 January 2003. Barry
joined Fidelity Investments in 1981
and is now vice chairman of Fidelity
International Limited. He also holds
a number of directorships within
the Fidelity International Group.
Barry is a director of the Investment
Management Association and a
previous chairman of the Association
of Unit Trusts and Investment
Funds (now IMA). He was
previously marketing director at
Datastream and research director
at Hoare Govett.
Antony Bates - Chief Administrative
and Financial Officer, 48, is a
Chartered Accountant and was
appointed to the Board on
1 May 2004. Tony was previously
group finance director of EMI Group
and has also worked for Habitat,
Phillip Morris (now Altria) and
Arthur Andersen.
Jean-Yves Charlier - Chief
Executive Officer, 41, is on
secondment from Fidelity
International and was appointed
to the Board on 30 August 2004.
Jean-Yves was previously chief of
operations of the Global Services
division of BT Group and has also
worked for Equant and Wang.
Vincenzo Damiani - non-executive
Director, 65, was appointed to the
Board on 23 July 2002. Vincenzo is
a non-executive Director of Banca
di Roma and of Data Services SpA.
Vincenzo was previously corporate
vice-president of EDS Corporation
and has also worked for Digital
Equipment Europe and IBM.
Hans Eggerstedt - non-executive
Director, 66, was appointed to the
Board on 2 June 2003. Hans is a
member of the advisory council
of the ING Group, a member
of the supervisory board of
Rodamco Europe, a member of
the supervisory board of Unilever
Deutschland and a non-executive
Director of Jeronimo Martins. Hans
was previously finance director
of Unilever.
27
Gene Gabbard - non-executive
Director, 64, was appointed to the
Board on 6 January 2005. Gene is
a member of the board of Trillion
Partners, a member of the board
of PRE Holdings, a member of
the board of Knology, a special
limited partner of Ballast Point
Ventures and a Review Committee
member for Dali Hook Partners.
Gene was previously executive
vice president and chief financial
officer of MCI Communications
and has also been an advisor
to The Walt Disney Company
and worked for Telecom*USA,
Digital Communications (now
Hughes Network Systems) and
COMSAT Laboratories.
Dr Robert Hawley CBE
- non-executive Director, 68, was
appointed to the Board on 21 August
1998. Robert is a non-executive
director of Rutland Trust. Robert was
previously chief executive of British
Energy and of Nuclear Electric and
was also an advisor to HSBC Bank.
Timothy Hilton - non-executive
Director, 52, was appointed to the
Board on 26 May 1999. Timothy
is president of Fidelity Broadband
Group. Timothy was previously
president of Fidelity Capital and was
also a partner of the U.S. corporate
law firm Sullivan & Worcester.
John Remondi - non-executive
Director, 68, was appointed to
the Board on 31 December 2004.
John is senior vice president and
managing director of FMR Corp.
and is a director of Asia Telecom
Group, MetroRED Telecom Group,
The Strober Organisation, W.R.
Hambrecht and Geerlings & Wade.
John has previously held a number
of senior positions within the
Fidelity organisation.
H. Frans van den Hoven KBE
- non-executive Director, 81, was
appointed to the Board on 30
September 1996. Frans is a member
of the board of Hunter Douglas
and a non-executive director of
three funds managed by Fidelity
International. Frans was previously
chairman of ABN Amro Bank and
of Unilever.
Board of Directors
28
The Directors submit their report and audited financial
statements for the year ended 31 December 2004. For the
purposes of this report, “Company” means COLT Telecom
Group plc and “Group” means the Company and its
subsidiary undertakings.
Principal Activity
The Company is the holding company for the Group. The
principal activity of the Group is the provision of business
communications solutions and services within Europe.
Business Review and Development
The Chairman’s Overview, the Chief Executive Officer’s
Review of Operations and the Financial Review contain details
of the development of the Group’s business during 2004, the
position at the end of 2004, events in 2005 up to the date of
this report and likely future developments.
Results and Dividends
The Group Profit and Loss Account for 2004 is set out on
page 41 and the Financial Review is set out on pages 20 to 25.
The Directors are not recommending the payment of
a dividend.
Annual General Meeting
The ninth Annual General Meeting of the Company is to be
held at The Capital Club, 15 Abchurch Lane, London,
EC4N 7BW, UK on Thursday 21 April 2005, starting at
11:00 a.m. (the “AGM”). The notice convening the meeting is
in a separate document sent to shareholders. All proposals in
the notice of the meeting to be considered at the AGM will be
decided by a poll of shareholders.
Directors
The Directors of the Company are listed with their biographical
details on pages 26 and 27. During 2004, new Directors
appointed were Antony Bates on 1 May, Jean-Yves Charlier on
30 August and John Remondi on 31 December. Directors who
resigned were Mark Jenkins on 29 February and Steven Akin,
Paul Chisholm and James Curvey on 31 December. Gene
Gabbard was appointed a Director on 6 January 2005.
In accordance with the Articles of Association all the current
Directors will retire at the AGM. All of the retiring Directors,
being eligible, are standing for re-election or, in the case of the
Directors appointed since the last Annual General Meeting, for
election, as Directors.
Directors’ Interests
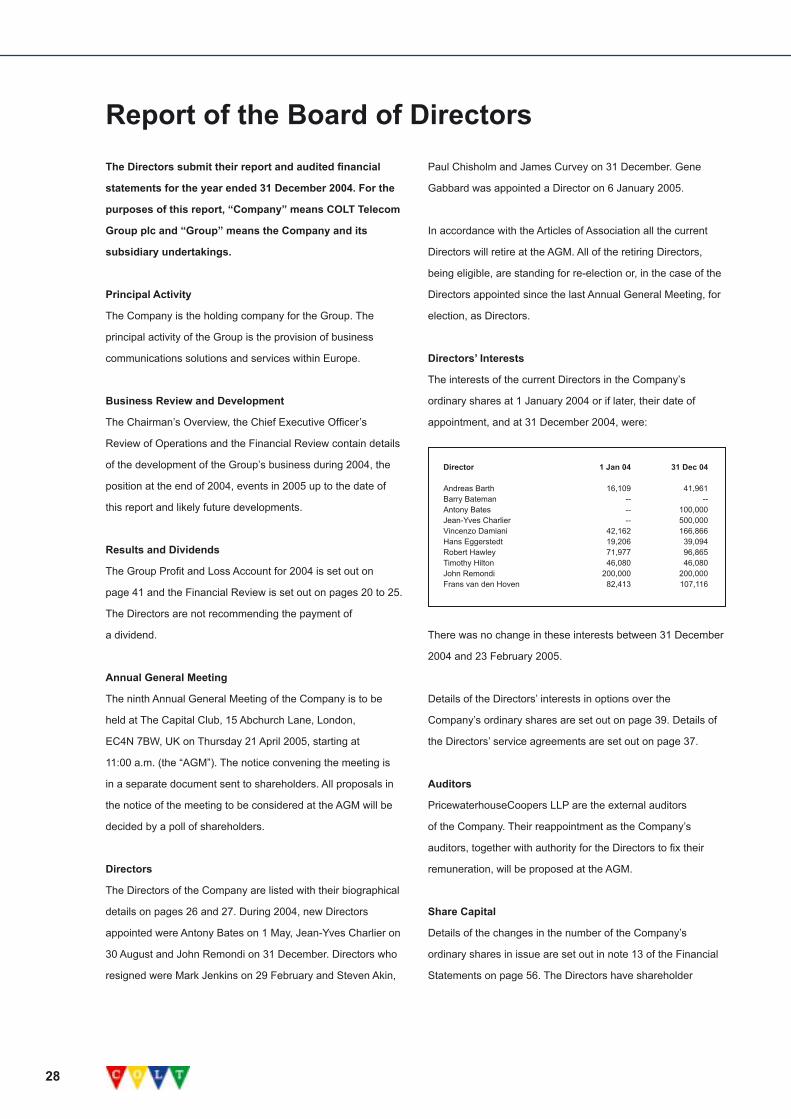
The interests of the current Directors in the Company’s
ordinary shares at 1 January 2004 or if later, their date of
appointment, and at 31 December 2004, were:
There was no change in these interests between 31 December
2004 and 23 February 2005.
Details of the Directors’ interests in options over the
Company’s ordinary shares are set out on page 39. Details of
the Directors’ service agreements are set out on page 37.
Auditors
PricewaterhouseCoopers LLP are the external auditors
of the Company. Their reappointment as the Company’s
auditors, together with authority for the Directors to fix their
remuneration, will be proposed at the AGM.
Share Capital
Details of the changes in the number of the Company’s
ordinary shares in issue are set out in note 13 of the Financial
Statements on page 56. The Directors have shareholder
Director 1 Jan 04 31 Dec 04
Andreas Barth 16,109 41,961Barry Bateman -- --Antony Bates -- 100,000Jean-Yves Charlier -- 500,000 Vincenzo Damiani 42,162 166,866Hans Eggerstedt 19,206 39,094Robert Hawley 71,977 96,865Timothy Hilton 46,080 46,080John Remondi 200,000 200,000Frans van den Hoven 82,413 107,116
Report of the Board of Directors

29
authority to allot ordinary shares in the Company and to
dis-apply statutory pre-emption rights. The renewal of these
authorities will be proposed at the AGM.
The Company has shareholder authority to purchase its own
shares. No shares have been purchased and no contract has
been entered into under this authority. The renewal of this
authority will be proposed at the AGM.
Shareholders
Two trusts are set up for facilitating the holding of shares in the
Company by employees and the executive Directors. Details of
these trusts, including the number of the Company’s ordinary
shares held by them, are given in note 13 of the Financial
Statements on page 58.
As at 23 February 2005, the following shareholders have
notified the Company of their interest in 3% or more of the
Company’s issued ordinary shares:
Fidelity Relationship Agreement
In December 1996, the Company entered into a Relationship
Agreement with FMR Corp., COLT Inc., Fidelity Investors Limited
Partnership, FIL Bank and Trust Company Limited (now FIL
Trust Company Limited) and Fidelity International Limited
(“Fidelity”). Under the Agreement, Fidelity, and where appropriate
its affiliates, have agreed that more than half of the Directors of
the Company will be non-Fidelity related Directors, that Fidelity
will not compete with the Group without the consent of the
non-Fidelity related Directors, that any agreements between
Fidelity and the Group will be on an arms-length basis and
subject to the consent of the non-Fidelity related Directors, and
that Fidelity will not acquire ordinary shares of the Company if
less than 25% of the shares would as a result be in public hands.
The Agreement continues in force while Fidelity or their affiliates
hold at least 30% of the issued ordinary shares of the Company.
The current Fidelity related Directors under the Agreement
are Barry Bateman, Jean-Yves Charlier, Timothy Hilton and
John Remondi. Details of transactions with Fidelity and
their affiliates in 2004 are given in note 23 of the Financial
Statements on page 69.
Corporate and Social Responsibility
The Corporate and Social Responsibility Review on pages 18
to 19 sets out the charitable and political donations made by
the Group, the employment policies of the Group and action
taken to involve employees in the business of the Group.
Creditors and Supplier Payment Policy
Where goods or services have been supplied in accordance
with terms agreed with a supplier, it is the policy of the Group
that the supplier is paid in accordance with those terms.
The Company is a holding company and has no trade
creditors. At 31 December 2004, the number of days of annual
purchases represented by year end creditors for the Group
was 34 days (2003: 38 days).
Approved by the Board of Directors and signed on its behalf by
Jane Forrest, Company Secretary, 23 February 2005
Shareholder Number of Ordinary Shares
FMR Corp.1 471,089,421Fidelity Investors Limited Partnership 2 313,073,111Amvescap plc 3 150,163,486Fidelity International Limited 4 107,906,957
1. FMR Corp.’s (82 Devonshire Street, Boston, Massachusetts 02109 USA) interest is held through:(a) an indirect wholly owned subsidiary, Colt, Inc., that holds 13,681,198 ordinary shares;(b) a wholly owned subsidiary, that as trustee holds 77,000,000 ordinary shares for The Colt, Inc. 2004 Annuity Trust, 172,215,436 ordinary shares for The Colt, Inc. 2003 Annuity Trust, 82,723,580 ordinary shares for The Colt, Inc. 2002 Annuity Trust, 60,016,438 ordinary shares for The Colt, Inc. 2001 Annuity Trust and 1,575,038 ordinary shares for The Colt, Inc. 2001 Charitable Trust;(c) a wholly-owned subsidiary, Strategic Advisers, Inc., that as manager of three charitable foundations has sole voting power over 9,715,293 ordinary shares for the Edward C. Johnson Fund, 9,810,218 ordinary shares for the Fidelity Foundation and 43,687,020 ordinary shares for the Fidelity Non-Profit Management Foundation; and (d) the COLT Incentive Shares Plan Trust, of which Colt, Inc. is the joint trustee, that holds 665,200 ordinary shares.2. Fidelity Investors Limited Partnership (82 Devonshire Street, Boston, Massachusetts 02109 USA) is a Delaware limited partnership.3. Amvescap plc (30, Finsbury Square, London, EC2A 1AG) is a fund manager whose interest is a non-beneficial interest held either directly or through its subsidiary companies.4. Fidelity International Limited (Pembroke Hall, 42 Crow Lane, Pembroke, Bermuda HM-19) is a Bermuda company.
Report of the Board of Directors

30
The Board recognises that good corporate governance
is in the best interests of all shareholders. This
statement describes the Company’s corporate
governance arrangements.
The Combined Code on Corporate Governance
The Combined Code on Corporate Governance was issued
in its amended form by the UK Financial Reporting Council in
July 2003 (the “Combined Code”) and is annexed to the Listing
Rules of the UK Listing Authority. During the year ended 31
December 2004, the Company complied with the provisions of
Section 1 of the Combined Code in all respects save only for
the matters described in this statement. These matters at 31
December 2004 were as follows.
The Board has not appointed a Senior Independent Director.
The Board is satisfied that because the Company maintains
an active relationship with its shareholders, as described in
the Relations with Shareholders section below, there is no role
for a Senior Independent Director within the Company, but will
keep this under review.
The Chairman of the Company is a member of the
Compensation Committee. His contact with executives
provides an important contribution to the work of this
Committee. Moreover, the Board believes that it is important
that Fidelity, as the major shareholder, is represented on the
Compensation Committee.
The Board
The Board has eleven members and it comprises the
Chairman, the Chief Executive, one other executive Director
and eight non-executive Directors. Biographical details of the
Directors are set out on pages 26 and 27.
Four members of the board are employed by Fidelity, the
Company’s major shareholder. These are the Chairman,
the Chief Executive, and two of the non-executive Directors,
Timothy Hilton and John Remondi. The appointment of
Directors representing a company’s major shareholder is
common and the Fidelity related non-executive Directors,
although not independent under the provisions of the
Combined Code, are independent of management and
accordingly exercise their judgement in the interests
of all shareholders. The Company is also able to carry
on its business independently of its major shareholder
and the Fidelity Relationship Agreement, details of
which are set out in the Report of the Board of Directors
on page 29, requires that any agreements between
Fidelity and the Group will be on an arms-length basis
and subject to the consent of the non-Fidelity
related Directors.
The Board considers that each of the remaining six non-
executive Directors, Andreas Barth, Vincenzo Damiani,
Hans Eggerstedt, Gene Gabbard, Robert Hawley and Frans
van den Hoven to be independent, notwithstanding the
following relationships or circumstances.
Vincenzo Damiani, Robert Hawley and Frans van den Hoven
hold share options, details of which are set out on page 39.
They were granted their options on joining the Board as an
appropriate means by which they could acquire shares in the
Company and align their interests with shareholders, and at a
time when this was permitted under then applicable corporate
governance provisions. Options have not been granted
to any non-executive Director since 2002. The estimated
value of the outstanding options based on a Black Scholes
model are less than £11,000, £700 and £100 respectively. In
the circumstances, the Board does not consider that these
historical options compromise the independence of
these Directors.
Frans van den Hoven is an independent non-executive director
of three funds managed by Fidelity International Limited.
His role in this capacity involves the oversight of Fidelity
International Limited on behalf of the fund’s shareholders.
As he is independent of Fidelity management, the Board does
not consider that these external directorships compromise
his independence.
Corporate governance statement
31
There is a division of responsibility between the Chairman,
Barry Bateman, and the Chief Executive, Jean-Yves Charlier.
The Chairman, whose commitments other than to the Group
are set out on page 26 and which have not changed during the
year, is responsible for keeping the strategic direction of the
Group under review and for ensuring that the Board functions
effectively. The Chief Executive is responsible for the operation
and development of the Group’s business.
On appointment, Directors undertake an induction process
which is designed to develop their knowledge and understanding
of the Group’s business through visits to various operating sites,
presentations on relevant technology, product demonstrations,
briefings from management and a familiarisation with investor
perceptions of the Group. The Directors’ knowledge and
understanding of the Company’s business is refreshed
throughout the year and with briefings as necessary on
corporate governance and regulatory compliance. The training
needs of the Directors are periodically reviewed by the Board.
The Board has evaluated its performance and that of its
Committees during 2004 and their continuing ability to act as
effective bodies. The non-executive Directors have assessed
the Chairman’s performance. A series of questionnaires were
used to facilitate the evaluation process, which was conducted
without external consultants. The Chairman has assessed
whether each Director contributed effectively to the Board and
demonstrated commitment to the role.
Where a Director has been unable to attend all meetings of the
Board or Board committees of which he is a member, the
Director has confirmed that he remains committed to the role
and has the requisite time available to perform the role.
Under the Company’s Articles of Association, at each Annual
General Meeting all Directors appointed since the previous
Annual General Meeting retire and seek election, and all
other Directors retire and seek re-election. This means that
no Director can hold office for more than one year unless re-
elected by shareholders.
Operation of the Board
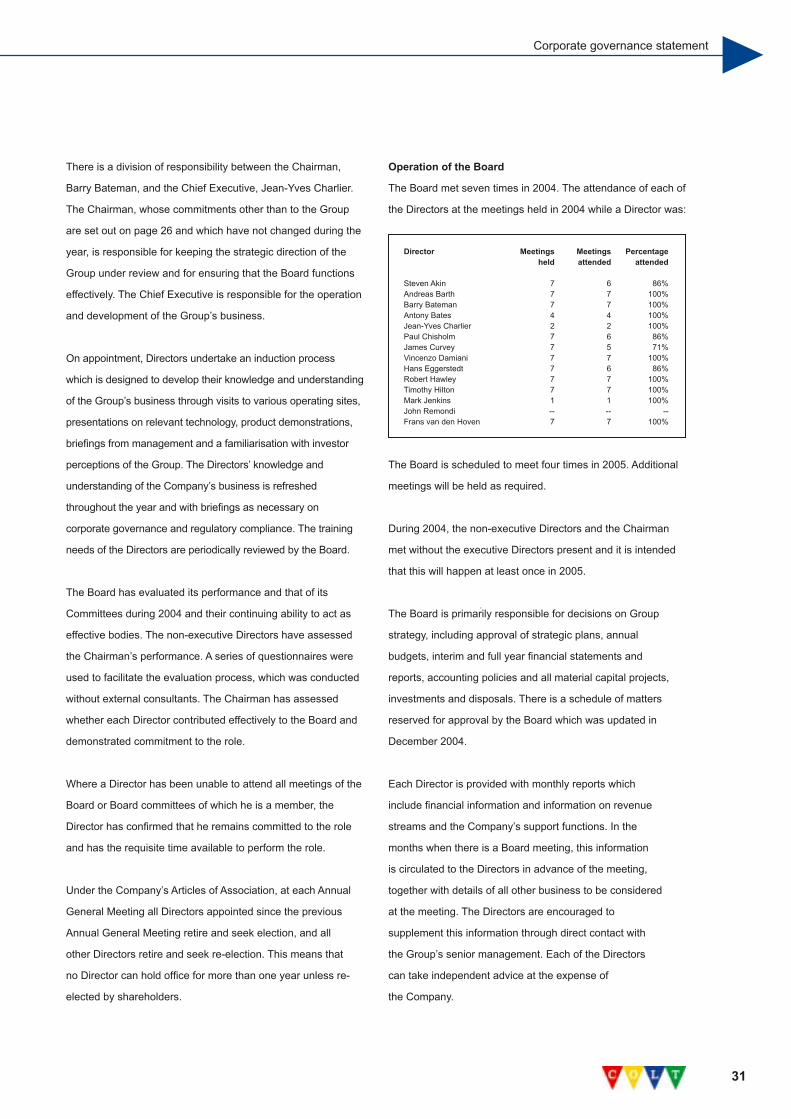
The Board met seven times in 2004. The attendance of each of
the Directors at the meetings held in 2004 while a Director was:
The Board is scheduled to meet four times in 2005. Additional
meetings will be held as required.
During 2004, the non-executive Directors and the Chairman
met without the executive Directors present and it is intended
that this will happen at least once in 2005.
The Board is primarily responsible for decisions on Group
strategy, including approval of strategic plans, annual
budgets, interim and full year financial statements and
reports, accounting policies and all material capital projects,
investments and disposals. There is a schedule of matters
reserved for approval by the Board which was updated in
December 2004.
Each Director is provided with monthly reports which
include financial information and information on revenue
streams and the Company’s support functions. In the
months when there is a Board meeting, this information
is circulated to the Directors in advance of the meeting,
together with details of all other business to be considered
at the meeting. The Directors are encouraged to
supplement this information through direct contact with
the Group’s senior management. Each of the Directors
can take independent advice at the expense of
the Company.
Director Meetings Meetings Percentage held attended attended
Steven Akin 7 6 86%Andreas Barth 7 7 100%Barry Bateman 7 7 100%Antony Bates 4 4 100%Jean-Yves Charlier 2 2 100%Paul Chisholm 7 6 86%James Curvey 7 5 71%Vincenzo Damiani 7 7 100%Hans Eggerstedt 7 6 86%Robert Hawley 7 7 100%Timothy Hilton 7 7 100%Mark Jenkins 1 1 100%John Remondi -- -- --Frans van den Hoven 7 7 100%
Corporate governance statement
32
Board Committees
The Board has delegated specific responsibilities to three
standing Committees of the Board. The membership of
these Committees and a summary of their main duties
under their terms of reference are set out below. The full
terms of reference may be viewed on the Company’s
website, www.colt.net.
The Committees are provided with the resources required to
undertake their duties and they are able to take independent
advice at the expense of the Company. The Company
Secretary acts as secretary to each of these Committees.
In addition to the standing Committees, the Board occasionally
delegates specific tasks to ad-hoc Committees of the Board.
Audit Committee
Hans Eggerstedt is the Chairman of the Audit Committee
and is also the Committee member identified as having
recent and relevant financial experience. The other
members of the Committee are Vincenzo Damiani, Robert
Hawley and Frans van den Hoven. Hans Eggerstedt was
appointed to the Committee on 23 February 2004 and
as Committee Chairman on 20 October 2004, replacing
Frans van den Hoven.
The Chief Administrative and Financial Officer, the Group
Financial Controller, the Senior Director of Audit, Risk
and Security and representatives from the external
auditors, usually attend meetings of the Committee in
advisory capacities.
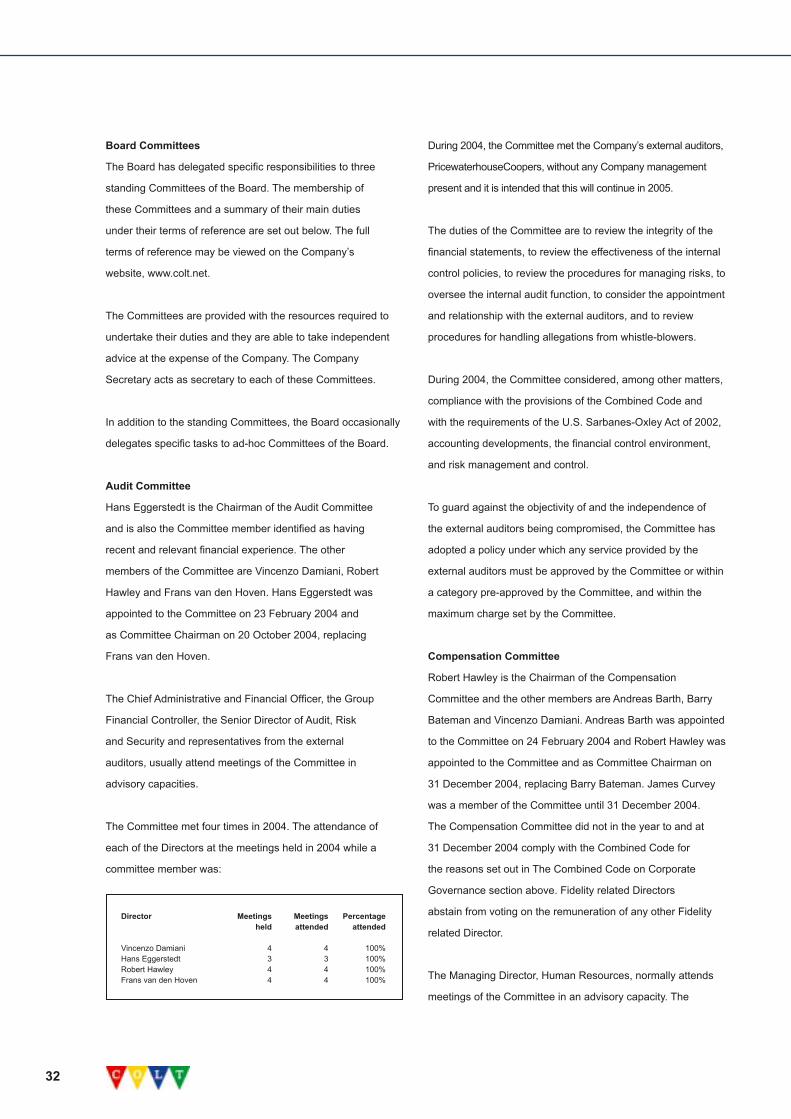
The Committee met four times in 2004. The attendance of
each of the Directors at the meetings held in 2004 while a
committee member was:
During 2004, the Committee met the Company’s external auditors,
PricewaterhouseCoopers, without any Company management
present and it is intended that this will continue in 2005.
The duties of the Committee are to review the integrity of the
financial statements, to review the effectiveness of the internal
control policies, to review the procedures for managing risks, to
oversee the internal audit function, to consider the appointment
and relationship with the external auditors, and to review
procedures for handling allegations from whistle-blowers.
During 2004, the Committee considered, among other matters,
compliance with the provisions of the Combined Code and
with the requirements of the U.S. Sarbanes-Oxley Act of 2002,
accounting developments, the financial control environment,
and risk management and control.
To guard against the objectivity of and the independence of
the external auditors being compromised, the Committee has
adopted a policy under which any service provided by the
external auditors must be approved by the Committee or within
a category pre-approved by the Committee, and within the
maximum charge set by the Committee.
Compensation Committee
Robert Hawley is the Chairman of the Compensation
Committee and the other members are Andreas Barth, Barry
Bateman and Vincenzo Damiani. Andreas Barth was appointed
to the Committee on 24 February 2004 and Robert Hawley was
appointed to the Committee and as Committee Chairman on
31 December 2004, replacing Barry Bateman. James Curvey
was a member of the Committee until 31 December 2004.
The Compensation Committee did not in the year to and at
31 December 2004 comply with the Combined Code for
the reasons set out in The Combined Code on Corporate
Governance section above. Fidelity related Directors
abstain from voting on the remuneration of any other Fidelity
related Director.
The Managing Director, Human Resources, normally attends
meetings of the Committee in an advisory capacity. The
Director Meetings Meetings Percentage held attended attended
Vincenzo Damiani 4 4 100%Hans Eggerstedt 3 3 100%Robert Hawley 4 4 100%Frans van den Hoven 4 4 100%
33
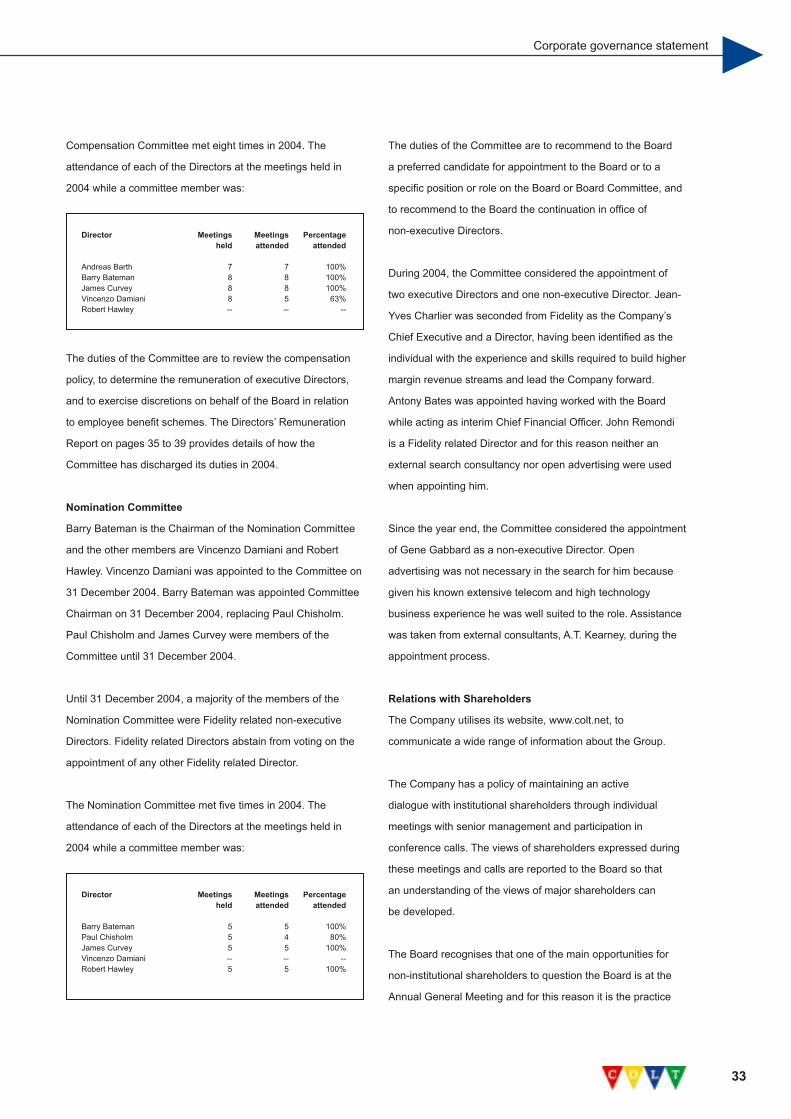
Compensation Committee met eight times in 2004. The
attendance of each of the Directors at the meetings held in
2004 while a committee member was:
The duties of the Committee are to review the compensation
policy, to determine the remuneration of executive Directors,
and to exercise discretions on behalf of the Board in relation
to employee benefit schemes. The Directors’ Remuneration
Report on pages 35 to 39 provides details of how the
Committee has discharged its duties in 2004.
Nomination Committee
Barry Bateman is the Chairman of the Nomination Committee
and the other members are Vincenzo Damiani and Robert
Hawley. Vincenzo Damiani was appointed to the Committee on
31 December 2004. Barry Bateman was appointed Committee
Chairman on 31 December 2004, replacing Paul Chisholm.
Paul Chisholm and James Curvey were members of the
Committee until 31 December 2004.
Until 31 December 2004, a majority of the members of the
Nomination Committee were Fidelity related non-executive
Directors. Fidelity related Directors abstain from voting on the
appointment of any other Fidelity related Director.
The Nomination Committee met five times in 2004. The
attendance of each of the Directors at the meetings held in
2004 while a committee member was:
The duties of the Committee are to recommend to the Board
a preferred candidate for appointment to the Board or to a
specific position or role on the Board or Board Committee, and
to recommend to the Board the continuation in office of
non-executive Directors.
During 2004, the Committee considered the appointment of
two executive Directors and one non-executive Director. Jean-
Yves Charlier was seconded from Fidelity as the Company’s
Chief Executive and a Director, having been identified as the
individual with the experience and skills required to build higher
margin revenue streams and lead the Company forward.
Antony Bates was appointed having worked with the Board
while acting as interim Chief Financial Officer. John Remondi
is a Fidelity related Director and for this reason neither an
external search consultancy nor open advertising were used
when appointing him.
Since the year end, the Committee considered the appointment
of Gene Gabbard as a non-executive Director. Open
advertising was not necessary in the search for him because
given his known extensive telecom and high technology
business experience he was well suited to the role. Assistance
was taken from external consultants, A.T. Kearney, during the
appointment process.
Relations with Shareholders
The Company utilises its website, www.colt.net, to
communicate a wide range of information about the Group.
The Company has a policy of maintaining an active
dialogue with institutional shareholders through individual
meetings with senior management and participation in
conference calls. The views of shareholders expressed during
these meetings and calls are reported to the Board so that
an understanding of the views of major shareholders can
be developed.
The Board recognises that one of the main opportunities for
non-institutional shareholders to question the Board is at the
Annual General Meeting and for this reason it is the practice
Director Meetings Meetings Percentage held attended attended
Andreas Barth 7 7 100%Barry Bateman 8 8 100%James Curvey 8 8 100%Vincenzo Damiani 8 5 63%Robert Hawley -- -- --
Director Meetings Meetings Percentage held attended attended
Barry Bateman 5 5 100%Paul Chisholm 5 4 80%James Curvey 5 5 100%Vincenzo Damiani -- -- --Robert Hawley 5 5 100%
Corporate governance statement

34
that each of the Directors attend the meeting whenever
possible. Any shareholder is free to contact the Company’s
Director of Corporate Communications at any time.
Statement of Directors’ Responsibilities
Directors are required by the Companies Act 1985 to prepare
financial statements for each financial year which give a true
and fair view of the state of affairs of the Company, including its
subsidiary companies, as at the end of the financial year, and
of the profit or loss of the Company for that relevant period.
In preparing those financial statements, the Directors are
required to select suitable accounting policies and apply them
consistently, supported by judgements and estimates
that are reasonable and prudent and to state whether
applicable accounting standards have been followed, subject
to any material departures disclosed and explained in the
financial statements.
The Directors are also responsible for keeping proper
accounting records, which disclose with reasonable accuracy,
the financial position of the Company and they are also
responsible for safeguarding the assets of the Company and to
prevent and detect fraud and other irregularities.
The financial statements are published on the Company
website. The maintenance and integrity of the website
is the responsibility of the Directors. Legislation in the
United Kingdom governing the preparation and dissemination
of financial statements may differ from legislation in
other jurisdictions.
Going Concern
The Directors, after making appropriate enquiries, have a
reasonable expectation that the Company has adequate
resources to continue in operational existence for the
foreseeable future. For this reason, the Directors continue
to adopt the going concern basis in preparing the
financial statements.
Internal Control
The Board has overall responsibility for the Company’s system
of internal controls and for reviewing its effectiveness. The
system of internal control is designed to manage, rather than
eliminate risk of failure to achieve business objectives and can
only provide reasonable and not absolute assurance against
material misstatement or loss. Throughout 2004, and up until
the date of this report, there has been an ongoing process for
identifying, evaluating and managing the material risks faced
by the Company. The effectiveness of the internal control
system and risk management process is kept under review by
the Audit Committee and reviewed annually by the Board.
The Group’s senior management, supported by the Senior
Director of Audit, Risk and Security, identify the key risks facing
the Group. These risks and how they are being managed are
reported to the Audit Committee. The key risks are selected
from the Group risk register which details the risks identified,
the impact if those risks were to occur and the actions that will
be taken to manage those risks most appropriately.
The Company operates a management structure with clear
delegated authority levels and clear functional reporting lines
and accountability. The Company operates a comprehensive
budgeting and financial reporting system, which compares
actual performance to budget on a monthly basis. All capital
expenditure and all other purchases are subject to appropriate
authorisation procedures. This together with the internal
controls and risk management process allows management to
monitor financial and operational performance and compliance
controls on a continuing basis and to identify and respond to
business risks as they arise.
35
The Directors’ Remuneration Report sets out the
Company’s policy on remuneration. The report also sets
out for each Director the remuneration earned in 2004,
their interests in share options and other long-term
incentive plans, and their contractual relationship with
the Company.
The Directors’ Remuneration Report, which has been
approved and adopted by the Board of Directors, will be put
to shareholders at the Annual General Meeting for approval.
The report complies with the Directors’ Remuneration Report
Regulation 2002 and sets out how the principles in Section 1.B
of the Combined Code have been applied.
Compensation Committee
The Compensation Committee consists of independent
non-executive Directors and the Company Chairman. Robert
Hawley was appointed to the Committee and as Committee
Chairman on 31 December 2004, replacing Barry Bateman
as Committee Chairman. The other members are Andreas
Barth (appointed to the Committee on the 24 February 2004),
Barry Bateman and Vincenzo Damiani. James Curvey was a
member of the Committee until 31 December 2004.
The Compensation Committee section of the Corporate
Governance Statement on pages 32 and 33 gives the reasons
why the Board considers it appropriate for the Company
Chairman to remain a member of the Committee. The
statement also sets out the number of meetings, attendance
and duties of the Committee.
Normally attending meetings of the Committee, in an advisory
capacity, is the Managing Director, Human Resources. The
Committee also appointed and received advice from Hewitt
Bacon & Woodrow, Monks Partnership (also retained by the
Company) and Watson Wyatt on salary, benefits and other
compensation trend data which the Committee has used
when considering the appropriate level of compensation for its
executive Directors. In addition, Slaughter and May have
provided guidance about the rules of the share option plans.
Compensation Policy
The Company’s policy is to place a significant emphasis
on performance related elements of total compensation for
executive Directors and senior executive officers and to align
their interests with those of shareholders.
Base salary reflects an executive’s experience, responsibility
and market value. Performance bonuses are subject to
upper limits that normally range between 50% and 200%
of salary or, where appropriate, a specified amount. Each
year, performance targets are set for bonuses that link
50% to the Company’s financial targets and the balance to
personal business goals such as quality of service, revenue
success, process improvements and the introduction of
new technologies.
The Company believes that it is important to encourage an
ownership mentality amongst all employees. Share and share
option schemes are designed to offer employees a stake in the
organisation and a share in the achievement of the successes
over the medium to long term.
The policies relating to each of the components of total
compensation are subject to regular review in order to ensure
that they remain competitive, stimulating and challenging. The
package is geared towards driving exceptional effort through
the variable elements of the total package. The ability to have
an impact on shareholder value will influence the mix of the total
reward package with, at less senior levels, there being greater
emphasis on the base salary portion of the total package.
Base salaries and performance bonuses are benchmarked
regularly against other appropriate sectors, in particular,
telecommunications operators and technology companies.
Elements of Compensation for Executive Directors
Executive Directors receive base salary, performance bonus,
long-term incentives, defined contribution pensions and other
usual benefits. Payment of bonus and vesting of long-term
incentives is dependent upon the achievement of performance
targets that are set beforehand by the Committee.
The Directors’ remuneration report
The Directors’ remuneration report

36
Salary and Bonus
Base salary for the executive Directors is set when they
are appointed to the role and reflects their experience,
responsibility and market value and are not normally
reviewed annually.
Bonus amounts are based upon demanding financial targets
and the achievement of personal predetermined business
objectives. Bonuses are subject to upper limits of 200% of
salary for John-Yves Charlier and 150% of salary for Antony
Bates. Annual bonuses do not form part of pensionable
earnings. Current executive Director performance bonus
payments for the year were in the range of 61% to 73% of
maximum bonus potential (pro rated for service).
Proportion of Fixed and Variable Remuneration
The table below shows the approximate targeted proportion
of fixed and variable remuneration for the executive Directors.
The long-term incentives proportion is based on the estimated
value of the awards using a Black Scholes model which
takes into account the likelihood that performance conditions
are met at the end of the relevant performance periods. The
annual cash bonus plan supports financial and operational
performance, whilst the long-term incentive element is reward
for superior performance over the longer term and the numbers
in the table take into account the likelihood of payment.
Long-Term Incentives
The Company has two share option plans used for long-term
incentives, the Group Share Plan and the Deferred Bonus
Plan. Options over shares granted under these Plans to
Directors are set out in the table on page 39.
Group Share Plan (“Option Plan”)
The Option Plan is divided into two parts; the “Approved Part”
approved by the U.K. Inland Revenue for the purposes of the
Income and Corporation Taxes Act 1988, and the “Unapproved
Part” which is not so approved. Options granted under the
Approved Part will not normally be exercisable until the third
anniversary of the date of grant. Options granted under the
Unapproved Part may become exercisable earlier than the
third anniversary.
There are two programmes now offered under the Option Plan,
“Performance Options” and “Welcome Options”. Performance
Options are awarded to high performing executives and,
subject to meeting performance conditions, 100% of shares
under option vest on the third anniversary of the date of grant.
Welcome Options are awarded to senior employees to attract
them to COLT and, subject to performance conditions, 50%
of shares under option vest on the third anniversary and 25%
of shares under option vest on each of the fourth and fifth
anniversaries of the grant date. Options are granted at an
option price which is not less than the market value of the
ordinary shares on the date of grant.
In 2004, Jean-Yves Charlier and Antony Bates were each
awarded Welcome Options on joining the Company of 800,000
and 500,000 shares respectively. Each grant was subject to the
normal set of performance metrics, described below.
For all grants of options made during 2004, a performance
condition was applied based upon the achievement of a
performance metric consisting of two elements. The first
element is that the cumulative free cash flow over the three
years to the end of 2006 must reach a certain level (free
cash flow for this purpose is the sum of net cash inflow
from operating activities less net cash outflow from returns
on investments and servicing of finance and from capital
expenditure and financial investment). The second element
is that the Company must attain targeted cumulative revenue
over the three years to the end of 2006. Achievement of the
first element will result in 50% of the option vesting, while
achievement of the second element will result in the vesting
of the remaining 50%. This performance condition was
chosen by the Committee as being the most appropriate as
Proportion of fixed and variable remuneration
Fixed Variable _________________________ _______________ Long-Term Base Pay Pension Benefits Bonus Incentives Total (%) (%) (%) (%) (%) (%)Steven Akin 33.5 5.4 3.3 50.3 7.5 100Jean-Yves Charlier 33.5 5.4 3.3 50.3 7.5 100Antony Bates 38.3 6.1 3.8 43.1 8.7 100
37
it aligns the potential reward with the strategic financial aims
of the Company. Future grants may be subject to different
performance criteria as determined by the Committee at
the time.
Deferred Bonus Plan
Jean-Yves Charlier and Antony Bates each purchased 500,000
and 100,000 shares respectively and were awarded matching
awards of shares of 250,000 and 50,000 respectively under
the provisions of the Deferred Bonus Plan. Subject to the same
performance condition as for their Option Plan options, the
Deferred Bonus Plan shares will vest on the third anniversary
of the grant date.
Pension Contributions and other Benefits
Pension contributions are determined based on employee
age and years of service and are made to defined contribution
schemes. Benefits include, as appropriate, housing
benefit, private health insurance and other similar benefits
commensurate with market practice.
Saving-Related Share Option Scheme (“SAYE Scheme”)
Participation in the Company’s SAYE Scheme is open to
all eligible employees and the executive Directors. Details of
the participation of the executive Directors are set out in
the table on page 39. Under the SAYE Scheme, employees
may save between £5 and £250 a month with a savings
institution and are granted options to acquire shares in
the Company. After a three year period, employees can use
the proceeds of their savings account to exercise the options
at a price established at the beginning of the three year
period. The price established at the beginning of the three
years is at the discretion of the Board of Directors and can
be up to a 20% discount to the then market price of the
Company’s shares.
Non-executive Directors
The compensation of non-executive Directors is reviewed
periodically by the Board. The Company aligns this
compensation with the interests of shareholders by delivering
it in a mix of cash and shares acquired in the open market.
In the last 12 months, the non-executive Directors have
received no element of their compensation in the form of
options, benefits or other incentives, nor is it the intent of
the Board that this should occur within the forthcoming
twelve months.
Directors’ Service Agreements
Jean-Yves Charlier’s services are provided under a
secondment agreement with Fidelity International Limited and
Fidelity Investment Management Limited. The secondment is
for three years from 1 September 2004 but can be terminated
by Fidelity International Limited and Fidelity Investment
Management Limited or by the Company at any time. In the
event of termination there is no right to compensation.
Antony Bates has an employment contract that can be
terminated by him giving six months’ notice. Until 30 April 2005,
the service contract can be terminated by the Company giving
twenty-four months’ notice less the number of completed
months since 1 May 2004. The Compensation Committee
believed that this period of notice was justified in order to
secure the services of Antony Bates on a permanent basis.
From 1 May 2005, the service contract can be terminated
by the Company giving twelve months’ notice. In the event
of termination, he has the right to receive an amount which,
subject to mitigation, is equal to his salary and other benefits
for the period of notice plus bonus equal to the average bonus
percentage of salary achieved during the previous two years
or, if termination is before two bonus payments have been
made, at 127.5% of his base salary.
The Chairman and non-executive Directors are engaged
on letters of appointment that set out their duties and
responsibilities. The appointment of Barry Bateman, Gene
Gabbard and John Remondi can be terminated by them or by
the Company by giving three months’ notice. The appointment
of Andreas Barth, Hans Eggerstedt, Vincenzo Damiani,
Robert Hawley, Timothy Hilton and Frans van den Hoven can
be terminated by them or by the Company at any time. In
every case, there is no right to compensation in the event
of termination.
The Directors’ remuneration report
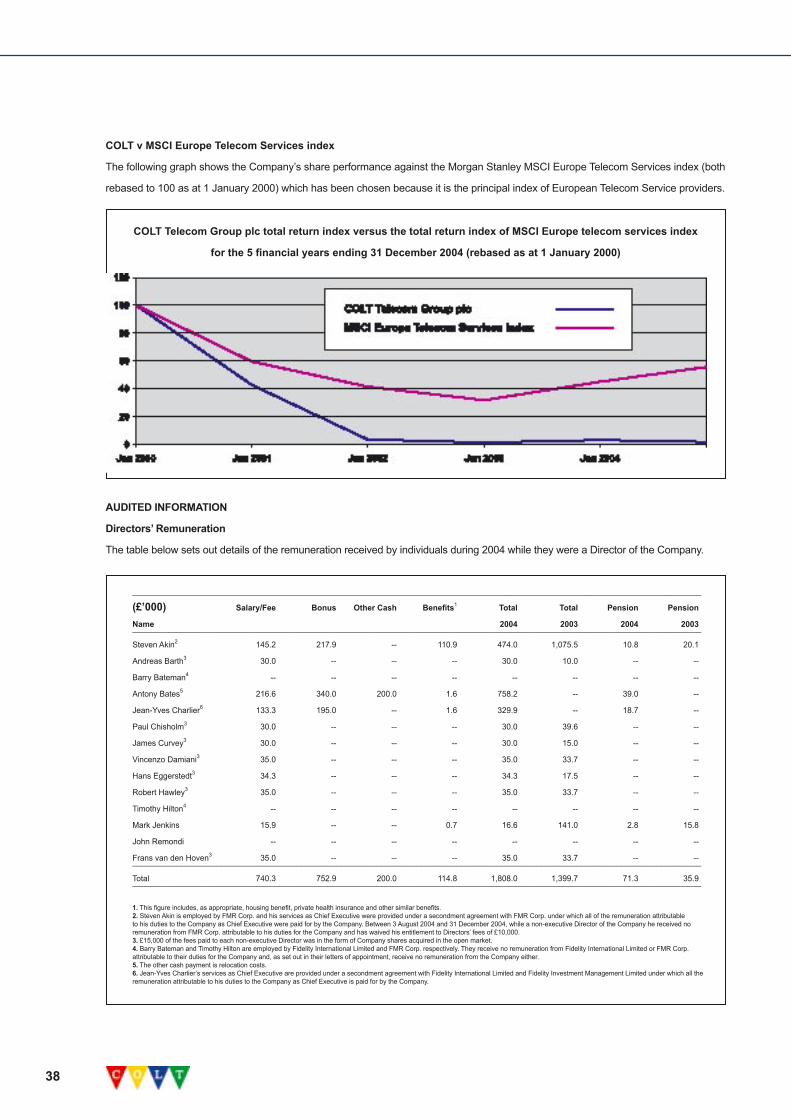
38
COLT v MSCI Europe Telecom Services index
The following graph shows the Company’s share performance against the Morgan Stanley MSCI Europe Telecom Services index (both
rebased to 100 as at 1 January 2000) which has been chosen because it is the principal index of European Telecom Service providers.
COLT Telecom Group plc total return index versus the total return index of MSCI Europe telecom services index
for the 5 financial years ending 31 December 2004 (rebased as at 1 January 2000)
________________________________________________________________________________________________________________________________
(£’000) Salary/Fee Bonus Other Cash Benefits1 Total Total Pension Pension
Name 2004 2003 2004 2003________________________________________________________________________________________________________________________________
Steven Akin2 145.2 217.9 -- 110.9 474.0 1,075.5 10.8 20.1
Andreas Barth3 30.0 -- -- -- 30.0 10.0 -- --
Barry Bateman4 -- -- -- -- -- -- -- --
Antony Bates5 216.6 340.0 200.0 1.6 758.2 -- 39.0 --
Jean-Yves Charlier6 133.3 195.0 -- 1.6 329.9 -- 18.7 --
Paul Chisholm3 30.0 -- -- -- 30.0 39.6 -- --
James Curvey3 30.0 -- -- -- 30.0 15.0 -- --
Vincenzo Damiani3 35.0 -- -- -- 35.0 33.7 -- --
Hans Eggerstedt3 34.3 -- -- -- 34.3 17.5 -- --
Robert Hawley3 35.0 -- -- -- 35.0 33.7 -- --
Timothy Hilton4 -- -- -- -- -- -- -- --
Mark Jenkins 15.9 -- -- 0.7 16.6 141.0 2.8 15.8
John Remondi -- -- -- -- -- -- -- --
Frans van den Hoven3 35.0 -- -- -- 35.0 33.7 -- --________________________________________________________________________________________________________________________________
Total 740.3 752.9 200.0 114.8 1,808.0 1,399.7 71.3 35.9________________________________________________________________________________________________________________________________
1. This figure includes, as appropriate, housing benefit, private health insurance and other similar benefits.2. Steven Akin is employed by FMR Corp. and his services as Chief Executive were provided under a secondment agreement with FMR Corp. under which all of the remuneration attributable to his duties to the Company as Chief Executive were paid for by the Company. Between 3 August 2004 and 31 December 2004, while a non-executive Director of the Company he received no remuneration from FMR Corp. attributable to his duties for the Company and has waived his entitlement to Directors’ fees of £10,000.3. £15,000 of the fees paid to each non-executive Director was in the form of Company shares acquired in the open market. 4. Barry Bateman and Timothy Hilton are employed by Fidelity International Limited and FMR Corp. respectively. They receive no remuneration from Fidelity International Limited or FMR Corp. attributable to their duties for the Company and, as set out in their letters of appointment, receive no remuneration from the Company either. 5. The other cash payment is relocation costs.6. Jean-Yves Charlier’s services as Chief Executive are provided under a secondment agreement with Fidelity International Limited and Fidelity Investment Management Limited under which all the remuneration attributable to his duties to the Company as Chief Executive is paid for by the Company.
AUDITED INFORMATION
Directors’ Remuneration
The table below sets out details of the remuneration received by individuals during 2004 while they were a Director of the Company.

39
The Directors’ remuneration report
Option Plan ___________________________________________________________________________________________________________________________________Name 1 Jan 2004 Granted Exercised Lapsed 31 Dec Date of Market Option Usual date from which Usual 2004 exercise value exercise first exercisable1,2 expiry date price per share___________________________________________________________________________________________________________________________________Steven Akin3 500,000 -- -- -- 500.000 0.4800 29 Jul 2003 to 29 Jul 2007 29 Jul 2012 150,000 -- -- 150,000 -- 0.7692 28 Jul 2006 to 28 Jul 2008 28 Jul 2013 __________________________________________________ 650,000 -- -- 150,000 500,000___________________________________________________________________________________________________________________________________
Antony Bates -- 500,000 -- -- 500,000 0.7667 4 May 2007 to 4 May 2009 4 May 2014 ___________________________________________________________________________________________________________________________________
Jean-Yves Charlier -- 800,000 -- -- 800,000 0.3800 31 Aug 2007 to 31 Aug 2009 31 Aug 2014 ___________________________________________________________________________________________________________________________________Paul Chisholm4 5,100,000 -- 500,000 -- 4,600,000 25 Feb 04 1.1300 0.6875 17 Dec 1997 to 17 Dec 2001 17 Dec 2006 400,000 -- -- -- 400,000 1.7000 15 Dec 1998 to 15 Dec 2002 15 Dec 2007 __________________________________________________ 5,500,000 -- 500,000 -- 5,000,000 ___________________________________________________________________________________________________________________________________
Vincenzo Damiani 40,000 -- -- -- 40,000 0.4800 29 Jul 2003 to 29 Jul 2007 29 Jul 2012 ___________________________________________________________________________________________________________________________________
Robert Hawley 68,060 -- -- -- 68,060 7.4940 25 Nov 1999 to 25 Nov 2003 25 Nov 2008 ___________________________________________________________________________________________________________________________________
Mark Jenkins5 160,000 -- -- 160,000 -- 6.6000 4 Aug 1999 to 4 Aug 2003 4 Aug 2008 20,000 -- -- 20,000 -- 13.3700 27 Feb 2002 to cliff vest 27 Feb 2011 20,000 -- 8,000 12,000 -- 25 Mar 04 0.9525 0.4125 26 Feb 2003 to 26 Feb 2007 26 Feb 2012 20,000 -- 4,000 16,000 -- 25 Mar 04 0.9525 0.4800 29 Jul 2003 to 29 Jul 2007 29 Jul 2012 __________________________________________________ 220,000 -- 12,000 208,000 --___________________________________________________________________________________________________________________________________
Frans van den Hoven 16,000 -- -- -- 16,000 8.5000 17 Dec 1996 to 17 Dec 2000 17 Dec 2006 16,000 -- -- -- 16,000 29.0000 17 Dec 1996 to 17 Dec 2000 17 Dec 2006 16,000 -- -- -- 16,000 14.8600 17 Dec 1996 to 17 Dec 2000 17 Dec 2006 __________________________________________________ 48,000 -- -- -- 48,000___________________________________________________________________________________________________________________________________
Option Plan - Past Directors___________________________________________________________________________________________________________________________________Peter Manning6 500,000 -- -- -- 500,000 0.4125 26 Feb 2003 31 Dec 2005 ___________________________________________________________________________________________________________________________________
Deferred Bonus Plan_______________________________________________________________________________ Name 1 Jan 2004 Granted Exercised Lapsed 31 Dec Usual date 2004 of vesting2_______________________________________________________________________________ Antony Bates -- 50,000 -- -- 50,000 26 Oct 2007_______________________________________________________________________________ Jean-Yves Charlier -- 250,000 -- -- 250,000 31 Aug 2007_______________________________________________________________________________ Mark Jenkins5 1,685 -- -- 1,685 -- 27 Feb 2004_______________________________________________________________________________
SAYE Scheme_______________________________________________________________________________________________________________ Name 1 Jan 2004 Granted Exercised Lapsed 31 Dec Option Usual date Usual 2004 exercise from which expiry date price per first share exercisable_______________________________________________________________________________________________________________ Mark Jenkins5 18,000 -- -- 18,000 -- 0.4000 1 Mar 2006 1 Aug 2006_______________________________________________________________________________________________________________
1. In the case of options granted under the Option Plan before July 2003, usually 20% of the shares under option become exercisable on each of the five anniversaries following the grant date. In the case of options granted since July 2003, usually 50% of the shares under option become exercisable on the third anniversary of the grant date and 25% of the shares under option become exercisable on each of the fourth and fifth anniversaries of the grant date. In certain circumstances, including the death of the option holder, options may become exercisable earlier.2. Usually an option over shares is exercisable, or vests, only if a performance condition is met. For all grants of options made during 2004, a performance condition was applied based upon the achievement of a performance metric consisting of two elements. The first element is that the cumulative free cash flow over the three years to the end of 2006 must reach a certain level. The second element is that the Company must attain a targeted cumulative revenue cash flow over the three years to the end of 2006. Achievement of the first element will result in 50% of the option vesting, while achievement of the second element will result in the vesting of the remaining 50%.3. Steven Akin resigned as a Director on 31 December 2004 having returned to FMR Corp. at the end of his secondment. These options will remain exercisable until the usual expiry date or the date he leaves the employment of FMR Corp., whichever is the earlier. 4. Paul Chisholm resigned as a Director on 31 December 2004. These options will remain exercisable until the usual expiry date.5. Mark Jenkins resigned as a Director on 29 February 2004. All options over shares have lapsed.6. Peter Manning resigned as a Director on 25 July 2002. The terms of this option were varied such that it vested on 26 February 2003 and is exercisable until 31 December 2005, at which time it will lapse. All other options over shares have lapsed.
Directors’ Share Options
The tables below set out details of options under each of the
Company’s share option plans held by individuals who are or
have been a Director of the Company.
The closing mid-point price of the Company’s ordinary shares
on 31 December 2004 was £0.465 per share and the range
during the year was £0.3625 to £1.3037 per share.
Approved by the Board of Directors and signed on its behalf by
Dr. R. Hawley CBE, Chairman of the Compensation Committee
40
Independent auditors’ report to the members of COLT Telecom Group plcWe have audited the financial statements which comprise the profit and loss account, the balance sheet, the cash flow statement, the statement of total recognised gains and losses, the reconciliation of equity shareholders’ funds and the related notes which have been prepared under the historical cost convention and the accounting policies set out in the statement of accounting policies. We have also audited the disclosures required by Part 3 of Schedule 7A to the Companies Act 1985 contained in the Directors’ Remuneration Report (“the auditable part”).
Respective responsibilities of Directors and auditorsThe Directors’ responsibilities for preparing the Annual Report and the financial statements in accordance with applicable United Kingdom law and accounting standards are set out in the Statement of Directors’ Responsibilities. The Directors are also responsible for preparing the Directors’ Remuneration Report.
Our responsibility is to audit the financial statements and the auditable part of the Directors’ Remuneration Report in accordance with relevant legal and regulatory requirements and United Kingdom Auditing Standards issued by the Auditing Practices Board. This report, including the Opinion, has been prepared for and only for the Company’s members as a body in accordance with Section 235 of the Companies Act 1985 and for no other purpose. We do not, in giving this opinion, accept or assume responsibility for any other purpose or to any other person to whom this report is shown or in to whose hands it may come save where expressly agreed by our prior consent in writing.
We report to you our opinion as to whether the financial statements give a true and fair view and whether the financial statements and the auditable part of the Directors’ Remuneration Report have been properly prepared in accordance with the Companies Act 1985. We also report to you if, in our opinion, the Directors’ Report is not consistent with the financial statements, if the Company has not kept proper accounting records, if we have not received all the information and explanations we require for our audit, or if information specified by law regarding Directors’ remuneration and transactions is not disclosed.
We read the other information contained in the Annual Report and consider the implications for our report if we become aware of any apparent misstatements or material inconsistencies with the financial statements. The other information comprises only the sections set out in the table of contents including the Chairman’s Overview, the Chief Executive Officer’s Review of Operations, the Financial Review, the Report of the Board of Directors, the Corporate Governance Statement and the unaudited part of the Directors’ Remuneration Report.
We review whether the Corporate Governance Statement reflects the Company’s compliance with the nine provisions of the 2003 FRC Combined Code specified for our review by the Listing Rules of the Financial Services Authority, and we report if it does not. We are not required to consider whether the board’s statements on internal control cover all risks and controls, or form an opinion on the effectiveness of the Group’s corporate governance procedures or its risk and control procedures.
Basis of audit opinionWe conducted our audit in accordance with auditing standards issued by the Auditing Practices Board. An audit includes examination, on a test basis, of evidence relevant to the amounts and disclosures in the financial statements and the auditable part of the Directors’ Remuneration Report. It also includes an assessment of the significant estimates and judgements made by the Directors in the preparation of the financial statements, and of whether the accounting policies are appropriate to the Company’s circumstances, consistently applied and adequately disclosed.
We planned and performed our audit so as to obtain all the information and explanations which we considered necessary in order to provide us with sufficient evidence to give reasonable assurance that the financial statements and the auditable part of the Directors’ Remuneration Report are free from material misstatement, whether caused by fraud or other irregularity or error. In forming our opinion we also evaluated the overall adequacy of the presentation of information in the financial statements.
OpinionIn our opinion:- the financial statements give a true and fair view of the state of affairs of the Company and the Group at 31 December 2004 and of the loss and cash flows of the Group for the year then ended; - the financial statements have been properly prepared in accordance with the Companies Act 1985; and- those parts of the Directors’ Remuneration Report required by Part 3 of Schedule 7A to the Companies Act 1985 have been properly prepared in accordance with the Companies Act 1985.
PricewaterhouseCoopers LLPChartered Accountants and Registered AuditorsLondon23 February 2005

41
Financial statements
The accompanying notes are an integral part of the financial statements.
Year ended 31 December ___________________________________________________________________ 2003 2003 2003 2004 2004 2004 2004 Before After Before After After Exceptional Exceptional Exceptional Exceptional Exceptional Exceptional Exceptional Items Items Items Items Items Items Items Notes £’000 £’000 £’000 £’000 £’000 £’000 $’000 ________ ________ ________ ________ ________ ________ ________ ________
Turnover 2 1,166,318 -- 1,166,318 1,214,020 -- 1,214,020 2,326,062
Cost of sales Interconnect and network (766,942) -- (766,942) (813,728) -- (813,728) (1,559,102) Network depreciation (204,417) -- (204,417) (191,969) -- (191,969) (367,813) ________ ________ ________ ________ ________ ________ ________ (971,359) -- (971,359) (1,005,697) -- (1,005,697) (1,926,915) ________ ________ ________ ________ ________ ________ ________Gross profit 194,959 -- 194,959 208,323 -- 208,323 399,147
Operating expenses Selling, general and administrative (235,928) 2,453 (233,475) (246,633) -- (246,633) (472,549) Other depreciation and amortisation (38,531) -- (38,531) (30,519) -- (30,519) (58,474) ________ ________ ________ ________ ________ ________ ________ (274,459) 2,453 (272,006) (277,152) -- (277,152) (531,023) ________ ________ ________ ________ ________ ________ ________Operating loss (79,500) 2,453 (77,047) (68,829) -- (68,829) (131,876)
Other income (expense) Interest receivable 26,718 -- 26,718 21,001 -- 21,001 40,238 Gain on redemption of debt 7 -- 7,589 7,589 -- 205 205 393 Interest payable and similar charges 6 (88,295) -- (88,295) (66,812) -- (66,812) (128,012) Exchange gain 6,388 -- 6,388 4 -- 4 8 ________ ________ ________ ________ ________ ________ ________ (55,189) 7,589 (47,600) (45,807) 205 (45,602) (87,373) ________ ________ ________ ________ ________ ________ ________
Loss on ordinary activities before taxation 3 (134,689) 10,042 (124,647) (114,636) 205 (114,431) (219,249)Taxation 8 -- -- -- -- -- -- -- ________ ________ ________ ________ ________ ________ ________Loss for period (134,689) 10,042 (124,647) (114,636) 205 (114,431) (219,249) ________ ________ ________ ________ ________ ________ ________ ________ ________ ________ ________ ________ ________ ________Basic and diluted loss per share 9 £(0.09) £0.01 £(0.08) £(0.08) £0.00 £(0.08) £(0.15) ________ ________ ________ ________ ________ ________ ________ ________ ________ ________ ________ ________ ________ ________
There is no difference between the loss on ordinary activities before taxation and the retained loss for the periods stated above and their historical cost equivalents.
All of the Group’s activities are continuing.
Details of exceptional items are provided in note 7.
Group profit and loss account
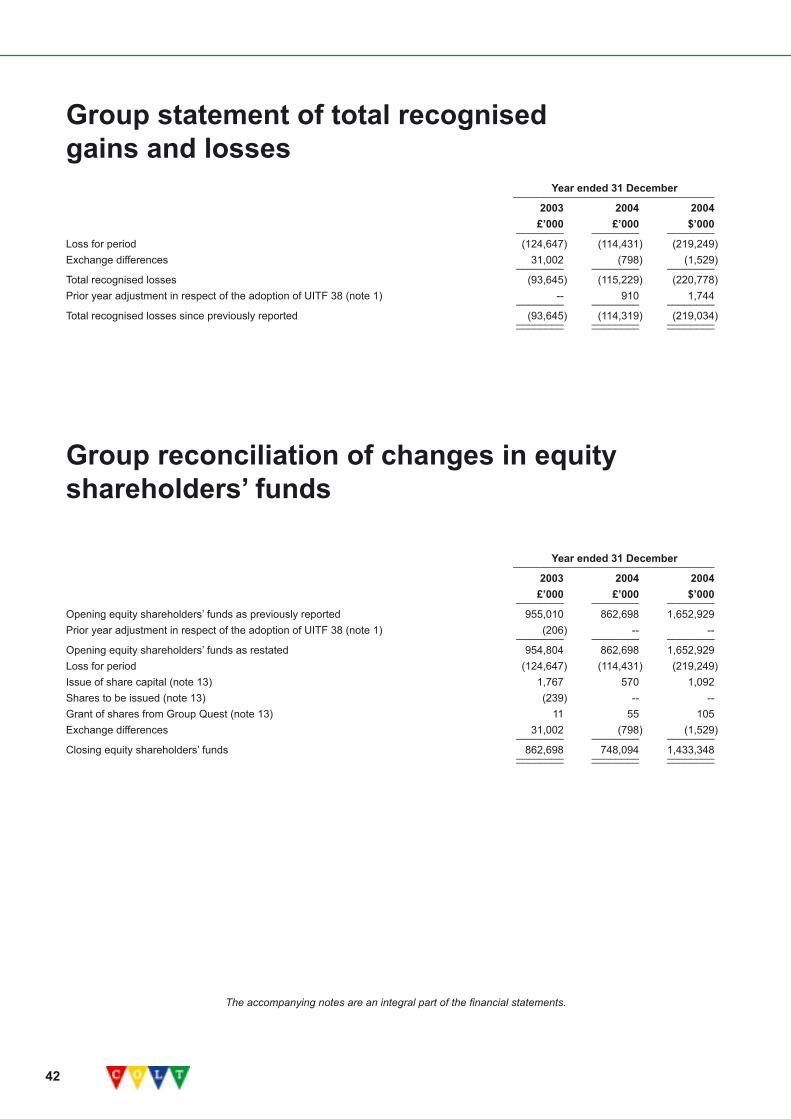
42
Year ended 31 December __________________________________ 2003 2004 2004 £’000 £’000 $’000 ________ ________ ________Loss for period (124,647) (114,431) (219,249)Exchange differences 31,002 (798) (1,529) ________ ________ ________Total recognised losses (93,645) (115,229) (220,778)Prior year adjustment in respect of the adoption of UITF 38 (note 1) -- 910 1,744 ________ ________ ________Total recognised losses since previously reported (93,645) (114,319) (219,034) ________ ________ ________ ________ ________ ________
Group reconciliation of changes in equity shareholders’ funds
Year ended 31 December __________________________________ 2003 2004 2004 £’000 £’000 $’000 ________ ________ ________Opening equity shareholders’ funds as previously reported 955,010 862,698 1,652,929 Prior year adjustment in respect of the adoption of UITF 38 (note 1) (206) -- -- ________ ________ ________Opening equity shareholders’ funds as restated 954,804 862,698 1,652,929 Loss for period (124,647) (114,431) (219,249)Issue of share capital (note 13) 1,767 570 1,092 Shares to be issued (note 13) (239) -- -- Grant of shares from Group Quest (note 13) 11 55 105 Exchange differences 31,002 (798) (1,529) ________ ________ ________Closing equity shareholders’ funds 862,698 748,094 1,433,348 ________ ________ ________ ________ ________ ________
Group statement of total recognised gains and losses
The accompanying notes are an integral part of the financial statements.

43
Financial statements
Group balance sheet
At 31 December _________________________________ Restated* 2003 2004 2004 Notes £’000 £’000 $’000 ________ ________ ________ ________Fixed assets Intangible fixed assets 10 9,493 7,317 14,019 Tangible fixed assets 11 1,344,285 1,253,502 2,401,710 ________ ________ ________Total fixed assets 1,353,778 1,260,819 2,415,729
Current assets Trade debtors 12 199,849 199,074 381,426 Prepaid expenses and other debtors 12 66,834 48,078 92,117 Investments in liquid resources 18 742,143 393,312 753,586 Cash at bank and in hand 18 60,239 59,404 113,818 ________ ________ ________Total current assets 1,069,065 699,868 1,340,947 ________ ________ ________Total assets 2,422,843 1,960,687 3,756,676 ________ ________ ________ ________ ________ ________
Capital and reserves 13 Called up share capital 37,754 37,778 72,383 Share premium 2,315,904 2,316,665 4,438,730 Merger reserve 27,359 27,359 52,420 Shares to be issued 215 -- -- Profit and loss account (1,518,534) (1,633,708) (3,130,185) ________ ________ ________Equity shareholders’ funds 862,698 748,094 1,433,348
Provisions for liabilities and charges 16 62,860 48,708 93,325
Creditors Amounts falling due within one year: Non-convertible debt 18 -- 81,692 156,522 Other 14 352,736 336,508 644,749 ________ ________ ________ Total amounts falling due within one year 352,736 418,200 801,271 ________ ________ ________ Amounts falling due after more than one year: 15 Convertible debt 700,131 382,320 732,525 Non-convertible debt 444,418 363,365 696,207 ________ ________ ________ Total amounts falling due after more than one year 1,144,549 745,685 1,428,732 ________ ________ ________Total creditors 1,497,285 1,163,885 2,230,003 ________ ________ ________Total liabilities, capital and reserves 2,422,843 1,960,687 3,756,676 ________ ________ ________ ________ ________ ________
* Restated as a result of the adoption of UITF 38 “Accounting for ESOP trusts” as disclosed in note 1
Approved by the Board of Directors on 23 February 2005 and signed on its behalf by:
Antony Bates, Chief Administrative and Financial Officer
The accompanying notes are an integral part of the financial statements.
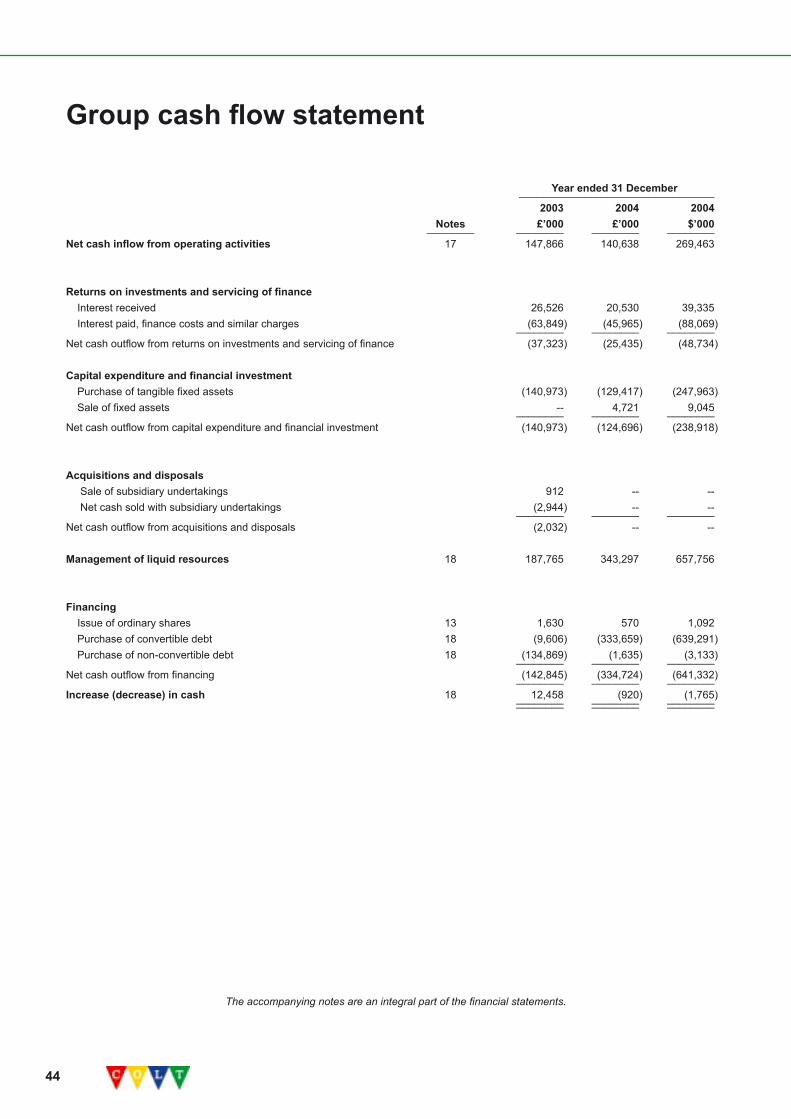
44
Group cash flow statement
Year ended 31 December _________________________________ 2003 2004 2004 Notes £’000 £’000 $’000 ________ ________ ________ ________Net cash inflow from operating activities 17 147,866 140,638 269,463
Returns on investments and servicing of finance Interest received 26,526 20,530 39,335 Interest paid, finance costs and similar charges (63,849) (45,965) (88,069) ________ ________ ________Net cash outflow from returns on investments and servicing of finance (37,323) (25,435) (48,734)
Capital expenditure and financial investment Purchase of tangible fixed assets (140,973) (129,417) (247,963) Sale of fixed assets -- 4,721 9,045 ________ ________ ________Net cash outflow from capital expenditure and financial investment (140,973) (124,696) (238,918)
Acquisitions and disposals Sale of subsidiary undertakings 912 -- -- Net cash sold with subsidiary undertakings (2,944) -- -- ________ ________ ________Net cash outflow from acquisitions and disposals (2,032) -- --
Management of liquid resources 18 187,765 343,297 657,756
Financing Issue of ordinary shares 13 1,630 570 1,092 Purchase of convertible debt 18 (9,606) (333,659) (639,291) Purchase of non-convertible debt 18 (134,869) (1,635) (3,133) ________ ________ ________Net cash outflow from financing (142,845) (334,724) (641,332) ________ ________ ________Increase (decrease) in cash 18 12,458 (920) (1,765) ________ ________ ________ ________ ________ ________
The accompanying notes are an integral part of the financial statements.

45
Financial statements
1. Basis of presentation and principal accounting policiesCOLT Telecom Group plc (“COLT” or the “Company”) together with its subsidiaries is referred to as the “Group”. The Group financial statements consolidate the financial statements of the Company and its subsidiaries up to 31 December 2004.
Accounting policies
The accounting policies and presentation applied are consistent with those applied in preparing the Group’s financial statements for the year ended 31 December 2003 except for the adoption of UITF 38 “Accounting for ESOP trusts”. Applying the UITF has resulted in the cost of own shares, previously reported as a fixed asset investment, being shown as a deduction from shareholders’ funds. A prior year adjustment has been made to reflect this change. The aggregate impact of this adjustment on the previously reported Balance Sheet as at 31 December 2002 and 2003 is to reduce Equity Shareholders’ funds by £0.2 million. In addition, £0.9 million has been included in the Statement of Total Recognised Gains and Losses being the amount charged to the Profit and Loss Account in prior years to write-down the carrying value of these shares. The adoption of UITF 38 has had no impact on the Profit and Loss Account in either 2003 or 2004.
As permitted by paragraph 3 (3) of Schedule 4 of the Companies Act 1985, the Directors have adapted the prescribed profit and loss format in a manner appropriate to the nature of the Group’s business.
Certain British pound amounts in the financial statements have been translated into U.S. dollars at 31 December 2004 and for the year then ended at the rate of $1.916 to the British pound, which was the noon buying rate in the City of New York for cable transfers in British pounds as certified for customs purposes by the Federal Reserve Bank on such date. Such translations should not be construed as representations that the British pound amounts have been or could be converted into U.S. dollars at that or any other rate.
Basis of accounting
The financial statements have been prepared in accordance with applicable Accounting Standards in the United Kingdom, under the historical cost convention.
The preparation of financial statements requires management to make estimates and assumptions that affect; reported amounts of assets and liabilities, disclosure and valuation of contingent assets and liabilities and the reported amounts of income and expenditure. Estimates are used principally when accounting for provisions for doubtful debts and the lengths of fixed asset lives. These estimates could differ from the actual results.
Turnover
Turnover represents amounts earned for services provided to customers (net of value added tax and inter-company revenue).
Contracted income invoiced in advance for fixed periods is recognised as turnover in the period of actual service provision. Turnover from installation and other up-front set-up activities is recognised in the same period as the related costs.
Turnover attributable to infrastructure sales in the form of indefeasible rights-of-use (“IRUs”) with characteristics which qualify the transaction as an outright sale, or transfer of title agreements, are recognised at the time of delivery and acceptance by the customer. Proceeds from the sale of infrastructure qualify as turnover where the infrastructure was designated as built for resale at the outset and where the associated costs of construction have been classified as inventory for future sale. Where the infrastructure was not designated for resale and was classified as tangible fixed assets, the proceeds from these infrastructure sales are recorded net of costs as a gain or loss on the disposal of a fixed asset.
Charges to customers for services provided through the Group network where the Group is deemed to be acting as agent are reported net of service providers’ charges to the Group.
Cost of sales
Cost of sales includes payments made to other carriers, depreciation of network infrastructure and equipment, direct network costs and construction costs associated with infrastructure sales.
Operating leases
Costs in respect of operating leases are charged on a straight-line basis over the lease term.
Goodwill
Goodwill arises on the purchase of subsidiary undertakings and represents the excess of the fair value of purchase consideration over the fair value of assets acquired. Goodwill arising on all acquisitions prior to 1 January 1998 was written off against reserves. Goodwill arising on all acquisitions since 1 January 1998 is capitalised in the year in which it arises and is amortised through the profit and loss account on a straight line basis over its useful economic life. Goodwill arising on the acquisition of ImagiNet is being amortised over 10 years (see note 10).

46
Tangible fixed assets
Tangible fixed assets are recorded at historical cost. Network infrastructure and equipment comprises assets purchased and built, at cost, together with capitalised labour which is directly attributable to the cost of construction.
Depreciation is calculated to write off the cost, less estimated residual values, of tangible fixed assets on a straight-line basis over their expected economic lives as follows:
Network infrastructure and equipment 5% - 20% per annum Office computers, equipment, fixtures and fittings and vehicles 10% - 33% per annum
Depreciation of network infrastructure and equipment commences from the date it becomes operational.
Impairment
Tangible and intangible fixed assets are reviewed for impairment whenever events or changes in circumstances indicate that carrying amounts may not be recoverable. An impairment loss is recognised to the extent that the carrying amount of an asset exceeds its recoverable amount (being the higher of its value in use and net realisable value).
Investments
The Company’s investments in subsidiaries are stated at cost less provision for impairment.
Licences
Annual amounts payable for telecommunications licences have been expensed as incurred.
Deferred taxation
Deferred tax is provided on all timing differences which result in an obligation at the balance sheet date, to pay more tax, or a right to pay less tax, at a future date, at rates that are expected to apply when the obligation crystallises, based on current tax rates and laws enacted or substantially enacted at the balance sheet date. Timing differences arise from the inclusion of items of income and expenditure in taxation computations in periods different from those in which they are included in the financial statements. Deferred tax assets and liabilities are recognised to the extent that it is regarded as more likely than not that they will be recovered in the foreseeable future. Deferred tax is measured on a non-discounted basis.
Property provisions
The Group provides for obligations relating to excess leased space in offices and ISCs. The provisions represent the net present value of the future estimated costs and the unwinding of the discount is included within the interest charge for the year.
Finance costs
Costs incurred raising debt finance are deducted from the amount raised and amortised over the life of the debt facility on a constant yield basis. Costs incurred in raising equity finance are deducted from the premium arising on the issue of shares.
Pension schemes
The Group operates a number of defined contribution pension schemes through its subsidiaries. Pension costs are charged to the profit and loss account on an accruals basis in the period in which contributions are payable to the schemes.
Foreign currencies and derivative financial instruments
Transactions denominated in foreign currencies are translated at the rate prevailing at the time of the transaction. Monetary assets and liabilities are translated at the period end rate. Exchange differences arising from the re-translation of the opening net assets of foreign subsidiaries, denominated in foreign currencies, and any related loans, together with the differences between profit and loss accounts translated at average rates and rates ruling at the period end are taken directly to reserves.
Translation differences on intra-Group currency loans and foreign currency borrowings to the extent that they are used to finance or hedge Group equity investments in foreign enterprises are taken directly to reserves together with the exchange differences on the carrying value of the related investments.
Forward exchange contracts are deemed hedges only where they relate to actual foreign currency assets and liabilities or commitments which have been identified and where they involve the same, or similar, currency as the hedged transaction and reduce the risk to the Group’s operations arising from foreign currency exchange movements. Gains and losses on forward exchange contracts deemed as hedges are deferred and included in the value of the related foreign currency transaction. No other derivative instruments are used by the Group.
All other exchange differences are taken to the profit and loss account.
Liquid resources
Liquid resources include surplus cash which is placed on short-term deposit which is disposable without curtailing or disrupting the business and are either readily convertible into known amounts of cash at or close to their carrying values or traded in an active market. At 31 December 2004 and 31 December 2003, all of the Group’s liquid resources comprised short-term money market deposits.

47
Financial statements
2. Segmental analysis
Factors used to identify reporting segments
The Group operates in a single business segment, telecommunications, and in geographical areas as shown below.
Country activities and local business are managed by local management teams. These local management teams are co-ordinated across the Group through a regional and functional organisational structure. During the year, the Directors considered the Group’s reportable segments to be North, South and Central. North Region comprised Belgium, Denmark, Ireland, The Netherlands, Sweden and the U.K. The Central Region comprised Austria, Germany and Switzerland. The South Region comprised France, Italy, Portugal and Spain. These reportable segments are expected to change during 2005 as a result of the reorganisation which was announced in late 2004.
Products and services within each reportable segment
Turnover from the single business segment is attributed within geographical areas and is classified as Switched, Non-switched, and Other. Turnover by destination is not materially different from turnover by origin. Switched turnover comprises services including the transmission of voice, data or video through a switching centre. Non-switched turnover includes managed and non-managed network and bandwidth services.
Turnover has also been classified by customer type with wholesale turnover comprising services to other telecommunications carriers, resellers and internet service providers (ISPs). Corporate turnover comprises services to corporates and governments.
Measurement of segment performance
Accounting policies adopted by the single business segment and for each geographical area are described in note 1. Management evaluates performance based upon profit or loss on ordinary activities before taxation and exceptional items.
Segmental analysis for the year ended 31 December 2004:
North Central South Corporate & Region Region Region eliminations Total _____________________Turnover £’000 £’000 £’000 £’000 £’000 $’000 ________ ________ ________ ________ ________ ________ Carrier 102,677 179,242 67,307 (85,135) 264,091 505,998 Non-carrier 134,377 244,040 104,595 -- 483,012 925,451 ________ ________ ________ ________ ________ ________ Total switched 237,054 423,282 171,902 (85,135) 747,103 1,431,449 Non-switched 181,177 184,116 142,547 (43,999) 463,841 888,719 Other 457 1,647 972 -- 3,076 5,894 Inter region turnover (45,250) (54,868) (29,016) 129,134 -- -- ________ ________ ________ ________ ________ ________ 373,438 554,177 286,405 -- 1,214,020 2,326,062 ________ ________ ________ ________ ________ ________ ________ ________ ________ ________ ________ ________Depreciation and amortisation 59,168 73,618 47,190 42,512 222,488 426,287 ________ ________ ________ ________ ________ ________ ________ ________ ________ ________ ________ ________Net interest (payable) receivable (60,487) (44,927) (24,713) 84,316 (45,811) (87,774) ________ ________ ________ ________ ________ ________ ________ ________ ________ ________ ________ ________Profit (loss) on ordinary activities before taxation and exceptional items (83,646) (34,308) (22,210) 25,528 (114,636) (219,643) ________ ________ ________ ________ ________ ________ ________ ________ ________ ________ ________ ________Profit (loss) on ordinary activities before taxation and after exceptional items (83,646) (34,308) (22,210) 25,733 (114,431) (219,249) ________ ________ ________ ________ ________ ________ ________ ________ ________ ________ ________ ________Expenditure on fixed assets 42,778 38,630 36,163 15,564 133,135 255,087 ________ ________ ________ ________ ________ ________ ________ ________ ________ ________ ________ ________Tangible fixed assets 334,312 517,565 388,848 12,777 1,253,502 2,401,710 ________ ________ ________ ________ ________ ________ ________ ________ ________ ________ ________ ________Total assets 424,641 630,368 486,458 419,220 1,960,687 3,756,676 ________ ________ ________ ________ ________ ________ ________ ________ ________ ________ ________ ________Equity shareholders’ funds 299,200 495,250 374,500 (420,856) 748,094 1,433,348 ________ ________ ________ ________ ________ ________ ________ ________ ________ ________ ________ ________
48
Segmental analysis for the year ended 31 December 2003:
North Central South Corporate & Region Region Region eliminations Total _____________________Turnover £’000 £’000 £’000 £’000 £’000 $’000 ________ ________ ________ ________ ________ ________ Carrier 96,473 146,500 69,134 (73,194) 238,913 457,757 Non-carrier 138,431 214,092 111,202 -- 463,725 888,497 ________ ________ ________ ________ ________ ________ Total switched 234,904 360,592 180,336 (73,194) 702,638 1,346,254 Non-switched 182,526 173,935 144,978 (39,035) 462,404 885,966 Other 82 742 584 (132) 1,276 2,445 Inter region turnover (44,910) (40,866) (26,585) 112,361 -- -- ________ ________ ________ ________ ________ ________ 372,602 494,403 299,313 -- 1,166,318 2,234,665 ________ ________ ________ ________ ________ ________ ________ ________ ________ ________ ________ ________Depreciation and amortisation 63,020 86,308 53,679 39,941 242,948 465,488 ________ ________ ________ ________ ________ ________ ________ ________ ________ ________ ________ ________Net interest (payable) receivable (43,263) (48,470) (38,731) 68,887 (61,577) (117,982) ________ ________ ________ ________ ________ ________ ________ ________ ________ ________ ________ ________Profit (loss) on ordinary activities before taxation and exceptional items (60,187) (52,472) (35,473) 13,443 (134,689) (258,064) ________ ________ ________ ________ ________ ________ ________ ________ ________ ________ ________ ________Profit (loss) on ordinary activities before taxation and after exceptional items (43,738) 45,963 (35,456) (91,416) (124,647) (238,823) ________ ________ ________ ________ ________ ________ ________ ________ ________ ________ ________ ________Expenditure on fixed assets 41,182 43,325 37,392 6,173 128,072 245,386 ________ ________ ________ ________ ________ ________ ________ ________ ________ ________ ________ ________Tangible fixed assets 359,749 564,994 408,349 11,193 1,344,285 2,575,650 ________ ________ ________ ________ ________ ________ ________ ________ ________ ________ ________ ________Total assets 458,642 674,196 523,144 766,861 2,422,843 4,642,167 ________ ________ ________ ________ ________ _______ ________ ________ ________ ________ ________ ________Equity shareholders’ funds 332,810 535,454 404,917 (410,483) 862,698 1,652,929 ________ ________ ________ ________ ________ ________ ________ ________ ________ ________ ________ ________
Segmental analysis by customer type for the year ended 31 December 2004:
Corporate Wholesale Total _____________________ £’000 £’000 £’000 $’000 ________ ________ ________ ________ Carrier -- 264,091 264,091 505,998 Non-carrier 336,064 146,948 483,012 925,451 ________ ________ ________ ________ Total switched 336,064 411,039 747,103 1,431,449 Non-switched 359,314 104,527 463,841 888,719 Other 2,963 113 3,076 5,894 ________ ________ ________ ________Total 698,341 515,679 1,214,020 2,326,062 ________ ________ ________ ________ ________ ________ ________ ________
Segmental analysis by customer type for the year ended 31 December 2003:
Corporate Wholesale Total _____________________ £’000 £’000 £’000 $’000 ________ ________ ________ ________ Carrier -- 238,913 238,913 457,757 Non-carrier 336,980 126,745 463,725 888,497 ________ ________ ________ ________ Total switched 336,980 365,658 702,638 1,346,254 Non-switched 354,794 107,610 462,404 885,966 Other 909 367 1,276 2,445 ________ ________ ________ ________Total 692,683 473,635 1,166,318 2,234,665 ________ ________ ________ ________ ________ ________ ________ ________

49
Financial statements
Loss on ordinary activities before taxation is stated after charging:
Year ended 31 December __________________________________ 2003 2004 2004 £’000 £’000 $’000 ________ ________ ________Employee costs (note 5) 224,085 208,496 399,478 Depreciation of tangible fixed assets 240,832 220,461 422,403 Amortisation of intangible fixed assets 2,116 2,027 3,884 Operating lease rentals - property 27,688 29,679 56,864 - other 68,164 73,045 139,954 Remuneration of auditors Statutory audit (Company £0.1 million (2003: £0.1 million)) 920 906 1,736 Non-statutory assurance services 88 235 451 Taxation services - compliance 194 176 337 - advisory 660 456 874 Other services 40 189 362
4. Directors’ emolumentsAggregate emoluments for Directors of COLT in the year were: Year ended 31 December __________________________________ 2003 2004 2004 £’000 £’000 $’000 ________ ________ ________Salaries, fees and bonuses 1,049 1,493 2,861 Other benefits 351 315 604 ________ ________ ________Aggregate emoluments 1,400 1,808 3,465 Pension contributions 36 71 136 ________ ________ ________ ________ ________ ________ 1,436 1,879 3,601 ________ ________ ________ ________ ________ ________
3. Loss on ordinary activities before taxation
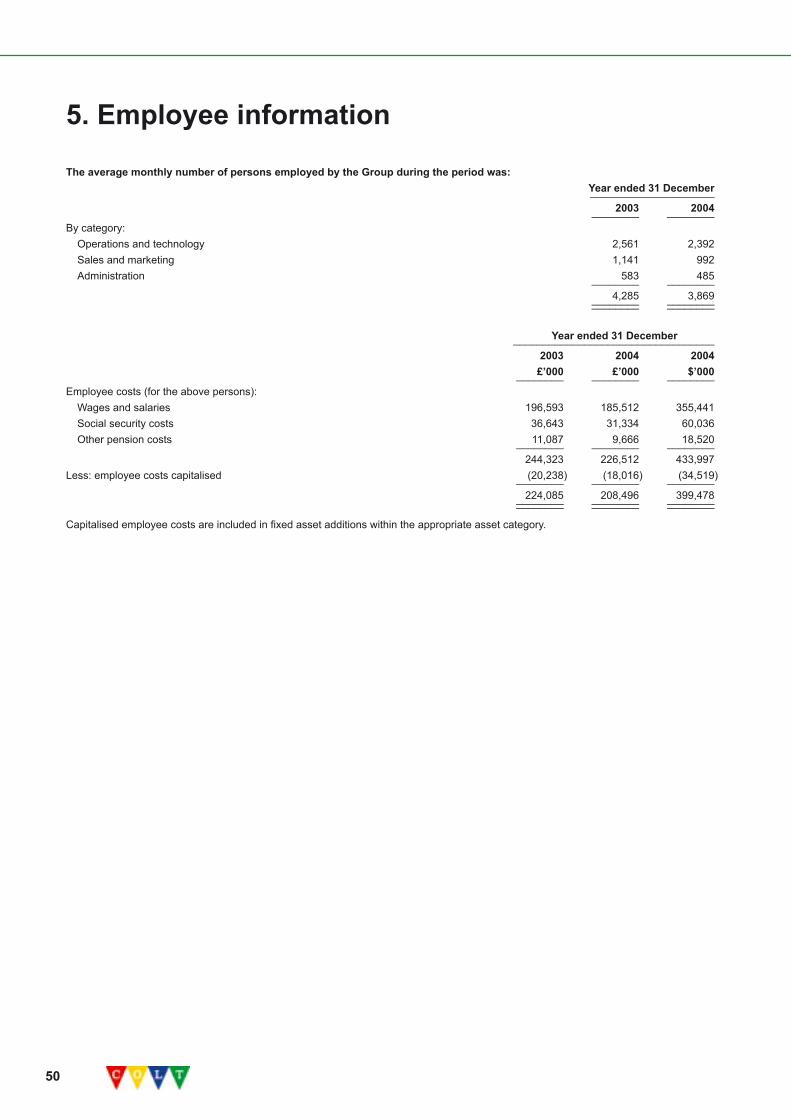
50
The average monthly number of persons employed by the Group during the period was: Year ended 31 December _____________________ 2003 2004 ________ ________By category: Operations and technology 2,561 2,392 Sales and marketing 1,141 992 Administration 583 485 ________ ________ 4,285 3,869 ________ ________ ________ ________
Year ended 31 December __________________________________ 2003 2004 2004 £’000 £’000 $’000 ________ ________ ________Employee costs (for the above persons): Wages and salaries 196,593 185,512 355,441 Social security costs 36,643 31,334 60,036 Other pension costs 11,087 9,666 18,520 ________ ________ ________ 244,323 226,512 433,997Less: employee costs capitalised (20,238) (18,016) (34,519) ________ ________ ________ 224,085 208,496 399,478 ________ ________ ________ ________ ________ ________
Capitalised employee costs are included in fixed asset additions within the appropriate asset category.
5. Employee information
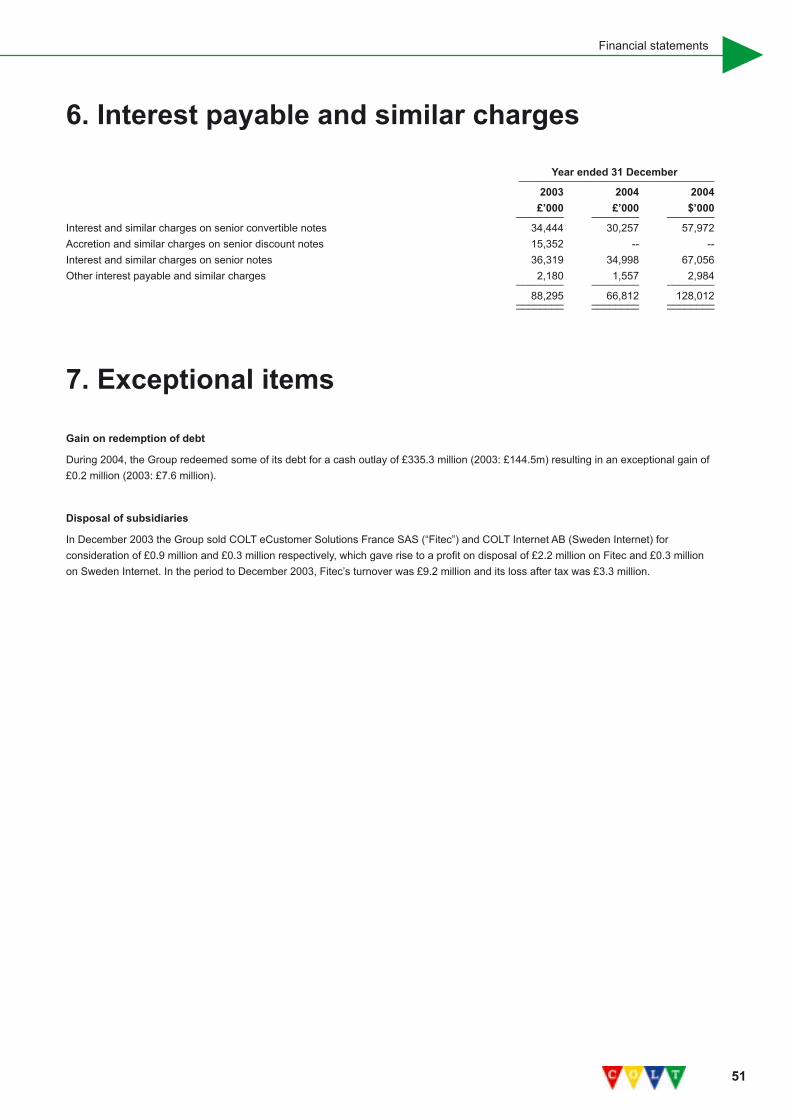
51
Financial statements
Year ended 31 December _________________________________ 2003 2004 2004 £’000 £’000 $’000 ________ ________ ________Interest and similar charges on senior convertible notes 34,444 30,257 57,972 Accretion and similar charges on senior discount notes 15,352 -- --Interest and similar charges on senior notes 36,319 34,998 67,056 Other interest payable and similar charges 2,180 1,557 2,984 ________ ________ ________ 88,295 66,812 128,012 ________ ________ ________ ________ ________ ________
7. Exceptional items
Gain on redemption of debt
During 2004, the Group redeemed some of its debt for a cash outlay of £335.3 million (2003: £144.5m) resulting in an exceptional gain of £0.2 million (2003: £7.6 million).
Disposal of subsidiaries
In December 2003 the Group sold COLT eCustomer Solutions France SAS (“Fitec”) and COLT Internet AB (Sweden Internet) for consideration of £0.9 million and £0.3 million respectively, which gave rise to a profit on disposal of £2.2 million on Fitec and £0.3 million on Sweden Internet. In the period to December 2003, Fitec’s turnover was £9.2 million and its loss after tax was £3.3 million.
6. Interest payable and similar charges

52
There is no tax charge arising in the years ended 31 December 2003 and 2004 as the Group had no taxable profits.
Net tax losses carried forward amounted to: At 31 December _________________________________ 2003 2004 2004 £’000 £’000 $’00 ________ ________ ________North Region 457,894 444,261 851,204Central Region 448,453 290,148 555,924South Region 112,812 123,728 237,063 ________ ________ ________ 1,019,159 858,137 1,644,191 ________ ________ ________ ________ ________ ________
These amounts are not time limited, but must be utilised in the country in which they arose. The losses carried forward remain subject to legislative provisions and to agreements with the various tax authorities in jurisdictions where the Group operates.
The tax losses in the Central region were reduced in the year as a result of a reorganisation of the Group’s German operations. The reorganisation generated a profit of £196.0 million which utilised existing tax losses in Germany. However, the reorganisation increased, for German tax purposes, the value of assets that are depreciable and will generate future tax deductions of a similar amount. This is reflected in the potential deferred tax asset “capital allowances less depreciation” below. No deferred tax asset has been recognised in the financial statements. The unprovided potential deferred tax asset is as follows:
At 31 December _________________________________ 2003 2004 2004 £’000 £’000 $’000 ________ ________ ________Capital allowances less depreciation (126,591) (201,271) (385,635)Short-term timing differences (22,971) (20,810) (39,872) ________ ________ ________Potential deferred tax asset (149,562) (222,081) (425,507)Add losses available (348,081) (299,257) (573,376) ________ ________ ________Total potential deferred tax asset after addition of losses (497,643) (521,338) (998,883) ________ ________ ________ ________ ________ ________
9. Loss per share
Basic loss per share is based upon the loss after tax for each period and the weighted average ordinary shares in issue in the period. All potential ordinary shares issuable have an anti-dilutive effect on basic loss per share for each financial year presented and therefore these potential shares have been excluded in the calculation of diluted loss per share.
Year ended 31 December _________________________________ 2003 2004 2004 £’000 £’000 $’000 ________ ________ ________Loss for period (124,647) (114,431) (219,249) ________ ________ ________ ________ ________ ________Weighted average ordinary shares issued (‘000) 1,507,771 1,510,853 1,510,853 ________ ________ ________ ________ ________ ________Basic and diluted loss per share £(0.08) £(0.08) $(0.15) ________ ________ ________ ________ ________ ________
8. Taxation
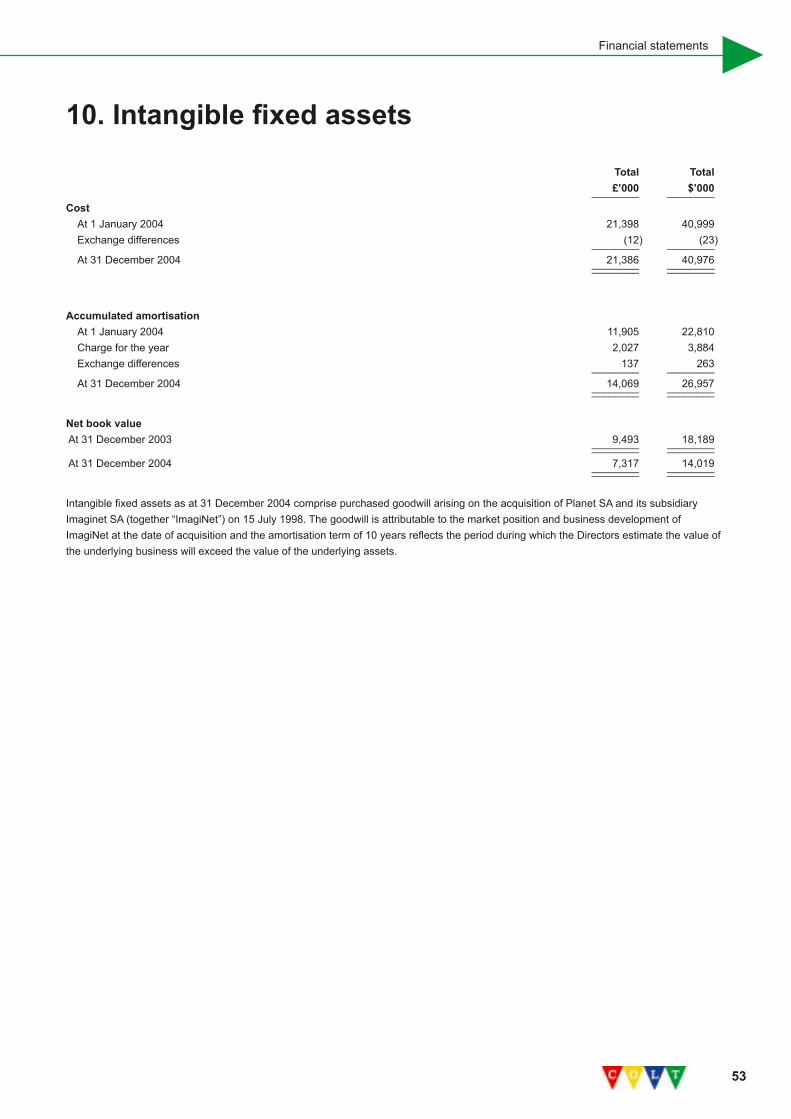
53
Financial statements
Total Total £’000 $’000 ________ ________Cost At 1 January 2004 21,398 40,999 Exchange differences (12) (23) ________ ________ At 31 December 2004 21,386 40,976 ________ ________ ________ ________
Accumulated amortisation At 1 January 2004 11,905 22,810 Charge for the year 2,027 3,884 Exchange differences 137 263 ________ ________ At 31 December 2004 14,069 26,957 ________ ________ ________ ________
Net book value At 31 December 2003 9,493 18,189 ________ ________ ________ ________ At 31 December 2004 7,317 14,019 ________ ________ ________ ________
Intangible fixed assets as at 31 December 2004 comprise purchased goodwill arising on the acquisition of Planet SA and its subsidiary Imaginet SA (together “ImagiNet”) on 15 July 1998. The goodwill is attributable to the market position and business development of ImagiNet at the date of acquisition and the amortisation term of 10 years reflects the period during which the Directors estimate the value of the underlying business will exceed the value of the underlying assets.
10. Intangible fixed assets
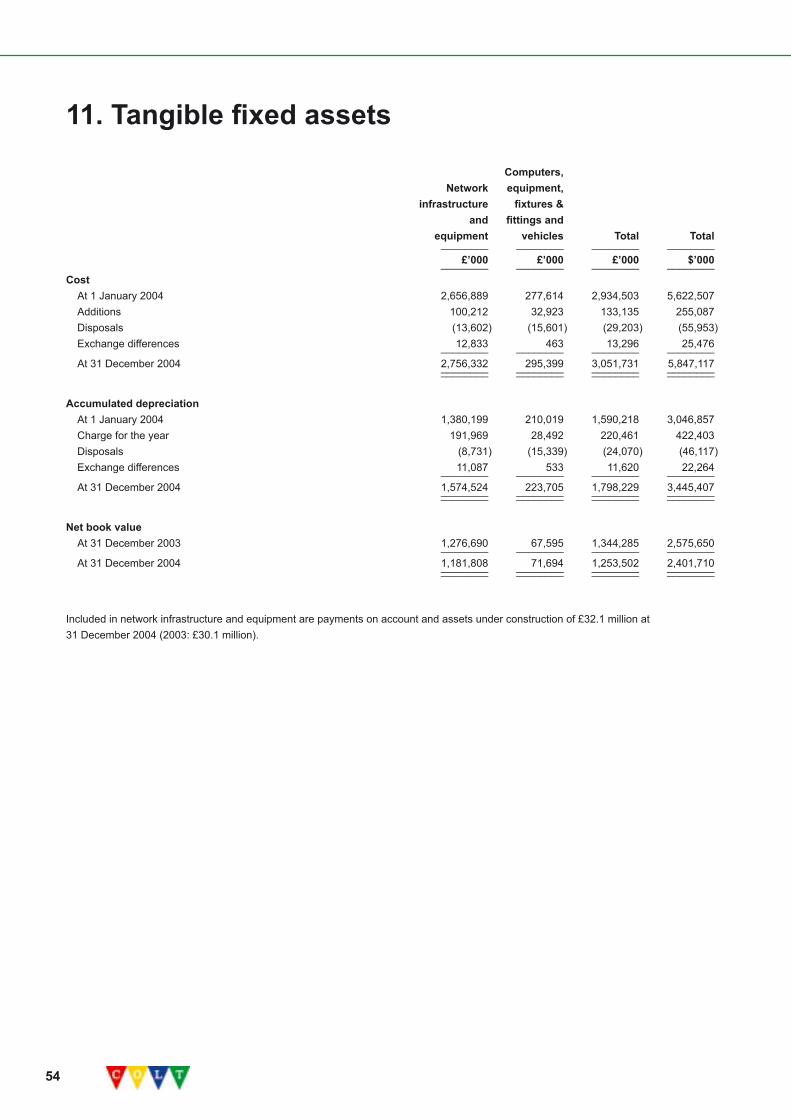
54
Computers, Network equipment, infrastructure fixtures & and fittings and equipment vehicles Total Total ________ ________ ________ ________ £’000 £’000 £’000 $’000 ________ ________ ________ ________Cost At 1 January 2004 2,656,889 277,614 2,934,503 5,622,507 Additions 100,212 32,923 133,135 255,087 Disposals (13,602) (15,601) (29,203) (55,953) Exchange differences 12,833 463 13,296 25,476 ________ ________ ________ ________ At 31 December 2004 2,756,332 295,399 3,051,731 5,847,117 ________ ________ ________ ________ ________ ________ ________ ________
Accumulated depreciation At 1 January 2004 1,380,199 210,019 1,590,218 3,046,857 Charge for the year 191,969 28,492 220,461 422,403 Disposals (8,731) (15,339) (24,070) (46,117) Exchange differences 11,087 533 11,620 22,264 ________ ________ ________ ________ At 31 December 2004 1,574,524 223,705 1,798,229 3,445,407 ________ ________ ________ ________ ________ ________ ________ ________
Net book value At 31 December 2003 1,276,690 67,595 1,344,285 2,575,650 ________ ________ ________ ________ At 31 December 2004 1,181,808 71,694 1,253,502 2,401,710 ________ ________ ________ ________ ________ ________ ________ ________
Included in network infrastructure and equipment are payments on account and assets under construction of £32.1 million at 31 December 2004 (2003: £30.1 million).
11. Tangible fixed assets
55
Financial statements
Trade debtors: At 31 December _________________________________ 2003 2004 2004 £’000 £’000 $’000 ________ ________ ________Trade debtors 245,235 235,698 451,598Provision against doubtful debts (45,386) (36,624) (70,172) ________ ________ ________ 199,849 199,074 381,426 ________ ________ ________ ________ ________ ________
Prepaid expenses and other debtors: At 31 December _________________________________ 2003 2004 2004 £’000 £’000 $’000 ________ ________ ________Other debtors 34,468 14,785 28,328Prepayments and accrued income 13,493 18,724 35,875VAT recoverable 18,873 14,569 27,914 ________ ________ ________ 66,834 48,078 92,117 ________ ________ ________ ________ ________ ________
12. Debtors - amounts falling due within one year
56
Restated Shares Profit Total Ordinary Share Share Merger to be and loss shareholders’ shares (i) capital premium reserve (ii) issued reserve (iii) funds No’000 £’000 £’000 £’000 £’000 £’000 £’000 ________ ________ ________ ________ ________ ________ ________At 1 January 2004 1,510,154 37,754 2,315,904 27,359 215 (1,518,534) 862,698 Shares issued in the year 975 24 546 -- -- -- 570 Shares to be issued -- -- 215 -- (215) -- -- Loss for period -- -- -- -- -- (114,431) (114,431) Exchange differences -- -- -- -- -- (798) (798) Grant of shares from Group Quest -- -- -- -- -- 55 55 ________ ________ ________ ________ ________ ________ ________At 31 December 2004 1,511,129 37,778 2,316,665 27,359 -- (1,633,708) 748,094 ________ ________ ________ ________ ________ ________ ________ ________ ________ ________ ________ ________ ________ ________At 31 December 2004 ($’000) 72,383 4,438,730 52,420 -- (3,130,185) 1,433,348 ________ ________ ________ ________ ________ ________ ________ ________ ________ ________ ________ ________
(i) Authorised share capital comprises 2,075,000,000 shares of 2.5p each.
(ii) The Group has taken merger relief under the provisions of section 131 of the Companies Act 1985 on shares issued in respect of prior year acquisitions. All premium on the issue of those shares has been taken directly to the merger reserve.
(iii) Cumulative goodwill relating to acquisitions made prior to 1 January 1998, which has been eliminated against reserves, amounted to £38.4 million (2003: £38.4 million).
Warrants
In December 1996, the Company issued US$314 million aggregate principal amount at maturity of senior discount notes in the form of 314,000 units, each unit consisting of one 12% senior discount note and one warrant to purchase 31.2 ordinary shares from the Company at an exercise price of £0.7563 per share. The warrants may be exercised at any time prior to the close of business on 31 December 2006. Warrants that are not exercised by such date will expire. In accordance with the terms of the warrants, following the completion of the Company’s sale of ordinary shares in December 2001, the number of shares underlying each outstanding warrant and the warrant exercise price were adjusted to 45.323 ordinary shares and £0.5206 per ordinary share, respectively. At 31 December 2004, warrants to purchase 881,770 (2003: 881,770) ordinary shares were outstanding. The Company has authorised and has reserved for issuance such number of ordinary shares as will be issuable upon the exercise of all outstanding warrants.
COLT Telecom Group Share Plan
The COLT Telecom Group Share Plan (the “Option Plan”) was adopted on 7 November 1996, for the issuance to key employees of the Group incentive compensation related to the public market performance of the Company’s ordinary shares. The Option Plan is divided into two parts; the “Approved Part” which is approved by the U.K. Inland Revenue for the purposes of the Income and Corporation Taxes Act 1988, and the “Unapproved Part” which is not so approved. Options may be granted by the Compensation Committee to Directors and employees of the Group under either part of the Option Plan. Individuals who provide services to COLT may also be permitted to participate in the Unapproved Part.
Options granted under the Approved Part will not normally be exercisable until the third anniversary of the date of grant. Options granted under the Unapproved Part may become exercisable earlier than the third anniversary. Options may be exercised early in certain circumstances, including on cessation of employment under special circumstances and on death. Otherwise, unless the Compensation Committee agrees otherwise, options lapse when an option holder ceases to be an employee. The Compensation Committee, at its discretion, may determine in connection with each grant of options, the terms of vesting and whether or not vesting will be accelerated upon a change of control event. Options are not transferable.
Option Plan awards are based on an employee’s level of responsibility, performance and term of service. Options will be granted at an option price which is not less than the market value of the ordinary shares on the date of grant and will normally only be granted within six weeks of the announcement of COLT’s results for any period. The grant of options to subscribe for new shares under each of the plans is limited so that new shares in respect of which options to subscribe are granted may not, when added to the shares issued or remaining issuable under any share option scheme, or issued under any share incentive scheme, in the previous 10 years, exceed 10% of the then issued equity share capital of the Company.
13. Capital and reserves

57
Financial statements
At 31 December 2004, options outstanding under the Option Plan, together with their exercise prices and dates, were as follows:
Date of Exercise Dates of Date of Number of ordinary shares under option _____________________________________________________grant price vesting expiration Granted Exercised Lapsed Outstanding________ ________ ______________ ___________ ___________ ___________ ___________ ___________Dec-96 £0.69 Dec 97 to Dec 01 Dec-06 25,824,000 12,744,036 6,939,964 6,140,000Jan-97 £0.78 Jan 98 to Jan 02 Jan-07 396,000 226,400 149,600 20,000Apr-97 £0.71 Apr 98 to Apr 02 Apr-07 1,280,000 675,000 377,600 227,400Aug-97 £0.96 Aug 98 to Aug 02 Aug-07 2,488,000 726,000 933,200 828,800Nov-97 £1.29 Nov 98 to Nov 02 Nov-07 3,196,000 1,418,362 1,158,038 619,600Dec-97 £1.70 Dec 98 to Dec 02 Dec-07 4,204,000 1,104,400 1,148,000 1,951,600Feb-98 £2.74 Feb 99 to Feb 03 Feb-08 140,000 56,000 84,000 --Feb-98 £2.74 Feb 99 to Feb 03 Feb-08 900,000 530,220 369,780 --May-98 £4.76 May 99 to May 03 May-08 830,000 207,750 340,000 282,250Aug-98 £6.60 Aug 99 to Aug 03 Aug-08 2,906,000 591,544 1,695,712 618,744Nov-98 £7.49 Nov 99 to Nov 03 Nov-08 1,408,075 113,215 980,400 314,460Dec-98 £7.88 Dec 99 to Dec 03 Dec-08 100,000 -- 100,000 --Mar-99 £11.30 Mar 00 to Mar 04 Mar-09 990,000 122,500 597,000 270,500Apr-99 £10.93 Apr 00 to Apr 04 Apr-09 1,000,000 150,000 850,000 --May-99 £12.25 May 00 to May 04 May-09 585,000 58,000 390,000 137,000Aug-99 £12.74 Aug 00 to Aug 04 Aug-09 930,000 15,000 659,000 256,000Nov-99 £21.00 Nov 00 to Nov 04 Nov-09 800,500 -- 587,500 213,000Dec-99 £24.39 Dec 00 to Dec 04 Dec-09 740,000 -- 460,000 280,000Feb-00 £36.18 Feb 01 to Feb 05 Feb-10 745,000 -- 440,000 305,000May-00 £22.61 May 01 to May 05 May-10 792,500 -- 378,674 413,826Jun-00 £26.66 Jun 01 to Jun 05 Jun-10 846,000 -- 450,500 395,500Aug-00 £19.16 Aug 01 to Aug 05 Aug-10 1,181,500 -- 685,434 496,066Aug-00 £17.73 Aug 01 to Aug 05 Aug-10 317,500 -- 161,250 156,250Nov-00 £19.48 Nov 01 to Nov 05 Nov-10 800,000 -- 327,500 472,500Dec-00 £15.18 Dec 01 to Dec 05 Dec-10 757,321 -- 327,702 429,619Feb-01 £13.37 Feb 02 to Feb 06 Feb-11 2,401,040 -- 1,568,792 832,248Feb-01 £20.06 Feb 02 to Feb 06 Feb-11 400,000 -- 400,000 --Feb-01 £26.74 Feb 02 to Feb 06 Feb-11 750,000 -- 750,000 --May-01 £8.44 May 02 to May 06 May-11 866,500 -- 588,500 278,000May-01 £12.66 May 02 to May 06 May-11 250,000 -- 250,000 --May-01 £16.87 May 02 to May 06 May-11 250,000 -- 250,000 --Jun-01 £7.10 Jun 02 to Jun 06 Jun-11 2,688,750 -- 1,179,000 1,509,750Aug-01 £3.22 Aug 02 to Aug 06 Aug-11 1,464,500 -- 953,500 511,000Nov-01 £1.72 Nov 02 to Nov 06 Nov-11 231,000 -- 26,000 205,000Dec-01 £1.56 Dec 02 to Dec 06 Dec-11 1,410,500 -- 390,500 1,020,000Feb-02 £0.41 Feb 03 to Feb 07 Feb-12 4,688,500 180,000 2,628,000 1,880,500May-02 £0.45 May 03 to May 07 May-12 72,500 6,000 51,500 15,000Jul-02 £0.48 Jul 03 to Jul 07 Jul-12 5,602,300 127,360 1,312,100 4,162,840Aug-02 £0.50 Aug 03 to Aug 07 Aug-12 250,000 -- -- 250,000Oct-02 £0.32 Oct 03 to Oct 07 Oct-12 250,000 50,000 180,000 20,000Nov-02 £0.44 Nov 03 to Nov 07 Nov-12 400,000 -- -- 400,000Mar-03 £0.41 Mar 04 to Mar 08 Mar-13 200,000 -- -- 200,000Apr-03 £0.46 Apr 04 to Apr 08 Apr-13 32,500 -- 20,000 12,500May-03 £0.47 May 04 to May 08 May-13 150,000 -- -- 150,000May-03 £0.49 May 04 to May 08 May-13 50,000 -- -- 50,000Jul-03 £0.77 Jul 06 to Jul 08 Jul-13 7,161,000 -- 1,107,000 6,054,000Oct-03 £1.01 Oct 06 to Oct 08 Oct-13 60,000 -- -- 60,000Feb-04 £1.13 Feb 07 to Feb 09 Feb-14 60,000 -- -- 60,000Apr-04 £0.84 Apr 07 to Apr 09 Apr-14 20,000 -- -- 20,000May-04 £0.77 May 07 to May 09 May-14 500,000 -- -- 500,000Jul-04 £0.42 Jul 07 to July 09 Jul-14 165,000 -- -- 165,000Aug-04 £0.38 Aug 07 Aug-14 6,392,500 -- 78,700 6,313,800Aug-04 £0.38 Aug 07 to Aug 09 Aug-14 800,000 -- -- 800,000Oct-04 £0.41 Oct 07 to Oct 09 Oct-14 1,210,000 -- -- 1,210,000 _____________________________________________________ Total 92,933,986 19,101,787 32,324,446 41,507,753 _____________________________________________________ _____________________________________________________
In addition to options granted under the Option Plan, further options to subscribe for 160,000 ordinary shares have been granted to certain Directors of the Company. At 31 December 2004 64,000 options had been exercised, 48,000 had lapsed and 48,000 remained exercisable. The outstanding options at 31 December 2004 vested in three tranches of 16,000 shares with exercise prices of £14.86, £29.00 and £8.50.
58
COLT Savings-Related Share Option Scheme
The COLT Savings-Related Share Option Scheme (the “SAYE Scheme”) was adopted on 17 June 1997, allowing for eligible employees to apply for an option to acquire ordinary shares under a three or four year savings contract. The aggregate monthly contribution payable by an employee under the savings contract may not exceed an amount established by the U.K. Inland Revenue for the purposes of the Income and Corporation Taxes Act 1988, currently £250 or the local currency equivalent. The option exercise price per ordinary share may not be less than the higher of (a) 80% of the average of the middle market quotations of an ordinary share for either three consecutive dealing days in the period of 30 days prior to the date of grant or the dealing day prior to the date on which the exercise price is set and (b) the nominal value of an ordinary share on the date of grant.
The Group has taken advantage of the exemption, provided by UITF 17 “Employee Share Schemes”, from charging the profit and loss account with the differences between fair value of the options on the date of grant and any consideration payable by the employees on exercise.
In normal circumstances, an option may only be exercised while the participant remains employed within the Group and then only during the six months starting at the date on which the savings contract matures. At the expiry of that period, the option will lapse. Earlier exercise is permitted in certain circumstances where the participant’s employment terminates or in the event of change of control, reorganisation or amalgamation of the Company. During the year ended 31 December 2004, 260,728 options with a maturity date of 1 March 2006 were exercised early. No other options were exercised during the year.
Options outstanding under the SAYE Scheme were as follows:
Number of options at 31 December 2004 ____________________________________ Exercise price Date of grant (£ per ordinary share) Date of Vesting Granted Outstanding ______________ __________________ ______________ ______________ ______________December 2001 1.615 March 2005 6,986,000 666,262December 2002 0.40 March 2006 18,410,000 13,759,505December 2003 1.027 March 2008 58,323* 58,323December 2003 0.995 March 2007 1,560,919 924,847December 2004 0.43 March 2009 202,330* 202,330December 2004 0.465 March 2008 3,737,658 3,737,658 ___________ ___________ 30,955,230 19,348,925 ___________ ___________ ___________ ___________
*Each option holder entered into a four year savings contract.
In March 2000, the Group established a QUEST to acquire, inter alia, shares in the Company to satisfy existing options granted under the Group’s SAYE Scheme. The shares held in the QUEST are expected to be utilised in full to part-satisfy the options granted in December 2002 under the SAYE Scheme. At 31 December 2004, the QUEST held 138,435 shares (2003: 270,559).
COLT Deferred Bonus Plan
The COLT Deferred Bonus Plan (the “Deferred Bonus Plan”) was adopted on 25 May 2000. Under this plan, selected senior employees will be entitled to receive an award of shares representing a proportion (initially expected to be 50%) of the amount of their annual cash bonus.
In October 2003, the rules were amended so that selected senior employees may be invited to defer all or a portion of their annual cash bonus and receive a matching award in the form of an option to acquire shares with a market value equal to half the amount of the deferred bonus. Receipt of the matching award is subject to the achievement of performance targets.
At 31 December 2004, share awards outstanding under the Deferred Bonus Plan, together with dates, were as follows:
Number of ordinary shares _____________________________________________________________Date of grant Date of vesting Granted Exercised Lapsed Outstanding________________ ________________ __________ __________ __________ __________Feb 01 Feb 04 to Feb 06 24,182 15,722 8,460 --Feb 04 Feb 07 156,519 -- 7,535 148,984Aug 04 Aug 07 250,000 -- -- 250,000Oct 04 Oct 07 50,000 -- -- 50,000
On 22 March 1999, an Employee Benefit Trust (“EBT”) was established. On 26 March 1999, the EBT purchased 440,000 ordinary shares at their nominal value of 2.5p each. On 13 December 2001, the EBT subscribed for its pro rata share of the Company’s offering, purchasing 104,144 ordinary shares at £0.62 per share. At 31 December 2004, the EBT held 211,380 shares (2003: 217,344).
59
Financial statements
At 31 December _________________________________ 2003 2004 2004 £’000 £’000 $’000 ________ ________ ________Trade creditors 91,184 86,136 165,037 Other taxation and social security 37,229 28,355 54,328 Other creditors 29,303 13,648 26,150 Accruals and deferred income 171,004 183,356 351,310 Interest accrual 12,592 11,709 22,434 Network infrastructure 11,424 13,304 25,490 ________ ________ ________ 352,736 336,508 644,749 ________ ________ ________ ________ ________ ________
15. Creditors - amounts falling due after more than one year At 31 December _________________________________ 2003 2004 2004 £’000 £’000 $’000 ________ ________ ________Repayable between one and two years Senior convertible notes 107,771 135,230 259,101 Repayable between two and three years Senior convertible notes 355,732 247,090 473,424 Repayable between three and four years Senior convertible notes 236,628 -- -- Senior notes 83,328 177,484 340,059 Repayable between four and five years Senior notes 176,791 185,881 356,148 Repayable in more than five years Senior notes 184,299 -- -- ________ ________ ________ 1,144,549 745,685 1,428,732 ________ ________ ________ ________ ________ ________
Senior Convertible Notes
1998 Senior Convertible Notes
In August 1998, COLT issued Deutschmark denominated senior convertible notes (“1998 Senior Convertible Notes”) in the initial principal amount of DM600.0 million. A total of £204.3 million was raised before issuance costs of £5.2 million. These costs were deducted from the principal amount of the 1998 Senior Convertible Notes and were charged to the profit and loss account over three years. The notes bore interest at the rate of 2% of the initial principal amount per annum, payable in cash annually beginning 6 August 1999. The 1998 Senior Convertible Notes would have matured on 6 August 2005 and any outstanding notes would then have been redeemed at a price of 117.907% of the initial principal amount. The notes were also redeemable at the option of the Company, in whole or in part, at any time on or after 6 August 2001 at an accreted principal amount plus any accrued interest. The accreted principal amount is that amount determined so as to provide a gross yield at redemption (including any accrued interest and any cash interest previously paid) of 4.25%. The 1998 Senior Convertible Notes were convertible at any time, at the option of the holder, unless previously redeemed, repurchased or cancelled, into ordinary shares of COLT. At issue, the conversion price of the notes was £9.3438 per ordinary share with a fixed exchange rate of DM2.9392 per £1.00. In accordance with the terms of the notes, following the completion of the Company’s sale of ordinary shares in December 2001, the conversion price of the notes was adjusted to £7.9039 per ordinary share with a fixed exchange rate of DM2.9392 per £1.00. The notes ranked pari passu in right of payment with all other unsubordinated unsecured indebtedness of the Company and were
14. Creditors - amounts falling due within one year
60
senior in right of payment to all subordinated indebtedness of the Company. On 31 December 2001, the 1998 Senior Convertible Notes were redenominated from Deutschmarks to Euros at a rate of DM1.95583 per €1.00. During 2004, DM32.0 million (2003: DM3.3 million) aggregate initial principal amount of the notes was purchased. On 19 October 2004, all of the outstanding 1998 Senior Convertible Notes were redeemed early at the accreted principal amount of the notes plus accrued coupon interest for a cash consideration of £95.3 million.
March 1999 Senior Convertible Notes
In March 1999, COLT issued Euro denominated senior convertible notes (“March 1999 Senior Convertible Notes”) in the initial principal amount of €295.0 million. A total of £199.6 million was raised before issuance costs of £5.1 million. These costs were deducted from the principal amount of the March 1999 Senior Convertible Notes and were charged to the profit and loss account over three years. The notes bore interest at the rate of 2% of the initial principal amount per annum, payable in cash annually beginning 29 March 2000. The March 1999 Senior Convertible Notes mature on 29 March 2006 and any outstanding notes will then be redeemed at a price of 117.907% of the initial principal amount. The notes are also redeemable at the option of the Company, in whole or in part, at any time on or after 29 March 2002 at an accreted principal amount plus any accrued interest. The accreted principal amount is that amount determined so as to provide a gross yield at redemption (including any accrued interest and any cash interest previously paid) of 4.25%. The March 1999 Senior Convertible Notes are convertible at any time, at the option of the holder, unless previously redeemed, repurchased or cancelled, into ordinary shares of COLT. At issue, the conversion price of the notes was £14.6460 per ordinary share with a fixed exchange rate of €1.4780 per £1.00. In accordance with the terms of the notes, following the completion of the Company’s sale of ordinary shares in December 2001, the conversion price of the notes was adjusted to £12.2351 per ordinary share with a fixed exchange rate of €1.4780 per £1.00. At 31 December 2004, 9,210,009 ordinary shares are reserved for issuance upon conversion of the March 1999 Senior Convertible Notes (2003: 9,210,009). The notes rank pari passu in right of payment to all unsubordinated unsecured indebtedness of the Company and are senior in right of payment to all subordinated indebtedness of the Company.
December 1999 Senior Convertible Notes
In December 1999, COLT issued Euro denominated senior convertible notes (“December 1999 Senior Convertible Notes”) in the initial principal amount of €368.0 million. A total of £230.4 million was raised before issuance costs of £9.3 million. These costs were deducted from the principal amount of the December 1999 Senior Convertible Notes and were charged to the profit and loss account over three years. The notes bore interest at the rate of 2% of the initial principal amount per annum, payable in cash annually beginning 16 December 2000. The December 1999 Senior Convertible Notes would have matured on 16 December 2006 and any outstanding notes would then have been redeemed at a price of 126.664% of the initial principal amount. The notes were also redeemable at the option of the Company, in whole or in part, at any time on or after 16 December 2002 at an accreted principal amount plus any accrued interest. The accreted principal amount is that amount determined so as to provide a gross yield at redemption (including any accrued interest and any cash interest previously paid) of 5.25%. The December 1999 Senior Convertible Notes are convertible at any time, at the option of the holder, unless previously redeemed, repurchased or cancelled, into ordinary shares of COLT. At issue, the conversion price of the notes was £35.5550 per ordinary share with a fixed exchange rate of €1.5974 per £1.00. In accordance with the terms of the notes, following the completion of the Company’s sale of ordinary shares in December 2001, the conversion price of the notes was adjusted to £30.0760 per ordinary share with a fixed exchange rate of €1.5974 per £1.00. The notes ranked pari passu in right of payment with all other unsubordinated unsecured indebtedness of the Company and were senior in right of payment to all subordinated indebtedness of the Company. During 2004, €2.0 million aggregate initial principal amount of the notes was purchased (2003: €3.6 million). On 19 October 2004, all of the outstanding December 1999 Senior Convertible Notes were redeemed early at the accreted principal amount of the notes plus accrued coupon interest for a cash consideration of £228.3 million.
2000 Senior Convertible Notes
In April 2000, COLT issued Euro denominated senior convertible notes (“2000 Senior Convertible Notes”) in the initial principal amount of €402.5 million. A total of £245.7 million was raised before issuance costs of £5.6 million. These costs were deducted from the principal amount of the 2000 Senior Convertible Notes and were charged to the profit and loss account over three years. The notes bear interest at the rate of 2% of the initial principal amount per annum, payable in cash annually beginning 3 April 2001. The 2000 Senior Convertible Notes mature on 3 April 2007 and any outstanding notes will then be redeemed at a price of 131.238% of the initial principal amount. The notes are also redeemable at the option of the Company, in whole or in part, at any time on or after 3 April 2003 at an accreted principal amount plus any accrued interest. The accreted principal amount is that amount determined so as to provide a gross yield at redemption (including any accrued interest and any cash interest previously paid) of 5.75%. The 2000 Senior Convertible Notes are convertible at any time, at the option of the holder, unless previously redeemed, repurchased or cancelled, into ordinary shares of COLT. At issue, the conversion price of the notes was £50.076 per ordinary share with a fixed exchange rate of €1.6372 per £1.00. In accordance with the terms of the notes, following the completion of the Company’s sale of ordinary shares in December 2001, the conversion price of the notes was adjusted to £42.3593 per ordinary share with a fixed exchange rate of €1.6372 per £1.00. During 2004, no initial principal amount of the notes was purchased (2003: €15.0 million). At 31 December 2004, 4,195,217 ordinary shares are reserved for issuance upon conversion of the
61
Financial statements
2000 Senior Convertible Notes (2003: 4,195,217). The notes rank pari passu in right of payment with all other unsubordinated unsecured indebtedness of the Company and are senior in right of payment to all subordinated indebtedness of the Company.
Senior notes
1997 Senior Notes
In November 1997, COLT issued Sterling and Deutschmark denominated senior notes (“1997 Senior Notes”) with aggregate principal amounts at maturity of £50.0 million and DM 150.0 million respectively. A total of £100.7 million was raised before issuance costs of £3.3 million. These costs were deducted from the principal amount of the 1997 Senior Notes and were charged to the profit and loss account over five years. The British pound notes bear interest at the rate of 10.125% per annum and the Deutschmark notes bear interest at 8.875% per annum, both payable semi-annually beginning 31 May 1998. The 1997 Senior Notes mature on 30 November 2007. The 1997 Senior Notes rank pari passu in right of payment with all other unsubordinated unsecured indebtedness of the Company and are senior in right of payment to all subordinated indebtedness of the Company. The 1997 Senior Notes are redeemable at the option of the Company, in whole or in part, at any time on or after 30 November 2002, initially at 105.0625% of their principal amount at maturity, plus accrued interest, in the case of the British pound notes and 104.4375% of their principal amount at maturity, plus accrued interest, in the case of the Deutschmark notes, declining in each case to 100% of their principal amount at maturity, plus accrued interest, on or after 30 November 2004. On 31 December 2001, the Deutschmark denominated 1997 Senior Notes were redenominated from Deutschmarks to Euros at a rate of DM1.95583 per €1.00. During 2004, DM 5,000,000 aggregate initial principal amount of the notes was purchased (2003: none purchased). At 31 December 2004, the 1997 Senior Notes were reclassified to “Creditors - Amounts falling due within one year” following the early redemption announcement on 14 December 2004. On 21 January 2005, all of the outstanding 1997 Notes were redeemed early at the principal amount of the notes of £80.9 million, plus accrued coupon interest of £1.1 million.
1998 Senior Notes
In July 1998, COLT issued Deutschmark denominated senior notes (“1998 Senior Notes”) with aggregate principal amount at maturity of DM600.0 million. A total of £204.3 million was raised before issuance costs of £5.9 million. These costs were deducted from the principal amount of the 1998 Senior Notes and were charged to the profit and loss account over five years. The 1998 Senior Notes bear interest at the rate of 7.625% per annum, payable semi-annually beginning 31 January 1999. The 1998 Senior Notes mature on 28 July 2008. The 1998 Senior Notes rank pari passu in right of payment with all other unsubordinated unsecured indebtedness of the Company and are senior in right of payment to all subordinated indebtedness of the Company. The 1998 Senior Notes are redeemable at the option of the Company, in whole or in part, at any time on or after 31 July 2003, initially at 103.8125% of their principal amount at maturity, plus accrued interest declining to 100% of their principal amount at maturity, plus accrued interest, on or after 31 July 2005. On 31 December 2001, the 1998 Senior Notes were redenominated from Deutschmarks to Euros at a rate of DM1.95583 per €1.00.
1999 Senior Notes
In December 1999, COLT issued Euro denominated senior notes (“1999 Senior Notes”) with aggregate principal amount at maturity of €320.0 million. A total of £200.3 million was raised before issuance costs of £4.8 million. These costs were deducted from the principal amount of the 1999 Senior Notes and are being charged to the profit and loss account over five years. The 1999 Senior Notes bear interest at the rate of 7.625% per annum, payable semi-annually beginning 15 June 2000. The 1999 Senior Notes mature on 15 December 2009. The 1999 Senior Notes rank pari passu in right of payment with all other unsubordinated unsecured indebtedness of the Company and are senior in right of payment to all subordinated indebtedness of the Company. The 1999 Senior Notes are redeemable at the option of the Company, in whole or in part, at any time on or after 15 December 2004, initially at 103.8125% of their principal amount at maturity, plus accrued interest declining to 100% of their principal amount at maturity, plus accrued interest, on or after 15 December 2007.
Fair value of financial instruments
The fair values of the Group’s financial instruments outstanding at 31 December 2004 are disclosed in note 21.
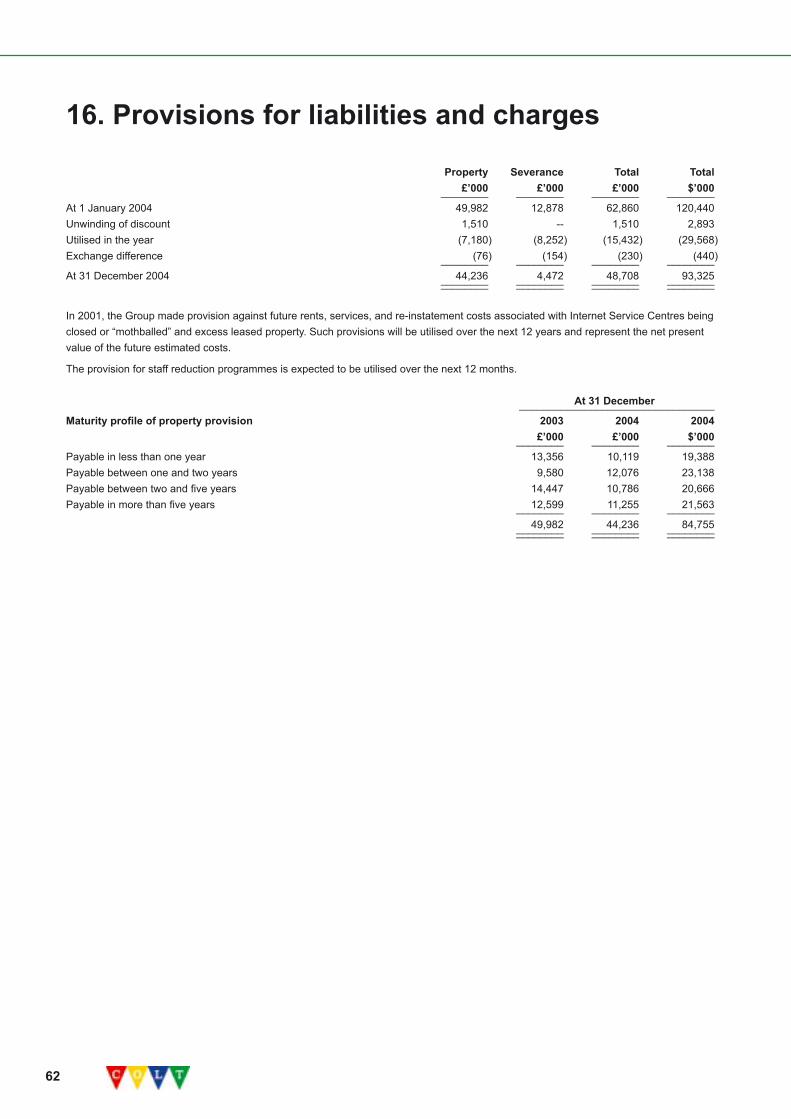
62
Property Severance Total Total £’000 £’000 £’000 $’000 ________ ________ ________ ________At 1 January 2004 49,982 12,878 62,860 120,440 Unwinding of discount 1,510 -- 1,510 2,893 Utilised in the year (7,180) (8,252) (15,432) (29,568)Exchange difference (76) (154) (230) (440) ________ ________ ________ ________At 31 December 2004 44,236 4,472 48,708 93,325 ________ ________ ________ ________ ________ ________ ________ ________
In 2001, the Group made provision against future rents, services, and re-instatement costs associated with Internet Service Centres being closed or “mothballed” and excess leased property. Such provisions will be utilised over the next 12 years and represent the net present value of the future estimated costs.
The provision for staff reduction programmes is expected to be utilised over the next 12 months.
At 31 December _________________________________Maturity profile of property provision 2003 2004 2004 £’000 £’000 $’000 ________ ________ ________Payable in less than one year 13,356 10,119 19,388 Payable between one and two years 9,580 12,076 23,138 Payable between two and five years 14,447 10,786 20,666 Payable in more than five years 12,599 11,255 21,563 ________ ________ ________ 49,982 44,236 84,755 ________ ________ ________ ________ ________ ________
16. Provisions for liabilities and charges
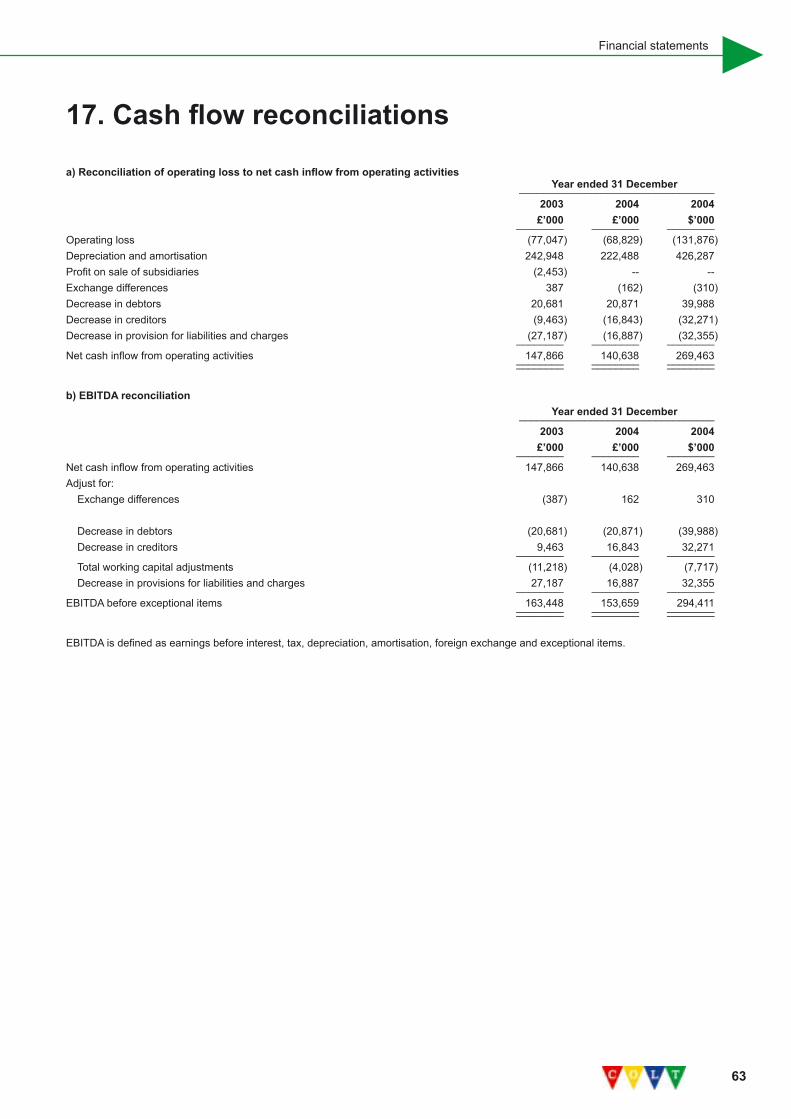
63
Financial statements
a) Reconciliation of operating loss to net cash inflow from operating activities Year ended 31 December _________________________________ 2003 2004 2004 £’000 £’000 $’000 ________ ________ ________Operating loss (77,047) (68,829) (131,876)Depreciation and amortisation 242,948 222,488 426,287 Profit on sale of subsidiaries (2,453) -- --Exchange differences 387 (162) (310)Decrease in debtors 20,681 20,871 39,988 Decrease in creditors (9,463) (16,843) (32,271)Decrease in provision for liabilities and charges (27,187) (16,887) (32,355) ________ ________ ________Net cash inflow from operating activities 147,866 140,638 269,463 ________ ________ ________ ________ ________ ________
b) EBITDA reconciliation Year ended 31 December _________________________________ 2003 2004 2004 £’000 £’000 $’000 ________ ________ ________Net cash inflow from operating activities 147,866 140,638 269,463Adjust for: Exchange differences (387) 162 310
Decrease in debtors (20,681) (20,871) (39,988) Decrease in creditors 9,463 16,843 32,271 ________ ________ ________ Total working capital adjustments (11,218) (4,028) (7,717) Decrease in provisions for liabilities and charges 27,187 16,887 32,355 ________ ________ ________EBITDA before exceptional items 163,448 153,659 294,411 ________ ________ ________ ________ ________ ________
EBITDA is defined as earnings before interest, tax, depreciation, amortisation, foreign exchange and exceptional items.
17. Cash flow reconciliations
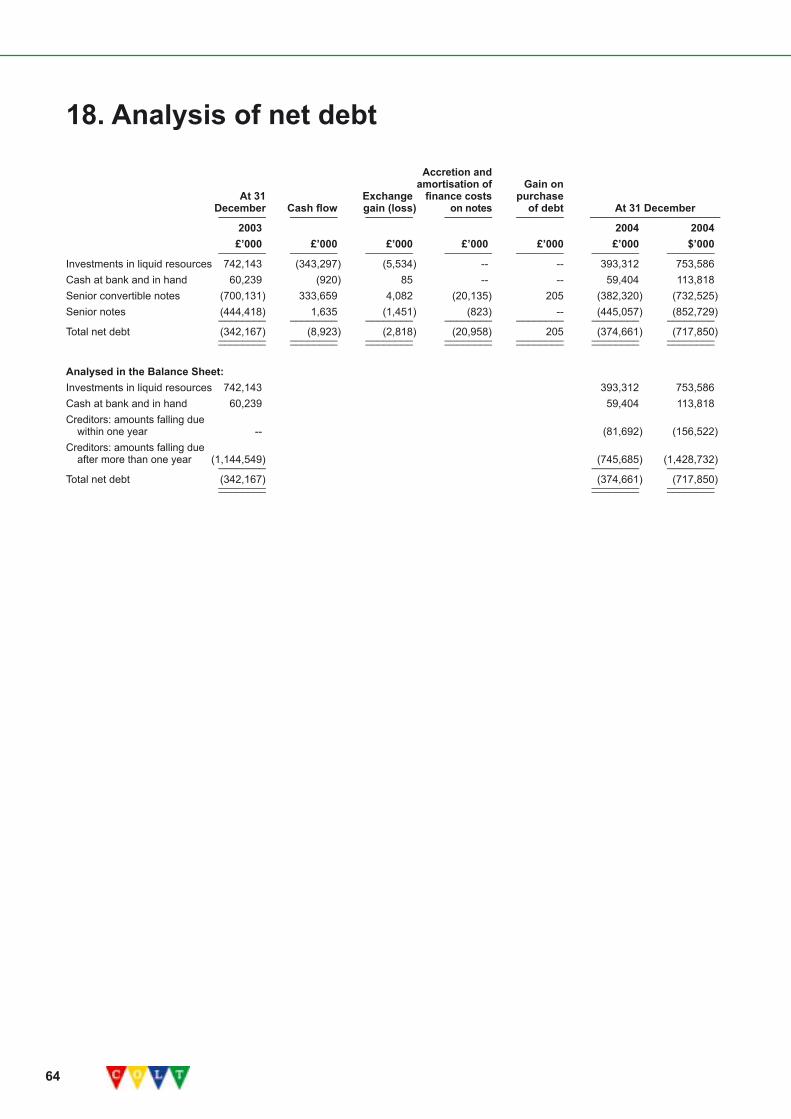
64
Accretion and amortisation of Gain on At 31 Exchange finance costs purchase December Cash flow gain (loss) on notes of debt At 31 December ________ ________ ________ ________ ________ ______________________ 2003 2004 2004 £’000 £’000 £’000 £’000 £’000 £’000 $’000 ________ ________ ________ ________ ________ ________ ________Investments in liquid resources 742,143 (343,297) (5,534) -- -- 393,312 753,586 Cash at bank and in hand 60,239 (920) 85 -- -- 59,404 113,818 Senior convertible notes (700,131) 333,659 4,082 (20,135) 205 (382,320) (732,525)Senior notes (444,418) 1,635 (1,451) (823) -- (445,057) (852,729) ________ ________ ________ ________ ________ ________ ________Total net debt (342,167) (8,923) (2,818) (20,958) 205 (374,661) (717,850) ________ ________ ________ ________ ________ ________ ________ ________ ________ ________ ________ ________ ________ ________
Analysed in the Balance Sheet:Investments in liquid resources 742,143 393,312 753,586 Cash at bank and in hand 60,239 59,404 113,818 Creditors: amounts falling due within one year -- (81,692) (156,522)Creditors: amounts falling due after more than one year (1,144,549) (745,685) (1,428,732) ________ ________ ________Total net debt (342,167) (374,661) (717,850) ________ ________ ________ ________ ________ ________
18. Analysis of net debt
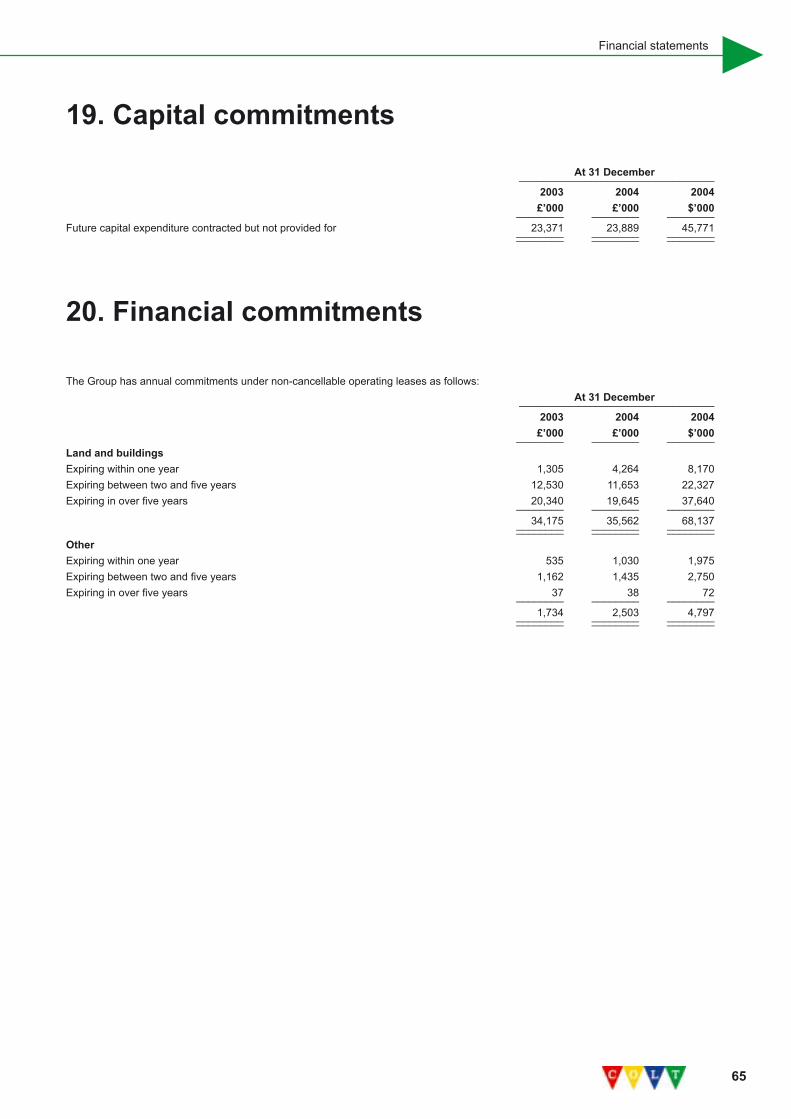
65
Financial statements
At 31 December _________________________________ 2003 2004 2004 £’000 £’000 $’000 ________ ________ ________Future capital expenditure contracted but not provided for 23,371 23,889 45,771 ________ ________ ________ ________ ________ ________
20. Financial commitments
The Group has annual commitments under non-cancellable operating leases as follows: At 31 December _________________________________ 2003 2004 2004 £’000 £’000 $’000 ________ ________ ________Land and buildingsExpiring within one year 1,305 4,264 8,170 Expiring between two and five years 12,530 11,653 22,327 Expiring in over five years 20,340 19,645 37,640 ________ ________ ________ 34,175 35,562 68,137 ________ ________ ________ ________ ________ ________OtherExpiring within one year 535 1,030 1,975 Expiring between two and five years 1,162 1,435 2,750 Expiring in over five years 37 38 72 ________ ________ ________ 1,734 2,503 4,797 ________ ________ ________ ________ ________ ________
19. Capital commitments
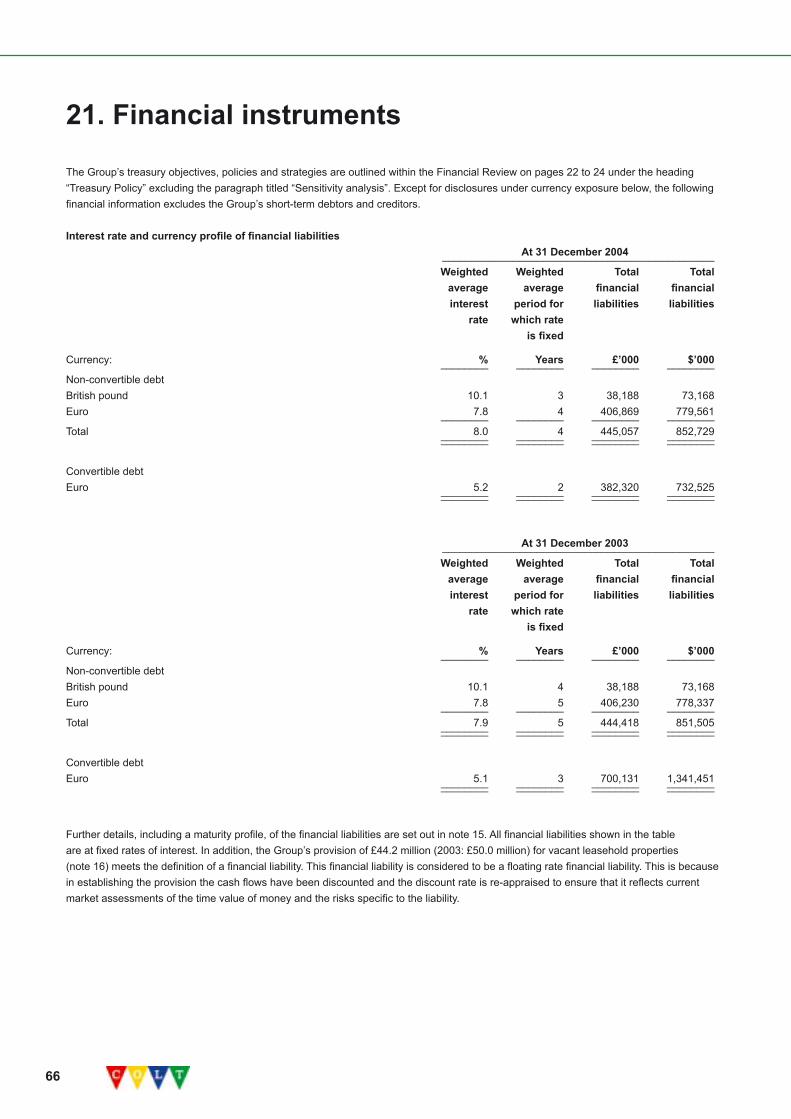
66
The Group’s treasury objectives, policies and strategies are outlined within the Financial Review on pages 22 to 24 under the heading “Treasury Policy” excluding the paragraph titled “Sensitivity analysis”. Except for disclosures under currency exposure below, the following financial information excludes the Group’s short-term debtors and creditors.
Interest rate and currency profile of financial liabilities At 31 December 2004 ______________________________________________ Weighted Weighted Total Total average average financial financial interest period for liabilities liabilities rate which rate is fixed
Currency: % Years £’000 $’000 ________ ________ ________ ________Non-convertible debtBritish pound 10.1 3 38,188 73,168 Euro 7.8 4 406,869 779,561 ________ ________ ________ ________Total 8.0 4 445,057 852,729 ________ ________ ________ ________ ________ ________ ________ ________
Convertible debtEuro 5.2 2 382,320 732,525 ________ ________ ________ ________ ________ ________ ________ ________
At 31 December 2003 ______________________________________________ Weighted Weighted Total Total average average financial financial interest period for liabilities liabilities rate which rate is fixed
Currency: % Years £’000 $’000 ________ ________ ________ ________Non-convertible debtBritish pound 10.1 4 38,188 73,168 Euro 7.8 5 406,230 778,337 ________ ________ ________ ________Total 7.9 5 444,418 851,505 ________ ________ ________ ________ ________ ________ ________ ________
Convertible debtEuro 5.1 3 700,131 1,341,451 ________ ________ ________ ________ ________ ________ ________ ________
Further details, including a maturity profile, of the financial liabilities are set out in note 15. All financial liabilities shown in the table are at fixed rates of interest. In addition, the Group’s provision of £44.2 million (2003: £50.0 million) for vacant leasehold properties (note 16) meets the definition of a financial liability. This financial liability is considered to be a floating rate financial liability. This is because in establishing the provision the cash flows have been discounted and the discount rate is re-appraised to ensure that it reflects current market assessments of the time value of money and the risks specific to the liability.
21. Financial instruments
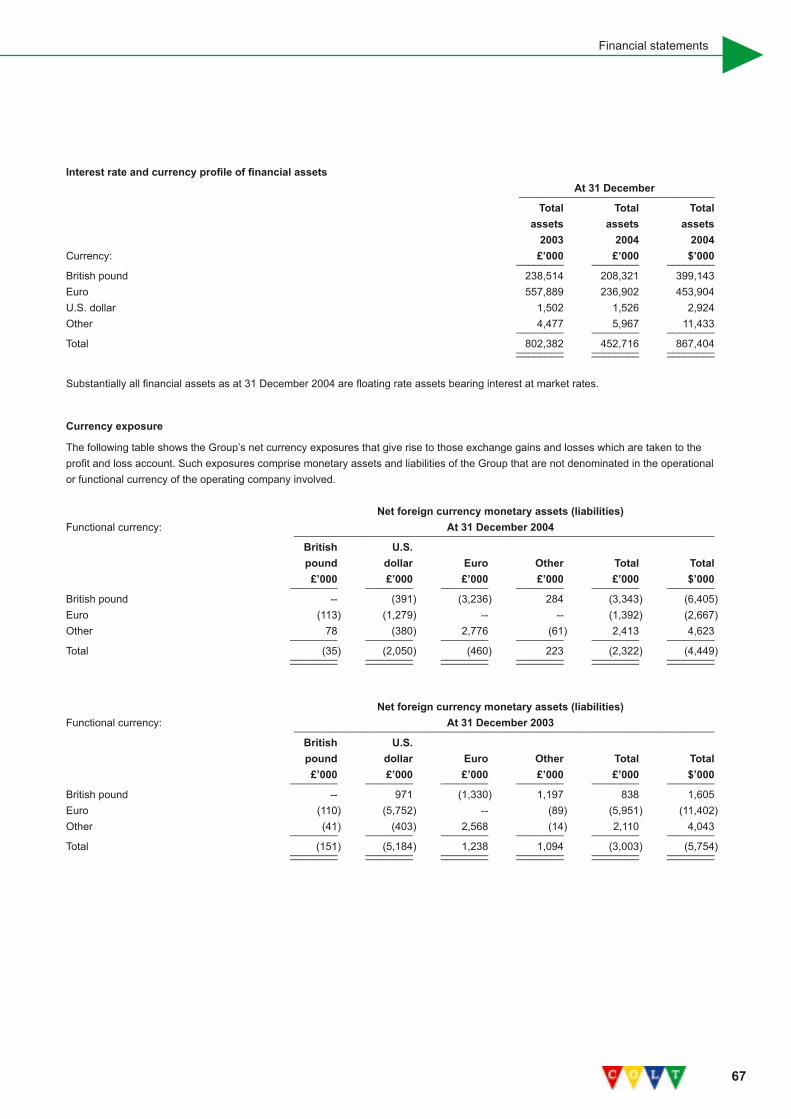
67
Financial statements
Interest rate and currency profile of financial assets At 31 December _________________________________ Total Total Total assets assets assets 2003 2004 2004 Currency: £’000 £’000 $’000 ________ ________ ________British pound 238,514 208,321 399,143Euro 557,889 236,902 453,904U.S. dollar 1,502 1,526 2,924Other 4,477 5,967 11,433 ________ ________ ________Total 802,382 452,716 867,404 ________ ________ ________ ________ ________ ________
Substantially all financial assets as at 31 December 2004 are floating rate assets bearing interest at market rates.
Currency exposure
The following table shows the Group’s net currency exposures that give rise to those exchange gains and losses which are taken to the profit and loss account. Such exposures comprise monetary assets and liabilities of the Group that are not denominated in the operational or functional currency of the operating company involved.
Net foreign currency monetary assets (liabilities)Functional currency: At 31 December 2004 __________________________________________________________________________ British U.S. pound dollar Euro Other Total Total £’000 £’000 £’000 £’000 £’000 $’000 ________ ________ ________ ________ ________ ________British pound -- (391) (3,236) 284 (3,343) (6,405)Euro (113) (1,279) -- -- (1,392) (2,667)Other 78 (380) 2,776 (61) 2,413 4,623 ________ ________ ________ ________ ________ ________Total (35) (2,050) (460) 223 (2,322) (4,449) ________ ________ ________ ________ ________ ________ ________ ________ ________ ________ ________ ________
Net foreign currency monetary assets (liabilities)Functional currency: At 31 December 2003 __________________________________________________________________________ British U.S. pound dollar Euro Other Total Total £’000 £’000 £’000 £’000 £’000 $’000 ________ ________ ________ ________ ________ ________British pound -- 971 (1,330) 1,197 838 1,605Euro (110) (5,752) -- (89) (5,951) (11,402)Other (41) (403) 2,568 (14) 2,110 4,043 ________ ________ ________ ________ ________ ________Total (151) (5,184) 1,238 1,094 (3,003) (5,754) ________ ________ ________ ________ ________ ________ ________ ________ ________ ________ ________ ________
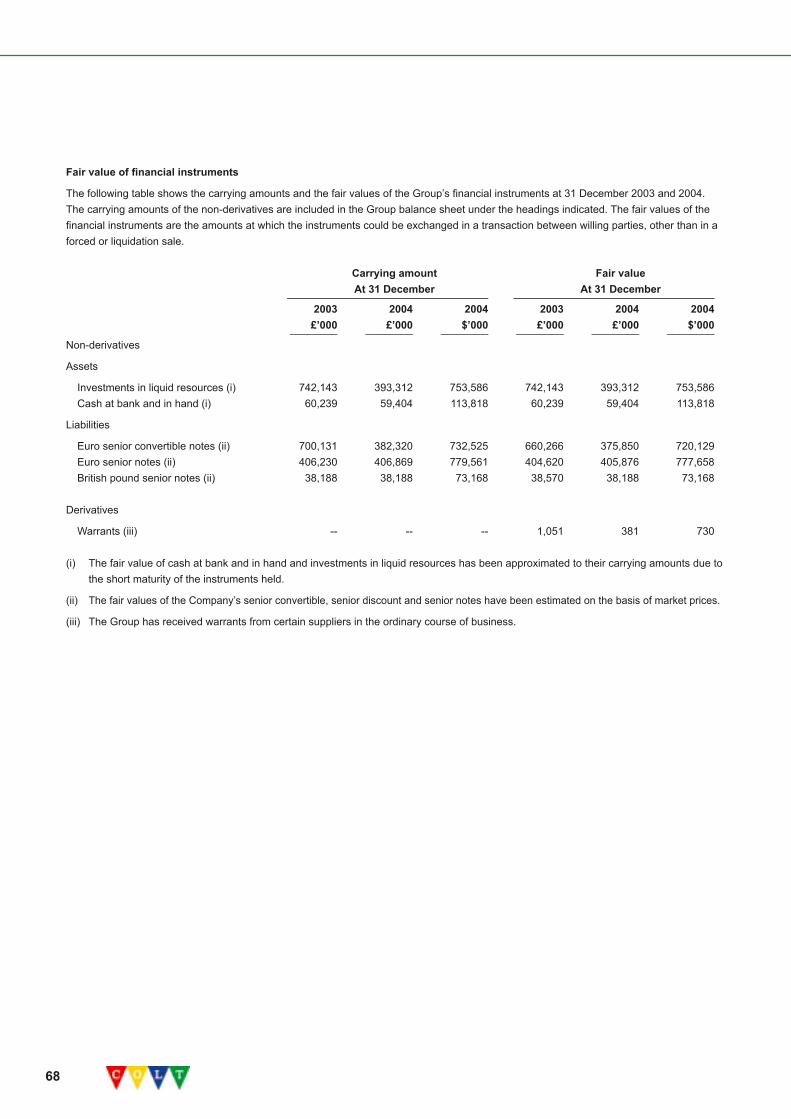
68
Fair value of financial instruments
The following table shows the carrying amounts and the fair values of the Group’s financial instruments at 31 December 2003 and 2004. The carrying amounts of the non-derivatives are included in the Group balance sheet under the headings indicated. The fair values of the financial instruments are the amounts at which the instruments could be exchanged in a transaction between willing parties, other than in a forced or liquidation sale.
Carrying amount Fair value At 31 December At 31 December ____________________________________ ____________________________________ 2003 2004 2004 2003 2004 2004 £’000 £’000 $’000 £’000 £’000 $’000 ________ ________ ________ ________ ________ ________Non-derivatives
Assets
Investments in liquid resources (i) 742,143 393,312 753,586 742,143 393,312 753,586 Cash at bank and in hand (i) 60,239 59,404 113,818 60,239 59,404 113,818
Liabilities
Euro senior convertible notes (ii) 700,131 382,320 732,525 660,266 375,850 720,129 Euro senior notes (ii) 406,230 406,869 779,561 404,620 405,876 777,658 British pound senior notes (ii) 38,188 38,188 73,168 38,570 38,188 73,168
Derivatives
Warrants (iii) -- -- -- 1,051 381 730
(i) The fair value of cash at bank and in hand and investments in liquid resources has been approximated to their carrying amounts due to the short maturity of the instruments held.
(ii) The fair values of the Company’s senior convertible, senior discount and senior notes have been estimated on the basis of market prices.
(iii) The Group has received warrants from certain suppliers in the ordinary course of business.
69
Financial statements
The Group operates a number of defined contribution pension schemes in its subsidiaries.
Pension costs are charged to the profit and loss account on an accruals basis in the period in which contributions are payable to the scheme. The pension cost for 2004 amounted to £9.7 million (2003: £11.1 million).
COLT Telecom AG, the Group’s Swiss operating company, entered into a pension scheme in December 2002. Under Swiss law, employees are guaranteed a minimum return on the assets of the scheme. COLT Telecom AG has an arrangement with a Switzerland based insurance company to insure the minimum commitment in full. If the insurance company was unable to meet the minimum guaranteed commitment, then COLT Telecom AG would be required to fund any deficit. The Directors consider the likelihood of such a situation arising as remote. At 31 December 2004, the pension scheme had assets and liabilities of £8.8 million (2003: £7.7 million) and prepaid contributions of £19,000 (2003: £30,000).
23. Transactions with related entities
The UK pension scheme is administered by Fidelity Pensions Management, a subsidiary of Fidelity Investments Management Limited (“FIML”), a wholly owned subsidiary of Fidelity International Limited (“FIL”). The fees for the above services for the year ended 31 December 2004 were £0.1 million (2003: £0.1 million).
The Group has certain agreements with Fidelity Capital Associates Inc. (“FCA”), a wholly owned subsidiary of FMR Corp., which allow under certain circumstances, for the Group to obtain consulting services from, or provide consulting services to, FCA. Compensation under the agreements is at prevailing market rates set each year.
Pursuant to a contract with the Group, certain FMR Corp. and FIL employees provide consulting and other services to the Group at agreed rates. The fees for these services for the year ended 31 December 2004 were approximately £1.9 million (2003: £1.9 million) for FMR employees and £1.1 million (2003: £1.1 million) for FIL employees. At 31 December 2004, there were creditor balances outstanding to FMR Corp. and FIC of £1.6 million (2003: £0.8 million), and £0.4 million (2003: £0.7 million) respectively.
An amount of £2.9 million was billed during 2004 to FIL for voice, data and eBusiness services (2003: £3.2 million). At 31 December 2004, there were balances outstanding from FIL of £0.6 million (2003: £0.7 million).
An amount of £2.9 million was billed during 2004 by Teranua, a 100% owned subsidiary of FMR Corp., for consultancy services (2003: £0.9 million). No balances were due to Teranua at 31 December 2004 (2003: £nil).
24. Post balance sheet events
On 21 January 2005, all of the outstanding £50.0 million 10.125% Senior Notes due 2007 and the DM150 million 8.875% Senior Notes due 2007 were redeemed. The redemptions were at the principal amount of the Notes and were funded out of COLT’s cash and liquid resources. The principal amount payable was £80.9 million.
22. Pension arrangements

70
At 31 December _________________________________ 2003 2004 2004 Notes £’000 £’000 $’000 ________ ________ ________ ________Fixed assets Tangible fixed assets b 17,149 24,977 47,856 Investments c 1,785,331 1,526,598 2,924,962 ________ ________ ________Total fixed assets 1,802,480 1,551,575 2,972,818
Current assets Prepaid expenses and other debtors d 5,923 3,592 6,882 Investments in liquid resources 237,349 204,085 391,027 Cash at bank and in hand 9 100 192 ________ ________ ________Total current assets 243,281 207,777 398,101 ________ ________ ________Total assets 2,045,761 1,759,352 3,370,919 ________ ________ ________ ________ ________ ________
Capital and reserves Called up share capital 37,754 37,778 72,383 Share premium 2,315,904 2,316,665 4,438,730 Merger reserve 27,359 27,359 52,420 Shares to be issued 215 -- -- Profit and loss account e (1,518,339) (1,483,469) (2,842,327) ________ ________ ________Equity shareholders’ funds 862,893 898,333 1,721,206
Provisions for liabilities and charges 4,401 4,760 9,120
Creditors Amounts falling due within one year: Non-convertible debt -- 81,692 156,522 Other f 33,918 28,882 55,339 ________ ________ ________ Total amounts falling due within one year 33,918 110,574 211,861 ________ ________ ________ Amounts falling due after more than one year: Convertible debt 700,131 382,320 732,525 Non-convertible debt 444,418 363,365 696,207 ________ ________ ________ Total amounts falling due after more than one year g 1,144,549 745,685 1,428,732 ________ ________ ________Total creditors 1,178,467 856,259 1,640,593 ________ ________ ________Total liabilities, capital and reserves 2,045,761 1,759,352 3,370,919 ________ ________ ________ ________ ________ ________
Approved by the Board of Directors on 23 February 2005 and signed on its behalf by:
Antony Bates, Chief Administrative and Financial Officer
25. Company balance sheet
71
Financial statements
Notes to the company balance sheet
a) Profit and Loss account
As permitted by Section 230 of the Companies Act of 1985, the parent company’s profit and loss account has not been included in these financial statements. The parent company’s profit for the period was £29.9 million (2003: loss of £174.7 million).
b) Tangible fixed assets Computers, equipment, fixtures & Systems fittings and under vehicles development Total Total £’000 £’000 £’000 $’000 ________ ________ ________ ________Cost At 1 January 2004 35,893 11,201 47,094 90,232 Additions 509 15,100 15,609 29,907 Transfers 11,259 (11,259) -- -- ________ ________ ________ ________ At 31 December 2004 47,661 15,042 62,703 120,139 ________ ________ ________ ________ ________ ________ ________ ________
Accumulated depreciation At 1 January 2004 29,945 -- 29,945 57,375 Charge for the year 7,781 -- 7,781 14,908 ________ ________ ________ ________ At 31 December 2004 37,726 -- 37,726 72,283 ________ ________ ________ ________ ________ ________ ________ ________
Net book value At 31 December 2003 5,948 11,201 17,149 32,857 ________ ________ ________ ________ At 31 December 2004 9,935 15,042 24,977 47,856 ________ ________ ________ ________ ________ ________ ________ ________
c) Investments £’000 $’000 ________ ________At 1 January 2004 1,785,331 3,420,694 Additions 61,749 118,311 Disposals (6,096) (11,680)Movement in long-term loans to subsidiaries (317,182) (607,721)Exchange difference 2,796 5,358 ________ ________At 31 December 2004 1,526,598 2,924,962 ________ ________ ________ ________
See note 27 for additional subsidiary information.
72
d) Prepaid expenses and other debtors At 31 December _________________________________ 2003 2004 2004 £’000 £’000 $’000 ________ ________ ________Prepayments 1,295 1,645 3,152 Other debtors 4,628 1,947 3,730 ________ ________ ________ 5,923 3,592 6,882 ________ ________ ________ ________ ________ ________
e) Profit and loss account £’000 $’000 ________ ________At 1 January 2004 (1,518,339) (2,909,137)Retained profit for the period 29,885 57,260 Exchange differences (including £3.7 million loss on net foreign currency borrowings) 4,985 9,550 ________ ________At 31 December 2004 (1,483,469) (2,842,327) ________ ________ ________ ________
f) Creditors - amounts falling due within one year At 31 December _________________________________ 2003 2004 2004 £’000 £’000 $’000 ________ ________ ________Accrued expenses 33,918 28,882 55,339 ________ ________ ________ ________ ________ ________
g) Creditors - amounts falling due after more than one year At 31 December _________________________________ 2003 2004 2004 £’000 £’000 $’000 ________ ________ ________
Repayable between one and two years Senior convertible notes 107,771 135,230 259,101 Repayable between two and three years Senior convertible notes 355,732 247,090 473,424 Repayable between three and four years Senior convertible notes 236,628 -- -- Senior notes 83,328 177,484 340,059 Repayable between four and five years Senior notes 176,791 185,881 356,148 Repayable in more than five years Senior notes 184,299 -- -- ________ ________ ________ 1,144,549 745,685 1,428,732 ________ ________ ________ ________ ________ ________
73
Financial statements
The consolidated financial statements have been prepared in accordance with U.K. GAAP and on the basis of presentation as set out in Note 1, which differs in certain respects from U.S. GAAP. The main differences between U.K. GAAP and U.S. GAAP which affect the Group’s consolidated net losses and net equity are set out below.
a) Effects of conforming to U.S. GAAP - impact on net loss At 31 December _________________________________ 2003 2004 2004 £’000 £’000 $’000 ________ ________ ________Loss for period under U.K. GAAP (124,647) (114,431) (219,249)U.S. GAAP adjustments: Amortisation of intangibles (i) (viii) 2,116 2,027 3,884 Capitalised interest, net of depreciation (ii) (3,082) (3,712) (7,112) Deferred compensation (i) (iii) (1,012) 337 646 Payroll taxes on employee share schemes (iv) 385 (385) (738) Profit on sale of IRUs (v) 1,044 1,044 2,000 Installation revenue (vi) 3,469 4,627 8,865 Direct costs attributable to installation revenue (vi) (4,231) -- -- Warrants (vii) 199 (670) (1,284) Impairment (ix) (11,221) (11,221) (21,499) ________ ________ ________Loss for period under U.S. GAAP before giving effect to the change in accounting policy (136,980) (122,384) (234,487)Cumulative effect on prior years of change in accounting policy -- (72,552) (139,010) ________ ________ ________Loss for period under U.S. GAAP (136,980) (194,936) (373,497) ________ ________ ________ ________ ________ ________Ordinary shares used in calculation of basic and diluted loss per share (‘000) 1,507,771 1,510,853 1,510,853 ________ ________ ________ ________ ________ ________Basic and diluted loss per share before giving effect to the change in accounting policy £ (0.09) £ (0.08) $ (0.16)Cumulative effect on prior years of change in accounting policy £ 0.00 £ (0.05) $ (0.09) ________ ________ ________Basic and diluted loss per share £ (0.09) £ (0.13) $ (0.25) ________ ________ ________ ________ ________ ________
(i) On 15 July 1998, the Group completed the acquisition of ImagiNet. A total of 1,395,292 ordinary shares were issued at completion. An additional 476,208 remained to be issued during 1999 and 2000 subject to certain criteria being met.
On 3 July 2001, the Group acquired all the share capital of Fitec. A total of 1,518,792 ordinary shares and 4,040,000 Euros was paid at completion with an additional 317,784 ordinary shares and 1,200,000 Euros paid over the two year period ended June 2003, subject to certain criteria being met.
Under U.K. GAAP, the deferred shares and payments have been included in the purchase consideration. The excess purchase consideration over the fair value of assets and liabilities acquired is attributed to goodwill and is being amortised over its estimated economic life.
Under U.S. GAAP these deferred shares and payments are excluded from the purchase consideration and recognised as compensation expense in the profit and loss accounts over the period in which the payments vest. The total compensation charge for 2004 was £nil (2003: £0.3 million). The goodwill which arose on acquisition for U.S. purposes was £13.3 million.
(ii) Under U.K. GAAP, the Group does not capitalise interest. Under U.S. GAAP, the estimated amount of interest incurred on capital projects is included in fixed assets and depreciated over the lives of the related assets.
(iii) The Group operates an Inland Revenue approved Savings-Related Share Option Scheme (“SAYE” Scheme). Under this scheme, options may be granted at a discount of up to 20%. Under U.K. GAAP no charge is taken in relation to the discount. Under U.S. GAAP, the difference between the market value of the shares on the date of grant and the price paid for the shares is charged as a compensation cost to the profit and loss account over the period over which the shares are earned.
26. Summary of differences between U.K. generally accepted accounting principles and U.S. generally accepted accounting principles (“GAAP”)

74
Also under U.S. GAAP, an employer’s offer to enter into a new SAYE contract at a lower price causes variable accounting for all existing awards subject to the offer. Variable accounting commences for all existing awards when the offer is made, and for those awards that are retained by employees because the offer is declined, variable accounting continues until the awards are exercised, are forfeited, or expire unexercised. New awards are accounted for as variable to the extent that the previous, higher priced options are cancelled.
The total expected compensation cost is recorded within equity shareholders’ funds as unearned compensation and additional paid in share capital respectively, with the compensation being charged to the profit and loss account over the vesting period. The compensation cost for the year ended 31 December 2004 under the SAYE scheme was a credit of £0.3 million (2003: charge of £0.7 million). At 31 December 2004 there were 1,844,978 variable SAYE options outstanding.
(iv) The Group operates a number of employee share schemes on which it incurs employer payroll taxes. Under U.K. GAAP, the cost of the employer taxes is recognised over the period from the date of grant to the end of the performance period. Under U.S. GAAP, the cost is recognised when the tax obligation arises.
(v) In 2000 and 2001, the Group concluded a number of infrastructure sales in the form of 20-year indefeasible rights-of-use (“IRU”) with characteristics, which qualify the transaction as outright sales for U.K. GAAP. Under U.S. GAAP these sales are treated as a 20 year operating lease. There were no infrastructure sales in 2004 or 2003 hence the adjustment represents the recognition of profit under U.S. GAAP on the sale of IRUs concluded in prior years.
(vi) Under U.K. GAAP, customer installation revenue is recognised in the same period as the related costs. Under U.S. GAAP, such installation revenue is recognised over the expected customer relationship period.
Under U.S. GAAP, the Group has historically applied a policy of also deferring attributable direct costs up to the level of associated revenue and recognising them over the customer relationship period. Effective 1 January 2004, the Group changed its accounting policy under U.S. GAAP to expensing these costs as incurred.
The Group has decided to change this accounting policy to reflect the way that the business is now being monitored and run by senior management. Additionally, the Group will be adopting IFRS from 1 January 2005. Under IFRS, only certain attributable directs costs are allowed to be deferred and the Group has elected that the best representation of its current business is to expense such costs.
The cumulative effect of the change on the opening retained earnings of £72.6 million has been recorded as a charge to the current year loss for the period under U.S. GAAP. The effect of the change in accounting policy for the current year is to increase the loss for the period under U.S. GAAP by £68.1 million (being the net of the impact on opening retained earnings of £72.6 million and the reduction in the amount of costs which would have been deferred under the old policy in 2004 of £4.5 million). The disclosure below reflects the pro forma impact on loss for the period, under U.S. GAAP, of the change in accounting policy assuming it had been applied retroactively in 2003 and 2004.
At 31 December __________________________________ 2003 2004 2004 £’000 £’000 $’000 ________ ________ ________
Loss for period under U.S. GAAP (132,749) (122,384) (234,487) ________ ________ ________ ________ ________ ________Basic and diluted loss per share £(0.09 ) £(0.08 ) $(0.16 ) ________ ________ ________ ________ ________ ________
(vii) The Group has received warrants from certain suppliers in the ordinary course of business. Under U.K. GAAP, warrants are treated as financial assets and recorded at the lower of cost or fair value. Hence for U.K. GAAP purposes the warrants have been recognised at £nil.
At 31 December 2000, under U.S. GAAP, the warrants were recorded at fair value with unrecognised gains included in “Other Comprehensive Income” within equity shareholders’ funds. As required by FAS 133 “Accounting for Derivative Instruments” (“FAS 133”), as amended by FAS 137 and FAS 138, which came into effect on 1 January 2001, the unrealised gain at 31 December 2000 and subsequent changes in fair value are now reflected in the profit and loss account.

75
Financial statements
(viii) The Group has adopted FAS 141 Business Combinations and FAS 142, Goodwill and Other Intangible Assets. FAS 142 states that goodwill and intangible assets with indefinite useful lives should not be amortised but should be tested for impairment annually. Goodwill on acquisitions made before 1 July 2001 continued to be amortised until 31 December 2001. Hence prior to 1 January 2002, the Group amortised the goodwill arising on the acquisition of ImagiNet over its useful economic life of 10 years.
The Group had unamortised goodwill of £8.5 million at December 2004, which is no longer amortised under U.S. GAAP but is assessed for impairment annually. Amortisation expense related to goodwill under U.K. GAAP was £2.0 million in 2004. The adjustment represents the writeback of this amortisation.
(ix) Under U.S. GAAP, long-lived assets are evaluated for impairment whenever events or changes in circumstances indicate that the carrying amount of a long-lived asset is not recoverable. On a regular basis, the undiscounted estimated future net cash flows associated with the asset are compared to the asset’s carrying amount to determine if an impairment has occurred. If such assets are deemed impaired, an impairment loss equal to the amount by which the carrying amount exceeds the fair value of the assets is recognised. If quoted market prices for the assets are not available, the fair value is calculated using the present value of estimated expected future net cash flows. The cash flow calculations are based on management’s best estimates, using appropriate assumptions and projections at the time.
During the third quarter of 2002, the Group recorded charges of £443.8 million under U.S. GAAP to reflect the impairment of goodwill, other intangible assets, network and non-network fixed assets, resulting in a GAAP difference of £107.2 million. The charge for the year ended 31 December 2004, represents the charge for depreciation in respect of the assets that had not been impaired for U.S. GAAP purposes.

76
b) Effects of conforming to U.S. GAAP - impact on net equity At 31 December _________________________________ Restated 2003 2004 2004 £’000 £’000 $’000 ________ ________ ________Equity shareholders’ funds under U.K. GAAP 862,698 748,094 1,433,348U.S. GAAP adjustments: Deferred compensation (i) (iii) (10,766) (10,429) (19,982) Unearned compensation (i) (iii) (1,510) (39) (75) Additional paid in share capital (i) (iii) 12,276 10,468 20,057 Amortisation of intangibles (i) (viii) 6,016 8,043 15,410 Warrants (vii) 1,051 381 730 Deferred profit on sale of IRUs (v) (17,723) (16,679) (31,957) Capitalised interest, net of depreciation (ii) 37,879 34,167 65,465 Impairment (ix) 93,169 81,948 157,012 Deferred profit on installations (vi) (762) -- -- Deferred installation revenue (vi) -- (68,687) (131,604) Payroll taxes on employee share schemes (iv) 385 -- -- ________ ________ ________Equity shareholders’ funds under U.S. GAAP (x) 982,713 787,267 1,508,404 ________ ________ ________ ________ ________ ________
(i) to (ix) see note (a) for description of adjustments.
(x) Under U.S. GAAP, shares held by employee share trusts are recorded in the balance sheet as a deduction from shareholders’ funds. Up to 31 December 2003, under U.K. GAAP, these shares were recorded as fixed asset investments. However, following the adoption of UTIF 38 “Accounting for ESOP Trusts” during 2004, these shares are now being shown as a deduction from shareholders’ funds under U.K. GAAP, with a prior year adjustment being made to the 2003 U.K. GAAP Balance Sheet. As a result of the prior year adjustment, the £0.2 million net equity reconciling item relating to shares held by employee share trusts in 2003 is no longer required. The net equity reconciliation at 31 December 2003 has been restated to reflect this.
c) Income taxes
Under U.K. GAAP, deferred income taxes are accounted for to the extent that it is considered probable that a liability or asset will materialise in the foreseeable future.
Under U.S. GAAP, deferred taxes are accounted for on all temporary differences between book income and tax income and a valuation allowance is established to reduce deferred tax assets to the amount which is more likely than not to be realised in future tax returns.The deferred tax asset is reconciled to the U.S. GAAP net deferred tax asset as follows:
At 31 December _________________________________ 2003 2004 2004 £’000 £’000 $’000 ________ ________ ________Deferred tax asset under U.K. GAAP -- -- --Tax effects of timing differences: Tax losses: North region 127,617 139,910 268,068 Central region 182,468 113,039 216,583 South region 37,996 46,308 88,726
Capital allowances and other timing differences 149,562 222,081 425,507 ________ ________ ________Gross deferred tax asset under U.S. GAAP 497,643 521,338 998,884Deferred tax valuation allowance (497,643) (521,338) (998,884) ________ ________ ________Net deferred tax asset under U.S. GAAP -- -- -- ________ ________ ________ ________ ________ ________No deferred tax asset has been recorded and there is no U.S. GAAP tax provision.
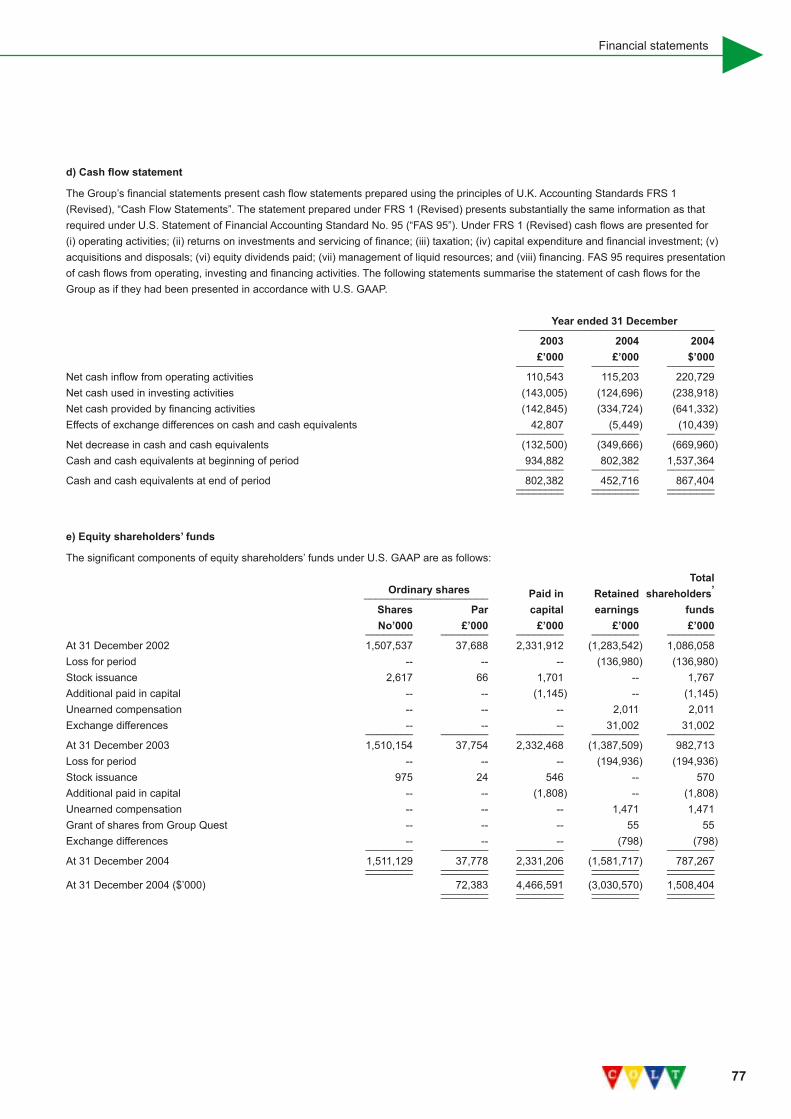
77
Financial statements
d) Cash flow statement
The Group’s financial statements present cash flow statements prepared using the principles of U.K. Accounting Standards FRS 1 (Revised), “Cash Flow Statements”. The statement prepared under FRS 1 (Revised) presents substantially the same information as that required under U.S. Statement of Financial Accounting Standard No. 95 (“FAS 95”). Under FRS 1 (Revised) cash flows are presented for (i) operating activities; (ii) returns on investments and servicing of finance; (iii) taxation; (iv) capital expenditure and financial investment; (v) acquisitions and disposals; (vi) equity dividends paid; (vii) management of liquid resources; and (viii) financing. FAS 95 requires presentation of cash flows from operating, investing and financing activities. The following statements summarise the statement of cash flows for the Group as if they had been presented in accordance with U.S. GAAP.
Year ended 31 December _________________________________ 2003 2004 2004 £’000 £’000 $’000 ________ ________ ________Net cash inflow from operating activities 110,543 115,203 220,729 Net cash used in investing activities (143,005) (124,696) (238,918)Net cash provided by financing activities (142,845) (334,724) (641,332)Effects of exchange differences on cash and cash equivalents 42,807 (5,449) (10,439) ________ ________ ________Net decrease in cash and cash equivalents (132,500) (349,666) (669,960)Cash and cash equivalents at beginning of period 934,882 802,382 1,537,364 ________ ________ ________Cash and cash equivalents at end of period 802,382 452,716 867,404 ________ ________ ________ ________ ________ ________
e) Equity shareholders’ funds
The significant components of equity shareholders’ funds under U.S. GAAP are as follows:
Total Ordinary shares Paid in Retained shareholders’ _____________________ Shares Par capital earnings funds No’000 £’000 £’000 £’000 £’000 ________ ________ ________ ________ ________At 31 December 2002 1,507,537 37,688 2,331,912 (1,283,542) 1,086,058Loss for period -- -- -- (136,980) (136,980)Stock issuance 2,617 66 1,701 -- 1,767Additional paid in capital -- -- (1,145) -- (1,145)Unearned compensation -- -- -- 2,011 2,011Exchange differences -- -- -- 31,002 31,002 ________ ________ ________ ________ ________At 31 December 2003 1,510,154 37,754 2,332,468 (1,387,509) 982,713Loss for period -- -- -- (194,936) (194,936)Stock issuance 975 24 546 -- 570Additional paid in capital -- -- (1,808) -- (1,808)Unearned compensation -- -- -- 1,471 1,471Grant of shares from Group Quest -- -- -- 55 55Exchange differences -- -- -- (798) (798) ________ ________ ________ ________ ________At 31 December 2004 1,511,129 37,778 2,331,206 (1,581,717) 787,267 ________ ________ ________ ________ ________ ________ ________ ________ ________ ________At 31 December 2004 ($’000) 72,383 4,466,591 (3,030,570) 1,508,404 ________ ________ ________ ________ ________ ________ ________ ________

78
f) Other disclosures
EBITDA
EBITDA consists of earnings (loss) before net interest expense, income taxes, depreciation, amortisation and foreign exchange gains or losses. EBITDA is a measure commonly used in the telecommunications industry and is presented to enhance the understanding of the Group’s operating results. EBITDA is not a measurement of financial performance under generally accepted accounting principles and may not be comparable to other similarly titled measures of other companies. EBITDA should not be considered as an alternative to operating or net income (as determined in accordance with generally accepted accounting principles) as an indicator of the Group’s performance, as an alternative to cash flows from operating activities (as determined in accordance with generally accepted accounting principles) or as a measure of liquidity.
New accounting standards
U.S. GAAP
In November 2004 the Financial Accounts Standards Board (“FASB”) issued Statement of Financial Accounting Standards (“SFAS”) 151, “Inventory Costs - an amendment of ARB No. 43, Chapter 4” (“SFAS 151”), which clarifies that abnormal amounts of idle facility expense, freight, handling costs, and wasted material (spoilage) should be recognized as a current period expense. In addition, this Statement requires that allocation of fixed production overhead to the costs of conversion be based on the normal capacity of the production facilities. SFAS 151 is effective for fiscal years beginning after June 15, 2005. Management does not believe that the implementation of this standard will have a material impact on the financial position, results of operations or cash flows.
In December 2004, the FASB issued SFAS 153 “Exchanges of Non-Monetary Assets - An Amendment to APB 29” (“SFAS 153”). APB 29 had stated that all exchanges of non-monetary assets should be recorded at fair value except in a number of situations, including where the exchange is in relation to similarly productive assets. SFAS 153 amends APB 29 to eliminate the exception for non-monetary exchanges of similar productive assets and replaces it with a general exception for exchanges for non-monetary assets that do not have commercial substance. A non-monetary transaction has commercial substance where the future cash flows of the business will be expected to change significantly as a result of the exchange. The provisions of this statement will be effective for non-monetary exchanges occurring in fiscal periods beginning after June 15, 2005. Management does not believe that the implementation of this standard will have a material impact on the financial position, results of operations or cash flows.
In December 2004, the FASB issued SFAS 123 (Revised) “Share Based Payments” (“SFAS 123(R)”), which required companies to expense the value of employee stock option schemes and similar awards based on the grant date fair value of the award. SFAS 123(R) eliminates the option to use APB 25’s intrinsic method of accounting for valuation of share options and similar awards as provided by SFAS 123 as originally issued. SFAS 123 (R) is effective for public companies for the interim period beginning after June 15 2005. Under the revised standard there are three transition methods available, the modified prospective model, the modified prospective model with restatement of prior interim results or the modified prospective model. Management is currently assessing the impact of this standard on the financial position, results of operations or cash flows.
In November 2004, the Task Force issued EITF Issue No, 03-13, “Applying the conditions in Paragraph 42 of SFAS 144 in Determining Whether to Report Discontinued Operations” (“EITF 03-13”), which provides an approach for evaluating whether the criteria in paragraph 42 of FAS 144 have been met for classifying as a discontinued operations a component of an entity that either has been disposed of or is classified as held for sale. EITF 03-13 is effective for fiscal periods beginning after December 15, 2004. Management does not believe that the implementation will have a material impact on the financial position, results of operations or cash flows.
In October 2004, the EITF issued EITF 04-10 “Determining whether to Aggregate Operating Segments that do not meet the Quantitative Thresholds” (“EITF 04-10”). EITF 04-10 states that operating segments, as defined by SFAS 131, “Disclosure about Segments of an Enterprise and Related Information,” (SFAS 131) that do not meet the quantitative thresholds within SFAS 131, can be aggregated only if aggregation is consistent with the objective and basic principles of SFAS 131, that the segments have similar economic characteristics, and the segments share a majority of the aggregation criteria listed in SFAS 131. EITF 04-10 will be effective when a new FASB Statement of Position being discussed on a related issue that will provide guidance in determining whether two or more operating segments have similar economic characteristics becomes effective, although early adoption is permitted. Management has assessed the impact of EITF 04-10 and believes the impact is not material.
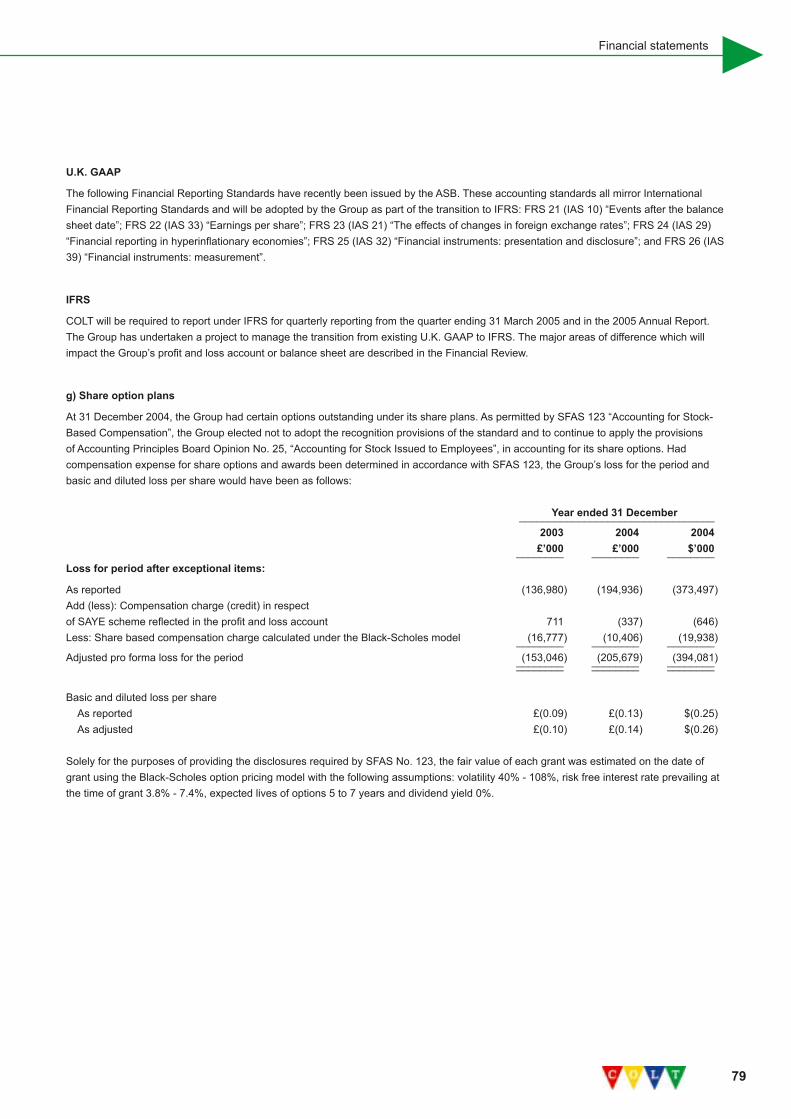
79
Financial statements
U.K. GAAP
The following Financial Reporting Standards have recently been issued by the ASB. These accounting standards all mirror International Financial Reporting Standards and will be adopted by the Group as part of the transition to IFRS: FRS 21 (IAS 10) “Events after the balance sheet date”; FRS 22 (IAS 33) “Earnings per share”; FRS 23 (IAS 21) “The effects of changes in foreign exchange rates”; FRS 24 (IAS 29) “Financial reporting in hyperinflationary economies”; FRS 25 (IAS 32) “Financial instruments: presentation and disclosure”; and FRS 26 (IAS 39) “Financial instruments: measurement”.
IFRS
COLT will be required to report under IFRS for quarterly reporting from the quarter ending 31 March 2005 and in the 2005 Annual Report. The Group has undertaken a project to manage the transition from existing U.K. GAAP to IFRS. The major areas of difference which will impact the Group’s profit and loss account or balance sheet are described in the Financial Review.
g) Share option plans
At 31 December 2004, the Group had certain options outstanding under its share plans. As permitted by SFAS 123 “Accounting for Stock-Based Compensation”, the Group elected not to adopt the recognition provisions of the standard and to continue to apply the provisions of Accounting Principles Board Opinion No. 25, “Accounting for Stock Issued to Employees”, in accounting for its share options. Had compensation expense for share options and awards been determined in accordance with SFAS 123, the Group’s loss for the period and basic and diluted loss per share would have been as follows:
Year ended 31 December _________________________________ 2003 2004 2004 £’000 £’000 $’000 ________ ________ ________Loss for period after exceptional items:
As reported (136,980) (194,936) (373,497)Add (less): Compensation charge (credit) in respect of SAYE scheme reflected in the profit and loss account 711 (337) (646)Less: Share based compensation charge calculated under the Black-Scholes model (16,777) (10,406) (19,938) ________ ________ ________Adjusted pro forma loss for the period (153,046) (205,679) (394,081) ________ ________ ________ ________ ________ ________
Basic and diluted loss per share As reported £(0.09) £(0.13) $(0.25) As adjusted £(0.10) £(0.14) $(0.26)
Solely for the purposes of providing the disclosures required by SFAS No. 123, the fair value of each grant was estimated on the date of grant using the Black-Scholes option pricing model with the following assumptions: volatility 40% - 108%, risk free interest rate prevailing at the time of grant 3.8% - 7.4%, expected lives of options 5 to 7 years and dividend yield 0%.
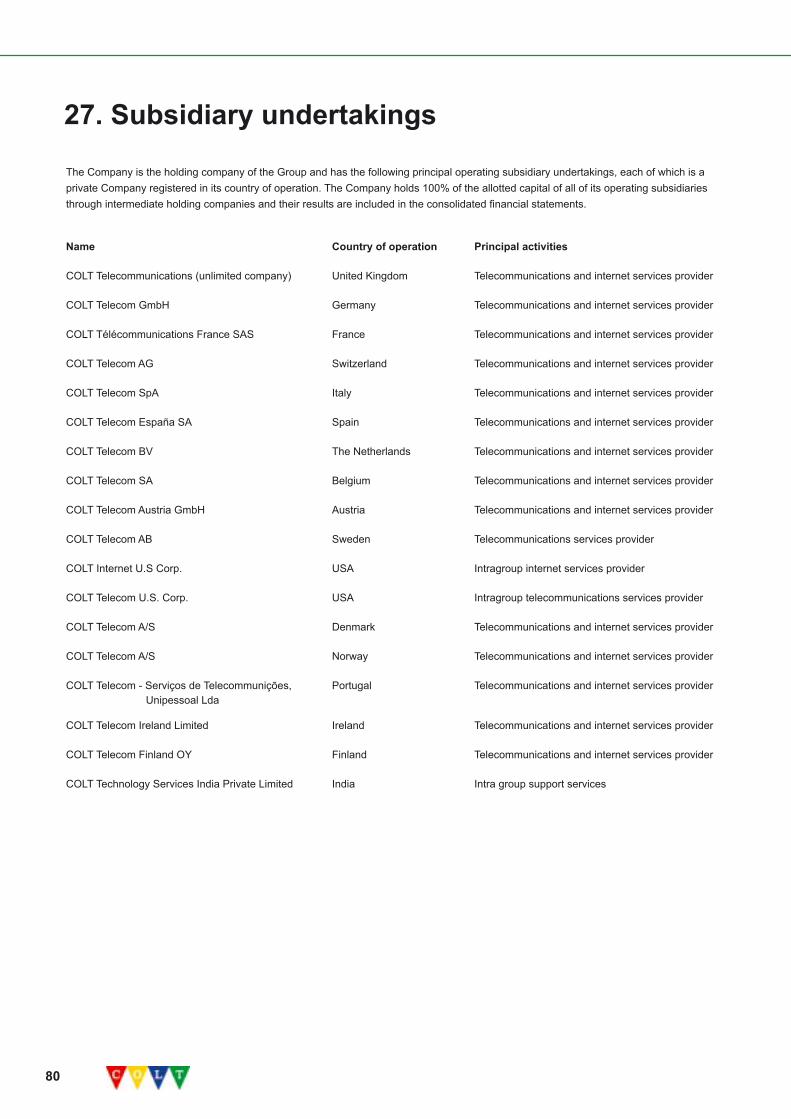
80
The Company is the holding company of the Group and has the following principal operating subsidiary undertakings, each of which is a private Company registered in its country of operation. The Company holds 100% of the allotted capital of all of its operating subsidiaries through intermediate holding companies and their results are included in the consolidated financial statements.
Name Country of operation Principal activities
COLT Telecommunications (unlimited company) United Kingdom Telecommunications and internet services provider
COLT Telecom GmbH Germany Telecommunications and internet services provider
COLT Télécommunications France SAS France Telecommunications and internet services provider
COLT Telecom AG Switzerland Telecommunications and internet services provider
COLT Telecom SpA Italy Telecommunications and internet services provider
COLT Telecom España SA Spain Telecommunications and internet services provider
COLT Telecom BV The Netherlands Telecommunications and internet services provider
COLT Telecom SA Belgium Telecommunications and internet services provider
COLT Telecom Austria GmbH Austria Telecommunications and internet services provider
COLT Telecom AB Sweden Telecommunications services provider
COLT Internet U.S Corp. USA Intragroup internet services provider
COLT Telecom U.S. Corp. USA Intragroup telecommunications services provider
COLT Telecom A/S Denmark Telecommunications and internet services provider
COLT Telecom A/S Norway Telecommunications and internet services provider
COLT Telecom - Serviços de Telecommunições, Portugal Telecommunications and internet services provider Unipessoal Lda
COLT Telecom Ireland Limited Ireland Telecommunications and internet services provider
COLT Telecom Finland OY Finland Telecommunications and internet services provider
COLT Technology Services India Private Limited India Intra group support services
27. Subsidiary undertakings
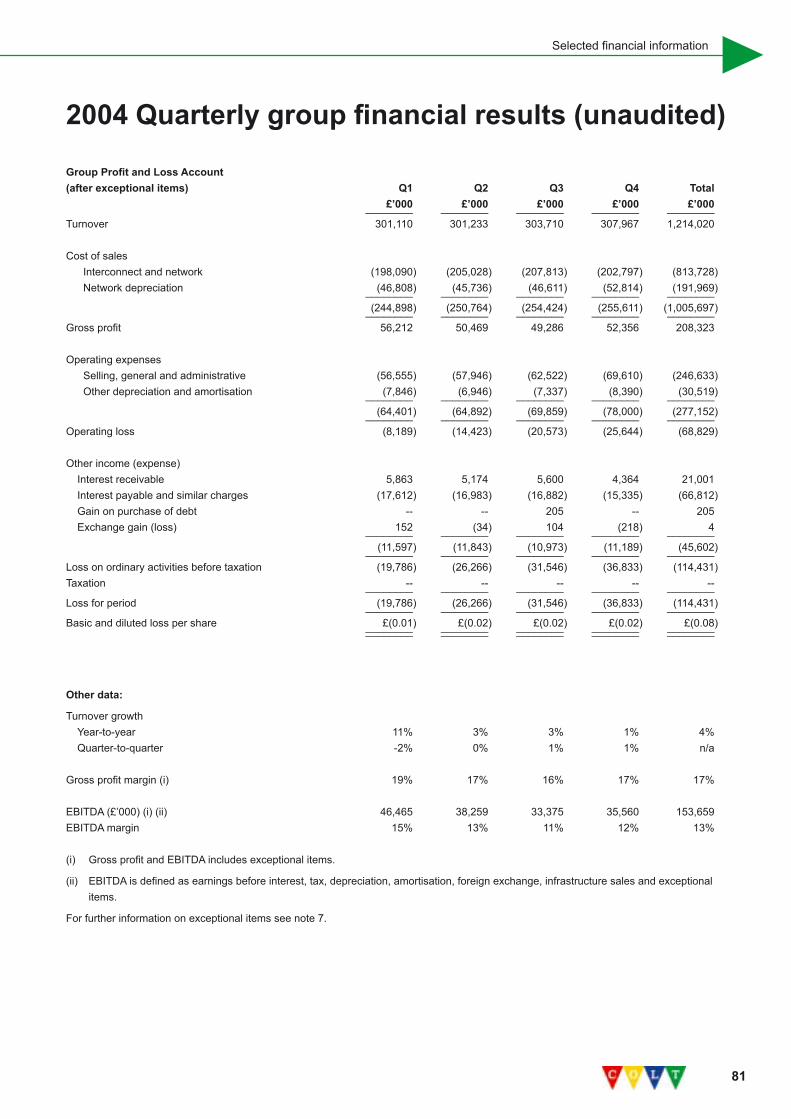
81
Selected financial information
Group Profit and Loss Account(after exceptional items) Q1 Q2 Q3 Q4 Total £’000 £’000 £’000 £’000 £’000 ________ ________ ________ ________ ________Turnover 301,110 301,233 303,710 307,967 1,214,020
Cost of sales Interconnect and network (198,090) (205,028) (207,813) (202,797) (813,728) Network depreciation (46,808) (45,736) (46,611) (52,814) (191,969) ________ ________ ________ ________ ________ (244,898) (250,764) (254,424) (255,611) (1,005,697) ________ ________ ________ ________ ________Gross profit 56,212 50,469 49,286 52,356 208,323
Operating expenses Selling, general and administrative (56,555) (57,946) (62,522) (69,610) (246,633) Other depreciation and amortisation (7,846) (6,946) (7,337) (8,390) (30,519) ________ ________ ________ ________ ________ (64,401) (64,892) (69,859) (78,000) (277,152) ________ ________ ________ ________ ________Operating loss (8,189) (14,423) (20,573) (25,644) (68,829)
Other income (expense) Interest receivable 5,863 5,174 5,600 4,364 21,001 Interest payable and similar charges (17,612) (16,983) (16,882) (15,335) (66,812) Gain on purchase of debt -- -- 205 -- 205 Exchange gain (loss) 152 (34) 104 (218) 4 ________ ________ ________ ________ ________ (11,597) (11,843) (10,973) (11,189) (45,602) ________ ________ ________ ________ ________Loss on ordinary activities before taxation (19,786) (26,266) (31,546) (36,833) (114,431)Taxation -- -- -- -- -- ________ ________ ________ ________ ________Loss for period (19,786) (26,266) (31,546) (36,833) (114,431) ________ ________ ________ ________ ________Basic and diluted loss per share £(0.01) £(0.02) £(0.02) £(0.02) £(0.08) ________ ________ ________ ________ ________ ________ ________ ________ ________ ________
Other data:
Turnover growth Year-to-year 11% 3% 3% 1% 4% Quarter-to-quarter -2% 0% 1% 1% n/a
Gross profit margin (i) 19% 17% 16% 17% 17%
EBITDA (£’000) (i) (ii) 46,465 38,259 33,375 35,560 153,659 EBITDA margin 15% 13% 11% 12% 13%
(i) Gross profit and EBITDA includes exceptional items.
(ii) EBITDA is defined as earnings before interest, tax, depreciation, amortisation, foreign exchange, infrastructure sales and exceptional items.
For further information on exceptional items see note 7.
2004 Quarterly group financial results (unaudited)

82
Q1 Q2 Q3 Q4 ________ ________ ________ ________Customers (at end of period) (i) North Region 5,796 5,736 5,724 5,740 Central Region 7,213 7,929 7,960 7,870 South Region 5,813 5,940 6,041 6,204 ________ ________ ________ ________ 18,822 19,605 19,725 19,814Customers (at end of period) (i) Corporate 17,841 18,432 18,518 18,614 Wholesale 981 1,173 1,207 1,200 ________ ________ ________ ________ 18,822 19,605 19,725 19,814
Switched minutes (million) (for quarter) North Region 1,605 1,489 1,425 1,421 Central Region 3,752 3,593 3,580 3,875 South Region 1,092 1,114 1,060 1,301 ________ ________ ________ ________ 6,449 6,196 6,065 6,597
Private wire VGEs (000) (at end of quarter) (ii) North Region 11,179 11,737 12,619 12,710 Central Region 11,993 13,013 15,623 15,795 South Region 5,298 5,642 6,431 7,859 ________ ________ ________ ________ 28,470 30,392 34,673 36,364
Headcount (at end of quarter) (iii) North Region 1,536 1,568 1,544 1,489 Central Region 1,370 1,361 1,330 1,271 South Region 928 928 929 908 India -- -- 86 201 ________ ________ ________ ________ 3,834 3,857 3,889 3,869
South Region comprises France, Italy, Portugal and Spain. North Region comprises UK, Ireland, The Netherlands, Belgium, Denmark, and Sweden. Central Region comprises Germany, Austria and Switzerland
(i) Customers represent the number of customers who purchase network and data solutions products.
(ii) Non-switched circuits are measured in Voice Grade Equivalents (VGEs). VGEs are the comparable number of voice circuits, of 64 kilobits per second, each approximately equivalent in capacity to the non-switched circuit being measured.
(iii) Headcount comprises active employees excluding temporary and contract workers.
2004 Operating statistics (unaudited)

83
Selected financial information
Group Profit and Loss Account(after exceptional items) 2000 2001 2002 2003 2004 £’000 £’000 £’000 £’000 £’000 ________ ________ ________ ________ ________Turnover (i) 686,977 905,687 1,027,258 1,166,318 1,214,020
Cost of sales Interconnect and network (478,215) (704,906) (731,935) (766,942) (813,728) Network depreciation (88,689) (236,764) (720,009) (204,417) (191,969) ________ ________ ________ ________ ________ (566,904) (941,670) (1,451,944) (971,359) (1,005,697) ________ ________ ________ ________ ________Gross profit (loss) 120,073 (35,983) (424,686) 194,959 208,323 Operating expenses Selling, general and administrative (181,674) (264,981) (261,029) (233,475) (246,633) Other depreciation and amortisation (23,312) (58,967) (92,879) (38,531) (30,519) ________ ________ ________ ________ ________ (204,986) (323,948) (353,908) (272,006) (277,152) ________ ________ ________ ________ ________Operating loss (84,913) (359,931) (778,594) (77,047) (68,829)Other income (expense) Interest receivable 80,500 60,727 38,108 26,718 21,001 Gain on purchase of debt -- 58,774 101,668 7,589 205 Amounts written off investment in own shares -- (2,757) (409) -- -- Interest payable and similar charges (104,794) (111,952) (96,300) (88,295) (66,812) Exchange gain (loss) (7,653) (5,230) 17,245 6,388 4 ________ ________ ________ ________ ________ (31,947) (438) 60,312 (47,600) (45,602) ________ ________ ________ ________ ________Loss on ordinary activities before taxation (116,860) (360,369) (718,282) (124,647) (114,431)Taxation -- -- -- -- -- ________ ________ ________ ________ ________Loss for period (116,860) (360,369) (718,282) (124,647) (114,431) ________ ________ ________ ________ ________ ________ ________ ________ ________ ________Basic and diluted loss per share £(0.17) £(0.48) £(0.48) £(0.08) £(0.08) ________ ________ ________ ________ ________ ________ ________ ________ ________ ________
Operating loss after exceptional items (84,913) (359,931) (778,594) (77,047) (68,829)Exceptional items: Interconnect and network -- 62,382 18,320 -- -- Network depreciation -- 73,371 508,000 -- -- Selling, general and administrative -- 27,870 18,934 (2,453) -- Other depreciation and amortisation -- 11,955 43,000 -- -- ________ ________ ________ ________ ________Operating loss before exceptional items (84,913) (184,353) (190,340) (79,500) (68,829)Gross profit on infrastructure sales (i) (18,990) (1,414) -- -- -- ________ ________ ________ ________ ________Operating loss before exceptional items and infrastructure sales (103,903) (185,767) (190,340) (79,500) (68,829) ________ ________ ________ ________ ________ ________ ________ ________ ________ ________EBITDA (ii) 8,098 24,638 71,548 163,448 153,659 ________ ________ ________ ________ ________ ________ ________ ________ ________ ________
(i) Turnover in 2001 includes infrastructure sales of £3.8 million (2000: £46.2 million) which had associated cost of sales of £2.4 million (2000: £27.2 million). There were no infrastructure sales in 2002, 2003 or 2004.
(ii) EBITDA is defined as earnings before interest, tax, depreciation, amortisation, foreign exchange, infrastructure sales and exceptional items.
Five year summary
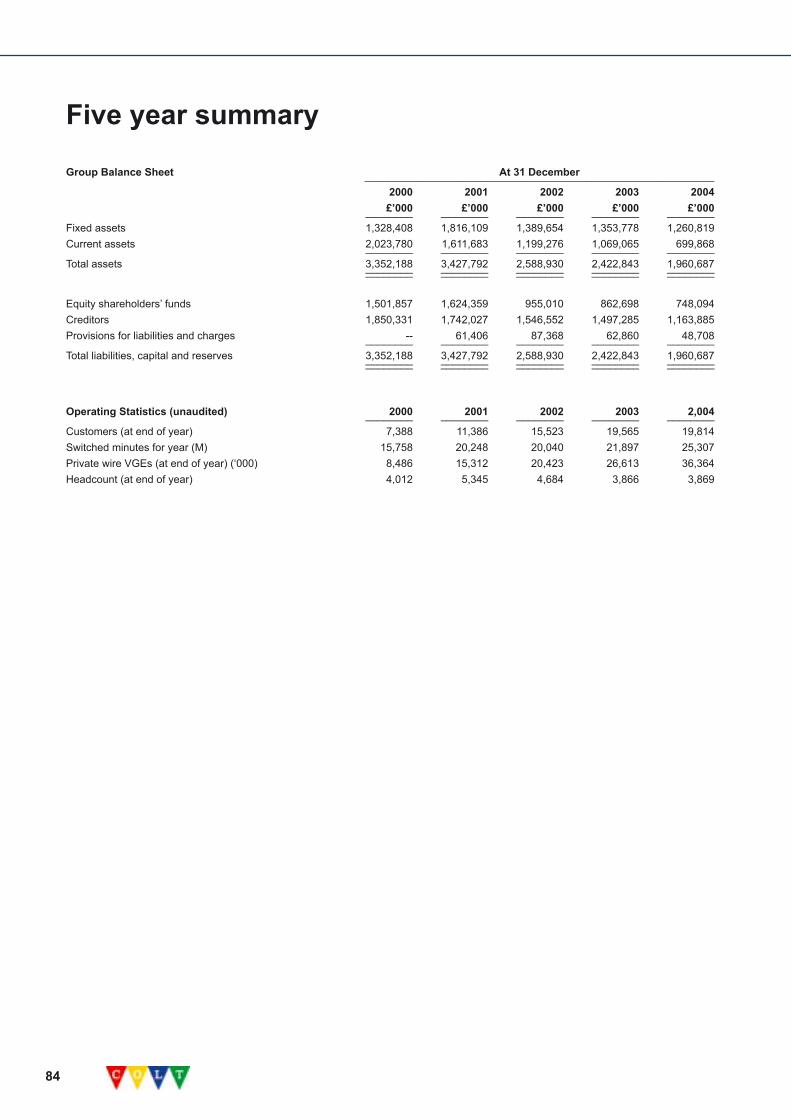
84
Group Balance Sheet At 31 December ____________________________________________________________ 2000 2001 2002 2003 2004 £’000 £’000 £’000 £’000 £’000 ________ ________ ________ ________ ________Fixed assets 1,328,408 1,816,109 1,389,654 1,353,778 1,260,819Current assets 2,023,780 1,611,683 1,199,276 1,069,065 699,868 ________ ________ ________ ________ ________Total assets 3,352,188 3,427,792 2,588,930 2,422,843 1,960,687 ________ ________ ________ ________ ________ ________ ________ ________ ________ ________
Equity shareholders’ funds 1,501,857 1,624,359 955,010 862,698 748,094Creditors 1,850,331 1,742,027 1,546,552 1,497,285 1,163,885Provisions for liabilities and charges -- 61,406 87,368 62,860 48,708 ________ ________ ________ ________ ________Total liabilities, capital and reserves 3,352,188 3,427,792 2,588,930 2,422,843 1,960,687 ________ ________ ________ ________ ________ ________ ________ ________ ________ ________
Operating Statistics (unaudited) 2000 2001 2002 2003 2,004 ________ ________ ________ ________ ________Customers (at end of year) 7,388 11,386 15,523 19,565 19,814 Switched minutes for year (M) 15,758 20,248 20,040 21,897 25,307 Private wire VGEs (at end of year) (‘000) 8,486 15,312 20,423 26,613 36,364 Headcount (at end of year) 4,012 5,345 4,684 3,866 3,869
Five year summary
85
Investor information
Investor information
ListingsOrdinary shares of COLT Telecom Group plc are traded on the London Stock Exchange and, in the form of American Depositary Shares (ADSs), on the Nasdaq National Market.
American Depositary ReceiptsADSs, each representing four ordinary shares, are traded on the Nasdaq National Market under the symbol ‘COLT’. ADSs are represented by American Depositary Receipts (ADRs). The ADR programme is administered on behalf of the Company by The Bank of New York, 101 Barclay Street, 22 W, New York, NY 10286Telephone +1 212 815 2276
Reports to ADR HoldersADR holders receive the annual reports issued to ordinary shareholders. COLT Telecom Group plc will file with the Securities and Exchange Commission in the United States its annual report on Form 20-F and other information as required. A copy of the Form 20-F may be obtained by writing to: Investor Relations, COLT Telecom Group plc, Beaufort House, 15 St. Botolph Street, London EC3A 7QN.
SolicitorsSlaughter & May, One Bunhill Row, London EC1Y 8YY
RegistrarsLloyds TSB Registrars, The Causeway, Worthing, West Sussex BN99 6DA Telephone: +44 1903 502541
Annual General MeetingThe 2004 Annual General Meeting of COLT Telecom Group plc will be held at 11.00 am on 21 April 2005 at: The Capital Club, Abchurch Lane, London EC4 7BB
Further Information contactDirector Corporate CommunicationsCOLT Telecom Group plc, Beaufort House, 15 St. Botolph Street, London EC3A 7QNTelephone: +44 20 7390 3681Facsimile: +44 20 7390 3701 Registered NumberCOLT Telecom Group plc Registered in England No. 3232904
86
Austriawww.colt.at
ViennaCOLT Telecom Austria GmbHKärntner Ring 121010 ViennaMD Austria: Alfred PufitschTel: +43 1 20 500 0Fax: +43 1 20 500 199
Belgiumwww.colt-telecom.be
BrusselsCOLT Telecom NV/SA Zweefvliegtuigstraat 10 Rue du PlaneurB – 1130 BrusselsMD Belgium: Henri van der VaerenTel: +32 2 790 16 16Fax: +32 2 190 16 00
AntwerpCOLT Telecom NV/SAHaifastraat 6B – 2030 AntwerpTel: +32 2 790 16 16Fax: +32 2 190 16 00
Denmarkwww.colt-telecom.dk
CopenhagenCOLT Telecom A/SBorgmester Christiansens Gade 552450 Copenhagen SVMD Denmark: Morten JaegerTel: +45 70 21 23 30Fax: +45 70 21 23 31
Francewww.colt-telecom.fr
ParisCOLT TélécommunicationsFrance SAS 25 Rue de Chazelles75489 Paris Cedex 17MD France: Richard BlausteinTel: +33 1 70 99 55 00Fax: +33 1 70 99 56 06
LyonCOLT TélécommunicationsFrance SAS 11 Rue de Teinturiers69003 LyonTel: +33 4 26 84 79 00Fax: +33 4 26 84 79 01
MarseillesCOLT TélécommunicationsFrance SAS152 Avenue du Prado13008 MarseilleTel: +33 4 88 91 45 00Fax: +33 4 88 91 45 01
Germanywww.colt.de
FrankfurtCOLT Telecom GmbHCentral Business ServicesHerriotstraβe 460528 FrankfurtMD Germany: Wolfgang EssigTel: +49 69 56606 0Fax: +49 69 56606 1000
FrankfurtCOLT Telecom GmbHHerriotstraβe 460528 FrankfurtTel: +49 69 56606 0Fax: +49 69 56606 2222
BerlinCOLT Telecom GmbHUhlandstraβe 181-183 10623 BerlinTel: +49 30 88 4420Fax: +49 30 88 442 100
CologneCOLT Telecom GmbHMagnusstraβe 1350672 Cologne Tel: +49 221 27 380Fax: +49 221 27 381 00
DüsseldorfCOLT Telecom GmbHUerdinger Straβe 9040474 DüsseldorfTel: +49 211 478 430Fax: +49 211 478 43100
HamburgCOLT Telecom GmbHDrehbahn 120354 HamburgTel: +49 40 350 670Fax: +49 40 350 671 00
COLT’s European offices
HanoverCOLT Telecom GmbHCalenberger Esplanade 430169 HanoverTel: +49 511 123 530Fax: +49 511 123 531 00
MunichCOLT Telecom GmbHVon-der-Tann Straβe 1180539 MunichTel: +49 89 286 410Fax: +49 89 286 41 100
StuttgartCOLT Telecom GmbHKronenstraβe 2570174 StuttgartTel: +49 711 222 530Fax: +49 711 222 53100
Italywww.colt-telecom.it
MilanCOLT Telecom SpAViale E. Jenner 5620159 MilanMD Italy: Achille De TommasoTel: +39 02 30 333 1Fax: +39 02 30 333 700
TurinCOLT Telecom SpAEnvironment ParkVia Livorno 6010144 TurinTel: +39 011 2300 1Fax: +39 011 2300 700
RomeCOLT Telecom SpAVia Simone Martini 12700142 RomeTel: +39 06 51074 1Fax: +39 06 51074 700
87
COLT’s European offices
Netherlandswww.colt-telecom.nl
AmsterdamCOLT Telecom BVVan der Madeweg 12-14aPostbus 940141090 GA AmsterdamMD Netherlands:Tel: +31 20 888 2020Fax: +31 20 888 2010
RotterdamCOLT Telecom BVConradstraat 28Postbus 291653001 GD RotterdamTel: +31 10 799 3030Fax: +31 10 799 3010
The HagueCOLT Telecom BVC/O Conradstraat 28Postbus 291653001 GD RotterdamTel: +31 10 799 3030Fax: +31 10 799 3010
Portugalwww.colt-telecom.pt
LisbonCOLT Telecom Serviços de TelecommuniçacõesUnipessoal LdaEstrada da Outurela 118Edificio B2790-114 CarnaxideMD Portugal: Adelino SantosTel: +351 21 120 00 00Fax: +351 21 120 00 09
Republic of Irelandwww.colt-telecom.ie
DublinCOLT Telecom Ireland Limited15-16 Docklands Innovation ParkEast Wall RoadDublin 3IrelandMD Ireland: Gary KeoghTel: +353 1436 5900Fax: +353 1436 5901
Spainwww.colt-telecom.es
MadridCOLT Telecom España SA C/O Telémaco 528027 MadridMD Spain: Angel Rojo-DiezTel: +34 91 789 9000Fax: +34 91 789 9099
BarcelonaCOLT Telecom España SAC/O Acero 5-908038 BarcelonaTel: +34 93 445 5000Fax: +34 93 445 5099
ValenciaCOLT Telecom España SAC/O Espinosa, 846008 ValenciaTel: +34 96 046 6000Fax: +34 96 046 6100
Swedenwww.colt.se
StockholmCOLT Telecom AB Box 3458Luntmakargatan 18SE – 103 69 StockholmSwedenMD Sweden: Marie LoverfeltTel: +46 8 781 80 00Fax: +43 8 781 81 00
Switzerlandwww.colt.ch
ZürichCOLT Telecom AGMürtschenstrasse 27CH – 8048 ZürichMD Switzerland: Hans Jörg DenzlerTel: +41 1 5 600 600Fax: +41 1 5 600 610
GenevaCOLT Telecom SARue de Montbrillant 40 bisCH – 1201 GenevaTel: +41 22 591 0 591Fax: +41 22 591 0 585
United Kingdomwww.colt.net
LondonCOLT Telecom Group plcBeaufort House15 St. Botolph StreetLondon EC3A 7QNCEO: Jean-Yves CharlierChief Administrative and Financial Officer: Tony BatesChief Operations Officer: Ken StarkeyMD Strategic Markets: Lakh JemmettMD Data Centre Solutions: Paul DavidMD Sales and Marketing: Detlef SpangMD Human Resources: Bruce KingMD Strategy and Business Transformation: Tanuja RanderyTel: +44 20 7390 3900Fax: +44 20 7390 3901
LondonCOLT TelecommunicationsBeaufort House15 St. Botolph StreetLondon EC3A 7QNMD UK: Tim WortTel: +44 20 7390 3900Fax: +44 20 7390 3901
BirminghamCOLT Telecommunications4 Stephens StreetNewtown Birmingham B6 4RGTel: +44 20 7947 1803Fax: +44 20 7947 1810
ManchesterCOLT TelecommunicationsJohn Dalton House121 Deansgate Manchester M3 2BXTel: +44 20 7390 3900Fax: +44 20 7390 3901