Embed Size (px)
Citation preview
16.2021INVESTOR PRESENTATION
COLUMBIA PROPERTY TRUSTCOLUMBIA PROPERTY TRUST
2
CONTENTS
Company Overview Page 3
Case Studies Page 18
Appendix Page 22
3
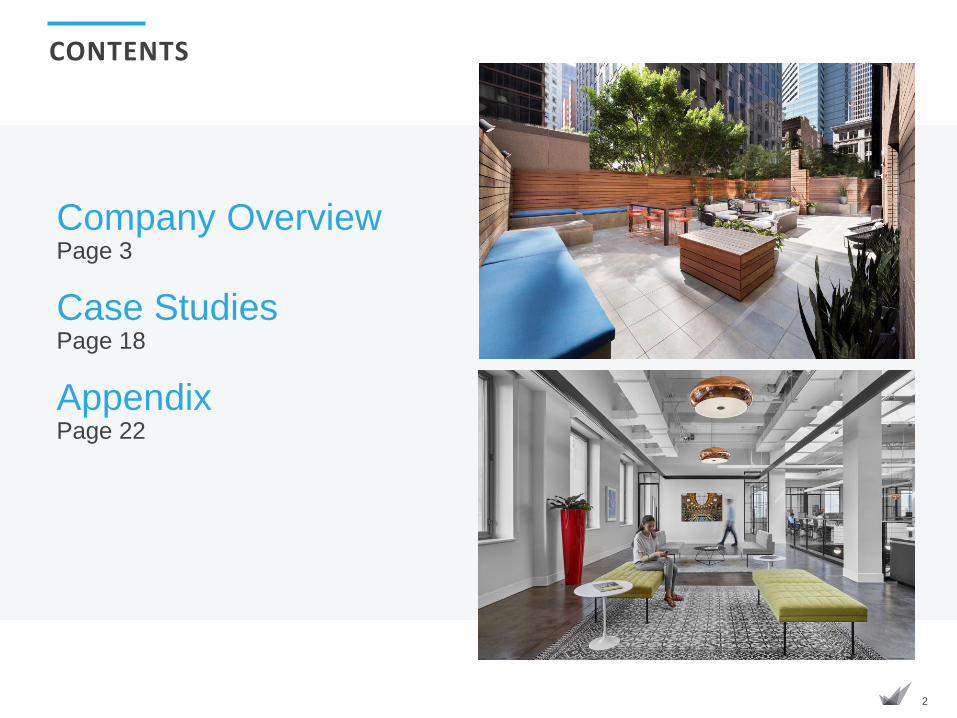
WHY INVEST?
✓Exceptional gateway portfolio at discounted valuation Modernized, boutique office properties in strategic submarkets
✓Fully integrated platform with deep experienceTrack record of success in value-add and development
✓Attractive yield with durable cash flows94% leased with strong rent roll and limited near-term expirations
✓ Investment grade balance sheetStrong liquidity and flexibility on future capital projects
4
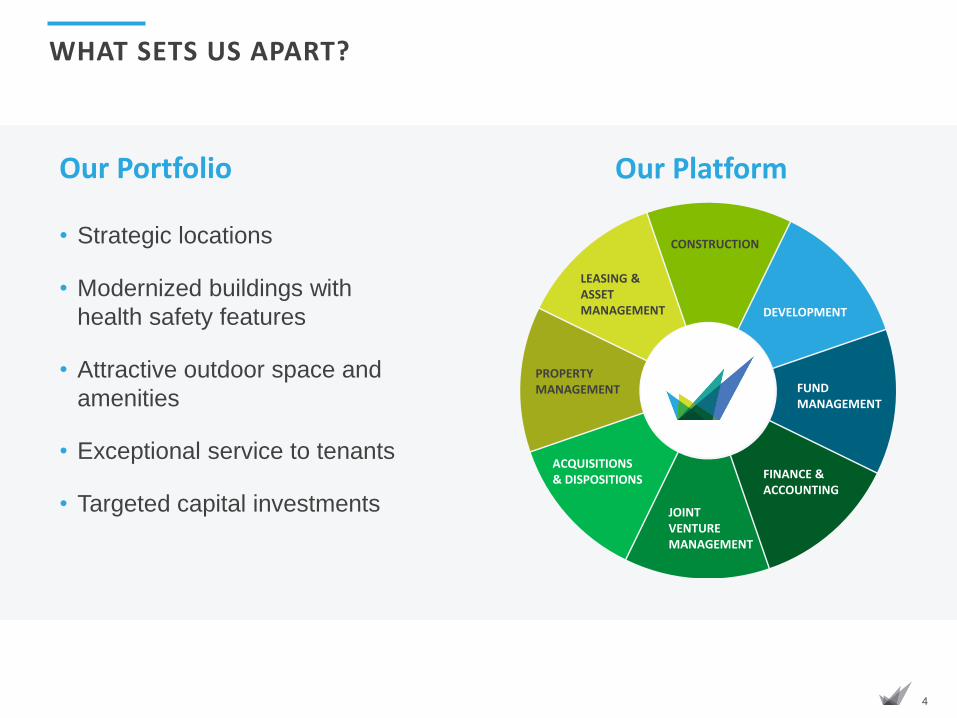
WHAT SETS US APART?
• Strategic locations
• Modernized buildings with
health safety features
• Attractive outdoor space and
amenities
• Exceptional service to tenants
• Targeted capital investments
ACQUISITIONS & DISPOSITIONS
JOINT VENTURE MANAGEMENT
LEASING & ASSET MANAGEMENT
PROPERTY MANAGEMENT
CONSTRUCTION
DEVELOPMENT
FINANCE & ACCOUNTING
FUNDMANAGEMENT
Our Portfolio Our Platform
5
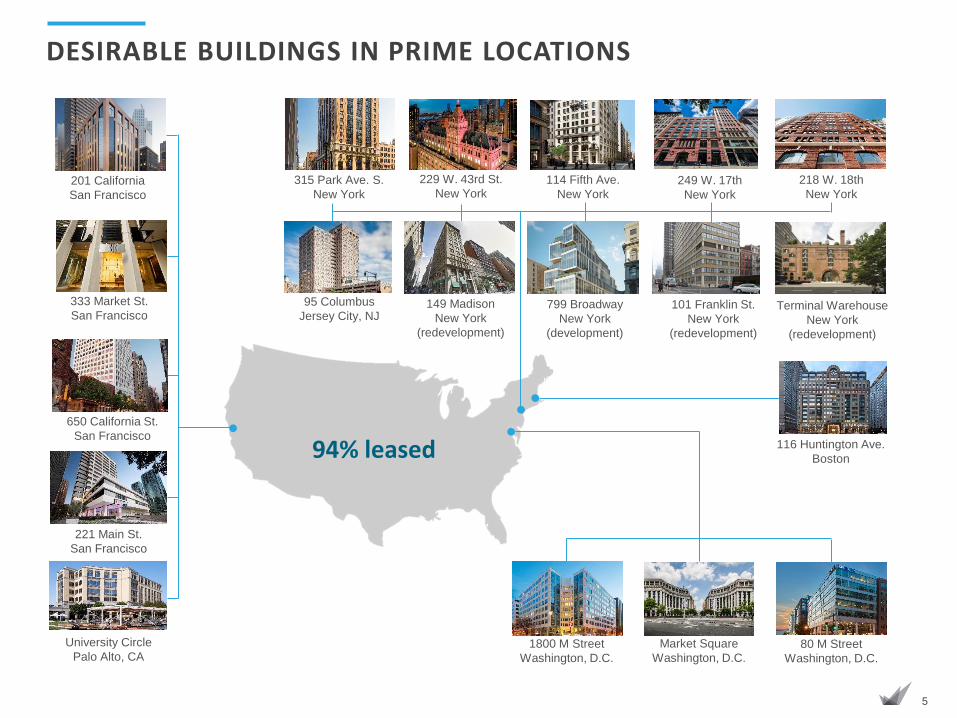
DESIRABLE BUILDINGS IN PRIME LOCATIONS
333 Market St.
San Francisco
650 California St.
San Francisco
94% leased
114 Fifth Ave.
New York
229 W. 43rd St.
New York315 Park Ave. S.
New York
221 Main St.
San Francisco
1800 M Street
Washington, D.C.
Market Square
Washington, D.C.80 M Street
Washington, D.C.
University Circle
Palo Alto, CA
149 Madison
New York
(redevelopment)
799 Broadway
New York
(development)
218 W. 18th
New York
95 Columbus
Jersey City, NJ101 Franklin St.
New York
(redevelopment)
249 W. 17th
New York201 California
San Francisco
116 Huntington Ave.
Boston
Terminal Warehouse
New York
(redevelopment)
6
LEADING GATEWAY SUBMARKETS
Data for properties owned in unconsolidated joint ventures presented at 100%. 1New York metrics exclude 149 Madison, 799 Broadway, 101 Franklin Street, and Terminal Warehouse.
2.2M total SF
97% leased1
2.2M total SF
93% leased
1.5M total SF
92% leased
SAN FRANCISCO WASHINGTON, D.C.NEW YORK
201 California
101 Franklin
Terminal
Warehouse
799 Broadway
149 Madison
315 Park Ave. S
114 Fifth
218 W. 18th
249 W. 17th
229 W. 43rd
95 Columbus
JERSEY CITY
7
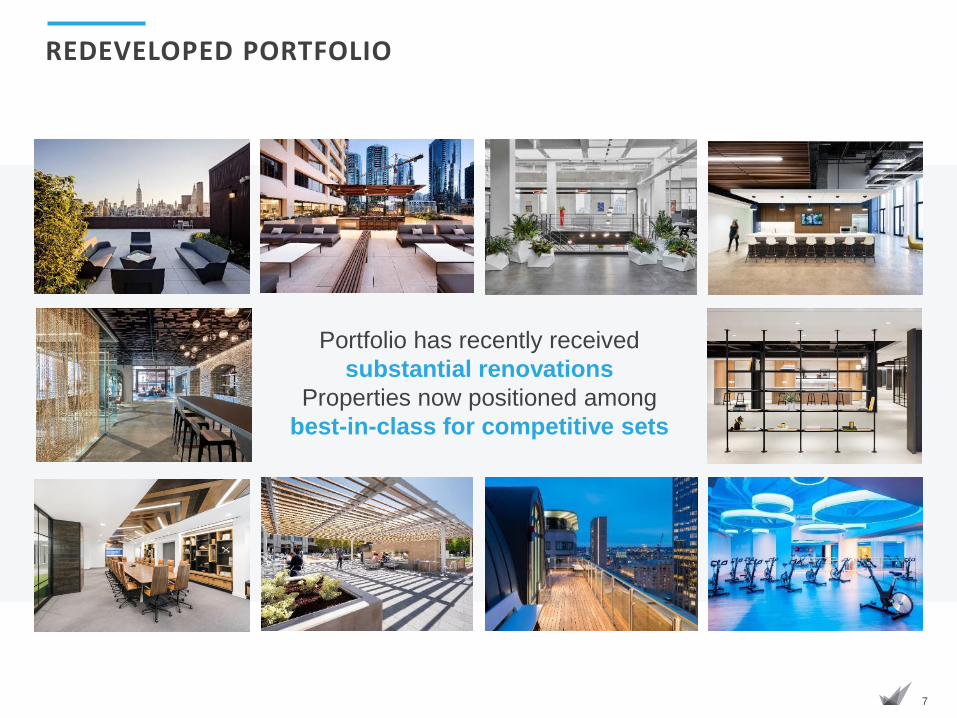
REDEVELOPED PORTFOLIO
Portfolio has recently received
substantial renovations
Properties now positioned among
best-in-class for competitive sets
8
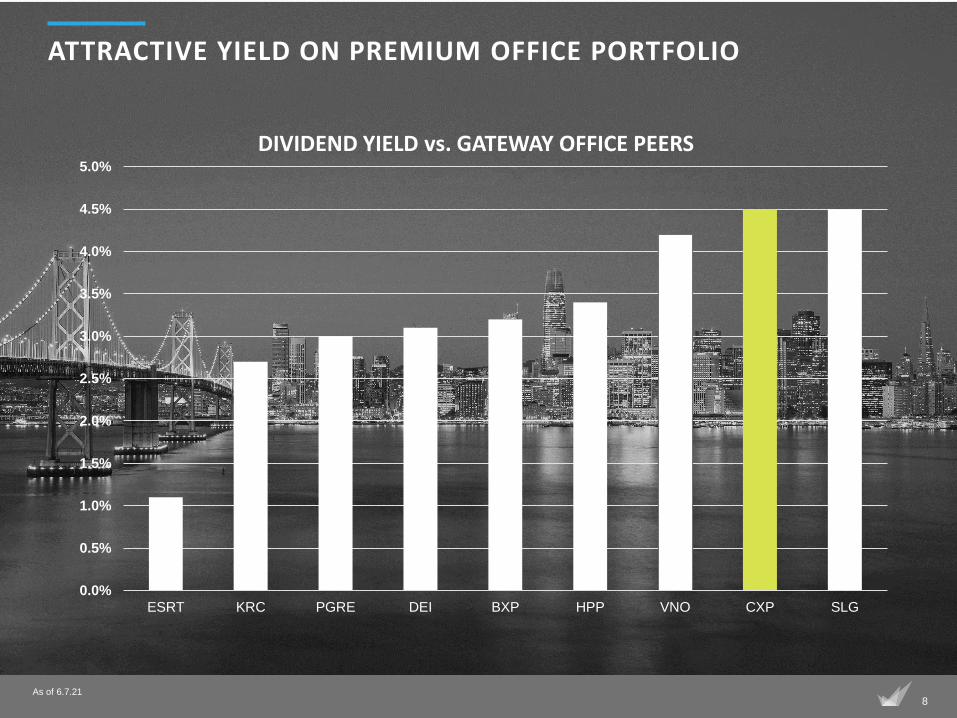
ATTRACTIVE YIELD ON PREMIUM OFFICE PORTFOLIO
As of 6.7.21
0.0%
0.5%
1.0%
1.5%
2.0%
2.5%
3.0%
3.5%
4.0%
4.5%
5.0%
ESRT KRC PGRE DEI BXP HPP VNO CXP SLG
DIVIDEND YIELD vs. GATEWAY OFFICE PEERS
9
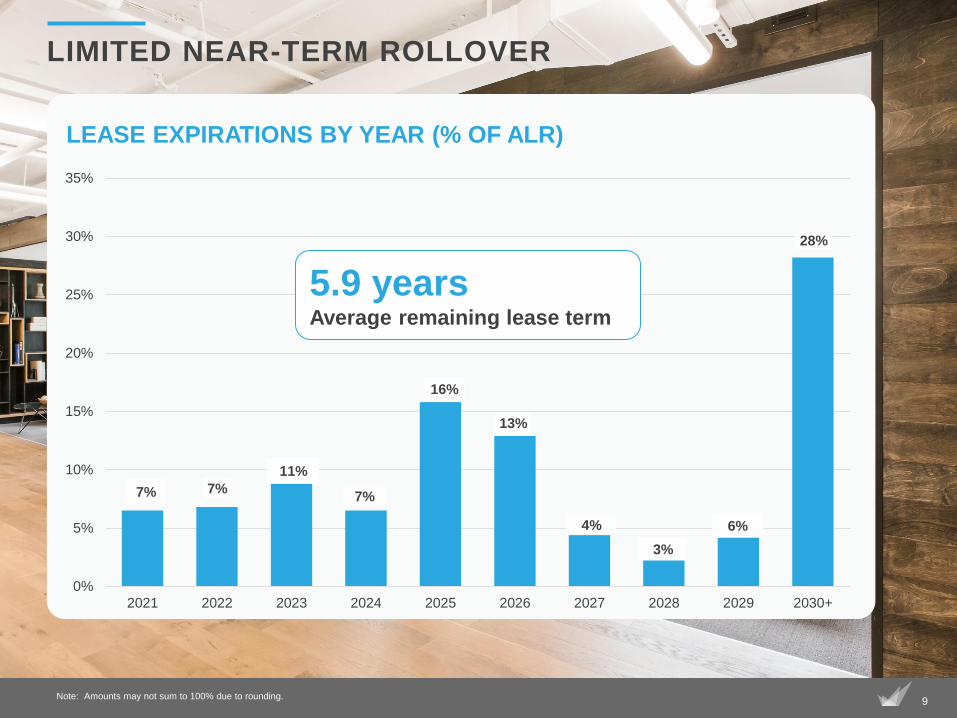
LIMITED NEAR-TERM ROLLOVER
7% 7%
11%
7%
16%
13%
4%
3%
6%
28%
0%
5%
10%
15%
20%
25%
30%
35%
2021 2022 2023 2024 2025 2026 2027 2028 2029 2030+
LEASE EXPIRATIONS BY YEAR (% OF ALR)
5.9 years Average remaining lease term
Note: Amounts may not sum to 100% due to rounding.
10
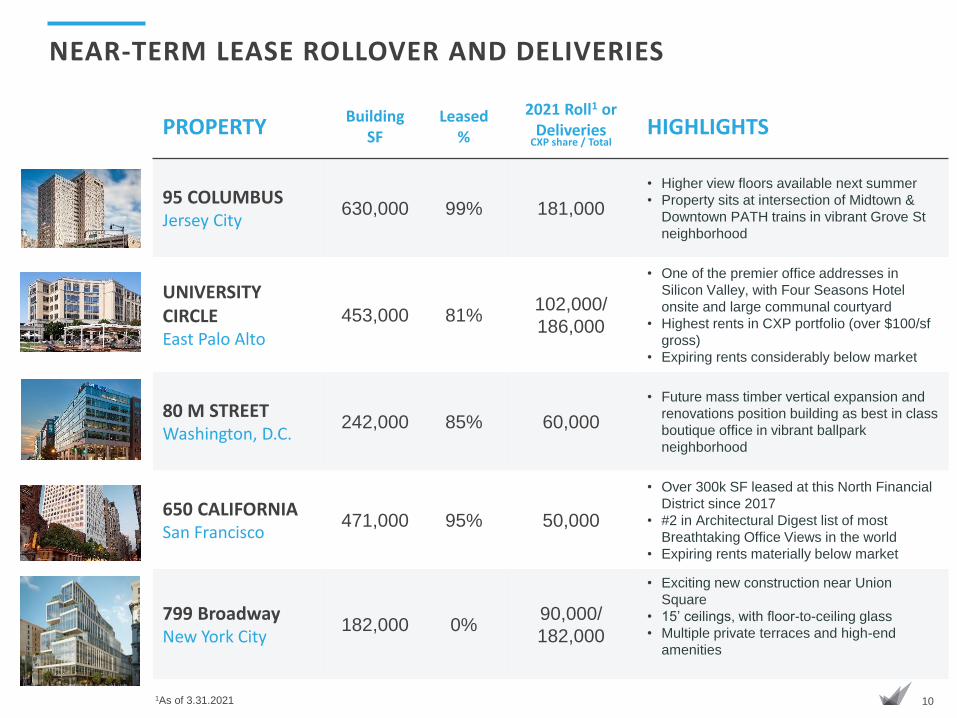
NEAR-TERM LEASE ROLLOVER AND DELIVERIES
PROPERTYBuilding
SFLeased
%
2021 Roll1 or Deliveries
CXP share / TotalHIGHLIGHTS
95 COLUMBUSJersey City
630,000 99% 181,000
• Higher view floors available next summer
• Property sits at intersection of Midtown &
Downtown PATH trains in vibrant Grove St
neighborhood
UNIVERSITY CIRCLEEast Palo Alto
453,000 81%102,000/
186,000
• One of the premier office addresses in
Silicon Valley, with Four Seasons Hotel
onsite and large communal courtyard
• Highest rents in CXP portfolio (over $100/sf
gross)
• Expiring rents considerably below market
80 M STREETWashington, D.C.
242,000 85% 60,000
• Future mass timber vertical expansion and
renovations position building as best in class
boutique office in vibrant ballpark
neighborhood
650 CALIFORNIASan Francisco
471,000 95% 50,000
• Over 300k SF leased at this North Financial
District since 2017
• #2 in Architectural Digest list of most
Breathtaking Office Views in the world
• Expiring rents materially below market
799 BroadwayNew York City
182,000 0%90,000/
182,000
• Exciting new construction near Union
Square
• 15’ ceilings, with floor-to-ceiling glass
• Multiple private terraces and high-end
amenities
1As of 3.31.2021
11
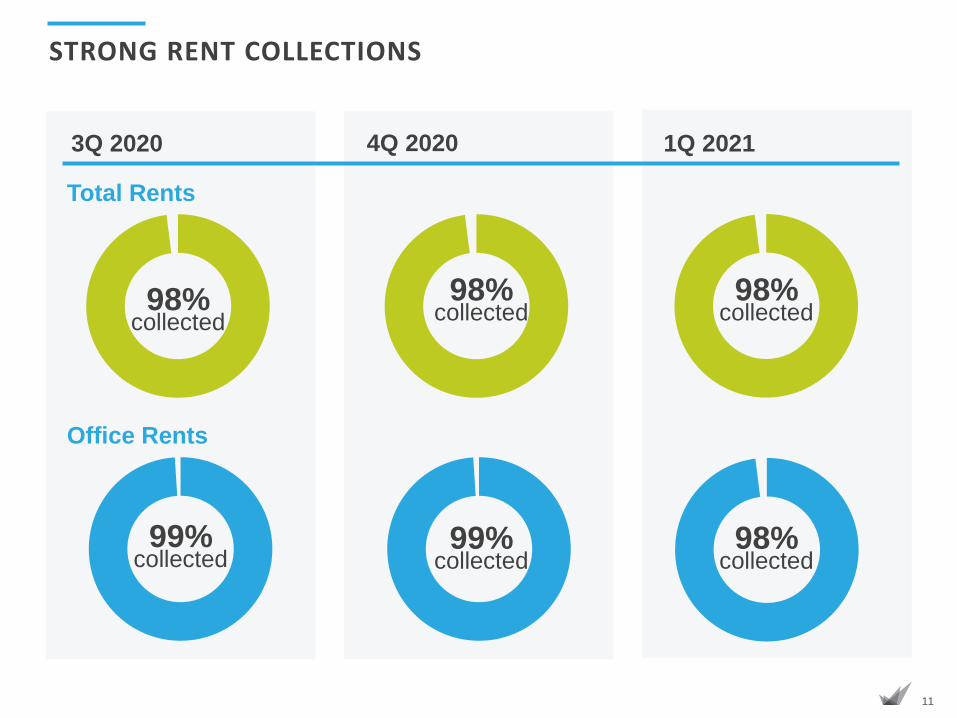
STRONG RENT COLLECTIONS
3Q 2020
Total Rents
98% collected
99% collected
Office Rents
98% collected
98% collected
4Q 2020 1Q 2021
98% collected
99% collected
12
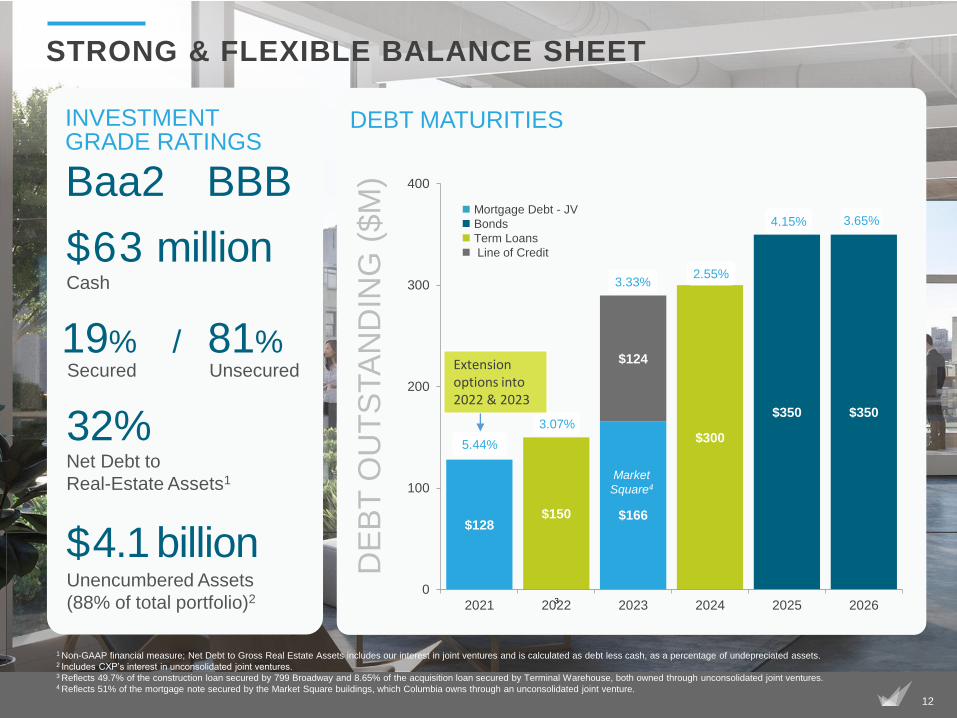
$128$166
$124
$150
$300
$350 $350
0
100
200
300
400
2021 2022 2023 2024 2025 20263
INVESTMENT GRADE RATINGS
19% / 81%Secured Unsecured
32%Net Debt to
Real-Estate Assets1
Baa2 BBB
DE
BT
OU
TS
TA
ND
ING
($M
)
◼ Mortgage Debt - JV
◼ Bonds
◼ Term Loans
◼ Line of Credit
DEBT MATURITIES
3.33%
3.07%
4.15% 3.65%
Market
Square4
1 Non-GAAP financial measure; Net Debt to Gross Real Estate Assets includes our interest in joint ventures and is calculated as debt less cash, as a percentage of undepreciated assets.2 Includes CXP’s interest in unconsolidated joint ventures. 3 Reflects 49.7% of the construction loan secured by 799 Broadway and 8.65% of the acquisition loan secured by Terminal Warehouse, both owned through unconsolidated joint ventures. 4 Reflects 51% of the mortgage note secured by the Market Square buildings, which Columbia owns through an unconsolidated joint venture.
$4.1 billionUnencumbered Assets
(88% of total portfolio)2
5.44%
STRONG & FLEXIBLE BALANCE SHEET
2.55%
$63 millionCash
Extension options into 2022 & 2023
13
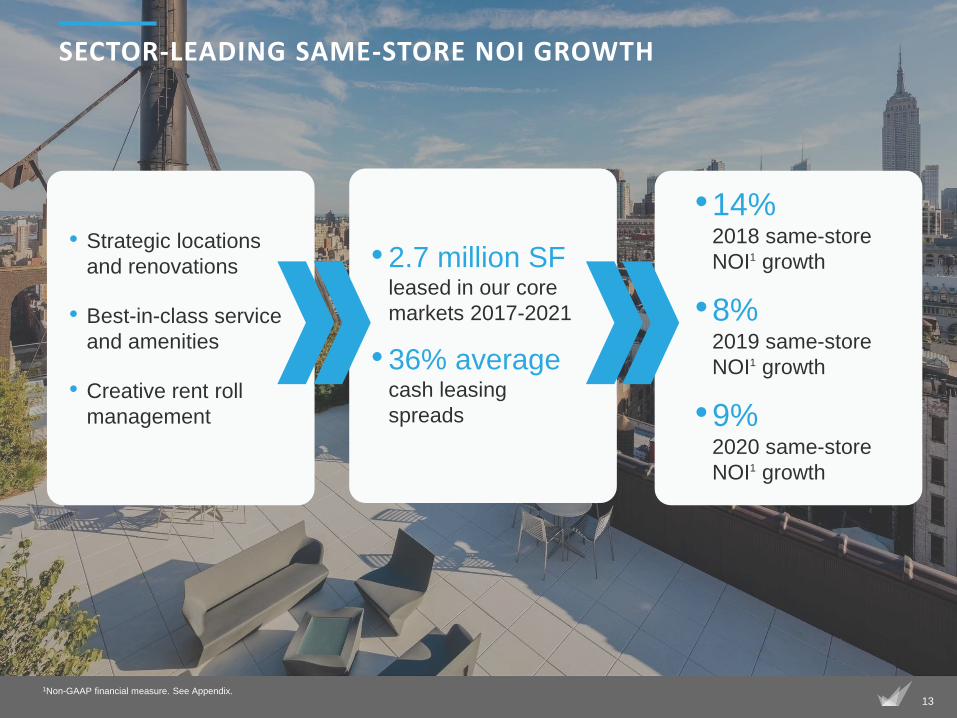
SECTOR-LEADING SAME-STORE NOI GROWTH
• Strategic locations
and renovations
• Best-in-class service
and amenities
• Creative rent roll
management
• 2.7 million SF leased in our core
markets 2017-2021
• 36% average cash leasing
spreads
•14%2018 same-store
NOI1 growth
•8% 2019 same-store
NOI1 growth
•9% 2020 same-store
NOI1 growth
1Non-GAAP financial measure. See Appendix.
14
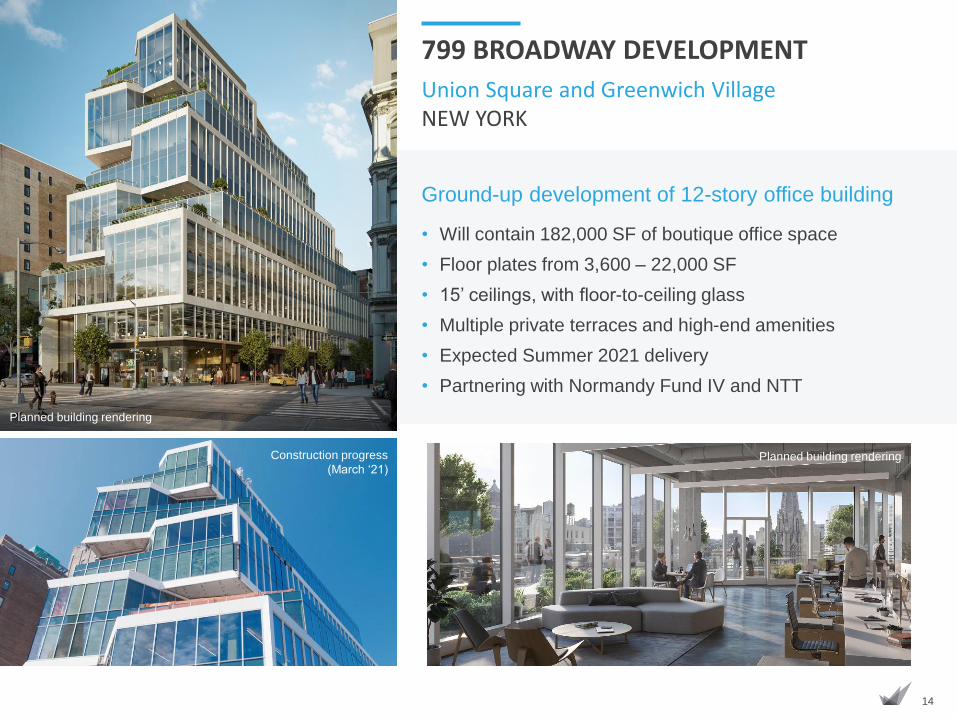
Ground-up development of 12-story office building
• Will contain 182,000 SF of boutique office space
• Floor plates from 3,600 – 22,000 SF
• 15’ ceilings, with floor-to-ceiling glass
• Multiple private terraces and high-end amenities
• Expected Summer 2021 delivery
• Partnering with Normandy Fund IV and NTT
Union Square and Greenwich Village NEW YORK
799 BROADWAY DEVELOPMENT
Planned building rendering
Planned building renderingConstruction progress
(October 2020)
Construction progress
(March ‘21)
15
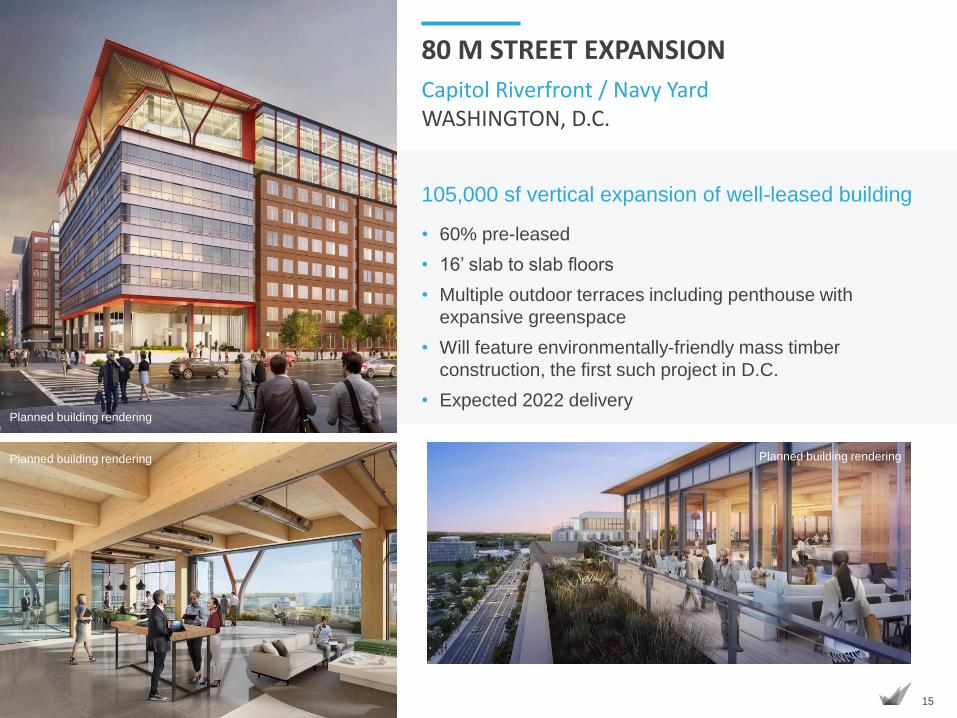
105,000 sf vertical expansion of well-leased building
• 60% pre-leased
• 16’ slab to slab floors
• Multiple outdoor terraces including penthouse with
expansive greenspace
• Will feature environmentally-friendly mass timber
construction, the first such project in D.C.
• Expected 2022 delivery
Capitol Riverfront / Navy YardWASHINGTON, D.C.
80 M STREET EXPANSION
Planned building rendering
Planned building renderingPlanned building rendering
16
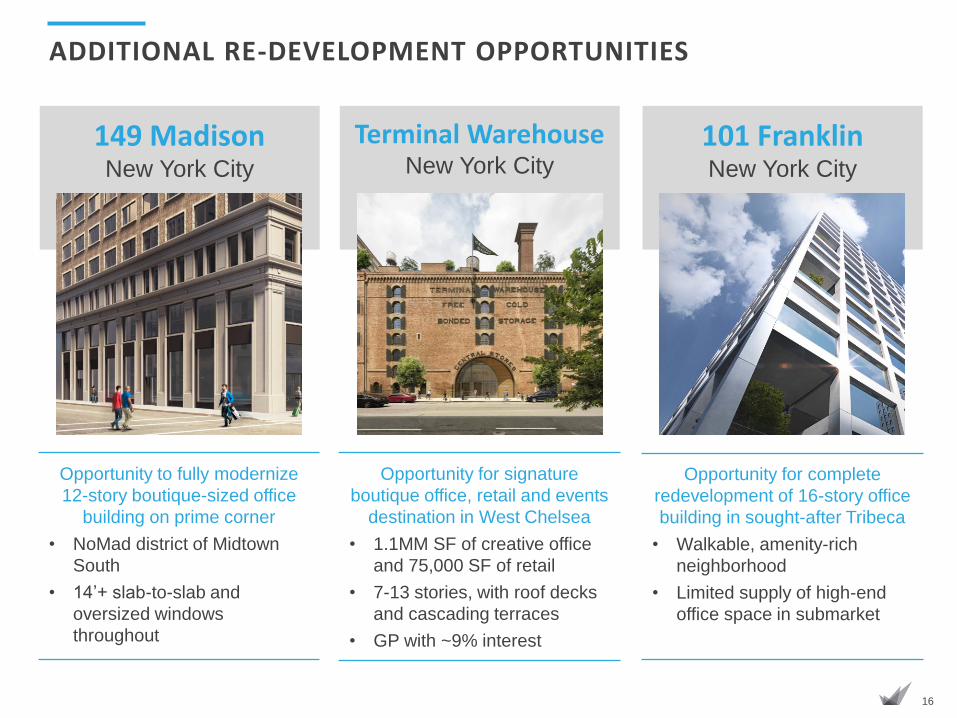
ADDITIONAL RE-DEVELOPMENT OPPORTUNITIES
149 MadisonNew York City
Terminal WarehouseNew York City
101 FranklinNew York City
Opportunity to fully modernize
12-story boutique-sized office
building on prime corner
• NoMad district of Midtown
South
• 14’+ slab-to-slab and
oversized windows
throughout
Opportunity for signature
boutique office, retail and events
destination in West Chelsea
• 1.1MM SF of creative office
and 75,000 SF of retail
• 7-13 stories, with roof decks
and cascading terraces
• GP with ~9% interest
Opportunity for complete
redevelopment of 16-story office
building in sought-after Tribeca
• Walkable, amenity-rich
neighborhood
• Limited supply of high-end
office space in submarket
17
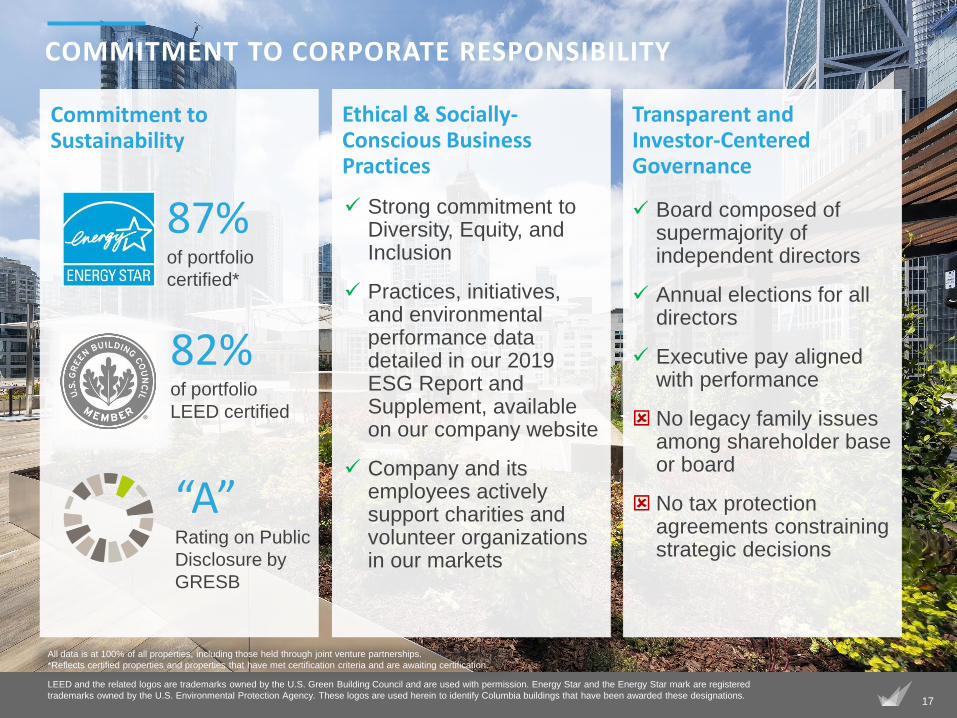
Commitment to Sustainability
✓ Board composed of supermajority of independent directors
✓ Annual elections for all directors
✓ Executive pay aligned with performance
No legacy family issues among shareholder base or board
No tax protection agreements constraining strategic decisions
Transparent and Investor-Centered Governance
87% of portfolio
certified*
All data is at 100% of all properties, including those held through joint venture partnerships.
*Reflects certified properties and properties that have met certification criteria and are awaiting certification.
LEED and the related logos are trademarks owned by the U.S. Green Building Council and are used with permission. Energy Star and the Energy Star mark are registered
trademarks owned by the U.S. Environmental Protection Agency. These logos are used herein to identify Columbia buildings that have been awarded these designations.
Ethical & Socially-Conscious Business Practices
✓ Strong commitment to Diversity, Equity, and Inclusion
✓ Practices, initiatives, and environmental performance data detailed in our 2019 ESG Report and Supplement, available on our company website
✓ Company and its employees actively support charities and volunteer organizations in our markets
COMMITMENT TO CORPORATE RESPONSIBILITY
82% of portfolio
LEED certified
“A” Rating on Public
Disclosure by
GRESB

18
CASE STUDIES
19
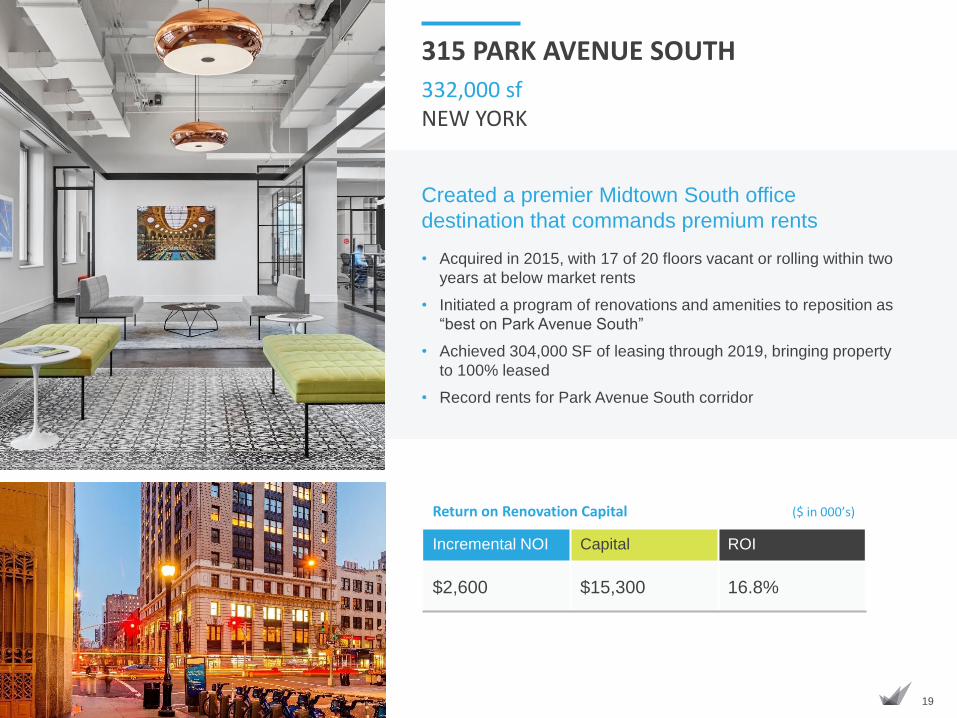
APPENDIX: Case Studies
Return on Renovation Capital ($ in 000’s)
Incremental NOI Capital ROI
$2,600 $15,300 16.8%
332,000 sfNEW YORK
315 PARK AVENUE SOUTH
Created a premier Midtown South office
destination that commands premium rents
• Acquired in 2015, with 17 of 20 floors vacant or rolling within two
years at below market rents
• Initiated a program of renovations and amenities to reposition as
“best on Park Avenue South”
• Achieved 304,000 SF of leasing through 2019, bringing property
to 100% leased
• Record rents for Park Avenue South corridor
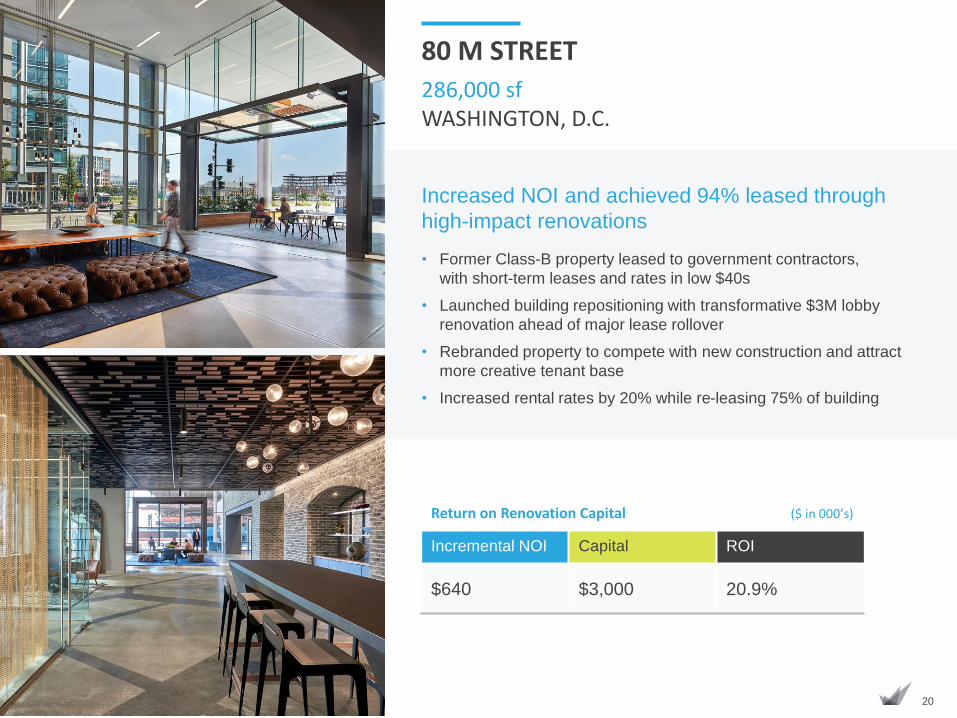
20
Return on Renovation Capital ($ in 000’s)
Incremental NOI Capital ROI
$640 $3,000 20.9%
286,000 sfWASHINGTON, D.C.
80 M STREET
Increased NOI and achieved 94% leased through
high-impact renovations
• Former Class-B property leased to government contractors,
with short-term leases and rates in low $40s
• Launched building repositioning with transformative $3M lobby
renovation ahead of major lease rollover
• Rebranded property to compete with new construction and attract
more creative tenant base
• Increased rental rates by 20% while re-leasing 75% of building
21
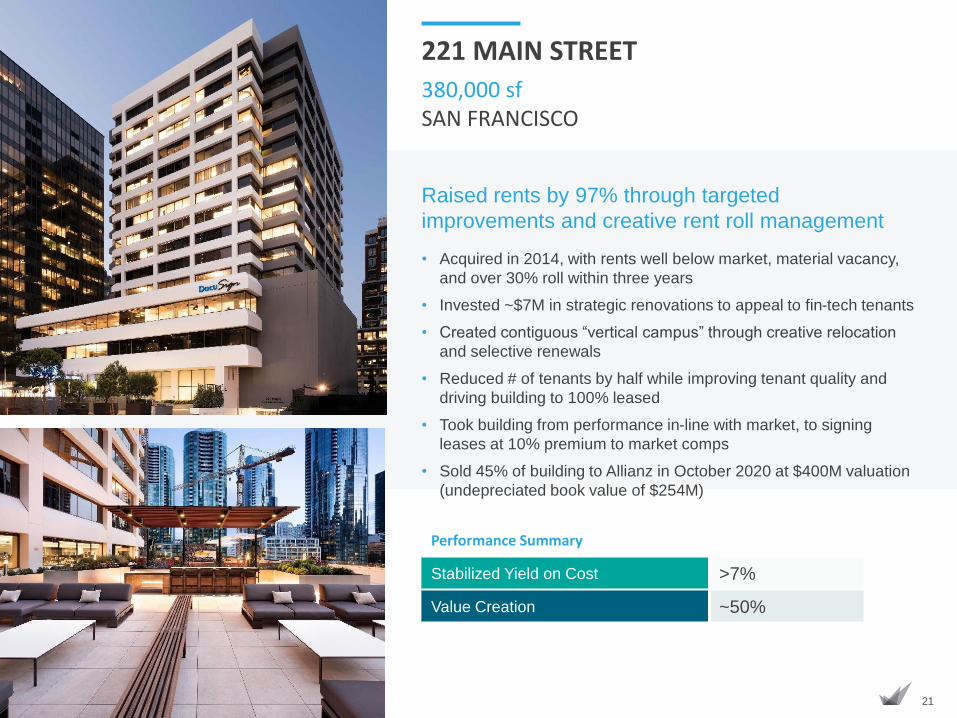
Raised rents by 97% through targeted
improvements and creative rent roll management
• Acquired in 2014, with rents well below market, material vacancy,
and over 30% roll within three years
• Invested ~$7M in strategic renovations to appeal to fin-tech tenants
• Created contiguous “vertical campus” through creative relocation
and selective renewals
• Reduced # of tenants by half while improving tenant quality and
driving building to 100% leased
• Took building from performance in-line with market, to signing
leases at 10% premium to market comps
• Sold 45% of building to Allianz in October 2020 at $400M valuation
(undepreciated book value of $254M)
380,000 sfSAN FRANCISCO
221 MAIN STREET
Performance Summary
Stabilized Yield on Cost >7%
Value Creation ~50%

22
FOR MORE INFORMATION
Columbia Property Trust
INVESTOR RELATIONS
404.465.2227
APPENDIX
www.columbia.reit
23
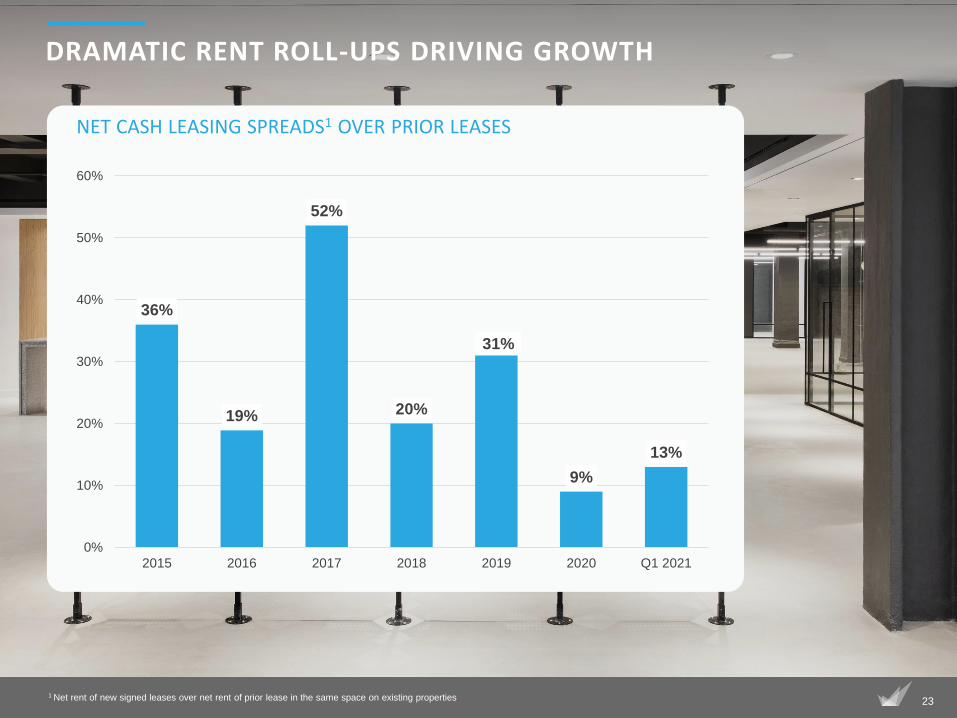
DRAMATIC RENT ROLL-UPS DRIVING GROWTH
36%
19%
52%
20%
31%
9%
13%
0%
10%
20%
30%
40%
50%
60%
2015 2016 2017 2018 2019 2020 Q1 2021
1 Net rent of new signed leases over net rent of prior lease in the same space on existing properties.
NET CASH LEASING SPREADS1 OVER PRIOR LEASES
24
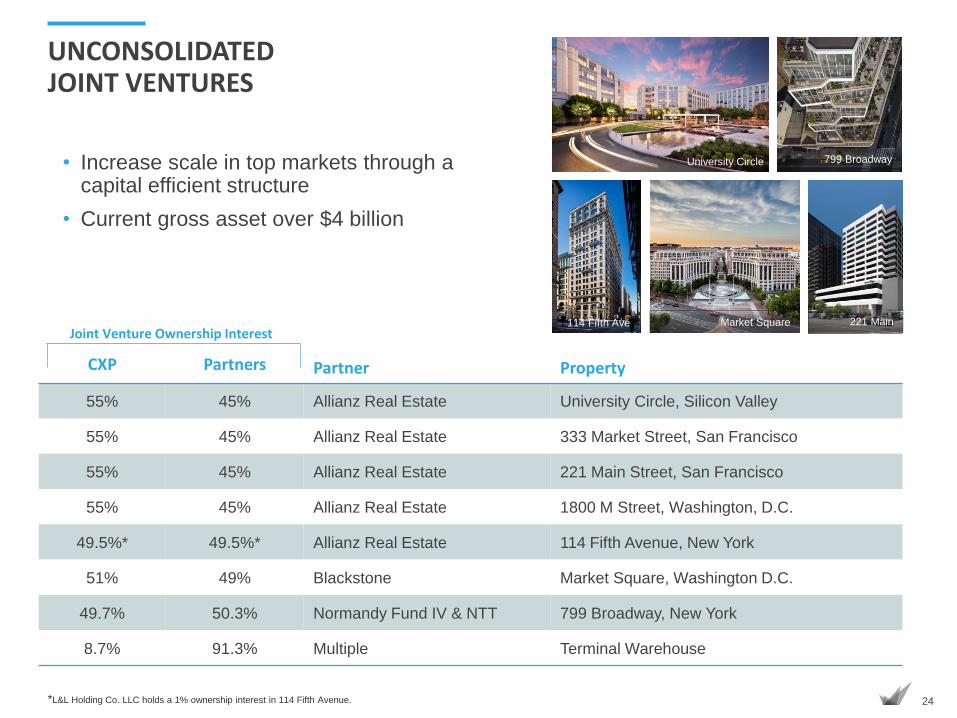
UNCONSOLIDATED JOINT VENTURES
• Increase scale in top markets through a capital efficient structure
• Current gross asset over $4 billion
Joint Venture Ownership Interest
Partner PropertyCXP Partners
55% 45% Allianz Real Estate University Circle, Silicon Valley
55% 45% Allianz Real Estate 333 Market Street, San Francisco
55% 45% Allianz Real Estate 221 Main Street, San Francisco
55% 45% Allianz Real Estate 1800 M Street, Washington, D.C.
49.5%* 49.5%* Allianz Real Estate 114 Fifth Avenue, New York
51% 49% Blackstone Market Square, Washington D.C.
49.7% 50.3% Normandy Fund IV & NTT 799 Broadway, New York
8.7% 91.3% Multiple Terminal Warehouse
*L&L Holding Co. LLC holds a 1% ownership interest in 114 Fifth Avenue.
University Circle
Market Square
799 Broadway
114 Fifth Ave 221 Main
25
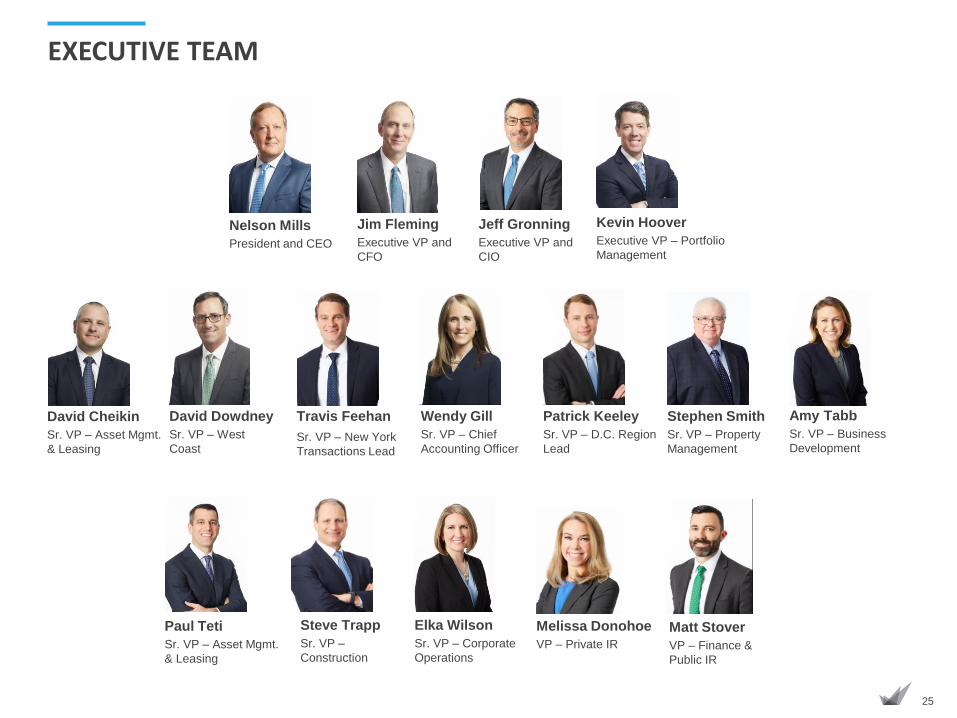
EXECUTIVE TEAM
Stephen Smith
Sr. VP – Property
Management
Steve Trapp
Sr. VP –
Construction
David Cheikin
Sr. VP – Asset Mgmt.
& Leasing
Travis Feehan
Sr. VP – New York
Transactions Lead
Wendy Gill
Sr. VP – Chief
Accounting Officer
Jeff Gronning
Executive VP and
CIO
Nelson Mills
President and CEO
Paul Teti
Sr. VP – Asset Mgmt.
& Leasing
Kevin Hoover
Executive VP – Portfolio
Management
Jim Fleming
Executive VP and
CFO
Elka Wilson
Sr. VP – Corporate
Operations
Amy Tabb
Sr. VP – Business
Development
David Dowdney
Sr. VP – West
Coast
Patrick Keeley
Sr. VP – D.C. Region
Lead
Matt Stover
VP – Finance &
Public IR
Melissa Donohoe
VP – Private IR
26
FORWARD-LOOKING STATEMENTS
086-CORPPRES0820
This presentation contains certain statements that may be considered forward-looking statements within the meaning of Section 27A of the Securities Act of 1933
and Section 21E of the Securities Exchange Act of 1934. Such forward-looking statements can generally be identified by our use of forward-looking terminology
such as “may,” “will,” “expect,” “intend,” “anticipate,” “estimate,” “believe,” “continue,” or other similar words. These forward-looking statements include information
about possible or assumed future results of the business and our financial condition, liquidity, results of operations, future plans, and objectives. They also include,
among other things, statements regarding subjects that are forward-looking by their nature, such as, our business and financial strategy; our guidance and
underlying assumptions; expectations on timing of completion of announced acquisitions; expectations on occupancy rates and additional growth in same store net
operating income; the impact of the COVID-19 pandemic on our results of operations; our ability to obtain future financing; future acquisitions and dispositions of
operating assets; future repurchases of common stock; and market and industry trends. Readers are cautioned not to place undue reliance on these forward-
looking statements, which speak only as of the date this presentation is published, and which are subject to certain risks and uncertainties which could cause actual
results to differ materially from those projected or anticipated. These risks and uncertainties include, without limitation: risks affecting the real estate industry and
the office sector, in particular (such as the inability to enter into new leases, dependence on tenants' financial condition, and competition from other owners of real
estate); risks relating to lease terminations, lease defaults, or changes in the financial condition of our tenants, particularly by a significant tenant; risks relating to
our ability to maintain and increase property occupancy rates and rental rates; adverse economic or real estate market developments in our target markets; the
risks of pandemics or other public health emergencies, including the continued spread and impact of, and the governmental and third-party response to, the recent
COVID-19 outbreak; the impact of social distancing, shelter-in-place, border closings, travel restrictions, remote work requirements and similar governmental and
private measures taken to combat the spread of COVID-19; risks relating to the use of debt to fund acquisitions; availability and terms of financing; the ability to
refinance indebtedness as it comes due; sensitivity of our operations and financing arrangements to fluctuations in interest rates; reductions in asset valuations and
related impairment charges; risks relating to construction, development, and redevelopment activities; risks associated with joint ventures, including disagreements
with, or misconduct by, joint venture partners; risks relating to repositioning our portfolio; risks relating to reduced demand for, or over supply of, office space in our
markets; risks relating to acquisition and disposition activities; the ability to successfully integrate our operations and employees in connection with the acquisition
of Normandy Real Estate Management, LLC (“Normandy”); the ability to realize anticipated benefits and synergies of the acquisition of Normandy; amount of the
costs, fees, expenses, and charges related to the acquisition of Normandy; risks associated with our ability to continue to qualify as a real estate investment trust
(“REIT”); risks associated with possible cybersecurity attacks against us or any of our tenants; potential liability for uninsured losses and environmental
contamination; potential adverse impact of market interest rates on the market price for our securities; and risks associated with our dependence on key personnel
whose continued service is not guaranteed.
We do not intend to publicly update or revise any forward-looking statement, whether as a result of new information, future events, or otherwise. For additional risks
and uncertainties that may cause actual results to differ from expectations, see our Annual Report on Form 10-K for the year ended December 31, 2020, and
subsequently filed periodic reports.
The names, logos, and related product and service names, design marks, and slogans are the trademarks or service marks of their respective companies. When
evaluating the Company’s performance and capital resources, management considers the financial impact of investments held directly and through unconsolidated
joint ventures. This presentation includes financial and operational information for our wholly-owned investments and our proportional interest in unconsolidated
investments.
Unless otherwise noted, all data herein is as of March 31, 2021.
27
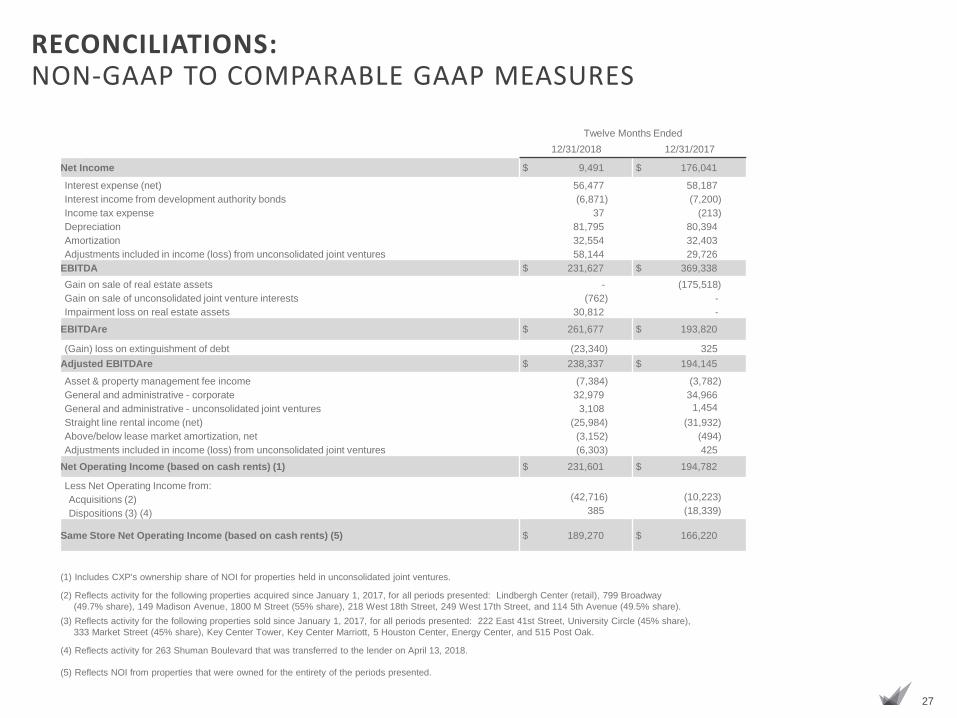
RECONCILIATIONS: NON-GAAP TO COMPARABLE GAAP MEASURES
Twelve Months Ended
12/31/2018 12/31/2017
Net Income $ 9,491 $ 176,041
Interest expense (net) 56,477 58,187
Interest income from development authority bonds (6,871) (7,200)
Income tax expense 37 (213)
Depreciation 81,795 80,394
Amortization 32,554 32,403
Adjustments included in income (loss) from unconsolidated joint ventures 58,144 29,726
EBITDA $ 231,627 $ 369,338
Gain on sale of real estate assets - (175,518)
Gain on sale of unconsolidated joint venture interests (762) -
Impairment loss on real estate assets 30,812 -
EBITDAre $ 261,677 $ 193,820
(Gain) loss on extinguishment of debt (23,340) 325
Adjusted EBITDAre $ 238,337 $ 194,145
Asset & property management fee income (7,384) (3,782)
General and administrative - corporate 32,979 34,966
General and administrative - unconsolidated joint ventures 3,108 1,454
Straight line rental income (net) (25,984) (31,932)
Above/below lease market amortization, net (3,152) (494)
Adjustments included in income (loss) from unconsolidated joint ventures (6,303) 425
Net Operating Income (based on cash rents) (1) $ 231,601 $ 194,782
Less Net Operating Income from:
Acquisitions (2) (42,716) (10,223)
Dispositions (3) (4) 385 (18,339)
Same Store Net Operating Income (based on cash rents) (5) $ 189,270 $ 166,220
(1) Includes CXP's ownership share of NOI for properties held in unconsolidated joint ventures.
(2) Reflects activity for the following properties acquired since January 1, 2017, for all periods presented: Lindbergh Center (retail), 799 Broadway
(49.7% share), 149 Madison Avenue, 1800 M Street (55% share), 218 West 18th Street, 249 West 17th Street, and 114 5th Avenue (49.5% share).
(3) Reflects activity for the following properties sold since January 1, 2017, for all periods presented: 222 East 41st Street, University Circle (45% share),
333 Market Street (45% share), Key Center Tower, Key Center Marriott, 5 Houston Center, Energy Center, and 515 Post Oak.
(4) Reflects activity for 263 Shuman Boulevard that was transferred to the lender on April 13, 2018.
(5) Reflects NOI from properties that were owned for the entirety of the periods presented.
28
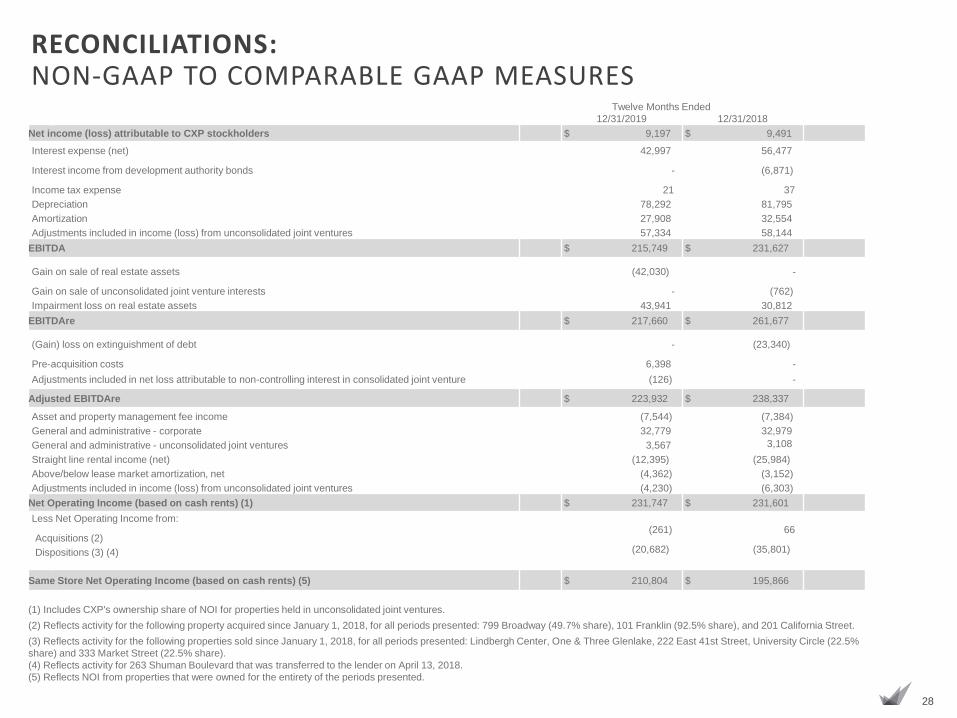
RECONCILIATIONS: NON-GAAP TO COMPARABLE GAAP MEASURES
Twelve Months Ended
12/31/2019 12/31/2018
Net income (loss) attributable to CXP stockholders $ 9,197 $ 9,491
Interest expense (net) 42,997 56,477
Interest income from development authority bonds - (6,871)
Income tax expense 21 37
Depreciation 78,292 81,795
Amortization 27,908 32,554
Adjustments included in income (loss) from unconsolidated joint ventures 57,334 58,144
EBITDA $ 215,749 $ 231,627
Gain on sale of real estate assets (42,030) -
Gain on sale of unconsolidated joint venture interests - (762)
Impairment loss on real estate assets 43,941 30,812
EBITDAre $ 217,660 $ 261,677
(Gain) loss on extinguishment of debt - (23,340)
Pre-acquisition costs 6,398 -
Adjustments included in net loss attributable to non-controlling interest in consolidated joint venture (126) -
Adjusted EBITDAre $ 223,932 $ 238,337
Asset and property management fee income (7,544) (7,384)
General and administrative - corporate 32,779 32,979
General and administrative - unconsolidated joint ventures 3,567 3,108
Straight line rental income (net) (12,395) (25,984)
Above/below lease market amortization, net (4,362) (3,152)
Adjustments included in income (loss) from unconsolidated joint ventures (4,230) (6,303)
Net Operating Income (based on cash rents) (1) $ 231,747 $ 231,601
Less Net Operating Income from:
Acquisitions (2)(261) 66
Dispositions (3) (4) (20,682) (35,801)
Same Store Net Operating Income (based on cash rents) (5) $ 210,804 $ 195,866
(1) Includes CXP's ownership share of NOI for properties held in unconsolidated joint ventures.
(2) Reflects activity for the following property acquired since January 1, 2018, for all periods presented: 799 Broadway (49.7% share), 101 Franklin (92.5% share), and 201 California Street.
(3) Reflects activity for the following properties sold since January 1, 2018, for all periods presented: Lindbergh Center, One & Three Glenlake, 222 East 41st Street, University Circle (22.5%
share) and 333 Market Street (22.5% share).
(4) Reflects activity for 263 Shuman Boulevard that was transferred to the lender on April 13, 2018.
(5) Reflects NOI from properties that were owned for the entirety of the periods presented.
29
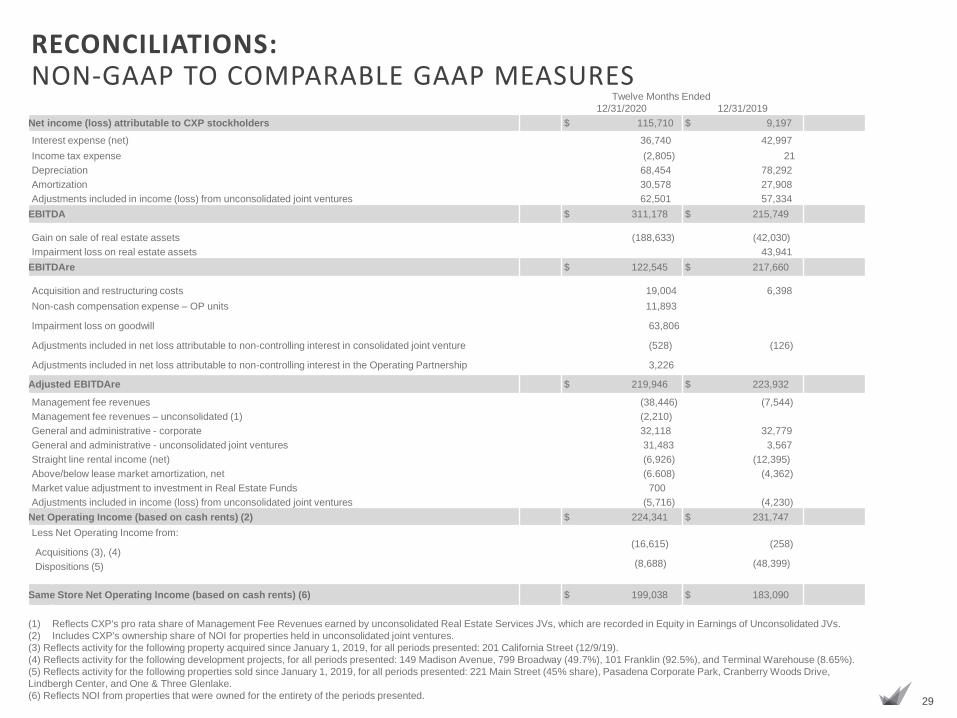
RECONCILIATIONS: NON-GAAP TO COMPARABLE GAAP MEASURES
Twelve Months Ended
12/31/2020 12/31/2019
Net income (loss) attributable to CXP stockholders $ 115,710 $ 9,197
Interest expense (net) 36,740 42,997
Income tax expense (2,805) 21
Depreciation 68,454 78,292
Amortization 30,578 27,908
Adjustments included in income (loss) from unconsolidated joint ventures 62,501 57,334
EBITDA $ 311,178 $ 215,749
Gain on sale of real estate assets (188,633) (42,030)
Impairment loss on real estate assets 43,941
EBITDAre $ 122,545 $ 217,660
Acquisition and restructuring costs 19,004 6,398
Non-cash compensation expense – OP units 11,893
Impairment loss on goodwill 63,806
Adjustments included in net loss attributable to non-controlling interest in consolidated joint venture (528) (126)
Adjustments included in net loss attributable to non-controlling interest in the Operating Partnership 3,226
Adjusted EBITDAre $ 219,946 $ 223,932
Management fee revenues (38,446) (7,544)
Management fee revenues – unconsolidated (1) (2,210)
General and administrative - corporate 32,118 32,779
General and administrative - unconsolidated joint ventures 31,483 3,567
Straight line rental income (net) (6,926) (12,395)
Above/below lease market amortization, net (6.608) (4,362)
Market value adjustment to investment in Real Estate Funds 700
Adjustments included in income (loss) from unconsolidated joint ventures (5,716) (4,230)
Net Operating Income (based on cash rents) (2) $ 224,341 $ 231,747
Less Net Operating Income from:
Acquisitions (3), (4)(16,615) (258)
Dispositions (5) (8,688) (48,399)
Same Store Net Operating Income (based on cash rents) (6) $ 199,038 $ 183,090
(1) Reflects CXP's pro rata share of Management Fee Revenues earned by unconsolidated Real Estate Services JVs, which are recorded in Equity in Earnings of Unconsolidated JVs.
(2) Includes CXP's ownership share of NOI for properties held in unconsolidated joint ventures.
(3) Reflects activity for the following property acquired since January 1, 2019, for all periods presented: 201 California Street (12/9/19).
(4) Reflects activity for the following development projects, for all periods presented: 149 Madison Avenue, 799 Broadway (49.7%), 101 Franklin (92.5%), and Terminal Warehouse (8.65%).
(5) Reflects activity for the following properties sold since January 1, 2019, for all periods presented: 221 Main Street (45% share), Pasadena Corporate Park, Cranberry Woods Drive,
Lindbergh Center, and One & Three Glenlake.
(6) Reflects NOI from properties that were owned for the entirety of the periods presented.
30
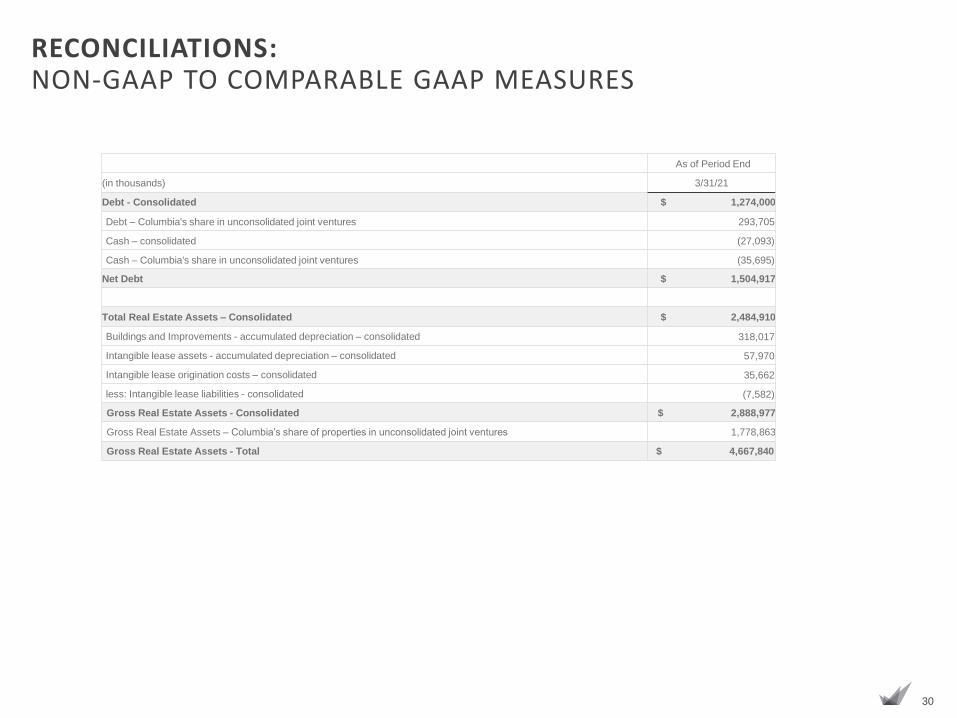
RECONCILIATIONS: NON-GAAP TO COMPARABLE GAAP MEASURES
As of Period End
(in thousands) 3/31/21
Debt - Consolidated $ 1,274,000
Debt – Columbia's share in unconsolidated joint ventures 293,705
Cash – consolidated (27,093)
Cash – Columbia's share in unconsolidated joint ventures (35,695)
Net Debt $ 1,504,917
Total Real Estate Assets – Consolidated $ 2,484,910
Buildings and Improvements - accumulated depreciation – consolidated 318,017
Intangible lease assets - accumulated depreciation – consolidated 57,970
Intangible lease origination costs – consolidated 35,662
less: Intangible lease liabilities - consolidated (7,582)
Gross Real Estate Assets - Consolidated $ 2,888,977
Gross Real Estate Assets – Columbia’s share of properties in unconsolidated joint ventures 1,778,863
Gross Real Estate Assets - Total $ 4,667,840