Embed Size (px)
Citation preview
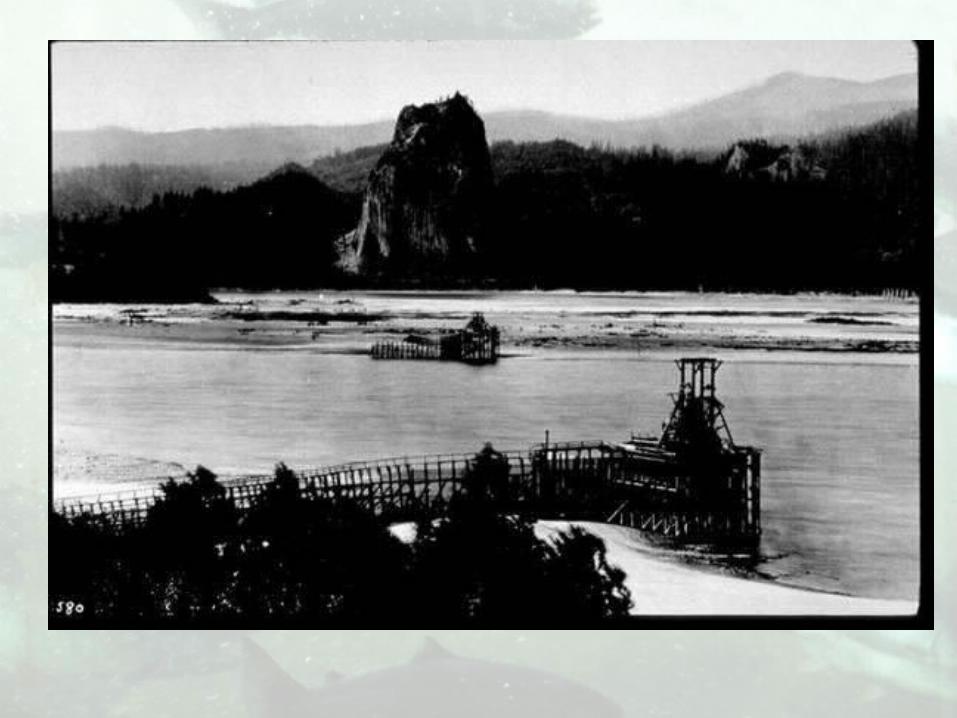
Columbia River salmon:
Who (or what) will save them?
John WilliamsKlarälven meeting in Karlstad
9 May 2011
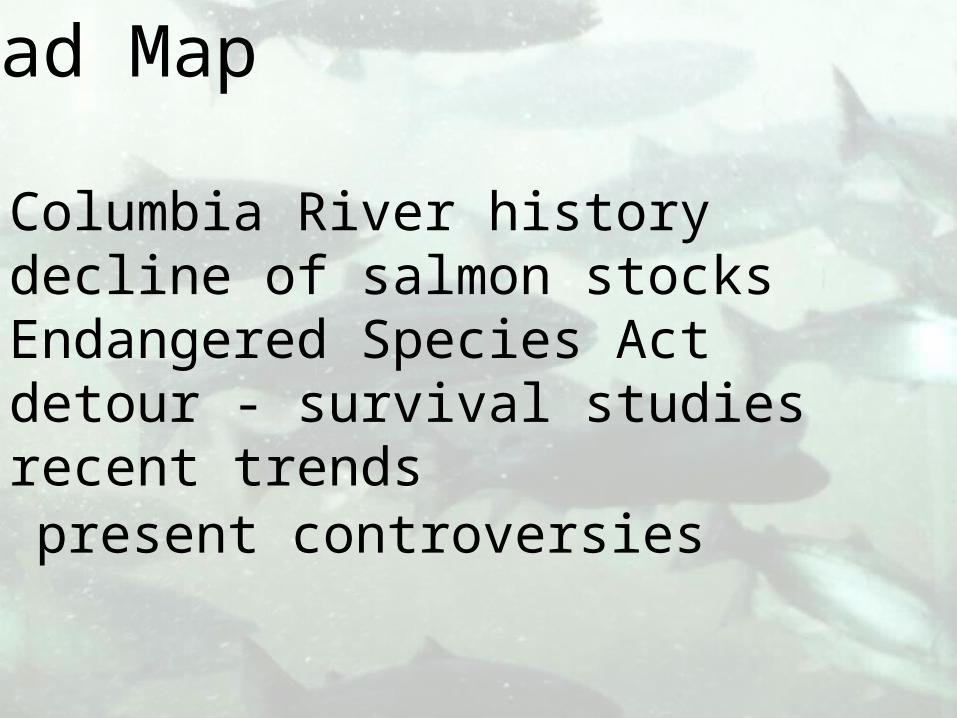
Road Map
• Columbia River history• decline of salmon stocks• Endangered Species Act• detour - survival studies• recent trends• present controversies
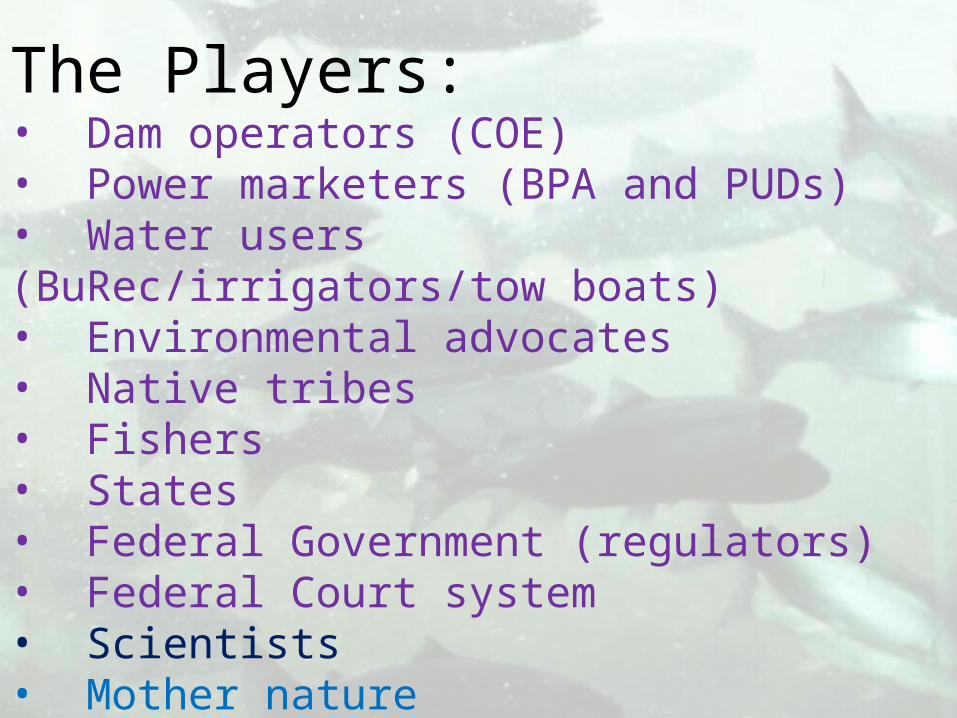
The Players:• Dam operators (COE)• Power marketers (BPA and PUDs)• Water users (BuRec/irrigators/tow boats)• Environmental advocates• Native tribes• Fishers• States• Federal Government (regulators)• Federal Court system• Scientists• Mother nature
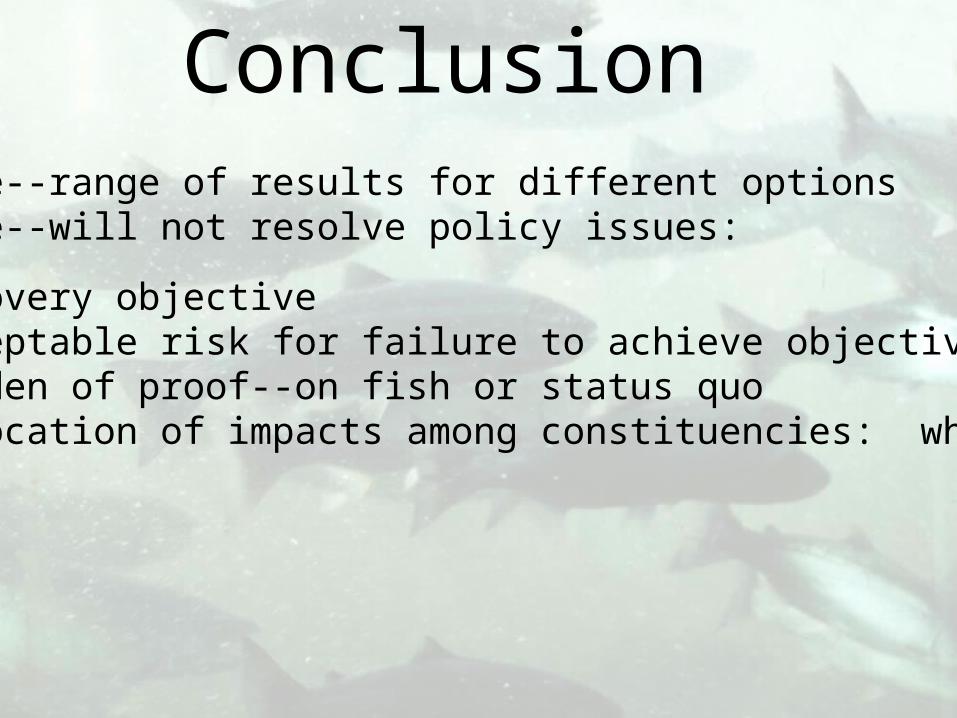
Science--range of results for different options Science--will not resolve policy issues:
• recovery objective• acceptable risk for failure to achieve objective• burden of proof--on fish or status quo• allocation of impacts among constituencies: who pays
Conclusion
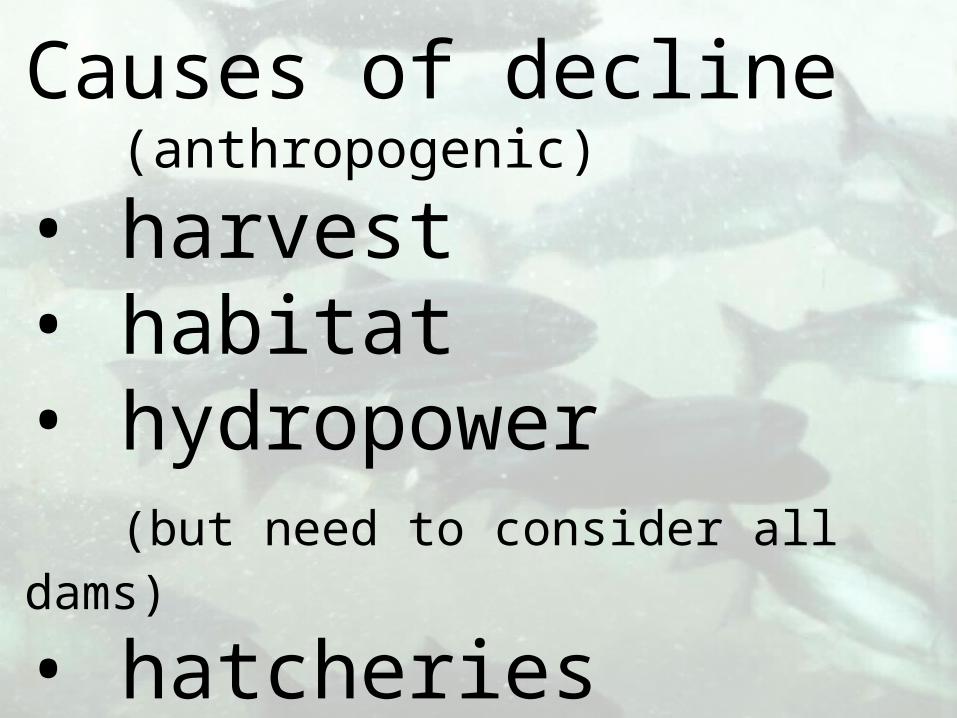
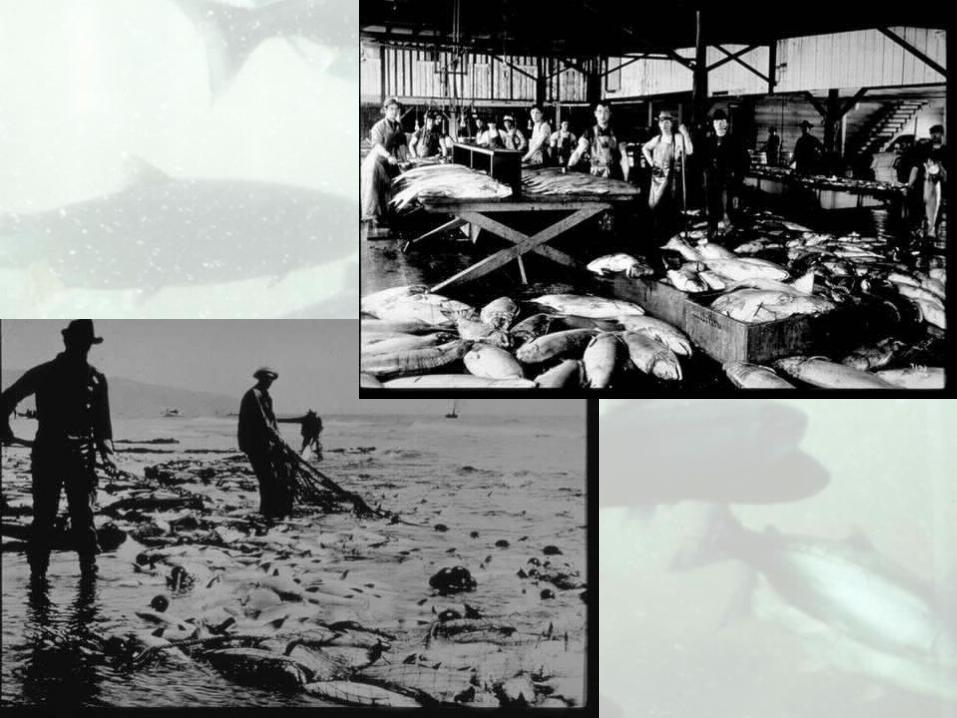
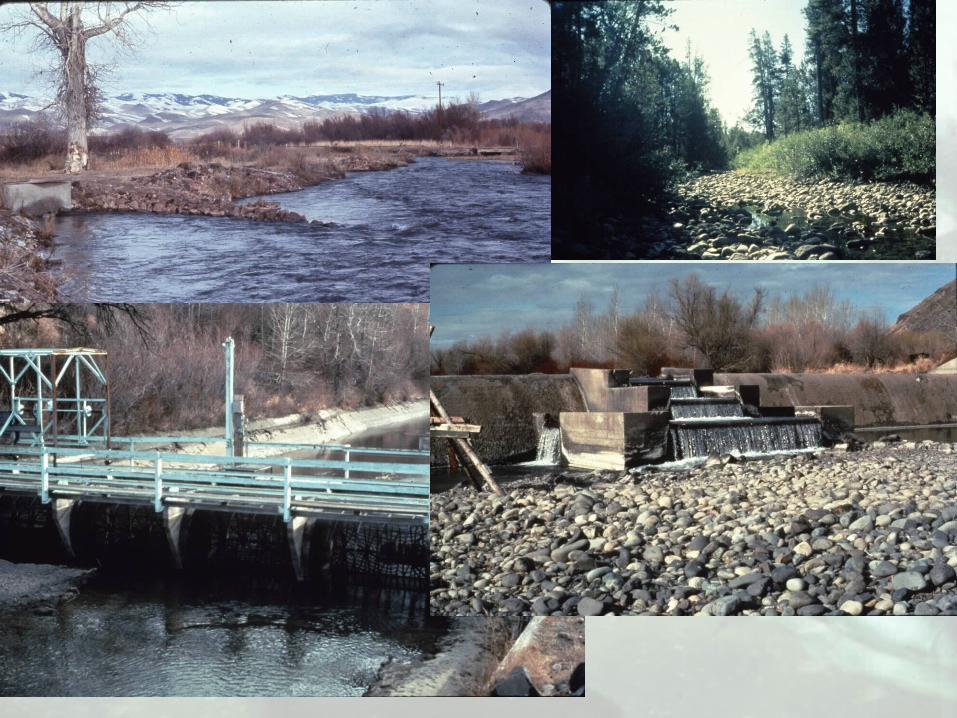
Causes of decline(anthropogenic)
• harvest• habitat• hydropower
(but need to consider all dams)
• hatcheries
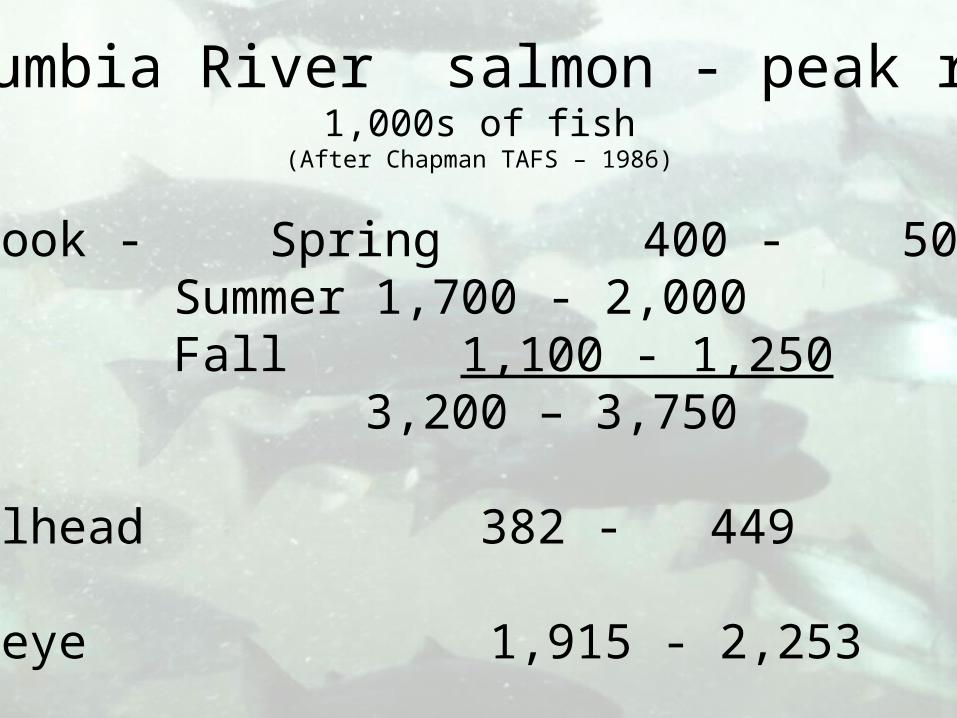
Columbia River salmon - peak runs1,000s of fish
(After Chapman TAFS – 1986)
Chinook - Spring 400 - 500Summer 1,700 - 2,000Fall 1,100 - 1,250
3,200 – 3,750
Steelhead 382 - 449
Sockeye 1,915 - 2,253
190019010
250
500
750
1000
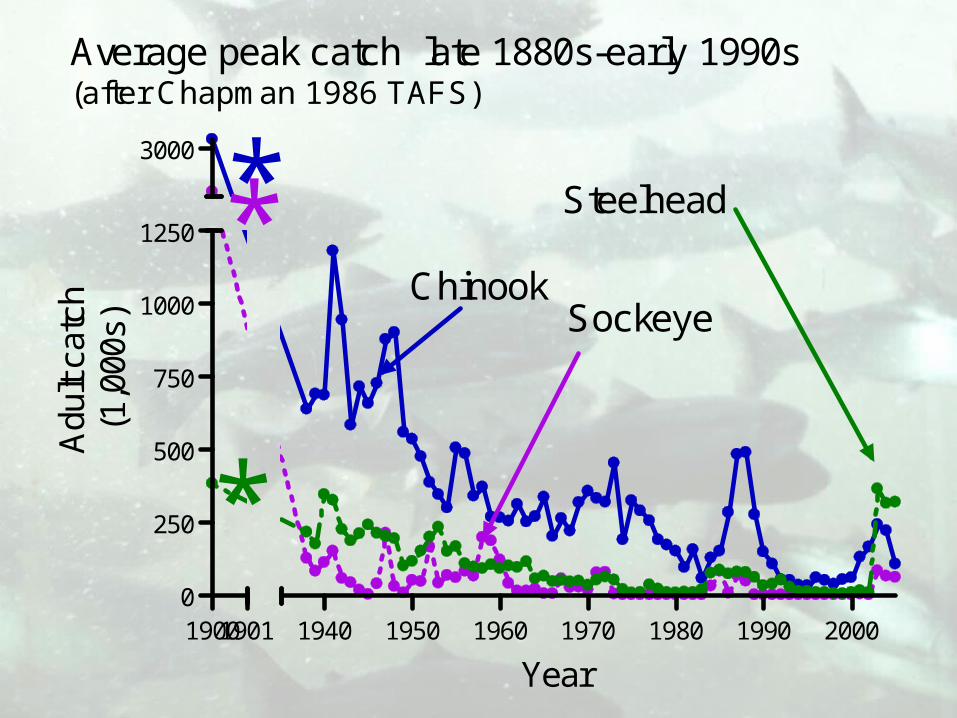
1250Steelhead
Chinook
3000
1940 1950 1960 1970 1980 1990 2000
*
Sockeye
**
Average peak catch late 1880s-early 1990s(after Chapman 1986 TAFS)
Year
Adu
lt ca
tch
(1,0
00s)
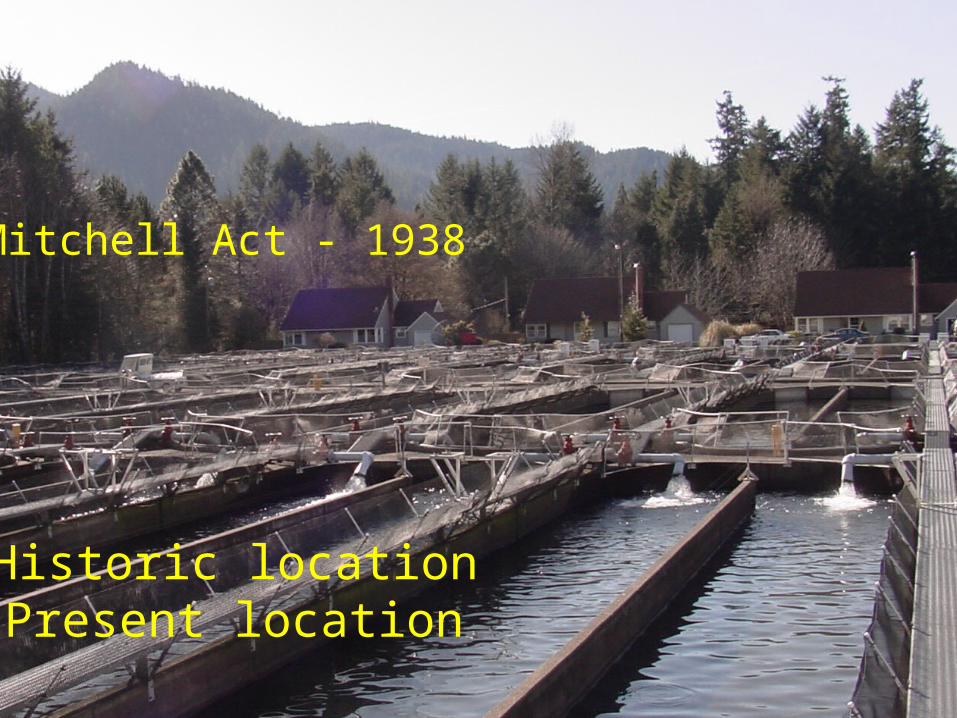
Mitchell Act - 1938
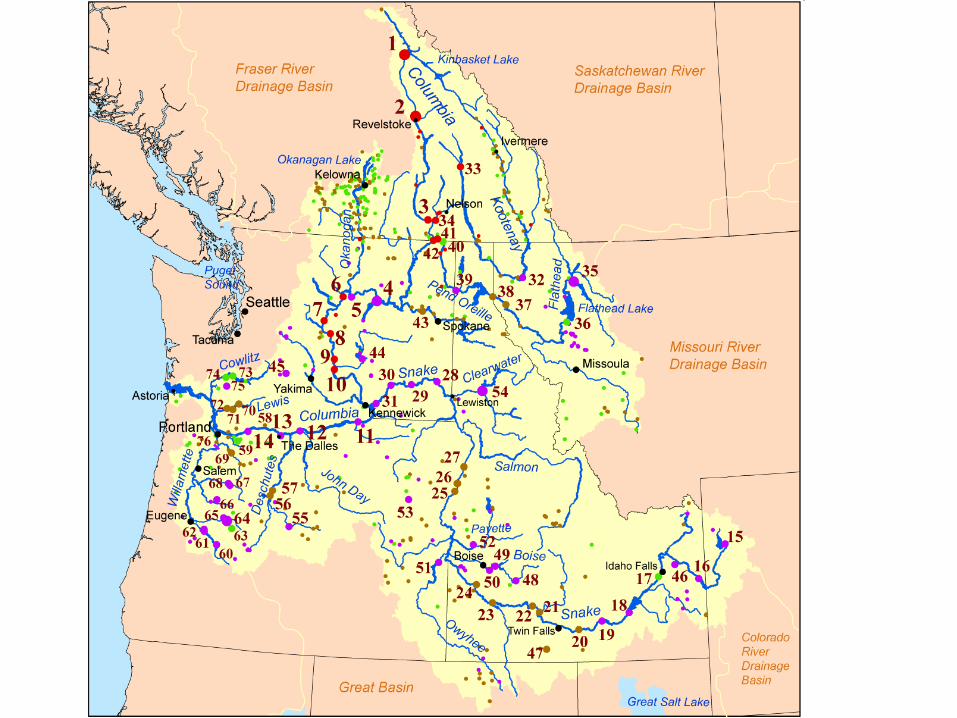
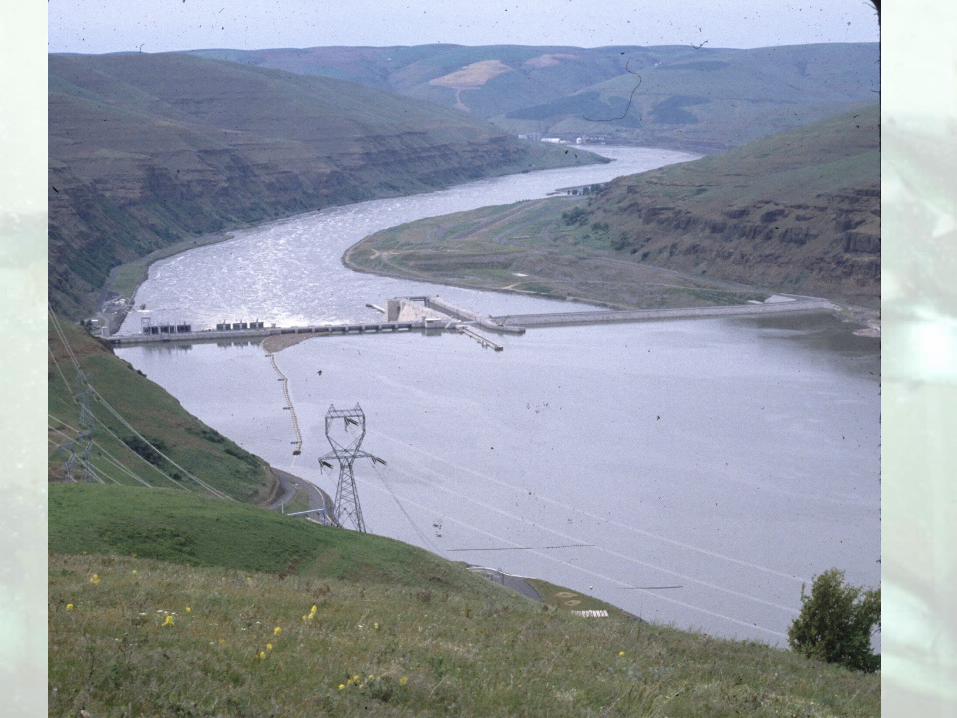
• Historic location• Present location
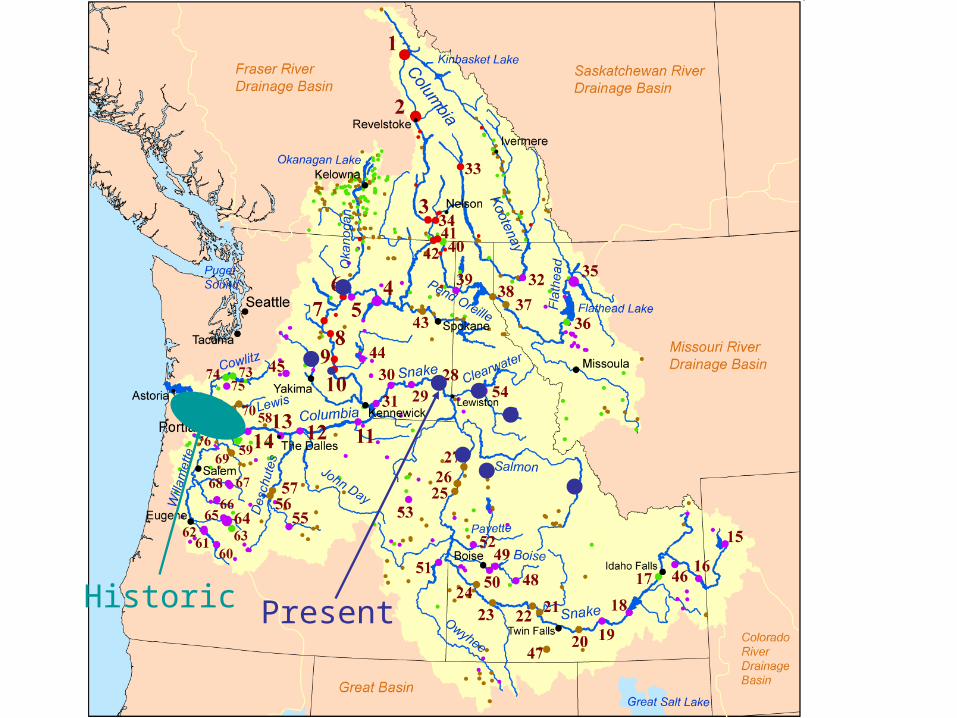
Historic Present
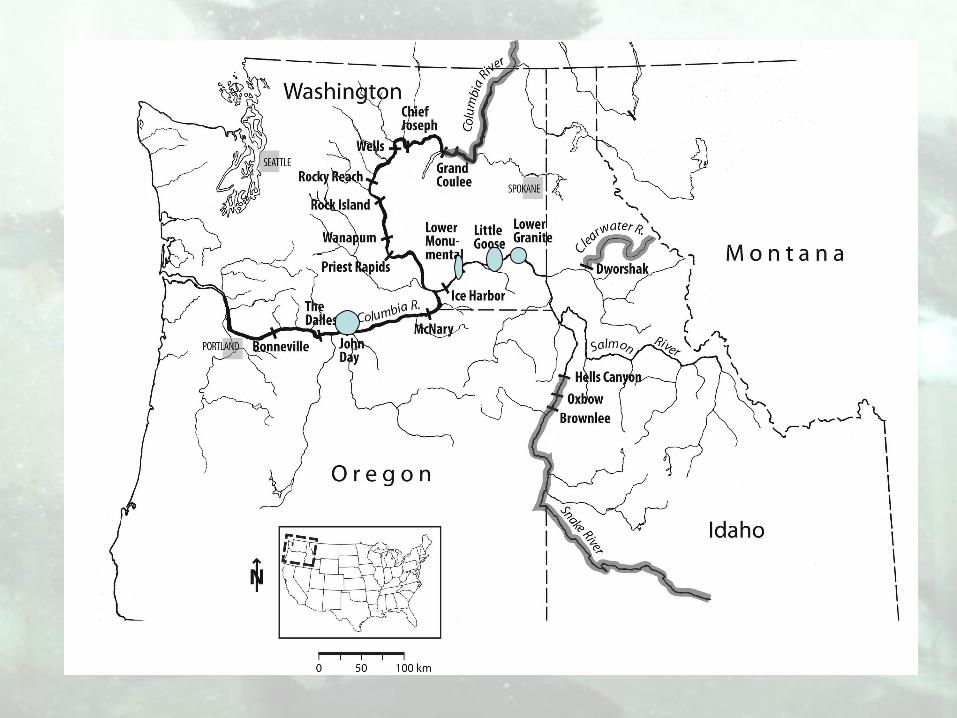
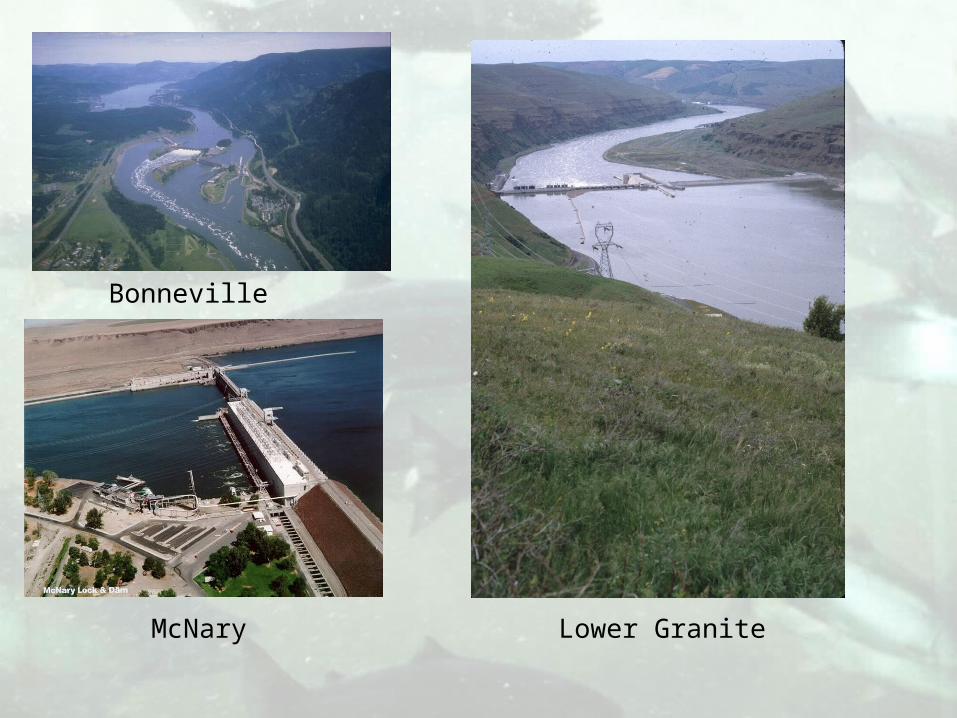
Bonneville
McNary Lower Granite
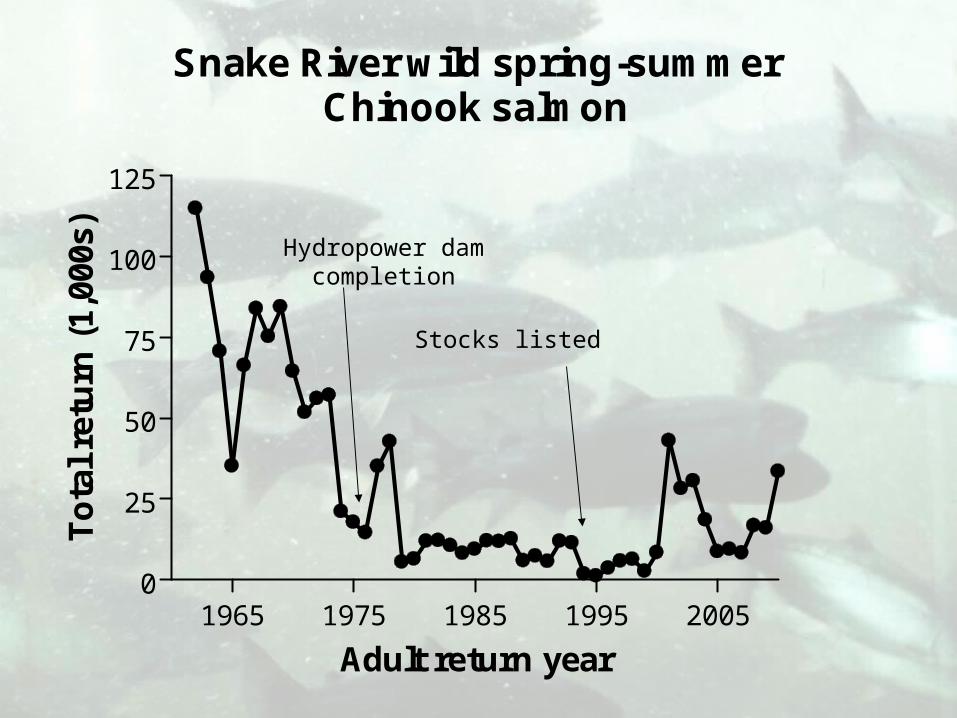
Snake River wild spring-summerChinook salmon
1965 1975 1985 1995 20050
25
50
75
100
125
Adult return year
To
tal
retu
rn (
1,00
0s)
Stocks listed
Hydropower damcompletion
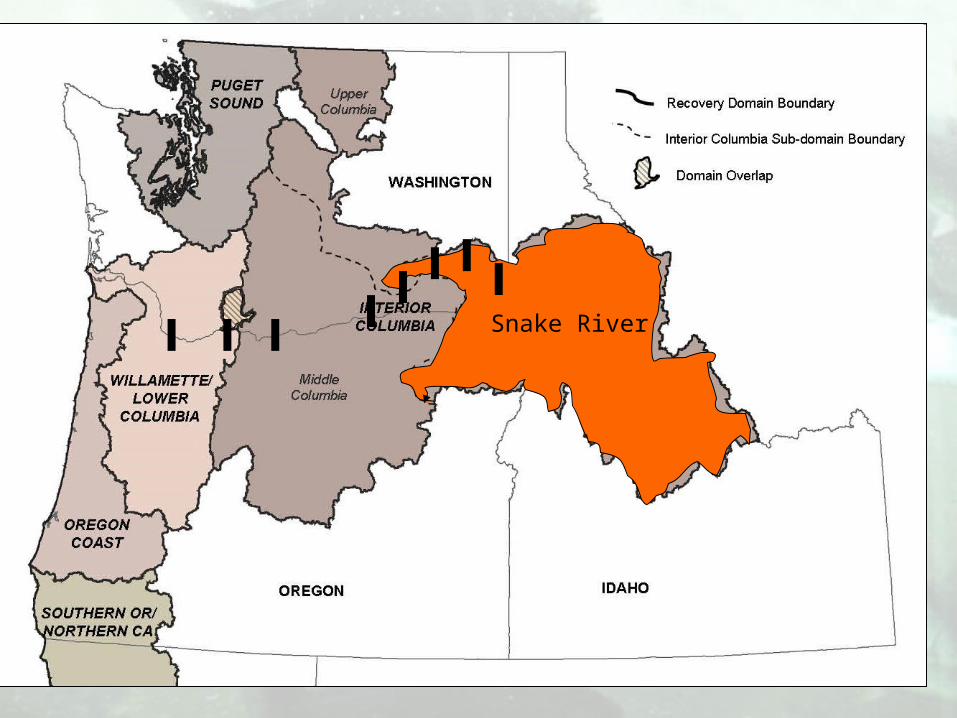
Snake River
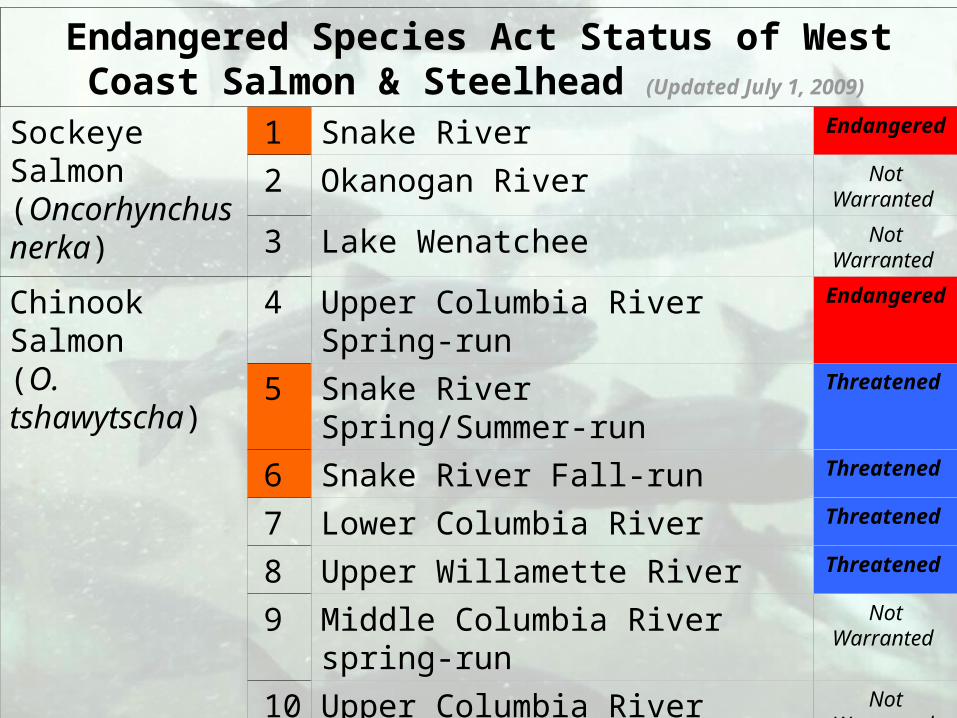
Endangered Species Act Status of West Coast Salmon & Steelhead (Updated July 1, 2009)
Sockeye Salmon (Oncorhynchus nerka)
1 Snake River Endangered
2 Okanogan River Not Warranted
3 Lake Wenatchee Not Warranted
Chinook Salmon (O. tshawytscha)
4 Upper Columbia River Spring-run Endangered
5 Snake River Spring/Summer-run Threatened
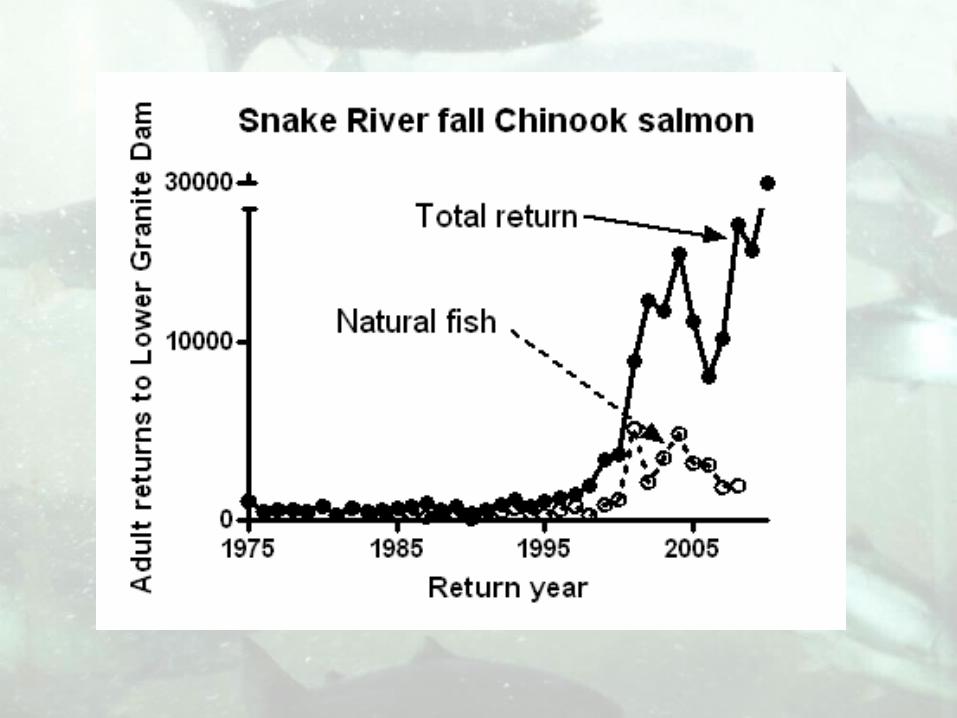
6 Snake River Fall-run Threatened
7 Lower Columbia River Threatened
8 Upper Willamette River Threatened
9 Middle Columbia River spring-run Not Warranted
10 Upper Columbia River summer/fall-run
Not Warranted
12 Deschutes River summer/fall-run Not Warranted
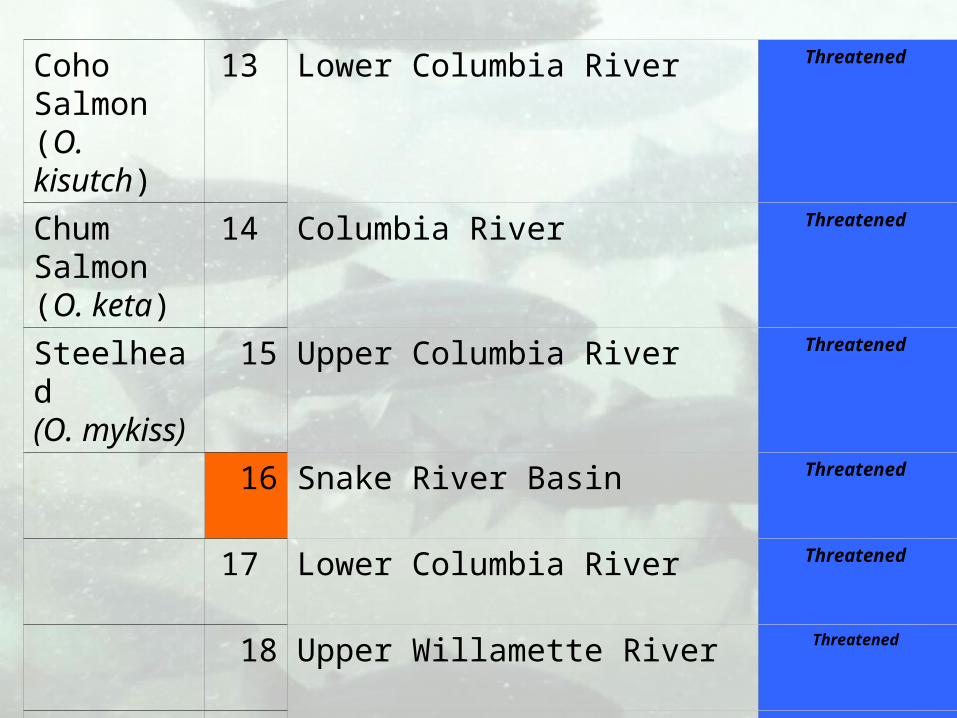
Coho Salmon (O. kisutch)
13 Lower Columbia River Threatened
Chum Salmon (O. keta)
14 Columbia River Threatened
Steelhead(O. mykiss)
15 Upper Columbia River Threatened
16 Snake River Basin Threatened
17 Lower Columbia River Threatened
18 Upper Willamette River Threatened
19 Middle Columbia River Threatened
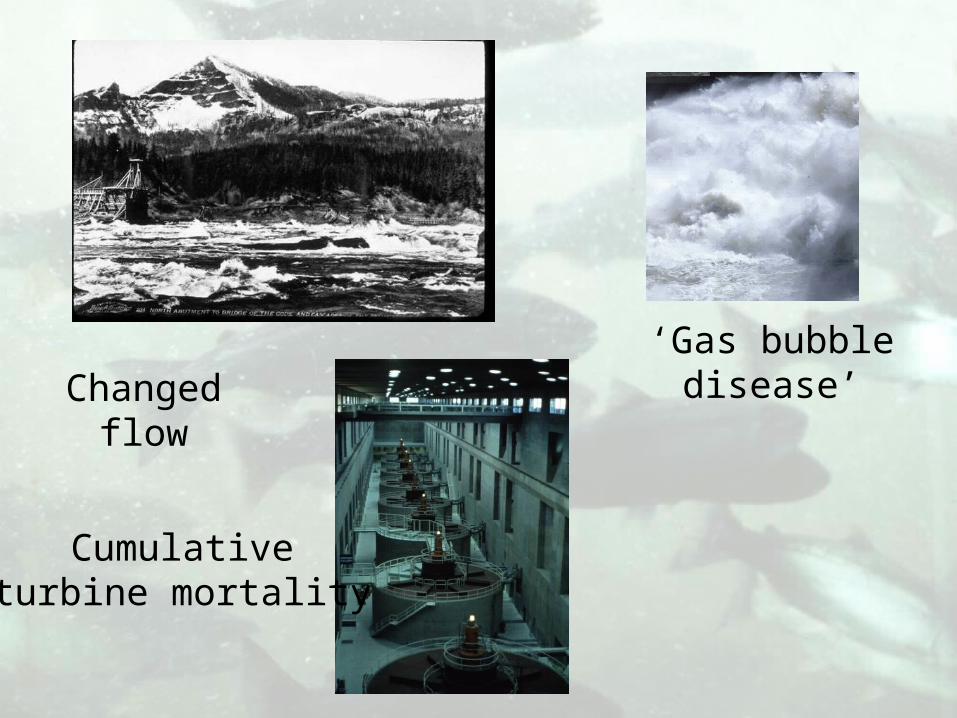
Changed flow
Cumulativeturbine mortality
‘Gas bubbledisease’
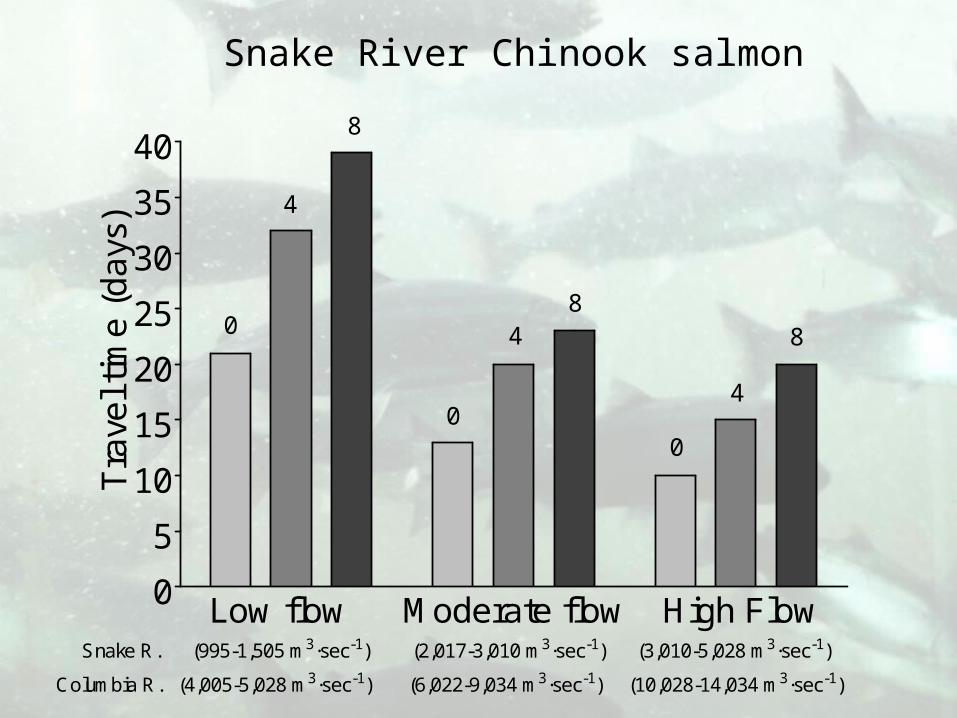
Snake River Chinook salmon
0
5
10
15
20
25
30
35
40
Low flow Moderate flow High FlowSnake R. (995-1,505 m3·sec-1) (2,017-3,010 m3·sec-1) (3,010-5,028 m3·sec-1)
Columbia R. (4,005-5,028 m3·sec-1) (6,022-9,034 m3·sec-1) (10,028-14,034 m3·sec-1)
0
4
8
0
48
0
4
8
Tra
vel t
ime
(d
ays
)
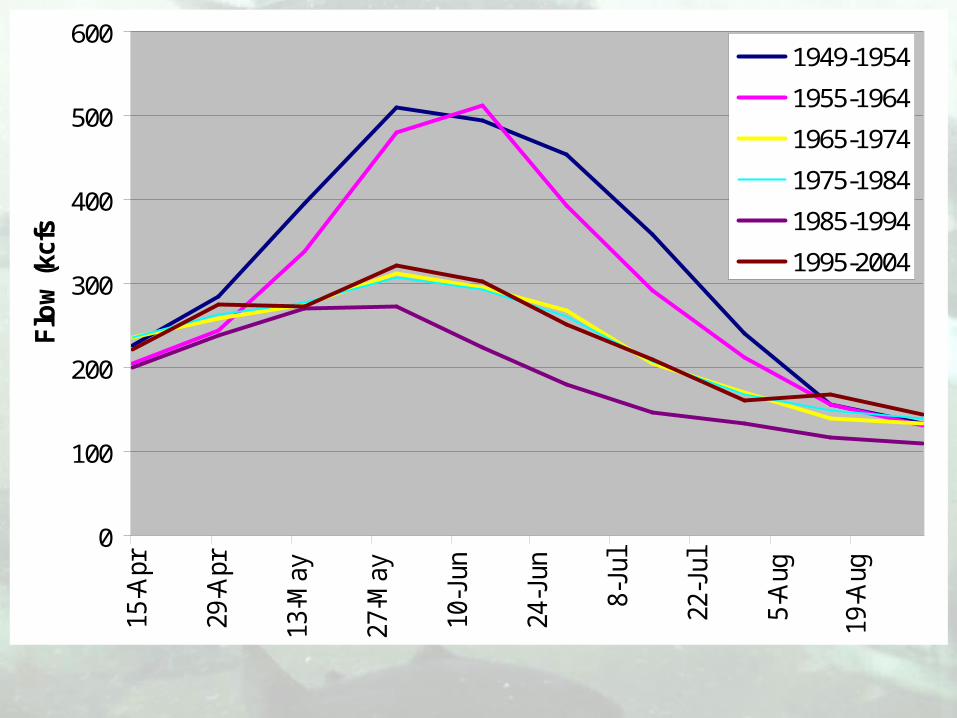
0
100
200
300
400
500
600
15-A
pr
29-A
pr
13-M
ay
27-M
ay
10-J
un
24-J
un
8-Ju
l
22-J
ul
5-A
ug
19-A
ug
Flo
w (
kcfs
)1949-1954
1955-1964
1965-1974
1975-1984
1985-1994
1995-2004
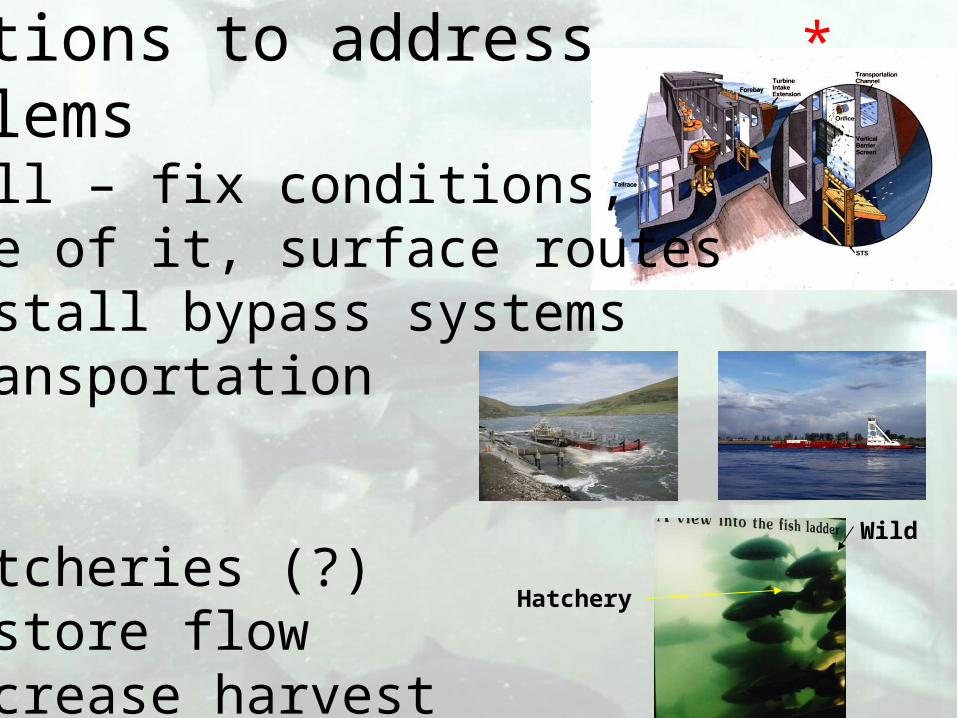
Solutions to addressproblems1.Spill – fix conditions, more of it, surface routes 2. Install bypass systems3. Transportation
4. Hatcheries (?)5. Restore flow6. Decrease harvest
Hatchery
Wild
*
Hatcheries• Juvenile releases• Effects on wild spawners
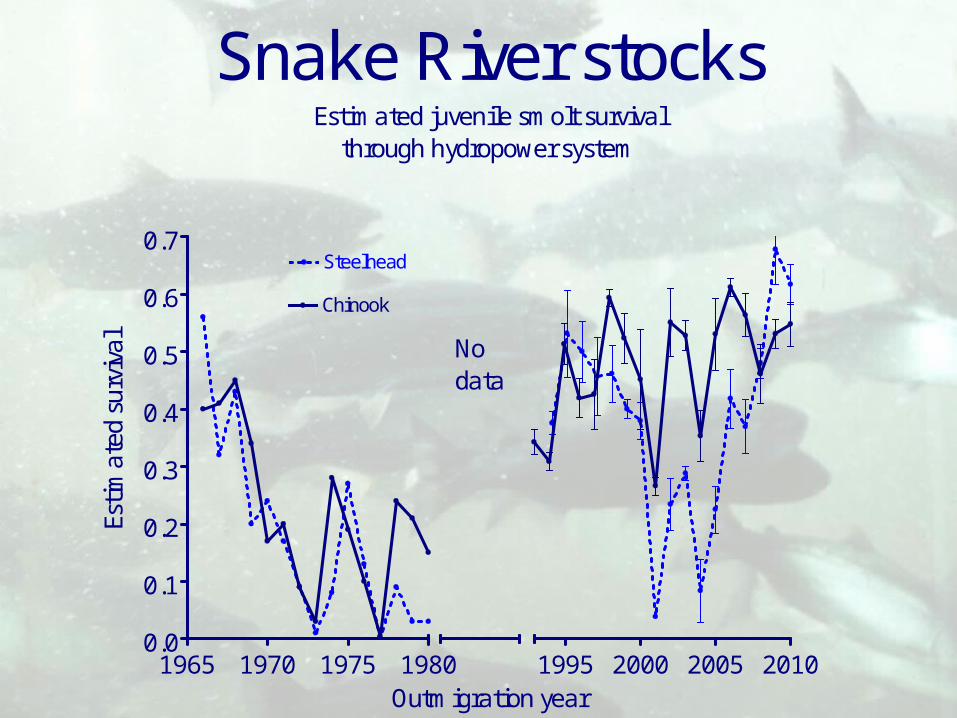
Snake River stocksEstimated juvenile smolt survival
through hydropower system
1965 1970 1975 19800.0
0.1
0.2
0.3
0.4
0.5
0.6
0.7
1995 2000 2005 2010
Nodata
Chinook
Steelhead
Outmigration year
Estim
ated
sur
viva
l
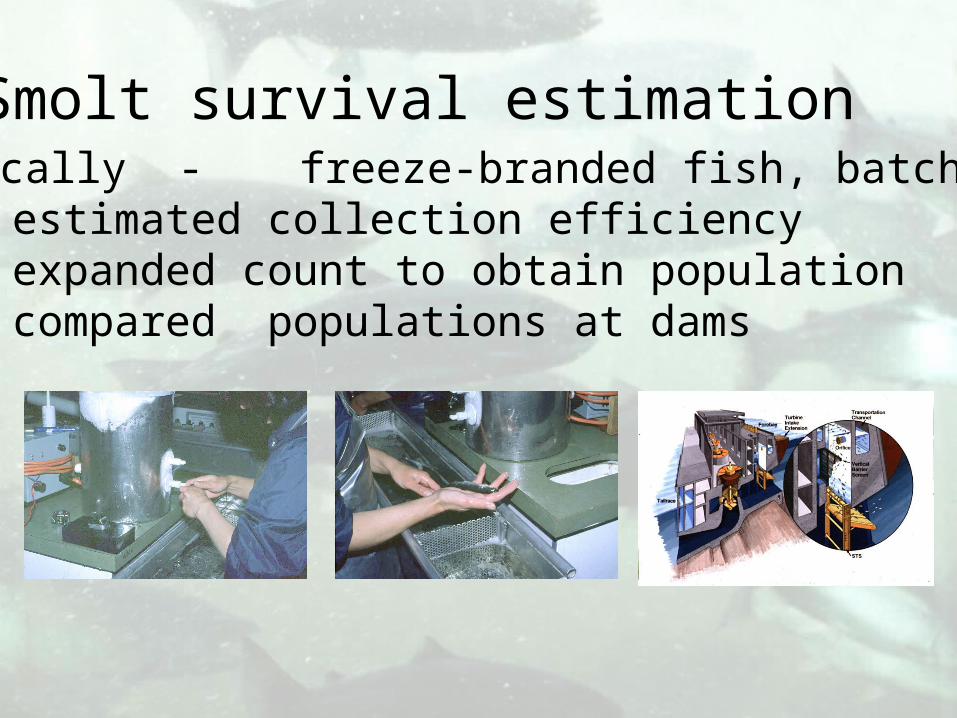
Smolt survival estimationHistorically - freeze-branded fish, batch marked
estimated collection efficiencyexpanded count to obtain populationcompared populations at dams
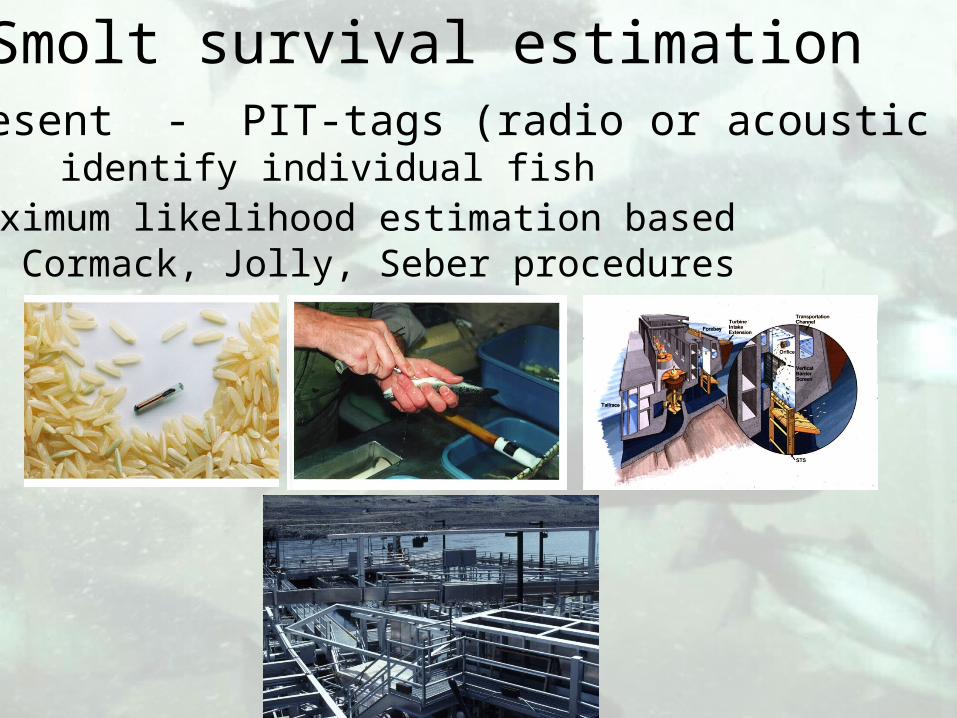
At present - PIT-tags (radio or acoustic tags) identify individual fish
maximum likelihood estimation basedon Cormack, Jolly, Seber procedures
Smolt survival estimation
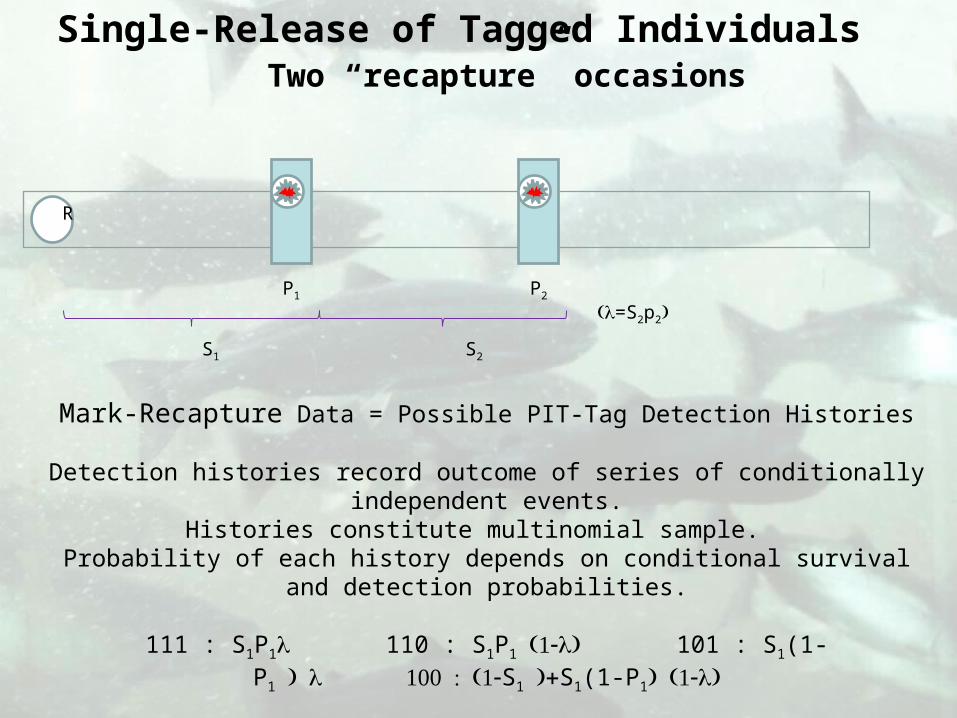
Single-Release of Tagged IndividualsTwo “recapture” occasions
Mark-Recapture Data = Possible PIT-Tag Detection Histories
Detection histories record outcome of series of conditionally independent events.Histories constitute multinomial sample.
Probability of each history depends on conditional survival and detection probabilities.
111 : S1P1110 : S1P1101 : S1(1-P1S1S1(1-P1
=S2p2P1
S2
P2
R
S1
•Many assumptions
•Some not met exactly
•Bias in survival estimates
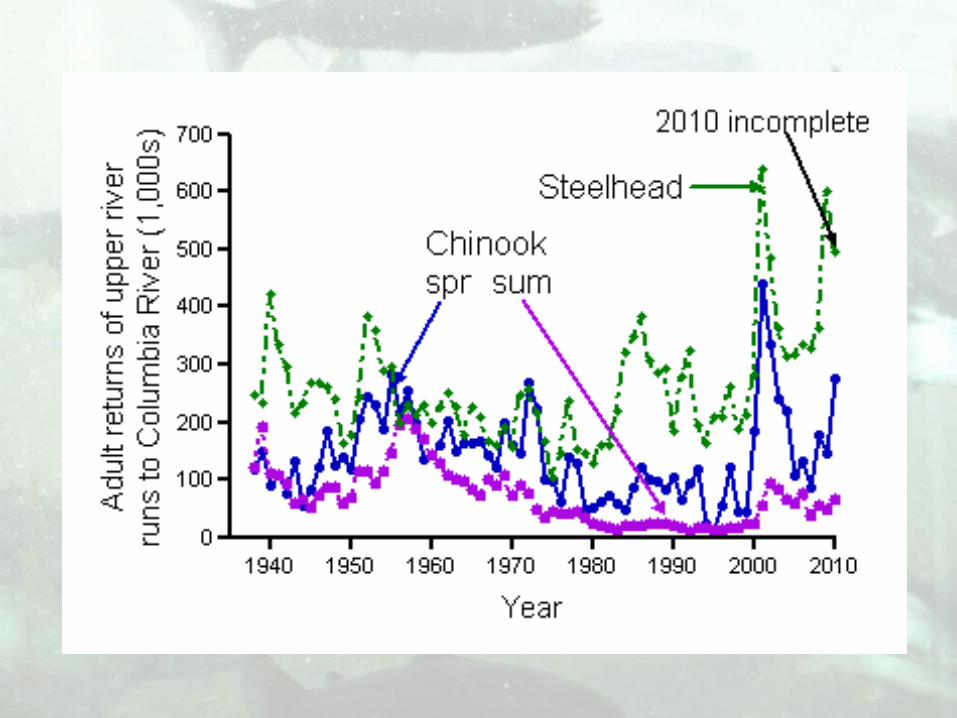
Status of stocks at present
(empirical data)
1960 1975 1990 20050
1
2
3
4
5
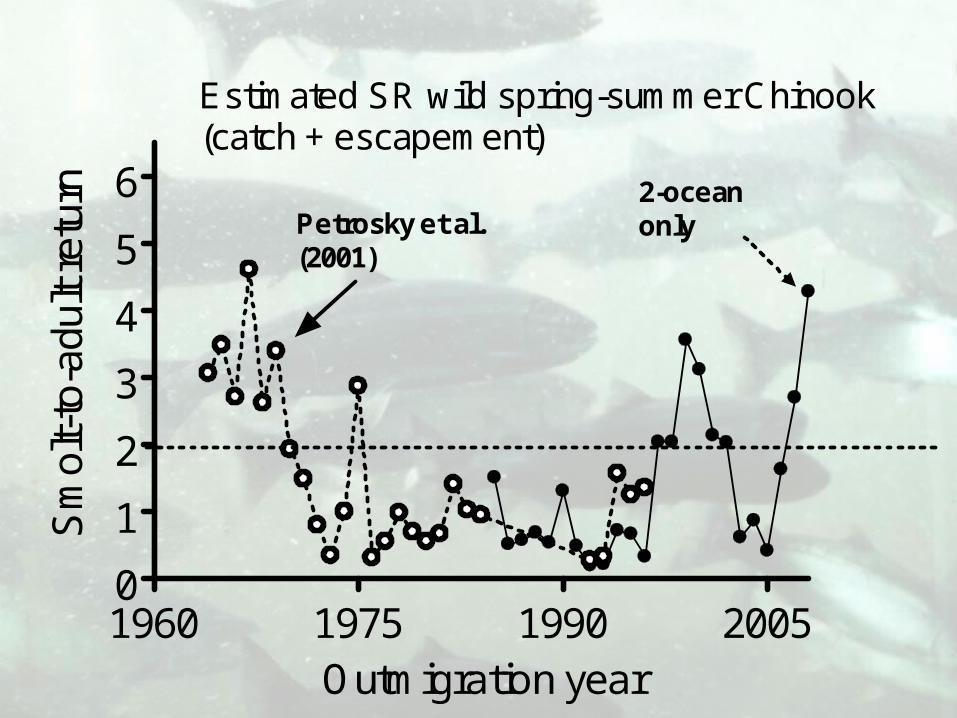
6Petrosky et al.(2001)
Estimated SR wild spring-summer Chinook(catch + escapement)
2-oceanonly
Outmigration year
Sm
olt-
to-a
dult
retu
rn
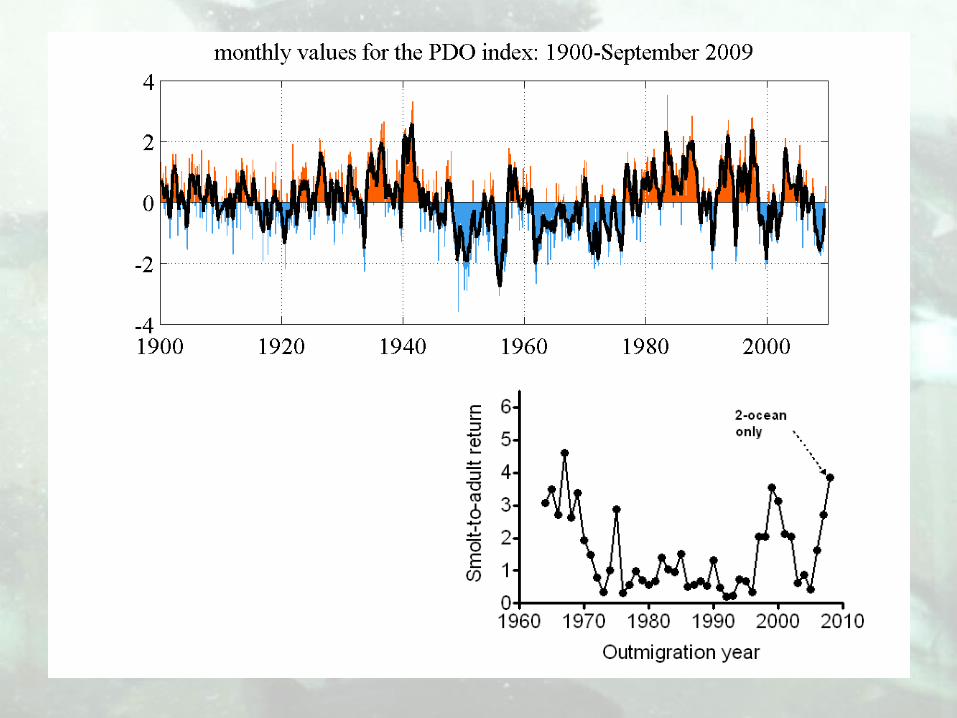
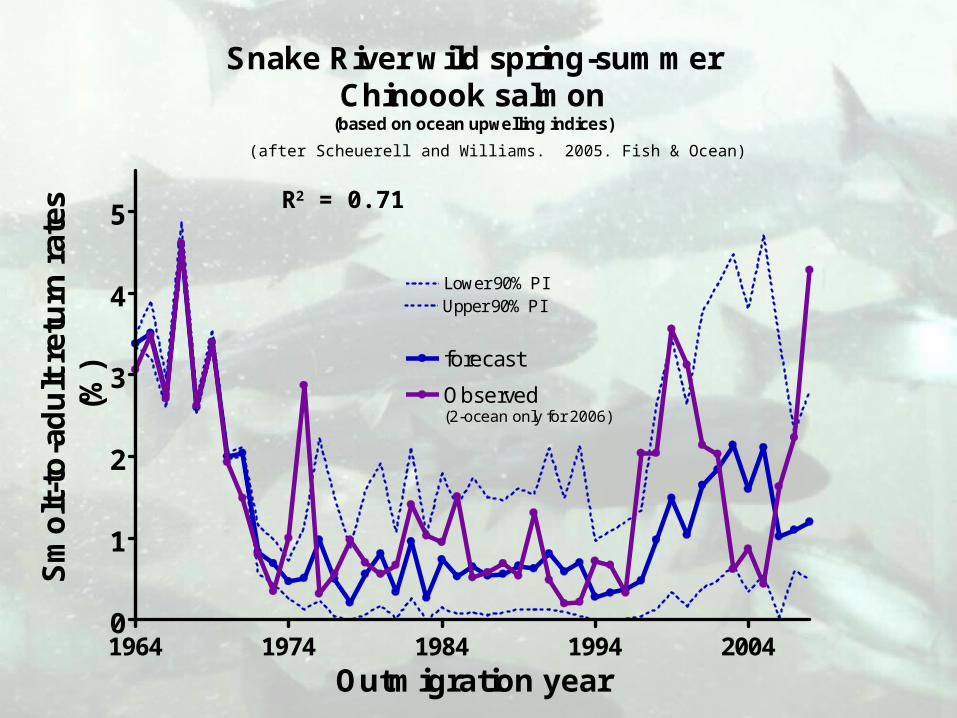
Snake River wild spring-summerChinoook salmon
(based on ocean upwelling indices)
1964 1974 1984 1994 20040
1
2
3
4
5
forecast
Lower 90% PIUpper 90% PI
Observed(2-ocean only for 2006)
Outmigration year
Sm
olt
-to
-ad
ult
ret
urn
rat
es(%
)
R2 = 0.71
(after Scheuerell and Williams. 2005. Fish & Ocean)
1995 1996 1997 1998 1999 2000 2001 2002 2003 2004 2005 2006 2007 20080.0
0.5
1.0
1.5
2.0
2.5
3.0
3.5
4.0
4.5
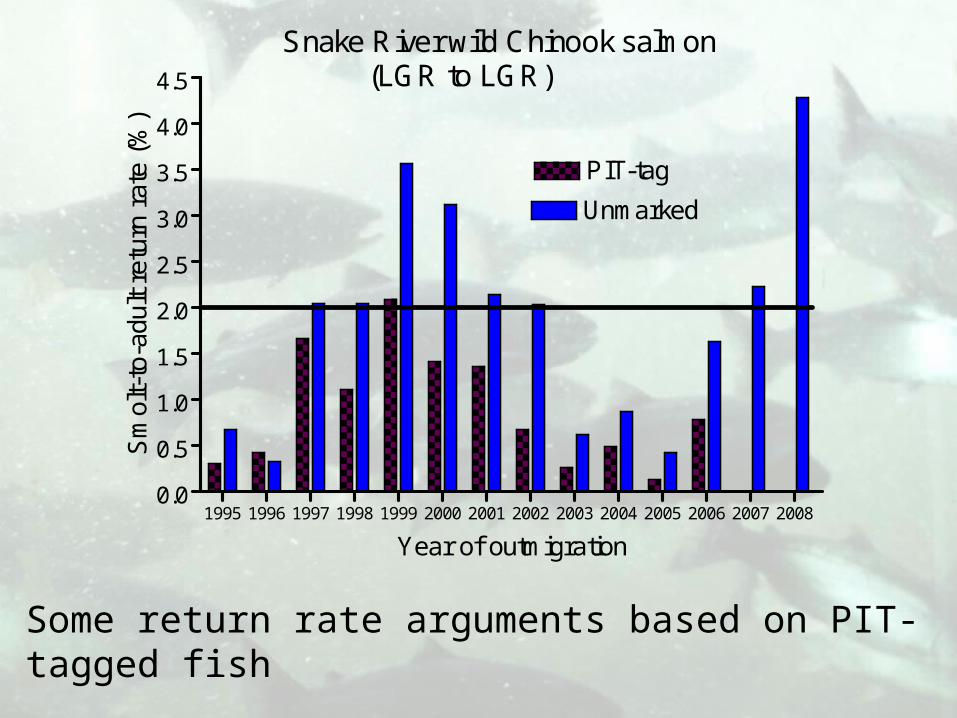
Snake River wild Chinook salmon (LGR to LGR)
Unmarked
PIT-tag
Year of outmigration
Sm
olt-
to-a
dult
retu
rn r
ate
(%)
Some return rate arguments based on PIT-tagged fish
But, absolute numbers of wildfish returns less
What will happenin the future?
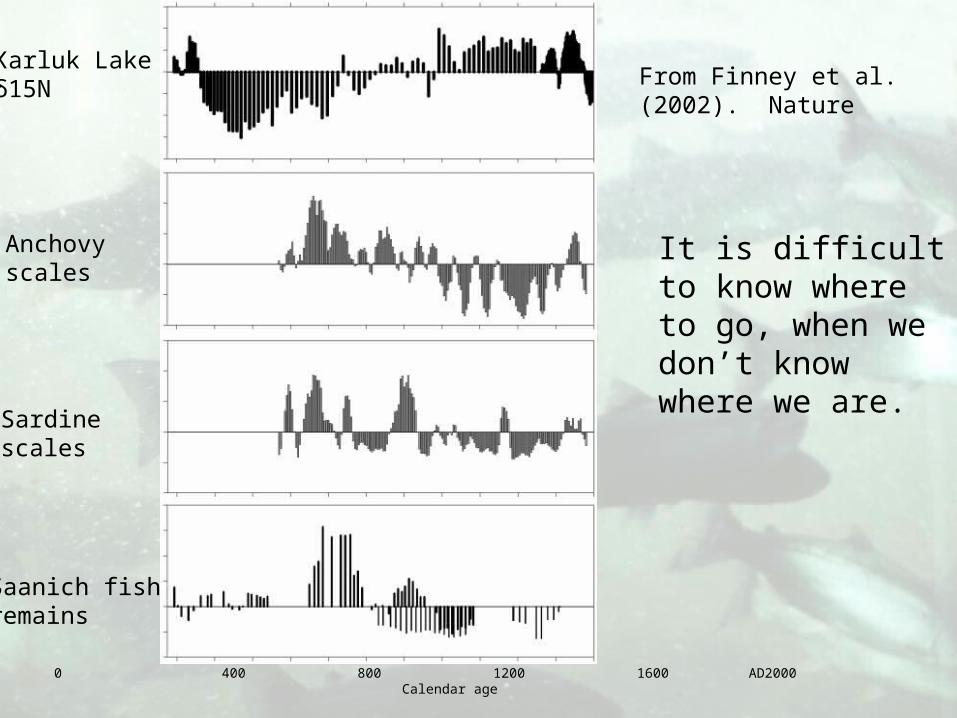
Karluk Lakeδ15N
Anchovyscales
Sardinescales
Saanich fishremains
0 400 800 1200 1600 AD2000 Calendar age
From Finney et al.(2002). Nature
It is difficult to know where to go, when we don’t know where we are.
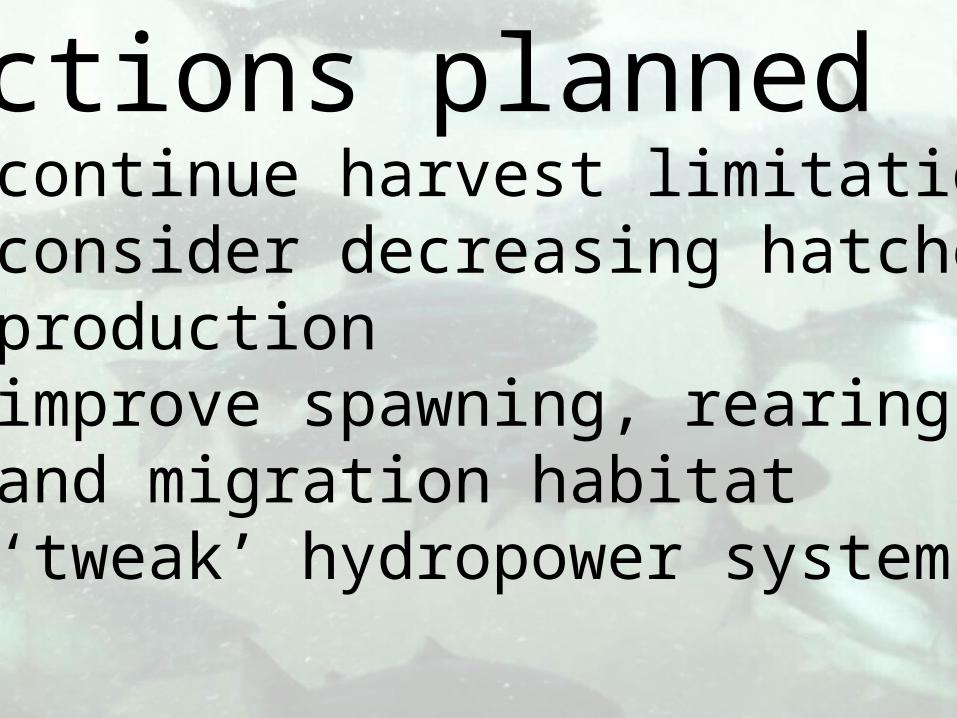
Actions planned• continue harvest limitations• consider decreasing hatchery production• improve spawning, rearing, and migration habitat• ‘tweak’ hydropower system
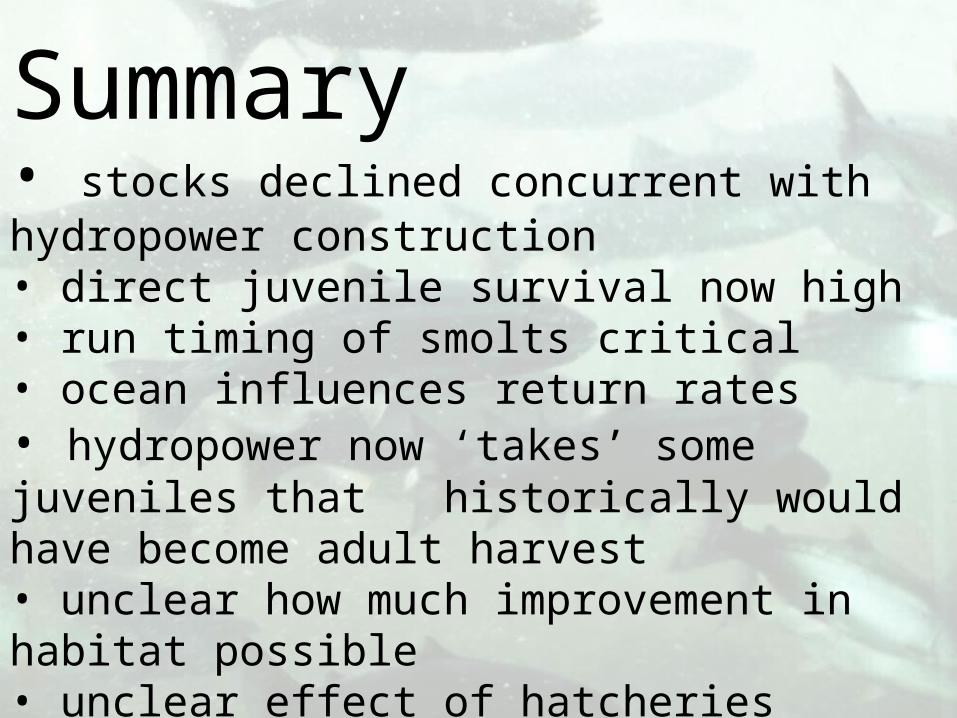
Summary• stocks declined concurrent with hydropower construction• direct juvenile survival now high• run timing of smolts critical • ocean influences return rates• hydropower now ‘takes’ some juveniles that historically would have become adult harvest• unclear how much improvement in habitat possible• unclear effect of hatcheries
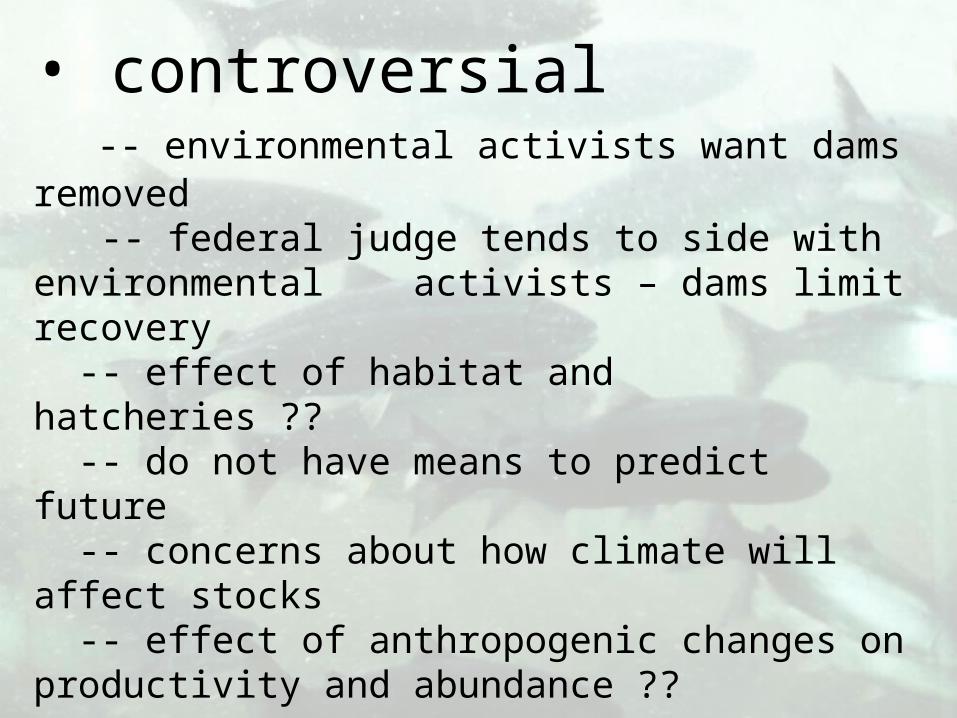
• controversial -- environmental activists want dams removed -- federal judge tends to side with environmental activists – dams limit recovery -- effect of habitat and hatcheries ?? -- do not have means to predict future -- concerns about how climate will affect stocks -- effect of anthropogenic changes on productivity and abundance ??

Thanks for your attention
Comments?
Questions?