Embed Size (px)
Citation preview

Column Supported Embankments with Geosynthetic
Encased Columns: Validity of the Unit Cell Concept
Majid Khabbazian1; Victor N. Kaliakin2; Christopher L. Meehan3
Abstract: Column supported embankments (CSEs) are used to overcome common problems associated with theconstruction of embankments over soft compressible soils. The use of granular columns as deep foundation elementsfor CSEs can be problematic in soft soils due to the lack of adequate lateral confining pressure, particularly in theupper portion of the column. Using a high-strength geosynthetic for granular column confinement forms geosyntheticencased columns (GECs); the confinement imposed by the geosynthetic increases the strength of the column, andalso prevents its lateral displacement into the soft surrounding soil. This paper presents the results of finite elementanalyses of a hypothetical geosynthetic reinforced column supported embankment (GRCSE) (i.e., a CSE underlain bygeosynthetic reinforcement) that is constructed with GECs as the deep foundation elements. Full three-dimensional(3-d), 3-d unit cell, and axisymmetric unit cell analyses of the GRCSE were carried out to investigate the validity of theunit cell concept. The effect of the degree of nodal constraint along the bottom boundary when numerically modelingGRCSEs was also studied in this paper. Numerical results show that a full 3-d idealization is required to more preciselydetermine the tension forces that are produced in the geosynthetic reinforcement that underlies the GRCSE. A numberof design parameters such as the average vertical stresses carried by the GECs, lateral displacement of the GECs, andthe maximum settlement of the soft foundation soil, however, can be successfully calculated using unit cell analyses.
DOI: 10.1007/s10706-014-9826-8
Keywords: Geosynthetics; Granular column; Geosynthetic encased column; Unit cell; 3-d finite element analysis.
Copyright: This paper is part of Geotechnical and Geological Engineering, Vol. 33, No. 3, June 2015, ISSN 0960-3182.The copyright for this work is held by Springer International Publishing AG. The original publication of this work canbe obtained by following the DOI link above.
Reference: Khabbazian, M., Kaliakin, V. N., and Meehan, C. L. (2015). “Column Supported Embankments withGeosynthetic Encased Columns: Validity of the Unit Cell Concept.” Geotechnical and Geological Engineering, Springer,33(3), 425-442. (doi:10.1007/s10706-014-9826-8)
Note: The manuscript for this paper was submitted for review and possible publication on March 27, 2014; approved forpublication on October 8, 2014; and published online in January of 2015.
1 Introduction
When constructing embankments over soft compressiblesoils, it is usually necessary to use some form of groundimprovement to overcome common geotechnical engineer-ing problems in the foundation soil, such as bearing capac-ity failure, slope instability, lateral spreading, and largetotal and/or differential settlements. The use of columnsupported embankments (CSEs) offers numerous advan-
1Geotechnical Engineer, Earth Engineering Incorporated, EastNorriton, PA 19401, U.S.A. (Formerly, Graduate Student, Univer-sity of Delaware, Dept. of Civil and Environmental Engineering, 301DuPont Hall, Newark, DE 19716, U.S.A.) E-mail: [email protected]
2Professor, University of Delaware, Dept. of Civil and Environ-mental Engineering, 301 DuPont Hall, Newark, DE 19716, U.S.A.E-mail: [email protected]
3Bentley Systems Incorporated Chair of Civil Engineering & As-sociate Professor, University of Delaware, Dept. of Civil and Envi-ronmental Engineering, 301 DuPont Hall, Newark, DE 19716, U.S.A.E-mail: [email protected] (corresponding author)
tages over alternative ground improvement techniques inthe realm of embankment construction, including: rela-tively rapid construction, comparatively small total anddifferential settlements, and protection of adjacent facili-ties (e.g., Collin 2004; Han et al. 2004).
When constructing CSEs, one or more layers of geosyn-thetic can be placed over the columns/pile caps to forma geosynthetic reinforced column supported embankment(GRCSE). The use of this type of geosynthetic “bridginglayer” over the columns and soft soil foundation enhancesthe load transfer efficiency from the embankment to thedeep foundation elements and reduces the required areareplacement ratio of the columns (the area replacementratio is defined as the ratio of the area of the column tothe total area of the column plus its tributary area) (Law-son 1992; Russell and Pierpoint 1997; Kempton et al. 1998;Han and Gabr 2002). In addition to transferring embank-ment loads to the columns, the use of a geosynthetic re-
1
inforcement layer also helps to resist horizontal thrust atthe sides of an embankment, which eliminates the need forusing inclined columns in this area.
In GRCSEs, the columns have the important role oftransferring the surcharge and embankment loads from theground surface to a stiffer underlying layer. A wide rangeof deep foundation systems (i.e., stiff or non-stiff columns)can be used in GRCSE construction. In very soft soils,however, it is well understood that the use of granularcolumns can be problematic due to the lack of adequatelateral confining pressure, particularly in the upper por-tion of the column. Using a high-strength geosyntheticfor encasement of granular columns increases the strengthof a given column and improves its stress-displacementresponse (e.g., Al-Joulani and Bauer 1995; Alexiew etal. 2005; Murugesan and Rajagopal 2007; Khabbazian etal. 2009, 2010a, b); the resulting foundation elements arecommonly referred to as geosynthetic encased columns(GECs).
The field behavior of GRCSEs is truly three-dimensional(3-d), as each column is not continuous in the out-of-planedirection (e.g., Kempton et al. 1998; Liu et al. 2007; Huanget al. 2009; Jenck et al. 2009). The complicated mechanismof load transfer in GRCSEs combines arching effects, ten-sion in the geosynthetic reinforcement, and stress concen-trations (Han and Wayne 2000).
Smith and Filz (2007) performed axisymmetric and 3-danalyses of GRCSEs. In these analyses the columns wererelatively stiff (e.g., deep-mixed soil-cement) and thus notencased. Square pile caps topped the columns. Smithand Filz (2007) stated that 3-d numerical analyses arenecessary to calculate the strains and tensile forces thatdevelop in orthotropic geosynthetic reinforcement. Theyalso stated that stress concentrations in the geosyntheticreinforcement at the corner of a square pile cap can onlybe captured through a 3-d numerical analysis.
Some 3-d analyses of GRCSEs and CSEs have been per-formed to simulate the behavior of a row of columns in thetransverse direction (e.g., Huang et al. 2006, 2009; Liu etal. 2007; Jenck et al. 2009; Wachman et al. 2010). Three-dimensional analyses have also been performed to capturethe behavior of a “unit cell” (e.g., Kempton et al. 1998;Stewart and Filz 2005; Chew et al. 2006). The columns inthese analyses were, however, not encased.
Even though 3-d analyses are most appropriate for thenumerical simulation of GRCSEs and CSEs, the majorityof past numerical models of these geostructures have as-sumed the solution domain to be two-dimensional (2-d).These analyses have historically been performed assum-ing either plane strain (e.g., Jones et al. 1990; Kempton etal. 1998; Han et al. 2005, 2007; Yan et al. 2006; Oh and Shin2007; Tan et al. 2008; Huang et al. 2009; Zheng et al. 2009)or axisymmetric (e.g., Han and Gabr 2002; Vega-Meyerand Shao 2005; Smith and Filz 2007; Chen et al. 2008; Tanet al. 2008; Borges et al. 2009; Huang et al. 2009; Zheng etal. 2009; Plaut and Filz 2010) idealizations.
The concept of a “unit cell” has been the most pop-ular approach for numerically simulating the response ofCSEs when GECs are used as the deep foundation elements
(e.g., Murugesan and Rajagopal 2006; Malarvizhi and Il-amparuthi 2007; Park et al. 2007; Almeida et al. 2013; El-sawy 2013). Yoo and Kim (2009) compared the results ofaxisymmetric, 3-d unit cell, and fully 3-d models of CSEswith GECs, but without geosynthetic reinforcement placedover the columns. They concluded that the results of 3-dunit cell analyses were in good agreement with those froma fully 3-d model; however, axisymmetric modeling tendedto give results that were 10-20% larger than the 3-d mod-els, particularly for the vertical effective stress and lateraldeformation of the granular columns, as well as for thestrain in the geosynthetic encasement.
A detailed review of available literature has thus re-vealed that no research has been performed to investigatethe behavior of GRCSEs with GECs, either in a 2-d or 3-didealization. Consequently, this paper presents the resultsof 2-d and 3-d finite element analyses that were carried outto study the validity of the unit cell concept in the numer-ical simulation of GRCSEs that utilize GECs as the deepfoundation elements.
2 Finite Element Modeling
2.1 Geometry, Boundary Conditions, andLoading
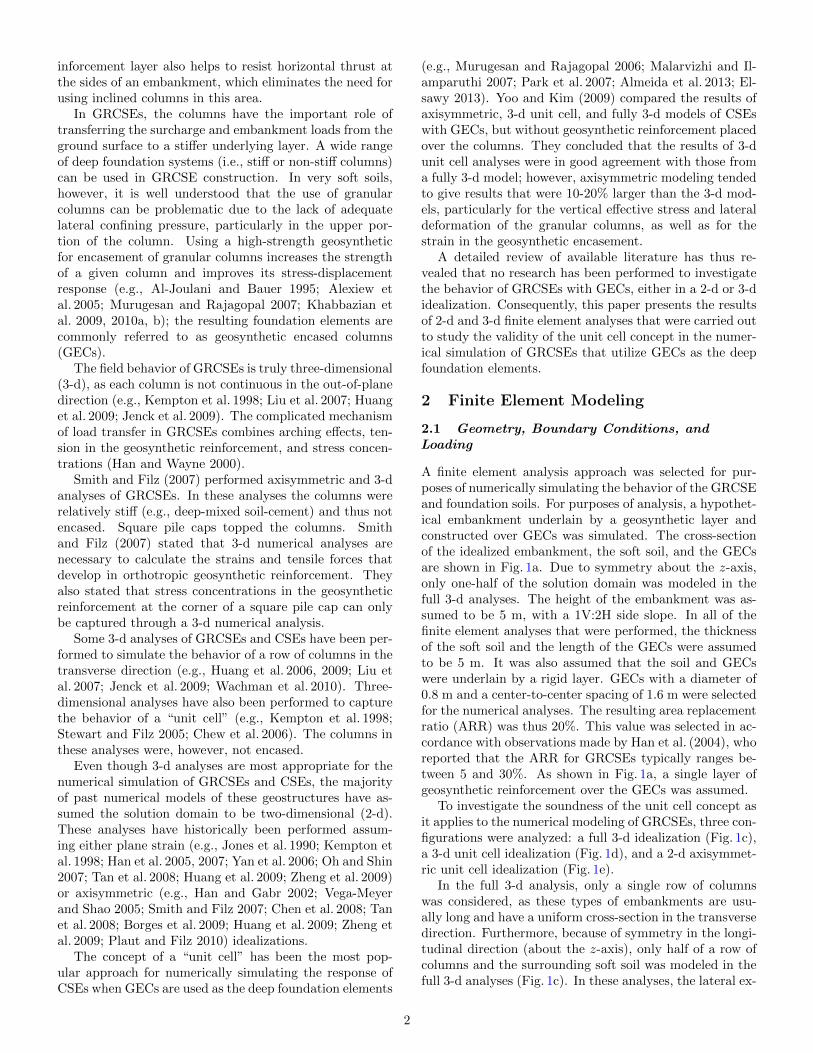
A finite element analysis approach was selected for pur-poses of numerically simulating the behavior of the GRCSEand foundation soils. For purposes of analysis, a hypothet-ical embankment underlain by a geosynthetic layer andconstructed over GECs was simulated. The cross-sectionof the idealized embankment, the soft soil, and the GECsare shown in Fig. 1a. Due to symmetry about the z-axis,only one-half of the solution domain was modeled in thefull 3-d analyses. The height of the embankment was as-sumed to be 5 m, with a 1V:2H side slope. In all of thefinite element analyses that were performed, the thicknessof the soft soil and the length of the GECs were assumedto be 5 m. It was also assumed that the soil and GECswere underlain by a rigid layer. GECs with a diameter of0.8 m and a center-to-center spacing of 1.6 m were selectedfor the numerical analyses. The resulting area replacementratio (ARR) was thus 20%. This value was selected in ac-cordance with observations made by Han et al. (2004), whoreported that the ARR for GRCSEs typically ranges be-tween 5 and 30%. As shown in Fig. 1a, a single layer ofgeosynthetic reinforcement over the GECs was assumed.
To investigate the soundness of the unit cell concept asit applies to the numerical modeling of GRCSEs, three con-figurations were analyzed: a full 3-d idealization (Fig. 1c),a 3-d unit cell idealization (Fig. 1d), and a 2-d axisymmet-ric unit cell idealization (Fig. 1e).
In the full 3-d analysis, only a single row of columnswas considered, as these types of embankments are usu-ally long and have a uniform cross-section in the transversedirection. Furthermore, because of symmetry in the longi-tudinal direction (about the z-axis), only half of a row ofcolumns and the surrounding soft soil was modeled in thefull 3-d analyses (Fig. 1c). In these analyses, the lateral ex-
2

0.0 m
5.0 m
10 m
C L 16.4 m 15.0 m
1
2Embankment
Soft soil
Geosynthetic
Firm layer
GEC
1.6 m
1.6 mDe = 1.8 m
Unit cell (3‐d) Unit cell (Axisymmetric)
(a)
(d) (e)
x
z
x
y
Geosynthetic Encasement
1.6 m
1.6 m
(b)
x
y
0.8 m
31.4 m
(c)x
y
Fig. 1: (a) Cross section of the simulated GRCSE embankment, (b) plan view of GECs, (c) plan view of the full 3-d simulation,(d) plan view of a unit cell, and (e) plan view of an equivalent axisymmetric unit cell.
tent of the soft soil beyond the toe of the embankment waschosen to be 15 m. Sensitivity analyses were performedto confirm that the finite element results were not affectedby the imposed conditions at this distance along the rightvertical boundary of the soft soil.
A unit cell consists of a single column surrounded bythe tributary area of soil that is defined by lines of symme-try (Fig. 1b). For columns in a square configuration withequal center-to-center spacing in both the longitudinal andtransverse directions, the unit cell has a square geometry(Fig. 1d). A 3-d finite element analysis is required to prop-erly model this unit cell. Since it has two lines of symmetry(Fig. 1d), only one-quarter of the unit cell was modeled inthe finite element analyses.
As shown in Fig. 1e, a square unit cell can be approx-imated by a circular one by choosing the same area ofsoft soil that surrounds the column. The resulting circularunit cell can be used to perform axisymmetric finite ele-ment analyses. In this case, the equivalent diameter of theunit cell is equal to 1.13 times the center-to-center columnspacing; i.e., De = (1.13)(1.6) = 1.80 m.
It should be noted that for columns in a triangular pat-tern, the unit cell forms a regular hexagon around thecolumn. This hexagonal unit cell can also be closely ap-proximated by an equivalent circular unit cell with thesame total area. The equivalent circular unit cell can thenbe simulated using either a 3-d unit cell or an axisym-metric unit cell. This approximation is similar to that
3

x
z
y
x
z
x
y
(a)
(b)
(c)
Fig. 2: Finite-element mesh used for full 3-d analysis: (a) three-dimensional view, (b) profile view, and (c) plan view.
in which a square unit cell is approximated by a circularunit cell, as discussed in the previous paragraph. In otherwords, nearly identical analyses can be performed to nu-merically simulate the unit cell behavior of GRCSEs witheither square or triangular column configurations; only theunit cell areas are slightly different. It is expected that theresults from a full 3-d analysis of a triangular column spac-ing configuration would be also slightly different than thatfor a square column spacing, since the cross-section in thetransverse direction in the case of the triangular pattern isnot uniform. The differences in the numerical simulationsof GRCSE with columns in triangular and square patternsare beyond the scope of this paper. For purposes of theanalyses conducted herein, a square pattern spacing wasexclusively assumed.
In the full 3-d model (Fig. 2), nodal displacements inthe x-direction are constrained along the right and leftboundaries (planes) of the solution domain. These bound-ary conditions are reasonable, because: (1) the left sideplanar boundary represents a symmetry boundary, whichcannot have displacements that are normal to the plane(i.e., in the x-direction), and (2) the right side planarboundary is far enough away (e.g., the soft soil domainis large enough) that constraining the nodal displacementsin the x-direction along this boundary has no significant
effect on the model results. The boundary planes parallelto the x-z plane are also symmetry planes (recall Fig. 1c).It follows that nodal displacements in the y-direction (i.e.,those normal to the x-z plane) must be constrained alongthese planes. Finally, along the bottom boundary, nodaldisplacements in the z-direction are constrained so as toprevent rigid-body motion in this direction.
In the 3-d unit cell model (Fig. 3), planes parallel to thex-z and y-z planes represent symmetry boundaries. Assuch, nodal displacements normal to these planes must beconstrained. Along the bottom boundary, nodal displace-ments in the z-direction must be also constrained so as toprevent rigid-body motion in this direction.
In the axisymmetric unit cell model (Fig. 4), nodal dis-placements in the radial direction are constrained along theright and left boundaries of the solution domain. The lat-ter specifications are necessitated by the fact that the leftboundary represents a symmetry boundary, thus preclud-ing displacements normal to it. Along the bottom bound-ary, nodal displacements in the z-direction are constrainedso as to prevent rigid-body motion in this direction. Theabove nodal constraints associated with the full 3-d, 3-dunit cell, and axisymmetric unit cell analyses shall be re-ferred to throughout the remainder of this paper as the“standard degree of nodal constraint” along the bottom
4

x
zy
Fig. 3: Finite-element mesh used for 3-d unit cell analysis.
boundary of the solution domain.Due to lateral spreading of the embankment in the full
3-d analysis, it was hypothesized that the numerical resultsmight be affected by the imposed boundary conditions thatare specified in the x-direction along the bottom of the so-lution domain (i.e., along the bottom of the soft soil andGECs). As a result, the full 3-d, 3-d unit cell, and ax-isymmetric unit cell analyses of the GRCSE were repeatedwith nodes along the bottom boundary constrained in alldirections. These nodal constraints shall be referred toherein as the “increased degree of nodal constraint” alongthe bottom boundary of the solution domain. The resultsfrom analyses with both the “standard” and “increased”degrees of nodal constraint along the bottom boundary willbe compared and discussed later in this paper.
All finite element analyses described herein were per-formed using the computer program ABAQUS (Hibbitt etal. 2007). The finite element analyses were initiated byactivating the initial stresses in the GECs and in the sur-rounding soft soil. The initial lateral earth pressure wasassumed to be at an ‘at-rest’ condition. The lateral earthpressure coefficient (K) was determined to be 0.5, usingthe empirical relationship proposed by Brooker and Ire-land (1965), Ko = 0.95 − sin φ. After establishing theinitial stress state, the embankment construction was sim-ulated in a number of steps. The embankment loading wasmodeled by progressively assigning gravity to each 0.5 mthick layer of elements in the embankment. In all of the
y
zx
r
z
Fig. 4: Finite-element mesh used for axisymmetric unit cellanalysis.
analyses the excess pore pressures were assumed to havedissipated over time, i.e., the analyses were considered tobe “drained”.
2.2 Finite Element Mesh
The finite-element mesh for the granular columns, the softsoil, and the embankment was developed using 8-nodebrick elements and 4-node quadrilateral elements in the3-d and axisymmetric numerical simulations, respectively.The geosynthetic for both the column encasement and thereinforcement over the columns was modeled using 4-nodequadrilateral and 2-node membrane elements in the 3-dand axisymmetric finite element analyses, respectively.
The finite-element meshes used for the full 3-d, 3-d unitcell, and the axisymmetric unit cell analyses are shownin Figs. 2, 3, and 4, respectively. For the full 3-d analy-sis, 38,856 continuum and membrane elements were usedin the mathematical model, while only 1,840 and 448 ele-ments were used in the finite-element mesh for the 3-d unitcell and the axisymmetric analyses, respectively. Mesh sen-sitivity analyses were performed to ensure that the mesheswere sufficiently fine so as to yield accurate results. In or-der to minimize possible errors due to the finite elementmesh, the same size of elements were utilized in all numer-ical analyses. It should also be noted that to eliminate ill-shaped elements in the finite-element mesh that was used
5
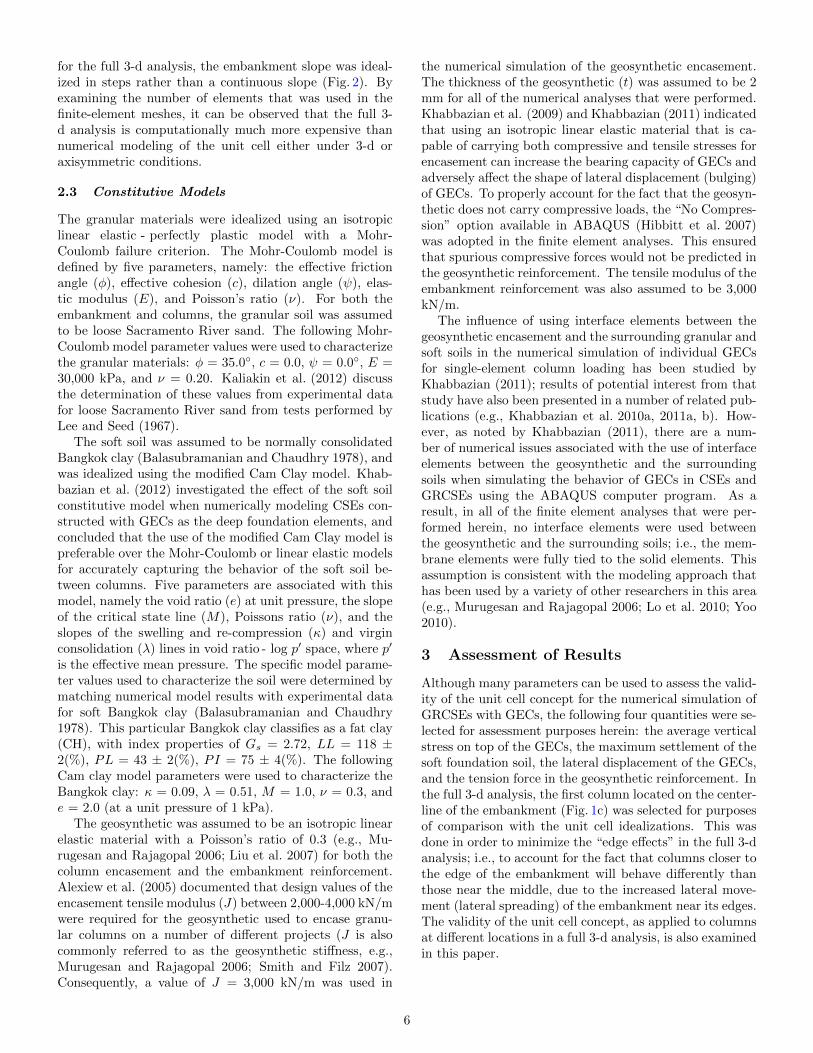
for the full 3-d analysis, the embankment slope was ideal-ized in steps rather than a continuous slope (Fig. 2). Byexamining the number of elements that was used in thefinite-element meshes, it can be observed that the full 3-d analysis is computationally much more expensive thannumerical modeling of the unit cell either under 3-d oraxisymmetric conditions.
2.3 Constitutive Models
The granular materials were idealized using an isotropiclinear elastic - perfectly plastic model with a Mohr-Coulomb failure criterion. The Mohr-Coulomb model isdefined by five parameters, namely: the effective frictionangle (φ), effective cohesion (c), dilation angle (ψ), elas-tic modulus (E), and Poisson’s ratio (ν). For both theembankment and columns, the granular soil was assumedto be loose Sacramento River sand. The following Mohr-Coulomb model parameter values were used to characterizethe granular materials: φ = 35.0◦, c = 0.0, ψ = 0.0◦, E =30,000 kPa, and ν = 0.20. Kaliakin et al. (2012) discussthe determination of these values from experimental datafor loose Sacramento River sand from tests performed byLee and Seed (1967).
The soft soil was assumed to be normally consolidatedBangkok clay (Balasubramanian and Chaudhry 1978), andwas idealized using the modified Cam Clay model. Khab-bazian et al. (2012) investigated the effect of the soft soilconstitutive model when numerically modeling CSEs con-structed with GECs as the deep foundation elements, andconcluded that the use of the modified Cam Clay model ispreferable over the Mohr-Coulomb or linear elastic modelsfor accurately capturing the behavior of the soft soil be-tween columns. Five parameters are associated with thismodel, namely the void ratio (e) at unit pressure, the slopeof the critical state line (M), Poissons ratio (ν), and theslopes of the swelling and re-compression (κ) and virginconsolidation (λ) lines in void ratio - log p′ space, where p′
is the effective mean pressure. The specific model parame-ter values used to characterize the soil were determined bymatching numerical model results with experimental datafor soft Bangkok clay (Balasubramanian and Chaudhry1978). This particular Bangkok clay classifies as a fat clay(CH), with index properties of Gs = 2.72, LL = 118 ±2(%), PL = 43 ± 2(%), PI = 75 ± 4(%). The followingCam clay model parameters were used to characterize theBangkok clay: κ = 0.09, λ = 0.51, M = 1.0, ν = 0.3, ande = 2.0 (at a unit pressure of 1 kPa).
The geosynthetic was assumed to be an isotropic linearelastic material with a Poisson’s ratio of 0.3 (e.g., Mu-rugesan and Rajagopal 2006; Liu et al. 2007) for both thecolumn encasement and the embankment reinforcement.Alexiew et al. (2005) documented that design values of theencasement tensile modulus (J) between 2,000-4,000 kN/mwere required for the geosynthetic used to encase granu-lar columns on a number of different projects (J is alsocommonly referred to as the geosynthetic stiffness, e.g.,Murugesan and Rajagopal 2006; Smith and Filz 2007).Consequently, a value of J = 3,000 kN/m was used in
the numerical simulation of the geosynthetic encasement.The thickness of the geosynthetic (t) was assumed to be 2mm for all of the numerical analyses that were performed.Khabbazian et al. (2009) and Khabbazian (2011) indicatedthat using an isotropic linear elastic material that is ca-pable of carrying both compressive and tensile stresses forencasement can increase the bearing capacity of GECs andadversely affect the shape of lateral displacement (bulging)of GECs. To properly account for the fact that the geosyn-thetic does not carry compressive loads, the “No Compres-sion” option available in ABAQUS (Hibbitt et al. 2007)was adopted in the finite element analyses. This ensuredthat spurious compressive forces would not be predicted inthe geosynthetic reinforcement. The tensile modulus of theembankment reinforcement was also assumed to be 3,000kN/m.
The influence of using interface elements between thegeosynthetic encasement and the surrounding granular andsoft soils in the numerical simulation of individual GECsfor single-element column loading has been studied byKhabbazian (2011); results of potential interest from thatstudy have also been presented in a number of related pub-lications (e.g., Khabbazian et al. 2010a, 2011a, b). How-ever, as noted by Khabbazian (2011), there are a num-ber of numerical issues associated with the use of interfaceelements between the geosynthetic and the surroundingsoils when simulating the behavior of GECs in CSEs andGRCSEs using the ABAQUS computer program. As aresult, in all of the finite element analyses that were per-formed herein, no interface elements were used betweenthe geosynthetic and the surrounding soils; i.e., the mem-brane elements were fully tied to the solid elements. Thisassumption is consistent with the modeling approach thathas been used by a variety of other researchers in this area(e.g., Murugesan and Rajagopal 2006; Lo et al. 2010; Yoo2010).
3 Assessment of Results
Although many parameters can be used to assess the valid-ity of the unit cell concept for the numerical simulation ofGRCSEs with GECs, the following four quantities were se-lected for assessment purposes herein: the average verticalstress on top of the GECs, the maximum settlement of thesoft foundation soil, the lateral displacement of the GECs,and the tension force in the geosynthetic reinforcement. Inthe full 3-d analysis, the first column located on the center-line of the embankment (Fig. 1c) was selected for purposesof comparison with the unit cell idealizations. This wasdone in order to minimize the “edge effects” in the full 3-danalysis; i.e., to account for the fact that columns closer tothe edge of the embankment will behave differently thanthose near the middle, due to the increased lateral move-ment (lateral spreading) of the embankment near its edges.The validity of the unit cell concept, as applied to columnsat different locations in a full 3-d analysis, is also examinedin this paper.
6
3.1 Numerical Simulations with BottomBoundary Constrained Only in Vertical Direction
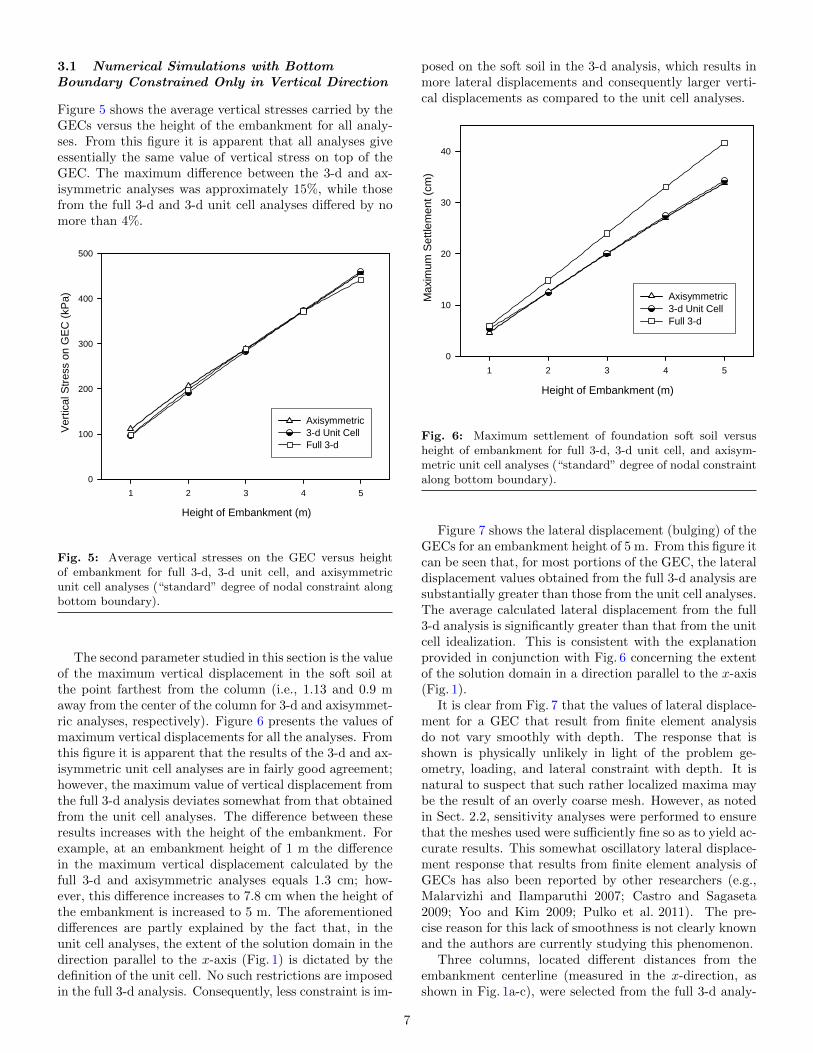
Figure 5 shows the average vertical stresses carried by theGECs versus the height of the embankment for all analy-ses. From this figure it is apparent that all analyses giveessentially the same value of vertical stress on top of theGEC. The maximum difference between the 3-d and ax-isymmetric analyses was approximately 15%, while thosefrom the full 3-d and 3-d unit cell analyses differed by nomore than 4%.
Height of Embankment (m)
1 2 3 4 5
Ver
tical
Str
ess
on G
EC
(kP
a)
0
100
200
300
400
500
Axisymmetric3-d Unit CellFull 3-d
Fig. 5: Average vertical stresses on the GEC versus heightof embankment for full 3-d, 3-d unit cell, and axisymmetricunit cell analyses (“standard” degree of nodal constraint alongbottom boundary).
The second parameter studied in this section is the valueof the maximum vertical displacement in the soft soil atthe point farthest from the column (i.e., 1.13 and 0.9 maway from the center of the column for 3-d and axisymmet-ric analyses, respectively). Figure 6 presents the values ofmaximum vertical displacements for all the analyses. Fromthis figure it is apparent that the results of the 3-d and ax-isymmetric unit cell analyses are in fairly good agreement;however, the maximum value of vertical displacement fromthe full 3-d analysis deviates somewhat from that obtainedfrom the unit cell analyses. The difference between theseresults increases with the height of the embankment. Forexample, at an embankment height of 1 m the differencein the maximum vertical displacement calculated by thefull 3-d and axisymmetric analyses equals 1.3 cm; how-ever, this difference increases to 7.8 cm when the height ofthe embankment is increased to 5 m. The aforementioneddifferences are partly explained by the fact that, in theunit cell analyses, the extent of the solution domain in thedirection parallel to the x-axis (Fig. 1) is dictated by thedefinition of the unit cell. No such restrictions are imposedin the full 3-d analysis. Consequently, less constraint is im-
posed on the soft soil in the 3-d analysis, which results inmore lateral displacements and consequently larger verti-cal displacements as compared to the unit cell analyses.
Height of Embankment (m)
1 2 3 4 5
Max
imum
Set
tlem
ent
(cm
)
0
10
20
30
40
Axisymmetric3-d Unit CellFull 3-d
Fig. 6: Maximum settlement of foundation soft soil versusheight of embankment for full 3-d, 3-d unit cell, and axisym-metric unit cell analyses (“standard” degree of nodal constraintalong bottom boundary).
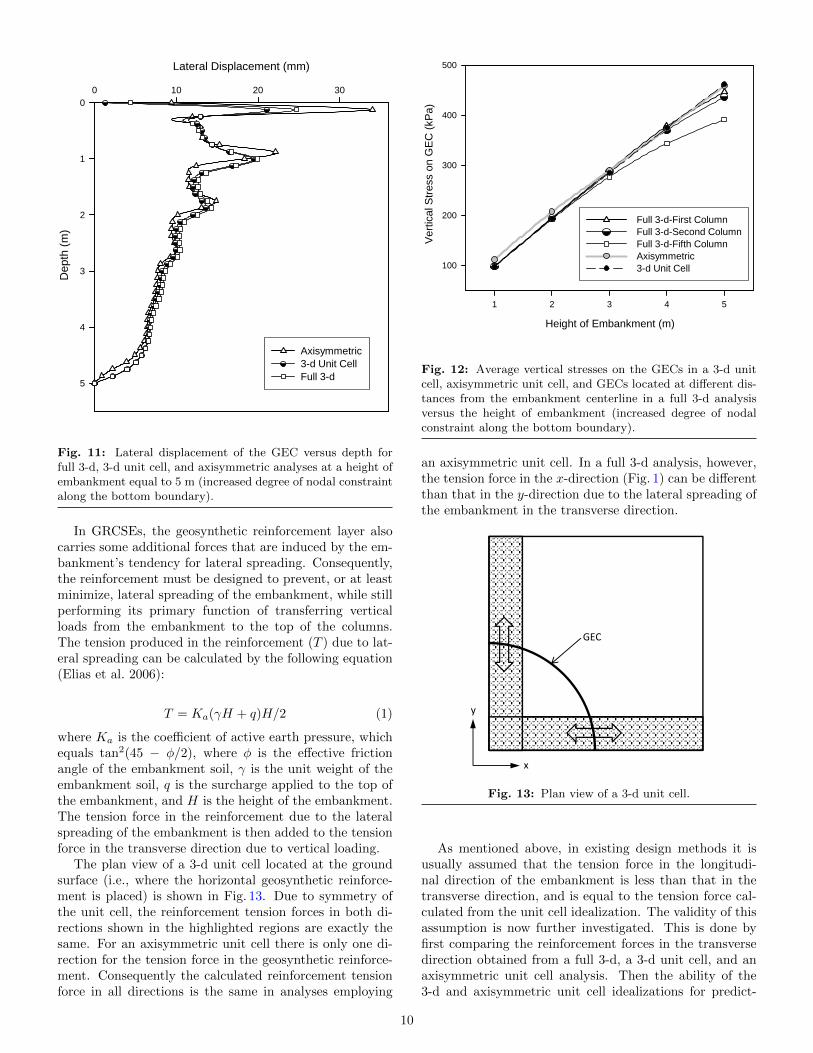
Figure 7 shows the lateral displacement (bulging) of theGECs for an embankment height of 5 m. From this figure itcan be seen that, for most portions of the GEC, the lateraldisplacement values obtained from the full 3-d analysis aresubstantially greater than those from the unit cell analyses.The average calculated lateral displacement from the full3-d analysis is significantly greater than that from the unitcell idealization. This is consistent with the explanationprovided in conjunction with Fig. 6 concerning the extentof the solution domain in a direction parallel to the x-axis(Fig. 1).
It is clear from Fig. 7 that the values of lateral displace-ment for a GEC that result from finite element analysisdo not vary smoothly with depth. The response that isshown is physically unlikely in light of the problem ge-ometry, loading, and lateral constraint with depth. It isnatural to suspect that such rather localized maxima maybe the result of an overly coarse mesh. However, as notedin Sect. 2.2, sensitivity analyses were performed to ensurethat the meshes used were sufficiently fine so as to yield ac-curate results. This somewhat oscillatory lateral displace-ment response that results from finite element analysis ofGECs has also been reported by other researchers (e.g.,Malarvizhi and Ilamparuthi 2007; Castro and Sagaseta2009; Yoo and Kim 2009; Pulko et al. 2011). The pre-cise reason for this lack of smoothness is not clearly knownand the authors are currently studying this phenomenon.
Three columns, located different distances from theembankment centerline (measured in the x-direction, asshown in Fig. 1a-c), were selected from the full 3-d analy-
7

Lateral Displacement (mm)
0 10 20 30
Dep
th (
m)
0
1
2
3
4
5
Axisymmetric3-d Unit CellFull 3-d
Fig. 7: Lateral displacement of the GEC versus depth for full 3-d, 3-d unit cell, and axisymmetric unit cell analyses at a heightof embankment equal to 5 m (“standard” degree of nodal con-straint along bottom boundary).
sis to investigate the sensitivity of the finite element resultsto the proximity of columns to the shoulder of the embank-ment. The first column was located on the centerline ofthe embankment; the second and the third columns werethe third and fifth ones from the centerline of the embank-ment, respectively. The values of maximum vertical dis-placement of the foundation soil (i.e., settlement) aroundeach of the columns as a function of the height of the em-bankment are shown in Fig. 8. For the sake of comparison,results from the 3-d and axisymmetric unit cell analysesare also shown in this figure. As evident from Fig. 8, thevalues of maximum settlements calculated in the 3-d anal-yses were almost the same for all three columns as long asthe height of the embankment was less than 3 m. Oncethe height of the embankment exceeds 3 m, these valuesdecrease with distance from the centerline of the embank-ment. For example, at an embankment height of 5 m, thevalue of the maximum settlement of the first column isabout 20% greater than that for the fifth column. This isexplained by the fact that the soft foundation soil closerto the embankment centerline is subjected to larger ver-tical stresses both at the ground surface and with depthas compared to the soil that is located closer to the shoul-der. Such an effect is expected to be even greater if thickerlayers of soft foundation soil were modeled in the numer-ical analyses. This observed model behavior representsanother source of discrepancy between the values of verti-cal settlements calculated from unit cell idealizations andthose from full 3-d models (Fig. 6). Similar trends as thoseshown for maximum settlement in Fig. 8 were generally ob-
served for the other quantities such as the average verticalstresses carried by the GECs and the lateral displacementof the GECs. As a result, for the embankment analyzedherein, the design of the first GEC (i.e., the one locatedon the centerline of the embankment) is the most criticalone.
Height of Embankment (m)
1 2 3 4 5
Max
imum
Set
tlem
ent
(cm
)
0
10
20
30
40
Full 3-d-First ColumnFull 3-d-Second ColumnFull 3-d-Fifth ColumnAxisymmetric3-d Unit Cell
Fig. 8: Maximum settlement of soft foundation soil aroundGECs in a 3-d unit cell, axisymmetric unit cell, and full-3-danalysis versus the height of embankment, for GECs located atdifferent distances from the embankment centerline (“standard”degree of nodal constraint along bottom boundary).
From the results shown in Figs. 5, 6, 7 and 8, for themost critical column in the embankment, it can be ob-served that the unit cell modeling approach (either the3-d or axisymmetric) underestimates the maximum set-tlement between columns and the lateral displacement ofGECs, but provides a reasonable estimate of the stressesapplied to each column. As settlement is often the control-ling factor in the design of GRCSEs, the use of a unit cellmodeling approach can consequently lead to an unconser-vative design of such structures. It should be noted thatthis conclusion is based on results from analyses in whichnodes along the bottom boundary of the soft soil and theGECs were unconstrained in the x and y-directions.
3.2 Numerical Simulations with IncreasedDegree of Nodal Constraint along the BottomBoundary
Another set of finite element analyses, with full 3-d, 3-d unit cell, and axisymmetric unit cell idealizations, wascarried out to study the soundness of the unit cell concept.The only difference between these analyses and those de-scribed in the previous section was that an “increased de-gree of nodal constraint” was imposed along the bottomboundary of the soft soil and the GECs, by also preventingdisplacement in the x-direction (see Fig. 1).
Figures 9, 10, and 11 present the average vertical
8
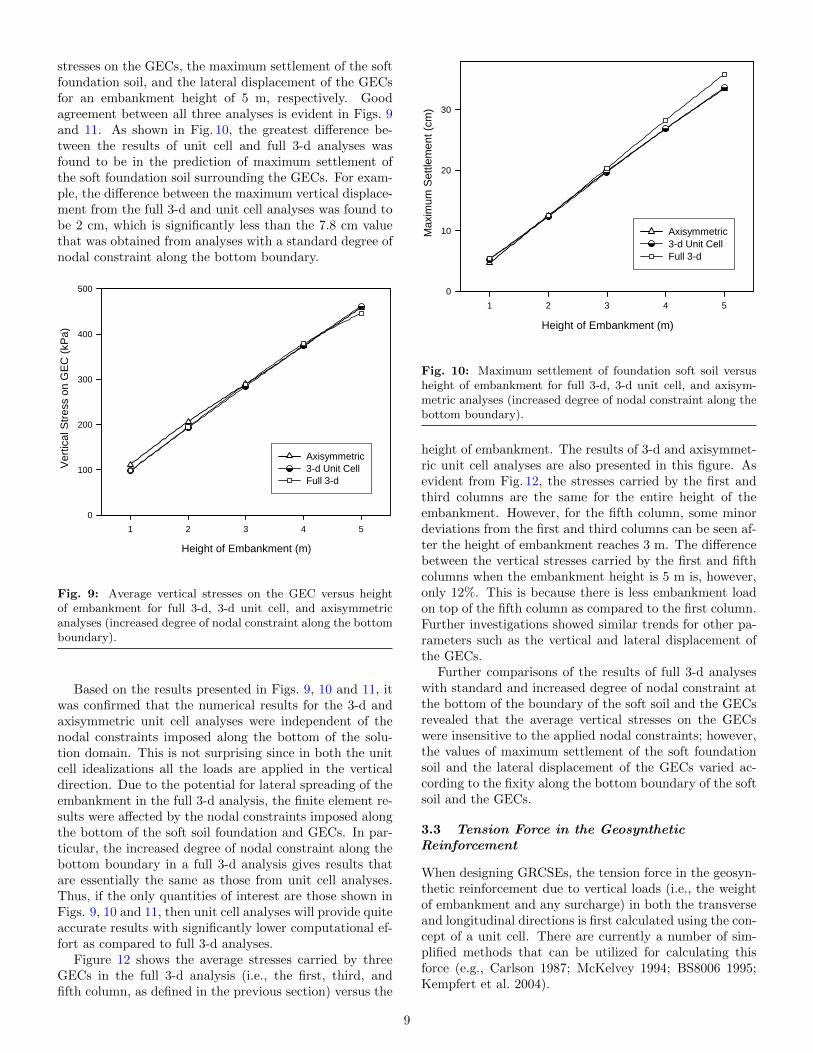
stresses on the GECs, the maximum settlement of the softfoundation soil, and the lateral displacement of the GECsfor an embankment height of 5 m, respectively. Goodagreement between all three analyses is evident in Figs. 9and 11. As shown in Fig. 10, the greatest difference be-tween the results of unit cell and full 3-d analyses wasfound to be in the prediction of maximum settlement ofthe soft foundation soil surrounding the GECs. For exam-ple, the difference between the maximum vertical displace-ment from the full 3-d and unit cell analyses was found tobe 2 cm, which is significantly less than the 7.8 cm valuethat was obtained from analyses with a standard degree ofnodal constraint along the bottom boundary.
Height of Embankment (m)
1 2 3 4 5
Ver
tical
Str
ess
on G
EC
(kP
a)
0
100
200
300
400
500
Axisymmetric3-d Unit CellFull 3-d
Fig. 9: Average vertical stresses on the GEC versus heightof embankment for full 3-d, 3-d unit cell, and axisymmetricanalyses (increased degree of nodal constraint along the bottomboundary).
Based on the results presented in Figs. 9, 10 and 11, itwas confirmed that the numerical results for the 3-d andaxisymmetric unit cell analyses were independent of thenodal constraints imposed along the bottom of the solu-tion domain. This is not surprising since in both the unitcell idealizations all the loads are applied in the verticaldirection. Due to the potential for lateral spreading of theembankment in the full 3-d analysis, the finite element re-sults were affected by the nodal constraints imposed alongthe bottom of the soft soil foundation and GECs. In par-ticular, the increased degree of nodal constraint along thebottom boundary in a full 3-d analysis gives results thatare essentially the same as those from unit cell analyses.Thus, if the only quantities of interest are those shown inFigs. 9, 10 and 11, then unit cell analyses will provide quiteaccurate results with significantly lower computational ef-fort as compared to full 3-d analyses.
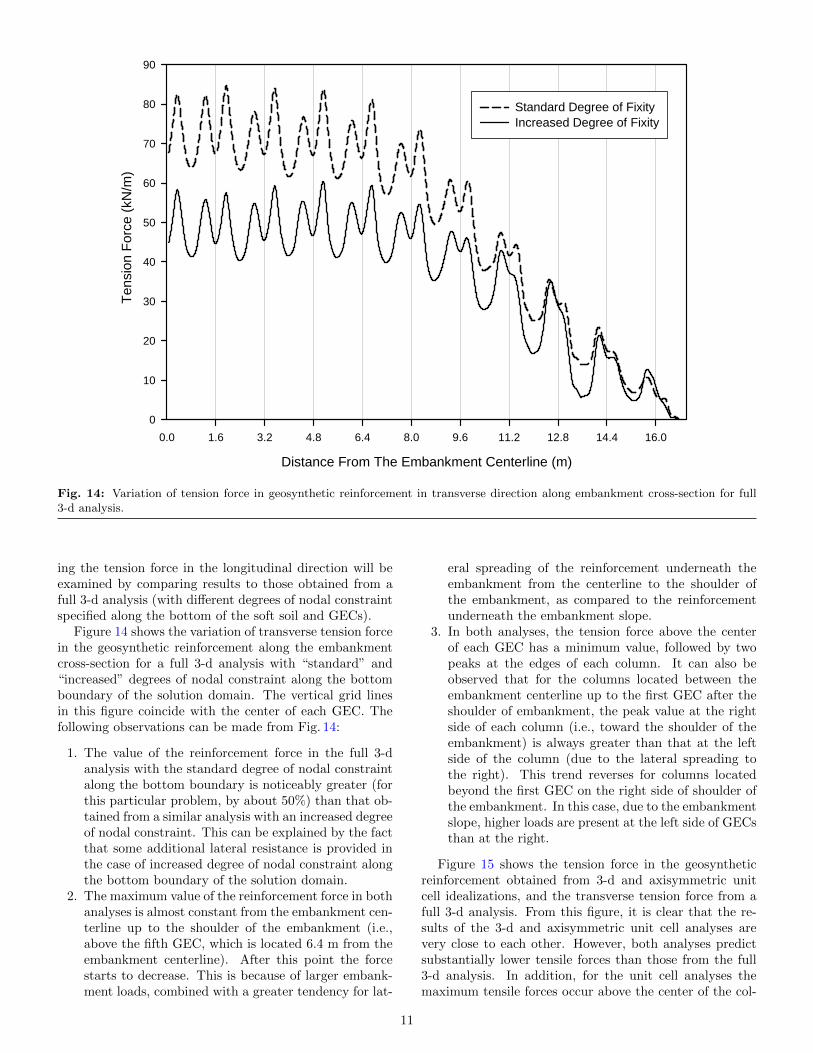
Figure 12 shows the average stresses carried by threeGECs in the full 3-d analysis (i.e., the first, third, andfifth column, as defined in the previous section) versus the
Height of Embankment (m)
1 2 3 4 5
Max
imum
Set
tlem
ent
(cm
)
0
10
20
30
Axisymmetric3-d Unit CellFull 3-d
Fig. 10: Maximum settlement of foundation soft soil versusheight of embankment for full 3-d, 3-d unit cell, and axisym-metric analyses (increased degree of nodal constraint along thebottom boundary).
height of embankment. The results of 3-d and axisymmet-ric unit cell analyses are also presented in this figure. Asevident from Fig. 12, the stresses carried by the first andthird columns are the same for the entire height of theembankment. However, for the fifth column, some minordeviations from the first and third columns can be seen af-ter the height of embankment reaches 3 m. The differencebetween the vertical stresses carried by the first and fifthcolumns when the embankment height is 5 m is, however,only 12%. This is because there is less embankment loadon top of the fifth column as compared to the first column.Further investigations showed similar trends for other pa-rameters such as the vertical and lateral displacement ofthe GECs.
Further comparisons of the results of full 3-d analyseswith standard and increased degree of nodal constraint atthe bottom of the boundary of the soft soil and the GECsrevealed that the average vertical stresses on the GECswere insensitive to the applied nodal constraints; however,the values of maximum settlement of the soft foundationsoil and the lateral displacement of the GECs varied ac-cording to the fixity along the bottom boundary of the softsoil and the GECs.
3.3 Tension Force in the GeosyntheticReinforcement
When designing GRCSEs, the tension force in the geosyn-thetic reinforcement due to vertical loads (i.e., the weightof embankment and any surcharge) in both the transverseand longitudinal directions is first calculated using the con-cept of a unit cell. There are currently a number of sim-plified methods that can be utilized for calculating thisforce (e.g., Carlson 1987; McKelvey 1994; BS8006 1995;Kempfert et al. 2004).
9
Lateral Displacement (mm)
0 10 20 30
Dep
th (
m)
0
1
2
3
4
5
Axisymmetric3-d Unit CellFull 3-d
Fig. 11: Lateral displacement of the GEC versus depth forfull 3-d, 3-d unit cell, and axisymmetric analyses at a height ofembankment equal to 5 m (increased degree of nodal constraintalong the bottom boundary).
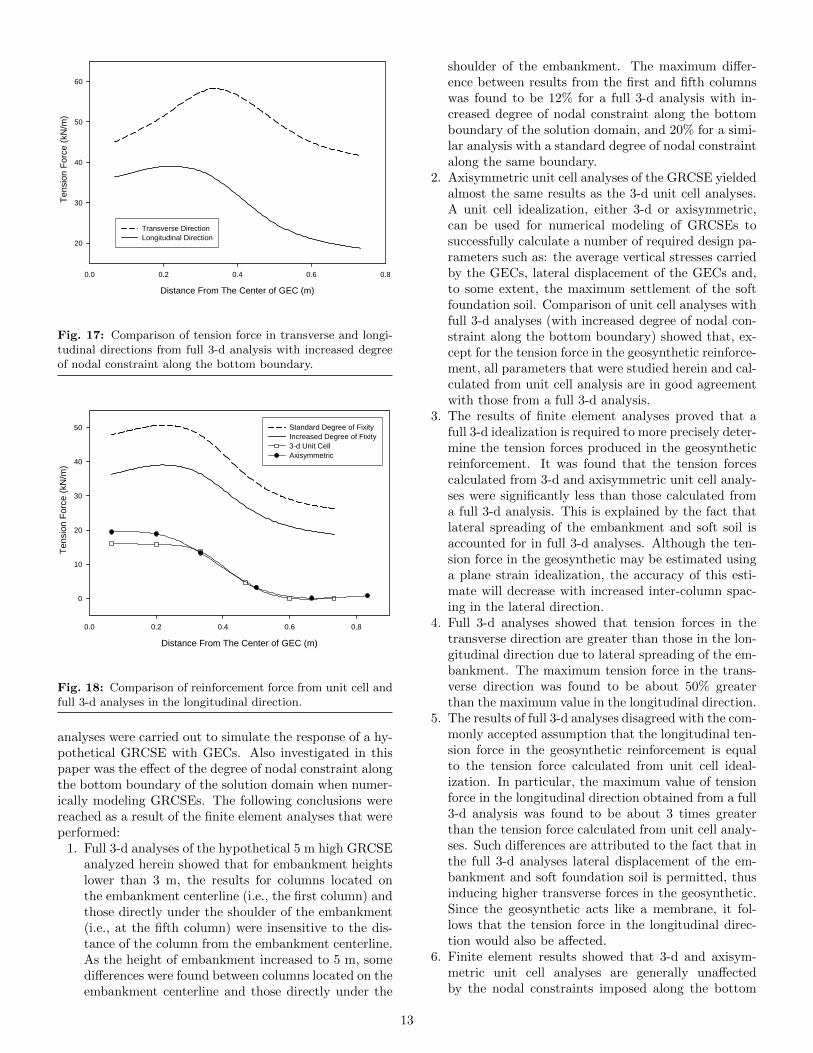
In GRCSEs, the geosynthetic reinforcement layer alsocarries some additional forces that are induced by the em-bankment’s tendency for lateral spreading. Consequently,the reinforcement must be designed to prevent, or at leastminimize, lateral spreading of the embankment, while stillperforming its primary function of transferring verticalloads from the embankment to the top of the columns.The tension produced in the reinforcement (T ) due to lat-eral spreading can be calculated by the following equation(Elias et al. 2006):
T = Ka(γH + q)H/2 (1)
where Ka is the coefficient of active earth pressure, whichequals tan2(45 − φ/2), where φ is the effective frictionangle of the embankment soil, γ is the unit weight of theembankment soil, q is the surcharge applied to the top ofthe embankment, and H is the height of the embankment.The tension force in the reinforcement due to the lateralspreading of the embankment is then added to the tensionforce in the transverse direction due to vertical loading.
The plan view of a 3-d unit cell located at the groundsurface (i.e., where the horizontal geosynthetic reinforce-ment is placed) is shown in Fig. 13. Due to symmetry ofthe unit cell, the reinforcement tension forces in both di-rections shown in the highlighted regions are exactly thesame. For an axisymmetric unit cell there is only one di-rection for the tension force in the geosynthetic reinforce-ment. Consequently the calculated reinforcement tensionforce in all directions is the same in analyses employing
Height of Embankment (m)
1 2 3 4 5
Ver
tical
Str
ess
on G
EC
(kP
a)
100
200
300
400
500
Full 3-d-First ColumnFull 3-d-Second ColumnFull 3-d-Fifth ColumnAxisymmetric3-d Unit Cell
Fig. 12: Average vertical stresses on the GECs in a 3-d unitcell, axisymmetric unit cell, and GECs located at different dis-tances from the embankment centerline in a full 3-d analysisversus the height of embankment (increased degree of nodalconstraint along the bottom boundary).
an axisymmetric unit cell. In a full 3-d analysis, however,the tension force in the x-direction (Fig. 1) can be differentthan that in the y-direction due to the lateral spreading ofthe embankment in the transverse direction.
x
y
GEC
Fig. 13: Plan view of a 3-d unit cell.
As mentioned above, in existing design methods it isusually assumed that the tension force in the longitudi-nal direction of the embankment is less than that in thetransverse direction, and is equal to the tension force cal-culated from the unit cell idealization. The validity of thisassumption is now further investigated. This is done byfirst comparing the reinforcement forces in the transversedirection obtained from a full 3-d, a 3-d unit cell, and anaxisymmetric unit cell analysis. Then the ability of the3-d and axisymmetric unit cell idealizations for predict-
10
Distance From The Embankment Centerline (m)
0.0 1.6 3.2 4.8 6.4 8.0 9.6 11.2 12.8 14.4 16.0
Ten
sion
For
ce (
kN/m
)
0
10
20
30
40
50
60
70
80
90
Standard Degree of FixityIncreased Degree of Fixity
Fig. 14: Variation of tension force in geosynthetic reinforcement in transverse direction along embankment cross-section for full3-d analysis.
ing the tension force in the longitudinal direction will beexamined by comparing results to those obtained from afull 3-d analysis (with different degrees of nodal constraintspecified along the bottom of the soft soil and GECs).
Figure 14 shows the variation of transverse tension forcein the geosynthetic reinforcement along the embankmentcross-section for a full 3-d analysis with “standard” and“increased” degrees of nodal constraint along the bottomboundary of the solution domain. The vertical grid linesin this figure coincide with the center of each GEC. Thefollowing observations can be made from Fig. 14:
1. The value of the reinforcement force in the full 3-danalysis with the standard degree of nodal constraintalong the bottom boundary is noticeably greater (forthis particular problem, by about 50%) than that ob-tained from a similar analysis with an increased degreeof nodal constraint. This can be explained by the factthat some additional lateral resistance is provided inthe case of increased degree of nodal constraint alongthe bottom boundary of the solution domain.
2. The maximum value of the reinforcement force in bothanalyses is almost constant from the embankment cen-terline up to the shoulder of the embankment (i.e.,above the fifth GEC, which is located 6.4 m from theembankment centerline). After this point the forcestarts to decrease. This is because of larger embank-ment loads, combined with a greater tendency for lat-
eral spreading of the reinforcement underneath theembankment from the centerline to the shoulder ofthe embankment, as compared to the reinforcementunderneath the embankment slope.
3. In both analyses, the tension force above the centerof each GEC has a minimum value, followed by twopeaks at the edges of each column. It can also beobserved that for the columns located between theembankment centerline up to the first GEC after theshoulder of embankment, the peak value at the rightside of each column (i.e., toward the shoulder of theembankment) is always greater than that at the leftside of the column (due to the lateral spreading tothe right). This trend reverses for columns locatedbeyond the first GEC on the right side of shoulder ofthe embankment. In this case, due to the embankmentslope, higher loads are present at the left side of GECsthan at the right.
Figure 15 shows the tension force in the geosyntheticreinforcement obtained from 3-d and axisymmetric unitcell idealizations, and the transverse tension force from afull 3-d analysis. From this figure, it is clear that the re-sults of the 3-d and axisymmetric unit cell analyses arevery close to each other. However, both analyses predictsubstantially lower tensile forces than those from the full3-d analysis. In addition, for the unit cell analyses themaximum tensile forces occur above the center of the col-
11

umn and become zero over the soft soil at the mid spanof columns. In the full 3-d analyses, the values of ten-sion force start to increase from the center of the column,reaching their maximum value slightly before the edge ofthe column. The rather large difference between the ten-sion forces in the transverse direction obtained from unitcell analyses and those obtained from a full 3-d analysis canbe attributed to the lateral spreading of the embankmentin the latter case.
Distance From The Center of GEC (m)
0.0 0.2 0.4 0.6 0.8
Ten
sion
For
ce (
kN/m
)
0
10
20
30
40
50
60
70
80
90
Standard Degree of FixityIncreased Degree of Fixity3-d Unit CellAxisymmetric
Fig. 15: Comparison of reinforcement force from full 3-d andunit cell analyses in the transverse direction.
Using Eq. (1) in conjunction with the friction angle andthe unit weight of the embankment material (35◦ and 20kN/m3, respectively), and the height of the embankment(5 m), the tension force due to the lateral spreading iscalculated to be 67.7 kN/m. This value is added to thetension forces obtained from unit cell analyses, and theresults are shown in Fig. 16. For the sake of comparison,the results of a full 3-d analysis are also shown in thisfigure. It is clear that the corrected values of tensile forcesfrom the unit cell analyses are in fairly good agreementwith the results from the full 3-d analysis with the standarddegree of nodal constraint along the bottom boundary ofthe solution domain. The corrected values of tensile forcesfrom unit cell analyses, however, are overestimated whencompared to the results from the full 3-d analysis withthe increased degree of nodal constraint along the bottomboundary of the solution domain.
Figure 17 compares the reinforcement forces in thetransverse and longitudinal directions obtained from a full3-d analysis with an increased degree of nodal constraintalong the bottom boundary. It is clear that the tensionforce in the transverse direction is always greater than thatin the longitudinal direction. In particular, for the spe-cific case considered herein, the maximum tension force inthe transverse direction is 50% greater than the maximumvalue in the longitudinal direction. A similar trend wasalso found for model results when the standard degree ofnodal constraint was applied along the bottom boundary.
Distance From The Center of GEC (m)
0.0 0.2 0.4 0.6 0.8
Ten
sion
For
ce (
kN/m
)
40
50
60
70
80
90
Standard Degree of FixityIncreased Degree of Fixity3-d Unit Cell-CorrectedAxisymmetric-Corrected
Fig. 16: Comparison of corrected reinforcement force from unitcell analyses and actual tension forces from full 3-d analyses inthe transverse direction.
Figure 18 shows the tension force in the longitudinal di-rection obtained from a full 3-d analysis, together with thatfrom the 3-d and axisymmetric unit cell analyses. FromFig. 18, a similar pattern of longitudinal tensile forces forthe full 3-d analysis and for the 3-d and axisymmetric unitcell analyses is evident. This can be explained by the simi-larity of boundary conditions in the longitudinal directionfor a full-3d model to those from the unit cell analyses. Itis also clear from Fig. 18 that the longitudinal tensile forcesfrom a full 3-d analysis are always greater than those pre-dicted by the unit cell analyses. The maximum value oftensile force from the full 3-d analysis is about 3 timesgreater than the maximum values from the unit cell anal-yses. This is attributed to the fact that only in the full3-d analysis is the transverse reinforcement force correctlycomputed. Since the geosynthetic acts like a membrane, itfollows that the longitudinal force will likewise be affectedin the full 3-d analysis.
As a result of these analyses, it can be reasonably con-cluded that the unit cell idealizations are not capable ofproperly predicting the values of the reinforcement forcesin the longitudinal direction. These results (Fig. 18) dis-agree with the commonly accepted assumption that thelongitudinal tension force in the geosynthetic reinforce-ment is equal to the tension force that is calculated froma unit cell idealization. Consequently, full 3-d analyses arerequired to more precisely compute the longitudinal forcesin the geosynthetic reinforcement.
4 Conclusions
This paper has presented the results of finite element anal-yses of a hypothetical geosynthetic reinforced column sup-ported embankment (GRCSE) with geosynthetic encasedcolumns (GECs) as the deep foundation elements. Themain focus of this study was the validity of the unit cellconcept in the finite element modeling of GRCSEs withGECs. Full 3-d, 3-d unit cell, and axisymmetric unit cell
12
Distance From The Center of GEC (m)
0.0 0.2 0.4 0.6 0.8
Ten
sion
For
ce (
kN/m
)
20
30
40
50
60
Transverse DirectionLongitudinal Direction
Fig. 17: Comparison of tension force in transverse and longi-tudinal directions from full 3-d analysis with increased degreeof nodal constraint along the bottom boundary.
Distance From The Center of GEC (m)
0.0 0.2 0.4 0.6 0.8
Ten
sion
For
ce (
kN/m
)
0
10
20
30
40
50 Standard Degree of FixityIncreased Degree of Fixity3-d Unit CellAxisymmetric
Fig. 18: Comparison of reinforcement force from unit cell andfull 3-d analyses in the longitudinal direction.
analyses were carried out to simulate the response of a hy-pothetical GRCSE with GECs. Also investigated in thispaper was the effect of the degree of nodal constraint alongthe bottom boundary of the solution domain when numer-ically modeling GRCSEs. The following conclusions werereached as a result of the finite element analyses that wereperformed:
1. Full 3-d analyses of the hypothetical 5 m high GRCSEanalyzed herein showed that for embankment heightslower than 3 m, the results for columns located onthe embankment centerline (i.e., the first column) andthose directly under the shoulder of the embankment(i.e., at the fifth column) were insensitive to the dis-tance of the column from the embankment centerline.As the height of embankment increased to 5 m, somedifferences were found between columns located on theembankment centerline and those directly under the
shoulder of the embankment. The maximum differ-ence between results from the first and fifth columnswas found to be 12% for a full 3-d analysis with in-creased degree of nodal constraint along the bottomboundary of the solution domain, and 20% for a simi-lar analysis with a standard degree of nodal constraintalong the same boundary.
2. Axisymmetric unit cell analyses of the GRCSE yieldedalmost the same results as the 3-d unit cell analyses.A unit cell idealization, either 3-d or axisymmetric,can be used for numerical modeling of GRCSEs tosuccessfully calculate a number of required design pa-rameters such as: the average vertical stresses carriedby the GECs, lateral displacement of the GECs and,to some extent, the maximum settlement of the softfoundation soil. Comparison of unit cell analyses withfull 3-d analyses (with increased degree of nodal con-straint along the bottom boundary) showed that, ex-cept for the tension force in the geosynthetic reinforce-ment, all parameters that were studied herein and cal-culated from unit cell analysis are in good agreementwith those from a full 3-d analysis.
3. The results of finite element analyses proved that afull 3-d idealization is required to more precisely deter-mine the tension forces produced in the geosyntheticreinforcement. It was found that the tension forcescalculated from 3-d and axisymmetric unit cell analy-ses were significantly less than those calculated froma full 3-d analysis. This is explained by the fact thatlateral spreading of the embankment and soft soil isaccounted for in full 3-d analyses. Although the ten-sion force in the geosynthetic may be estimated usinga plane strain idealization, the accuracy of this esti-mate will decrease with increased inter-column spac-ing in the lateral direction.
4. Full 3-d analyses showed that tension forces in thetransverse direction are greater than those in the lon-gitudinal direction due to lateral spreading of the em-bankment. The maximum tension force in the trans-verse direction was found to be about 50% greaterthan the maximum value in the longitudinal direction.
5. The results of full 3-d analyses disagreed with the com-monly accepted assumption that the longitudinal ten-sion force in the geosynthetic reinforcement is equalto the tension force calculated from unit cell ideal-ization. In particular, the maximum value of tensionforce in the longitudinal direction obtained from a full3-d analysis was found to be about 3 times greaterthan the tension force calculated from unit cell analy-ses. Such differences are attributed to the fact that inthe full 3-d analyses lateral displacement of the em-bankment and soft foundation soil is permitted, thusinducing higher transverse forces in the geosynthetic.Since the geosynthetic acts like a membrane, it fol-lows that the tension force in the longitudinal direc-tion would also be affected.
6. Finite element results showed that 3-d and axisym-metric unit cell analyses are generally unaffectedby the nodal constraints imposed along the bottom
13
boundary of the GEC and the surrounding soft soil.This is explained by the fact that there is no lateralloading in the unit cell idealizations. For full 3-d anal-yses the results were, however, affected by the de-gree of nodal constraint in the transverse direction(x-direction) along the bottom boundary. This effectis attributed to the lateral spreading of the embank-ment. In particular, it was found that the results fromthe full 3-d analyses with a “standard” degree of nodalconstraint along the bottom boundary differed fromthose calculated from similar analyses with an “in-creased” degree of nodal constraint along the bottomboundary. It was also found that the results of unitcell analyses were more similar to the results of a full 3-d analysis with an increased degree of nodal constraintalong the bottom boundary. In reality, however, thebottom boundary is neither completely constrained inall directions nor it is free to move laterally. In otherwords, the behavior along the actual bottom bound-ary is likely somewhere between the two extremes ofnodal constraint assumed in this study. In addition,the effect of the bottom boundary on the numerical re-sults of a full 3-d analysis of GRCSEs is also expectedto be dependent on the length of the deep foundationelements. In particular, as the length of these ele-ments increases, the influence of the bottom boundaryon the finite element results is expected to decrease.This effect, however, was not investigated as part ofthis study.
7. For the models with a “standard” degree of nodal con-straint along the bottom boundary, the largest differ-ences in results between the full 3-d and unit cell anal-yses were in the calculation of the settlement of thefoundation soil and the maximum value of the lateraldisplacement of the GECs. This difference was typ-ically found to be less than 20%. The difference inthese results is expected to be even smaller if somefixity is present along the bottom boundary, which isa reasonable expectation for an actual GRCSE. Con-sequently, the authors feel that a unit cell idealizationprovides a reasonable approximation of the behaviorthat is obtained from full 3-d analyses for GRCSEsthat are constructed using GECs. The only exceptionto this conclusion is the calculation of tensile forcesthat are induced in the geosynthetic reinforcementlayer by the lateral spreading of the embankment inboth the transverse and longitudinal directions.
Although the conclusions that are reached in this studycannot necessarily be generalized to all cases with differ-ent geometries and soil/geosynthetic properties, they doprovide a useful indication of general trends in GRCSEbehavior. Future experimental research is needed in thisarea to validate the simulation-based observations that aremade herein.
Acknowledgments
This material is based upon work supported in part by theGeosynthetic Institute under its GSI Fellowship Program.
List of symbols
The following symbols are used in this paper:
c = Effective cohesion (Pa);D = Column diameter (m);De = Center-to-center column spacing (m);e = Void ratio at unit pressure (dimensionless);E = Effective Young’s modulus (Pa);J = Tensile modulus (N/m);M = Slope of the critical state line (dimensionless);φ = Friction angle (degree);κ = The slope of the swelling line (dimensionless);λ = The slope of the virgin consolidation line
(dimensionless);ν = Poisson’s ratio (dimensionless);ψ = Dilatancy angle (degree).
References
Alexiew D, Brokemper D, Lothspeich S (2005) Geotextile en-cased columns (GEC): load capacity, geotextile selection andpre-design graphs. In: Proceedings of the geofrontiers 2005congress, Austin, Texas, pp 1-14
Al-Joulani N, Bauer GE (1995) Laboratory behavior of sleeve-reinforced stone columns. Geosynthetics ‘95 conference pro-ceedings, pp 1111-1123
Almeida MSS, Hosseinpour I, Riccio M (2013) Performance ofa geosynthetic-encased column (GEC) in soft ground: nu-merical and analytical studies. Geosynth Int 20(4):252-262
Balasubramanian AS, Chaudhry AR (1978) Deformation andstrength characteristics of soft Bangkok clay. J Geotech EngDiv ASCE 104(9):1153-1167
Borges JL, Domingues TS, Cardoso AS (2009) Embankmentson soft soil reinforced with stone columns: numerical analy-sis and proposal of a new design method. Geotech Geol Eng27(6):667-679
Brooker EW, Ireland HO (1965) Earth pressures at rest relatedto stress history. Can Geotech J 2(1):1-15
BS 8006 (1995) Code of practice for strengthened/reinforcedsoils and other fills. BSI, Milton Keynes
Carlson BO (1987) Armerad Jord berakningsprinciper forbanker pa palar. Terranova, Distr. SGI., Linkoping (inSwedish)
Castro J, Sagaseta C (2009) Consolidation around stonecolumns. Influence of column deformation. Int J NumerAnal Meth Geomech 33(7):851-877
Chen RP, Chen YM, Han J, Xu ZZ (2008) A theoretical so-lution for pile-supported embankments on soft soils underone-dimensional compression. Can Geotech J 45(5):611-623
Chew SH, Phoon HL, Hello BL, Villard P (2006) Geosyntheticreinforced piled embankment: large-scale model tests andnumerical modeling. In: 8th International conference ongeosynthetics, Geosynthetics, Yokohama, Japan, September18-22, vol 1-4, pp 901-904
Collin JG (2004) Column supported embankment design con-siderations. In: Labuz JF, Bentler JG (eds) Proceedings ofthe 52nd annual geotechnical engineering conference, Uni-versity of Minnesota, St. Paul, pp 51-78
Elias V, Welsh J, Warren J, Lukas R, Collin G, Berg RR (2006)Ground improvement methods, volume II, FHWA-NHI-06-020
14

Elsawy MBD (2013) Behaviour of soft ground improved by con-ventional and geogrid-encased stone columns, based on FEMstudy. Geosynth Int 20(4):276-285
Han J, Gabr MA (2002) Numerical analysis of geosynthetic-reinforced and pile-supported earth platforms over soft soil.J Geotech Geoenviron Eng 128(1):44-53
Han J, Wayne MH (2000) Pile-soil-geosynthetic interactionsin geosynthetic reinforced platform/piled embankments oversoft soil. In: Presentation at 79th annual transportation re-search board meeting, Washington, DC
Han J, Collin JG, Huang J (2004) Recent developmentof geosynthetic-reinforced column-supported embankments.In: Proceedings of the 55th highway geology symposium,Kansas City, Missouri, September 7-10, pp 299-321
Han J, Huang J, Porbaha A (2005) 2D numerical modelingof a constructed geosynthetic-reinforced embankment overdeep mixed columns. ASCE Geotechnical Special Publica-tion (GSP) No. 131: contemporary issues in foundationengineering, ASCE GeoFrontiers, Austin, TX, pp 24-26
Han J, Oztoprak S, Parsons RL, Huang J (2007) Numericalanalysis of foundation columns to support widening of em-bankments. Comput Geotech 34(6):435-448
Hibbitt, Karlsson and Sorensen Inc. (2007) ABAQUS user’smanual, version 6.7, Pawtucket, RI
Huang J, Han J, Collin JG (2006) Deformations of geosynthetic-reinforced column-supported embankments. In: Proceed-ings of the 8th international geosynthetics conference, 18-22September, Yokohama, Japan, pp 1029-1032
Huang J, Han J, Oztoprak S (2009) Coupled mechanicaland hydraulic modeling of geosynthetic-reinforced column-supported embankments. J Geotech Geoenviron Eng135(8):1011-1021
Jenck O, Dias D, Kastner R (2009) Three-dimensional nu-merical modeling of a piled embankment. Int J Geomech9(3):102-112
Jones CJPF, Lawson CR, Ayres DJ (1990) Geotextiles rein-forced piled embankments. In: 4th international conferenceon geotextiles, geomembranes and related products, DenHaag, vol 1, pp 155-160
Kaliakin VN, Khabbazian M, Meehan CL (2012) Modelingthe behavior of geosynthetic encased columns: influenceof granular soil constitutive model. Int J Geomech ASCE12(4):357-369. doi:10.1061/(ASCE)GM.1943-5622.0000084
Kempfert H-G, Gobel C, Alexiew D, Heitz C (2004) Ger-man recommendations for reinforced embankments on pile-similar elements. EuroGeo3: 3rd European geosynthet-ics conference, geotechnical engineering with geosynthetics,Munich, pp 279-284
Kempton G, Russell D, Pierpoint ND, Jones CJFP (1998) Two-and three-dimensional numerical analysis of the performanceof piled embankments. In: Proceedings of the 6th interna-tional conference on geosynthetics, Atlanta, GA, pp 767-772
Khabbazian M (2011) Numerical simulation of geosynthetic en-cased columns used individually and in group configurations.A dissertation submitted to the Faculty of the University ofDelaware in partial fulfillment of the requirements for thedegree of Doctor of Philosophy in Civil Engineering
Khabbazian M, Kaliakin VN, Meehan CL (2009) 3D analy-ses of geosynthetic encased stone columns. In: Proceedingsof international foundations congress and equipment expo09 (IFCEE09), contemporary topics in ground modification,problem soils, and geo-support, geotechnical special publica-tion No. 187, Orlando, FL, March 15-19, ASCE, pp 201-208
Khabbazian M, Kaliakin VN, Meehan CL (2010a) Numericalstudy of the effect of geosynthetic encasement on the be-
haviour of granular columns. Geosynth Int Thomas Telford17(3):132-143
Khabbazian M, Meehan CL, Kaliakin VN (2010b) Numericalstudy of effect of encasement on stone column performance.In: Proceedings GeoFlorida 2010: advances in analysis,modeling & design, geotechnical special publication No. 199,West Palm Beach, FL, February 20-24, 2010, ASCE, Reston,VA, pp 184-193
Khabbazian M, Kaliakin VN, Meehan CL (2011a) Performanceof quasilinear elastic constitutive models in simulation ofgeosynthetic encased columns. Comput Geotech 38(8):998-1007
Khabbazian M, Meehan CL, Kaliakin VN (2011b) Influence ofgranular soil constitutive model when simulating the behav-ior of geosynthetic encased columns. Geo-Frontiers 2011:advances in geotechnical engineering, geotechnical specialpublication No. 211, Dallas, TX, March 13-16, 2011, ASCE,Reston, VA, pp 539-548
Khabbazian M, Kaliakin VN, Meehan CL (2012) Numericalsimulation of column supported embankments with geosyn-thetic encased columns: influence of soft soil constitutivemodel. Geo-Congress 2012: state of the art and practicein geotechnical engineering, geotechnical special publicationno. 225, Oakland, CA, March 25-29, 2012, ASCE, Reston,VA, 1-10. doi:10.1061/9780784412121.001
Lawson CR (1992) Soil reinforcement with geosynthetics.Southeast Asian Geotechnical Society (SEAGS), ApplGround Improv Tech, pp 55-74
Lee KL, Seed HB (1967) Drained strength characteristics ofsands. J Soil Mech Found Div ASCE 93(6):117-141
Liu HL, Ng CWW, Fei K (2007) Performance of a geogrid-reinforced and pile supported highway embankment over softclay: case study. J Geotech Geoenviron Eng 133(12):1483-1493
Lo SR, Zhang R, Mak J (2010) Geosynthetic-encased stonecolumns in soft clay: a numerical study. Geotext Geomembr28(3):292-302
Malarvizhi SN, Ilamparuthi K (2007) Performance of stone col-umn encased with geogrids. In: Proceedings of the 4th in-ternational conference on soft soil engineering, pp 309-314
McKelvey JA, III (1994) Consideration of equipment loadingsin geosynthetic lined slope designs. In: Proceedings of the8th international conference on computer methods and ad-vances in geomechanics, Rotterdam, vol 2, pp 1371-1377
Murugesan S, Rajagopal K (2006) Geosynthetic-encased stonecolumns: numerical evaluation. Geotext Geomembr24(6):349-358
Murugesan S, Rajagopal K (2007) Model tests on geosynthetic-encased stone columns. Geosynth Int 14(6):346-354
Oh YI, Shin EC (2007) Reinforcement and arching effect ofgeogrid-reinforced and pile-supported embankment on ma-rine soft ground. Mar Georesour Geotechnol 25(2):97-118
Park S, Yoo C, Lee D (2007). A study on the geogrid rein-forced stone column system for settlement reduction effect.In: Proceedings of the seventeenth international offshore andpolar engineering conference, Lisbon, Portugal, July 1-6, pp1636-1641
Plaut RH, Filz GM (2010) Analysis of geosynthetic reinforce-ment in pile-supported embankments. Part III: axisymmet-ric model. Geosynth Int 17(2):77-85
Pulko B, Majes B, Logar J (2011) Geosynthetic-encased stonecolumns: analytical calculation model. Geotext Geomembr29(1):29-39
15

Russell D, Pierpoint N (1997) An assessment of design methodsfor piled embankments. Ground Eng 30(11):39-44
Smith M, Filz G (2007) Axisymmetric numerical modeling ofa unit cell in geosynthetic-reinforced, column-supported em-bankments. Geosynth Int 14(1):13-22
Stewart ME, Filz GM (2005) Loads on geosynthetic reinforce-ment in bridging layers for pile-supported embankments. In:Proceedings of geo-frontiers 2005, ASCE, Austin
Tan SA, Tjahyono S, Oo KK (2008) Simplified plane-strainmodeling of stone-column reinforced ground. J GeotechGeoenviron Eng 134(2):185-194
Vega-Meyer R, Shao Y (2005) Geogrid-reinforced and pile-supported roadway embankment. Geo-Frontiers 2005, con-temporary issues in foundation engineering, geotechnicalspecial publication no. 131, January 24-26, Austin, Texas
Wachman GS, Biolzi L, Labuz JF (2010) Structural behavior ofa pile-supported embankment. J Geotech Geoenviron Eng136(1):26-34
Yan L, Yang JS, Han J (2006) Parametric study of geosynthetic-reinforced pile-supported embankments. Advances in earthstructures: research to practice, ASCE Geotechnical Spe-cial Publication No. 151. In: Yin J-H, White DJ, Han J,Lin G (eds) Proceedings of the GeoShanghai internationalconference 2006, Shanghai, China, June 6-8, pp 255-261
Yoo C (2010) Performance of geosynthetic-encased stonecolumns in embankment construction: numerical investiga-tion. J Geotech Geoenviron Eng 138(8):1148-1160
Yoo C, Kim SB (2009) Numerical modeling of geosynthetic-encased stone column-reinforced ground. Geosynth Int16(3):116-126
Zheng JJ, Chen BG, Lu YE, Abusharar SW, Yin JH (2009) Theperformance of an embankment on soft ground reinforcedwith geosynthetics and pile walls. Geosynth Int 16(3):173-182
16

![Concentric Arches Model Validation with Embankment on soft ... · Load transfer in Geosynthetic reinforced piled supported embankments [Source: (7)] 1.2 DIFFERENT DESIGN CODES AVAILABLE](https://img.pdfslide.net/doc/110x75/60631c9d554bbd5a483f2844/concentric-arches-model-validation-with-embankment-on-soft-load-transfer-in.jpg)