Embed Size (px)
Citation preview

4825 Mark Center Drive • Alexandria, Virginia 22311-1850
CRM D0006315.A2/FinalOctober 2002
Combat Logistics Force Levels:Methodology and Results
Wendy R Trickey • Burnham C. McCaffree Jr.

Approved for distribution:
Integrated Systems and Operations Division
This document represents the best opinion of CNA at the time of issue. It does not necessarily represent the opinion of the Department of the Navy.
Approved for Public Release; Distribution Unlimited. Specific authority: N00014-00-D-0700. For copies of this document call: CNA Document Control and Distribution Section at 703-824-2123
October 2002
Copyright 0 2002 The CNA Corporation

Contents
Summary . . . . . . . . . . . . . . . . . . . . . . . . . . . . . . 1Background and methodology . . . . . . . . . . . . . . . 1Results . . . . . . . . . . . . . . . . . . . . . . . . . . . . 2
Introduction . . . . . . . . . . . . . . . . . . . . . . . . . . . . 5
Timeline methodology and assumptions . . . . . . . . . . . . . 9Timeline description . . . . . . . . . . . . . . . . . . . . . 9Peacetime presence requirements . . . . . . . . . . . . . 10
Initial use of presence requirements in the timeline methodology . . . . . . . . . . . . . . . . . 10
Current presence requirements . . . . . . . . . . . . 11CLF presence requirements during Operation
Enduring Freedom . . . . . . . . . . . . . . . . . . 12Post-OEF CLF presence requirements . . . . . . . . . 12
Timeline assumptions . . . . . . . . . . . . . . . . . . . . 14Maintenance . . . . . . . . . . . . . . . . . . . . . . 14AOE workup for deployment. . . . . . . . . . . . . . 16Transit between theaters . . . . . . . . . . . . . . . . 16Deployment lengths . . . . . . . . . . . . . . . . . . 17AOE conversions . . . . . . . . . . . . . . . . . . . . 18CLF transition. . . . . . . . . . . . . . . . . . . . . . 18FDNF carrier battle group . . . . . . . . . . . . . . . 19
Other considerations . . . . . . . . . . . . . . . . . . . . . . . 21Presence requirements. . . . . . . . . . . . . . . . . . . . 21Timeline limitations . . . . . . . . . . . . . . . . . . . . . 22
Force structure requirements and capabilities . . . . . . . . . . 25CLF Alternative I . . . . . . . . . . . . . . . . . . . . . . . 26
Near-term period (2003-2006) . . . . . . . . . . . . . 26Mid-term period (2007-2015) . . . . . . . . . . . . . 28Far-term period (2016-2020) . . . . . . . . . . . . . . 30
i

CLF Alternative II . . . . . . . . . . . . . . . . . . . . . . 31Near-term period . . . . . . . . . . . . . . . . . . . . 32Mid-term period (2007-2015) . . . . . . . . . . . . . 32Far-term period (2016-2020) . . . . . . . . . . . . . . 34
Summary of results . . . . . . . . . . . . . . . . . . . . . . 35Alternative III . . . . . . . . . . . . . . . . . . . . . . 38
Conclusions . . . . . . . . . . . . . . . . . . . . . . . . . . . . 39
Appendix . . . . . . . . . . . . . . . . . . . . . . . . . . . . . . 41
References . . . . . . . . . . . . . . . . . . . . . . . . . . . . . 55
List of figures . . . . . . . . . . . . . . . . . . . . . . . . . . . 57
List of tables . . . . . . . . . . . . . . . . . . . . . . . . . . . . 59
Distribution list . . . . . . . . . . . . . . . . . . . . . . . . . . 61
ii

Summary
Background and methodology
The Director, Strategic Mobility and Combat Logistics Division (N42)in the Office of the Chief of Naval Operations recently asked CNA toinvestigate the future force structure of the Combat Logistics Force(CLF) based on current peacetime presence requirements. Thesponsor was interested in finding what changes in force structure willbe needed due to:
• The retirement of legacy ships and the commissioning of newships
• New assumptions based on maintenance and transit betweentheaters
• Post-September 11 combatant requirements.
We used a timeline methodology to assess the capabilities of a specificforce structure in meeting CLF peacetime presence requirements.The timelines use peacetime carrier battle group (CVBG) schedulesas a guideline for CLF ship scheduling. We investigated two transitionplans in this report: one with a transition to 12 T-AKEs that we calledAlternative I1, and one with a transition to 9 T-AKEs and 4 T-AOE(X)sthat we called Alternative II. These new ships replace 17 legacyships—4 AOE-1s, 6 T-AFSs, and 7 T-AEs. We used a timeline of 2003to 2020, which covers three phases:
• From 2003 through 2006, the near-term future, when thelegacy ships are still operational
1. Alternative I is similar to the Navy’s Program of Record as of Spring2002.
1

• From 2007 through 2015, the mid-term future, during whichthe CLF transitions from legacy classes to the new classes,including the Military Sealift Command (MSC) civilian modifi-cation (CIVMOD) alterations that the T-AOE-6s will require
• From 2016 through 2020, the far-term future, when all legacyships have been retired and all T-AKEs and T-AOE(X)s havebecome operational in the fleet.
These timelines enabled us to construct force-level transition plansfor the CLF that show, year by year, the number of:
• CLF ships of each type that are needed in a full operating status(FOS) to meet prescribed peacetime presence requirements2
• AOEs that are undergoing conversion from Navy operation toMSC operation and, later, are in extended maintenance toreceive the CIVMOD alteration
• T-AKEs and T-AOE(X)s that have been delivered and havebegun full operation
• Legacy ships that have been retired.
Based on the results of the timelines, we also investigated in less detaila third alternative, Alternative III, which transitions to a CLF of11 T-AKEs and 2 T-AOE(X)s.
Results
To meet the presence requirements with any Alternative in the near-term years, we determined that it was necessary to activate two T-AOsand two T-AEs from ROS to FOS early in FY 2003, resulting in 15 FOST-AOs and 6 FOS T-AEs. We found that if the (T)-AOEs [this notationrefers to all AOEs in the near-term future] in WestLant are used asshuttle ships when they are there for times beyond the (T)-AOE
2. While we do not propose building ships for the purpose of putting themin a reduced operational status (ROS), we found that not all CLF shipsin our timelines are continuously required in FOS to fulfill peacetimepresence requirements, and we have placed those ships in ROS.
2

presence requirement, it is not necessary to activate either a T-AO ora T-AE in FY 2003, and it may not be necessary to activate both ofthose ships.
During the transition, from 2007 to 2016, the total number of CLFships gradually decreases as new classes of ships enter the fleet,because each ship replaces one or two legacy ships. The number ofFOS ships fluctuates and eventually decreases by 2015.
In the final 5 years, 2016 to 2020, the transition is complete and noships are undergoing conversion. Table 1 shows a summary of thetwo alternative CLFs that we used in our transition plans, plus thethird alternative that we did not investigate with a timeline. All alter-natives are able to provide much of the required peacetime presence.
Alternative I in the far-term future would have 30 ships in FOS, withtwo shuttle ships (a T-AO and a T-AKE) in ROS that could be acti-vated to serve either as shuttle ships or, together, as a substitute CVBGstation ship. Alternative II would have 29 FOS ships, plus two new-construction T-AOE(X)s in ROS that could be activated to serve asstation ships, and two T-AOs in ROS.
If all four T-AOE(X)s in Alternative II were maintained in FOS, theexcess T-AOE(X) presence could be applied to the shuttle shiprequirements of the T-AO and T-AKE. Consequently, an additionalT-AO and/or a T-AKE could probably be placed in ROS.
Table 1. Alternative CLF force levels in the far-term (2016-2020)
Ship Type Alternative I Alternative II Alternative IIIFOS ROS FOS ROS FOS ROS
T-AOE-6 4 0 4 0 4 0T-AOE(X) 0 0 2 2 2 0T-AO 15 1 14 2 14 2T-AKE 11 1 9 0 9 2Total 30 2 29 4 29 4
3

Alternative III is an adjustment from Alternative II that does not con-tain the excess T-AOE(X)s in ROS. It includes 11 T-AKEs, 6 T-AOEs,and 16 T-AOs, totaling 33 ships. Of these ships, two T-AOs and twoT-AKEs are in ROS. The ROS T-AKEs could be activated to act as sub-stitute CVBG station ships (with the T-AOs) if needed, and could alsohelp to fulfill the shuttle T-AKE requirements.
To summarize:
• All alternatives are identical in the near term in compositionand thus in the peacetime presence they provide.
• During most of the mid-term transition period, Alternative IIrequires slightly (1-2) more ships and generates slightly morepresence in home waters than Alternative I (they do equallywell in overseas theaters).
• In the far-term future, Alternative I requires one more FOSship than Alternative II, and the two alternatives are compara-ble in fulfilling presence requirements.
4

Introduction
The CLF is composed of the ships whose mission is to provide logisticssupport to Navy ships, with fuel, ordnance, food, repair parts, andother stores. These ships enable combatants to remain on station andcontinue their primary mission, without having to resupply at a port.They are particularly important when combatants are unable toreceive supplies from local ports in theater because force protectionmeasures do not allow it.
The current CLF consists of four types of ships:
• The fast combat support ship, the AOE, which is a triple-prod-uct ship having storage space for fuel, ordnance, and dry andrefrigerated stores. The AOE primarily serves as a carrier battlegroup station ship—it replenishes combatant ships of theCVBG during transits as well as in the overseas theater. Thereare eight AOEs—four AOE-1 class ships and four AOE-6 classships. One AOE-6 class ship has been transferred to the MSC,one is currently undergoing the transfer, and the other two willbe transferred by 2005. The Navy plans to decommission thefour AOE-1s from 2006 to 2007.
• The fleet oiler of the T-AO 187 class, which carries Diesel FuelMarine (DFM) for ships’ propulsion and JP-5 jet fuel for air-craft. There are currently 16 T-AOs, all operated by the MSC.Two of these ships are in Category B (Cat B) in the NationalDefense Reserve Fleet and one is in ROS. They are 10 to15 years old.
• The combat stores ship, MSC-operated T-AFS, carries dry andrefrigerated stores and provisions. All six T-AFSs are in FOS.Most of them are over 30 years old, and they are scheduled tobe decommissioned starting in about 2008.
5
• The ammunition ship, the T-AE. Four of these ships are in FOSand operated by MSC and three are in ROS. These ships arescheduled to be decommissioned over the next 10 years.
The T-AO, T-AFS, and T-AE serve as shuttle ships, transiting betweenthe closest resupply port and the combatants at sea. They replenishthe CVBG station ship, and also directly resupply combatants. Whennecessary, a T-AO and T-AE together serve as a substitute CVBG sta-tion ship.
The Chairman, Joint Chiefs of Staff (CJCS) Global Naval Force Pres-ence Policy (GNFPP) states the number of Navy combatant ships thatmust be present in each overseas theater during the year. For exam-ple, a presence requirement of 0.50 for the aircraft carrier impliesthat a carrier must be in the theater for half of the year—183 out of365 days. The GNFPP presence values are based on the JCS’s assess-ment of the amount of combatant ship presence required in the sev-eral theaters for national defense and other priorities. Based on thesecombatant presence requirements, the Navy Fleet commandersdetermine the CLF ship presence needed in each theater to supportthis force.
From these CLF presence requirements, it is necessary to determinethe force structure required to meet them. For example, if a theaterhad a 1.0 presence requirement for a certain type of ship, more thanone of those ships would be needed to meet the requirement, due tomaintenance, transit times, deployment length restrictions, andother scheduling considerations.
The Director, Strategic Mobility and Combat Logistics Division(OPNAV N42), asked CNA to investigate future CLF force structurerequirements based on current presence requirements and shipacquisition plans. The sponsor wanted to find out what changes inforce structure will be needed due to:
• The retirement of legacy ships and the commissioning of newships
• New assumptions based on maintenance and transit betweentheaters
6

• Post-September 11 combatant requirements.
We used an assessment methodology that enables us to calculate anddisplay the CLF force structure year by year. This methodologyinvolves creating timelines in which we schedule each CLF shipmonth by month, and then calculate the cumulative presence of eachship type in each theater. The results allow us to assess the capabilitiesof a particular force structure to meet all specified presence require-ments.
The methodology also allows us to investigate the transition to newships as the Navy decommissions current ships. Currently, the Navyplans to procure 12 T-AKEs—double-product ships that can carryboth ordnance and dry stores. These ships will replace the T-AEs andT-AFSs. There is concern, however, that as the AOE-1s are decommis-sioned, using a T-AKE with a T-AO as a CVBG station ship will notmeet battle group needs. As a result, the Navy is now contemplatingbuilding a new class of multi-product CLF ship known as a T-AOE(X)that would replace the AOE-1s as CVBG station ships. Therefore, inthis document we have used our methodology to investigate CLFforce-level requirements with and without the T-AOE(X).
7


Timeline methodology and assumptions
When CNA conducted the analysis of alternatives (AOA) for the Aux-iliary Dry Cargo Carrier, the TADC(X) (now referred to as the T-AKE(Auxiliary Cargo and Ammunition Ship)), we found that we neededa means of depicting the transition of the CLF from the present to thefuture well beyond when that new class entered the fleet [1]. Associ-ated with the CLF transition plan was the need to represent theemployment of CLF ships to fulfill certain peacetime presencerequirements in each theater where the U.S. Navy customarily oper-ates, in order to determine how many CLF ships were required inFOS. As a result, we developed a spreadsheet methodology thatenabled us to depict the notional employment of each ship throughthe various maintenance and operating evolutions it would normallyexperience in peacetime. We could then calculate the numbers andtypes of CLF ships needed to meet the prescribed peacetime pres-ence in each theater. This methodology became known as the “time-line methodology” because the notional ship schedules are depictedas timelines for all CLF ships in the Atlantic Fleet (LANTFLT) andPacific Fleet (PACFLT).
The timeline methodology was also used to develop a series of CLFtransition plans for a 1999 OPNAV Working Group that was con-vened by N76 to work in conjunction with the LANTFLT andPACFLT headquarters staffs to determine peacetime CLF require-ments [2]. It was used subsequently in support of the 2000 CIN-CLANTFLT “Fleet Analysis of the CLF” study and mid-2001deliberations by fleet representatives on the number of TAFSs thatare required in peacetime [3, 4].
Timeline description
We created the timelines in Microsoft Excel, with separate timelinesfor PACFLT and LANTFLT CLF ships. They show notional monthly
9

scheduling of every CLF ship, as well as CVBG deployments, fromFY 2003 through FY 2020. For each month, we assigned a color codeto each ship representing the theater in which the ship is located.When a ship is undergoing maintenance or training, or is in ROS, weassigned no color to it for that month. Ships both in ROS and Cat Bwere labeled as “ROS” in the timelines.
The timelines schedule all LANTFLT and PACFLT CLF shipsthroughout the course of each year, built on CVBG deploymentschedules. We used the most recent CVBG schedules for the first5 years, obtained from the GNFPP conference, and then repeated theschedule into later years [5]. Each CVBG includes as its station ship a(T)-AOE, or a T-AO paired with a T-AE or T-AKE.
We wrote a program in Visual Basic that calculates the amount ofpresence for each month for each type of ship. The program sums thecontribution of each ship for each theater. We then averaged theamount of presence for each ship type in each theater for every year.The results show whether the ships are meeting presence require-ments based on a specific set of maintenance, transit, and deploy-ment assumptions.
Peacetime presence requirements
We needed to determine presence requirements to apply to the time-lines. The following sections describe how we chose the requirementsthat we used.
Initial use of presence requirements in the timeline methodology
In June 1997, to assist CNA in its AOA of the TADC(X), CINCLANT-FLT and CINCPACFLT provided us with the presence requirementsthat they endeavored to achieve with CLF ships in order to providelogistics support of their battle force ships (see table 2) [6]. Therequirements included not only those for the overseas theaters wherethe Navy operates—the Mediterranean (Med), the Central Com-mand area of responsibility (CentCom), and the Western Pacific andIndian Ocean (WestPac)—but also those for the theaters contiguousto the United States—the Western Atlantic including the Caribbean
10

(WestLant) and the Eastern and Middle Pacific (EastPac). CNAsubsequently used these CLF presence requirements both in anexpanded AOA of the entire CLF in 1998 as the basis for determiningthe force structure required to meet them, and to compute peace-time force-level requirements for an OPNAV CLF Working Group in1999 [1].
Current presence requirements
In July 2001 CINCLANTFLT hosted a CLF working group meeting todiscuss CLF presence and force structure requirements. The groupassessed the presence requirements based on previous requirementsand historical data. Table 3 shows the values they determined [7].
Table 2. CLF presence requirements on 17 June 1997
LANTFLT PACFLTWestLant Med CentCom WestPac EastPac
AOEa
a. The AOE requirement is fulfilled by both AOEs and substitute station ships (a T-AO plus a T-AE).
0.75 1.00 0.75 0.33 0.75
T-AOb
b. When acting as a substitute station ship, the ships’ presence is not counted towards the T-AO or T-AE presence.
2.33 2.00 1.00 2.00 2.00
T-AEb 0.75 0.00 0.00 1.00 0.75
T-AFS 0.00 1.00 1.00c
c. It was informally understood that this requirement would be jointly filled by PACFLT and LANTFLT T-AFSs.
1.50 0.00
Table 3. CLF presence requirements in August 2001
LANTFLT PACFLTWestLant Med CentCom CentCom WestPac EastPac
(T)-AOEa
a. The (T)-AOE requirement is fulfilled by both (T)-AOEs and substitute station ships (a T-AO plus a T-AE)
0.75 1.00 0.50 0.50 0.33 0.75
T-AOb 2.33 2.00 0.00 1.00 2.00 2.00
T-AEb 0.75 0.00 0.00 0.00 1.30 1.00
T-AFS 0.00 1.00 0.50 0.50 1.85 0.00
11

The working group recognized that CentCom had become a theaterin which battle force ships and CLF shuttle ships of both fleets oper-ated each year, and it subdivided the CentCom column into a columnfor each fleet. In view of the fact that a CVBG of each fleet was oper-ating there about half of each year, with an AOE as a station ship,each fleet would provide an AOE (or T-AOE when the AOE 6 classships transition to the MSC) 0.50 annually. Similarly, each fleetagreed to provide a T-AFS to CentCom for half of the year.
CLF presence requirements during Operation Enduring Freedom
Following the 11 September 2001 terrorist attacks, presence require-ments for CVBG deployments essentially changed in a number ofareas. For example, from October 2001 to July 2002, the LANTFLTCVBG was deployed mostly to CentCom rather than to the Med [8].Similarly, from October to December 2001 the Forward DeployedNaval Force (FDNF) carrier was deployed to CentCom out of itsnormal rotation [9]. With the changed CVBG (and amphibious readygroup (ARG)) presence in overseas theaters, we perceived a numberof de facto changes in presence requirements for CLF ships, withincreases in CentCom and reductions in the Med and in WestPac.Specifically, two AOEs, two T-AOs, and two T-AFSs were in CentCom,and eventually one T-AE went there as well [10]. Concomitantly, theAOE presence in the Med dropped to only that which resulted fromAOEs transiting with CVBGs through the theater (< 0.33).
Post-OEF CLF presence requirements
By the end of April 2002, the number of CVBGs and ARGs in Cent-Com had dropped to one each, or half the number that had beenpresent for most of the past 8 months. Also during April, the numberof CLF ships dropped from seven to three, with an AOE, a T-AO, anda T-AFS remaining to support the CVBG and the ARG [11]. We there-fore did not increase any CLF presence requirements due to OEF.
b. When acting as a substitute station ship, the ships’ presence is not counted towards the T-AO or T-AE presence.
12

Based on the GNFPP CVBG schedules, in the future LANTFLT andPACFLT will both contribute about half of the CVBG presencerequirement in CentCom [5]. This will allow the LANTFLT CVBGsto be present more of each year in the Med, their traditional forwardoperating theater. However, based on the schedules, the CVBGs willstill not be present in the Med every day of the year. We thereforereduced the Med (T)-AOE requirement to 0.75, recognizing that the(T)-AOE requirement will vary with the CVBG presence there.
In some cases the July 2001 working group established increased pres-ence requirements on the basis of historical presence data from 1999and 2000 (table 3). But for two of these cases, we did not observe fromtheir data that there was a need for more operating days in the the-ater. Thus, we decreased the presence requirements to their originalvalue—the WestPac T-AFS from 1.85 to 1.50 and the EastPac T-AEfrom 1.00 to 0.75 [12]. We kept the WestPac T-AE at its increasedvalue.
In the past, the AOE presence requirement in WestPac was 0.33,which reflected the presence derived from AOEs accompanying theCVBGs that transited from EastPac to CentCom. However, that valuediscounts the presence contributed by the FDNF CVBG station ship.Consequently, we assumed that a substitute station ship was requiredat all times for the FDNF CVBG, and thus increased the WestPac(T)-AOE requirement to 1.33.
In 2007 the T-AKEs will become operational in the fleet. In view thatthey will replace the T-AEs and T-AFSs, we assumed that the presencerequirement for the T-AKE in each region would be the sum of therequirements for the two types of ships it is replacing.
Therefore, we assume that the CLF presence requirements for theforeseeable future will resemble the numbers shown in table 4. Thevalues in blue show the changes we made from table 3.
Timeline assumptions
We made every effort to construct employment and deployment time-lines for CLF ships (see the appendix) that are reasonable with
13

respect to the events depicted in the course of the ships’ operationalcycle. To do so, we obtained planning factors from the Navy andmade assumptions that are associated with the following:
• The periodicity and duration of major maintenance events
• The sequence and duration of workup events leading to for-ward deployments and the deployments themselves
• The duration of transits between theaters, including thenumber of days that do not contribute to peacetime presence
• The length of ship transition periods from Navy to MSC opera-tion, and major ship conversion availabilities
• The timing and duration of other key events in CLF transitionfrom legacy to new CLF ships.
The following sections explain the assumptions that we used for theCLF timelines, and our rationale for doing so.
Maintenance
The following sections describe the maintenance assumptions forCLF ships in the MSC and in the Navy.
MSC ship maintenance
CLF ships in the MSC follow maintenance cycles that include peri-odic preventive maintenance events in ship repair facilities. Figure 1shows a notional maintenance schedule for a 5-year period for anMSC ship. Major maintenance events occur every 15 months, alter-nating between mid-term availabilities (MTAs) that last 30 days
Table 4. CLF future presence requirements
LANTFLT PACFLTWestLant Med CentCom CentCom WestPac EastPac
(T)-AOE 0.75 0.75 0.50 0.50 1.33 0.75
T-AO 2.33 2.00 0.00 1.00 2.00 2.00
T-AE 0.75 0.00 0.00 0.00 1.30 0.75
T-AFS 0.00 1.00 0.50 0.50 1.50 0.00
T-AKE 0.75 1.00 0.50 0.50 2.80 0.75
14

(green) and regular overhauls (ROHs) that last 60 days (red). Inquarters where major maintenances are not scheduled, the shipundergoes a 14-day voyage repair (VR), shown in blue. Over 5 years,the number of maintenance days varies each year, from 56 to 102days. The average number of maintenance days per year is 81.
An MSC ship is operationally available to the fleet for 270 days out of365 days each year, with the balance of the year devoted to mainte-nance and availability for inspections, training, and other MSCevents. MSC does not need all of those 95 days for maintenance inyears when ROHs do not take place, but the ships still are not avail-able for Navy use during that time. However, the timing of these extraMSC days is flexible, and they can be worked around naval needs. Wehave decided that due to this flexibility in years of less maintenance,ships can be counted as present for more than 270 days each year.
Although VRs must be completed each quarter, there is flexibility inwhen they can be scheduled within the quarter. Also, in most cases aship can be brought out of a VR within 72 hours. Consequently, wecounted CLF ships as contributing to theater presence when they arein a VR. This strategy is consistent with the way the Navy counts pres-ence of combatant ships in quarterly selective readiness availabilities(SRAs) in overseas theaters [13].
The final concern with maintenance scheduling is flexibility andunpredictability. Many CLF ships are more than 20 years old. As shipsage, they require more, and sometimes unexpected, maintenance tokeep them operational. To account for this unpredictability, weadded 30 days of maintenance to the MTAs and ROHs, bringingthem to 60-day and 90-day availabilities, respectively. This strategy ofaddressing unexpected maintenance was confirmed by MSC [4, 14].
Figure 1. Notional maintenance schedule for an MSC ship
Year 1 Year 2 Year 3 Year 4 Year 5
15

In considering all of the above, in our timelines we scheduled MSCships for major maintenance availabilities every 15 months or less,alternating between 2- and 3-month periods. These periods do notcount as ship presence in a theater. We did not schedule VRs becausethey count towards presence.
Navy ship maintenance
Most CLF ships are already assigned to the MSC. However, there arestill six Navy AOEs (that number will reach zero in 2008). They aresubject to more stringent Navy operating and personnel tempo(OpTempo and PersTempo) restrictions, and maintenance andtraining requirements than MSC ships. In our timelines for Navy-operated AOEs, after each deployment we scheduled a month ofpost-deployment standdown, then a 4-month maintenance availabil-ity (SRA or equivalent), and then 6 months of basic and intermediate-level training before they join other ships of the CVBG in the Inter-Deployment Training Cycle (IDTC). These months do not contrib-ute to presence because the AOEs are not providing logistics supportduring these periods of maintenance and training.
AOE workup for deployment
When a (T)-AOE works up in preparation for a forward deployment,it participates with other ships of the CVBG in the IDTC. The IDTCincludes two major pre-deployment training events, the CompatibilityTraining Underway Exercise (COMPTUEX) and the Joint Task ForceExercise (JTFEX). The months in which these exercises are con-ducted count towards the (T)-AOE presence requirements in thehome theater because the (T)-AOEs are supporting the CVBG com-batants. One month prior to deployment, all CVBG ships are inportfor Preparation for Overseas Movement (POM), and this month doesnot count towards presence. T-AOs, T-AEs, and T-AKEs also followthese guidelines when they are employed as substitute CVBG stationships.
Transit between theaters
When a ship is in FOS, it is inevitably in one of the five theaters. How-ever, if a CLF ship is at the boundary of a theater during its inter-the-
16

ater transit, it is unlikely to be near enough to any combatants toresupply them. Therefore, based on input from the July 2001 CLFworking group, we chose to treat transit time as contributing to pres-ence only if the CLF ship transited in company with combatant ships.
CVBG station ships
(T)-AOEs and substitute CVBG station ships transit as a part of aCVBG. Therefore, we did not take any portion of the month duringtransit away from their presence calculation. To best represent thetransit of the CVBG deployment to the Med, 30 percent of both thefirst and last months of the deployment count towards WestLant pres-ence (with the remainder applied to the Med presence). For CVBGsdeploying to WestPac, 25 percent counts towards EastPac presence,with the balance of the month applied to WestPac.
Shuttle ships
COMSC supplied us with transit times between major ports in severaloverseas theaters [15]. We list these times in table 5. Based on thesetimes, table 5 shows the portions of the transit month that we havecounted and not counted towards presence in our timelines.
There is one exception to the shuttle ship transit time omissions.PACFLT stated that it sends T-AFSs to CentCom only with a CVBG[16]. Because a PACFLT T-AFS transits with the CVBG, and thereforeis in company with it during much of the transit, we counted the fullT-AFS transit as contributing to presence in one or more theaters.When the T-AKEs replace the T-AFSs, the same criterion applies.
Table 5. Shuttle ship transit times between theaters and the distribution of the month during transit
Transit between theater 1 and theater 2
Transit time (days)
Fraction towards theater 1
Fraction not
counted
Fraction towards theater 2
WestLant ⇔ Med 10.5 0.1 0.3 0.6
Med ⇔ CentCom 12.5 0.1 0.3 0.6
WestPac ⇔ CentCom 18.8-19.7 0.1 0.7 0.2
EastPac ⇔ WestPac 14-24.2 0.1 0.7 0.2
17

Deployment lengths
Currently, CLF ship deployments are 6 months long. Navy ships limitdeployment durations to 6 months portal-to-portal in order to avoidexceeding OpTempo and PersTempo requirements. MSC ships, how-ever, do not have these Navy tempo restrictions, so their deploymentscan be extended. MSC has stated that 9-month deployments are fea-sible if mariner recruiting and retention permits [15]. The advantageof extending deployments is that it would reduce these ships’ time intransit each year, thereby increasing their contribution to presencewithin theaters. We investigated a few scenarios in timelines where weused either 6- or 9-month deployments for the shuttle ships. Using9-month deployments, we found there was an increase in presence ineach theater for each type of ship, but usually by less than 0.1. Eventhough in most cases the presence did not change greatly, using9-month deployments simplified construction of our timelines. Wetherefore chose to schedule all MSC CLF shuttle ship deploymentsfor up to 9 months.
Deployments to CentCom are different from those to the Med or toWestPac because anti-terrorism and force protection concerns pro-hibit performing quarterly VRs. Consequently, T-AEs, T-AFSs, andT-AKEs must leave CentCom to get a 14-day VR. Therefore, we didnot deploy these ships to CentCom for longer than 4 months at atime.
AOE conversions
The four AOE-6 class ships are being transferred to the MSC. First,they undergo a hot transfer—a 6-month maintenance availability andpersonnel transfer period during which the ship is converted for MSCoperation. One AOE has already completed the hot transfer, thesecond began in June 2002, and the two in PACFLT will transition inthe next couple of years. About 8 years later, they will undergo a12-month major maintenance availability to complete MSC CIVMODalterations. The CIVMOD is then followed by a 3-month period forinspections, trials, and workup prior to returning to the fleet.
18

CLF transition
We used the most recent acquisition plans for the dates of delivery tothe Navy and to the Fleet of both the T-AKEs and T-AOE(X)s [17,18]. As we brought a new ship into the timelines on the date set forfleet delivery in the acquisition plans, we retired a legacy ship thatsame month, starting with the AOE-1 class ships. N42 submitted pro-posed changes to the Navy’s Ship and Aircraft Data Tables (SASDT)that show new planned commissioning and retirement dates of theCLF ships [19]. In the SASDT submission, the order of ships beingretired was based on the age and wear of the ship—the poorer thematerial condition of the ship, the sooner it was retired. We followedthe N42 order of ship type retirements in each fleet, but did notalways retire them in the same year. For example, in the SASDT sub-mission, a T-AFS is scheduled to be decommissioned in FY 2009 whenthe seventh T-AKE enters the fleet. A T-AE and a T-AFS are scheduledto be decommissioned in FY 2010 when the eighth T-AKE enters thefleet. Instead, we decommissioned a T-AFS and T-AE when the sev-enth T-AKE entered the fleet in FY 2009, and decommissioned a T-AFS in FY 2009 when the eighth T-AKE entered the fleet.
FDNF carrier battle group
There is an FDNF CVBG homeported in WestPac, which deploys toCentCom every few years. This CVBG needs a station ship with it at alltimes when it is conducting battle group operations. Therefore, weassigned a T-AO and T-AE/T-AKE to act as the permanent substitutestation ship for the FDNF CVBG. These CLF ships are also home-ported in WestPac, but they do not count towards the theater pres-ence for CLF shuttle ships. Instead they count towards the (T)-AOEpresence in the theater where the FDNF CVBG is located.
19


Other considerations
We have based our analysis of the CLF structure on many assump-tions. Our results might have been different if our assumptions hadchanged. In addition, the timeline method of analysis has limitations.We discuss some of these issues in this section.
Presence requirements
The CLF force levels that we developed are primarily predicated onseeking to achieve the presence requirements provided to CNA bythe fleet (table 3). We do not know whether these presence require-ments are sufficient or excessive to the logistics support requirementsof forward-deployed naval forces, and comparable support require-ments in theater contiguous to the United States. If we were given dif-ferent presence requirements, our results would change.
We chose to calculate the theater presence requirement of the T-AKEby summing the requirement for the T-AE and T-AFS in each theater,because these are the ships that the T-AKE is replacing. However, theT-AKE should have greater efficiency in providing logistics support tocombatant naval forces because it is able to provide either ordnanceor dry stores, or both. So the presence requirements for this type shipmight not need to equal the sum of T-AE and T-AFS presencerequirements. Also, the T-AKE will have a small cargo fuel capacitythat will enable it to refuel small combatants or otherwise augmentthe theater oiler capabilities. The additional flexibility of a dual-prod-uct T-AKE with a cargo fuel capacity needs to be explored more thor-oughly.
The T-AO and T-AE/T-AKE devoted to the FDNF CVBG as a substi-tute station ship may be able to contribute to the shuttle ship require-ments of the theaters that they are in. Therefore, our assumption thatthese ships do not count towards the shuttle ship presence require-ment is conservative.
21

Presently, (T)-AOEs are scheduled concurrently with CVBGs so thatthey will be present for battle group events in preparation for andduring forward deployments. The amount of peacetime presencethat (T)-AOEs provide in each theater therefore derives from thepresence that the associated CVBGs provide in each theater, whichmay or may not equal their prescribed annual presence requirement.As an example, we were given a 1.33 presence requirement in West-Pac, which is fulfilled by the FDNF CVBG (hence, its substitute stationship) plus CVBGs (and their station ships) from EastPac. When weapplied the PACFLT CVBG deployment patterns, we calculated thatduring several years the actual CVBG (hence, (T)-AOE) presence inWestPac did not achieve the 1.33 requirement. This example showsthat whether or not (T)-AOEs achieve the required presence in anoverseas theater is entirely dependent on the way the CVBG deploy-ments are scheduled.
Timeline limitations
Transition plan results are highly dependent on the CVBG schedulesthat they use. If CVBG deployments became more frequent, (T)-AOEdeployments would become more frequent, possibly increasing theneed for substitute station ships. This in turn could lead to a need formore FOS T-AOs, T-AEs, or T-AKEs. The same trends would apply ifCVBG deployments became less frequent.
The timelines show a notional employment and deployment sched-ule for every ship in the CLF. We chose the schedules in a subjectivemanner, so that the presence requirements and maintenance sched-ule would be met, and the scheduling would look as easy to meet aspossible. Because we chose the schedules manually, other schedulescould also result in meeting the requirements. We do not knowwhether these other schedules would result in greater efficiency orgreater acceptance by the Navy.
The timeline results are based entirely on theater presence require-ments. They do not themselves show the effects of ship and theatercharacteristics on combatant needs. For example, the WestPac the-ater is very large, and combatant ships—the CLF’s customers—maybe conducting operations nearly simultaneously in several different
22

areas within that theater. A higher-speed ship may be able to meetmore customer replenishment needs than a slower ship. In fact, theprincipal argument for construction of the T-AOE(X) is to replacethe AOE-1 class ships in order to provide high-speed, multi-productships as station ships. The transition plans and timeline methodologywe have used in this analysis are not able to validate or contradict thisargument.
We did not investigate the result of changing CLF presence, andtherefore force structure, requirements in response to a contingency.We know from Operations Desert Storm and Enduring Freedom thatany significant growth in the number of combatant ships in a theaterattendant to a contingency will require a larger number of CLF shipsfor logistics support.
The timeline methodology calculates how many ships are needed inFOS to maintain certain prescribed levels of force presence in varioustheaters around the world. Another method that has been used todetermine force levels is to analyze the logistics demand of the com-batant forces afloat, both in the combat theater and in contiguoustheaters through which combatant forces must transit. This method,instead of using presence requirements, directly assesses supplyneeds and the ships required to deliver them, and can investigateboth peacetime and wartime requirements. The results obtainedfrom this other force-level assessment process may give additionalinsight into CLF responsibilities and capabilities.
23


Force structure requirements and capabilities
We prepared timelines to support two CLF transition plans (seeappendix). The first, Alternative I, contains a CLF that is consistentwith the Navy’s Program of Record for the CLF, in that it includes oneCLF acquisition program—12 ships of the T-AKE class. Alternative IIcontains a CLF that reflects two CLF acquisition programs in the nextdecade: nine ships of the T-AKE class and four ships of a new three-product ship called the T-AOE(X). The T-AOE(X) would replace thefour ships of the AOE-1 class as CVBG station ships.
Our transition plans and supporting timelines extend from 2003through 2020, and are divided into three periods:
• From 2003 through 2006, the near-term future when all legacyships are still operational and AOE-6 class ships undergo hottransfers to the MSC
• From 2007 through 2015, the mid-term future during whichthe CLF transitions from legacy-type classes to the new classes,including the MSC CIVMOD alterations that the T-AOE-6s willrequire
• From 2016 through 2020, the far-term future when all T-AFSs,T-AEs, and AOE-1s have been retired and all T-AKEs andT-AOE(X)s have become operational in the fleet.
Succeeding sections will summarize each of the alternatives, notingthe mix and number of CLF ships that are required to fulfill the pre-scribed presence in all five operating theaters. They will also notewhere our timelines did not completely produce the required pres-ence, and the reasons therefore. In the near-term period, thetwo transition plans and timelines are identical because the CLF con-sists of the same mix of ship types. Thus, we will summarize the nearterm in the Alternative I section only.
25

CLF Alternative I
The transition plan for Alternative I is shown in table 6. Force levelsare as of the first day of each Fiscal Year.
Near-term period (2003-2006)
The timelines start with the CLF ships in their current operatingstatus (FOS or ROS). In this and later periods, we activate ships thatare in ROS when we cannot reach the presence requirements in ourtimelines with the current CLF, and we place FOS ships in ROS whenthe presence resulting from the CLF is considerably greater than therequirement.
Table 6. The numbers and status of each ship type for the timeline transitioning to 12 T-AKEs (Alternative I)
Ship typeNear-term years Mid-term years Far-term years03 04 05 06 07 08 09 10 11 12 13 14 15 16 17 18 19 20
AOE-1 FOS 4 4 4 4 3 1 0 0 0 0 0 0 0 0 0 0 0 0AOE-6 FOS 2 1 0 0 0 0 0 0 0 0 0 0 0 0 0 0 0 0Under Conversion 1 1 1 0 0 0 0 0 1 1 1 1 1 0 0 0 0 0T-AOE FOS 1 2 3 4 4 4 4 4 3 3 3 3 3 4 4 4 4 4T-AOE ROS 0 0 0 0 0 0 0 0 0 0 0 0 0 0 0 0 0 0T-AO FOS 13 15 15 15 15 15 15 15 15 16 16 15 15 15 15 15 15 15T-AO ROS 3a
a. Two of the T-AOs are in CAT B, not ROS.
1 1 1 1 1 1 1 1 0 0 1 1 1 1 1 1 1T-AE FOS 4 6 6 6 4 4 4 3 2 2 2 2 0 0 0 0 0 0T-AE ROS 3 1 1 1 2 2 2 2 0 0 0 0 0 0 0 0 0 0T-AFS FOS 6 6 6 6 6 5 4 0 0 0 0 0 0 0 0 0 0 0T-AFS ROS 0 0 0 0 0 1 1 2 2 0 0 0 0 0 0 0 0 0T-AKE Delivered 0 0 0 1 2 2 2 3 2 0 0 0 0 0 0 0 0 0T-AKE FOS 0 0 0 0 1 3 5 8 9 11 11 11 11 11 11 11 11 11T-AKE ROS 0 0 0 0 0 0 0 0 1 1 1 1 1 1 1 1 1 1Total FOS 30 34 34 35 33 32 32 30 29 32 32 31 29 30 30 30 30 30Total Conversion 1 1 1 0 0 0 0 0 1 1 1 1 1 0 0 0 0 0Total ROS 6 2 2 2 3 4 4 5 4 1 1 2 2 2 2 2 2 2Total 37 37 37 37 36 36 36 35 34 34 34 34 32 32 32 32 32 32
26

(T)-AOEs
Throughout this period there are eight AOE class ships, with theAOE-6s undergoing hot transfer to the MSC so that by FY 2006 thereare four AOE-1s and four T-AOE-6s in the force. Planned CVBGdeployments are such that a (T)-AOE is present in the Med only for60 percent of the year. Therefore, our timelines do not maintain therequired 0.75 presence in that theater. The EastPac (T)-AOE require-ment is also not met in 2003, due to the obligatory maintenance andtraining that PACFLT (T)-AOEs must undergo during that year. Sim-ilarly, we do not achieve the 1.33 WestPac (T)-AOE presence require-ment in 2006, during which the FDNF CVBG is deployed out-of-areato CentCom.
In home theaters (EastPac and WestLant), there is excess presence of(T)-AOEs during most of these years. Since the (T)-AOE is both anammunition ship and an oiler, we explored the feasibility of employ-ing excess (T)-AOE presence in EastPac and WestLant to fulfill anyshortfall in T-AO or T-AE presence in those areas, as an alternative toactivating ROS T-AOs and T-AEs (which we discuss in the followingsections). We found that there is not sufficient excess (T)-AOE pres-ence in EastPac to apply to any shortfalls in the Pacific theater. Wedetermined that the excess (T)-AOE presence in WestLant could ful-fill the shortfall in either T-AO or T-AE presence there, if we did notactivate a ROS T-AE or ROS T-AO for that purpose. While our meth-odology is not able to test it, it is also possible that the multi-purpose(T)-AOEs in WestLant could simultaneously fulfill the shortfall inboth T-AO and T-AE presence in that theater during those years.
T-AOs
In FY 2003 we activated two T-AOs from ROS, one in each fleet, total-ling 15 FOS T-AOs. Activating a T-AO in LANTFLT enables meetingcombatant commander presence requirements in 2003 and 2006, butit results in a large excess of T-AO presence in WestLant in 2004 and2005. However, in 2003 and 2006 the WestLant (T)-AOE presencegreatly exceeds its requirement, by more than 1.00. The excess(T)-AOE presence could be used as a shuttle oiler to fulfill T-AOrequirements instead of the T-AO being activated from ROS.
27

In PACFLT, an additional T-AO is needed because of the FDNFCVBG substitute station ship requirement as well as shuttle oilerrequirements. We used this additional oiler alternatively in WestPacand EastPac. Even with that activation, T-AOs do not meet their East-Pac requirement in 2004 because one PACFLT T-AO must act as asubstitute station ship.
T-AEs
We activated two T-AEs in 2003, one in each fleet, leading to a totalof six FOS ammunition ships. In LANTFLT, a T-AE must be activatedbecause the one T-AE in that fleet is required as a substitute stationship in 2003 and 2006. If an additional T-AE had not been activated,the T-AE presence requirements in 2004 and 2005 would still bereached, but the presence in 2003 and 2006 would be practically zero.Instead of using it towards T-AO presence, the excess (T)-AOE pres-ence in these years could be used to offset any T-AE presence short-falls, allowing the T-AE to remain in ROS. The two FOS LANTFLTT-AEs are brought down to ROS after 2006.
In PACFLT, the activated T-AE is needed to fill in for the T-AEemployed continuously as the FDNF CVBG station ship. In 2004, thesole EastPac-based T-AE must serve as a substitute CVBG station ship.Because of this, the EastPac presence requirement is not attained thatyear. There is excess (T)-AOE presence during this year, however,and a (T)-AOE could be used as a shuttle T-AE so that the require-ment is met. But even with the (T)-AOE used as a shuttle ship, theROS T-AE needs to be activated.
T-AFSs
The six T-AFSs met all presence requirements. We followed fleetT-AFS deployment patterns: PACFLT sends a T-AFS with its CVBGswhen they deploy to CentCom, and LANTFLT T-AFSs deploy for4 months in CentCom.
Mid-term period (2007-2015)
As explained earlier, this is the transition period for the CLF whenthe AOE-1s, the T-AFSs and the T-AEs are retired as the T-AKEs aredelivered to the Navy. The first T-AKE will be operational in July 2006.
28

In the timelines, for each T-AKE brought into the fleet, at least oneship was retired in the same month. We followed the order of the shiptypes retiring from each fleet that is specified in N42’s SASDT submis-sion [19].
T-AOEs
The AOE-1s retire between 2006 to 2007, leaving a total of fourT-AOE-6s in FOS. The T-AOE-6s undergo their CIVMOD conversionsfrom 2011 to 2015, one at a time, so that there are only three FOST-AOEs in any of those years. Because of these events, more substitutestation ships are required to support CVBG deployments during thistransition period.
The T-AOEs only reach their Med requirement in 2013, and the West-Pac requirement is occasionally not met. Periodically, one fleet or theother does not meet the prescribed CentCom T-AOE presence, butthe sum of the two fleets’ presence each year meets or exceeds therequired presence of 1.00 in that theater. These presence valuesresult directly from the CVBG schedules.
T-AOs
When we retire the AOE-1s, a T-AO along with a T-AE or T-AKE mustact as a substitute station ship on a regular basis—at least every thirdCVBG deployment. This need increases when the T-AOE-6s undergotheir CIVMOD conversions to MSC—two or three T-AOs a year mustact as station ships.
From 2007 to 2011, the 15 FOS T-AOs continue to meet most pres-ence requirements. After the CIVMOD conversions are complete inLANTFLT, one T-AO can be placed in ROS in 2013, leaving sixLANTFLT FOS T-AOs. Then, there are a couple of years in which theWestLant requirement is not met, but the available presence is closeto the 2.33 requirement. In PACFLT, to compensate for the non-availability of T-AOE-6s in 2013 and 2014 during their CIVMOD con-versions, we activated the LANTFLT ROS T-AO in 2011 and trans-ferred it to PACFLT. Even with nine T-AOs in PACFLT, EastPacpresence requirements are not met in 2013 or 2014.
29

T-AFSs, T-AEs, and T-AKEs
The four AOE-1s are retired as the first four T-AKEs enter the fleet.Thereafter, T-AEs and T-AFSs retire as the remaining T-AKEs deliverto the fleet. All presence requirements are met in these years exceptin CentCom in 2015, when the PACFLT T-AKE presence is con-strained by the duration of CVBG deployments to that theater per thePACFLT scheduling policy.
As LANTFLT T-AKEs join the fleet, they can fulfill the ammunitionship presence requirements as well as meet substitute station shippresence requirements. Therefore, we were able to retire one LANT-FLT T-AE in 2006 and place the other two in ROS. The three T-AFSs,however, must remain in FOS until they are retired, except for thefinal year (2010) of the last T-AFS. After 2009, only five FOS T-AKEsare needed in LANTFLT to meet presence requirements, so weplaced one in ROS in 2010. Once the T-AOE CIVMOD conversionsare complete in 2012, LANTFLT requires only four T-AKEs in FOS;thus, we put another T-AKE in ROS in 2013.
In PACFLT, as the T-AKEs enter the fleet we are able to place oneT-AFS and one T-AE in ROS while still meeting presence require-ments. The rest of the T-AEs must remain in FOS until retired, withtwo of them staying active through 2014. All six PACFLT T-AKEs areneeded in FOS. Also, to meet presence requirements in 2012 we acti-vate a LANTFLT ROS T-AKE and transfer it to PACFLT. Five of theseseven T-AKEs are home-ported in WestPac.
Far-term period (2016-2020)
After the Alternative I transition is complete, most presence require-ments are met with a CLF composed of the following:
• In LANTFLT, two T-AOEs, six T-AOs, and four T-AKEs in FOS,and one T-AO and one T-AKE in ROS
• In PACFLT, two T-AOEs, nine T-AOs, and seven T-AKEs inFOS.
The main presence deficiency is with the WestLant T-AOs, which donot meet their 2.33 requirement about half of the time, and are short
30

by as much as 0.28 one year. We could have activated the ROS T-AOto eliminate the presence shortfall, but we chose not to do so becausethat would have generated a large amount of excess presence in West-Lant. On the other hand, the T-AO presence in EastPac alwaysexceeds the 2.00 requirement significantly. We chose not to put aT-AO in ROS in this case because it would have created presencevalues lower than the requirement by about 0.50 for some years.
It is important to emphasize that the CVBG schedules control muchof the CLF presence capabilities. If the LANTFLT CVBG schedulebecame more rigorous, e.g., requiring a 0.75 presence in the Medand a comparable T-AOE Med presence, the LANTFLT ROS T-AOand T-AKE could be activated to provide a greater substitute stationship capability. If PACFLT CVBG deployments were scheduled morefrequently, however, there would be no CLF ships in ROS to activate.Only the excess T-AO and T-AKE presence would be available to assistin meeting any additional station ship requirements.
CLF Alternative II
Table 7 shows the transition plan for Alternative II, showing forcelevels as of the first day of each Fiscal Year.
31

Near-term period
As previously explained, Alternative II timelines are identical to thoseof Alternative I because CLF ship types during the near-term periodare the same in both cases.
Mid-term period (2007-2015)
In Alternative II , nine T-AKEs are acquired, fol lowed byfour T-AOE(X)s. As each of these ships enters the fleet, we retire oneor two of the AOE-1s, T-AFSs, and T-AEs. As mentioned previously, weused the most recent SASDT submission to determine the order inwhich ship types will retire from each fleet [19].
Table 7. The numbers and status of each ship type for the timeline transitioning to 9 T-AKEs and 4 T-AOE(X)s (Alternative II)
Ship typeNear-term years Mid-term years Far-term years03 04 05 06 07 08 09 10 11 12 13 14 15 16 17 18 19 20
AOE-1 FOS 4 4 4 4 3 1 0 0 0 0 0 0 0 0 0 0 0 0AOE-6 FOS 2 1 0 0 0 0 0 0 0 0 0 0 0 0 0 0 0 0Under Conversion 1 1 1 0 0 0 0 0 1 1 1 1 1 0 0 0 0 0T-AOE(X) Deliv-ered
0 0 0 0 0 0 0 0 1 0 2 1 0 0 0 0 0 0
T-AOE FOS 1 2 3 4 4 4 4 4 3 4 5 6 6 7 6 6 6 6T-AOE ROS 0 0 0 0 0 0 0 0 0 0 0 1 1 1 2 2 2 2T-AO FOS 13 15 15 15 15 15 15 15 15 16 16 14 14 14 14 14 14 14T-AO ROS 3a 1 1 1 1 1 1 1 1 0 0 2 2 2 2 2 2 2T-AE FOS 4 6 6 6 4 4 4 3 3 3 3 0 0 0 0 0 0 0T-AE ROS 3 1 1 1 2 2 2 2 1 0 0 0 0 0 0 0 0 0T-AFS FOS 6 6 6 6 6 5 4 1 1 1 1 0 0 0 0 0 0 0T-AFS ROS 0 0 0 0 0 1 1 1 1 1 0 0 0 0 0 0 0 0T-AKE Delivered 0 0 0 1 2 2 2 1 1 0 0 0 0 0 0 0 0 0T-AKE FOS 0 0 0 0 1 3 5 8 9 9 9 9 9 9 9 9 9 9T-AKE ROS 0 0 0 0 0 0 0 0 0 0 0 0 0 0 0 0 0 0Total FOS 30 34 34 35 33 32 32 31 31 33 34 29 29 30 29 29 29 29Total Conversion 1 1 1 0 0 0 0 0 1 1 1 1 1 0 0 0 0 0Total ROS 6 2 2 2 3 4 4 4 3 1 0 3 3 3 4 4 4 4Total 37 37 37 37 36 36 36 35 35 35 35 33 33 33 33 33 33 33
a. Two of the T-AOs are in CAT B, not ROS.
32
T-AOEs
The AOE-1 class ships retire from 2006 through 2007, the AOE-6class ships undergo CIVMOD conversions from 2011 to 2015, and thefour T-AOE(X)s enter the fleet between the years of 2011 and 2014.We found that LANTFLT requires only three T-AOE type ships inorder to meet all (T)-AOE presence requirements for which LANT-FLT is responsible; hence, we placed the second T-AOE(X) in ROSalmost immediately. In PACFLT we retained the second T-AOE(X) inFOS a year longer to compensate for the T-AOE-6 CIVMOD conver-sions still taking place in that fleet. We then put it in ROS, leavingtwo T-AOE-6s and one T-AOE(X).
Between 2007 and 2015, the T-AOEs reach their Med requirementonly in 2013; the WestPac requirement is also occasionally not metduring that period. The combined T-AOE presence from both fleetsin CentCom meets the requirement there.
With the addition of the T-AOE(X)s, Alternative II becomes differentfrom Alternative I in two ways:
• Fewer substitute station ships are necessary.
• There is a greater WestLant and EastPac T-AOE presence.
These changes do not alter the presence deficiencies in the Med andWestPac.
T-AOs
The T-AOs follow the same schedule as in Alternative I until 2014,with one LANTFLT ROS T-AO activated in 2011 and then transferredto PACFLT. The other 15 T-AOs are all in FOS until 2014. Becausethe entering T-AOE(X)s alleviate some of the need for T-AOs as sub-stitute station ships, in 2014 we place one T-AO from each fleet inROS, leaving 14 in FOS (as compared to 15 retained in FOS in Alter-native I). The only year that the T-AO does not meet a presencerequirement is in 2008 in EastPac, when a T-AO must deploy as a sub-stitute station ship and all other EastPac T-AOs are undergoing main-tenance.
33

T-AKEs, T-AFSs, and T-AEs
The delivery of the first nine T-AKEs in Alternative II is identical tothat event in Alternative I, and the transitioning and retirement ofT-AEs and T-AFSs is almost the same in both Alternatives. All of thepresence requirements are met during the transition period until2013. The WestLant requirement is not met from 2013 to 2015 andthe EastPac requirement is not met in 2015.
In PACFLT, as the T-AKEs enter we place two T-AFSs and one T-AEin ROS. The rest must remain in FOS until retired. The final T-AEsretire in 2013 (compared to 2014 in Alternative I). Once the T-AOE-6CIVMOD conversions are complete in LANTFLT, one of itsfour T-AKEs is transferred to PACFLT. This T-AKE enters PACFLT in2012, which allows the presence requirements to continue to be met.
Far-term period (2016-2020)
As with Alternative I, once the transition is complete almost all pres-ence requirements are met with the following CLF force levels:
• In LANTFLT, three T-AOEs, six T-AOs, and three T-AKEs inFOS; one T-AOE and one T-AO in ROS
• In PACFLT, three T-AOEs, eight T-AOs, and six T-AKEs in FOS;one T-AOE and one T-AO in ROS.
WestLant T-AO presence exceeds requirements by 0.39 or more butnot enough to justify putting another LANTFLT T-AO in ROS. TheT-AKEs in PACFLT do not meet their EastPac presence requirementin 2016, and in LANTFLT do not quite reach the WestLant require-ment in most years. Given the number of CLF ships in EastPac (over4.5 on average) and in WestLant (almost 5), other types of CLF shipsmight be able to perform the required functions of T-AKEs whentheir presence is deficient in those theaters.
Two T-AOE(X)s are in ROS during these years. If in FOS, they couldbe employed to fulfill shuttle ship presence requirements. With theT-AOE(X)s in FOS, it might be possible to put a T-AO and/or aT-AKE in ROS. However, the fleets generally consider the AOE onlyfor station ship needs, so this practice may not be acceptable.
34

As previously mentioned, the CVBG schedule controls much of theCLF presence capabilities. But unlike in Alternative I, if the CVBGforward deployments increased such that the actual presenceequalled the T-AOE requirement in forward theaters, in AlternativeII both LANTFLT and PACFLT would have ROS T-AOEs that couldbe activated to meet these new requirements. Thus, there would beno need for additional substitute station ships.
Summary of results
Figures 2 and 3 show the total number of CLF ships each year forAlternatives I and II. Figure 2 shows the number of CLF ships for 2003through 2009 when the transition plans are the same for both Alter-natives. Figure 3 contains two columns for each year from 2010through 2020: the left column shows the numbers of CLF shipsrequired for Alternative I (12 T-AKEs) for each year, and the rightcolumn shows those required for Alternative II (9 T-AKEs and4 T-AOE(X)s).
Figure 2. Number of CLF ships from FY 2003 through 2009
048
1216202428323640
03 04 05 06 07 08 09
Year
Nu
mb
er o
f C
LF
Sh
ips
FOS Conversion ROS
35

The red bar in the first three columns in figure 2 represents an AOE-6undergoing hot transfer to the MSC. The figure shows that, to achievethe required peacetime presence with our timelines, we needed toincrease by four the number of CLF ships in FOS in 2003. Asexplained on page 25, the CLF transition period begins in 2007, withall T-AOE-6s under MSC operation and the first T-AKE entering thefleet, and two fewer ships (33 vice 35) required in FOS. The totalnumber of ships drops by one, from 37 to 36, when the first legacyshuttle ship, the ROS T-AE, is retired that year.
As figure 3 shows, the number of FOS ships fluctuates as the transi-tion period continues and the T-AOE-6 CIVMOD conversions (shownas red bars) occur. Alternative II requires more ships thanAlternative I in FOS until 2014 to meet presence requirements. In thefinal 4 years, when the CLF transition is complete, Alternative I hasone fewer ship than Alternative II, but Alternative I requires onemore ship in FOS.
Figure 4 shows how well the CLF ships meet their presence require-ments from 2011 to 2020. If the region is green, the presence require-ments are met—if light green, there is an excess presence of 0.50 or
Figure 3. Number of CLF ships from FY 2010 to 2020. Alternative I is on the left, and Alternative II is on the right
0
4
8
12
16
20
24
28
32
36
10 11 12 13 14 15 16 17 18 19 20Year
Nu
mb
er o
f C
LF
Sh
ips
FOS Conversion ROS
36
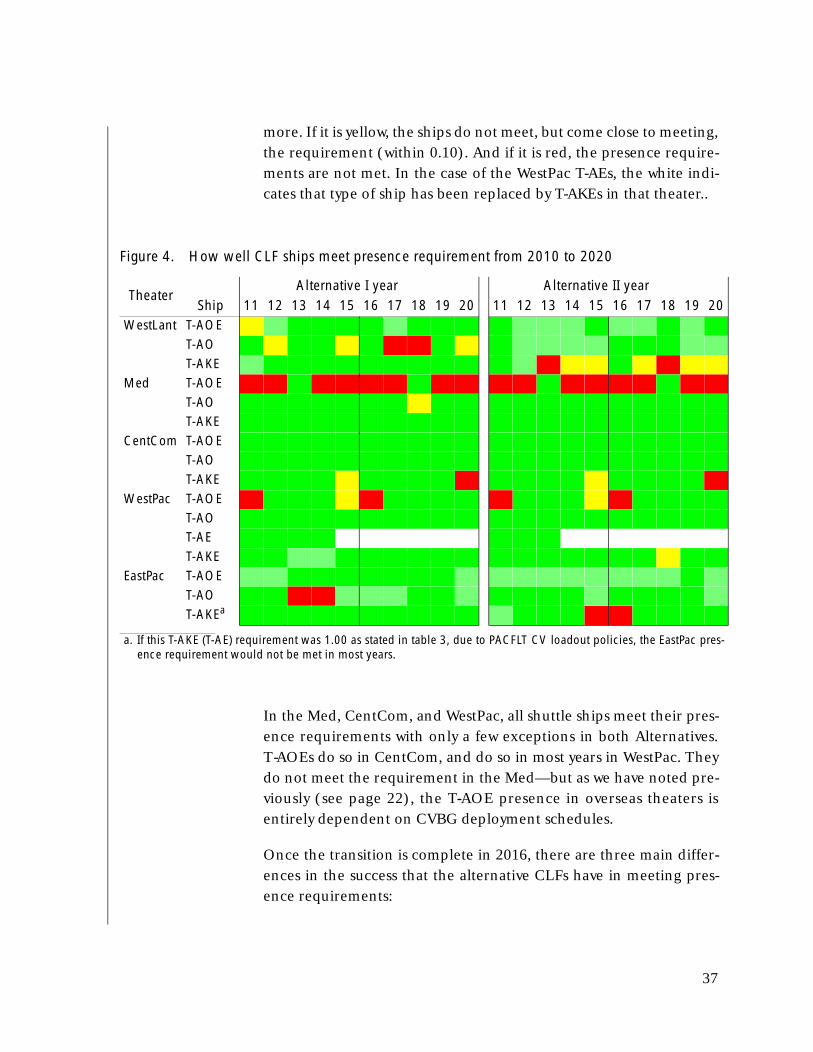
more. If it is yellow, the ships do not meet, but come close to meeting,the requirement (within 0.10). And if it is red, the presence require-ments are not met. In the case of the WestPac T-AEs, the white indi-cates that type of ship has been replaced by T-AKEs in that theater..
In the Med, CentCom, and WestPac, all shuttle ships meet their pres-ence requirements with only a few exceptions in both Alternatives.T-AOEs do so in CentCom, and do so in most years in WestPac. Theydo not meet the requirement in the Med—but as we have noted pre-viously (see page 22), the T-AOE presence in overseas theaters isentirely dependent on CVBG deployment schedules.
Once the transition is complete in 2016, there are three main differ-ences in the success that the alternative CLFs have in meeting pres-ence requirements:
Figure 4. How well CLF ships meet presence requirement from 2010 to 2020
TheaterAlternative I year Alternative II year
Ship 11 12 13 14 15 16 17 18 19 20 11 12 13 14 15 16 17 18 19 20WestLant T-AOE
T-AOT-AKE
Med T-AOET-AOT-AKE
CentCom T-AOET-AOT-AKE
WestPac T-AOET-AOT-AET-AKE
EastPac T-AOET-AOT-AKEa
a. If this T-AKE (T-AE) requirement was 1.00 as stated in table 3, due to PACFLT CV loadout policies, the EastPac pres-ence requirement would not be met in most years.
37

• In WestLant, in four out of the five final years, the T-AKEs meettheir presence requirement in Alternative I, but do not meetthe requirement in Alternative II.
• In WestLant, the T-AOs do not meet the presence require-ments in three of the last five years in Alternative I, while theydo (with some excess) in Alternative II.
• In EastPac, the T-AKEs meet all presence requirements inAlternative I, but do not meet the requirement in one of thelast 5 years in Alternative II.
Another difference between the two alternatives is in the numbersand the types of ships placed in ROS:
• One T-AKE and one T-AO in ROS in Alternative I
• Two T-AOE(X)s and two T-AOs in ROS in Alternative II.
In Alternative I there is a LANTFLT T-AO in ROS that could be acti-vated to ease or eliminate the oiler shortfall in WestLant. In Alterna-tive II there are no T-AKEs in ROS that could be activated to FOS toease the shortfalls in WestLant shown in figure 4. This would implythat Alternative I is preferable.
Alternative III
Another alternative (Alternative III) that may be worth consideringwould be to acquire 11 T-AKEs and two T-AOE(X)s. This, in effect,would change the two T-AOE(X)s that are in ROS in Alternative II toT-AKEs. This combination of alternatives is advantageous because:
• In Alternative I, the T-AOs must be employed frequently as sub-stitute station ships. With Alternative III, the two T-AOE(X)swould eliminate that employment of the T-AOs.
• In Alternative II, the T-AKE presence requirement is not met.With Alternative III, there are two T-AKEs in ROS that couldhelp meet the unsatisfied portion of the presence requirement.
38

Conclusions
We conclude by comparing the force structure requirements andcapabilities of the Alternatives.
In the near term,
• All Alternatives provide the same presence because in thoseyears the alternative CLFs are identical.
• All Alternatives require activating two T-AOs and two T-AEsfrom ROS to FOS to meet presence requirements. If (T)-AOEsin WestLant are used as shuttle ships when they generate excess(T)-AOE presence, it is not necessary to activate either a T-AOor a T-AE in FY 2003, and it may not be necessary to activateboth of those LANTFLT ships.
In the mid term,
• All Alternatives provide nearly identical presence in overseastheaters, and Alternative II is slightly better in fulfilling pres-ence in home waters than Alternative I.
• To meet presence requirements, Alternative II requires slightly(1-2) more ships than Alternative I in FOS until 2014, but Alter-native I retires the final two T-AEs a year later than AlternativeII.
In the far term,
• Alternative I contains 32 ships, with two in ROS. Alternatives IIand III have 33 ships, with four in ROS. All Alternatives fulfillnearly all presence requirements.
• The difference between Alternatives II and III is that in Alter-native II two T-AOE(X)s, versus two T-AKEs, are in ROS.
39

• Alternative I is the only Alternative that requires the use of shut-tle ships as substitute station ships.
• If CVBG deployments increase, all Alternatives contain ships inROS that can be activated to meet CVBG station ship needs—Alternative I has a substitute station ship in LANTFLT, Alterna-tive III has one in each fleet, and Alternative II has a T-AOE(X)in each fleet.
• If the four T-AOE(X)s in Alternative II are maintained in FOS,one additional shuttle ship from each fleet could probably beplaced in ROS.
40
Appendix
Appendix
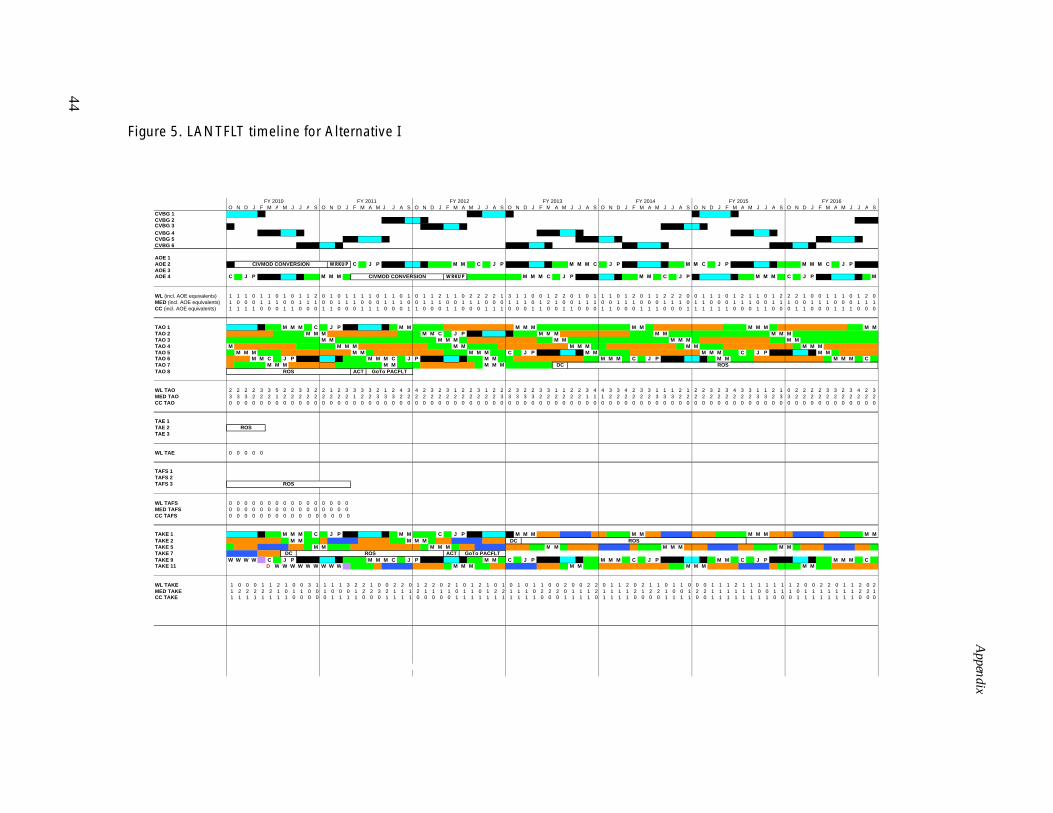
This appendix shows the timelines we investigated to assess CLF struc-ture requirements for Alternatives I and II. We split LANTFLT andPACFLT in the timelines. We created a CVBG schedule based on theGNFPP schedule specified to 2007 [5], and repeated it through 2020.
Within each fleet, we group ship types separately and denote the the-ater in which they are present each month by color, as shown in thetimeline. Besides having a color code, a ship can also be in mainte-nance, in training, or in ROS.
For each month, we sum the presence of each ship type in each the-ater. When forward deployments occur, we count the first and lastmonth of that deployment towards theaters as described on page 17and in table 5 to account for transit times. We average the ship types’presence for each year, shown at the end of the timelines. We alsonote the presence requirement and the average of the yearly aver-ages.
During the transition period when T-AKEs are entering the fleet andT-AEs and T-AFSs are retiring, we summed the theater contributionsfrom the different ship types as appropriate. For example, in EastPacthere is a 0.75 T-AE presence requirement and no T-AFS presencerequirement. When both T-AEs and T-AKEs are in EastPac, they aresummed and must meet a 0.75 presence (the T-AKEs are acting asT-AEs). In one theater, WestPac, there is both a T-AE and T-AFSrequirement. We found that the T-AEs were able to meet theirrequirement in WestPac without any contribution from the T-AKEs,so until the T-AEs were retired, the T-AKE presence was summed withthe T-AFS presence, and only needed to meet the T-AFS requirement(1.50). After the T-AEs retired, the T-AKE requirement was increasedto 2.80. If the yearly average presence for a ship is colored grey, thenwe summed it with another ship, shown below the T-AKE averages.
41

Appendix
The following table lists the abbreviations used in the timeline.
First we show the timelines for LANFLT and PACFLT forAlternative I—the case when there are 12 T-AKEs (figures 5 and 6).Then we show the timelines for Alternative II—the case when thereare nine T-AKEs and four T-AOE(X)s (figures 7 and 8).
Table 8. List of abbreviations
Abbreviation MeaningWL Western AtlanticCC Central CommandEP Eastern PacificWP Western PacificT TrainingS Post-deployment standdownM MaintenanceC CVBG COMPTUEXJ CVBG JTF exerciseP CVBG preparation for overseas movement periodD Delivery to MSCW Post-delivery workupDC Decommissioning/Inactivation periodACT Activation periodRQRD Presence requirement
42

43
Appendix
A S O N D J F M A M J J A S
M M M C J P
C J P M M
2 1 1 0 1 1 1 1 0 2 1 1 0 11 0 0 1 1 1 0 0 0 1 1 1 0 10 1 1 0 0 0 1 1 1 0 0 0 1 1
M M C J P M M
M M MM MM M
M M MM M
3 4 4 3 4 5 4 4 4 2 3 2 2 11 1 1 1 1 1 2 2 3 3 3 3 3 30 0 0 0 0 0 0 0 0 0 0 0 0 0
0 0 0 0 0 0 0 0 0 0 0 0 0 0
M M
0 0 1 1 1 1 1 0 1 0 0 1 0 02 2 0 0 0 0 1 1 0 0 0 0 0 00 0 1 1 1 1 0 0 0 0 0 0 0 0
M M C J P
M M MM M M
W W W W W W W
D W W W W W
1 0 0 0 1 1 1 1 2 1 3 2 0 11 2 2 2 2 1 0 0 0 1 0 0 1 20 0 0 0 0 1 1 1 1 0 0 0 0 0
FY 2009
DC
DC
Figure 5. LANTFLT timeline for Alternative I
FY 2005 FY 2006O N D J F M A M J J A S O N D J F M A M J J A S O N D J F M A M J J A S O N D J F M A M J J A S O N D J F M A M J J A S O N D J F M A M J J
CVBG 1 CVBG 2 CVBG 3
CVBG 4 CVBG 5 CVBG 6
AOE 1 M M M T T T T T T C M J P S M M M M T T T T T TAOE 2 M M C J P M M M M M C J P M M M C J P M M C J P AOE 3 T T T T T C M J P S M M M M T T T T T TAOE 4 C J P M M M M M C J P M M M C J P M M C J P M M M
WL (incl. AOE equivalents) 1 0 2 2 2 2 1 3 2 3 3 3 2 2 2 1 3 2 3 2 2 0 0 2 2 2 0 1 1 1 1 0 1 1 2 2 2 1 2 4 4 3 2 3 3 2 2 1 1 1 2 0 1 1 2 2 1 1 1 2 1 1 0 0 1 1 1 0 1 2MED (incl. AOE equivalents) 1 1 1 1 1 0 0 1 1 1 0 0 1 1 1 0 0 0 1 1 1 0 1 1 0 0 0 1 1 1 0 0 1 1 1 0 0 1 1 1 0 0 0 1 1 1 0 0 1 1 1 0 0 1 1 1 0 0 0 1 1 1 0 1 2 1 0 0 1 1CC (incl. AOE equivalents) 0 0 0 0 0 1 1 0 0 0 1 1 0 0 0 1 1 1 0 0 0 1 1 1 1 1 1 0 0 0 1 1 0 0 0 1 1 0 0 0 1 1 1 0 0 0 1 1 0 0 0 1 1 0 0 0 1 1 1 0 0 0 1 1 0 0 1 1 0 0
TAO 1 M M M M M M M M M M C J P M M M C J P TAO 2 M M M M M M M M M M M M MTAO 3 M M M M M M M M M M M MTAO 4 J P M M M M M M M M M M M MTAO 5 M M M M M M M M M MTAO 6 M M M M M M M M M MTAO 7 M M M M M C J P M M M M M
TAO 8
WL TAO 3 3 2 2 1 2 1 2 3 3 2 4 5 5 3 3 4 4 5 4 3 3 3 2 4 3 4 3 4 3 3 3 4 4 3 4 2 3 3 3 2 4 3 3 3 3 2 3 4 4 3 3 3 2 3 4 3 2 2 2 3 2 3 3 3 3 1 3 3 4MED TAO 2 1 2 2 2 2 2 3 3 3 3 2 1 1 2 2 2 2 2 2 3 3 3 3 2 2 2 2 2 3 3 2 2 2 2 2 2 2 2 2 2 1 2 2 2 3 3 3 3 2 2 2 2 2 2 1 2 2 3 3 3 3 3 3 2 3 3 2 2 1CC TAO 0 0 0 0 0 0 0 0 0 0 0 0 0 0 0 0 0 0 0 0 0 0 0 0 0 0 0 0 0 0 0 0 0 0 0 0 0 0 0 0 0 0 0 0 0 0 0 0 0 0 0 0 0 0 0 0 0 0 0 0 0 0 0 0 0 0 0 0 0 0
TAE 1 J P M M M M M M MTAE 2 M M M M M C J P TAE 3
WL TAE 0 0 0 0 1 1 1 1 2 1 1 2 2 2 1 1 1 2 2 2 2 2 2 2 1 1 1 2 2 1 1 2 2 2 1 2 1 1 1 0 0 1 1 1 0 0 0 0 0 0 0 0 0 0 0 0 0 0 0 0 0 0 0 0 0 0 0 0 0 0
TAFS 1 M M M M M M M M M M M MTAFS 2 M M M M M M M M M MTAFS 3 M M M M M M M M M M M M M
WL TAFS 0 0 1 2 1 0 0 2 0 0 1 0 0 0 1 0 0 1 2 0 1 2 1 0 0 0 1 0 1 1 0 1 2 2 0 0 1 2 1 0 1 1 0 1 1 0 0 0 2 1 0 2 2 0 0 0 1 0 0 1 0 0 2 1 0 0 0 1 1 0MED TAFS 2 2 1 0 0 1 1 0 1 1 2 3 2 2 1 1 2 1 1 1 0 0 1 1 1 1 1 1 1 1 1 0 1 1 2 2 0 0 0 1 1 1 1 1 2 2 2 2 1 1 1 0 0 1 1 1 1 2 2 2 1 1 0 1 1 1 0 0 1 2CC TAFS 0 0 1 1 1 1 1 1 1 1 0 0 1 1 1 1 0 0 0 0 1 1 1 1 1 1 1 1 1 1 1 1 0 0 0 0 1 1 1 1 1 1 1 1 0 0 0 0 0 0 0 1 1 1 1 1 1 1 1 0 1 1 1 1 1 1 1 1 0 0
TAKE 1 D W W W W W W W W W W W W W C J P M M M C J P
TAKE 2 D W W W W W W W W W M MTAKE 5 D W W W W W W W W W TAKE 7 D W W
TAKE 9TAKE 11
WL TAKE 0 0 0 0 0 0 ## 0 0 0 0 0 0 0 1 1 1 2 2 1 2 1 1 1 1 1 1 1 1 2 1 0 0 1 2 2 2 2 1MED TAKE 0 0 0 0 0 0 ## 0 0 0 0 0 0 0 0 0 0 0 0 0 0 0 0 0 0 0 0 0 0 0 0 0 0 0 0 0 0 0 1CC TAKE 0 0 0 0 0 0 ## 0 0 0 0 0 0 0 0 0 0 0 0 0 0 0 0 0 0 0 0 0 0 0 0 0 0 0 0 0 0 0 0
= CVBG and STATION SHIP MEDITERRANEAN = SHUTTLE SHIP MEDITERRANEAN
= WESTLANT & CARIBBEAN = T-AKE READY TO DEPLOY DATE= SHUTTLE SHIP CENTCOM
= CVBG and STATION SHIP CENTCOM
HT
ROS
ROS ACT
FY 2003 FY 2004
DC
DC
FY 2007 FY 2008
DC
ROS
DC
ROSROSROS
DC
ACT
44
Appendix
D J F M A M J J A S O N D J F M A M J J A S
J P M M M C J P
M M M C J P M
1 1 0 1 2 1 1 0 1 2 2 2 1 0 0 1 1 1 0 1 2 00 0 0 1 1 1 0 0 1 1 1 0 0 1 1 1 0 0 0 1 1 11 1 1 0 0 0 1 1 0 0 0 1 1 0 0 0 1 1 1 0 0 0
M M M M MM M M
M MM M M
M M C J P M MM M M M M C
3 2 3 4 3 3 1 1 2 1 0 2 2 2 2 3 3 2 3 4 2 32 2 2 2 2 2 3 3 2 3 3 2 2 2 2 2 2 2 2 2 2 20 0 0 0 0 0 0 0 0 0 0 0 0 0 0 0 0 0 0 0 0 0
M M M M M
M M
M M C J P M M M CM M
1 1 1 2 1 1 1 1 1 1 1 2 0 0 2 2 0 1 1 2 0 21 1 1 1 1 1 0 0 1 1 1 0 1 1 1 1 1 1 1 2 2 11 1 1 1 1 1 1 1 0 0 0 1 1 1 1 1 1 1 1 0 0 0
ROS
FY 2016FY 2015
Figure 5. LANTFLT timeline for Alternative I
CVBG 1CVBG 2CVBG 3
CVBG 4 CVBG 5 CVBG 6
AOE 1 AOE 2AOE 3 AOE 4
WL (incl. AOE equivalents)MED (incl. AOE equivalents)CC (incl. AOE equivalents)
TAO 1TAO 2TAO 3TAO 4TAO 5TAO 6TAO 7
TAO 8
WL TAOMED TAOCC TAO
TAE 1TAE 2TAE 3
WL TAE
TAFS 1TAFS 2TAFS 3
WL TAFSMED TAFSCC TAFS
TAKE 1
TAKE 2TAKE 5TAKE 7
TAKE 9TAKE 11
WL TAKEMED TAKECC TAKE
FY 2010 FY 2011O N D J F M A M J J A S O N D J F M A M J J A S O N D J F M A M J J A S O N D J F M A M J J A S O N D J F M A M J J A S O N
C J P M M C J P M M M C J P M M C
C J P M M M M M M C J P M M C J P
1 1 1 0 1 1 0 1 0 1 1 2 0 1 0 1 1 1 1 0 1 1 0 1 0 1 1 2 1 1 0 2 2 2 2 1 3 1 1 0 0 1 2 2 0 1 0 1 1 1 0 1 2 0 1 1 2 2 2 0 0 11 0 0 0 1 1 1 0 0 1 1 1 0 0 1 1 1 0 0 0 1 1 1 0 0 1 1 1 0 0 1 1 1 0 0 0 1 1 1 0 1 2 1 0 0 1 1 1 0 0 1 1 1 0 0 0 1 1 1 0 1 11 1 1 1 0 0 0 1 1 0 0 0 1 1 0 0 0 1 1 1 0 0 0 1 1 0 0 0 1 1 0 0 0 1 1 1 0 0 0 1 1 0 0 1 1 0 0 0 1 1 0 0 0 1 1 1 0 0 0 1 1 1
M M M C J P M M M M M M MM M M M M C J P M M M M M
M M M M M M M M M MM M M M M M M M M M M
M M M M M M M M C J P M M MM M C J P M M M C J P M M M M M C J P
M M M M M M M M
2 2 2 2 3 3 5 2 2 3 3 2 2 1 2 3 3 3 3 2 1 2 4 3 4 2 3 2 3 1 2 2 3 1 2 2 2 3 2 2 3 3 1 1 2 2 3 4 4 3 3 4 2 3 3 1 1 1 2 1 2 23 3 3 2 2 2 1 2 2 2 2 2 2 2 2 2 1 2 2 3 3 3 2 2 2 2 2 2 2 2 2 2 2 2 2 3 3 3 3 3 2 2 2 2 2 2 1 1 1 2 2 2 2 2 2 3 3 3 2 2 2 20 0 0 0 0 0 0 0 0 0 0 0 0 0 0 0 0 0 0 0 0 0 0 0 0 0 0 0 0 0 0 0 0 0 0 0 0 0 0 0 0 0 0 0 0 0 0 0 0 0 0 0 0 0 0 0 0 0 0 0 0 0
0 0 0 0 0
0 0 0 0 0 0 0 0 0 0 0 0 0 0 0 00 0 0 0 0 0 0 0 0 0 0 0 0 0 0 00 0 0 0 0 0 0 0 0 0 0 0 0 0 0 0
M M M C J P M M C J P M M M M M
M M M M MM M M M M M M M M M
W W W W C J P M M M C J P M M C J P M M M C J P D W W W W W W W W W M M M M M M M M
1 0 0 0 1 1 2 1 0 0 3 1 1 1 1 3 2 2 1 0 0 2 2 0 1 2 2 0 2 1 0 1 2 1 0 1 0 1 0 1 1 0 0 2 0 0 2 2 0 1 1 2 0 2 1 1 0 1 1 0 0 01 2 2 2 2 2 1 0 1 1 0 0 1 0 0 0 1 2 2 3 2 1 1 1 2 1 1 1 1 0 1 1 0 1 2 2 1 1 1 0 2 2 2 0 1 1 1 2 1 1 1 1 2 1 2 2 1 0 0 1 2 21 1 1 1 1 1 1 1 0 0 0 0 0 1 1 1 1 0 0 0 1 1 1 1 0 0 0 0 0 1 1 1 1 1 1 1 1 1 1 1 0 0 0 1 1 1 1 0 1 1 1 1 0 0 0 0 1 1 1 1 0 0
FY 2012
ACTROS
FY 2014
GoTo PACFLT
DC
ACTROSDC
FY 2013
DC
GoTo PACFLT
CIVMOD CONVERSION WRKUP
CIVMOD CONVERSION WRKUP
ROS
ROS
ROS

45
Appendix
RD) presence. the forward deployed CVBG.
ce
2011 2012 2013 2014 2015 2016 2017 2018 2019 2020
0.68 1.27 0.98 1.10 0.90 0.93 1.27 0.82 1.10 0.820.48 0.48 0.85 0.48 0.60 0.57 0.48 0.77 0.57 0.520.50 0.50 0.33 0.50 0.58 0.42 0.50 0.42 0.42 0.67
ce2011 2012 2013 2014 2015 2016 2017 2018 2019 2020
2.47 2.31 2.38 2.37 2.31 2.37 2.14 2.05 2.46 2.302.05 2.02 2.05 2.00 2.02 2.00 2.02 1.97 2.00 2.050.00 0.00 0.00 0.00 0.00 0.00 0.00 0.00 0.00 0.00
ce
2011 2012 2013 2014 2015 2016 2017 2018 2019 2020
ce
2011 2012 2013 2014 2015 2016 2017 2018 2019 2020
ce
2011 2012 2013 2014 2015 2016 2017 2018 2019 2020
1.28 1.13 0.78 0.88 0.96 1.12 0.88 0.88 0.97 0.961.07 1.00 1.07 1.00 1.03 1.07 1.03 1.00 1.00 1.030.53 0.53 0.53 0.53 0.53 0.53 0.53 0.53 0.53 0.531.28 1.13 0.78 0.88 0.96 1.12 0.88 0.88 0.97 0.961.07 1.00 1.07 1.00 1.03 1.07 1.03 1.00 1.00 1.030.53 0.53 0.53 0.53 0.53 0.53 0.53 0.53 0.53 0.53
4.43 4.71 4.15 4.36 4.17 4.42 4.28 3.75 4.52 4.07
Figure 5. LANTFLT timeline for Alternative I
CVBG 1CVBG 2CVBG 3
CVBG 4 CVBG 5 CVBG 6
AOE 1 AOE 2AOE 3 AOE 4
WL (incl. AOE equivalents)MED (incl. AOE equivalents)CC (incl. AOE equivalents)
TAO 1TAO 2TAO 3TAO 4TAO 5TAO 6TAO 7
TAO 8
WL TAOMED TAOCC TAO
TAE 1TAE 2TAE 3
WL TAE
TAFS 1TAFS 2TAFS 3
WL TAFSMED TAFSCC TAFS
TAKE 1
TAKE 2TAKE 5TAKE 7
TAKE 9TAKE 11
WL TAKEMED TAKECC TAKE
O N D J F M A M J J A S O N D J F M A M J J A S O N D J F M A M J J A S O N D J F M A M J J A S
Note: Where shown in red below, presence is less than the required (RQNote: At all times, an AOE (or substitute station ship) is in company with
M M C J P M M M C J P M M C J P
M C J P M M M C J P M M C J P M M M Average annual presen
RQRD AVE 2003 2004 2005 2006 2007 2008 2009 2010
1 1 2 2 2 1 1 1 1 1 1 1 0 2 0 1 0 1 1 2 1 0 1 1 1 1 1 0 1 1 0 2 1 2 2 1 0 1 1 1 1 0 1 2 0 1 0 2 0.75 1.17 1.93 1.82 1.10 2.43 1.23 0.93 0.87 0.790 0 1 1 1 0 0 1 1 1 0 0 0 1 1 1 0 1 2 1 0 0 1 1 1 0 0 1 1 1 0 0 0 1 1 1 0 1 1 0 0 0 1 1 1 0 0 1 0.75 0.59 0.73 0.60 0.57 0.48 0.60 0.73 0.54 0.621 1 0 0 0 1 1 0 0 0 1 1 1 0 0 0 1 1 0 0 1 1 0 0 0 1 1 0 0 0 1 1 1 0 0 0 1 1 1 1 1 1 0 0 0 1 1 0 0.50 0.48 0.33 0.50 0.50 0.50 0.42 0.42 0.50 0.50
M M M M M M M MM M M M M M M M M
M M M M M M M MM M M M M M M
M M M M M M M MJ P M M C J P M M M C J P M M C J P
Average annual presenRQRD AVE 2003 2004 2005 2006 2007 2008 2009 2010
3 1 2 2 3 2 2 2 2 1 2 3 3 1 2 2 1 2 1 3 3 2 1 3 4 3 3 4 2 1 4 2 2 1 2 1 2 2 2 2 2 3 4 2 3 1 2 2 2.33 2.64 2.39 3.72 3.55 2.89 2.97 2.96 3.22 2.642 2 2 2 1 1 2 2 3 3 3 3 3 3 3 2 2 2 2 1 1 2 2 2 1 2 2 2 3 3 2 2 2 2 2 2 2 2 2 2 3 3 2 2 2 2 2 2 2.00 2.03 2.10 2.02 2.05 2.02 2.02 2.08 2.05 2.020 0 0 0 0 0 0 0 0 0 0 0 0 0 0 0 0 0 0 0 0 0 0 0 0 0 0 0 0 0 0 0 0 0 0 0 0 0 0 0 0 0 0 0 0 0 0 0 0.00 0.00 0.00 0.00 0.00 0.00 0.00 0.00 0.00 0.00
Average annual presen
RQRD AVE 2003 2004 2005 2006 2007 2008 2009 2010
0.75 0.83 1.75 1.50 0.50 0.00 0.00
Average annual presen
RQRD AVE 2003 2004 2005 2006 2007 2008 2009 2010
0.00 0.57 0.63 0.71 0.71 0.70 0.79 0.46 0.59 0.001.00 1.03 1.03 1.03 1.07 1.03 0.87 0.15 0.000.50 0.53 0.53 0.53 0.53 0.53 0.53 0.27 0.00
M M M M M M M M
M M M M M M M M M
J P M M C J P M M M C J P M M C J P M M M M M M M M Average annual presen
RQRD AVE 2003 2004 2005 2006 2007 2008 2009 2010
2 2 0 1 1 0 0 0 2 0 0 2 2 0 2 1 1 0 1 1 0 0 1 1 1 1 1 2 1 0 2 0 1 1 1 0 0 0 1 0 1 2 2 0 2 1 2 0 0.75 0.25 1.25 1.18 1.12 0.871 1 1 0 0 1 1 2 1 2 2 1 1 1 0 0 2 2 1 2 1 1 1 1 2 2 1 1 1 1 2 2 0 0 0 1 2 1 1 1 1 2 1 1 0 0 1 1 1.00 0.00 0.00 0.27 0.88 1.140 0 0 1 1 1 1 0 1 1 1 1 1 1 1 1 0 0 0 0 1 1 1 1 0 0 1 1 1 1 0 0 1 1 1 1 0 1 1 1 1 0 1 1 1 1 0 0 0.50 0.00 0.00 0.00 0.27 0.53
WL TAKE+TAE 0.75 1.06 0.83 1.75 1.50 0.75 1.25 1.18 1.12 0.87MED TAKE+TAFS 1.00 1.04 1.03 1.03 1.03 1.07 1.03 1.13 1.03 1.14
CC TAKE+TAFS 0.50 0.53 0.53 0.53 0.53 0.53 0.53 0.53 0.53 0.53
WL CLF TOTAL 5.12 5.78 8.00 6.86 6.77 6.25 5.53 5.80 4.30
FY 2020
ROS
ROS ROS
FY 2019FY 2017 FY 2018

46
Appendix
Figure 6. PACFLT timeline for Alternative I
M J J A S O N D J F M A M J J A S O N D J F M A M J J A S
M M M C J P M M C J P S MJ P M M C J P M M M C
1 0 1 1 1 1 0 1 1 0 2 1 2 2 2 1 0 2 1 1 1 0 1 0 0 0 1 1 20 1 2 1 0 0 0 2 1 0 0 1 2 0 0 0 1 2 0 0 0 1 2 1 0 0 0 1 01 0 0 0 1 1 1 0 0 1 1 0 0 1 1 1 0 0 1 1 1 0 0 0 1 1 1 0 01 1 1 1 1 1 1 1 1 1 1 1 1 1 1 1 1 1 1 1 1 1 1 1 1 1 1 1 1
M M M M M
M M M M MM M M M M
M M M M MM M M M
M M M M MM M M C J P M M
3 3 3 2 2 2 3 2 1 2 1 1 0 0 1 2 2 2 1 2 3 3 2 2 3 3 2 1 12 2 2 3 2 2 3 2 3 2 2 2 1 1 2 2 2 1 1 2 2 3 2 2 2 2 1 2 32 2 1 1 1 1 1 0 0 0 0 1 1 2 2 2 2 1 2 2 1 1 1 1 1 0 0 0 1
M M M C J P
M M M M MM M M M M
1 1 1 1 0 0 0 1 0 1 0 0 0 0 0 0 0 0 0 0 0 0 0 0 0 0 0 0 02 2 1 1 2 2 2 2 2 1 1 1 2 2 2 2 2 1 1 1 2 2 2 2 1 1 2 2 2
M MM M M
1 2 2 2 1 1 0 1 2 1 1 2 1 0 0 1 2 1 0 0 0 1 1 1 0 0 0 0 0
1 0 0 0 1 1 1 0 0 1 1 0 0 1 1 1 0 0 1 1 1 0 0 0 1 1 1 0 0
M M
W W W W W M M MD W W W W W W W W W
D W W W W W W W W WD
1 1 1 1 1 2 2 2 1 1 1 1 1 1 0 0 1 2 2 1 1 1 1 1 1 1 1 1 10 0 0 0 0 0 0 0 0 1 1 1 1 1 1 1 0 0 1 1 1 1 1 2 2 2 2 2 30 0 0 0 0 0 0 0 0 0 0 0 0 0 0 0 0 0 0 0 0 0 0 0 0 0 0 0 0
ADY TO DEPLOY DATE
TION SHIP WESTPAC
R
DCDC
DC
ROS
DC
FY 2009FY 2008
FY 2005 FY 2006O N D J F M A M J J A S O N D J F M A M J J A S O N D J F M A M J J A S O N D J F M A M J J A S O N D J F M ACVBG 7 CVBG 8 CVBG 9 CVBG 10 CVBG 11 FDNF CVBG
AOE 5 T T C M J P S M M M M T T T T T T C M J P SAOE 6 M T T T T T T C M J P S M M M M M M M C J P M MAOE 7 S M M M M T T T T T T C M J P S M M M M T T T T T T C M J P AOE 8 P S M M M M M C J P M M M M M C
EP (incl. AOE equivalents) 0 0 1 0 1 0 1 1 0 1 0 1 1 0 1 1 3 2 2 2 2 2 0 2 1 2 2 2 3 2 1 1 2 2 2 1 2 1 1 2 2 2 4 3 3 2 3 3 2 1 2 2 2 2 2WP (incl. AOE equivalents) 0 1 1 1 0 1 2 0 0 0 1 2 0 0 0 1 2 1 0 0 0 1 0 0 0 1 1 0 0 0 1 1 0 0 0 1 2 1 0 0 0 1 0 0 0 0 1 1 0 0 0 1 1 0 0CC (incl. AOE equivalents) 1 1 1 1 1 0 0 1 1 1 0 0 1 1 1 0 0 0 1 1 1 0 0 0 0 0 0 1 1 1 0 0 1 1 1 0 0 0 1 1 1 0 0 1 1 1 0 0 1 1 1 0 0 1 1
1 1 1 1 1 1 1 1 1 1 1 1 1 1 1 1 1 1 1 1 1 1 1 1 1 1 1 1 1 1 1 1 1 1 1 1 1 1 1 1 1 1 1 0 0 0 1 1 1 1 1 1 1 1 1
TAO 9 M M M C J P M M M M M M MTAO 10 J P
TAO 11 M M M M M M M M M MTAO 12 M M M M M M M M M MTAO 13 M M M M M M M M M MTAO 14 M M M M M M M M M MTAO 15 M M M M M M M M M MTAO 16 M M M M M M M
TAO 8
EP TAO 1 1 1 2 2 3 3 2 1 2 3 3 2 2 1 1 2 1 1 2 2 2 1 1 3 4 3 3 2 2 2 3 2 1 1 3 3 1 1 2 3 3 4 3 3 3 3 2 2 3 3 3 1 1 2WP TAO 3 3 1 2 1 1 1 1 1 3 3 3 2 2 3 2 3 2 2 1 1 1 2 2 2 2 1 2 3 2 2 3 2 2 1 2 2 2 2 3 2 1 1 2 2 2 3 2 2 2 1 0 2 3 2CC TAO 2 2 1 1 1 0 1 1 1 1 1 1 1 1 1 1 1 1 1 1 1 1 1 1 1 1 1 1 1 1 1 1 1 1 1 0 0 1 1 1 1 2 1 1 1 1 1 1 0 0 1 1 1 1 1
TAE 4 M M M C J P M M M M M M MTAE 5 C J PTAE 6 M M M M M M M M M MTAE 7 M M M M M M M M
EP TAE 1 1 1 1 1 1 1 0 0 0 1 1 0 1 0 0 0 0 0 0 0 0 0 0 1 1 1 1 1 0 0 0 1 1 1 1 1 1 1 1 1 1 1 1 0 0 1 1 1 1 1 1 1 1 1WP TAE 1 1 1 1 1 1 1 2 2 2 2 2 1 1 1 2 2 2 2 1 1 2 2 2 2 2 2 1 1 2 2 2 2 2 1 1 1 2 2 2 2 2 1 1 1 2 2 2 2 1 1 2 2 2 2
TAFS 4 M M M M M M M M M MTAFS 5 M M M M M M M M M MTAFS 6 M M M M M M M M M
WP TAFS 1 1 1 2 2 3 3 1 1 1 3 3 2 2 1 2 1 2 1 2 2 3 2 2 3 3 3 2 2 1 2 2 1 2 2 3 3 1 1 1 3 3 3 2 1 1 1 2 1 2 2 3 2 0 1
CC TAFS 1 1 1 1 1 0 0 1 1 1 0 0 1 1 1 0 0 0 1 1 1 0 0 0 0 0 0 1 1 1 0 0 1 1 1 0 0 1 1 1 0 0 0 1 1 1 0 0 1 1 1 0 0 1 1
TAKE 3 D W W W W W W W W W
TAKE 4 D W W W WTAKE 6TAKE 8TAKE 10TAKE 12
TAKE 7
EP TAKE 0 0 0 0 0 0 0 0 0 0 1 1WP TAKE 0 0 0 0 0 0 0 0 0 0 0 0CC TAKE 0 0 0 0 0 0 0 0 0 0 0 0
= CVBG and STATION SHIP WESTPAC = SHUTTLE SHIP WESTPAC
= T-AKE RE = CVBG and STATION SHIP CENTCOM = SHUTTLE SHIP CENTCOM
= FDNF STA= FDNF CVBG and STATION SHIP CENTCOM = EASTPAC/MIDPAC
Hot Transfer
ACT
ACT
DC
FY 2003 FY 2004 FY 2007
Hot transferDC

47
Appendix
D J F M A M J J A S O N D J F M A M J J A S
M M C J P M
P M M M M M C J P
1 1 1 2 1 2 0 1 1 1 1 1 2 1 1 1 0 0 2 2 2 00 1 1 0 0 0 1 1 0 0 0 1 2 0 0 0 1 1 0 0 0 00 0 0 1 1 1 0 0 1 1 1 0 0 1 1 1 0 0 0 1 1 11 1 1 1 1 1 1 1 1 1 1 1 1 1 1 1 1 1 1 0 0 0
M M MC J P
M M M MM M
M M MM M
M M M M MM M M C J P M M
M M M M M
3 3 3 2 3 1 2 2 3 4 4 2 2 4 4 3 3 4 3 3 3 32 3 2 2 2 3 2 2 0 1 1 1 1 2 2 2 2 2 3 3 3 21 1 1 2 1 1 1 1 1 0 0 1 1 1 1 1 2 1 1 1 1 1
M C J P M M
M M M M MM M M M M
C J PM M M
M M M M M
M M M
1 2 2 1 2 1 1 1 0 0 0 1 1 1 1 2 1 1 1 1 1 13 3 2 1 1 3 4 4 3 2 2 3 4 3 3 2 3 4 3 3 3 40 0 0 1 1 1 0 0 1 1 1 0 0 1 1 1 0 0 0 1 1 1
FY 2016FY 2015
Figure 6. PACFLT timeline for Alternative I
CVBG 7CVBG 8CVBG 9 CVBG 10CVBG 11 FDNF CVBG
AOE 5AOE 6 AOE 7 AOE 8
EP (incl. AOE equivalents)WP (incl. AOE equivalents)CC (incl. AOE equivalents)
TAO 9TAO 10
TAO 11TAO 12TAO 13TAO 14TAO 15TAO 16
TAO 8
EP TAOWP TAOCC TAO
TAE 4TAE 5TAE 6TAE 7
EP TAEWP TAE
TAFS 4TAFS 5TAFS 6
WP TAFS
CC TAFS
TAKE 3
TAKE 4TAKE 6TAKE 8TAKE 10TAKE 12
TAKE 7
EP TAKEWP TAKECC TAKE
FY 2010 FY 2011O N D J F M A M J J A S O N D J F M A M J J A S O N D J F M A M J J A S O N D J F M A M J J A S O N D J F M A M J J A S O N
M M M C J P M M C J P M M M C J P
J P M M M M M M M C J
2 0 0 0 1 1 1 0 1 1 0 2 1 2 2 2 1 1 2 2 2 2 0 0 0 2 1 2 1 2 3 0 1 0 2 1 1 1 0 1 1 0 1 0 1 2 1 2 1 2 2 1 2 1 2 0 0 1 1 1 1 20 0 1 1 0 0 0 1 1 0 0 0 1 2 0 0 0 1 1 0 0 0 0 1 1 0 0 0 1 1 0 0 0 1 2 1 0 0 0 2 1 0 0 1 2 0 0 0 1 2 0 0 0 1 2 1 0 0 0 1 0 00 0 0 0 1 1 1 0 0 1 1 1 0 0 1 1 1 0 0 0 1 1 1 0 0 1 1 1 0 0 1 1 1 0 0 0 1 1 1 0 0 1 1 0 0 1 1 1 0 0 1 1 1 0 0 0 1 1 1 0 0 01 1 1 1 1 1 1 1 1 1 1 1 1 1 1 1 1 1 1 1 0 0 0 1 1 1 1 1 1 1 1 1 1 1 1 1 1 1 1 1 1 1 1 1 1 1 1 1 1 1 1 1 1 1 1 1 1 1 1 1 1 1
M M M M M C J P M M M M MC J P
M M M M M M M M M MM M M M M M M M M M
M M M M M M M M M MM M M M M M M M C J P M M M
M M M M M C J P M M M M MM M M C J P M M M M M M M C J P
M M M C J P M M
2 3 3 3 2 2 2 3 2 1 2 2 2 1 0 1 1 2 3 3 3 3 3 2 2 2 3 2 1 1 1 3 2 2 2 3 2 2 2 2 2 3 2 1 1 1 3 1 2 2 1 2 2 1 1 2 2 3 1 1 3 43 3 2 2 2 2 2 3 2 2 0 1 2 2 2 3 3 1 1 1 2 2 3 2 2 2 3 1 2 3 3 1 1 1 2 2 2 3 2 2 2 2 2 2 1 2 2 1 1 1 2 2 2 2 2 2 2 2 2 3 3 21 1 1 1 1 2 1 1 1 1 1 0 0 1 1 1 1 1 2 1 1 1 1 1 1 0 1 1 1 1 1 1 2 1 1 1 1 1 1 0 0 0 1 1 1 2 2 2 2 1 1 2 1 1 1 1 0 0 0 1 1 1
M M M M M M M M M MM M M M M M M M M M
0 0 0 0 0 0 0 0 0 0 0 0 0 0 0 0 0 0 0 0 0 0 0 0 0 0 0 0 0 0 0 0 0 0 0 0 0 0 0 0 0 0 0 0 0 0 0 0 0 0 0 0 0 0 0 0 0 0 0 02 2 2 1 1 2 2 2 2 2 1 1 1 2 2 2 2 2 1 1 1 2 2 2 2 1 1 2 2 2 2 2 2 1 1 2 2 2 2 2 1 1 1 2 2 2 2 1 1 1 2 2 2 2 2 1 1 2 0 0
0 0 0 0 0 0 0 0 0 0 0 0 0 0 0 0 0 0 0 0 0
0 0 0 0 0 0 0 0 0 0 0 0 0 0 0 0 0 0 0 0 0
M M M M M M M M M M C J P M M
M M C J P M M M C J P M M C J P M M MM M M M M M M M M M
C J PW W W W W W W W W M M M M M C J P M M M C J P M M
D W W W W W W W W W M M M M M
M M M M M
0 0 1 2 2 1 0 1 1 1 1 0 0 1 1 0 0 1 1 2 1 1 0 1 2 0 1 1 1 1 0 1 0 1 1 1 1 1 1 1 0 1 0 1 2 0 1 1 1 1 0 1 0 1 1 1 0 1 1 1 1 13 2 1 1 0 1 1 3 3 1 1 1 2 2 0 0 1 1 1 2 1 2 2 3 3 2 2 2 3 2 1 1 0 1 0 1 1 2 3 4 4 2 2 2 3 2 2 1 2 2 1 2 2 3 3 3 1 2 3 4 4 40 0 0 0 1 1 1 0 0 1 1 1 0 0 1 1 1 0 0 0 1 1 1 0 0 1 1 1 0 0 1 1 1 0 0 0 1 1 1 0 0 1 1 0 0 1 1 1 0 0 1 1 1 0 0 0 1 1 1 0 0 0
from LANTFLT
DC
DCDC
ROS
from LANTFLT
ROS
CIVMOD CONVERSION WRKUP
FY 2014
WRKUPCIVMOD CONVERSION
FY 2013FY 2012

48
Appendix
Figure 6. PACFLT timeline for Alternative I
n the required (RQRD) presence. in company with the forward deployed CVBG.
e annual presence
2009 2010 2011 2012 2013 2014 2015 2016 2017 2018 2019 2020
0.77 0.81 1.42 1.25 0.83 1.10 1.23 1.06 0.77 1.08 1.00 1.500.48 0.27 0.42 0.50 0.42 0.56 0.27 0.35 0.48 0.50 0.50 0.330.50 0.50 0.50 0.50 0.67 0.50 0.42 0.58 0.50 0.58 0.58 0.331.00 1.00 0.75 1.00 1.00 1.00 1.00 0.75 1.00 1.00 1.00 1.00
1.48 1.27 1.17 1.50 1.42 1.56 1.27 1.10 1.48 1.50 1.50 1.33
e annual presence
2009 2010 2011 2012 2013 2014 2015 2016 2017 2018 2019 2020
2.12 2.28 2.02 2.02 1.87 1.69 2.77 3.17 2.94 2.45 2.44 2.522.02 2.09 2.06 2.00 2.01 2.01 2.07 2.04 2.01 2.01 2.08 2.071.00 1.05 1.05 1.07 1.05 1.00 1.05 1.05 1.00 1.05 1.07 1.07
e annual presence2009 2010 2011 2012 2013 2014 2015 2016 2017 2018 2019 2020
0.00 0.00 0.00 0.00 0.00 0.001.58 1.67 1.67 1.67 1.67 1.33
e annual presence
2009 2010 2011 2012 2013 2014 2015 2016 2017 2018 2019 2020
0.33
0.50
AKE 4 is home ported in WP after 2014.
e annual presence
2009 2010 2011 2012 2013 2014 2015 2016 2017 2018 2019 2020
1.19 0.85 0.79 0.84 0.85 0.76 1.08 1.01 1.01 0.76 0.84 1.001.55 1.53 1.50 1.52 2.37 2.35 2.83 3.10 3.02 3.18 2.85 2.920.00 0.50 0.50 0.50 0.67 0.50 0.42 0.58 0.50 0.58 0.58 0.331.19 0.85 0.79 0.84 0.85 0.76 1.08 1.01 1.01 0.76 0.84 1.001.88 1.53 1.50 1.52 2.37 2.350.50 0.50 0.50 0.50 0.67 0.50 0.42 0.58 0.50 0.58 0.58 0.33
3.99 3.75 4.27 4.09 3.69 3.87 4.39 4.11 3.79 3.85 3.92 4.57
CVBG 7CVBG 8CVBG 9 CVBG 10CVBG 11 FDNF CVBG
AOE 5AOE 6 AOE 7 AOE 8
EP (incl. AOE equivalents)WP (incl. AOE equivalents)CC (incl. AOE equivalents)
TAO 9TAO 10
TAO 11TAO 12TAO 13TAO 14TAO 15TAO 16
TAO 8
EP TAOWP TAOCC TAO
TAE 4TAE 5TAE 6TAE 7
EP TAEWP TAE
TAFS 4TAFS 5TAFS 6
WP TAFS
CC TAFS
TAKE 3
TAKE 4TAKE 6TAKE 8TAKE 10TAKE 12
TAKE 7
EP TAKEWP TAKECC TAKE
O N D J F M A M J J A S O N D J F M A M J J A S O N D J F M A M J J A S O N D J F M A M J J A S
Note: Where shown in red below, presence is less thaNote: At all times, an AOE (or substitute station ship) is
M M C J P M M C J P M M M M M
M M M C J P M M C J P M M M C J P Averag
RQRD AVE 2003 2004 2005 2006 2007 2008
0 0 1 1 1 0 1 2 1 1 0 1 2 2 1 0 2 1 1 1 0 1 2 1 1 0 2 2 2 1 0 1 1 1 1 1 2 2 3 1 1 1 2 2 1 0 1 1 0.75 1.19 0.46 1.48 1.81 2.33 1.42 1.001 1 0 0 0 1 1 0 0 0 1 2 1 0 0 0 2 1 0 0 1 2 0 0 0 1 2 0 0 0 1 2 1 0 0 0 1 0 0 0 1 1 0 0 0 1 1 0 0.63 0.35 0.35 0.42 0.42 0.500 0 1 1 1 0 0 1 1 1 0 0 0 1 1 1 0 0 1 1 0 0 1 1 1 0 0 1 1 1 0 0 0 1 1 1 0 0 0 0 0 0 1 1 1 0 0 1 0.50 0.52 0.67 0.50 0.50 0.50 0.58 0.581 1 1 1 1 1 1 1 1 1 1 1 1 1 1 1 1 1 1 1 1 1 1 1 1 1 1 1 1 1 1 1 1 1 1 1 1 1 1 1 1 1 1 1 1 1 1 1 FDNF 1.00 1.00 1.00 0.75 1.00 1.00
WP total - 1.33 1.39 1.63 1.35 1.35 1.17 1.42 1.50M M M M M M M C J P Note: TAOs 10, 11, 12, and 13 are home ported in WP
M M M M M M M M MM M M M M M M M M M
M M M M M M MM M M C J P M M C J P M M M
M M M M M M M MM M M M M M M M Averag
M M M M M M M M RQRD AVE 2003 2004 2005 2006 2007 2008
4 5 5 5 2 2 3 3 3 1 1 1 1 1 2 2 3 4 5 2 2 3 2 2 1 2 1 1 2 2 3 4 5 4 2 2 2 4 2 2 3 2 2 1 2 2 4 4 2.00 2.26 2.02 1.53 2.44 2.60 2.36 1.441 1 1 0 1 3 3 2 2 2 4 3 2 2 1 1 1 1 2 1 2 3 3 4 4 4 3 2 3 2 1 0 0 0 2 3 3 3 2 1 2 2 3 2 1 2 1 2 2.00 2.04 1.99 2.00 2.09 2.06 2.00 2.070 0 1 1 1 1 1 1 2 1 1 1 2 2 2 1 1 0 0 0 1 1 1 1 1 1 1 1 1 1 1 1 1 1 1 1 1 1 1 1 1 1 1 1 1 1 1 1 1.00 1.04 1.13 1.07 1.00 1.05 1.07 1.05
Note: TAEs 5, 6 and 7 are home ported in WP
AveragRQRD AVE 2003 2004 2005 2006 2007 2008
0.75 0.75 0.08 0.75 0.83 0.92 0.171.30 1.61 1.42 1.58 1.67 1.67 1.67 1.75
Note: All TAFSs are home ported in WP
Averag
RQRD AVE 2003 2004 2005 2006 2007 2008
1.50 1.83 1.83 2.17 1.83 1.58 1.00
0.50 0.67 0.50 0.50 0.50 0.58 0.58
M M M C J P M M C J P M M M Note: TAKEs 6, 7, 8 and 12 are home ported in WP. T
M M M M M M MM M M M M M M M
M M M M M M M C J P M MM M M M M M M M Averag
M M M M M M M M RQRD AVE 2003 2004 2005 2006 2007 2008
1 0 0 2 1 1 1 1 2 1 1 1 1 1 1 1 0 1 1 1 0 1 0 1 0 0 1 1 1 1 1 0 1 2 1 1 0 2 1 1 1 1 1 1 1 1 1 1 0.58 1.105 5 2 2 3 4 4 3 2 2 2 2 2 3 3 3 4 3 2 2 4 5 4 3 3 3 2 2 2 3 4 4 3 2 3 3 4 4 3 3 2 2 1 3 3 4 4 2 2.80 2.89 0.00 0.620 0 1 1 1 0 0 1 1 1 0 0 0 1 1 1 0 0 1 1 0 0 1 1 1 0 0 1 1 1 0 0 0 1 1 1 0 0 0 0 0 0 1 1 1 0 0 1 0.00 0.00
EP TAKE + TAE 0.75 0.90 0.75 0.08 0.75 0.83 1.50 1.27WP TAKE + TAFS 1.50 1.83 1.83 1.83 2.17 1.83 1.58 1.62CC TAKE + TAFS 0.50 0.52 0.67 0.50 0.50 0.50 0.58 0.58
EP CLF TOTAL 4.12 3.20 3.56 4.65 5.22 4.92 4.34
FY 2017 FY 2018 FY 2019 FY 2020

49
Appendix
A M J J A S O N D J F M A M J J A S
M M M C J P
M M M C J P M M
1 0 1 2 2 1 1 0 1 1 1 1 0 2 1 1 0 10 0 1 1 1 0 0 1 1 1 0 0 0 1 1 1 0 11 1 0 0 0 1 1 0 0 0 1 1 1 0 0 0 1 1
J P M M C J P M M MM M M M M
M M M MM M
M M MM M
1 3 3 4 3 4 4 3 4 5 4 4 4 2 3 2 2 13 2 2 1 1 1 1 1 1 1 2 2 3 3 3 3 3 30 0 0 0 0 0 0 0 0 0 0 0 0 0 0 0 0 0
0 0 0 0 0 0 0 0 0 0 0 0 0 0 0 0 0 0
M M M
0 1 1 0 0 0 1 1 1 1 1 0 1 0 0 1 0 00 0 1 2 2 2 0 0 0 0 1 1 0 0 0 0 1 11 1 0 0 0 0 1 1 1 1 0 0 0 0 0 0 0 0
J P M M C J P M M M
M M MD W W W W W W W W W
2 2 2 1 1 0 0 0 1 1 1 1 2 1 3 2 1 20 0 0 1 1 2 2 2 2 1 0 0 0 1 0 0 1 10 0 0 0 0 0 0 0 0 1 1 1 1 0 0 0 0 0
DCDC
2008 FY 2009
Figure 7. LANTFLT timeline for Alternative II
FY 2005 FY 2006O N D J F M A M J J A S O N D J F M A M J J A S O N D J F M A M J J A S O N D J F M A M J J A S O N D J F M A M J J A S O N D J F M
CVBG 1 CVBG 2 CVBG 3
CVBG 4 CVBG 5 CVBG 6
AOE 1 M M M T T T T T T C M J P S M M M M T T T T T TAOE 2 M M C J P M M M M M C J P M M M C J P M M C J P AOE 3 T T T T T C M J P S M M M M T T T T T TAOE 4 C J P M M M M M C J P M M M C J P M M C J P
TAOE 1
TAOE 3
WL (incl. AOE equivalents) 1 0 2 2 2 2 1 3 2 3 3 3 2 2 2 1 3 2 3 2 2 0 0 2 2 2 0 1 1 1 1 0 1 1 2 2 2 1 2 4 4 3 2 3 3 2 2 1 1 1 2 0 1 1 2 2 1 1 1 2 1 1 0 0 1 1MED (incl. AOE equivalents) 1 1 1 1 1 0 0 1 1 1 0 0 1 1 1 0 0 0 1 1 1 0 1 1 0 0 0 1 1 1 0 0 1 1 1 0 0 1 1 1 0 0 0 1 1 1 0 0 1 1 1 0 0 1 1 1 0 0 0 1 1 1 0 1 2 1CC (incl. AOE equivalents) 0 0 0 0 0 1 1 0 0 0 1 1 0 0 0 1 1 1 0 0 0 1 1 1 1 1 1 0 0 0 1 1 0 0 0 1 1 0 0 0 1 1 1 0 0 0 1 1 0 0 0 1 1 0 0 0 1 1 1 0 0 0 1 1 0 0
TAO 1 M M M M M M M M M M C J P M M M CTAO 2 M M M M M M M M M M M MTAO 3 M M M M M M M M M MTAO 4 J P M M M M M M M M M MTAO 5 M M M M M M M M M MTAO 6 M M M M M M M M M MTAO 7 M M M M M C J P M M M M M
TAO 8
WL 3 3 2 2 1 2 1 2 3 3 2 4 5 5 3 3 4 4 5 4 3 3 3 2 4 3 4 3 4 3 3 3 4 4 3 4 2 3 3 3 2 4 3 3 3 3 2 3 4 4 3 3 3 2 3 4 3 2 2 2 3 2 3 3 3 3MED 2 1 2 2 2 2 2 3 3 3 3 2 1 1 2 2 2 2 2 2 3 3 3 3 2 2 2 2 2 3 3 2 2 2 2 2 2 2 2 2 2 1 2 2 2 3 3 3 3 2 2 2 2 2 2 1 2 2 3 3 3 3 3 3 2 3CC 0 0 0 0 0 0 0 0 0 0 0 0 0 0 0 0 0 0 0 0 0 0 0 0 0 0 0 0 0 0 0 0 0 0 0 0 0 0 0 0 0 0 0 0 0 0 0 0 0 0 0 0 0 0 0 0 0 0 0 0 0 0 0 0 0 0
TAE 1 J P M M M M M M MTAE 2 M M M M M C J P TAE 3
WL TAE 0 0 0 0 1 1 1 1 2 1 1 2 2 2 1 1 1 2 2 2 2 2 2 2 1 1 1 2 2 1 1 2 2 2 1 2 1 1 1 0 0 1 1 1 0 0 0 0 0 0 0 0 0 0 0 0 0 0 0 0 0 0 0 0 0 0
TAFS 1 M M M M M M M M M M M MTAFS 2 M M M M M M M M M MTAFS 3 M M M M M M M M M M M M
WL TAFS 0 0 1 2 1 0 0 2 0 0 1 0 0 0 1 0 0 1 2 0 1 2 1 0 0 0 1 0 1 1 0 1 2 2 0 0 1 2 1 0 1 1 0 1 1 0 0 0 2 1 0 2 2 0 0 0 1 0 0 1 0 0 2 1 0 0MED TAFS 2 2 1 0 0 1 1 0 1 1 2 3 2 2 1 1 2 1 1 1 0 0 1 1 1 1 1 1 1 1 1 0 1 1 2 2 0 0 0 1 1 1 1 1 2 2 2 2 1 1 1 0 0 1 1 1 1 2 2 2 1 1 0 1 1 1CC TAFS 0 0 1 1 1 1 1 1 1 1 0 0 1 1 1 1 0 0 0 0 1 1 1 1 1 1 1 1 1 1 1 1 0 0 0 0 1 1 1 1 1 1 1 1 0 0 0 0 0 0 0 1 1 1 1 1 1 1 1 0 1 1 1 1 1 1
TAKE 1 D W W W W W W W W W W W W W C J P M M M CTAKE 2 D W W W W W W W W W M M
TAKE 5 D W W W W W W W W WTAKE 7
WL TAKE 0 0 0 0 0 0 0 0 0 0 0 0 0 0 1 1 1 2 2 1 2 1 1 1 1 1 1 1 1 2 1 0 0 1 2MED TAKE 0 0 0 0 0 0 0 0 0 0 0 0 0 0 0 0 0 0 0 0 0 0 0 0 0 0 0 0 0 0 0 0 0 0 0CC TAKE 0 0 0 0 0 0 0 0 0 0 0 0 0 0 0 0 0 0 0 0 0 0 0 0 0 0 0 0 0 0 0 0 0 0 0
= CVBG and STATION SHIP MEDITERRANEAN
= SHUTTLE SHIP MEDITERRANEAN = WESTLANT & CARIBBEAN = T-AKE OR T-AOE(X) READY TO DEPLOY DATE
= SHUTTLE SHIP CENTCOM = CVBG and STATION SHIP CENTCOM
ROS
ROSROS
ROS
FY 2007
DC
HT
FY 2003 FY 2004
DC
FY
DCACTDC
ROS
ACTROS

50
Appendix
J F M A M J J A S O N D J F M A M J J A S
J P M M M C J P
M M M C J P M
M M C J P M M M C
1 0 2 2 2 1 0 1 2 2 2 1 0 1 2 1 1 0 2 2 10 0 1 1 1 0 0 1 1 1 0 0 1 1 1 0 0 0 1 1 11 1 0 0 0 1 1 0 0 0 1 1 0 0 0 1 1 1 0 0 0
M M M M MM M M
M MM M M
M M MM M M M M
2 3 4 4 3 2 2 3 2 1 3 3 3 2 3 3 2 3 4 3 32 2 2 2 2 3 3 2 3 3 2 2 2 2 2 2 2 2 2 2 20 0 0 0 0 0 0 0 0 0 0 0 0 0 0 0 0 0 0 0 0
M M M M M
M MM M
1 1 1 1 0 1 1 1 1 1 2 0 0 1 1 0 1 1 1 0 11 1 1 1 1 0 0 1 1 1 0 1 1 1 1 1 1 1 2 2 11 1 1 1 1 1 1 0 0 0 1 1 1 1 1 1 1 1 0 0 0
FY 2016FY 2015
Figure 7. LANTFLT timeline for Alternative II
CVBG 1CVBG 2CVBG 3
CVBG 4CVBG 5 CVBG 6
AOE 1 AOE 2AOE 3 AOE 4
TAOE 1
TAOE 3
WL (incl. AOE equivalents)MED (incl. AOE equivalents)CC (incl. AOE equivalents)
TAO 1TAO 2TAO 3TAO 4TAO 5TAO 6TAO 7
TAO 8
WLMEDCC
TAE 1TAE 2TAE 3
WL TAE
TAFS 1TAFS 2TAFS 3
WL TAFSMED TAFSCC TAFS
TAKE 1TAKE 2
TAKE 5TAKE 7
WL TAKEMED TAKECC TAKE
FY 2010 FY 2011O N D J F M A M J J A S O N D J F M A M J J A S O N D J F M A M J J A S O N D J F M A M J J A S O N D J F M A M J J A S O N D
C J P M M C J P M M M C J P M M C
C J P M M M M M M C J P M M C J P
D W W W W W W W W W W W W W M M M C J P M M C J P M M M C J P
D W W W W W W W
1 1 1 0 1 1 0 1 0 1 1 2 0 1 0 1 1 2 1 0 1 1 1 1 0 1 1 2 1 1 0 3 3 2 2 2 3 2 1 0 0 2 3 3 1 2 2 3 1 1 0 2 2 1 1 1 2 2 2 0 0 1 21 0 0 0 1 1 1 0 0 1 1 1 0 0 1 1 1 0 0 0 1 1 1 0 0 1 1 1 0 0 1 1 1 0 0 0 1 1 1 0 1 2 1 0 0 1 1 1 0 0 1 1 1 0 0 0 1 1 1 0 1 1 01 1 1 1 0 0 0 1 1 0 0 0 1 1 0 0 0 1 1 1 0 0 0 1 1 0 0 0 1 1 0 0 0 1 1 1 0 0 0 1 1 0 0 1 1 0 0 0 1 1 0 0 0 1 1 1 0 0 0 1 1 1 1
M M M C J P M M M M M M MM M M M M C J P M M M M M
M M M M M M M M M MM M M M M M M M M M M
M M M M M M M M M M M MM M C J P M M M M M M M M
M M M M M M M M
2 2 2 2 3 3 5 2 2 3 3 2 2 1 2 3 3 3 3 2 1 3 4 4 5 3 4 3 4 2 3 2 3 1 2 2 3 3 3 2 3 3 2 2 3 3 3 4 4 3 3 4 3 3 4 2 2 2 3 2 3 3 33 3 3 2 2 2 1 2 2 2 2 2 2 2 2 2 1 2 2 3 3 3 2 2 2 2 2 2 2 2 2 2 2 2 2 3 3 3 3 3 2 2 2 2 2 2 1 1 1 2 2 2 2 2 2 3 3 3 2 2 2 2 20 0 0 0 0 0 0 0 0 0 0 0 0 0 0 0 0 0 0 0 0 0 0 0 0 0 0 0 0 0 0 0 0 0 0 0 0 0 0 0 0 0 0 0 0 0 0 0 0 0 0 0 0 0 0 0 0 0 0 0 0 0 0
0 0 0 0 0 0 0 0 0 0 0 0 0 0 0 0 0 0
M M M M M
0 0 0 0 0 0 0 1 1 1 0 0 0 1 1 0 0 0 0 0 0 0 0 0 1 0 0 1 0 0 0 0 0 0 0 0 0 1 0 0 0 0 0 0 0 0 0 00 0 0 0 1 1 1 0 0 0 0 0 0 0 0 1 1 0 0 0 0 1 1 1 0 0 0 0 1 0 0 0 0 1 1 1 1 0 0 0 0 0 0 0 0 0 0 01 1 1 1 0 0 0 0 0 0 0 0 0 0 0 0 0 1 1 1 1 0 0 0 0 0 0 0 0 1 1 1 1 0 0 0 0 0 0 0 0 0 0 0 0 0 0 0
M M M C J P M M C J P M M M M MM M M M M
M M M M M M M M M MM M M C J P M M M M M M M M M M
2 1 0 0 0 1 2 1 0 0 3 1 1 1 1 2 1 1 2 2 1 3 2 1 2 2 2 1 1 1 1 0 0 0 0 0 0 0 0 0 1 1 1 2 0 0 1 1 0 1 1 1 0 1 1 1 0 1 1 0 0 0 01 2 2 2 1 1 1 0 1 1 0 0 1 0 0 0 0 1 1 1 1 1 1 1 1 1 1 1 1 0 0 1 1 1 1 1 1 1 1 1 1 1 1 0 1 1 1 2 1 1 1 1 2 1 2 2 1 0 0 1 2 2 10 0 0 0 1 1 1 1 0 0 0 0 0 1 1 1 1 0 0 0 0 0 0 0 0 0 0 0 0 0 0 0 1 1 1 1 1 1 1 1 0 0 0 1 1 1 1 0 1 1 1 1 0 0 0 0 1 1 1 1 0 0 1
ROS
GoTo PACFLT
DC
ACT
DC
ROS
ROSDC
GoTo PACFLT
CIVMOD CONVERSION
FY 2013FY 2012
CIVMOD CONVERSION
FY 2014
WRKUP
WRKUP
ROS

51
Appendix
ired (RQRD) presence. any with the forward deployed CVBG.
l presence2010 2011 2012 2013 2014 2015 2016 2017 2018 2019 2020
0.79 0.85 1.52 1.82 1.27 1.15 1.27 1.43 1.07 1.35 1.070.62 0.48 0.48 0.85 0.48 0.60 0.57 0.48 0.77 0.57 0.520.50 0.50 0.50 0.33 0.50 0.58 0.42 0.50 0.42 0.42 0.67
l presence
2010 2011 2012 2013 2014 2015 2016 2017 2018 2019 2020
2.64 2.63 2.89 2.88 2.96 2.89 2.79 2.81 2.72 2.96 2.882.02 2.05 2.02 2.05 2.00 2.02 2.00 2.02 2.05 2.00 2.050.00 0.00 0.00 0.00 0.00 0.00 0.00 0.00 0.00 0.00 0.00
l presence
2010 2011 2012 2013 2014 2015 2016 2017 2018 2019 2020
0.00 0.00
l presence
2010 2011 2012 2013 2014 2015 2016 2017 2018 2019 2020
0.26 0.18 0.18 0.090.23 0.37 0.32 0.050.27 0.27 0.27 0.00
l presence2010 2011 2012 2013 2014 2015 2016 2017 2018 2019 2020
0.94 1.53 0.86 0.62 0.72 0.71 0.78 0.71 0.63 0.72 0.710.92 0.67 0.75 0.98 1.00 1.03 1.07 1.03 1.00 1.00 1.030.27 0.27 0.27 0.53 0.53 0.53 0.53 0.53 0.53 0.53 0.530.94 1.53 0.86 0.62 0.72 0.71 0.78 0.71 0.63 0.72 0.711.15 1.03 1.07 1.03 1.00 1.03 1.07 1.03 1.00 1.00 1.030.53 0.53 0.53 0.53 0.53 0.53 0.53 0.53 0.53 0.53 0.53
4.63 5.19 5.44 5.41 4.94 4.75 4.84 4.95 4.42 5.02 4.66
Figure 7. LANTFLT timeline for Alternative II
CVBG 1CVBG 2CVBG 3
CVBG 4CVBG 5 CVBG 6
AOE 1 AOE 2AOE 3 AOE 4
TAOE 1
TAOE 3
WL (incl. AOE equivalents)MED (incl. AOE equivalents)CC (incl. AOE equivalents)
TAO 1TAO 2TAO 3TAO 4TAO 5TAO 6TAO 7
TAO 8
WLMEDCC
TAE 1TAE 2TAE 3
WL TAE
TAFS 1TAFS 2TAFS 3
WL TAFSMED TAFSCC TAFS
TAKE 1TAKE 2
TAKE 5TAKE 7
WL TAKEMED TAKECC TAKE
O N D J F M A M J J A S O N D J F M A M J J A S O N D J F M A M J J A S O N D J F M A M J J A S
Note: Where shown in red below, presence is less than the requNote: At all times, an AOE (or substitute station ship) is in comp
M M C J P M M M C J P M M C J P
M C J P M M M C J P M M C J P M M M
J P M M C J P M M M C J P M M C J P
Average annuaRQRD AVE 2003 2004 2005 2006 2007 2008 2009
1 1 2 2 2 1 1 1 2 1 1 2 1 2 1 1 0 1 1 2 1 0 1 2 1 1 1 1 2 1 1 2 1 2 2 1 0 1 1 1 1 1 2 2 1 1 0 2 0.75 1.34 1.93 1.82 1.10 2.43 1.23 0.93 0.870 0 1 1 1 0 0 1 1 1 0 0 0 1 1 1 0 1 2 1 0 0 1 1 1 0 0 1 1 1 0 0 0 1 1 1 0 1 1 0 0 0 1 1 1 0 0 1 0.75 0.60 0.73 0.60 0.57 0.48 0.60 0.73 0.541 1 0 0 0 1 1 0 0 0 1 1 1 0 0 0 1 1 0 0 1 1 0 0 0 1 1 0 0 0 1 1 1 0 0 0 1 1 1 1 1 1 0 0 0 1 1 0 0.50 0.46 0.33 0.50 0.50 0.50 0.42 0.42 0.50
M M M M M M M M 0.60M M M M M M M M M
M M M M M M M MM M M M M M M
M M M M M M M MM M M M M M M
Average annua
RQRD AVE 2003 2004 2005 2006 2007 2008 2009
4 2 3 3 4 3 3 3 2 1 2 3 3 2 1 2 2 3 2 4 4 3 2 4 4 3 3 4 2 2 4 3 3 2 3 2 3 3 3 2 2 3 4 3 3 2 3 3 2.33 2.93 2.39 3.72 3.55 2.89 2.97 2.96 3.222 2 2 2 1 1 2 2 3 3 3 3 3 3 3 3 3 2 2 1 1 2 2 1 1 2 2 2 3 3 2 2 2 2 2 2 2 2 2 2 3 3 2 2 2 2 2 2 2.00 2.03 2.10 2.02 2.05 2.02 2.02 2.08 2.050 0 0 0 0 0 0 0 0 0 0 0 0 0 0 0 0 0 0 0 0 0 0 0 0 0 0 0 0 0 0 0 0 0 0 0 0 0 0 0 0 0 0 0 0 0 0 0 0.00 0.00 0.00 0.00 0.00 0.00 0.00 0.00 0.00
Average annua
RQRD 02-19 2003 2004 2005 2006 2007 2008 2009
0.75 0.83 1.75 1.50 0.50 0.00 0.00 0.00
Average annua
RQRD AVE 2003 2004 2005 2006 2007 2008 2009
0.00 0.56 0.63 0.71 0.71 0.70 0.79 0.46 0.601.00 1.03 1.03 1.03 1.07 1.03 0.87 0.280.50 0.53 0.53 0.53 0.53 0.53 0.53 0.27
M M M M M M M M
M M M M M M M M MM M M M M M M M Average annua
RQRD AVE 2003 2004 2005 2006 2007 2008 2009
2 2 0 1 1 0 0 0 1 0 0 1 1 0 1 1 1 0 1 1 0 0 1 0 1 1 1 1 0 0 1 0 1 1 1 0 1 0 1 0 1 1 1 0 0 0 2 1 0.75 0.25 1.25 1.18 1.281 1 1 0 0 1 1 2 1 2 2 1 1 1 0 0 2 2 1 2 1 1 1 1 2 2 1 1 1 1 2 2 0 0 0 1 1 2 1 1 1 1 2 1 1 1 0 1 1.00 0.00 0.00 0.27 0.750 0 0 1 1 1 1 0 1 1 1 1 1 1 1 1 0 0 0 0 1 1 1 1 0 0 1 1 1 1 0 0 1 1 1 1 0 0 1 1 1 1 0 1 1 1 1 0 0.50 0.00 0.00 0.00 0.27
WL TAKE+TAE 0.75 0.99 0.83 1.75 1.50 0.75 1.25 1.18 1.28MED TAKE+TAFS 1.00 1.05 1.03 1.03 1.03 1.07 1.03 1.13 1.03
CC TAKE+TAFS 0.50 0.49 0.53 0.53 0.53 0.53 0.53 0.53 0.53
WL CLF TOTAL 5.57 5.78 8.00 6.86 6.77 6.25 5.53 5.97
FY 2020
ROS
ROS
FY 2019FY 2017 FY 2018

52
Appendix
Figure 8. PACFLT timeline for Alternative II
J F M A M J J A S O N D J F M A M J J A S
M M C J P
M M C J P M M M C
1 0 2 1 2 2 2 1 0 2 1 1 1 0 1 0 0 0 1 1 21 0 0 1 2 0 0 0 1 2 0 0 0 1 2 1 0 0 0 1 00 1 1 0 0 1 1 1 0 0 1 1 1 0 0 0 1 1 1 0 01 1 1 1 1 1 1 1 1 1 1 1 1 1 1 1 1 1 1 1 1
M M M M M
M M M MM M M M M
M M M M MM M M M
M M M MC J P M M
1 2 1 1 0 0 1 2 2 2 1 2 3 3 2 2 3 3 2 1 13 2 2 2 1 1 2 2 2 1 1 2 2 3 2 2 2 2 1 2 30 0 0 1 1 2 2 2 2 1 2 2 1 1 1 1 1 0 0 0 1
C J P
M M M M MM M M
0 1 0 0 0 0 0 0 0 0 0 0 0 0 0 0 0 0 0 0 02 1 1 1 2 2 2 2 2 1 1 1 2 2 2 2 1 1 2 2 2
M M M
2 1 1 2 1 0 0 1 2 1 0 0 0 1 1 1 0 0 0 0 0
0 1 1 0 0 1 1 1 0 0 1 1 1 0 0 0 1 1 1 0 0
M M
M M MW W W W W W W W W
D W W W W W W W W W
1 1 1 1 1 1 0 0 1 2 2 1 0 0 1 1 1 1 1 1 10 1 1 1 1 1 1 1 0 1 1 1 1 2 2 2 2 2 2 3 20 0 0 0 0 0 0 0 0 0 0 0 0 0 0 0 0 0 0 0 0
LOY DATE
FY 2009FY 2008
DC
DCDC
ROS
R
FY 2005 FY 2006O N D J F M A M J J A S O N D J F M A M J J A S O N D J F M A M J J A S O N D J F M A M J J A S O N D J F M A M J J A S O N D
CVBG 7 CVBG 8 CVBG 9 CVBG 10 CVBG 11 FDNF CVBG
AOE 5 T T C M J P S M M M M T T T T T T C M J P SAOE 6 M T T T T T T C M J P S M M M M M M M C J P M M M M M C J PAOE 7 S M M M M T T T T T T C M J P S M M M M T T T T T T C M J P S MAOE 8 P S M M M M M C J P M M M M M C J P
TAOE 2TAOE 4
EP (incl. AOE equivalents) 0 0 1 0 1 0 1 1 0 1 0 1 1 0 1 1 3 2 2 2 2 2 0 2 1 2 2 2 3 2 1 1 2 2 2 1 2 1 1 2 2 2 4 3 3 2 3 3 2 1 2 2 2 2 2 1 0 1 1 1 1 0 1WP (incl. AOE equivalents) 0 1 1 1 0 1 2 0 0 0 1 2 0 0 0 1 2 1 0 0 0 1 0 0 0 1 1 0 0 0 1 1 0 0 0 1 2 1 0 0 0 1 0 0 0 0 1 1 0 0 0 1 1 0 0 0 1 2 1 0 0 0 2CC (incl. AOE equivalents) 1 1 1 1 1 0 0 1 1 1 0 0 1 1 1 0 0 0 1 1 1 0 0 0 0 0 0 1 1 1 0 0 1 1 1 0 0 0 1 1 1 0 0 1 1 1 0 0 1 1 1 0 0 1 1 1 0 0 0 1 1 1 0WP FDNF 1 1 1 1 1 1 1 1 1 1 1 1 1 1 1 1 1 1 1 1 1 1 1 1 1 1 1 1 1 1 1 1 1 1 1 1 1 1 1 1 1 1 1 0 0 0 1 1 1 1 1 1 1 1 1 1 1 1 1 1 1 1 1
TAO 9 M M M C J P M M M M M M MTAO 10 C J PTAO 11 M M M M M M M M M M MTAO 12 M M M M M M M M M MTAO 13 M M M M M M M M M MTAO 14 M M M M M M M M M MTAO 15 M M M M M M M M M M MTAO 16 M M M M M M M M M M
TAO 8
EP TAO 1 1 1 2 2 3 3 2 1 2 3 3 2 2 1 1 2 1 1 2 2 2 1 1 3 4 3 3 2 2 2 3 2 1 1 3 3 1 1 2 3 3 4 3 3 3 3 2 2 3 3 3 1 1 2 3 3 3 2 2 2 3 2WP TAO 3 3 1 2 1 1 1 1 1 3 3 3 2 2 3 2 3 2 2 1 1 1 2 2 2 2 1 2 3 2 2 3 2 2 1 2 2 2 2 3 2 1 1 2 2 2 3 2 2 2 1 0 2 3 2 2 2 2 3 2 2 3 2CC TAO 2 2 1 1 1 0 1 1 1 1 1 1 1 1 1 1 1 1 1 1 1 1 1 1 1 1 1 1 1 1 1 1 1 1 1 0 0 1 1 1 1 2 1 1 1 1 1 1 0 0 1 1 1 1 1 2 2 1 1 1 1 1 0
TAE 4 M M M C J P M M M M M M M M MTAE 5 C J PTAE 6 M M M M M M M M M MTAE 7 M M M M M M M M M M
EP TAE 1 1 1 1 1 1 1 0 0 0 1 1 0 1 0 0 0 0 0 0 0 0 0 0 1 1 1 1 1 0 0 1 1 1 1 1 1 1 1 1 1 1 1 1 0 0 0 1 1 1 1 1 1 1 1 1 1 1 1 0 0 1 1WP TAE 1 1 1 1 1 1 1 2 2 2 2 2 1 1 1 2 2 2 2 1 1 2 2 2 2 2 2 1 1 2 2 2 2 2 1 1 1 2 2 2 2 2 1 1 1 2 2 2 2 1 1 2 2 2 2 2 2 1 1 2 2 2 2
TAFS 4 M M M M M M M M M M M MTAFS 5 M M M M M M M M M MTAFS 6 M M M M M M M M M
WP TAFS 1 1 1 2 2 3 3 1 1 1 3 3 2 2 1 2 1 2 1 2 2 3 2 2 3 3 3 2 2 1 2 2 1 2 2 3 3 1 1 1 3 3 3 2 1 1 1 2 1 2 2 3 2 0 1 1 2 2 2 1 1 0 1
CC TAFS 1 1 1 1 1 0 0 1 1 1 0 0 1 1 1 0 0 0 1 1 1 0 0 0 0 0 0 1 1 1 0 0 1 1 1 0 0 1 1 1 0 0 0 1 1 1 0 0 1 1 1 0 0 1 1 1 0 0 0 1 1 1 0
TAKE 3 D W W W W W W W W W
TAKE 4 D W W W W W W W W WTAKE 6 DTAKE 8TAKE 9
TAKE 2
EP TAKE 0 0 0 0 0 0 0 0 0 0 1 1 1 1 1 1 1 1 2 2WP TAKE 0 0 0 0 0 0 0 0 0 0 0 0 0 0 0 0 0 1 0 0CC TAKE 0 0 0 0 0 0 0 0 0 0 0 0 0 0 0 0 0 0 0 0
= CVBG and STATION SHIP WESTPAC = SHUTTLE SHIP WESTPAC = T-AKE or T-AOE(X) READY TO DEP
= CVBG and STATION SHIP CENTCOM = SHUTTLE SHIP CENTCOM= FDNF STATION SHIP WESTPAC
= FDNF CVBG and STATION SHIP CENTCOM = EASTPAC/MIDPAC
FY 2007
DC
DC
ACT
ACT
FY 2003
Hot Transfer
FY 2004
Hot transfer
DC

53
Appendix
A M J J A S O N D J F M A M J J A S
M M M M
M M M M M C J P
M M M C J P M MJ P
3 2 0 1 1 2 2 2 3 2 2 2 1 1 3 3 2 00 0 1 1 0 0 0 1 2 1 0 0 0 1 0 0 0 01 1 0 0 1 1 1 0 0 0 1 1 1 0 0 1 1 11 1 1 1 1 1 1 1 1 1 1 1 1 1 1 0 0 0
M M MC J P
M M M MM M
M M MM M
M M M M MM M
3 2 2 2 4 4 3 1 1 2 3 2 2 3 3 4 3 22 3 2 1 0 1 1 2 2 3 3 2 2 2 2 2 2 11 1 1 1 1 0 0 1 1 1 1 1 2 1 1 1 1 1
M M
M M M MM M
C J PM M M M
M M M
1 1 1 1 0 0 0 0 0 0 0 1 1 1 1 1 1 12 3 3 3 2 4 4 5 4 2 2 1 3 4 3 2 2 21 1 0 0 1 1 1 0 0 1 1 1 0 0 0 1 1 1
DC
2015 FY 2016
Figure 8. PACFLT timeline for Alternative II
CVBG 7CVBG 8CVBG 9CVBG 10CVBG 11FDNF CVBG
AOE 5AOE 6 AOE 7 AOE 8
TAOE 2TAOE 4
EP (incl. AOE equivalents)WP (incl. AOE equivalents)CC (incl. AOE equivalents)WP FDNF
TAO 9TAO 10TAO 11TAO 12TAO 13TAO 14TAO 15TAO 16
TAO 8
EP TAOWP TAOCC TAO
TAE 4TAE 5TAE 6TAE 7
EP TAEWP TAE
TAFS 4TAFS 5TAFS 6
WP TAFS
CC TAFS
TAKE 3
TAKE 4TAKE 6TAKE 8TAKE 9
TAKE 2
EP TAKEWP TAKECC TAKE
FY 2010 FY 2011O N D J F M A M J J A S O N D J F M A M J J A S O N D J F M A M J J A S O N D J F M A M J J A S O N D J F M A M J J A S O N D J F M
M M M C J P M M C J P M M M C J P
J P M M M M M C J P
D W W W W W W W M M M C J P M MD W W W W W W W C J P M M C
2 0 0 0 1 1 1 0 1 1 0 2 1 2 2 2 1 1 2 2 2 2 0 0 0 2 1 2 1 2 3 0 1 0 2 2 2 2 1 2 1 0 1 1 2 2 2 3 2 3 2 2 2 1 2 1 1 2 2 2 3 3 2 3 3 30 0 1 1 0 0 0 1 1 0 0 0 1 2 1 0 0 0 1 0 0 0 0 1 1 0 0 0 1 1 0 0 0 1 2 1 0 0 0 2 1 0 0 1 2 0 0 0 1 2 0 0 0 1 2 1 0 0 0 1 0 0 0 1 1 00 0 0 0 1 1 1 0 0 1 1 1 0 0 0 1 1 1 0 0 1 1 1 0 0 1 1 1 0 0 1 1 1 0 0 0 1 1 1 0 0 1 1 0 0 1 1 1 0 0 1 1 1 0 0 0 1 1 1 0 0 0 0 0 0 11 1 1 1 1 1 1 1 1 1 1 1 1 1 1 1 1 1 1 1 0 0 0 1 1 1 1 1 1 1 1 1 1 1 1 1 1 1 1 1 1 1 1 1 1 1 1 1 1 1 1 1 1 1 1 1 1 1 1 1 1 1 1 1 1 1
M M M M M C J P M M M M MC J P
M M M M M M M M M MM M M M M M M M M M
M M M M M M M M M MM M M M M M M M M M M
M M M M M C J P M M M C J P M MM M M C J P M M M M M M M M M M
M M
2 3 3 3 2 2 2 3 2 1 2 2 2 1 0 1 1 2 3 3 3 3 3 2 2 2 3 3 1 1 1 4 2 1 1 3 2 1 1 1 2 3 3 1 1 2 4 3 2 2 3 3 2 2 3 2 2 3 1 1 2 3 2 1 2 33 3 2 2 2 2 2 3 2 2 0 1 2 2 2 3 3 1 1 1 2 2 3 2 2 2 2 1 2 3 2 1 1 1 3 3 3 3 2 3 3 2 2 2 1 1 1 1 1 1 2 2 2 2 2 2 2 2 2 3 3 3 3 2 2 21 1 1 1 1 2 1 1 1 1 1 0 0 1 1 1 1 1 2 1 1 1 1 1 1 0 1 1 1 1 1 1 2 1 1 1 1 1 1 0 0 0 1 1 1 2 2 2 2 1 1 2 1 1 1 1 0 0 0 1 1 1 1 1 1 2
C J PM M M M M M M M
M M M M M M M
0 0 0 0 0 0 0 0 0 0 0 0 0 0 0 0 0 0 0 0 0 0 0 0 0 0 0 0 0 0 0 0 0 0 0 0 0 0 0 0 0 0 0 0 0 0 0 02 2 2 1 1 2 2 2 2 2 1 1 1 2 2 2 2 2 1 1 1 2 2 2 2 1 1 2 2 2 2 2 2 1 1 2 2 2 2 2 1 1 1 2 2 2 0 0
0 0 0 0 0 0 0 0
0 0 0 0 0 0 0 0
M M M M M M M M M M M M M
M M C J P M M M C J P M M C J P M M M MM M M M M M M M M M M M M
M M M M MD W W W W W W W W M M M M M C J P M M M M M
M M M M M
1 1 1 2 2 1 0 1 1 0 1 0 0 1 1 1 1 2 2 3 2 2 1 2 2 0 1 1 2 2 0 1 0 0 0 0 0 1 1 1 0 2 1 1 1 0 0 1 1 1 1 1 1 1 1 1 1 1 1 1 0 0 0 1 1 12 2 1 1 0 1 1 3 3 3 2 1 2 3 1 1 1 1 1 2 1 1 1 3 3 2 1 0 1 2 1 1 0 1 3 3 2 2 2 3 2 1 1 3 3 1 1 0 2 3 2 2 2 3 3 4 3 3 3 4 3 3 3 3 3 20 0 0 0 1 1 1 0 0 1 1 1 0 0 1 1 1 0 0 0 1 1 1 0 0 1 1 1 0 0 1 1 1 0 0 0 1 1 1 0 0 1 1 0 0 1 1 1 0 0 1 1 1 0 0 0 1 1 1 0 0 0 0 0 0 1
from LANTFLT
WRKUP
WRKUP
DC
CIVMOD CONVERSION
DC
DC
DC
ROS
from PACFLT
ROS
ROS
FYFY 2012
CIVMOD CONVERSION
FY 2014FY 2013

54
Appendix
Figure 8. PACFLT timeline for Alternative II
equired (RQRD) presence.s in company with the forward deployed CVBG.
e annual presence
2009 2010 2011 2012 2013 2014 2015 2016 2017 2018 2019 2020
0.77 0.81 1.42 1.33 1.50 1.77 2.23 1.90 1.27 1.33 1.17 1.670.48 0.27 0.42 0.50 0.42 0.56 0.27 0.35 0.48 0.50 0.50 0.330.50 0.50 0.50 0.50 0.67 0.50 0.42 0.58 0.50 0.58 0.58 0.331.00 1.00 0.75 1.00 1.00 1.00 1.00 0.75 1.00 1.00 1.00 1.00
1.48 1.27 1.17 1.50 1.42 1.56 1.27 1.10 1.48 1.50 1.50 1.33
e annual presence
2009 2010 2011 2012 2013 2014 2015 2016 2017 2018 2019 2020
2.12 2.28 2.02 2.03 2.03 2.19 2.52 2.44 2.36 2.12 2.36 2.532.02 2.09 2.06 2.02 2.08 2.01 2.07 2.07 2.01 2.01 2.00 2.001.00 1.05 1.05 1.07 1.05 1.00 1.05 1.05 1.00 1.05 1.07 1.07
age annual presence2009 2010 2011 2012 2013 2014 2015 2016 2017 2018 2019 2020
0.00 0.00 0.00 0.00 0.001.58 1.67 1.67 1.67 1.42
age annual presence
2009 2010 2011 2012 2013 2014 2015 2016 2017 2018 2019 2020
0.33
0.50
4, 9, and 2 are home ported in WP after 2013 and 2014.
age annual presence
2009 2010 2011 2012 2013 2014 2015 2016 2017 2018 2019 2020
1.02 0.93 1.52 0.77 0.76 1.00 0.59 0.59 0.75 0.83 1.00 0.751.70 1.68 1.53 1.53 1.77 2.83 2.85 2.85 2.92 2.75 2.92 2.830.00 0.50 0.50 0.50 0.67 0.50 0.42 0.58 0.50 0.58 0.58 0.331.02 0.93 1.52 0.77 0.76 1.00 0.59 0.59 0.75 0.83 1.00 0.752.03 1.68 1.53 1.53 1.770.50 0.50 0.50 0.50 0.67 0.50 0.42 0.58 0.50 0.58 0.58 0.33
3.90 4.02 4.95 4.13 4.28 4.96 5.35 4.93 4.38 4.28 4.52 4.94
CVBG 7CVBG 8CVBG 9CVBG 10CVBG 11FDNF CVBG
AOE 5AOE 6 AOE 7 AOE 8
TAOE 2TAOE 4
EP (incl. AOE equivalents)WP (incl. AOE equivalents)CC (incl. AOE equivalents)WP FDNF
TAO 9TAO 10TAO 11TAO 12TAO 13TAO 14TAO 15TAO 16
TAO 8
EP TAOWP TAOCC TAO
TAE 4TAE 5TAE 6TAE 7
EP TAEWP TAE
TAFS 4TAFS 5TAFS 6
WP TAFS
CC TAFS
TAKE 3
TAKE 4TAKE 6TAKE 8TAKE 9
TAKE 2
EP TAKEWP TAKECC TAKE
O N D J F M A M J J A S O N D J F M A M J J A S O N D J F M A M J J A S O N D J F M A M J J A S
Note: Where shown in red, presence is less than the rM C J P M M M C J P M M M M M Note: At all times, an AOE (or substitute station ship) i
M M M C J P M M C J P M M M C J P
M M M C J P M M C J P M M M C J P Averag
RQRD AVE 2003 2004 2005 2006 2007 2008
1 2 2 2 1 0 1 2 2 1 0 1 2 2 1 0 1 2 2 1 0 2 2 2 1 0 2 2 2 1 0 2 2 1 1 1 2 3 3 1 1 1 2 2 1 0 1 2 0.75 1.41 0.46 1.48 1.81 2.33 1.42 1.001 1 0 0 0 1 1 0 0 0 1 2 1 0 0 0 2 1 0 0 1 2 0 0 0 1 2 0 0 0 1 2 1 0 0 0 1 0 0 0 1 1 0 0 0 1 1 0 0.44 0.63 0.35 0.35 0.42 0.42 0.500 0 1 1 1 0 0 1 1 1 0 0 0 1 1 1 0 0 1 1 0 0 1 1 1 0 0 1 1 1 0 0 0 1 1 1 0 0 0 0 0 0 1 1 1 0 0 1 0.50 0.54 0.67 0.50 0.50 0.50 0.58 0.581 1 1 1 1 1 1 1 1 1 1 1 1 1 1 1 1 1 1 1 1 1 1 1 1 1 1 1 1 1 1 1 1 1 1 1 1 1 1 1 1 1 1 1 1 1 1 1 FDNF 1.00 1.00 1.00 0.75 1.00 1.00
WP total - 1.33 1.39 1.63 1.35 1.35 1.17 1.42 1.50M M M M M M M Note: TAOs 10, 11, 12, and 13 are home ported in WP
M M M M M M M M MM M M M M M M M M M
M M M M M M MM M M M M M M M
M M M M M M M MM M M M M M M M Averag
RQRD AVE 2003 2004 2005 2006 2007 2008
3 3 3 3 2 1 2 3 2 2 2 2 2 2 2 2 3 3 3 1 1 2 3 1 1 2 2 2 2 2 3 3 4 4 2 1 2 3 2 2 2 3 3 2 2 2 3 4 2.00 2.17 2.02 1.53 2.44 2.60 2.36 1.442 2 2 0 1 2 3 2 2 2 3 2 2 2 1 1 1 2 2 1 2 3 3 3 4 4 3 2 3 2 2 0 0 0 1 2 3 3 2 2 3 3 2 1 1 2 0 1 2.00 2.04 1.99 2.00 2.09 2.06 2.00 2.070 0 1 1 1 1 1 1 2 1 1 1 2 2 2 1 1 0 0 0 1 1 1 1 1 1 1 1 1 1 1 1 1 1 1 1 1 1 1 1 1 1 1 1 1 1 1 1 1.00 1.05 1.13 1.07 1.00 1.05 1.07 1.05
Note: TAEs 5, 6 and 7 are home ported in WP
AverRQRD AVE 2003 2004 2005 2006 2007 2008
0.75 0.75 0.08 0.83 0.75 0.92 0.251.30 1.61 1.42 1.58 1.67 1.67 1.67 1.75
Note: All TAFSs are home ported in WP
Aver
RQRD AVE 2003 2004 2005 2006 2007 2008
1.50 1.83 1.83 2.17 1.83 1.58 1.00
0.50 0.67 0.50 0.50 0.50 0.58 0.58
M M M M M M M M Note: TAKEs 6 and 8 are home ported in WP. TAKEs
M M M M M M MM M M M M M M M
M M M M M M M M M Aver
M M M M M M M RQRD AVE 2003 2004 2005 2006 2007 2008
1 1 1 1 1 1 0 0 0 1 1 1 1 1 1 1 1 1 1 1 1 0 0 1 1 1 1 1 1 1 1 1 1 1 1 1 0 0 0 1 1 1 1 1 1 1 1 1 0.58 1.023 4 3 3 3 4 3 2 2 2 3 3 3 3 2 2 3 4 3 3 4 3 2 1 2 4 3 2 2 2 3 4 4 3 3 3 3 3 3 3 3 3 2 3 2 3 3 3 2.80 2.85 0.00 0.700 0 1 1 1 0 0 1 1 1 0 0 0 1 1 1 0 0 1 1 0 0 1 1 1 0 0 1 1 1 0 0 0 1 1 1 0 0 0 0 0 0 1 1 1 0 0 1 0.00 0.00
EP TAKE + TAE 0.75 0.88 0.75 0.08 0.83 0.75 1.50 1.27WP TAKE + TAFS 1.50 1.77 1.83 1.83 2.17 1.83 1.58 1.70CC TAKE + TAFS 0.50 0.54 0.67 0.50 0.50 0.50 0.58 0.58
WP TAKE + AOE EP CLF TOTAL 4.46 3.23 3.09 5.09 5.68 5.27 3.71
FY 2019FY 2017 FY 2018
ROS
ROS
FY 2020
References
[1] Burnham C. McCaffree Jr. and John F. Ince, Transitioning the-Combat Logistics Force into the 21st Century, Unclassified, May1998 (CNA Research Memorandum 98-69)
[2] Burnham C. McCaffree Jr. and John F. Ince, Building a CombatLogistics Force for the Future, Unclassified, Sep 1999 (CNA Anno-tated Briefing 99-50)
[3] Dr. John F. Ince and CAPT John Vuolo, USN, Fleet Analysis ofthe Combat Logistics Force (U), FOUO, Aug 2001 (CINC-LANT-FLT N81)
[4] CINCLANTFLT CLF Peacetime Force Presence StructureWorking Group Conference on 25-26 Jul 2001, Norfolk, VA
[5] 2002 GNFPP Scheduling Conference, CY 02-07 GNFPP CVBGSchedules (U)(Brief), Secret, Jun 2002
[6] RADM Burnham C. McCaffree Jr., USN (Ret.), Future Optionsfor Combat Logistics Force (CLF) Peacetime Forward Presence,Unclassified, Nov 1997 (CNA Annotated Briefing 97-64)
[7] CINCLANTFLT Norfolk VA, message 071755Z SEP 2001Combat Logistics Force Peacetime Force Structure Recommendations,Unclassified
[8] CINCLANTFLT Employment Schedules - Battle Group (U), Jan2002 and Aug 2002, Secret, CINCLANTFLT web site
[9] CINCPACFLT CVBG long-range deployment plan (U), Aug 2001to Jul 2002, Secret, CINCPACFLT web site
[10] OPNAV N4 Logistics Crisis Action Center, Daily CLF Locations(U), Confidential, Oct 2001 through Mar 2002
55

[11] CNO Navy Command Center Daily Operations Notes(OPNOTEs) for 1-30 Apr 2002, Unclassified
[12] Burnham C. McCaffree Jr. and Wendy R. Trickey, Trip Reportfrom CINCLANTFLT CLF peacetime force structure working groupconference on 25-26 July 2001, Unclassified, Aug 2001 (CNA Memorandum D0004432.A2)
[13] Email from OPNAV Code N512K to OPNAV Code N42C,Subj: GNFPP Presence, 4 Apr 2001
[14] Phone conversation between CNA RADM McCaffree andCOMSC PM-1D, 28 Aug 2002
[15] Commander Military Sealift Command, PM-1D, Memoran-dum: CLF Employment Timelines, Unclassified, 24 Oct 2001
[16] Burnham C. McCaffree Jr. and Wendy R. Trickey, Report oftrip to CINCPACFLT headquarters the week of March 19, Unclassi-fied, 3 Apr 2001 (CNA Memorandum D0003378.A1)
[17] Combat Logistics Force Senior Leadership Conference,TAKE Program Update (Brief), May 2002
[18] Phone conversation between OPNAV N424 and CNARADM B.C. McCaffree, Feb 2002
[19] OPNAV N42 Ships And Aircraft Data Tables (SASDT) input:FL37 Changes to PE: 020441N Underway ReplenishmentShips, Unclassified, Feb 2002
56

List of figures
Figure 1. Notional maintenance schedule for an MSC ship . . 15
Figure 2. Number of CLF ships from FY 2003 through 2009 . 35
Figure 3. Number of CLF ships from FY 2010 to 2020 . . . . . 36
Figure 4. How well CLF ships meet presence requirement from 2010 to 2020 . . . . . . . . . . . . . . . . . . . 37
Figure 5. LANTFLT timeline for Alternative I . . . . . . . . . 43
Figure 6. PACFLT timeline for Alternative I . . . . . . . . . . 46
Figure 7. LANTFLT timeline for Alternative II . . . . . . . . . 49
Figure 8. PACFLT timeline for Alternative II . . . . . . . . . . 52
57


List of tables
Table 1. Alternative CLF force levels in the far-term (2016-2020) . . . . . . . . . . . . . . . . . . . . . . 3
Table 2. CLF presence requirements on 17 June 1997 . . . . 11
Table 3. CLF presence requirements in August 2001 . . . . . 11
Table 4. CLF future presence requirements. . . . . . . . . . 13
Table 5. Shuttle ship transit times between theaters and the distribution of the month during transit. . . . . 17
Table 6. The numbers and status of each ship type for the timeline transitioning to 12 T-AKEs (Alternative I) . . . . . . . . . . . . . . . . . . . . . 26
Table 7. The numbers and status of each ship type for the timeline transitioning to 9 T-AKEs and 4 T-AOE(X)s (Alternative II) . . . . . . . . . . . . . 32
Table 8. List of abbreviations . . . . . . . . . . . . . . . . . . 42
59


Distribution list
SNDL21A1 CINCLANTFLT NORFOLK VA
Attn: N3Attn: N41Attn: N806Attn: N83G
21A2 CINCPACFLT PEARL HARBOR HIAttn: N3Attn: N4Attn: N83
22A2 COMSEVENTHFLTAttn: CNA RepAttn: N3 Attn: N4
22A3 COMSIXTHFLTAttn: CNA RepAttn: N3Attn: N4
22A4 COMFIFTHFLTAttn: CNA RepAttn: N3Attn: N4
23B4 COMLOGFORNAVCENTAttn: N00Attn: N3Attn: N4
61

28C1 COMSERFORSIXTHFLTAttn: N00Attn: N3Attn: N4
28C2 COMLOG WESTPAC (CTF 73)Attn: N00Attn: N3Attn: N4
28J1 COMLOGRON TWOAttn: N00Attn: N3Attn: N4
41A COMSC WASHINGTON DCAttn: N00Attn: N3Attn: PM1Attn: PM12
OPNAVN4N42N424N3/N5N81N817
62