Embed Size (px)
Citation preview

Combinatorial Chemistry & High Throughput Screening, 2009, 12, 51-63 51
1386-2073/09 $55.00+.00 © 2009 Bentham Science Publishers Ltd.
Automated Planar Electrode Electrophysiology in Drug Discovery: Examples of the Use of QPatch in Basic Characterization and High Content Screening on Nav, KCa2.3, and Kv11.1 Channels
Mads P.G. Korsgaard, Dorte Strøbæk and Palle Christophersen*
NeuroSearch A/S, Pederstrupvej 93, DK 2750 Ballerup, Denmark
Abstract: Planar chip technology has strongly facilitated the progress towards fully automated electrophysiological sys-
tems that, in contrast to the traditional patch clamp technology, have the capability of parallel compound testing. The
throughput has been increased from testing below 10 compounds per day to a realized capacity approaching high through-
put levels. Many pharmaceutical companies have implemented automated planar chip electrophysiology in their drug dis-
covery process, particularly at the levels of lead optimization, secondary screening and safety testing, whereas primary
screening is generally not performed. In this review, we briefly discuss the technology and give examples from selected
NeuroSearch ion channel programs, where one of the systems, the QPatch, has been evaluated for use in lead optimization
and primary screening campaigns, where high information content was a requirement.
Keywords: Ion channels, planar electrophysiology, QPatch, hERG channels, Nav channels, SK channels.
INTRODUCTION
Ion Channels and Electrophysiology
Ion channels are membrane spanning proteins, which allow a gated, selective flow of small inorganic ions across biological membranes. Ion channels participate in diverse physiological processes, such as the electrical and chemical signaling in excitable cells, the control of cell division and migration of proliferative cells, as well as bulk transport of salt across epithelia and endothelia. Ion channels also par-ticipate in numerous pathological conditions, and mutations in ion channel genes may itself lead to ion channel diseases, so called channelopathies [1]. The pharmaceutical industry has an interest in the pharmacology of ion channels since these potentially represent attractive new drug targets, but also because drug interaction with specific ion channels may produce unacceptable off-target effects. Ion channels are, however, particularly difficult targets for drug discovery, deviating considerably from enzymes and 7-TM receptors: The process of gating imposes an all-or-none behavior on ion channels, which is fundamental for the tuning of an ion channel population to generate a particular physiological response, such as initiating and ending an action potential within a millisecond. Thus, tightly controlled (time, voltage) high resolution recordings are often an absolute requirement in order to detect the relevant drug interaction with an ion channel. Classic drug discovery disciplines like receptor binding, measurement of radioactive fluxes, and even fluo-rescent based measurements of ion fluxes or changes in membrane potentials, do therefore often not suffice.
Since the description of the improved patch clamp tech-nique [2], this technology has been viewed as the standard for characterizing the biophysics and pharmacology of ion channels: Via an electrically and mechanically tight coupling of the tip of a glass pipette ( ~ 1 M) to the cell membrane,
*Address correspondence to this author at the NeuroSearch A/S, Peder-
strupvej 93, DK 2750 Ballerup, Denmark; Tel: +45 44 60 82 22;
Fax: +45 44 60 80 00; E-mail: [email protected]
measurements of small ion channel currents is possible in both whole-cell and excised patches. However, the patch clamp technique is quite laborious and has never achieved wide-spread popularity or use as a screening method in the pharma-ceutical industry. As a consequence, ion channel drug discov-ery programs may have been abandoned due to the limited capacity for electrophysiological validation of hit substances. Thus, there has long been an urge towards making the electro-physiology more efficient and easier to perform by making the process automatic and parallel.
Patch Clamp Automation
The automation of patch clamp electrophysiology has been a gradual process reviewed in detail by Mathes [3]. A major step was the development of the EPC-9 [4,5], which was the first traditional patch clamp amplifier being 100% computer controlled, with integrated data acquisition, ex-tended automatic compensation routines and online analysis capabilities. Thus the EPC-9 was the natural platform for several 1. generation attempts towards full automation based on the classical patch clamp technology, such as the Neuro-Patch/Apatchi [6] and Autopatch systems, and updated ver-sions remain even today the amplifier of choice in the Port-a-Patch/Patchliner systems.
A very significant progress towards higher throughput electrophysiology was the re-thinking of the “rendezvous” between the cell and the measuring device. In traditional patch clamp the tip of the glass pipette is brought to the cell surface, but with the chip based solutions the cell is brought to the hole of a perforated planar substrate [7,8]. Whereas every cell chosen for patch clamp experiments is manually selected based upon its appearance in the microscope, a cell suspension is applied blindly for attachment in the chip based systems. This made the process suitable for automa-tion and parallelization, but also imposed an increased de-mand on cell quality and homogeneity of the cell suspension.
Commercial chip-based systems for automated and parallel electrophysiological recordings are now in practical use in the

52 Combinatorial Chemistry & High Throughput Screening, 2009, Vol. 12, No. 1 Korsgaard et al.
pharmaceutical industry. The 1QPatch,
2Port-a-Patch/Patch-
liner, PatchExpress and 3IonWorks
HT systems use single cell
electrophysiology aiming at medium throughput screening/ characterization with near complete preservation of the high quality of the classic patch clamp technique. IonWorks
HT also
offers cell population based electrophysiology approaching the level of genuine high-throughput screening, although on the expense of electrophysiological fidelity and flexibility.
The automatic patch clamp systems are now considered so mature in terms of throughput, stability and analysis ca-pabilities, that it is feasible to discuss their roles, not only in drug characterization/secondary screening, but also in pri-mary screening programs, where the high information con-tent of the drug/channel interaction is considered the primary output and thereby justifies the higher cost as compared to traditional assays like the FLIPR (fluorometric imaging plate reader).
In this paper we present three case stories on the use of automated planar electrophysiology: (I) Establishment of an assay for detection of state-dependent Na
+ channel inhibi-
tors; (II) Establishment of an assay for identification of posi-tive and negative gating modulators of KCa2 (a.k.a. SK) channels; and (III) Report from an ongoing screening cam-paign for identification of positive modulators of Kv11.1 (a.k.a. hERG) channels. Each case story is initiated with a short monograph on the ion channels in question.
The QPatch System
The work described was conducted with QPatch systems. The QPatch comes as a 16- and as a 48 channel version (QPatch HT) based on the same basic principle; parallel whole-cell recordings with independent voltage- and suction-control as well as compound addition. In short, the planar substrate (or chip) where the whole-cell configuration is es-tablished is embedded in a single-use device, the QPlate, which also contains the electrodes and the flow channels to deliver intra- and extracellular solutions. Both QPatch sys-tems stack the disposable QPlates and the HT-system also stacks up to twenty 96-well format compound plates. Cells for the experiments are prepared by a centrifugation/wash procedure from a stirred cell suspension placed on the plat-form. All liquid handling, including cell transfer, cell wash and compound delivery, is done by the integrated pipette robot (4 or 8 pipettes). This means that cells, QPlates and compound plates are placed on the platform according to the prepared assay and no operator intervention is needed after initiation of the job. The whole-cell recordings are based on high resistance seals (G ) and employ series resistance compensation as defined by the operator. Applications of compounds are carried out during data acquisition, which enables analysis of time-courses before and during drug ap-plication. This allows correction for run-down/run-up (see later) as well as extraction of the kinetics of channel-drug interaction, just as in standard patch clamp experiments.
1 Sophion Bioscience, Baltorpvej 154, DK 2750 Ballerup, Denmark 2 Nanion Technologies GmbH, Erzgiessereistr. 4, 80335 München, Germa-
ny 3 Molecular Devices, MDS Analytical Technologies, 1311 Orleans Avenue,
Sunnywale, CA 94089-1136, USA
CASE STORIES
Voltage-Dependent Na+ Channels
The upstroke of the neuronal as well as the cardiac action potentials is carried by Na
+ ions flowing through voltage-
gated Na+ channels (Nav channels) activated by a membrane
depolarization. The steady-state voltage-dependence is steep with only 40 mV difference between no and full activation. Even more striking is the kinetics of the activation and of the subsequent inactivation of the channel, which both occur with time constants of less than 1 ms. After repolarization of the membrane, the return of the channel to a resting closed state, from which it can be re-activated, is a slower process, lasting 10-100
th of ms. This is a physiologically important
feature that ensures unidirectional spreading of action poten-tials, but it is also the biophysical process that is strongly delayed by use-dependent blockers (see later).
Nav channels are clustered in a family with 9 members with continuous polypeptides of around 2000 amino acids constituting the functional pore-forming -subunits. This makes Nav channels a challenge to clone and express in het-erologous systems, but despite that, stable clones of all sub-types of Na
+ channels are now available and suitable for bio-
physical and pharmacological characterization. Nav channel drugs have long been utilized clinically. Local anesthetics like procaine have been known for more than 100 years, but many Nav-acting drugs, if not all, were not recognized as such prior to entrance into the clinical market. This knowl-edge arose only gradually from electrophysiological studies of neurons, and were in particular accelerated and refined by patch clamp analyses of cloned Nav channels. This reverse pharmacological engineering has high-lighted the voltage- and state-dependent mode of action (MOA) of the clinical Nav channel blockers, as well as the binding site for these compounds [9]. State-dependent blockers preferentially act on pathophysiological events like sustained depolarizations and repetitive firing that occur e.g., during ischemia and un-der epileptic discharges, leaving the physiologically acti-vated channels essentially unaltered. This renders them safe drugs in the treatment of diseases like pain, epilepsy and cardiac arrhythmia. The “use-dependency” contrasts with the specific and potent “tonic” block, exerted by pore-blockers like tetrodotoxin (TTX), which is lethal due to block of the Nav channels irrespective of their physiological setting. In general, despite the fact that Nav channels are differentially distributed between tissues and even between cellular com-partments (i.e. Nav1.2 being axonal and the other brain types being somato-dendritic [10]), state-dependency rather than subtype selectivity has long been considered most important in the achievement of an acceptable therapeutic index. This notion was accentuated by the recognition of how function-ally as well as structurally homologous the Nav channel sub-types are: Nav1.1, 1.2, 1.3, 1.4, 1.6 and 1.7 share more than 90% sequence identity [11], and the core local anesthetic site is preserved among all subtypes. Despite the well known categorization of Nav channels in TTX-sensitive (subtypes 1.1; 1.2; 1.3; 1.4; 1.6 & 1.7), -insensitive (subtype 1.5 & 1.9), and -resistant (subtype 1.8), despite the fact that rilu-zole is somewhat selective (subtype 1.7 vs 1.8 [12]), and despite recent progress in the selectivity of Nav blockers, state-dependent Nav modulation remains a very important safety parameter in drug discovery. State-dependency is un-

Use of QPatch in Basic Characterization and High Content Screening Combinatorial Chemistry & High Throughput Screening, 2009, Vol. 12, No. 1 53
detectable unless it is measured with high time resolution (ms scale) and under good voltage clamp conditions, which means that electrophysiology is the technique of choice.
Establishing an Assay for State-Dependent Inhibition of Nav1.2a and Nav1.5a Channels
In the evaluation of the QPatch system for screening for Nav inhibitors, we first compared its capability for biophysi-cal characterization of Nav channels with manual patch clamp. Next, the basic performance with respect to pharma-cological characterization was evaluated, and finally a test protocol was defined that allows a simple read-out for state-dependent inhibition.
Two different rat Nav subtypes were employed in the evaluation, the TTX-sensitive subtype Nav1.2a, which is the dominant brain subtype, and Nav1.5a, a splice variant of the TTX-insensitive cardiac subtype. Nav1.5a lacks 53 continu-ous amino acids in the intracellular loop between domain II and III. It was cloned from a neuronal stem cell progenitor derived from rat hippocampus [13] and is also expressed in
intact brain tissue. Apart from being differentially sensitive towards TTX, these channels also differ in their biophysics of activation and inactivation, hence also in their susceptibil-ity towards state-dependent block.
Fig. (1) shows representative current traces (left panels) as well as average peak current voltage (IV) curves (right panels) for the two subtypes. The kinetics of activation and inactivation was significantly slower for Nav1.5a than for Nav1.2a in accordance with previous experiments [14]. For both channels a gradual increase in both activation and inac-tivation rates is obtained with increasing depolarization, re-sulting in an earlier peak current. The I-V curves show the difference in steady-state voltage-dependency with the threshold for activation of Nav1.5a being approximately 20 mV more negative than for Nav1.2, in line with manual patch clamp results [13,15]. For both channels, the peak-currents gradually increased during the range of negative potentials where the channels become more and more activated and then gradually decreased at the positive potentials where Nav channels are fully activated, but where the driving force on
Fig. (1). Differential IV-characteristics of rNav1.2a and rNav1.5a. Two HEK293 cell lines stably expressing rNav1.2a or rNav1.5a were
cultured in T175 flasks with standard growth medium at 37°C and 5% CO2. On the day of experiment cells were harvested by trypsin treat-
ment and suspended in serum free medium. The suspension was adjusted to a cell density of 3•106/mL and transferred to the stirrer on the
QPatch platform and allowed to adapt 15-30 min prior to initiation of the experiment. Extracellular saline for both subtypes was constituted
as (in mM): 140 NaCl, 4 KCl, 2 CaCl2, 1 MgCl2 and 10 HEPES, pH 7.4 with NaOH. 20 mM sucrose was added to raise the osmolarity to
app. 310 mOsm. The intracellular saline (IS) was: 100 CsCl, 20 CsF, 10 EGTA, 4 Mg2Cl & 10 HEPES, pH 7.2 with HCl. The presence of F-
intracellularly was empirically noted to improve both seal rate and resistance. (A) IV characteristics of rNav1.2a: The left panel shows the
voltage protocol - from a holding potential of -90 mV the cells were depolarized in steps of 10 mV for 20 ms every 10 s - and the resulting
current traces superimposed. The right panel shows the normalized, average peak Na+ currents (n = 8) plotted versus the depolarizing poten-
tial. (B) The corresponding experiments performed with rNav1.5a. (n = 8). Error bars are SEM. All traces were compensated for capacitance
and series resistance.

54 Combinatorial Chemistry & High Throughput Screening, 2009, Vol. 12, No. 1 Korsgaard et al.
the Na+ ion decreases. In conclusion, the overall biophysical
activation/inactivation kinetics by the two channels is faith-fully reported by the QPatch system, indicating that possible system specific concerns is not prohibitive for performance of high-quality voltage clamp studies. It is important to stress, however, that QPatch recordings are sensitive to all known confounding factors known from manual patch clamp, such as large currents, large cells, imperfect cell geometries, high series resistance, etc.
The TTX-sensitivities were measured on the two sub-types as shown in Fig. (2). The channels were activated by recurrent voltage steps to 0 mV and increasing concentra-tions of TTX were added accumulatively to the cells. As expected, the activation/inactivating kinetics of the currents were unchanged by TTX (see traces in Fig. 2A). The peak currents have been plotted versus the concentration of TTX (Fig. 2B) and a Hill-fit revealed IC50 values of 11 nM and 1.0 M for Nav1.2a respectively Nav1.5a (the corresponding values from manual patch clamp were 9 nM and 0.9 M, data not shown). In conclusion, the overall performance of the QPatch compound handling, application system, and solution exchange on the chip allow basic pharmacological experiments to be reliably performed. Importantly, however, just as with normal patch clamp experiments, compounds with slow drug-receptor kinetics, may need long incubation times to yield genuine concentration response curves.
Fig. (3) shows recovery from inactivation experiments performed with Nav1.2a: After full inactivation by a step to 0 mV for 100 ms, the channels were allowed to recover from inactivation at -90 mV for a variable period of time before a new step to 0 mV was performed. Fig. (3A) shows the re-covery of the second peak in the control situation as well as in the presence of lidocaine. Fig. (3B) shows the relative current amplitude from the second step versus the recovery time. The time course of recovery from inactivation oc-curred, in accordance with the literature, in two phases; a fast ( fast = 2.5 ms) as well as a slow ( slow = 279 ms) with a frac-tion of fast recovery of 79%. Application of lidocaine, a pro-totype state-dependent Nav channel blocker, greatly pro-longed the time to full recovery, apparently by selectively increasing the fraction of channels recovering slowly leaving the fast fraction at 29%.
Further evaluation of this double pulse paradigm for screening for state dependency led finally to a double pulse protocol with a first depolarizing pulse of 100 ms length with 15 ms repolarization at -90 mV for recovery. Fig. (4) shows an experiment where TTX and lidocaine were added to the same cell. Whereas the tonic blocker TTX exerted propor-tionally equal block on both peaks lidocaine only blocked the current elicited by pulse 2 leaving the pulse 1 current unaltered. This protocol proved efficient in the screening for state-dependency not only of the type exerted by lidocaine but also picked up a large number of antiepileptic and neuro-protective drugs, such as lamotrigine, sipatrigine, lubeluzole, riluzole, but notably not crobenetine (data not shown).
Small Conductance Ca2+
-Activated K+ Channels
Small conductance Ca2+
-activated K+ channels (KCa2,
SK) are important regulators of neuronal excitability and timing of action potentials, and KCa2 channels expressed in
Fig. (2). Differential effects of tetrodotoxin on rNav1.2a and
rNav1.5a. Cell handling, experimental conditions and solutions
were as described in Fig. (1). (A) Currents were elicited every 10 s
by a 20 ms depolarization to 0 mV from a holding potential of -90
mV. Single current traces of rNav1.2a respectively rNav1.5a show-
ing the blocking effect of TTX added accumulatively with 4 min
recording at each concentration. Different concentration ranges
were used on the two subtypes and denoted above each trace. (B)
Quantification (n = 4) of the relative block by tetrodotoxin on
rNav1.2a ( ) and rNav1.5a ( ). The concentration responses were
fitted to a Hill-equation and yielded IC50-values and Hill-
coefficients of 11 nM and 0.97 for rNav1.2a respectively 1.1 M
and 0.90 for rNav1.5a.
peripheral non-excitable cells participate in membrane po-tential regulation [16,17]. SKCa2 channels constitute of fam-ily of three highly homologous channels, KCa2.1-2.3 (SK1-SK3) that are gated by the intracellular [Ca
2+]i via
calmodulin constitutively bound to the C-termini of the four subunits. Experiments with excised patches that allow tight

Use of QPatch in Basic Characterization and High Content Screening Combinatorial Chemistry & High Throughput Screening, 2009, Vol. 12, No. 1 55
Fig. (3). Prolonged recovery from inactivation in the presence of
lidocaine. rNav1.2a expressed in HEK293 cells was exposed to a
two pulse protocol as depicted in (A). From a holding potential of -
90 mV the cells were depolarized to 0 mV for 100 ms followed by a
repolarization to -90 mV for a variable time, ranging from 1.35 to
1343 ms (exponential expansion). The resulting traces are superim-
posed for the control (upper panel) and from the same cell in the
presence of 300 M lidocaine (lower panel). (B) The average (n =
9) of the relative current amplitude of peak 2 as a function of the
repolarization time ( t) for control ( ) and in the presence of 300
M lidocaine ( ). The solid curves represent fits of the data to a bi-
exponential function with the sum of the two fractions locked in
unity. This gave time constants for the fast and slow recovery of
(control) fast = 2.5 and slow = 279 ms with 79% in the fast fraction.
For lidocaine fast = 8.3 ms and slow = 220 ms with 29% in the fast
fraction. Error bars are SEM.
control of the [Ca2+
]i have shown identical Ca2+
-sensitivity for all subtypes with half maximal activation ([Ca
2+]0.5) of 300-
400 nM Ca2+
and a Hill coefficient of 4-6 [18-21] implicating a high Ca
2+-sensitivity in the physiological range.
Fig. (4). Two-pulse paradigm for detection of state-dependent
modulators. Experimental conditions as described in legend to Fig.
1. (A) rNav1.2a current traces elicited by a two pulse protocol in the
absence and presence of 100 nM TTX (left panel) and 300 M
lidocaine (right panel), respectively. From a holding potential of -90
mV the following pulse protocol was elicited every 10 s; a first 100
ms step (truncated to 5 ms on the figure) to 0 mV was applied, fol-
lowed by a 15 ms repolarization at -90 mV, before a second 10 ms
step to 0 mV was imposed. The tonic TTX block affected either
peak identically, whereas the state-dependent effect of lidocaine
was noted as an unaltered first peak, while the second peak was
diminished. (B) A plot of the peak currents elicited from the first
( ) and second ( ) pulses versus time. The presence of TTX and
lidocaine is indicated by the horizontal bars.
No drugs have KCa2 channels as the primary target al-though several interact with KCa2 channels, e.g., the activator riluzole [22] and the blocker fluoxetine [23]. However, modulation of KCa2 channels may be a therapeutic principle for intervention in Parkinson disease, depression, schizo-phrenia, myotonic muscular dystrophy, cerebellar ataxia, migraine, anorexia nervosa, and urinary incontinence (for a review see [17]). KCa2 channels are specifically and potently blocked by the peptide apamin that blocks the pore from the outside. Other venom peptides as well as certain positively charged organic compounds inhibit the channels by a similar mechanism and displace apamin in binding experiments [24,25]. While these pore blockers are excellent tools in the in vitro elucidation of KCa2 channel impacts on physiological processes, their physicochemical properties limit their use for in vivo studies and they are probably not drug candidates either.
The activity of KCa2 channels can be regulated by alter-ing their Ca
2+-sensitivity. Physiologically this is achieved (at
least for KCa2.2) by phosphorylation of calmodulin by the protein kinase CK2 [26], which induces a shift in the activa-tion curve towards higher [Ca
2+]i. The Ca
2+-sensitivity of
KCa2 channels can also be modulated pharmacologically. 1-
EBIO, NS309 and CyPPA are all positive modulators that shift the activation curve towards lower [Ca
2+]i and in the
presence of NS309, the most potent compound, or CyPPA,

56 Combinatorial Chemistry & High Throughput Screening, 2009, Vol. 12, No. 1 Korsgaard et al.
the first subtype selective (KCa2.3/ KCa2.2) channel activator, the [Ca
2+]0.5 value may become less than 100 nM [20]. Re-
cently, the first negative gating modulator of KCa2 channels, NS8593, was described. In contrast to the blockers, NS8593 does not displace apamin, but decreases the Ca
2+-sensitivity
and in the presence of 3 M NS8593 [Ca2+
]0.5 is increased to 1.6 M [25].
In order to detect compounds with either mode of action (MOA), the [Ca
2+]i must be controlled in a narrow band of
300-700 nM, corresponding to 14-80% of maximal activation by Ca
2+ [20]: Obviously, the effect of both pore blockers and
negative gating modifiers requires that the channels are acti-vated and, on the other hand, neither positive nor negative modulators have any effect on fully activated channels (in contrast to pore blockers). However, the resting [Ca
2+]i of e.g.,
HEK293 or CHO cells is low, probably below 100 nM, which excludes direct detection of inhibitors and furthermore only detects positive modulators that shift the Ca
2+ activation curve
prominently. Experimental activation of the channels by ap-plication of a positive modulator [27] or by elevation of [Ca
2+]i
is therefore necessary when screening on intact cells measur-ing Rb
+ flux (atomic absorption), Tl
+ flux or membrane poten-
tial changes (fluorescence) and in nystatin/amphotericin perfo-rated patches (electrophysiology). In principle, however, full characterization of compounds that modify KCa2 channel ac-tivity requires studies in the inside-out configuration, where the [Ca
2+] can be controlled and varied during the experiment.
Unfortunately such measurements are time-demanding, re-quire skilled electrophysiologists, and are not yet amenable to any high throughput format. The second best is, in our experi-ence, to perform traditional whole-cell experiments using an intracellular saline (IS) with a tightly buffered [Ca
2+]. This
allows partial control of the KCa2 channel activity, which can be kept relatively stable over time. A particularly nice oppor-tunity is probably the Port-a-Patch system, which allows ex-change of the intracellular saline during the experiment.
Establishment of a KCa2.3 Channel Assay for Com-pounds with Different MOAs
Our work in the field of KCa2 modulators has lead to the identification of pore blockers as well as negative and posi-tive gating modulators. Although primary hits for the various categories were initially identified by FLIPR technology, we addressed whether the QPatch had the potential of being a more general platform for the lead optimization of KCa2 compounds comprising different MOAs.
All studies were performed with the human isoform of KCa2.3 expressed in HEK293 cells. Partial KCa2 channel acti-vation was achieved by an intermediate [Ca
2+]i and an in-
creased Ca2+
-sensitivity induced by positive modulators is therefore reflected in an increase in current, whereas a de-creased Ca
2+-sensitivity or a pore block are measured as a de-
crease in current. Experiments were performed using a physio-logical [K
+] gradient across the cell membrane and currents
were elicited by a linear voltage ramp (-120 mV to +30 mV). Under these conditions a K
+-selective current reverses at -90
mV and a possible leak current can therefore be estimated at this potential. The gating of KCa2 channels is independent of voltage, but since the pore is blocked voltage-dependently by intracellular Mg
2+, the slightly rectifying IV curves were used
as a signature for KCa2 currents. This is illustrated in Fig. (5A)
that shows current traces obtained from voltage ramps applied in an experiment with [Ca
2+]IS buffered at 300 nM. A signifi-
cant KCa2.3 current (600 pA at 0 mV) is detectable in the con-trol trace recorded 7 min after establishment of the whole-cell configuration and application of increasing concentrations of the positive modulator NS309 induced discrete increases compared to this control current. Similar experiments were performed with varying [Ca
2+]IS and the time-courses of three
experiments are depicted in Fig. (5B). In the experiments with 300 nM and 3 M Ca
2+ the KCa2.3 current increased gradually
after breakthrough to whole-cell configuration due to equili-bration with the higher [Ca
2+]IS, whereas that was not the case
with 100 nM free Ca2+
. NS309 concentration-dependently activated the KCa2.3 current to the same maximal current level at all [Ca
2+]IS irrespective of the level of control current. As
shown in Fig. (5C) the EC50 values and Hill-slopes for NS309 activation were very sensitive to the [Ca
2+]IS, both decreasing
with increasing Ca2+
(see legend to Fig. (5)). In inside out patches KCa2.3 channels are 96% activated at 3 M Ca
2+ and a
positive modulator does not increase the activity further. However, at the [Ca
2+]IS of 3 M, the KCa2.3 channels were
only activated 38% compared to the maximal activation by NS309, which indicates that [Ca
2+]i was far below 3 M in the
vicinity of the channels. At the lowest [Ca2+
]IS of 100 nM an EC50 value of 0.87 M was found, in good agreement with inside out experiments at 200 nM Ca
2+ where the value is 0.91
M (data not shown) and also in accordance with recent find-ings in an IonWorks
HT assay (EC50 of 1-2 M; intact cells,
perforated patches) for KCa2.3 [27].
It is notable, that these NS309 concentration-responses are the first to be performed using the whole-cell configura-tion, at least in our laboratory, since in conventional whole-cell patch clamp experiments we inevitably loose the cells at high degrees of channel activation. Thus the demonstration of the EC50 value dependency on [Ca
2+]i was enabled by the
QPatch experiments. Furthermore, a gradual loss of rectifica-tion was observed at higher NS309 concentrations (Fig. 5A). These findings may well hint towards important, and as yet unresolved, mechanistic interactions between positive modu-lators and KCa2 channels.
The assay conditions described above were also usable for pore blockers and even negative modulators, due to the intermediate degree of activation of the channels. Fig. (6A) shows the time course of a concentration-response experi-ment using the negative gating modulator NS8593. The bro-ken line represents the estimated run-up of the control cur-rent during the period of NS8593 application and was used for calculation of the degree of KCa2.3 current inhibition. The average concentration-response plots for NS8593 as well as for the pore blockers apamin, UCL1684 and bicu-culline methobromide are shown in Fig. (6B). The IC50 val-ues obtained from a Hill-fit to the QPatch data were in nice agreement with manual whole-cell patch clamp data as illus-trated in Fig. (6C) that also includes data on 7 other negative modulators. The IC50 value of 187 nM found in this study compares well with the whole-cell value of 90 nM published previously [25]. Given that the potency of NS8593 decreases from 0.47 M to 14 M when [Ca
2+]i is increased from 300
nM to 10 M in inside-out patches [25] the [Ca2+
]i in the vicinity of the channels were considerably lower than 300 nM.

Use of QPatch in Basic Characterization and High Content Screening Combinatorial Chemistry & High Throughput Screening, 2009, Vol. 12, No. 1 57
Fig. (5). Effects of NS309, a positive gating modifier on whole-cell hKCa2.3 currents, measured at different [Ca2+
]IS. The HEK293 cell
line stably expressing hKCa2.3 channels was cultured in T175 flasks with standard growth medium at 37°C and 5% CO2. The cells were har-
vested by trypsin or detachin treatment, suspended in serum free medium, and adjusted to a cell density of 3-5•106/mL before they were
transferred to the stirrer on the QPatch platform. After a typical residence time of 15-45 min the first experiment was initiated. The extracel-
lular saline consisted of (in mM): 144 NaCl, 4 KCl, 2 CaCl2, 1 MgCl2 and 10 HEPES, pH 7.4 with NaOH. After establishment of the whole-
cell configuration a modified extracellular saline with 0.1 mM CaCl2 and 3 mM MgCl2 was used. The ISs all contained 154 mM KCl and 10
mM HEPES as well as 10 mM of a Ca2+
chelator (EGTA or a combination of EGTA and NTA). CaCl2 and MgCl2 were added to give the
specified free concentration of Ca2+
and 1 mM free Mg2+
. pH was adjusted to 7.2 with KOH or HCl. (A) The IV-relationships obtained from
linear voltage ramps (from -120 mV to 30 mV in 150 ms) before (Control) and during application of NS309 in the concentrations listed at the
various traces (the unlabelled trace in between Control and 37 nM is 12 nM). The [Ca2+
]IS was buffered at 300 nM. The left arrow-head indi-
cates the K+ reversal potential (-90 mV) where leak currents were assessed and the right arrow-head specifies the point (0 mV) where the
KCa2.3 specific currents were measured. 0 mV was chosen since that is the reversal potential for any unselective leak conductance and a po-
tential where a negligible contribution from the endogenous voltage-dependent K+ current is present (B) The time courses of three experi-
ments with [Ca2+
]IS = 100 nM ( ), 300 nM ( ) and 3 M free Ca2+
( ), respectively. KCa2.3 currents were measured every 6 s and 7-8 min
after the whole-cell configurations were obtained NS309 was applied extracellularly to each cell in accumulating concentrations: 12 nM, 37
nM, 110 nM, 330 nM, 1 M, and 3 M. (Note that application periods do not align perfectly between experiments). Each concentration of
NS309 was present for at least 1 min. (C) KCa2.3 current, in percentage of the maximal current obtained by application of 3 M NS309, is
plotted as a function of the NS309 concentration. The KCa2.3 currents were obtained with 100 nM ( ), 300 nM ( ), 400 nM ( ), and 3 M
( ) free Ca2+
in the IS. The solid curves represent the best fits to Hill-type equations and the EC50 (nM) values and Hill coefficients obtained
were: 870 and 2.1 at 100 nM Ca2+
, 150 and 1.9 at 300 nM Ca2+
, 70 and 1.3 at 400 nM Ca2+
, and 50 nM and 1.4 at 3 M Ca2+
. The closed
symbols indicate the currents measured before the first application of NS309 and under these control conditions the relative degree of activa-
tion was 1.4 ± 0.37% (n = 2) in 100 nM; 5.1 ± 0.7% (n = 3) in 300 nM; 38 ± 5% (n = 3) in 400 nM; and 37 ± 7.6% (n = 3) in 3 M Ca2+
.
Error bars are SEM.

58 Combinatorial Chemistry & High Throughput Screening, 2009, Vol. 12, No. 1 Korsgaard et al.
The data indicates that the obtained [Ca2+
]i is lower than [Ca
2+]IS. The observation is equivalent to observations from
manual patch clamp and may be due to strongly competing cellular Ca
2+ buffering (or transport) mechanisms. However,
this is not prohibitive for obtaining intermediate channel activation and hence we conclude that the QPatch system provides the basic electrophysiological qualities required for a lead optimization program on KCa2 channels irrespective of the desired MOA.
Kv11.1 Channels
hERG (human ether-à-go-go-related gene) encodes the ion channel Kv11.1 that mediates the rapid delayed rectifier
potassium current known as I(Kr) in the heart. In contrast to the slow delayed rectifier (I(Ks) which is carried through Kv7.1/minK channels) and ultra rapid potassium conductance (I(Kur) which is carried through Kv1.5 channels), the kinetics of the Kv11.1 channel is characterized by fast activation with even faster inactivation occurring simultaneously resulting in only a small current during the plateau phase of the cardiac action potential [28]. In the re-polarizing phase, however, the channel transition from the inactivated to the closed state goes via the open channel state followed by deactivation to the closed channel, and this gives rise to a transient outward current. Together with Kv7.1/minK the Kv11.1 channel con-stitute most of the repolarization reserve of the heart. Since
Fig. (6). Effects of negative gating modifiers as well as pore blockers on whole-cell hKCa2.3 currents. The QPatch assay and hKCa2.3
cell line was as described in legend to Fig. (5). (A) hKCa2.3 current measured at 0 mV from voltage ramps as a function of time. The [Ca2+
]IS
was buffered at 400 nM and the negative gating modifier NS8593 was present in the extracellular saline in the concentrations listed during
the periods indicated at the horizontal bar. The broken line indicates the estimated degree of current run-up during the experiments and the
inhibition by NS8593 was calculated relative to this baseline. (B) hKCa2.3 current, in percentage of the baseline current, is plotted as a func-
tion of the concentration of various inhibitors. The data points were obtained from concentration response experiments like that illustrated in
(A). NS8593 ( , n = 8), and the pore blockers apamin ( , n = 3), UCL1684 ( , n = 2), and bicuculline methobromide ( , n = 9) were tested.
The solid lines are the fits to Hill-type equations and the IC50 values and Hill coefficients were: 0.2 nM and 1.1 for apamin, 3.0 nM and 0.67
for UCL1684, 187 nM and 0.84 for NS8593, and 8.9 M and 0.85 for bicuculline methobromide. Error bars are SEM. (C) Comparison of the
potency obtained for apamin, UCL1684, bicuculline methobromide as well as 7 negative modulators in patch clamp and in QPatch experi-
ments. The solid line illustrates unity.

Use of QPatch in Basic Characterization and High Content Screening Combinatorial Chemistry & High Throughput Screening, 2009, Vol. 12, No. 1 59
the 1990’ies it has been known that inhibition of Kv11.1 channels could lead to serious side effects arising from pro-longation of the QT interval in the ECG [29]. The Kv11.1 channel can be characterized as pharmacologically promis-cuous since, in addition to the class III anti-arrhythmics, a wide range of therapeutically unrelated drugs including anti-histamines and antipsychotics block the channel [30]. Test-ing for Kv11.1 channel inhibition is implemented in drug discovery in many if not all pharmaceutical companies and this need for early stage in vitro safety screening, has been the single most significant driver for the development of automated patch clamp electrophysiology.
Activators of Kv11.1 constitute an entirely new opportu-nity for treating the long QT syndrome and has been sug-gested to be an effective new approach to control certain kinds of cardiac arrhythmias [31]. Positive modulators of Kv11.1 channels exerting different profiles have recently been described. RPR260243 slows deactivation and decrease inactivation kinetics [32], NS3623 and NS1643 also decrease inactivation kinetics [33,34], whereas PD-11087 induces an uniform increase in currents in all states [35]. Although the site(s) for the activators has not been definitively settled, non-inactivating Kv11.1 mutants are generally insensitive towards the effects of the activators and mutagenesis studies have recently revealed distinct molecular determinants for the gating effects of RPR260243 [36].
The unusual and specific voltage-dependency of the Kv11.1 channel is suited for effective cardiac repolarization, without much K
+ loss at the plateau phase. In order to avoid
repolarization during the plateau phase, clinically useful positive modulators of Kv11.1 should preferentially, if not exclusively, affect the deactivation kinetics. Therefore, even though Kv11.1 channels may be an excellent molecular target for the development of new anti arrhythmic drugs, it is only so in the context of a very specific MOA of the active sub-stance. Since these subtle effects cannot be revealed neither by binding nor by fluorescence based assays, the search for positive modulators of Kv11.1 channels represent an excel-lent example of the need for high-content primary electro-physiological screening.
Primary Screening for Kv11.1 Activators
We decided to commence on a screening for positive Kv11.1 modulators with our QPatch HT platform. We used the Kv11.1 expressing HEK293 cell line, which has been used for safety studies at NeuroSearch during the last 7 years and from which we therefore have a comprehensive refer-ence data base concerning both basic electrophysiology and drug effects. The basic validation on QPatch revealed that the cells entering the whole-cell configuration, tended to fall into two categories; those that were fragile and lost within minutes (before compound additions) and those that lasted until the limit of the QPlate waste reservoir were reached after 12 compound additions. Furthermore, control experi-ments showed essentially identical electrophysiological be-havior of the Kv11.1 channel recorded in the QPatch system compared to the manual patch clamp.
We settled on the final screening paradigm after a couple of validation rounds with designed compound plates contain-ing known active (blockers and activators) and inactive sub-stances. Different compounds were added sequentially to the
same cell with 3 wash periods separating each addition. Fur-thermore, each compound was tested in quadruplicates, with the experimental software ensuring that individual com-pounds were applied to different cells, and that the order of additions were randomized with respect to time after estab-lishment of the whole-cell configuration. The quadruplicate test paradigm was chosen to avoid that prior addition of a high-affinity Kv11.1 blocker (low off-rate) would mask the effect of the subsequent testing of a possible activator on the same cell. This scenario increased the likelihood of having all compounds tested at least once embraced by inactive compounds. Furthermore, as a running test for pharmacol-ogical sensitivity during the screening, a reference Kv11.1 blocker (verapamil) and a reference activator (proprietary NeuroSearch compound) were included on each compound plate. The vast number of compounds and the desire for n 4 meant that the number of experiments by far exceeded what can be manually evaluated. Consequently, careful as-sessment of each experiment was not practical and a swap onto increasingly relying on systematic filtering opportuni-ties offered by the QPatch software was adopted although this paradigm shift was not followed rigorously.
Fig. (7A) shows representative current traces obtained with the reference activator (Cmpd A) in 10 M as well as with verapamil in 1 M and their respective controls. Fig. (7B) shows the fractional increases by Cmpd A respectively decreases by verapamil (control = 1) from the individual experiments as they have occurred during the screen. The averages obtained with the two compounds during the screening of the first 4500 compounds are depicted by the bars in Fig. (7C) with the Cmpd A giving 31% increase and verapamil 44% decrease in the tail current. The chosen test concentrations for Cmpd A and verapamil were close to their EC50/IC50 values (data not shown) and the average effects were thus as expected. However, inspection of Fig. (7B) re-veals drop-outs for both verapamil and Cmpd A, which is sometimes registered as a blocker. We were not able to pin-point whether the causes of these irregularities were human, technical or biological in nature. However, the data illustrate the value of testing positive controls blindly at least at the beginning of a screening campaign. In the continuation, we focus on increasing the stability of the assay further.
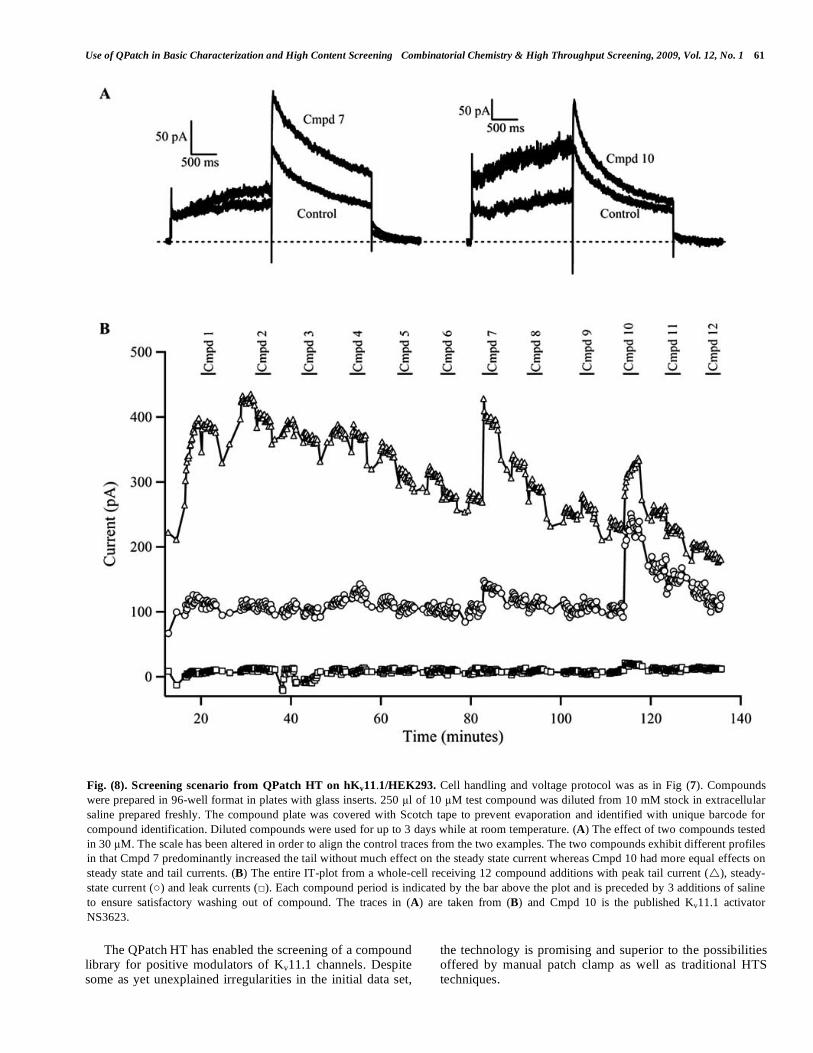
Fig. (8) shows an example of recordings obtained from a single cell during the screening campaign with the current traces obtained with two hits, Cmpd 7 and NS3623 (denoted Cmpd 10) shown in (A) and a plot of, mentioned from the top, the peak tail current, the steady-state current and the leak current versus time in (B). Despite a clear tendency to-wards a specific run-down of the Kv11.1 currents over time observed in the long lasting experiments, Kv11.1 retained its electrophysiological characteristics (Fig. 8A) and pharma-cological sensitivity for more than 2 h. Clearly, the chosen screening scenario also allows the identification of different MOAs, e.g., Cmpd 7 more pronouncedly affects tail current amplitude than sustained current. Furthermore, reversibility of both compounds was immediately appreciated.
The overall success rate for this particular screening campaign was app. 43% of the trials ending with a whole-cell recording. Fig. (9) shows an analysis of the different stages of progress: More than 90% of sites were successfully primed with intracellular and extracellular liquid with the

60 Combinatorial Chemistry & High Throughput Screening, 2009, Vol. 12, No. 1 Korsgaard et al.
resistance of the prepared chip of 2 M . n 79% of all cases a cell was positioned successfully on the chip and in 58% the primary seal criterion (100 M ) was reached. 32% of the 48 sites were genuine giga-seals and finally 43% possible sites were whole-cells. Note that even cells having lower seal re-sistances often entered into the whole-cell configuration, and although there was a tendency towards a correlation between
high giga-seal values and quality/duration of the subsequent experiment, this was not absolute and did not warrant the exclusion of lower resistance seals. Overall, an average of 137 compounds was tested per QPlate amounting to a de facto throughput of approximately 700 compounds tested per day when repetitions are included.
Fig. (7). Validation of QPatch HT screen with activator as well as inhibitor of hKv11.1 current. Cells were cultured and suspended as
described in Fig. (1) but two T175 flasks were harvested with detachin that decreases HEK cells tendency to aggregate compared to trypsin
treated cells. Extracellular saline was constituted as (in mM): 145 NaCl, 4 KCl, 2 CaCl2, 1 MgCl2 and 10 HEPES, pH 7.4 with NaOH. 20
mM sucrose was added to raise the osmolarity to app. 310 mOsm. The IS was: 120 KCl, 10 EGTA, 1.75 MgCl2, 5.374 CaCl2 and 10 HEPES,
pH 7.2 with HCl. Also, 10 mM glucose was added to the extracellular and 4 mM ATP was added to the IS. After whole-cell configuration
was established the voltage protocol was elicited every 10 s; from a holding potential of -80 mV a short step of 20 ms at -50 mV made off-
line leak subtraction possible. Activation of the channel was done by the subsequent step to +20 mV for 2 s followed by a step back to -50
mV to obtain the tail current that decayed until it was terminated after 2 s by stepping back to the holding potential. (A) The effect of 10 M
NeuroSearch proprietary Cmpd A (left traces) that activate the hKv11.1 current and 1 M verapamil (right traces) that decrease the current.
(B) The analyses of the relative effect on the tail current, control = 1, on Cmpd A ( , n = 156) and verapamil ( , n = 149). (C) The mean
effect from the experiments shown in (B) yielded 1.31 ± 0.03 and 0.56 ± 0.02 for Cmpd A respectively verapamil. Error bars are SEM.
Use of QPatch in Basic Characterization and High Content Screening Combinatorial Chemistry & High Throughput Screening, 2009, Vol. 12, No. 1 61
The QPatch HT has enabled the screening of a compound
library for positive modulators of Kv11.1 channels. Despite some as yet unexplained irregularities in the initial data set,
the technology is promising and superior to the possibilities offered by manual patch clamp as well as traditional HTS techniques.
Fig. (8). Screening scenario from QPatch HT on hKv11.1/HEK293. Cell handling and voltage protocol was as in Fig (7). Compounds
were prepared in 96-well format in plates with glass inserts. 250 l of 10 M test compound was diluted from 10 mM stock in extracellular
saline prepared freshly. The compound plate was covered with Scotch tape to prevent evaporation and identified with unique barcode for
compound identification. Diluted compounds were used for up to 3 days while at room temperature. (A) The effect of two compounds tested
in 30 M. The scale has been altered in order to align the control traces from the two examples. The two compounds exhibit different profiles
in that Cmpd 7 predominantly increased the tail without much effect on the steady state current whereas Cmpd 10 had more equal effects on
steady state and tail currents. (B) The entire IT-plot from a whole-cell receiving 12 compound additions with peak tail current ( ), steady-
state current ( ) and leak currents ( ). Each compound period is indicated by the bar above the plot and is preceded by 3 additions of saline
to ensure satisfactory washing out of compound. The traces in (A) are taken from (B) and Cmpd 10 is the published Kv11.1 activator
NS3623.

62 Combinatorial Chemistry & High Throughput Screening, 2009, Vol. 12, No. 1 Korsgaard et al.
Fig. (9). Success rates in the hKv11.1/HEK293 screening cam-
paign. The chronology of events on the QPlate leading to the
whole-cell configuration is shown from left to right. The QPlate
holds 48 measuring sites and all rates given are out of 48 possible.
First the QPlate is primed with intra- and extracellular solutions and
the resistance on the primed plate is evaluated ( 2 M ), which was
reached in 90% of the cases. Next cells prepared by the QPatch in a
final density of 6•106/mL is added to the plate and a successful
positioning means that the initial chip resistance has raised more
than 750%. This was achieved with a rate of 79%. Seal achieve-
ment is set by the operator, in this case 100 M , whereas Giga-seal
is the fraction of 1 G or better seals and these were reached with
58% and 32% respectively. Finally the whole-cell configuration is
established and detected by the appearance of capacitance spikes
with an overall rate of 43%.
NeuroSearch proprietary Cmpd A, used as positive modulator of Kv11.1 channels gave some “drop-outs” in its effects as shown in Fig. (7). It is now evident to us that Cmpd A is very unstable at room temperature and breaks down in few days. Furthermore, the decomposed substance has been found to block Kv11.1 channels and this is the most likely explanation for the drop-outs during the screening campaign described herein. In the remaining screening we have only used Compd A prepared from dry compound on the same day.
CONCLUSIONS
Ion channel pharmacology is complicated and spans a wide range of mechanisms related to both ion permeation and gating processes. Often the most useful drugs are not the most potent binders, but the compounds having a distinct modulatory MOA allowing a slightly changed ion channel response towards pathophysiological or even normal physio-logical stimuli.
Automated planar chip electrophysiology represents a hitherto unprecedented possibility for the design of dedicated high-information content screening programs for the detec-tion of ion channel modulators. In the present paper, we have selected three case stories, where the technology, represented by the QPatch system, has been evaluated for the detection of substances with a predefined, mandatory mode of action,
namely state-dependent Nav-inhibitors, positive and negative modulators of KCa2.3 channels, and positive modulators of Kv11.1 channels. For all three channel types, that each repre-sents particular experimental challenges, the QPatch offers experimental flexibility and yield data quality that compares with the ones obtainable with traditional whole cell patch clamp. Furthermore, the system has consistently provided stable detection of compounds with the required MOAs.
We conclude, that planar electrophysiology is a valuable technology in lead optimization- and secondary screening programs. In some cases, compounds with the desired MOA may be undetectable due to limited resolution and experi-mental control of traditional HTS methods. In such cases planar electrode electrophysiology, as the QPatch HT or the IonWorks
HT (or for special applications, requiring intracellu-
lar saline exchange, the Port-a-Patch system), may become the technology of choice, even for primary screening cam-paigns. This may become yet more realistic with further in-creases in capacity and lowered price of the disposable parts of these systems.
ACKNOWLEDGEMENTS
Thanks to Peter Buhl, Jette Sonne and Anne Stryhn Me-incke for their assistance in cell culturing and conduction of QPatch experiments. The KCa2.3/HEK293 cell line was a kind gift from GlaxoSmithKline, Stevenage, UK.
CONFLICT OF INTEREST
Sophion Bioscience A/S is an affiliate of NeuroSearch A/S.
ABBREVIATIONS
[Ca2+
]i = Intracellular calcium concentration
[Ca2+
]IS = Free calcium concentration in the intracellular saline
CHO = Chinese hamster ovary
Cmpd = Compound
CyPPA = Cyclohexyl-[2-(3,5-dimethyl-pyrazol-1-yl)-6- methyl-pyrimidin-4-yl]-amine
ECG = Electrocardiogram
FLIPR = Fluorometric imaging plate reader
HEK = Human embryonic kidney
hERG = Human ether-a-go-go related gene
IK = Intermediate conductance calcium-activated potassium channel
IS = Intracellular saline
IV = Current voltage
KCa2.3 = Small conductance calcium-activated potas- sium channel type 3, a.k.a SK3
KV11.1 = Voltage-dependent potassium channel type 11.1 a.k.a hERG channel
MOA = Mode-of-action
NS309 = 6,7-Dichloro-1H-indole-2,3-dione 3-oxime

Use of QPatch in Basic Characterization and High Content Screening Combinatorial Chemistry & High Throughput Screening, 2009, Vol. 12, No. 1 63
NS8593 = (R)-N-(benzimidazol-2-yl)-1,2,3,4-tetrahydro- 1-naphtylamine
NS3623 = N-(4-bromo-2-(1H-tetrazol-5-yl)-phenyl)-N'- (3'-trifluoromethylphenyl)urea
Nav = Voltage-dependent sodium channels
SK = Small conductance calcium-activated potassium channel
TTX = Tetrodotoxin
UCL1684 = 6,10-Diaza-3(1,3),8(1,4)-dibenzena-1,5(1,4)- diquinolinacyclodecaphane
REFERENCES
[1] Ashcroft, F.M. Ion channels and disease, Academic Press: 1999. [2] Hamill, O.P.; Marty, A.; Neher, E.; Sakmann, B.; Sigworth, F.J.
Pflugers Arch., 1981, 391, 85. [3] Mathes, C. Expert. Opin. Ther. Targets., 2006, 10, 319.
[4] Sigworth, F.J.; Affolter, H.; Neher, E. J. Neurosci. Methods, 1995, 56, 203.
[5] Sigworth, F.J. J. Neurosci. Methods., 1995, 56, ES. [6] Asmild, M.; Oswald, N.; Krzywkowski, K.M.; Friis, S.; Jacobsen,
R.B.; Reuter, D.; Taboryski, R.; Kutchinsky, J.; Vestergaard, R.K.; Schroder, R.L.; Sorensen, C.B.; Bech, M.; Korsgaard, M.P.; Wil-
lumsen, N.J. Receptors Channels, 2003, 9, 49. [7] Sigworth, F.J.; Klemic, K.G. Biophys. J., 2002, 82, 2831.
[8] Wood, C.; Williams, C.; Waldron, G.J. Drug Discov. Today., 2004, 9, 434.
[9] Yarov-Yarovoy, V.; McPhee, J.C.; Idsvoog, D.; Pate, C.; Scheuer, T.; Catterall, W.A. J. Biol. Chem., 2002, 277, 35393.
[10] Westenbroek, R.E.; Merrick, D.K.; Catterall, W.A. Neuron, 1989, 3, 695.
[11] Hille, B. Ion Channels of Excitable Membranes, Sinauer Associ-ates, Inc: Sunderland, MA 2001.
[12] Song, J.H.; Huang, C.S.; Nagata, K.; Yeh, J.Z.; Narahashi, T. J. Pharmacol. Exp. Ther., 1997, 282, 707.
[13] Korsgaard, M.P.G.; Christophersen, P.; Ahring, P.K.; Olesen, S.P. Pflugers Arch., 2001, 443, 18.
[14] Qu, Y.; Rogers, J.; Tanada, T.; Scheuer, T.; Catterall, W.A. Proc. Natl. Acad. Sci. USA, 1995, 92, 11839.
[15] Xie, X.; Dale, T.J.; John, V.H.; Cater, H.L.; Peakman, T.C.; Clare, J.J. Pflugers Arch., 2001, 441, 425.
[16] Stocker, M. Nat. Rev. Neurosci., 2004, 5, 758.
[17] Wulff, H.; Kolski-Andreaco, A.; Sankaranarayanan, A.; Sabatier,
J.M.; Shakkottai, V. Curr. Med. Chem., 2007, 14, 1437. [18] Kohler, M.; Hirschberg, B.; Bond, C.T.; Kinzie, J.M.; Marrion,
N.V.; Maylie, J.; Adelman, J.P. Science, 1996, 273, 1709. [19] Xia, X.M.; Fakler, B.; Rivard, A.; Wayman, G.; Johnson-Pais, T.;
Keen, J.E.; Ishii, T.; Hirschberg, B.; Bond, C.T.; Lutsenko, S.; Maylie, J.; Adelman, J.P. Nature, 1998, 395, 503.
[20] Hougaard, C.; Eriksen, B.L.; Jorgensen, S.; Johansen, T.H.; Dy-hring, T.; Madsen, L.S.; Strobaek, D.; Christophersen, P. Br. J.
Pharmacol., 2007, 151, 655. [21] Pedarzani, P.; Mosbacher, J.; Rivard, A.; Cingolani, L.A.; Oliver,
D.; Stocker, M.; Adelman, J.P.; Fakler, B. J. Biol. Chem., 2001, 276, 9762.
[22] Grunnet, M.; Jespersen, T.; Angelo, K.; Frokjaer-Jensen, C.; Klaerke, D.A.; Olesen, S.P.; Jensen, B.S. Neuropharmacology,
2001, 40, 879. [23] Terstappen, G.C.; Pellacani, A.; Aldegheri, L.; Graziani, F.; Carig-
nani, C.; Pula, G.; Virginio, C. Neurosci. Lett., 2003, 346, 85. [24] Finlayson, K.; McLuckie, J.; Hern, J.; Aramori, I.; Olverman, H.J.;
Kelly, J.S. Neuropharmacology, 2001, 41, 341. [25] Strobaek, D.; Hougaard, C.; Johansen, T.H.; Sorensen, U.S.; Niel-
sen, E.O.; Nielsen, K.S.; Taylor, R.D.; Pedarzani, P.; Christo-phersen, P. Mol. Pharmacol., 2006, 70, 1771.
[26] Bildl, W.; Strassmaier, T.; Thurm, H.; Andersen, J.; Eble, S.; Oliver, D.; Knipper, M.; Mann, M.; Schulte, U.; Adelman, J.P.;
Fakler, B. Neuron, 2004, 43, 847. [27] John, V.H.; Dale, T.J.; Hollands, E.C.; Chen, M.X.; Partington, L.;
Downie, D.L.; Meadows, H.J.; Trezise, D.J. J. Biomol. Screen., 2007, 12, 50.
[28] Roden, D.M.;George, A.L., Jr. Annu. Rev. Med., 1996, 47, 135. [29] Sanguinetti, M.C.;Tristani-Firouzi, M. Nature, 2006, 440, 463.
[30] Haverkamp, W.; Breithardt, G.; Camm, A.J.; Janse, M.J.; Rosen, M.R.; Antzelevitch, C.; Escande, D.; Franz, M.; Malik, M.; Moss,
A.; Shah, R. Cardiovasc. Res., 2000, 47, 219. [31] Hansen, R.S.; Olesen, S.P.; Grunnet, M. J. Pharmacol. Exp. Ther.,
2007, 321, 996. [32] Kang, J.; Chen, X.L.; Wang, H.; Ji, J.; Cheng, H.; Incardona, J.;
Reynolds, W.; Viviani, F.; Tabart, M.; Rampe, D. Mol. Pharma-col., 2005, 67, 827.
[33] Casis, O.; Olesen, S.P.; Sanguinetti, M.C. Mol. Pharmacol., 2006, 69, 658.
[34] Hansen, R.S.; Diness, T.G.; Christ, T.; Wettwer, E.; Ravens, U.; Olesen, S.P.; Grunnet, M. Mol. Pharmacol., 2006, 70, 1319.
[35] Zhou, J.; ugelli-Szafran, C.E.; Bradley, J.A.; Chen, X.; Koci, B.J.; Volberg, W.A.; Sun, Z.; Cordes, J.S. Mol. Pharmacol., 2005, 68,
876. [36] Perry, M.; Sachse, F.B.; Sanguinetti, M.C. Proc. Natl. Acad. Sci.
USA, 2007, 104, 13827.
Received: November 27, 2007 Revised: December 17, 2007 Accepted: December 17, 2007