Embed Size (px)
Citation preview

155
Combined ANFIS-Dijkstra’s Model: A Dynamic
Simulation for Suburban Public Transportation
Nazanin Pilevari 1, Maryam Rahmaty 2, Mohammad Shokouhifar 3 +
1 Department of Industrial Management, West Tehran Branch, Islamic Azad
University, Tehran, Iran 2 Department of Management, Chalous Branch, Islamic Azad University, Chalous,
Iran 3 Department of Electrical and Computer Engineering, Shahid Beheshti University,
Tehran, Iran [email protected].
Abstract. This paper presents a dynamic simulation based on a combination of
Adaptive Neuro-Fuzzy Inference System (ANFIS) and Dijkstra’s algorithm
(named ANFIS-Dijkstra’s model), to design and simulate a dynamic suburban
public transportation system in Iran. To evaluate the proposed suburban public
transportation system, two simulation methods related to the current system and
the proposed ANFIS-Dijkstra’s model are designed and implemented. To make
the simulator closer to the reality, a machine learning technique based on ANFIS
is used for route traffic estimation, while and Fuzzy C-Means (FCM) clustering
algorithm is utilized to determine the number of passengers. Then, Dijkstra's
algorithm is applied for the optimal routing of passengers from the source to the
destination. Finally, the results of the two simulation models are compared to
justify the performance of the proposed ANFIS-Dijkstra’s model. Based on the
results, the rate of using bus compared to taxi increased by 8.2%, the rate of using
bus capacity increased by 12.66%, and the total fare paid by passengers decreased.
Keywords: Suburban transportation, Dynamic systems, Dijkstra's algorithm,
Fuzzy C-Means (FCM), Adaptive Neuro-Fuzzy Inference System (ANFIS).
ISSN 1816-6075 (Print), 1818-0523 (Online)
Journal of System and Management Sciences
Vol. 11 (2021) No. 1, pp. 155-175
DOI:10.33168/JSMS.2021.0110

Pilevari et al. / Journal of System and Management Sciences Vol. 11 (2021) No. 1, pp. 155-175
156
1. Introduction
Transportation systems are inseparable parts of the economy. The social and
economic health of an area highly depends on the performance of its transportation
system. The transportation system not only facilitates mobility, but also affects the
growth patterns and level of economic activity in the long term through access to
different areas (Li and DaCosta, 2013). Due to the importance of the transportation
systems in economy, industry, politics, and even the military, many experts consider
transportation as the basis of sustainable development and believe that the
development becomes more inclusive when transportation is more efficient. In other
words, any movement should have most efficiency in terms of cost-benefit and
environmental friendliness. On the contrary, inefficiency of the transportation
system may lead to serious environmental consequences such as air pollution,
negative social and economic consequences and cause the inefficiency of
performance in cities.
In recent years, the need for transportation has increased along with economic
growth and development. Consequently, complications such as increased energy
consumption and environmental pollution intensity occur with the expansion of
transportation activities (Hutchison 2010). During the last forty years, the trend of
transportation activities around the world indicates growth in the level of car
dependence and change in social lifestyle, leading to increase in sensitivity to
environmental impacts and its reflections in health. The importance of
transportation planning has been highlighted because of the highly critical role of
transportation in everyday life and the disability of transportation routes to accept
any volume of traffic, as well as the need to prevent accidents. On the other hand,
transportation planning is impossible without road traffic information.
Transportation will not improve in developing countries under the current pattern of
transportation and pressures due to the rapid economic growth. Thus, the increase of
congestion, pollution, negative effects on health, and energy consumption are
expected. Based on the World Health Organization (WHO) report in 2004, road
accidents with more than two million deaths per year would be the fifth leading
cause of death in 2030. In addition, International Energy Agency (IEA) estimated in
2010 that energy consumption in the transportation sector would increase up to 50%
by 2030 and 80% by 2050 under the current conditions (Hidalgo and Huizenga
2013).
Significance of suburban transportation systems as the most important symbol
and the most basic prerequisite for development in any country is obvious.
Currently, some suburban public vehicles pass between cities with empty seats on a
daily basis. Nevertheless, many travelers fail to receive tickets to their desired
destination at the right time. As a result, they would pay high fares for taxis, despite
their inner willingness. On the other hand, if such individuals want to divide their
route into smaller routes, they are not sure if they can get a ticket later.

Pilevari et al. / Journal of System and Management Sciences Vol. 11 (2021) No. 1, pp. 155-175
157
Based on the above-mentioned issues, this paper aims to conduct the combined
design and simulation of a dynamic suburban public transportation system in Iran
using a combined technique based on Adaptive Neuro-Fuzzy Inference System
(ANFIS) and Dijkstra's algorithm. In the proposed ANFIS-Dijkstra’s model, a
transportation system is presented to enable the passenger to choose the most
optimal route for reaching his destination at any time. As a result, the passenger will
use the offered routes to use a combination of vehicles if she/he fails to get a ticket
of the desired travel style and she/he considers the cost of the trip as important. In
this regard, the passenger will get ensured that she/he is offered the best route in
terms of cost and time based on his circumstances. In addition, the passenger
ensures reaching the destination by booking tickets to continue the route by
different vehicles. Such an integrated system can change the public transportation
system especially since the proposed model can be generalized in terms of different
vehicles to the desired number.
Simulations of the proposed model have been performed by Simulink and
MATLAB software. All possible details and events have been considered in this
software to convince the managers of travel agencies about its benefits and reduce
the risk percentage as much as possible. The value of the designed transportation
system is not limited to optimizing fuel consumption and reducing passenger costs.
However, it provides a healthier environment due to the maximum use of bus
capacity. The raised issues can satisfy all of these components, if we consider the
fare paid by the passenger, the passenger's confidence in preparing the ticket, and
the optimal routing in terms of time among the concerns and components affecting
passenger satisfaction. Considering the accuracy of the proposed model on the used
dataset, it is not dependent on the obtained dataset, and can be applied to other
datasets.
The remainder of this paper is organized as follows. Section 2 reviews the
existing literature. Section 3 proposes the preliminaries of the ANFIS model to
forecast the traffic volume, and the Dijkstra's algorithm. Section 4 presents the
proposed combined ANFIS-Dijkstra’s methodology. In Section 5, the results and
analysis are discussed, and finally, the paper is concluded in Section 6.
2. Literature Review
As stated by O'Flaherty (2002), “Early manufactured roads were the stone-paved
streets of Ur in the Middle East (ca 4000 BC), the corduroy-log paths near
Glastonbury, England (ca 3300 BC), and brick paving in India (ca 3000 BC). The
oldest extant wooden pathway in Europe, the 2 km long Sweet Track, was built
across (parts subsequently preserved in) marshy ground near Glastonbury. The
oldest extant stone road in Europe was built in Crete ca 2000 BC”. Therefore, the
need for transportation dates back to the history of civilization. The first means of
transportation included passages built in the forests by opening the ways. The roads

Pilevari et al. / Journal of System and Management Sciences Vol. 11 (2021) No. 1, pp. 155-175
158
constructions developed by inventing and using wheel. Progression of road
construction techniques, after the development of the toll system, and especially in
the century after 1750, led to the emergence of skilled road builders such as
ThomasTelford and John Ludon McAdam (O'Flaherty 2002).
During the past twenty years, developing countries have experienced very huge
population growth (Buhaug and Urdal 2013). Urban sprawl and auto mobilization
have led to an increase in the number of journeys made by private motorized
vehicles, leading to increased congestion, increased greenhouse gas emissions; all
this and more resulting in negative environmental, social as well as economic
impacts (Sohoni, Thomas and Krishna Rao 2017).
Considering differences between decision-making in goods and private/passenger
transport in city administrations (Behrends, Lindholm nad Woxenius 2008), public
Transportation is one of the most efficient modes of transport which provide the
required mobility (Polat 2012). On a general basis, public transport service suppliers
have to study and consider multiple factors to insure the productivity and efficiency
of the services (De Borger and Kerstens 2006; Barnum, McNeil and Hart 2007).
Public transportation involves regular bus, electric bus, tram and urban railway,
high-speed transportation and passenger boats. Suburban public transportation
mainly includes taxis, airlines, intercity buses, and intercity railways. Among the
various modes of public transport, taxi industry is one of the most heavily regulated
industries in the world (Kamga, Yazici and Singhal 2015). Public transportation
brings advantages such as high speed, high efficiency, safety, reduction of negative
environmental effects, fast implementation of public transportation, stability in
value and land use, less traffic congestion, significant volume in passenger
transportation, lower costs due to fuel consumption and car depreciation, etc.
Tyrinopoulos and Antoniou (2008) aimed to evaluate and understand better
passenger attitudes toward public transport modes. With emphasis on the
importance of fuzzy logic systems in solving traffic and transportation problems,
Sarkar, Sahoo and Sahoo (2012) presented an analysis of the results achieved using
fuzzy logic to model complex traffic and transportation processes.
Various strategies can be implemented for improving and developing the
transportation system such as supporting the public transportation, increasing the
cost of parking cards for private cars, increasing tax on private vehicles and
regulating the transportation system by eliminating delays through developing the
scenarios (Suryani. et al, 2020). Employing a dynamic system for evaluation of
future strategies in Indonesia with considering operational efficiency, service
efficiency and uncertainty factors, Suryani et al. (2020) evaluated the effect of
simulated models and development of scenarios on improving transportation
systems and decreasing traffic congestion.
Debdatta, Subrata and Mitra (2016) measured technical efficiency of road
transportation modes in India using Directional Distance Function (DDF) to analyse

Pilevari et al. / Journal of System and Management Sciences Vol. 11 (2021) No. 1, pp. 155-175
159
the production function with favourable and unfavourable outputs, and Data
Envelopment Analysis (DEA) to measure the technical efficiency of 37 road
transportation modes in India. Considering the intelligent systems, as the advanced
tools for improving and protecting critical components of infrastructure which can
be used for protecting vital road and rail transportation infrastructure components,
Janušová and čičmancová (2016) focused on improving transportation safety using
intelligent transportation systems.
Discussing the challenge of sustainability for transportation to and from suburban
universities, Göçer and Göçer (2018) provided statistical analyses of travel mode
choices and their effect on campus use and activity participation for two different
demographic groups. Methods of arranging the transportation of passengers in
suburban traffic include a large number of system measures that cover both the
public transport system and the environment of the system where it exists
(Vakulenko et al., 2018). Kubiak and Długosz (2019) proposed a system for
optimizing and improving automated and intelligent public transportation systems
used in relatively small suburban areas in Poznan, Poland. Such a public
transportation transfers passengers from the above-mentioned places to the nearest
railway system in the region, from where the departure to other main parts of the
city starts by train. Sen et al. (2019) evaluated the reliability of travel time using
different public vehicles on a specific route in Calcutta. Cieplińska (2019) discussed
the substantial role of transport organizers in overseeing the mechanisms of all
flows in the urban area by the advent of automation automation technology. Noting
that the COVID-19 pandemic is causing disruptions in the urban transportation
system by having detrimental effects on travel and delivery services and the need to
review existing transportation issues and provide innovative solutions, Sun et al.
(2020) explored a urban-based automated public transportation system (APTS) that
serves both people and freight, using emerging technologies such as information
technology and automated vehicles.
Proposing the dynamic system model for developing interaction and feedback
among private vehicle users, public transport passengers, public transport
companies, and the government, Sopha and Ma'mun (2020) evaluated the selection
of transportation mechanisms, as well as potential energy policies in the public
transportation system. Moore (2019) evaluated the energy-saving potential of
innovative means of delivering intra-city freight. Jin and Zhou (2020) investigated
the factors affecting the comfort of passengers in the process of transportation and
discussed the comfort and convenience of passengers in the public transportation
system in the suburbs of Beijing.
The review of literature reveals that the studies related to suburban public
transportation based on dynamic simulation are found to be few. In this paper, two
simulation models related to the current system and the proposed suburban public
transportation system are designed and implemented. An ANFIS is employed for

Pilevari et al. / Journal of System and Management Sciences Vol. 11 (2021) No. 1, pp. 155-175
160
route traffic estimation and Fuzzy C-Means (FCM) clustering algorithm is utilized
to determine the number of passengers referring to each city terminal, and finally,
the Dijkstra's algorithm is applied to find the optimal routing of passengers from the
source to the destination.
3. Preliminaries
3.1. Adaptive Neuro-Fuzzy Inference System (ANFIS)
Fuzzy set theory is a perfect tool to model uncertainties and imprecision arising
from mental phenomena. Fuzzy Inference System (FIS) is one of the most popular
systems developed for fuzzy reasoning which uses fuzzy logic for modeling
uncertainties. ANFIS is a combination of two soft-computing methods of Artificial
Neural Networks (ANNs) and fuzzy logic (Jang, 1993). It is an adaptive network
that uses supervised learning on learning algorithm, which has a function similar to
the model of Takagi-Sugeno FIS (Shokouhifar and Jalali, 2017). Each node in this
network has different functions and tasks, and the output depends on the incoming
signals and parameters that are available in the node (Suparta and Alhasa, 2016). A
learning rule could affect the parameters in the node and reduce the occurrence of
errors in the output of the adaptive network (Jang, 1993).
ANFIS integrates neural networks and concepts of fuzzy logic and applies the
possibilities of both in one frame, the inference system of which is consistent with
the fuzzy if-then set of rules which can be learned for approximating nonlinear
functions (Jang, 1993). It is one of the most efficient techniques in the fields of
forecasting, estimating, and modelling (Nayak et al, 2004). In the present study, the
ANFIS is used to estimate the volume of daily traffic. Fig. 1 shows the general
structure of the ANFIS model with two inputs and one output.
Fig. 1: General structure of ANFIS model with a two-input first-order Sugeno fuzzy model
with two rules.

Pilevari et al. / Journal of System and Management Sciences Vol. 11 (2021) No. 1, pp. 155-175
161
In the ANFIS model, the fuzzy rules can be expressed as follows:
Rule1: if x is A1 and y is B1 then f1 = p1 x + q1 y + r1;
Rule2: if x is A2 and y is B2 then f2 = p2 x + q2 y + r2;
First layer: In this layer, the membership degree of input nodes to different
fuzzy intervals is determined using membership functions. x or y represents the
input to node i, and Ai or Bi represent the linguistic variables corresponding to this
node.
21
1 ( ) 1
i
i
b
ii A
i
x cO x
a
−
−
= = +
(1)
Second layer: Each node in this layer is a fixed node called P whose output is
the product of all input signals.
2
2 ( ) ( ); 1,2i ii A BO w x y i = = =
(2)
Third layer: This layer normalizes the output of the second layer and transfers it
to the next layer.
3
ii
l
i iO w w w= =
(3)
Fourth layer: Each node i in this layer is a node corresponding to the node
function, as follows.
4
i iO w f= (4)
where represents a normalized firing strength of the third layer, and pi, qi, and
ri indicate the set of parameters in this node, respectively. The parameters of this
layer are called inferential parameters.
Fifth layer: The only node in this layer is a fixed node called, calculating all
outputs as a set of all input signals as follows.
5
ii w fO =
(5)
3.2. Dijkstra’s Algorithm
Dijkstra is considered as one of the famous algorithms for calculating the shortest
path, developed by the Dutch computer scientist named Edsger W. Dijkstra in 1959
(Dijkstra, 1959). This algorithm is one of the graph navigation algorithms, solving
the problem of the shortest path from the single source for the weighted graphs
having edges with non-negative weight. Finally, this algorithm obtains the shortest
path from the source to all vertices of the graph by creating the shortest path tree.
The process of this algorithm for finding the shortest path from the source to the top

Pilevari et al. / Journal of System and Management Sciences Vol. 11 (2021) No. 1, pp. 155-175
162
of the destination is such that the algorithm can be stopped during the
implementation of the algorithm while finding the shortest path from the source to
the destination. If the graph has an edge with negative weight, this algorithm fails to
work properly and other algorithms such as the Bellman -Ford algorithm should be
used, which are more complex in time. Furthermore, the time order of this
algorithm equals O (log (N) * E). The steps of Dijkstra’s algorithm are as follows:
The set S including the graph vertices is determined. At the beginning, this set is
empty and this set contains the vertices to which the shortest path is found when the
algorithm progresses. The source vertex with the index puts zero inside S. For
vertices outside S, an index equal to the edge length + the index of the previous
vertex is considered. If the vertex outside the set has an index, the new index is the
lowest value between the previous index and the edge length + index of the
previous vertex. From the vertices outside the set, a vertex with the lowest index is
selected and added to the set S. Repeat this until the destination vertex enters the set
S. Finally, if the destination vertex has an index, its index indicates the distance
between the source and destination. Otherwise, there is no path between the source
and the destination (Diestel, 2010).
4. Proposed ANFIS-Dijkstra’s Model
In the present descriptive and analytical study, library and field methods are used
for collecting data. The distance of each city to another city is saved and used in
different parts of the program. Based on the latest data, these numbers are extracted
one by one through Google Map and new roads are considered. For a number of
clients, it is specified how many passengers travel to the terminals of each city by
bus or taxi every day and at any minute of the day. Such numbers are adjusted based
on the average capacity of buses using random number generation functions to
cover the maximum of different situations. The rate of traffic is determined at any
given time on the day of the week and minute of the day from each city to other
cities. Traffic rate is used as a factor in the simulation. Bus schedule contains 30
excel sheets, specifying the time of buses to different cities and passenger capacity
in a separate sheet for each city, which is documented separately for each city using
bus departure time information on reputable sites and stored in a single file. For bus
prices, the amount of bus fare is mentioned and the information of all cities is stored
in one page.
In order to conduct the present study, first the distance between the provincial
capitals is stored and the base time for transferring from one city to another is
determined based on the average speed of taxis and buses in each route. Route
traffic is one of the details considered in this study. Accordingly, the base time for
transferring from one city to another is affected. For this purpose, the desired time
traffic of the system is estimated by creating an ANFIS model. In order to create the

Pilevari et al. / Journal of System and Management Sciences Vol. 11 (2021) No. 1, pp. 155-175
163
desired ANFIS model, three inputs such as the route type, day of the week, and
minutes of the day, as well as one output including the traffic coefficient of that
route are considered.
To efficiently simulate the transportation system, the number of passengers from
each source is estimated using the FCM (Shokouhifar & Farokhi, 2010) using a
field study in relation to the amounts of the different requests at different times to
different destinations to be closer to reality. At this stage, other information such as
destination, passenger priority including cost or time and the passenger's desired
time frame for reaching the destination is received from the passenger, being
randomly assigned to the passenger at the same time as defining a new passenger in
the system. Then, the study is divided into two parts including the simulation of the
current suburban public transportation system and the proposed transportation
system.
In the current system simulation, the passenger is answered based on his/her
selected priority (cost or time) by submitting a travel request. In the simulation of
the proposed system, the passenger is offered the most optimal route based on his
request by receiving the passenger's information, which may be performed in
combination with taxi and bus during the distance from the source to the destination
to be more appropriate for the passenger's request. For this purpose, the Dijkstra's
algorithm is used for finding the best route. Finally, the results of simulating the two
suburban public transportation systems are compared to determine which could
meet the needs of passengers.
5. Performance Evaluation
The proposed ANFIS-Dijkstra’s model has been successfully developed in
MATLAB R2020b. Experiments were carried on a PC with 2.5 GHz i7 processor
and 16 GB memory running on windows 10. In the FIS, Gaussian functions have
been employed to define the input and output variables for the fuzzy inference
system. The range of variables is defined between 0 and 10. Fig. 2 shows the
membership function of the linguistic variables in the FIS.
In the present study, two limitations are considered due to the greater focus on the
subject such as restricting vehicles to taxi and bus and restricting the transit between
provincial capitals. Therefore, the transportation routes between the provincial
centres of Iran are studied for simulating the dynamic suburban public transportation
system. Since the traffic on the routes is considered as an effective parameter on the
efficiency of public transportation systems, the best diagnosis in this field is
diagnosed by creating and training an ANFIS model to lead to a more accurate
simulation model. In order to increase the reliability of traffic estimation, the data are
divided into three sections of training (70%), testing (10%), and checking (20%).
Thus, 140 data out of 200 data are extracted randomly using an appropriate function
in MATLAB software and the ANFIS model is taught using such data.

Pilevari et al. / Journal of System and Management Sciences Vol. 11 (2021) No. 1, pp. 155-175
164
Fig. 2: Membership functions for linguistic variables.
5.1. Estimating Traffic from Different Routes uing ANFIS
Fig. 3 displays the training error rate of the ANFIS model generated using the sub
clustering method in the training course. As shown, the ANFIS model training has
no effect on reducing the model error since the course 140 onwards, indicating that
the appropriate selection of number 200 for the number of model training courses
using the sub clustering method and the error rate in the training phase is 0.054. The
number of membership functions for inputs is considered 24. Hybrid optimization
method is used for training the parameters of membership functions. The used fuzzy
inference system is Sugeno with Gaussian membership functions and the variables
are converted to fuzzy variables by trial and error using the Gaussian function. The
weighted average function is used for defuzzification. After creating the model and
its training on the training data, testing and checking data which are not involved in
the training process are used for evaluating and determining the validity of the
designed model.
Fig. 4 and 5 illustrate the error rates of the generated ANFIS model for the testing
and checking datasets, respectively. In these figures, the symbols (*) indicate the
output of the system and the symbol (+) indicates the testing (checking) data
generated by the ANFIS model. The calculated mean error rate in testing and
checking datasets have been achieved as 0.075 and 0.09 respectively. As a result, no
over-fitting is observed in the designed model and the high accuracy of the created
model in estimating instantaneous traffic.

Pilevari et al. / Journal of System and Management Sciences Vol. 11 (2021) No. 1, pp. 155-175
165
Fig. 3: Training error of the ANFIS model created by the sub-clustering method.
Fig. 4: Testing data error diagram created in the ANFIS model.
Fig. 5: Checking data error diagram in the generated ANFIS model.

Pilevari et al. / Journal of System and Management Sciences Vol. 11 (2021) No. 1, pp. 155-175
166
5.2. Sensitivity Analysis of the ANFIS Model
Due to the significance of detecting the traffic rate and its effect on the
implementation of the simulation model and ensuring the correct selection of inputs
used in creating the ANFIS model, the estimated traffic sensitivity for each input
are calculated using the Neuro-Fuzzy-Designer tool as shown in Table 1. As shown
in Table 1, the days of week has a higher effect on the performance of the ANFIS
traffic estimation model than the other two inputs. In general, using all of the three
inputs has a significant effect on reducing the error of the ANFIS model detection.
For example, the model error rate is 0.232 without considering the days of week,
while this error rate reduced to 0.054 by using this input along with two other
variables, indicating a reduction of 0.178 or a 77% reduction in training error.
Based on the numbers obtained from the sensitivity analysis of the inputs used in
the ANFIS model, the effect of each input in determining the traffic rate is
determined, indicating the appropriate selection of inputs.
Table 1: Effect of each input on the performance of the traffic estimation model.
Input
Error rate
without
calculating input
Error reduction
rate including
input
Percentage of positive
effect of input on error
reduction
Route type 0.098 0.044 45%
Days of week 0.232 0.178 77%
Hours of day 0.116 0.062 53%
5.3. Simulation of Current Transportation System
Fig. 6 displays the current system simulation model. As shown in the upper part of
the figure, each pulse of the 120-minute simulation model equals two hours and the
related subsystem of all cities is connected to this pulse to update the passenger and
bus information at two-hour intervals.
To explain the simulation, the Arak city subsystem is selected as an example: one
of the inputs is time that 2 hours per pulse is added to its value. 29 inputs are related
to the passengers who had come from different cities to Arak and traveling to
another city or their destination is Arak. 29 outputs are connected to other cities, to
direct passengers to their next destinations. Another output specified for the Arak
subsystem, called Arak Centre, included the passengers who reached their
destination in a pulse and their information is sent to the simulation centre for
analysis. The three inputs and outputs of the lower part of the subsystem, being
connected to each other by a memory block, include:
Q_M: List of passengers waiting for their bus leaving from Arak.
W_M: List of passengers on the road waiting to reach their destination to transfer
their information to one of the above-mentioned 29 outputs.

Pilevari et al. / Journal of System and Management Sciences Vol. 11 (2021) No. 1, pp. 155-175
167
Fig. 6: Part of the simulation model for the current transportation system.
C_M: This list is related to the remaining time and capacity of buses from
different origins to different destinations which should be updated on each pulse.
Fig. 7 displays the contents of the Arak city subsystem and its performance is
summarized as follows:
Box 1: List of passengers who are on the road from previous pulses.
Box 2: Deciding on new passengers entering the city.
Box 3: Deciding on reaching or not reaching the end of the current route.
Box 4: Preparing the information of the passengers who have not yet arrived at
the destination for transfer to the next pulse.
Box 5: Preparing the distance of different routes separately for each city.

Pilevari et al. / Journal of System and Management Sciences Vol. 11 (2021) No. 1, pp. 155-175
168
Fig. 7: The contents of the selected subsystem.
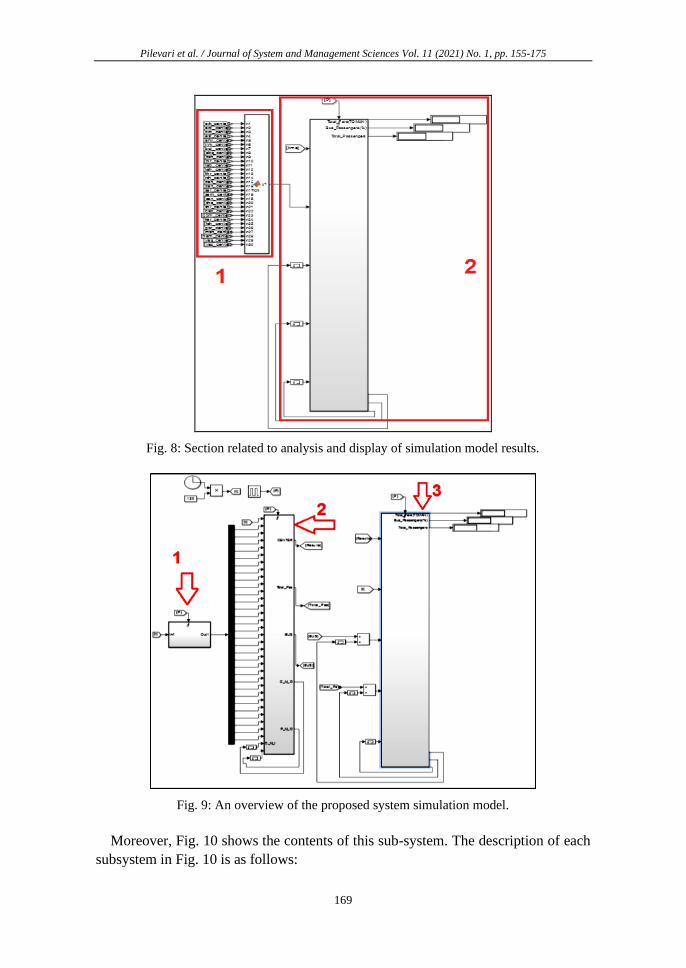
Fig. 8 presents the section for analysing and displaying the results of the
simulation model. In each time period from each city, the information of all the
passengers who have reached their final destination is transferred to this section and
the results are calculated:
Box 1: Converting the passengers’ information from all cities into a single matrix
and directing it to the next subsystem shown in Box 2.
Box 2: This subsystem calculates the three total numbers of passengers, the total
paid fare, and the percentage of passengers using bus.
5.4. Simulation of Proposed Suburban Transportation System
Fig. 8 displays an overview of the proposed system simulation model. The
description of each subsystem in Fig. 9 is as follows:
Box 1: Specifying the number of visitors to the terminal of each city.
Box 2: This section determines the information such as the passengers who have
arrived at the destination, the number of passengers who have travelled by bus, and
the total number of passengers after separating the vector related to the number of
passengers visiting each city in each two-hour period to provide to the next section.
In addition, it transfers the instantaneous capacity information of buses and
passengers (as C_M_O, P_M_O, respectively) to memory for later time intervals.
Pilevari et al. / Journal of System and Management Sciences Vol. 11 (2021) No. 1, pp. 155-175
169
Fig. 8: Section related to analysis and display of simulation model results.
Fig. 9: An overview of the proposed system simulation model.
Moreover, Fig. 10 shows the contents of this sub-system. The description of each
subsystem in Fig. 10 is as follows:

Pilevari et al. / Journal of System and Management Sciences Vol. 11 (2021) No. 1, pp. 155-175
170
Box 1: In case of being in the first 120 minutes, the passenger information stored
in the Passenger file is used; otherwise, the input information to this section being
stored in the relevant memory is used.
Box 2: Separating the passengers’ information for each city by the name of that
city.
Box 3: The information of the passengers whose number is determined in the
previous steps using the FCM algorithm is separated and prepared for each city.
Box 4: In this section, the basic information on the capacity of buses or updated
capacity is prepared for further use in simulation depending on whether we are in
the first 120 minutes or not.
Box 5: In this section, there is a MATLAB function which has the main task in
this simulation model.
Fig. 10: The contents of the subsystem related to decision-making about passengers in the
proposed system.
5.5. Discussion
The results of Table 2 are obtained by implementing the simulation models related
to the current system and the proposed suburban public transportation system for

Pilevari et al. / Journal of System and Management Sciences Vol. 11 (2021) No. 1, pp. 155-175
171
one week. As observed, the use of artificial intelligence algorithms and new
methods save a considerable amount of time and money. Obviously, the results of
this study indicate their importance when implemented after one or several years.
The results of Table 2 along with economic and temporal productivity greatly
increase the comfort of passengers in preparing tickets and helping the environment.
Table 2: Comparison of the proposed model with the current system.
Input Current model Proposed model Comparison
Percentage of using bus 70.6% 78.08% 8.2%
Increase
Percentage of empty seats 24.2% 11.54% 12.66%
Decrease
Average fare paid by each
passenger 818300 6432200
175100
Decrease
6. Conclusion
In this paper, the studies in the field of public transportation have been reviewed to
adopt an appropriate method to optimize fuel consumption, and save cost and time.
In the proposed model, an ANFIS model is created for estimating route traffic and
the FCM algorithm is established for determining the number of passengers visiting
each city terminal. Finally, Dijkstra's algorithm selects the optimal route from the
source to the destination. Two simulation models related to the current system and
the proposed system of public transportation are designed and implemented for one
week while extracting, collecting, and adjusting the data purposefully from the
places related to public transportation, and using Simulink and MATLAB software.
According to the obtained results, the rate of using buses compared to taxis
increased by 8.2%, the maximum capacity of buses increased by 12.66% and the
total fare paid by passengers decreased by 175100 Rials.
The designed transportation system is not limited to optimizing fuel consumption
and reducing passenger costs. Based on the maximum use of bus capacity, such a
system provides a healthier environment. If we consider the fare paid by the
passenger, the passenger's confidence in preparing the ticket and the optimal routing
in terms of time among the concerns and components affecting passenger
satisfaction, the raised issues will meet all these components. The proposed
methodology can be applied to other datasets. The dynamics of the methods used in
this study is considered as one of the reasons. Another reason is that decision-
making models adapt themselves to training data using artificial intelligence. As a
future work, other machine learning techniques such as Co-Active Neuro-Fuzzy
Inference System (CANFIS) can be utilized and evaluated for suburban public
transportation.
Pilevari et al. / Journal of System and Management Sciences Vol. 11 (2021) No. 1, pp. 155-175
172
References
Barnum, D. T., McNeil S. and J. Hart (2007). Comparing the efficiency of public
transportation subunits using data envelopment analysis. Journal of Public
Transport, 10, 116.
Behrends, S., Lindholm M. and J. Woxenius (2008). The Impact of Urban Freight
Transport: A Definition of Sustainability from an Actor's Perspective.
Transportation Planning and Technology, 31(6), 693-713.
Buhaug, H. and H. Urdal (2013). An urbanization bomb? Population growth and
social disorder in cities. Global Environmental Change, 23(1), 1–10.
Cieplińska, J. R. (2019). The Role of Transport Organisers in the Integration of
Passengers and Goods Flows Within Urban Areas. Transportation Research
Procedia, 39, 453–461.
De Borger, B. and K. Kerstens (2006). The performance of bus transit operators.
Document de travail du LEM. 20063 (21).
Debdatta, P., Subrata K. and A. Mitra (2016). An application of the directional
distance function with the number of accidents as an undesirable output to measure
the technical efficiency of state road transport in India. Transportation Research
Part A: Policy and Practice, 93, 1–12.
Diestel, R. (2010). Graph Theory. 4th Edition, springer, Berlin, Heidelberg.
Dijkstra, E.W. (1959). A note on two problems in connexion with graphs,
Numerische mathematic, 1, 269-271.
Gill, J. and J. Singh (2017). Performance analysis of vapor compression
refrigeration system using an adaptive neuro-fuzzy inference system. Int. J. Refrig.
82, 436–446.
Göçer, O. and K. Göçer (2018). The Effects of Transportation Modes on Campus
Use: A Case Study of a Suburban Campus. Case Studies on Transport Policy.
Hidalgo, D. and C. Huizenga (2013). Implementation of sustainable urban transport
in Latin America. Research in Transportation Economics, 40(1), 66-77.
Hutchison, R. (2010). Encyclopedia of urban studies. SAGE Publications. ISBN
(Electronic): 9781412971973.

Pilevari et al. / Journal of System and Management Sciences Vol. 11 (2021) No. 1, pp. 155-175
173
Jang, J. S. R. (1993). ANFIS: Adaptive Network Based Fuzzy Inference System.
IEEE Transactions on Systems, Man and Cybernetics, 23(3), 665 - 685.
Janušová, L. and S. Čičmancová (2016). Improving Safety of Transportation by
Using Intelligent Transport Systems. Procedia Engineering, 134,14-22.
Jin, T. and Y. Zhou (2020). Research on the Development of Beijing Suburban
Public Transportation Based on SEM. Journal of Physics, 1549(2), 022-027.
Kamga, C., Yazici M.A. and A. Singhal (2015). Analysis of taxi demand and supply
in New York City: implications of recent taxi regulations. Transportation Planning
and Technology, 38(6), 601-625.
Kubiak, M. B. K. and R. Długosz (2019). Solutions for Planning Smart Hybrid
Public Transportation System–Poznan Agglomeration as a Case Study of Satellite
Towns’ Connections. Communication Papers of the Federated Conference on
Computer Science and Information Systems, 20, 67–72.
Li, Y. and M. DaCosta (2013). Transportation and income inequality in China:
1978– 2007. Transportation Research Policy and Practice, 55, 56-71.
Moore, A.M. (2019). Innovative scenarios for modeling intra-city freight delivery.
Transportation Research Interdisciplinary Perspectives, 3, 100024.
Nayak, P. C., Sudheer K. P., Rangan D. M. and K. S. Ramasastri (2004). A Neuro-
Fuzzy Computing Technique for Modelling Hydrological Time Serie. Journal of
Hydrology, 291(2), 52-66.
O'Flaherty, C.A. (2002). Introduction: A historical overview of the development of
the road, Highways (Fourth Edition), Butterworth-Heinemann, 1-5.
Polat, C. (2012). The Demand Determinants for Urban Public Transport Services: A
Review of the Literature. Journal of Applied Sciences, 12(12), 1211-1231.
Sabet, S., Farokhi, F., and Shokouhifar, M. (2013). A hybrid mutation-based
artificial bee colony for traveling salesman problem. In 4th International
Conference on Electronics Computer Technology (ICECT).
Sarkar, A., Sahoo G. and U. C. Sahoo (2012). Application of fuzzy logic in
transport planning. International Journal on Soft Computing 3(2).

Pilevari et al. / Journal of System and Management Sciences Vol. 11 (2021) No. 1, pp. 155-175
174
Sen, S., Chowdhury T., Mitra A. and S. K. Roy (2019). Assessing Travel Time
Reliability of Public Transport in Kolkata: A Case Study. In Advances in
Transportation Engineering: 21-34, Springer, Singapore.
Shokouhifar, M., and Farokhi, F. (2010). Feature selection using supervised fuzzy
C-means algorithm with ant colony optimization. In 3rd International Conference
on Machine Vision (ICMV), 441-446.
Shokouhifar, M., and Jalali, A. (2015). A new evolutionary based application
specific routing protocol for clustered wireless sensor networks. AEU-International
Journal of Electronics and Communications, 69(1), 432-441.
Shokouhifar, M., and Jalali, A. (2017). Optimized sugeno fuzzy clustering
algorithm for wireless sensor networks. Engineering applications of artificial
intelligence, 60, 16-25.
Shokouhifar, M., and Jalali, A. (2017). Simplified symbolic transfer function
factorization using combined artificial bee colony and simulated annealing. Applied
Soft Computing, 55, 436-451.
Shokouhifar, M., Sabbaghi, M. M., and Pilevari, N. (2021). Inventory Management
in Blood Supply Chain Considering Fuzzy Supply/Demand Uncertainties and
Lateral Transshipment. Transfusion and Apheresis Science, 103103.
Sohoni, A.V., Thomas M. and K. V. Krishna Rao 2017. Application of the concept
of transit-oriented development to a suburban neighborhood. Transportation
Research Procedia, 25, 3220–3232.
Sopha, B.M. and S. Ma’mun 2020. System dynamics simulation of private and
public transportation in a developing country. In AIP Conference Proceedings,
2223(1), 050009, AIP Publishing LLC.
Sun, S., Wong Y.D., Liu X. and A. Rau 2020. Exploration of an integrated
automated public transportation system. Transportation Research Interdisciplinary
Perspectives, 8, 100275.
Suryani, E., Hendrawan R. A., Adipraja P. F., Wibisono A., Widodo B. and R.
Indraswari 2020. Modelling and simulation of transportation system effectiveness to
reduce traffic congestion: a system dynamics framework. Transportation Planning
and Technology, 43(7), 670-697.

Pilevari et al. / Journal of System and Management Sciences Vol. 11 (2021) No. 1, pp. 155-175
175
Tyrinopoulos, Y. and C. Antoniou 2008. Public transit user satisfaction: Variability
and policy implications. Transp. Policy, 15(4), 260–272.
Vakulenko, K., Kuhtin K., Afanasieva I. and A. Galkin 2018. Designing Optimal
Public Bus Route Networks in a Suburban Area. Transportation Research Procedia,
39, 554–564.
World Energy Outlook (2010). https://www.iea.org/reports/world-energy-outlook-
2010.
World Health Organization (2004), World Health Day: Road safety is no accident!
https://www.who.int/mediacentre/news/releases/2004/pr24/en/