Embed Size (px)
Citation preview
Biophysical Journal Volume 69 September 1995 1105-1110 1
Combined Effects of Light and Water Stress on ChloroplastVolume Regulation
Douglas C. McCainDepartment of Chemistry and Biochemistry, University of Southern Mississippi, Hattiesburg, Mississippi 39406 USA
ABSTRACT A nuclear magnetic resonance technique was used to measure changes in the water content of Acer p/a-tanoides chloroplasts in leaf discs that had reached osmotic equilibrium with external solutions either in the dark or underexposure to light. Results showed that chloroplast volume regulation (CVR) maintained constant water content in thechloroplasts over a range of water potentials in the dark, but CVR failed when the water potential fell below a critical value.The critical potential was lower in the dark in sun leaves than in shade leaves. Upon exposure to intense light, CVR remainedeffective in sun leaves over the same range as in the dark, but it failed in shade leaves at all water potentials. Osmolytes arenecessary for CVR, but KCI is relatively ineffective; increased concentrations of intracellular KCI did not fully support anincrease in the range of CVR. The results indicate that leaves need reserve supplies of cytosolic osmolytes to maintain CVRat low water potentials, and a larger reserve supply is needed in leaves that are exposed to intense light.
INTRODUCTION
Chloroplast volume regulation (CVR) is the process bywhich chloroplasts import or export osmolytes to maintainconstant volume in a changing environment. Robinson(1985) was the first to demonstrate CVR. He showed thatisolated chloroplasts retained a constant quantity of waterover a range of water potentials, but they lost water whenthe water potential fell below a critical value. Photosyn-thetic oxygen production was sensitive to volume change;chloroplasts that were above or below an optimum volumeevolved less 02. Sen Gupta and Berkowitz (1988) con-firmed these observations, and Santakumari and Berkowitz(1991) found that CVR extended to lower water potentialsin chloroplasts isolated from plants that had experiencedwater stress.
Chloroplasts shrink upon exposure to light. Ions aretransported from the stroma to the cytosol, and water fol-lows osmotically (Nobel, 1969; Defilippis and Pallaghy,1973). Coulter counter and packed-volume measurementshave revealed a light-induced decrease of 15-30% in thevolume of pea chloroplasts (Nobel, 1968; Zurzycki andMetzner, 1977), and light microscopy has been used tomeasure a 25% decrease in thickness along their minor axis(Nobel et al., 1969; Miller and Nobel, 1972). Stereologicalanalysis has showed that sunflower chloroplasts occupy30% of the palisade cell volume at night, but they contractto 21% of cell volume in daylight (Fagerberg, 1983). Chlo-roplast shrinkage also has been detected by changes in lightscattering (Heber et al., 1986). The light-induced shrinkageis reversible in the dark (Lawlor, 1987).
Receivedfor publication 13 February 1995 and in final form 3 June 1995.Address reprint requests to Dr. Douglas McCain, Department of Chem-istry and Biochemistry, University of Mississippi, Box 5043, Hatties-burg, MS 39406. Tel.: 601-266-4376; Fax: 601-266-5829; E-mail:[email protected]) 1995 by the Biophysical Society0006-3495/95/09/1105/06 $2.00
Both CVR and light-induced shrinkage involve osmolytetransport through the envelope; therefore, an interactionbetween the two processes is possible. While CVR andlight-induced shrinkage have been studied separately, nosingle study has focused on both simultaneously. This paperinvestigates the combined effects of light, water stress, andleaf type on chloroplast water content.
Nuclear magnetic resonance (NMR) was used to measurechanges in chloroplast water content. The major advantageof this method is that it can detect chloroplast volumechange in vivo. This is important because the effectiverange of CVR is not a property of chloroplasts alone, but ofthe entire plant. CVR may be affected by osmolyte com-partmentalization, membrane interactions, turgor pressure,and other factors that cannot be duplicated easily in vitro.
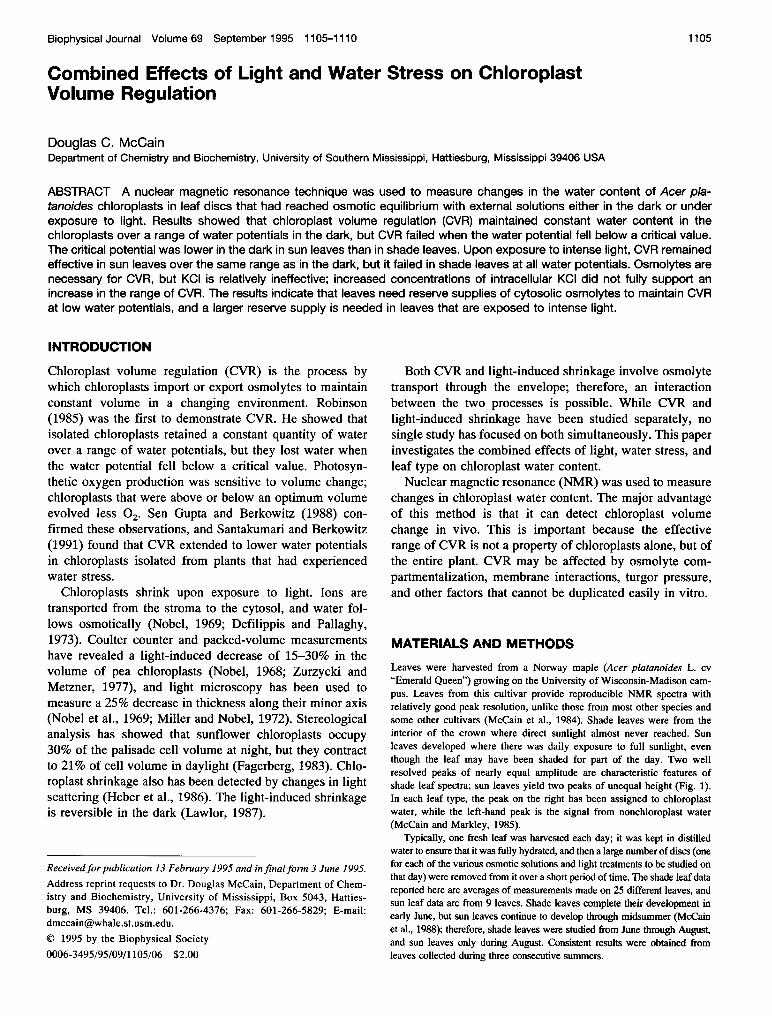
MATERIALS AND METHODSLeaves were harvested from a Norway maple (Acer platanoides L. cv"Emerald Queen") growing on the University of Wisconsin-Madison cam-pus. Leaves from this cultivar provide reproducible NMR spectra withrelatively good peak resolution, unlike those from most other species andsome other cultivars (McCain et al., 1984). Shade leaves were from theinterior of the crown where direct sunlight almost never reached. Sunleaves developed where there was daily exposure to full sunlight, eventhough the leaf may have been shaded for part of the day. Two wellresolved peaks of nearly equal amplitude are characteristic features ofshade leaf spectra; sun leaves yield two peaks of unequal height (Fig. 1).In each leaf type, the peak on the right has been assigned to chloroplastwater, while the left-hand peak is the signal from nonchloroplast water(McCain and Markley, 1985).
Typically, one fresh leaf was harvested each day; it was kept in distilledwater to ensure that it was fully hydrated, and then a large number of discs (onefor each of the various osmotic solutions and light treatments to be studied onthat day) were removed from it over a short period of time. The shade leaf datareported here are averages of measurements made on 25 different leaves, andsun leaf data are from 9 leaves. Shade leaves complete their development inearly June, but sun leaves continue to develop through midsummer (McCainet al., 1988); therefore, shade leaves were studied from June through August,and sun leaves only during August. Consistent results were obtained fromleaves collected during three consecutive summers.
1105
Volume 69 September 1995
Shade leafSun leaf
FIGURE 1 Typical 5H NMR spectra from sun and shade leaves of the A.platanoides cultivar "Emerald Queen". The peak on the right in eachspectrum is the signal from water in the chloroplasts, while the left peak isfrom water in all the other leaf compartments. Tick marks on the horizontalscales register parts-per-million of magnetic field. Relative peak intensitiesshow that chloroplasts contained a larger fraction of the total leaf water inshade leaves than in sun leaves.
Discs (4 mm diameter) were punched from near the centers of leafblades, avoiding large veins. The discs were placed in a sample holder thatwas designed to ensure magnetic field homogeneity and to orient the leafsurface perpendicular to the applied magnetic field (McCain et al., 1984;McCain, 1986). 1H NMR spectra were obtained at 400 MHz on a BrukerAM-400 spectrometer (Billerica, MA). Samples were exposed to insignif-icant light intensities while in the bore of the magnet.
Initial spectra were obtained using fresh discs from fully hydratedleaves. Next, each disc was submerged briefly in an osmotic solution andallowed to float with its abaxial surface up so that stomata were exposed toair while the adaxial surface and the cut edge were in contact with solution.At measured time intervals, discs were lifted from the solutions, blotted drywith tissue paper, and reexamined under the same NMR acquisition pa-
rameters as before. Some samples were refloated and used again.Aqueous solutions on which discs were floated included: KCI (0.1, 0.2,
0.3, 0.4, 0.5, 0.6, and 0.7 M), polyethylene glycol, PEG-8000 (0.1, 0.2,0.25, 0.3, 0.35, 0.4, 0.45, 0.5, 0.55, and 0.6 g PEG/g H20), and mixturescontaining both 0.1 M KCI and each of the first nine PEG concentrationslisted above. A thermocouple psychrometer (Model SC1OA, DecagonDevices, Inc., Pullman WA) was used to measure water potentials.
Some floating discs were kept in total darkness; others were placed over
a white reflective surface and illuminated from above. Light from a slideprojector was focused through a 500 ml round-bottomed flask filled withwater that acted simultaneously as a lens and as a heat filter; a mirrorreflected the light so that it fell vertically on the floating discs. A modelLI-185B photodetector (Li-Cor, Inc., Lincoln, NE) was used to measure
light intensity.All data reported here were obtained at 295 K. Although solution
temperatures increased by less than 0.50 upon exposure to light, thepossibility that localized heating could have caused the "light effect" was
investigated. No heat effect was found; discs that floated on osmoticsolutions in darkness at 304 K showed the same behavior as those main-tained in darkness at 295 K.
Light-induced chloroplast movements are well known in algae, but are
seldom observed in higher plants where chloroplast positions are more
dependent on leaf anatomy (Nagai, 1993). Stress-induced chloroplastmovements in A. platanoides leaves have been detected by observingchanges in NMR peak shapes (the observations will be reported else-where), but such movements occur only under extreme conditions and were
not important in the measurements reported here. Light induces rapidconformational changes in thylakoid membranes; the changes can bedetected by NMR (McCain et al., 1994), but not under the conditions of thepresent experiments.
Relative water content (RWC) can be computed as the total integral ofthe spectrum after treatment divided by the total integral from the fresh,fully hydrated sample. Defined in this way, RWC corresponds to the net
fraction of the initial water content of the fresh leaf disc that remains in thesample after treatment. Integrals are proportional to water content because
By analogy to RWC, relative chloroplast water content (RCWC) can
be defined as the fraction of the initial water content of the chloroplaststhat remains in the chloroplasts after treatment. The quantity of water inthe chloroplasts is proportional to the integral of the chloroplast peak (ifspins are allowed to recover thermal equilibrium between successivepulses), and, according to theory, it is also inversely proportional topeak separation. Integrals are reliable, but the theory that relates peakseparations to water content must be applied with caution; to use peakseparations, one must assume that the orientations of thylakoid mem-
branes and the conformations of their molecular components remainunchanged by the treatment (McCain and Markley, 1985). The integralmethod was used for all data reported here, and the measurements were
extrapolated to osmotic equilibrium.Total integrals are easy to measure in an NMR spectrum when the
spectral window is wide enough to reveal the true baseline. In shade leaves,the chloroplast peak integral was defined as the area to the right of themidpoint between the two peaks; although there is some overlap betweenpeaks, the measurement provides a good approximation of the true chlo-roplast peak integral because the peaks have similar shapes and intensities.In sun leaves, however, the chloroplast peak integral is difficult to definebecause of significant overlap from the stronger nonchloroplast peak (Fig.1). Sun leaf chloroplast integrals were measured by curve fitting, assumingtwo peaks of equal width but different amplitude; they may be less accuratethan shade leaf chloroplast integrals.
The water content of a leaf disc slowly approaches an asymptotic valueas the disc reaches osmotic equilibrium with the solution on which it floats.An earlier paper (McCain and Markley, 1992) demonstrated that experi-mental RCWC values approach equilibrium exponentially according to thefunction:
RCWC = F + (1- F)exp(-t/T)where t is the total time that the discs have floated, T is a characteristicrelaxation time, and F is the final equilibrium RCWC value. The same
extrapolation function fits the new data reported here, but equilibrium isreached faster in the light than in the dark. The relaxation time was
remeasured in the dark on PEG and on PEG + 0.1 M KCI and found to be110 min, the same value as before (McCain and Markley, 1992), but in thelight, T = 75 min. RWC approaches equilibrium by the same function andwith the same relaxation times as does RCWC.
Discs floating on concentrated KCI at flrst lost water by osmosis, butwater later reentered as KCI diffused into the discs. This behavior resem-
bles leaf-disc equilibration on glycerol solutions (McCain and Markley,1992). As with glycerol, the time-dependent RWC and RCWC data couldnot be fitted to a suitable extrapolation function; instead, KCI measure-
ments from t> 80 min were averaged to estimate equilibrium values.Discs that floated in the dark for a time on PEG and then were
transferred to water recovered most of the water they had lost, but discstransferred from KCI to water recovered more than their initial watercontent, indicating that KCI had entered the cells. Discs that floated in thelight on PEG and then were transferred to water never fully regained theirinitial water content, indicating they had lost some osmolytes. Discs thatfloated more than 2 hr at low water potential developed a thin ring ofplasmolyzed cells at their periphery; the ring broadened with time andeventually (after -1 day) reached the center of the disc.
RESULTS
Fig. 2 presents a small sample of the raw data to illustratewhat was observed under varying conditions of light andwater stress. For this experiment, eight discs were cut fromthe same leaf, and their initial spectra were recorded. Theeight initial spectra were almost identical, and closely re-sembled the shade leaf spectrum in Fig. 1. Next, each discwas floated on one of four PEG solutions, either in the dark
the water signal dominates the spectrum.orith lih.N Rseracansbgnimdaey
1106 Biophysical Journal
or in the light. NMR spectral changes began immediately
Chloroplast Volume Regulation
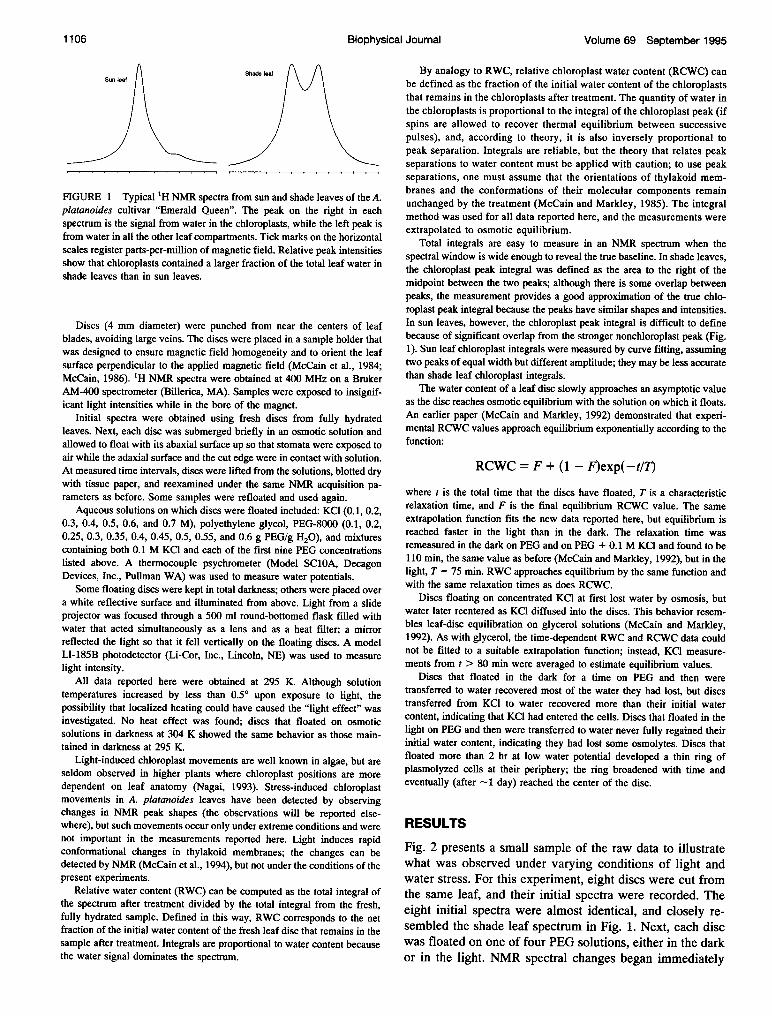
FIGURE 2 NMR spectra of eight different shade leaf discs after they hadfloated for 90 min on PEG solutions either in the dark or exposed to lightat 1200 ,umol m-2 s-1. Each spectrum is labeled with the concentration (inunits of g PEG/g H20) of the solution on which the disc floated. The discshad almost identical spectra before treatment, but different combinations oflight and water stress altered the positions and intensities of the peaks.
and could be detected as soon as 5 min after flotation. Thechanges are mostly reversible in the early stages, but be-come irreversible after extended treatment with light or withhigh concentrations of PEG. After treatment for 90 min, a
final spectrum was obtained from each sample. At 90 min,the spectra had nearly reached equilibrium.As nonchloroplast compartments lose water, the peak on
the left decreases in intensity but does not shift. Whenchloroplasts lose water, the peak on the right decreases inintensity and simultaneously shifts farther to the right. Forexample, one can see in Fig. 2 that chloroplasts retainedwater in the dark as the PEG concentration increased from0.2 to 0.4 g/g (i.e., the peak on the right in the 0.4 g/g tracehas the same height and occupies the same position as thecorresponding peaks below it), but nonchloroplast compart-ments lost water under the same conditions (i.e., the peak on
the left in the 0.4 g/g trace is slightly shorter than thosebelow it). Both the chloroplast and the nonchloroplast com-
partments lost water in the dark on 0.5 g/g PEG (i.e., bothpeaks are shorter and the chloroplast peak has shifted to theright). Water loss was greater in leaf discs that were exposedto light.
1.1 - RWC
1.0 - ---
0.9
0.8-
0.7-
0.6-
0.5-
0.4
0.3-4 -3 -2 -1 0
Water potential (MPa)
1.1 - RCWC
1.0 - --
0.9
0.8-
0.7-
0.6-
0.5 -
0.4-
0.3-4 -3 -2 -1 0
Water potential (MPa)
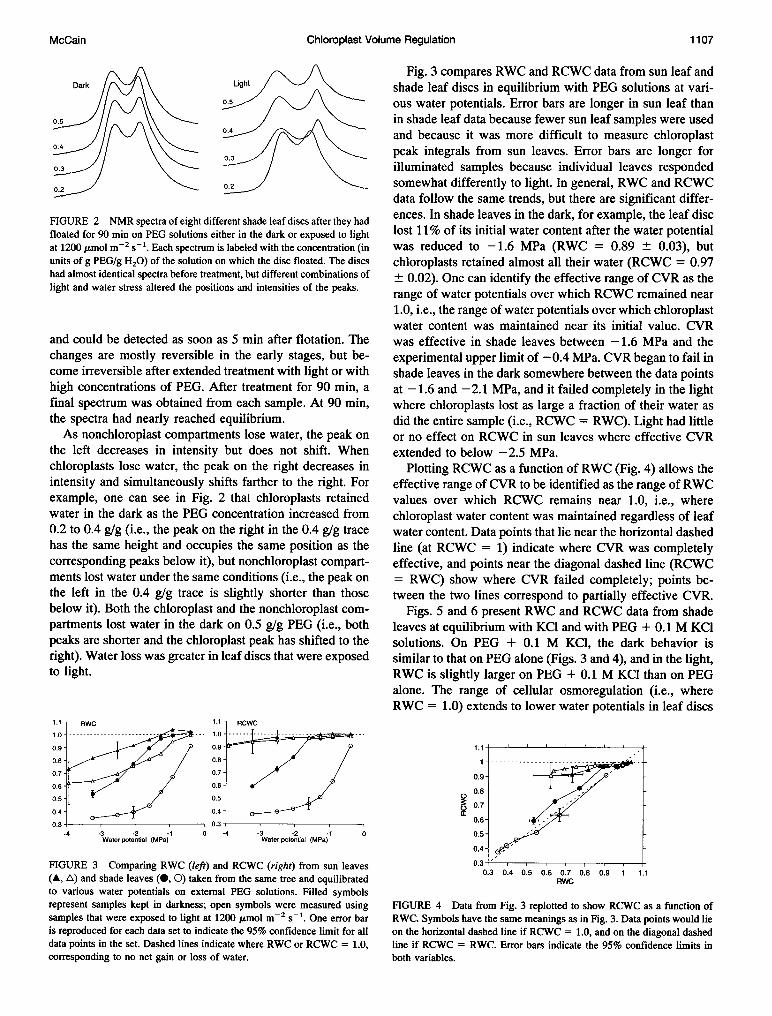
FIGURE 3 Comparing RWC (left) and RCWC (right) from sun leaves(A, A) and shade leaves (0, 0) taken from the same tree and equilibratedto various water potentials on external PEG solutions. Filled symbolsrepresent samples kept in darkness; open symbols were measured usingsamples that were exposed to light at 1200 ,umol m-2 s- . One error baris reproduced for each data set to indicate the 95% confidence limit for alldata points in the set. Dashed lines indicate where RWC or RCWC = 1.0,corresponding to no net gain or loss of water.
Fig. 3 compares RWC and RCWC data from sun leaf andshade leaf discs in equilibrium with PEG solutions at vari-ous water potentials. Error bars are longer in sun leaf thanin shade leaf data because fewer sun leaf samples were usedand because it was more difficult to measure chloroplastpeak integrals from sun leaves. Error bars are longer forilluminated samples because individual leaves respondedsomewhat differently to light. In general, RWC and RCWCdata follow the same trends, but there are significant differ-ences. In shade leaves in the dark, for example, the leaf disclost 11% of its initial water content after the water potentialwas reduced to -1.6 MPa (RWC = 0.89 ± 0.03), butchloroplasts retained almost all their water (RCWC = 0.97± 0.02). One can identify the effective range of CVR as therange of water potentials over which RCWC remained near1.0, i.e., the range of water potentials over which chloroplastwater content was maintained near its initial value. CVRwas effective in shade leaves between -1.6 MPa and theexperimental upper limit of -0.4 MPa. CVR began to fail inshade leaves in the dark somewhere between the data pointsat -1.6 and -2.1 MPa, and it failed completely in the lightwhere chloroplasts lost as large a fraction of their water asdid the entire sample (i.e., RCWC = RWC). Light had littleor no effect on RCWC in sun leaves where effective CVRextended to below -2.5 MPa.
Plotting RCWC as a function of RWC (Fig. 4) allows theeffective range of CVR to be identified as the range of RWCvalues over which RCWC remains near 1.0, i.e., wherechloroplast water content was maintained regardless of leafwater content. Data points that lie near the horizontal dashedline (at RCWC = 1) indicate where CVR was completelyeffective, and points near the diagonal dashed line (RCWC= RWC) show where CVR failed completely; points be-tween the two lines correspond to partially effective CVR.
Figs. 5 and 6 present RWC and RCWC data from shadeleaves at equilibrium with KCI and with PEG + 0.1 M KCIsolutions. On PEG + 0.1 M KCI, the dark behavior issimilar to that on PEG alone (Figs. 3 and 4), and in the light,RWC is slightly larger on PEG + 0.1 M KCI than on PEGalone. The range of cellular osmoregulation (i.e., whereRWC = 1.0) extends to lower water potentials in leaf discs
1.1-
0.9-
0.8-
C)80_7-0.6-
0.5-
0.4 -
0.30.3 0.4 0.5 0.6 0.7 0.8 0.9 1 1.1
RWC
FIGURE 4 Data from Fig. 3 replotted to show RCWC as a function ofRWC. Symbols have the same meanings as in Fig. 3. Data points would lieon the horizontal dashed line if RCWC = 1.0, and on the diagonal dashedline if RCWC = RWC. Error bars indicate the 95% confidence limits inboth variables.
McCain 1107
Volume 69 September 1995
1.2RCWC
1.08
0.8-
0.6/
0.4 r
0.2-4 -3 -2 -1 0
Water potenfial (MPa)
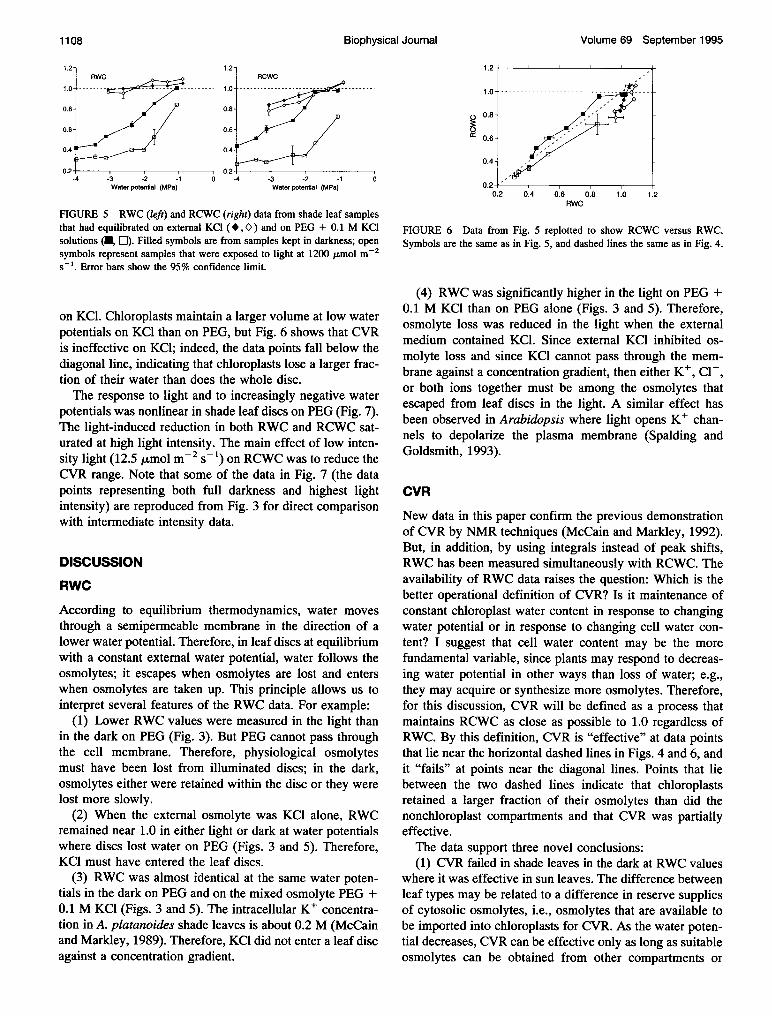
FIGURE 5 RWC (left) and RCWC (right) data from shade leaf samplesthat had equilibrated on external KCl (*,O ) and on PEG + 0.1 M KClsolutions (U, El). Filled symbols are from samples kept in darkness; opensymbols represent samples that were exposed to light at 1200 ,umol m-2s-'. Error bars show the 95% confidence limit.
on KCl. Chloroplasts maintain a larger volume at low waterpotentials on KCl than on PEG, but Fig. 6 shows that CVRis ineffective on KCl; indeed, the data points fall below thediagonal line, indicating that chloroplasts lose a larger frac-tion of their water than does the whole disc.The response to light and to increasingly negative water
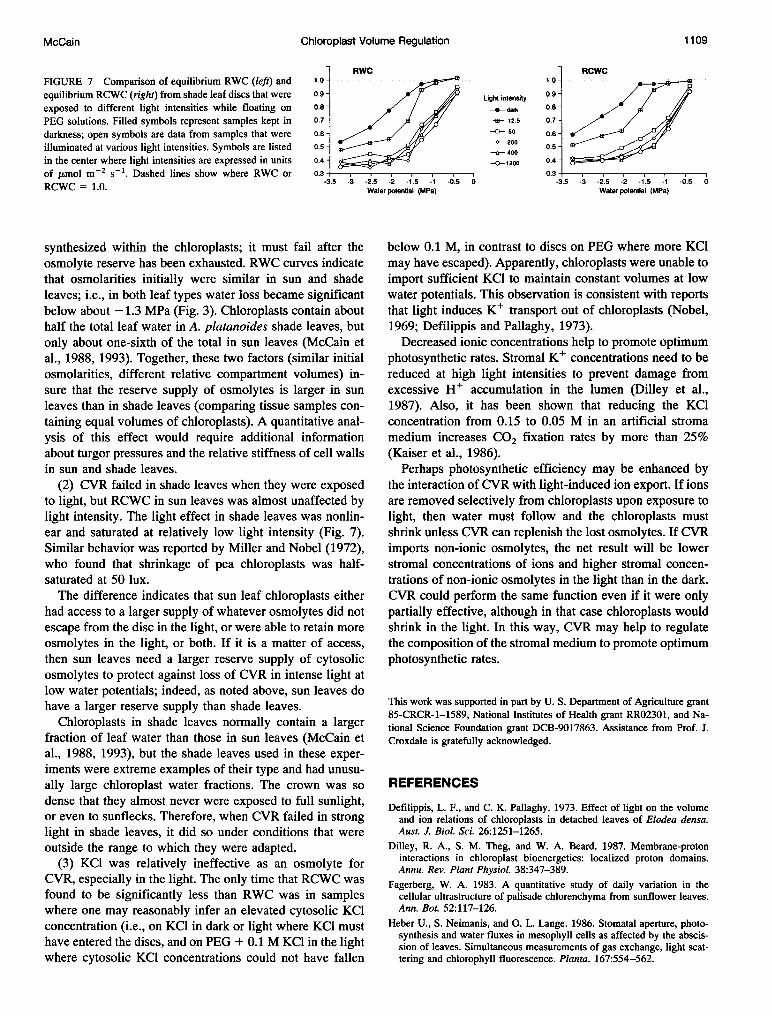
potentials was nonlinear in shade leaf discs on PEG (Fig. 7).The light-induced reduction in both RWC and RCWC sat-urated at high light intensity. The main effect of low inten-sity light (12.5 ,umol m-2 s'-) on RCWC was to reduce theCVR range. Note that some of the data in Fig. 7 (the datapoints representing both full darkness and highest lightintensity) are reproduced from Fig. 3 for direct comparisonwith intermediate intensity data.
DISCUSSION
RWC
According to equilibrium thermodynamics, water moves
through a semipermeable membrane in the direction of a
lower water potential. Therefore, in leaf discs at equilibriumwith a constant external water potential, water follows theosmolytes; it escapes when osmolytes are lost and enterswhen osmolytes are taken up. This principle allows us tointerpret several features of the RWC data. For example:
(1) Lower RWC values were measured in the light thanin the dark on PEG (Fig. 3). But PEG cannot pass throughthe cell membrane. Therefore, physiological osmolytesmust have been lost from illuminated discs; in the dark,osmolytes either were retained within the disc or they were
lost more slowly.(2) When the external osmolyte was KCl alone, RWC
remained near 1.0 in either light or dark at water potentialswhere discs lost water on PEG (Figs. 3 and 5). Therefore,KCl must have entered the leaf discs.
(3) RWC was almost identical at the same water poten-tials in the dark on PEG and on the mixed osmolyte PEG +0.1 M KCl (Figs. 3 and 5). The intracellular K+ concentra-tion in A. platanoides shade leaves is about 0.2 M (McCainand Markley, 1989). Therefore, KCl did not enter a leaf discagainst a concentration gradient.
1.2
1.0 - --
o0.8-
0.6-
0.4-
0.2- _0.2 0.4 0.6 0.8 1.0 1.2
RWC
FIGURE 6 Data from Fig. 5 replotted to show RCWC versus RWC.Symbols are the same as in Fig. 5, and dashed lines the same as in Fig. 4.
(4) RWC was significantly higher in the light on PEG +0.1 M KCl than on PEG alone (Figs. 3 and 5). Therefore,osmolyte loss was reduced in the light when the externalmedium contained KCl. Since external KCl inhibited os-molyte loss and since KCl cannot pass through the mem-brane against a concentration gradient, then either K+, Cl-,or both ions together must be among the osmolytes thatescaped from leaf discs in the light. A similar effect hasbeen observed in Arabidopsis where light opens K+ chan-nels to depolarize the plasma membrane (Spalding andGoldsmith, 1993).
CVR
New data in this paper confirm the previous demonstrationof CVR by NMR techniques (McCain and Markley, 1992).But, in addition, by using integrals instead of peak shifts,RWC has been measured simultaneously with RCWC. Theavailability of RWC data raises the question: Which is thebetter operational definition of CVR? Is it maintenance ofconstant chloroplast water content in response to changingwater potential or in response to changing cell water con-
tent? I suggest that cell water content may be the more
fundamental variable, since plants may respond to decreas-ing water potential in other ways than loss of water; e.g.,
they may acquire or synthesize more osmolytes. Therefore,for this discussion, CVR will be defined as a process thatmaintains RCWC as close as possible to 1.0 regardless ofRWC. By this definition, CVR is "effective" at data pointsthat lie near the horizontal dashed lines in Figs. 4 and 6, andit "fails" at points near the diagonal lines. Points that liebetween the two dashed lines indicate that chloroplastsretained a larger fraction of their osmolytes than did thenonchloroplast compartments and that CVR was partiallyeffective.The data support three novel conclusions:(1) CVR failed in shade leaves in the dark at RWC values
where it was effective in sun leaves. The difference betweenleaf types may be related to a difference in reserve suppliesof cytosolic osmolytes, i.e., osmolytes that are available tobe imported into chloroplasts for CVR. As the water poten-tial decreases, CVR can be effective only as long as suitableosmolytes can be obtained from other compartments or
1.2-
-3 -2 -1Water potential (MPa)
0
1108 Biophysical Journal
McCain Chloroplast Volume Regulation 1109
RWC RCWCFIGURE 7 Comparison of equilibrium RWC (left) and 1.0 . 1.0.....1o- ..
equilibrium RCWC (right) from shade leaf discs that were 0.9 - Ught intensity 0.9exposed to different light intensities while floating on 0.8- ,/ /da* 0.8-PEG solutions. Filled symbols represent samples kept in 0.7- X 12.5 0.7-darkness; open symbols are data from samples that were 0.6- -G 50 0.6-
illuminated at various light intensities. Symbols are listed 0.5 200 0.5-e- 400
in the center where light intensities are expressed in units 0.4- -0-1200 0.4-
of ,umol m-2 s-1. Dashed lines show where RWC or 0.3 0.3-RCWC,_ _ 0 -3-5 -3 -2.5 -2 -1.5 -1 -0.5 0 -3.5 -3 -2.5 -2 -1.5 -1 -0.5 0RCWC - 1.0. ~ ~ Water potential (MPa) Water potential (MPa)
synthesized within the chloroplasts; it must fail after theosmolyte reserve has been exhausted. RWC curves indicatethat osmolarities initially were similar in sun and shadeleaves; i.e., in both leaf types water loss became significantbelow about -1.3 MPa (Fig. 3). Chloroplasts contain abouthalf the total leaf water in A. platanoides shade leaves, butonly about one-sixth of the total in sun leaves (McCain etal., 1988, 1993). Together, these two factors (similar initialosmolarities, different relative compartment volumes) in-sure that the reserve supply of osmolytes is larger in sunleaves than in shade leaves (comparing tissue samples con-taining equal volumes of chloroplasts). A quantitative anal-ysis of this effect would require additional informationabout turgor pressures and the relative stiffness of cell wallsin sun and shade leaves.
(2) CVR failed in shade leaves when they were exposedto light, but RCWC in sun leaves was almost unaffected bylight intensity. The light effect in shade leaves was nonlin-ear and saturated at relatively low light intensity (Fig. 7).Similar behavior was reported by Miller and Nobel (1972),who found that shrinkage of pea chloroplasts was half-saturated at 50 lux.The difference indicates that sun leaf chloroplasts either
had access to a larger supply of whatever osmolytes did notescape from the disc in the light, or were able to retain moreosmolytes in the light, or both. If it is a matter of access,then sun leaves need a larger reserve supply of cytosolicosmolytes to protect against loss of CVR in intense light atlow water potentials; indeed, as noted above, sun leaves dohave a larger reserve supply than shade leaves.
Chloroplasts in shade leaves normally contain a largerfraction of leaf water than those in sun leaves (McCain etal., 1988, 1993), but the shade leaves used in these exper-iments were extreme examples of their type and had unusu-ally large chloroplast water fractions. The crown was sodense that they almost never were exposed to full sunlight,or even to sunflecks. Therefore, when CVR failed in stronglight in shade leaves, it did so under conditions that wereoutside the range to which they were adapted.
(3) KCl was relatively ineffective as an osmolyte forCVR, especially in the light. The only time that RCWC wasfound to be significantly less than RWC was in sampleswhere one may reasonably infer an elevated cytosolic KCIconcentration (i.e., on KCI in dark or light where KCl musthave entered the discs, and on PEG + 0.1 M KCl in the lightwhere cytosolic KCI concentrations could not have fallen
below 0.1 M, in contrast to discs on PEG where more KClmay have escaped). Apparently, chloroplasts were unable toimport sufficient KCl to maintain constant volumes at lowwater potentials. This observation is consistent with reportsthat light induces K+ transport out of chloroplasts (Nobel,1969; Defilippis and Pallaghy, 1973).
Decreased ionic concentrations help to promote optimumphotosynthetic rates. Stromal K+ concentrations need to bereduced at high light intensities to prevent damage fromexcessive H+ accumulation in the lumen (Dilley et al.,1987). Also, it has been shown that reducing the KCIconcentration from 0.15 to 0.05 M in an artificial stromamedium increases CO2 fixation rates by more than 25%(Kaiser et al., 1986).
Perhaps photosynthetic efficiency may be enhanced bythe interaction of CVR with light-induced ion export. If ionsare removed selectively from chloroplasts upon exposure tolight, then water must follow and the chloroplasts mustshrink unless CVR can replenish the lost osmolytes. If CVRimports non-ionic osmolytes, the net result will be lowerstromal concentrations of ions and higher stromal concen-trations of non-ionic osmolytes in the light than in the dark.CVR could perform the same function even if it were onlypartially effective, although in that case chloroplasts wouldshrink in the light. In this way, CVR may help to regulatethe composition of the stromal medium to promote optimumphotosynthetic rates.
This work was supported in part by U. S. Department of Agriculture grant85-CRCR-1-1589, National Institutes of Health grant RR02301, and Na-tional Science Foundation grant DCB-9017863. Assistance from Prof. J.Croxdale is gratefully acknowledged.
REFERENCES
Defilippis, L. F., and C. K. Pallaghy. 1973. Effect of light on the volumeand ion relations of chloroplasts in detached leaves of Elodea densa.Aust. J. Bio. Sci. 26:1251-1265.
Dilley, R. A., S. M. Theg, and W. A. Beard. 1987. Membrane-protoninteractions in chloroplast bioenergetics: localized proton domains.Annu. Rev. Plant Physiol. 38:347-389.
Fagerberg, W. A. 1983. A quantitative study of daily variation in thecellular ultrastructure of palisade chlorenchyma from sunflower leaves.Ann. Bot. 52:117-126.
Heber U., S. Neimanis, and 0. L. Lange. 1986. Stomatal aperture, photo-synthesis and water fluxes in mesophyll cells as affected by the abscis-sion of leaves. Simultaneous measurements of gas exchange, light scat-tering and chlorophyll fluorescence. Planta. 167:554-562.
1110 Biophysical Journal Volume 69 September 1995
Kaiser, W. M., G. Schroppel-Meier, and E. Wirth. 1986. Enzyme activitiesin an artificial stroma medium. An experimental model for studyingeffects of dehydration on photosynthesis. Planta. 167:292-299.
Lawlor, D. W. 1987. Photosynthesis: Metabolism, Control and Physiology.John Wiley and Sons, New York.
McCain, D. C. 1986. Orientation of chloroplasts in leaves by 1H NMRspectroscopy. In Modem Methods in Plant Biology, Vol. 2. H. F.Linskens and J. F. Jackson, editors. Springer-Verlag, Heidelburg.127-147.
McCain, D. C., J. Boetsch, and J. Croxdale. 1994. NMR detection oflight-induced change in chloroplasts: a new technique to study thylakoidenergization in vivo. J. Magn. Reson. B105:177-179.
McCain, D. C., J. Croxdale J., and J. L. Markley. 1988. Water is allocateddifferently to chloroplasts in sun and shade leaves. Plant Physiol. 86:16-18.
McCain, D. C., J. Croxdale, and J. L. Markley. 1993. The spatial distri-bution of chloroplast water in Acer platanoides sun and shade leaves.Plant Cell Environ. 16:727-733.
McCain, D. C., and J. L. Markley. 1985. A theory and a model forinterpreting the proton NMR spectra of water in plant leaves. Biophys. J.48:687-694.
McCain, D. C., and J. L. Markley. 1989. More manganese accumulates inmaple sun leaves than in shade leaves. Plant Physiol. 90:1417-1421.
McCain, D. C., and J. L. Markley. 1992. In vivo study of chloroplastvolume regulation. Biophys. J. 61:1207-1212.
McCain, D. C., T. C. Selig, Govindjee, and J. L. Markley. 1984. Someplant leaves have orientation-dependent EPR and NMR spectra. Proc.Natl. Acad. Sci. USA. 81:748-752.
Miller, M. M., and P. S. Nobel. 1972. Light-induced changes in theultrastructure of pea chloroplasts in vivo. Plant Physiol. 49:535-541.
Nagai, N. 1993. Regulation of intracellular movements in plant cells byenvironmental stimuli. Int. Rev. Cytology 145:251-310.
Nobel, P. S. 1968. Light-induced chloroplast shrinkage in vivo detectableafter rapid isolation of chloroplasts from Pisum sativum. Plant Physiol.43:781-787.
Nobel, P. S. 1969. Light-induced changes in the ionic content of chloro-plasts in Pisum sativum. Biochim. Biophys. Acta. 172:134-143.
Nobel, P. S., D. T. Chang D. T., C. Wang, S. S. Smith, and D. E. Barcus.1969. Initial ATP formation, NADP reduction, CO2 fixation, and chlo-roplast flattening upon illuminating pea leaves. Plant Physiol. 44:655-661.
Robinson, S. P. 1985. Osmotic adjustment by intact isolated chloroplasts inresponse to osmotic stress and its effect on photosynthesis and chloro-plast volume. Plant Physiol. 79:996-1002.
Santakumari, M., and G. A. Berkowitz. 1991. Chloroplast volume: cellwater potential relationships and acclimation of photosynthesis to leafwater deficits. Photosynthesis Res. 28:9-20.
Sen Gupta, A., and G. A. Berkowitz. 1988. Chloroplast osmotic adjustmentand water stress effects on photosynthesis. Plant Physiol. 88:200-206.
Spalding, E. P., and M. H. M. Goldsmith. 1993. Activation of ArabidopsisK+ channels by ATP. Plant Physiol. 102S:21.
Zurzycki, J., and H. Metzner. 1977. Volume changes of chloroplasts invivo at high densities of blue and red radiation. Photosynthetica. 11:260-267.


![Mitochondrial and Chloroplast Stress Responses …...Mitochondrial and Chloroplast Stress Responses Are Modulated in Distinct Touch and Chemical Inhibition Phases1[OPEN] Olivier Van](https://img.pdfslide.net/doc/110x75/5ea35083ef94da43374f208c/mitochondrial-and-chloroplast-stress-responses-mitochondrial-and-chloroplast.jpg)


![6065914 Stress Psychological Disorders Combined[1]](https://img.pdfslide.net/doc/110x75/577daafc1a28ab223f8bbe81/6065914-stress-psychological-disorders-combined1.jpg)