Embed Size (px)
Citation preview
HAL Id: inserm-00607669https://www.hal.inserm.fr/inserm-00607669
Submitted on 10 Jul 2011
HAL is a multi-disciplinary open accessarchive for the deposit and dissemination of sci-entific research documents, whether they are pub-lished or not. The documents may come fromteaching and research institutions in France orabroad, or from public or private research centers.
L’archive ouverte pluridisciplinaire HAL, estdestinée au dépôt et à la diffusion de documentsscientifiques de niveau recherche, publiés ou non,émanant des établissements d’enseignement et derecherche français ou étrangers, des laboratoirespublics ou privés.
Combined passive detection and ultrafast active imagingof cavitation events induced by short pulses of
high-intensity ultrasound.Jérôme Gateau, Jean-François Aubry, Mathieu Pernot, Mathias Fink, Mickaël
Tanter
To cite this version:Jérôme Gateau, Jean-François Aubry, Mathieu Pernot, Mathias Fink, Mickaël Tanter. Combinedpassive detection and ultrafast active imaging of cavitation events induced by short pulses of high-intensity ultrasound.. IEEE Trans Ultrason Ferroelectr Freq Control, 2011, 58 (3), pp.517-32.<10.1109/TUFFC.2011.1836>. <inserm-00607669>
IEEE Trans Ultrason Ferroelectr Freq Control . Author manuscript
Page /1 20
Combined passive detection and ultrafast active imaging of cavitationevents induced by short pulses of high-intensity ultrasoundJ r me Gateau é ô * , Jean-Fran ois Aubry ç , Mathieu Pernot , Mathias Fink , Micka l Tanterë
Physique des ondes pour la m decine é INSERM : U979 , Universit Paris Diderot - Paris 7 é , CNRS : UMR7587 , ESPCI ParisTech , 10rue Vauquelin 75005 Paris, FR*
Correspondence should be adressed to: J r me Gateau é ô <[email protected] >
Abstract
The activation of natural gas nuclei to induce larger bubbles is possible using short ultrasonic excitations of high amplitude, and is
required for ultrasound cavitation therapies. However, little is known about the distribution of nuclei in tissues. Therefore, the
acoustic pressure level necessary to generate bubbles in a targeted zone and their exact location are currently difficult to predict. In
order to monitor the initiation of cavitation activity, a novel all-ultrasound technique sensitive to single nucleation events is presented
here. It is based on combined passive detection and ultrafast active imaging over a large volume and with the same multi-element
probe.
Bubble nucleation was induced with a focused transducer (660kHz, f 1) driven by a high power (up to 300 W) electric burst of one#=to two cycles. Detection was performed with a linear array (4 7MHz) aligned with the single-element focal point. experiments– In vitro
in gelatin gel and muscular tissue are presented. The synchronized passive detection enabled radio-frequency data to be recorded,
comprising high-frequency coherent wave fronts as signatures of the acoustic emissions linked to the activation of the nuclei. Active
change detection images were obtained by subtracting echoes collected in the unucleated medium. These indicated the appearance of
stable cavitating regions. Thanks to the ultrafast frame rate, active detection occurred as soon as 330 s after the high amplitudeμexcitation and the dynamics of the induced regions were studied individually.
MESH Keywords Algorithms ; Animals ; Gases ; chemistry ; Gelatin ; Microbubbles ; Muscle, Skeletal ; ultrasonography ; Phantoms, Imaging ; Sheep ; Signal Processing,
Computer-Assisted ; Transducers ; Ultrasonography ; instrumentation ; methods
Author Keywords single nucleation events ; ultrafast active imaging ; passive detection
Introduction
Gas nuclei have been shown to exist naturally in human and animal tissues . The origin and persistence of these pre-existing nuclei [1 ]are still somewhat contentious subjects. Several nucleation mechanisms have been proposed to explain the appearance of transientin vivo
gas bodies in living systems . However, because of their randomness and the rapid dissolution of the potentially induced nuclei, these[1 ]nucleation mechanisms are usually insufficient to explain the observed bubble formation, particularly during decompression experiments.
Therefore, the stabilization of sub-micrometer gas bodies by intracellular crevices on boundary surfaces or by the absorption of[2 ]surfactant molecules onto their surfaces was suggested, leading to the idea of persistent gas nuclei , . However, none of the above[3 ] [1 ] [4 ]mechanisms currently have strong experimental proof Consequently, gas nuclei available in the living body are highly unknown.in vivo.
One can nevertheless assume that their spatial distribution within the body is heterogeneous because of the variety of structures and
molecular contents of living tissues. Moreover, these stabilized gas bodies are most probably smaller than a few micrometers so as not to
be trapped by capillaries in normal living conditions. The high rarefaction pressure necessary to induce bubbles using a short ultrasonic
excitation tends to prove that they are even smaller (sub-micrometer sized).[5 ]
The formation of bubbles can actually be caused by the ultrasonic exposure of tissues. The activation of pre-existing nucleiin vivo
may either be thermally-mediated and then issued from ultrasonic heating, or mechanically-driven resulting from acoustic negative
pressure. Firstly, an increase in temperature may promote the growth of nuclei by raising the vapor pressure or the partial pressure of
dissolved gas in the medium . Due to viscous absorption, ultrasound induces local tissue heating so that bubble formation can be[6 ]assisted by this mechanism during long insonifications and especially during ultrasound thermal therapy using high-intensity focused
ultrasound (HIFU) . Secondly, during the rarefaction phase of an ultrasonic wave, pre-existing gas nuclei respond as if the pressure was[7 ]static, due to their very small size. This means that they grow explosively if the rarefaction pressure exceeds a threshold, as described by
Blake . This threshold depends on the size of the nuclei and the surface tension of the surrounding liquid, among other factors, and falls[8 ]with increasing size of the initial gas body. In order to generate bubbles mechanically and to avoid any effects associated with tissue
heating, short ultrasound pulses at a low duty cycle were used in the present work.
The mechanism of bubble formation by transient pressure reduction is of great interest for at least two therapeutic applications of
ultrasound: cavitation-enhanced heating and histotripsy . Indeed, in order to achieve cavitation-enhanced heating at low acoustic[9 ] [5 ]
IEEE Trans Ultrason Ferroelectr Freq Control . Author manuscript
Page /2 20
intensity, prior to any heating, bubbles have to be generated in tissue by activation of the natural nuclei . The induced bubbles are used[10 ]for their ability to accelerate tissue heating while they undergo driven cavitation activity. On the other hand, this mechanism of bubble
generation is precisely the key mechanism of the initiation phase in the histotripsy process . In this application, high-powered[11 ]ultrasonic bursts of a few cycles are first used to generate a bubble cloud. Just afterwards, subsequent insonifications, possibly less
powerful, sustain the cloud so as to efficiently erode and liquefy the tissue. In short, both of these applications first require the efficient
generation of bubbles larger than naturally occurring nuclei. Such bubbles are indeed easier to excite ultrasonically and can undergo stable
or inertial cavitation.
The transition from sub-micrometer gas nuclei to a bubble size suitable for ultrasonic therapy is usually called bubble nucleation and“ ”corresponds to the initiation of cavitation activity in the medium. It is only possible when the nucleation threshold pressure is exceeded.
Previous studies have shown that this nucleation threshold can be extremely high (above 10 MPa rarefaction pressure ) in[12 ]–[14 ] in vivo
the frequency range usually used in medical ultrasound. However, there is also evidence to show that when a bubble is induced and
eventually breaks up (either from collapse or shape instability), the medium becomes seeded with additional gas nuclei that may engender
new bubbles and possibly create a bubble cloud after some additional excitations. Similarly, single nucleated bubbles could reflect
subsequent ultrasonic excitations and may then contribute to the creation of a high rarefaction pressure that favors the appearance of
additional bubble nucleation sites . As a result, the nucleation threshold may locally be lower in a tissue where bubbles have already[15 ]been generated than in the initial untreated medium. The very first induced bubbles are thus of great importance.
Acoustic techniques developed for the detection of generated bubbles generally have a low sensitivity to single bubbles, andin vivo
they are mostly aimed, in cavitation therapies, at ensuring that a cloud is efficiently generated and that its location and cavitational activity
can be determined. Consequently, standard passive cavitation detection with a single-element transducer and standard B-mode[16 ]imaging have been used to monitor the histotripsy process. When a bubble cloud has been induced, the energy received on the passive[5 ]detector suddenly increases, and once the bubbles are large or numerous enough to form a region that scatters incident ultrasound more
strongly than its surroundings, a hyperechogenic region can be pointed out on the B-mode images. Such hyperechoes may also appear after
sonication in ultrasonic-guided HIFU treatments that generate bubbles . For these latter applications, additional passive imaging[17 ]techniques using ultrasound arrays were recently developed . Besides all of these acoustic monitoring techniques, high frame rate[18 ]–[20 ]optical studies investigated the dynamics of cloud formation in its early stages, showing the evolution from one insonification to another [
, or for the same multi-cycle excitation cycle after cycle . These optical imaging techniques provide valuable information but21 ]–[22 ] [15 ]they require transparent media, and thus can only be used with transparent tissues mimicking phantoms or liquids. These kinds of materials
may not reproduce the nucleation conditions of living tissue. Furthermore, the requirement of optical transparency excludes animal tissues,
which are optically diffusive, and limits the application for therapy monitoring at an early stage.
In this study, we present a novel all-ultrasound technique based on combined passive and active detection using a conventional
ultrasonic array to determine whether or not the nucleation threshold has been locally exceeded in tissue and to study the individual
behavior of the first bubbles induced. Because of the very high pressure amplitude necessary to initiate cavitation, high-amplitude focused
ultrasound has to be used for the formation of bubbles. The focusing indeed allows the acoustic energy to be spatially concentrated around
the focus. However, even if a favored zone for nucleation is created, the precise location of the nucleation events still remains unknown:
this depends on both the applied pressure amplitude and the unknown distribution of gas nuclei in tissues. The detection of these events
should then occur, at the same time, over a large volume in the vicinity of the focus, and on a local scale within this volume. The
localization of spots where cavitation has been initiated would indeed provide information on the spatial heterogeneities of the nucleation
threshold. Likewise, the detection should provide information to discriminate between the different nucleation events that may happen for
a single insonification. Therefore, a multi-element transducer with an electronic system allowing simultaneous acquisitions over all the
elements was advantageously used here as a detector. Such a detector has already been used for passive imaging of inertialin vitro
cavitation during HIFU thermal treatment , and for passive detection and localization of the nucleation events induced by short[18 ]–[20 ]pulses . Passively recording the radio-frequency signals emitted during the nucleation process is also of great interest here in order to[23 ]obtain information on the early nucleation event. However, passive detection techniques cannot provide information on the temporal
behavior over time of the first bubbles induced. Therefore, active detection of the bubbles is also of interest, and we propose to combine it
with passive detection in this paper. Bubble nucleation from short ultrasonic pulses will often lead to transient bubbles with a maximum
life span of the order of a few milliseconds . In order to obtain information on the evolution of the induced bubbles from their[21 ]–[22 ]creation, active detection should occur as soon as possible after nucleation but not at the same time to avoid interactions and it– [24 ] –should be repeated with a high frame rate to rapidly image the bubble dynamics. Moreover, as each short high power insonification
supposedly leads to a different nucleation situation, the detection should be done at one time over the entire volume. A stroboscopic or
synthetic aperture detection method, such as conventional B-mode imaging, would provide only partial information since at a specific time
only a small portion of space is probed. Years ago, our team developed an ultrafast imaging technique that allows such an active[25 ]detection by using plane-wave transmission at a high frame rate (up to 20,000 frames/s).
IEEE Trans Ultrason Ferroelectr Freq Control . Author manuscript
Page /3 20
In this paper, combined passive and ultrafast active detection of single bubble nucleation events is demonstrated both in gelin vitro
and in freshly excised sheep s thigh muscle. Both detection signals indicated that cavitation inception occurred. A passive method was’shown to be able to detect the acoustic emission that occurs during a nucleation event: non-linear scattering of the high-amplitude
excitation by a nucleus cavitating non-inertially, and/or acoustic emission from an inertially collapsing bubble. On the other hand, an
active method was shown to detect nucleated bubbles, using their ability to strongly scatter probing insonifications. Active images here
could only detect bubbles in the stable cavitation regime, and passive acquisition was able to detect both stable and inertial cavitation. The
correlation between the two kinds of detection enabled the nucleation site locations and their number to be confirmed, but each contained
some specific complementary information. The life of a bubble from its nucleation until its disappearance or next excitation was recorded
experimentally and presented here.
Materials and methodsConfocal set-up
The technique presented here is based on the combination of a focused therapy transducer and a multi-element imaging probe
confocally aligned (see ). The therapy transducer used in this study was a single-element piezo-composite focused transducerFigure 1
(Imasonic, Besan on, France). It had a central frequency of 660 kHz, a focal distance of 45 mm and an f-number equal to one. Thisçsingle-element transducer was driven by a function generator (AFG 3101, Tektronix, Beaverton, OR, USA) with a 300 Watt RF power
amplifier (A-300, Electronics & Innovation, Rochester, NY, USA). In order to take advantage of the power of the amplifier, an electrical
impedance matching circuit was used between the amplifier output and the transducer. The whole system allowed us to generate
high-amplitude short ultrasonic bursts of a few cycles in the medium on demand.
A linear array (L7-4, 4.0/7.0 MHz Linear Array Vascular, Philips Medical Systems, Seattle, WA, USA) was used to perform ultrasonic
imaging. It was made of 128 elements with a 5 MHz central frequency and a 0.3 mm pitch. It was driven by an ultrasound scanner
prototype (V1, SuperSonic Imagine, Aix en Provence, France) programmable per channel both in receiving (64 channels) and in
transmitting (128 channels) modes. In the receiving mode, acquisitions of radio frequency (RF) signals were simultaneously made on all
receiving channels and the collected data were transferred at a 2 GB/s rate to memory. Data treatments, such as the beamforming process,
were made post-acquisition. This allowed a very high frame rate acquisition (up to 20,000 frames/s) by the receiving aperture (64
consecutive elements) with a good spatial sampling. For active detection, the transmitting mode enabled a single plane-wave insonification
to be emitted along the entire aperture of the ultrasound array (6 MHz, 1 cycle). The backscattered echoes of the emitted plane-wave were
collected by the receiving channels. Therefore, using this method, a full image was obtained using a single transmission within the time a
single line would only be acquired using conventional imaging . This ultrafast method, initially developed for transient elastography,[26 ]leads to frame rates that are only limited by the back and forth propagation of the ultrasonic wave, and are typically around 10 kHz
depending on the depth. Both active ultrafast frame rate imaging and passive recording were successively achieved using this ultrasound
scanner and linear array. Geometry appropriate for extra-corporeal implementation was selected for the alignment of the twoin vivo
transducers: the imaging probe was positioned on the side of the therapy transducer, as can be seen in . Using a custom-builtFigure 1
adjustable transducer holder with two rotation axes that could be independently blocked, and a translation axis ( ), the linear arrayFigure 1
was manually positioned to place the focal point of the therapy transducer within the median image plan. The alignment procedure was
performed as follows. First, the whole system was immersed in a degassed water tank and the position of the maximum pressure resulting
after a 3-cycle excitation burst of the single element was found using a 400 m aperture needle hydrophone (HNA-400, Onda Corporation,μSunnyvale, CA) and a 3-D positioning system (Newport, Irvine, CA, USA). Then, plane-waves were emitted with the array while it was
moved relatively to the single element so as to both maximize the signal measured on the hydrophone and to obtain a good B-mode image
of the hydrophone tip. Finally, the position was fixed using screws and the location of the focal point in the median image plan was
determined using a conventional B-mode sequence to be at z 47.9 0.3 mm away for the array and in front of the 67 element.F = ± th
Sample preparation
Two different media were tested : gelatin gel and freshly harvested sheep thigh muscle tissues.in vitro
Gelatin gel
The gel phantom was prepared using a 5 (w/v) concentration of gelatin powder (Gelatin powder Technical, VWR BDH Prolabo,%West Chester, PA, USA). First, the gelatin powder was melted into stirred hot (~90 C) deionized water until a homogeneous and clear°gelatin solution was obtained. The hot solution was then gently poured into a plastic container with an ultrasound absorber at the bottom,
so as to obtain a 5 cm thick phantom. The solution stood still at room temperature for one hour so that bubbles potentially created while
pouring could move upward and be eliminated. The top end was then sealed off with an adapted lid and the whole container was stored in
a fridge overnight so that gelation could occur. The next morning, the lid was removed and degassed water was added on the top of the gel
to fill up the container. The transducers were immersed and placed almost in contact with the gelatin gel just before testing began.

IEEE Trans Ultrason Ferroelectr Freq Control . Author manuscript
Page /4 20
Animal muscle tissues
Muscle tissues were harvested from the thigh of a sacrificed sheep. Several tissue pieces about 5 cm thick the other dimensions being–in the order of 10 cm were prepared. First, the fat tissues were removed with a scalpel. Each piece was then placed with a small quantity–of physiologic serum in a plastic bag designed to store fresh food. Using an appropriate vacuum sealer (Figuine, FI.VS50), the air was
removed from the bag and the bag was sealed. The experiments were performed less than 24 h after the animal s death. The samples were’immersed in a tank filled with degassed water and with an ultrasound absorber at the bottom. The integrated transducer system was then
placed in contact with the sample and testing began.
Nucleation detection sequence
The nucleation detection sequence was composed of three main blocks: 1) standard B-mode imaging of the medium, 2) synchronized
high-amplitude emission and passive detection, and 3) ultrafast active detection. The whole nucleation detection sequence consisted of
these three blocks, followed in succession. First of all, before any bubble nucleation, standard B-mode images were acquired with the
linear array and displayed in real time. They allowed the focal zone of the therapy transducer to be positioned within the different
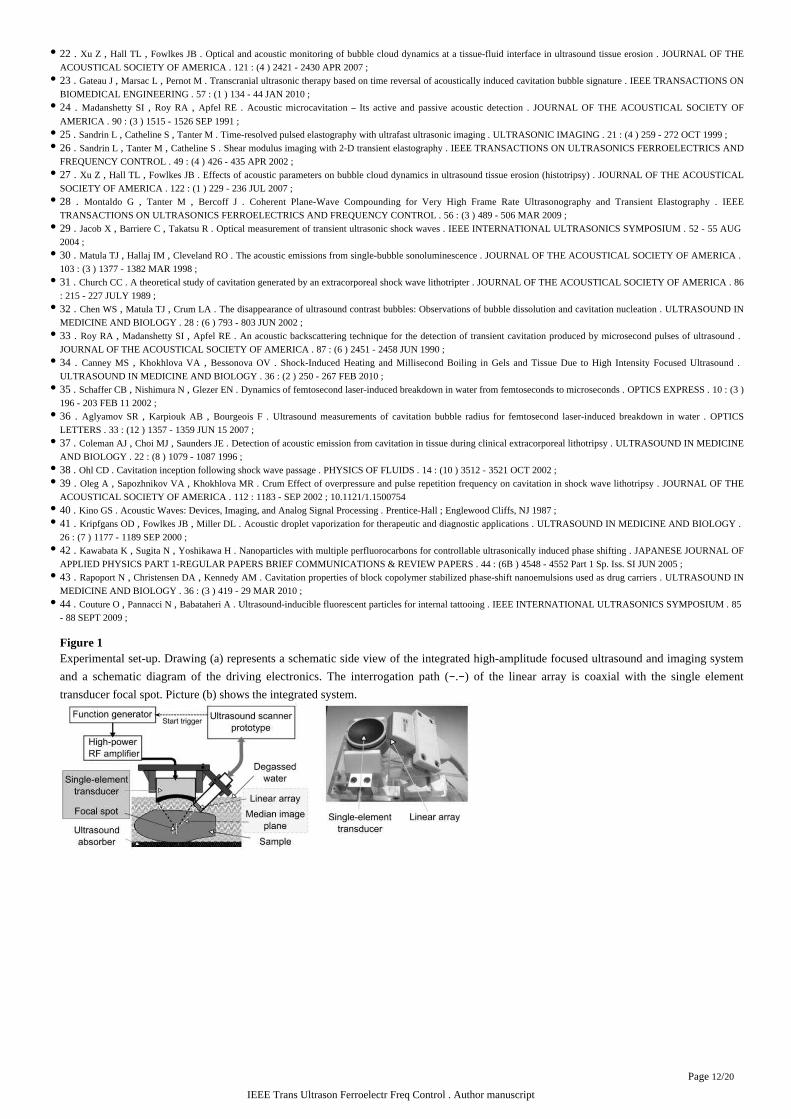
structures of the medium. Once the position was chosen, the actual detection sequence ( ) was launched. First, an ultrafast activeFigure 3
detection was made so as to provide a reference acquisition of the backscattered echoes from the un-nucleated medium ( , firstFigure 3
block on the time line, before t 0). Then, a synchronized passive detection was performed: a trigger pulse was sent by the ultrasound=scanner to the function generator, synchronizing the time lines of the transducers driving systems (t 0) and resulting in both the emission’ =of a high power short burst with the therapy transducer and passive recording with the multi-element transducer ( , first whiteFigure 3
block just after t 0). Immediately after this event, a new ultrafast active detection was performed in the potential nucleated medium. The=pattern of passive plus active detections (succession of blocks 2 and 3) was then repeated multiple times, and the raw RF data
corresponding to each detection acquisition were stored in the internal memory. These data were all collected at the end of the sequence,
and signal processing was performed using Matlab (Mathworks, Natick, MA, USA).
The reason for these multiple and successive high-amplitude excitations of the medium following the detection sequences is that
nucleation is a random process which might only occur after a great number of short high-amplitude excitations . The pulse repetition[16 ]frequency (PRF) of high power excitation has an influence on cloud initiation for histotripsy , and may thus influence the nucleation[27 ]conditions and the dynamics of the nucleated bubbles. The upper boundary of the PRF was linked here to the maximum ultrasound frame
rate and the minimum number of active images needed to obtain valuable information. Several PRF were implemented in the present study
( ).Table 1
Active cavitation detection and analysis
The area probed for all of the acquisitions was a rectangular area between 34 mm and 64 mm in depth, and between the 33 and the 97rd
element of the array (18.9 mm large). As a consequence, the minimum duration between two ultrafast images was T 110 s. Theth 1 min = μ
elevation beam width at 6 dB was measured as 3 1 mm at these depths.− ±
As already mentioned, thanks to the emission of plane-waves, a complete B-mode ultrasound image of the area was obtained at each
transmission (no iteration needed). This meant that less energy was sent through the medium than in conventional B-mode imaging, and as
a consequence the interactions between active detection and bubble behavior were reduced. However, since the ultrasound beams were not
focused in the transmit mode, the signal-to-noise ratio (SNR) and the contrast of the images were also reduced. Recently, Montaldo et al. [ demonstrated that the SNR and contrast can be regained by combining coherently backscattered echoes from successive compounded28 ]
plane wave insonifications at different angles. In this study, plane waves with 2 and 2 degree tilts were used to form the images after−coherent synthetic recombination. For each plane-wave emission, a single-cycle pulse at 6 MHz was transmitted to each element of the
array with the appropriate delay. In the receiving mode, the backscattered signals were sampled at 30 MHz. No time gain compensation
(TGC) was applied.
The reference recording, before any bubble nucleation, comprised two acquisitions of tilted plane-waves with opposite angles (Figure
), whereas the blocks following high-amplitude short excitation bursts consisted of 2.n acquisitions with alternately tilted insonification (3
) n was the number of pairs of active images acquired between two successive high-amplitude excitations; it varies with the PRFFigure 3 –of the high-amplitude excitation ( ). The time period between two successive acquisitions was set to T and depended on the PRF (Table 1 1
). The same period was chosen between the trigger pulse and the first active detection. The acquisition for the first image after aTable 1
high-amplitude excitation was then completed as soon as t 3 T .trigger + * 1
Spatial compound raw RF images were obtained by coherent recombination of the backscattered echoes from pairs of successive
plane-wave illuminations with opposite tilts and beamforming of the data in the receiving mode . Moreover, change detection (CD)[28 ]images were produced by an additional coherent subtraction of reference echoes prior to beamforming. This subtraction technique was
aimed at detecting the appearance or presence of bubbles in the medium, since induced bubbles were expected to cause the strongest
IEEE Trans Ultrason Ferroelectr Freq Control . Author manuscript
Page /5 20
scatter changes in the medium, either because they appeared or because their size changed due to a high-amplitude excitation. It is worth
noting that all of the images obtained here were provided in an absolute linear scale and were not normalized by the most reflective point
in the image. Their lateral resolution was 0.9 mm and the axial resolution was 0.26 mm.
Thanks to the linear scale of the images, the scattering amplitude of the nucleated bubbles was measured. Indeed, at the location where
a change appeared on the CD images, the value of the local maximum was proportional to the scattering amplitude from the bubbles due to
the coherent summation made during the beamforming process. In this study, small areas in the vicinity of the brightest spots on the CD
images were manually selected and the local maximum value was computed for each image.
These data illustrated the evolution of the scattering behavior of the bubble over time and between two successive high-amplitude
excitations.
Synchronized high-amplitude emission and passive detection
High amplitude insonification and calibration
The therapy transducer was calibrated in degassed water by measuring the ultrasonic displacement at focus with a standard heterodyne
interferometer. The experimental set-up used was previously described , and the digital demodulation scheme was used here. The[29 ]pressure waveforms were derived from the measured ultrasonic displacement assuming that the phase front of the wave was locally planar.
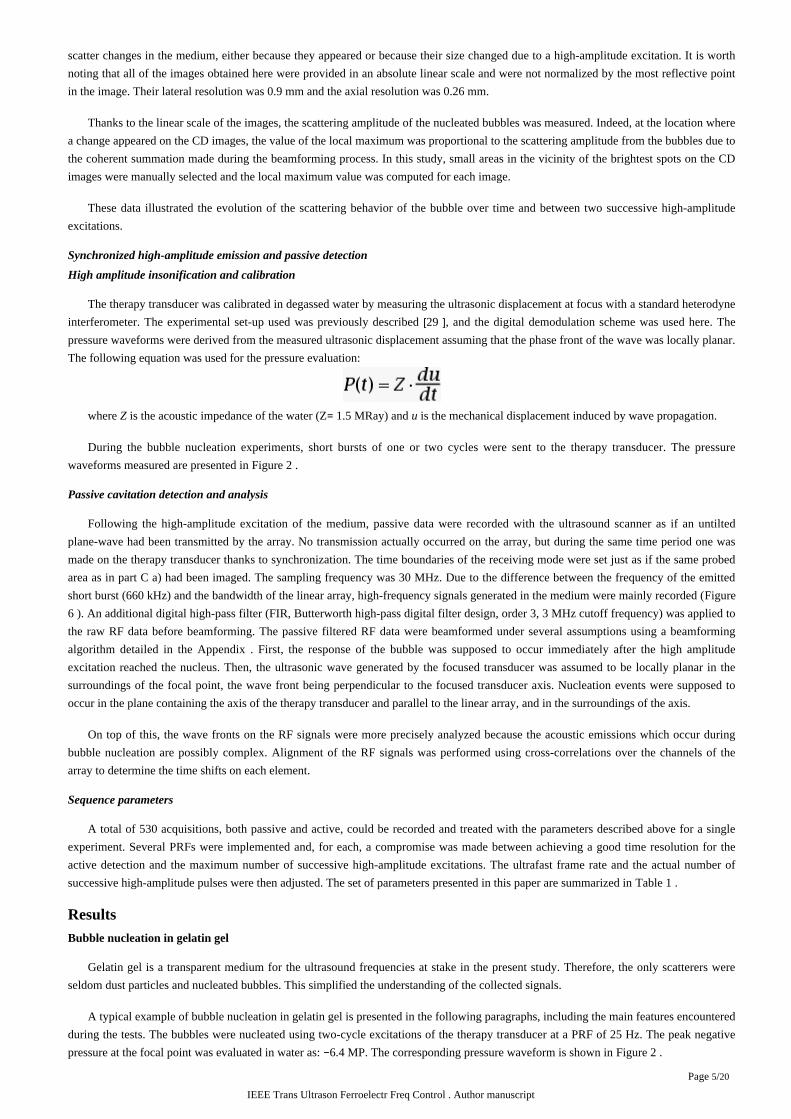
The following equation was used for the pressure evaluation:
where is the acoustic impedance of the water (Z 1.5 MRay) and is the mechanical displacement induced by wave propagation.Z = u
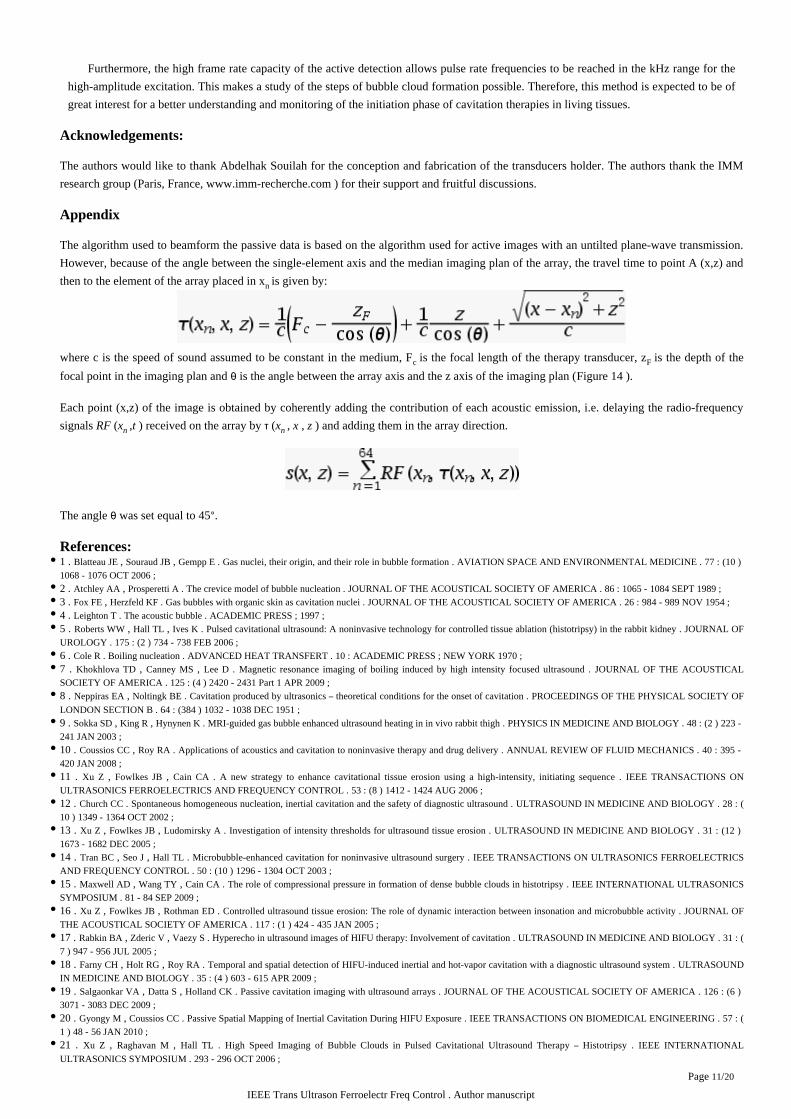
During the bubble nucleation experiments, short bursts of one or two cycles were sent to the therapy transducer. The pressure
waveforms measured are presented in .Figure 2
Passive cavitation detection and analysis
Following the high-amplitude excitation of the medium, passive data were recorded with the ultrasound scanner as if an untilted
plane-wave had been transmitted by the array. No transmission actually occurred on the array, but during the same time period one was
made on the therapy transducer thanks to synchronization. The time boundaries of the receiving mode were set just as if the same probed
area as in part C a) had been imaged. The sampling frequency was 30 MHz. Due to the difference between the frequency of the emitted
short burst (660 kHz) and the bandwidth of the linear array, high-frequency signals generated in the medium were mainly recorded (Figure
). An additional digital high-pass filter (FIR, Butterworth high-pass digital filter design, order 3, 3 MHz cutoff frequency) was applied to6
the raw RF data before beamforming. The passive filtered RF data were beamformed under several assumptions using a beamforming
algorithm detailed in the . First, the response of the bubble was supposed to occur immediately after the high amplitudeAppendix
excitation reached the nucleus. Then, the ultrasonic wave generated by the focused transducer was assumed to be locally planar in the
surroundings of the focal point, the wave front being perpendicular to the focused transducer axis. Nucleation events were supposed to
occur in the plane containing the axis of the therapy transducer and parallel to the linear array, and in the surroundings of the axis.
On top of this, the wave fronts on the RF signals were more precisely analyzed because the acoustic emissions which occur during
bubble nucleation are possibly complex. Alignment of the RF signals was performed using cross-correlations over the channels of the
array to determine the time shifts on each element.
Sequence parameters
A total of 530 acquisitions, both passive and active, could be recorded and treated with the parameters described above for a single
experiment. Several PRFs were implemented and, for each, a compromise was made between achieving a good time resolution for the
active detection and the maximum number of successive high-amplitude excitations. The ultrafast frame rate and the actual number of
successive high-amplitude pulses were then adjusted. The set of parameters presented in this paper are summarized in .Table 1
ResultsBubble nucleation in gelatin gel
Gelatin gel is a transparent medium for the ultrasound frequencies at stake in the present study. Therefore, the only scatterers were
seldom dust particles and nucleated bubbles. This simplified the understanding of the collected signals.
A typical example of bubble nucleation in gelatin gel is presented in the following paragraphs, including the main features encountered
during the tests. The bubbles were nucleated using two-cycle excitations of the therapy transducer at a PRF of 25 Hz. The peak negative
pressure at the focal point was evaluated in water as: 6.4 MP. The corresponding pressure waveform is shown in .− Figure 2
IEEE Trans Ultrason Ferroelectr Freq Control . Author manuscript
Page /6 20
Since the gel was free of scatterers, the B-mode images at the very beginning of the sequence were just used to check the targeted zone
and are not displayed here. Then, the detection sequence was run and the nucleation events were observed from the first high-amplitude
insonifications.
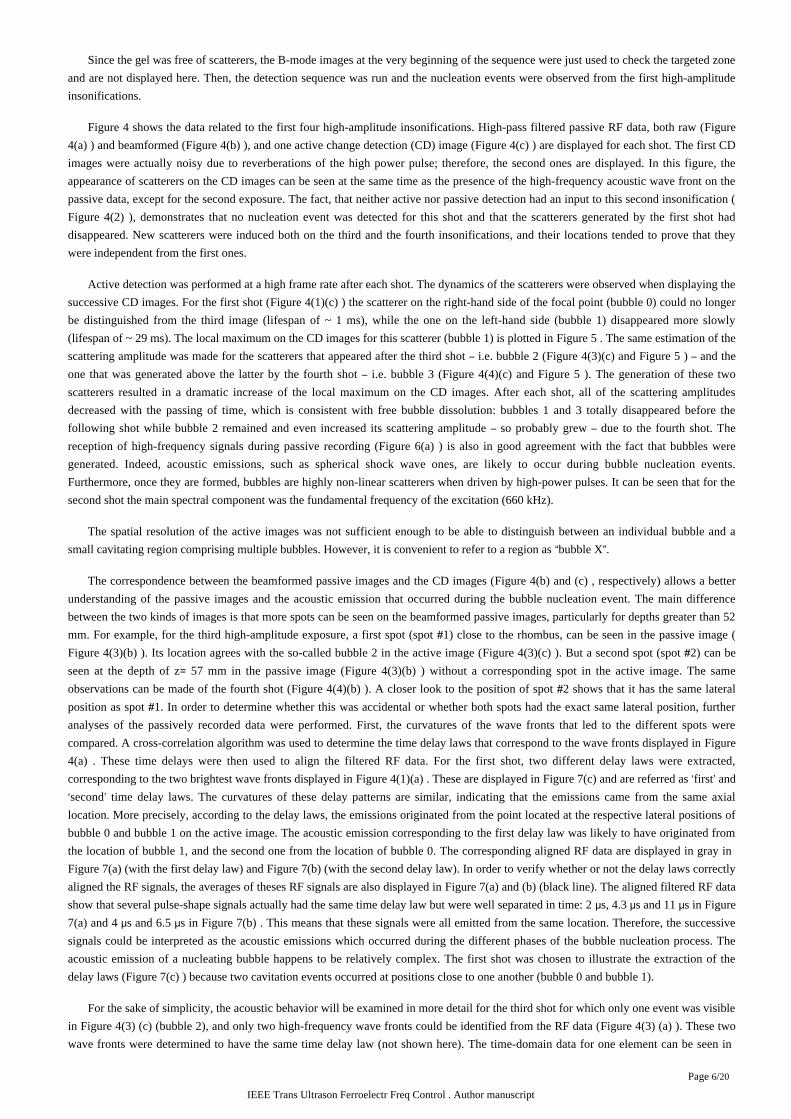
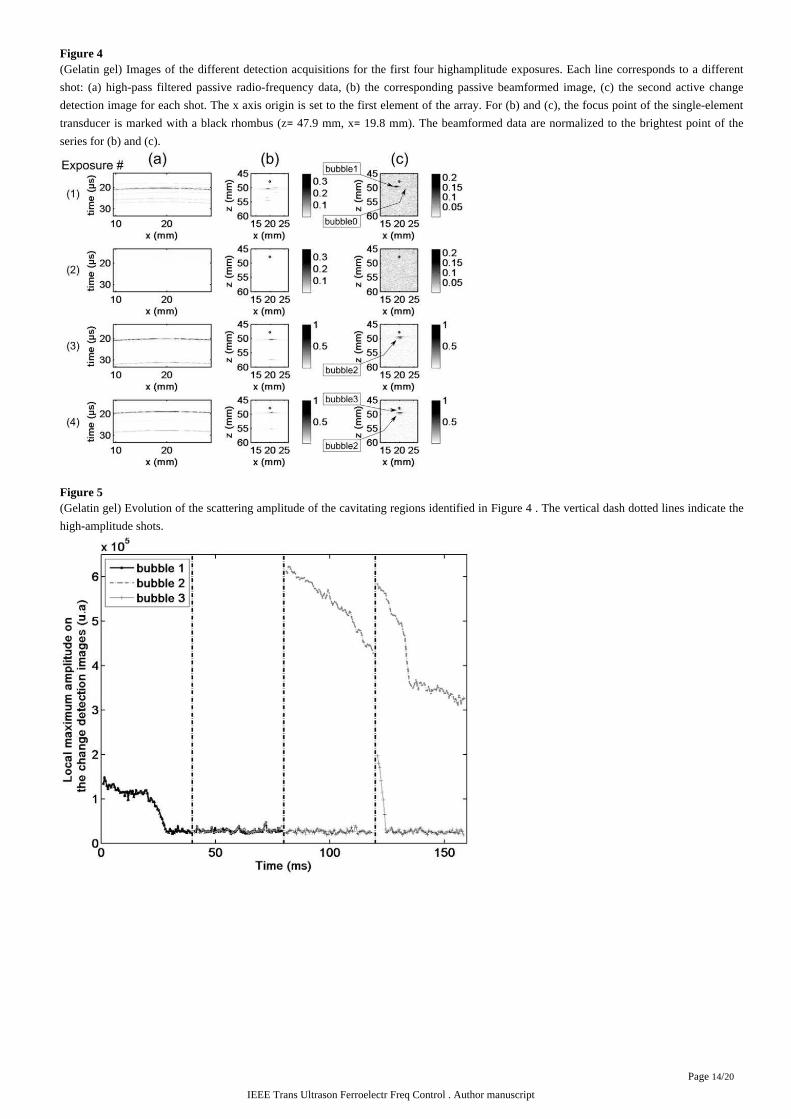
shows the data related to the first four high-amplitude insonifications. High-pass filtered passive RF data, both raw (Figure 4 Figure
) and beamformed ( ), and one active change detection (CD) image ( ) are displayed for each shot. The first CD4(a) Figure 4(b) Figure 4(c)
images were actually noisy due to reverberations of the high power pulse; therefore, the second ones are displayed. In this figure, the
appearance of scatterers on the CD images can be seen at the same time as the presence of the high-frequency acoustic wave front on the
passive data, except for the second exposure. The fact, that neither active nor passive detection had an input to this second insonification (
), demonstrates that no nucleation event was detected for this shot and that the scatterers generated by the first shot hadFigure 4(2)
disappeared. New scatterers were induced both on the third and the fourth insonifications, and their locations tended to prove that they
were independent from the first ones.
Active detection was performed at a high frame rate after each shot. The dynamics of the scatterers were observed when displaying the
successive CD images. For the first shot ( ) the scatterer on the right-hand side of the focal point (bubble 0) could no longerFigure 4(1)(c)
be distinguished from the third image (lifespan of ~ 1 ms), while the one on the left-hand side (bubble 1) disappeared more slowly
(lifespan of ~ 29 ms). The local maximum on the CD images for this scatterer (bubble 1) is plotted in . The same estimation of theFigure 5
scattering amplitude was made for the scatterers that appeared after the third shot i.e. bubble 2 ( and ) and the– Figure 4(3)(c) Figure 5 –one that was generated above the latter by the fourth shot i.e. bubble 3 ( and ). The generation of these two– Figure 4(4)(c) Figure 5
scatterers resulted in a dramatic increase of the local maximum on the CD images. After each shot, all of the scattering amplitudes
decreased with the passing of time, which is consistent with free bubble dissolution: bubbles 1 and 3 totally disappeared before the
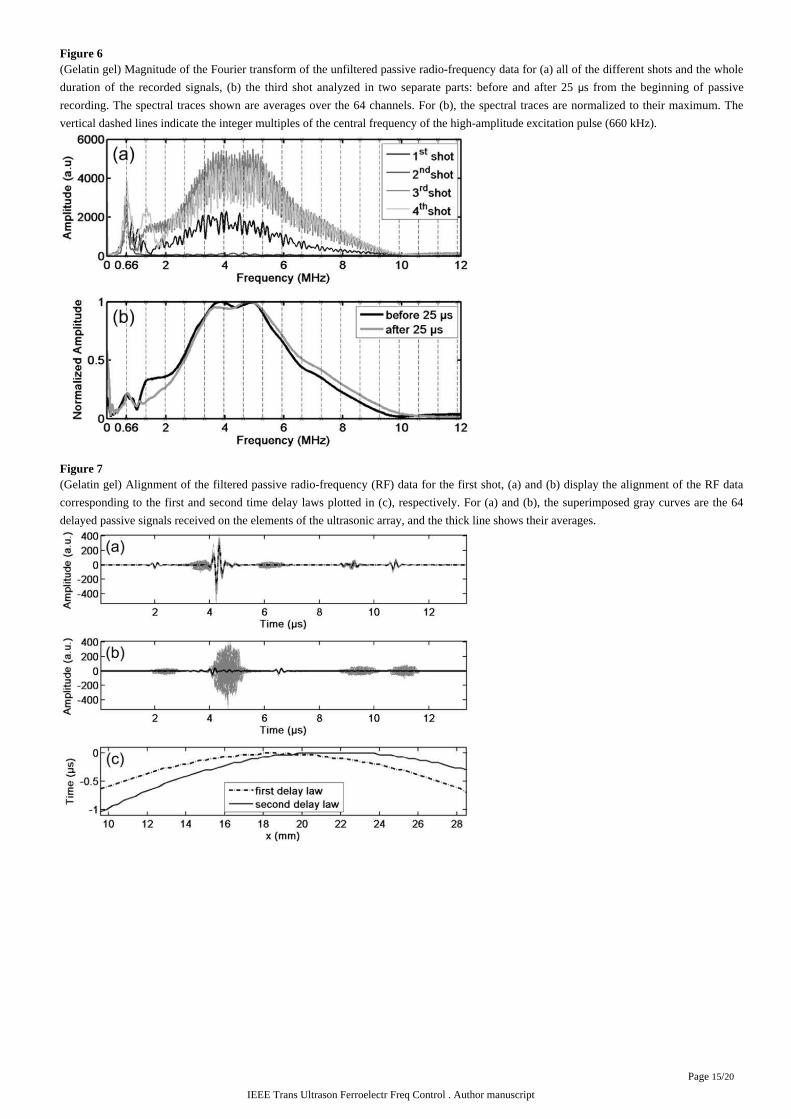
following shot while bubble 2 remained and even increased its scattering amplitude so probably grew due to the fourth shot. The– –reception of high-frequency signals during passive recording ( ) is also in good agreement with the fact that bubbles wereFigure 6(a)
generated. Indeed, acoustic emissions, such as spherical shock wave ones, are likely to occur during bubble nucleation events.
Furthermore, once they are formed, bubbles are highly non-linear scatterers when driven by high-power pulses. It can be seen that for the
second shot the main spectral component was the fundamental frequency of the excitation (660 kHz).
The spatial resolution of the active images was not sufficient enough to be able to distinguish between an individual bubble and a
small cavitating region comprising multiple bubbles. However, it is convenient to refer to a region as bubble X .“ ”
The correspondence between the beamformed passive images and the CD images ( , respectively) allows a betterFigure 4(b) and (c)
understanding of the passive images and the acoustic emission that occurred during the bubble nucleation event. The main difference
between the two kinds of images is that more spots can be seen on the beamformed passive images, particularly for depths greater than 52
mm. For example, for the third high-amplitude exposure, a first spot (spot 1) close to the rhombus, can be seen in the passive image (#). Its location agrees with the so-called bubble 2 in the active image ( ). But a second spot (spot 2) can beFigure 4(3)(b) Figure 4(3)(c) #
seen at the depth of z 57 mm in the passive image ( ) without a corresponding spot in the active image. The same= Figure 4(3)(b)
observations can be made of the fourth shot ( ). A closer look to the position of spot 2 shows that it has the same lateralFigure 4(4)(b) #position as spot 1. In order to determine whether this was accidental or whether both spots had the exact same lateral position, further#analyses of the passively recorded data were performed. First, the curvatures of the wave fronts that led to the different spots were
compared. A cross-correlation algorithm was used to determine the time delay laws that correspond to the wave fronts displayed in Figure
. These time delays were then used to align the filtered RF data. For the first shot, two different delay laws were extracted,4(a)
corresponding to the two brightest wave fronts displayed in . These are displayed in and are referred as first andFigure 4(1)(a) Figure 7(c) ‘ ’second time delay laws. The curvatures of these delay patterns are similar, indicating that the emissions came from the same axial‘ ’location. More precisely, according to the delay laws, the emissions originated from the point located at the respective lateral positions of
bubble 0 and bubble 1 on the active image. The acoustic emission corresponding to the first delay law was likely to have originated from
the location of bubble 1, and the second one from the location of bubble 0. The corresponding aligned RF data are displayed in gray in
(with the first delay law) and (with the second delay law). In order to verify whether or not the delay laws correctlyFigure 7(a) Figure 7(b)
aligned the RF signals, the averages of theses RF signals are also displayed in (black line). The aligned filtered RF dataFigure 7(a) and (b)
show that several pulse-shape signals actually had the same time delay law but were well separated in time: 2 s, 4.3 s and 11 s in μ μ μ Figure
and s and 6.5 s in . This means that these signals were all emitted from the same location. Therefore, the successive7(a) 4 μ μ Figure 7(b)
signals could be interpreted as the acoustic emissions which occurred during the different phases of the bubble nucleation process. The
acoustic emission of a nucleating bubble happens to be relatively complex. The first shot was chosen to illustrate the extraction of the
delay laws ( ) because two cavitation events occurred at positions close to one another (bubble 0 and bubble 1).Figure 7(c)
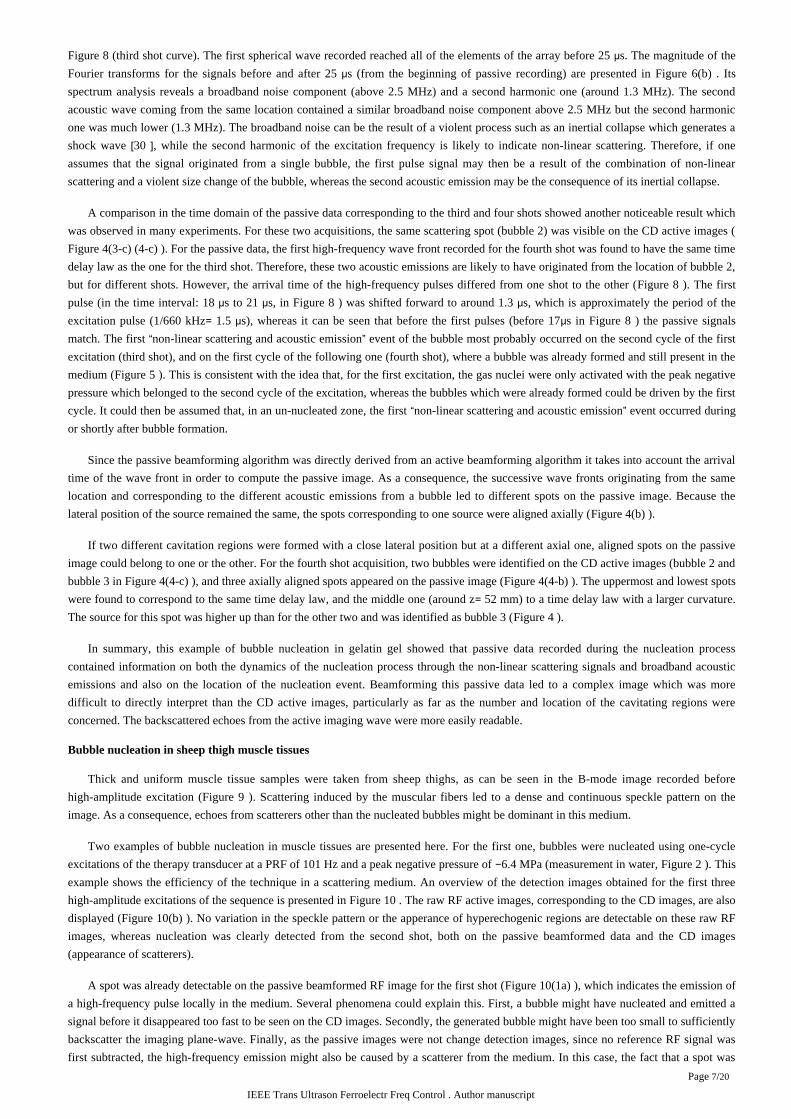
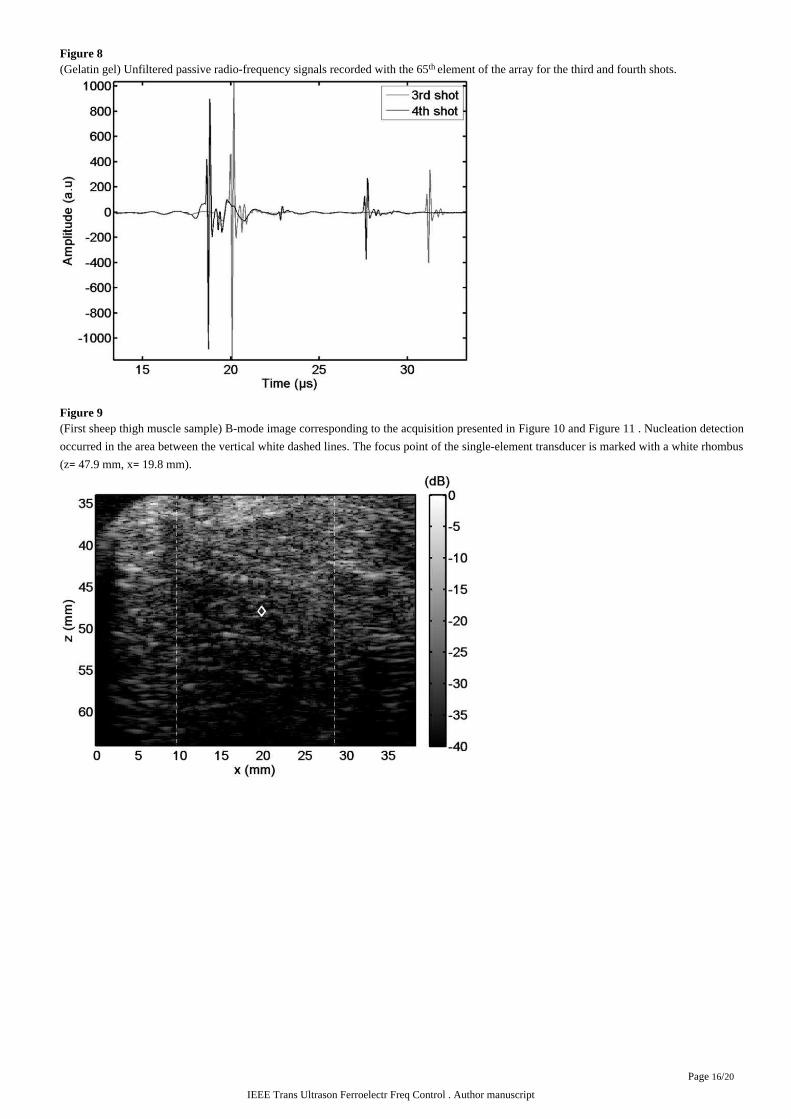
For the sake of simplicity, the acoustic behavior will be examined in more detail for the third shot for which only one event was visible
in (bubble 2), and only two high-frequency wave fronts could be identified from the RF data ( ). These twoFigure 4(3) (c) Figure 4(3) (a)
wave fronts were determined to have the same time delay law (not shown here). The time-domain data for one element can be seen in
IEEE Trans Ultrason Ferroelectr Freq Control . Author manuscript
Page /7 20
(third shot curve). The first spherical wave recorded reached all of the elements of the array before 25 s. The magnitude of theFigure 8 μFourier transforms for the signals before and after 25 s (from the beginning of passive recording) are presented in . Itsμ Figure 6(b)
spectrum analysis reveals a broadband noise component (above 2.5 MHz) and a second harmonic one (around 1.3 MHz). The second
acoustic wave coming from the same location contained a similar broadband noise component above 2.5 MHz but the second harmonic
one was much lower (1.3 MHz). The broadband noise can be the result of a violent process such as an inertial collapse which generates a
shock wave , while the second harmonic of the excitation frequency is likely to indicate non-linear scattering. Therefore, if one[30 ]assumes that the signal originated from a single bubble, the first pulse signal may then be a result of the combination of non-linear
scattering and a violent size change of the bubble, whereas the second acoustic emission may be the consequence of its inertial collapse.
A comparison in the time domain of the passive data corresponding to the third and four shots showed another noticeable result which
was observed in many experiments. For these two acquisitions, the same scattering spot (bubble 2) was visible on the CD active images (
). For the passive data, the first high-frequency wave front recorded for the fourth shot was found to have the same timeFigure 4(3-c) (4-c)
delay law as the one for the third shot. Therefore, these two acoustic emissions are likely to have originated from the location of bubble 2,
but for different shots. However, the arrival time of the high-frequency pulses differed from one shot to the other ( ). The firstFigure 8
pulse (in the time interval: 18 s to 21 s, in ) was shifted forward to around 1.3 s, which is approximately the period of theμ μ Figure 8 μexcitation pulse (1/660 kHz 1.5 s), whereas it can be seen that before the first pulses (before 17 s in ) the passive signals= μ μ Figure 8
match. The first non-linear scattering and acoustic emission event of the bubble most probably occurred on the second cycle of the first“ ”excitation (third shot), and on the first cycle of the following one (fourth shot), where a bubble was already formed and still present in the
medium ( ). This is consistent with the idea that, for the first excitation, the gas nuclei were only activated with the peak negativeFigure 5
pressure which belonged to the second cycle of the excitation, whereas the bubbles which were already formed could be driven by the first
cycle. It could then be assumed that, in an un-nucleated zone, the first non-linear scattering and acoustic emission event occurred during“ ”or shortly after bubble formation.
Since the passive beamforming algorithm was directly derived from an active beamforming algorithm it takes into account the arrival
time of the wave front in order to compute the passive image. As a consequence, the successive wave fronts originating from the same
location and corresponding to the different acoustic emissions from a bubble led to different spots on the passive image. Because the
lateral position of the source remained the same, the spots corresponding to one source were aligned axially ( ).Figure 4(b)
If two different cavitation regions were formed with a close lateral position but at a different axial one, aligned spots on the passive
image could belong to one or the other. For the fourth shot acquisition, two bubbles were identified on the CD active images (bubble 2 and
bubble 3 in ), and three axially aligned spots appeared on the passive image ( ). The uppermost and lowest spotsFigure 4(4-c) Figure 4(4-b)
were found to correspond to the same time delay law, and the middle one (around z 52 mm) to a time delay law with a larger curvature.=The source for this spot was higher up than for the other two and was identified as bubble 3 ( ).Figure 4
In summary, this example of bubble nucleation in gelatin gel showed that passive data recorded during the nucleation process
contained information on both the dynamics of the nucleation process through the non-linear scattering signals and broadband acoustic
emissions and also on the location of the nucleation event. Beamforming this passive data led to a complex image which was more
difficult to directly interpret than the CD active images, particularly as far as the number and location of the cavitating regions were
concerned. The backscattered echoes from the active imaging wave were more easily readable.
Bubble nucleation in sheep thigh muscle tissues
Thick and uniform muscle tissue samples were taken from sheep thighs, as can be seen in the B-mode image recorded before
high-amplitude excitation ( ). Scattering induced by the muscular fibers led to a dense and continuous speckle pattern on theFigure 9
image. As a consequence, echoes from scatterers other than the nucleated bubbles might be dominant in this medium.
Two examples of bubble nucleation in muscle tissues are presented here. For the first one, bubbles were nucleated using one-cycle
excitations of the therapy transducer at a PRF of 101 Hz and a peak negative pressure of 6.4 MPa (measurement in water, ). This− Figure 2
example shows the efficiency of the technique in a scattering medium. An overview of the detection images obtained for the first three
high-amplitude excitations of the sequence is presented in . The raw RF active images, corresponding to the CD images, are alsoFigure 10
displayed ( ). No variation in the speckle pattern or the apperance of hyperechogenic regions are detectable on these raw RFFigure 10(b)
images, whereas nucleation was clearly detected from the second shot, both on the passive beamformed data and the CD images
(appearance of scatterers).
A spot was already detectable on the passive beamformed RF image for the first shot ( ), which indicates the emission ofFigure 10(1a)
a high-frequency pulse locally in the medium. Several phenomena could explain this. First, a bubble might have nucleated and emitted a
signal before it disappeared too fast to be seen on the CD images. Secondly, the generated bubble might have been too small to sufficiently
backscatter the imaging plane-wave. Finally, as the passive images were not change detection images, since no reference RF signal was
first subtracted, the high-frequency emission might also be caused by a scatterer from the medium. In this case, the fact that a spot was
IEEE Trans Ultrason Ferroelectr Freq Control . Author manuscript
Page /8 20
present at the same location for the second shot ( ) indicates that the bubble nucleation hypothesis was more relevant.Figure 10(2a)
Moreover, the spectrum analysis of the passive data revealed a broadband component. Axially aligned spots were also distinguished on the
passive images, such as in the gelatin example ( ).Figure 10(1a)
As for the gelatin experiment, the local maximum was computed on the CD images in both areas where a scatterer appeared, showing
dramatic increases after the second high-amplitude insonification ( ). Similar increases occurred after the third shot, and eachFigure 11
sudden increase was followed by a slow decrease.
A second example ( and ), acquired at a higher PRF, shows bubble nucleation and also the early steps of a bubbleFigure 12 Figure 13
cloud formation in muscle tissues. One-cycle excitations of the therapy transducer were used at a PRF of 1010 Hz and a peak negative
pressure of 7.6 MPa (measurement in water, ). Data corresponding to the first four high-amplitude excitations are presented in − Figure 2
. As for the previous example, no hyperechogenic region or speckle variations were seen on the raw RF active images (Figure 12 Figure
), but some scatterers appeared on the CD images. After the first shot a single cavitating region was detected (bubble 1). During the12(b)
second shot, two others were generated: one upper and on the left-hand side (bubble 2), and the other deeper and also on the left (bubble
4). Two more were induced by the third shot: bubble 3 just above bubble 2 and bubble 5 just below bubble 4. Bubble 2 disappeared after
the fourth shot. The evolution of the local maximum at each bubble location is plotted in . For bubble 2, the maximum could notFigure 13
be computed after the fourth pulse because of the expansion of the adjacent cavitating regions. Due to the high PRF, the time interval
during which active detection was performed was highly reduced compared to the previous examples. Therefore, the dramatic increase in
the scattering amplitude could be observed when bubbles had just appeared, but the decreasing phase between the two shots was not so
clear ( ). Secondary spots were also observed on the passive images, but they were outside the display zone of the images.Figure 13
In summary, passive and active detections of bubble nucleation were performed in scattering tissues. Active detection using CD
images allowed direct observations and detection of the location of the induced bubbles, but this was only possible when nucleation led to
a cavitating region or bubbles large enough to produce an echo above the noise level and that last several images in the medium. Passive
detection provided an indication of the acoustic emissions of the bubbles over their lifespan.
Discussion
With this technique, active images of nucleated bubbles were obtained with a spatial resolution of the order of the imagingin situ
wavelength. Therefore, single nucleation events over a large volume were actively detected and discrete nucleation events were spatially
separated. It is worth noting that this detection was only possible thanks to the fact that a post-nucleation residual bubble was present in the
medium, and provided that this bubble had a lifespan of the order of milliseconds. The fact that a bubble larger than the initial nuclei
remained after the explosive growth and potential collapse was expected since a bubble cloud was still observed after the emission of a
histotripsy pulse , but it was not obvious for single nucleation events. Nevertheless, a theoretical study of a nucleus exposed to shock[21 ]waves , which are also high-amplitude excitations, confirmed that after collapse and ringing a larger bubble might be obtained.[31 ]
Since the same probe was used for both targeting and detecting active cavitation inception, superimposition of the B-mode and CD
images would lead to the immediate localization of the nucleation events within the tissue structure. The location of the events within the
pressure field of the therapy transducer was not straightforward since the imaging array was positioned on the side of the therapy
transducer. The position of the focal point was however displayed on the images (marked with a rhombus). Having the imaging probe
embedded in the single-element transducer so that the former median imaging plan includes the latter symmetry axis would greatly
simplify the localization process and should be considered for future work.
Thanks to the successive and ultrafast active detections between the high-amplitude excitations, the time evolution of each nucleated
bubble s scattering amplitude could be followed individually through measuring the local maxima on the CD images. Information about’the dissolution rate and lifespan could be retrieved: the lifespan of bubble 1 was longer than 20 ms ( ). Chen et al. showedFigure 11 [32 ]that the initial size of a nucleated bubble could actually be assessed from these data thanks to a model accounting for both the dissolution
rate and the dependence of the scattering cross-section with the bubble s size at the imaging frequency.’
Here, the imaging frequency was chosen so as to be appropriate for tissue imaging. Active detectors working at a higherin vivo
frequency, such as the one described by Roy et al. (focused 30 MHz detector), have the advantage of being insensitive to the[33 ]high-amplitude pulse, so they can even be used during nucleation. Furthermore, the emitted frequency is far above the bubblea priori
resonance, so the probing signal would not drive the induced bubble. However, the penetration depth in tissue at such a frequency is very
small (less than a centimeter at 30 MHz), which limits the application of such detectors, and the use of high frequencies wasin vivo
actually shown to affect the cavitation process . The potential effect of the imaging pulse on the bubble behavior was limited here for[24 ]two reasons. First, active detection and the high-amplitude excitation were not simultaneous, so that interactions between the two signals
were reduced. Secondly, the transmission signal for active detection was very short (1 cycle) and had a low intensity thanks to the use of
plane-waves (lower intensity than conventional focused waves at the focal zone). Nevertheless, the sensitivity was enhanced by the
IEEE Trans Ultrason Ferroelectr Freq Control . Author manuscript
Page /9 20
acquisition of the backscattered echoes on the array: on the one hand it allowed coherent summation of the signals in the beamforming
process, and on the other hand it allowed an additional coherent combination of compounded insonifications with the sequence used here.
As a result, the sensitivity of reception was similar to a focused singleelement detector but over an extended volume . This sensitivity[28 ]combined with a subtraction technique is the key aspect of this active method for distinguishing nucleated bubbles among other scatterers
in diffusive media such as biological tissues.
For the technique as a whole, the short duration of the high-amplitude insonification is a crucial feature. First, for the active detection,
and in particular for the CD images, it actually reduced the reverberation time of the high-power pulses, and then it reduced interference
with the backscattered echoes of the imaging wave. Besides this, the acoustic radiation force resulting from this insonification was too
small to induce any significant push in the medium: no shear wave was able to propagate and degrade the detection images. Secondly, for
the mechanism of nucleation itself, the short duration of the excitation ensured that bubble generation was not due to boiling .[34 ]Furthermore, longer insonifications just above the nucleation threshold might lead to the generation of multiple bubbles from a single
natural nucleus. A bubble nucleated on a cycle might collapse, fragment and seed the medium with new nuclei that would potentially
nucleate bubbles in the following cycles. As a result, a bubble cloud would immediately be formed and the analysis in terms of natural
nuclei spatial distribution, density and destabilization threshold would be more difficult than with discrete bubbles. The successive short
excitations used in the present study allowed the evolution of the number and size of the nucleated bubbles to be followed pulse after pulse
until a bubble cloud formed. Lastly, the emission of only a few high-amplitude cycles allowed rich passive RF data to be recorded. Pulse
shape and coherent signals were collected on the array. Analysis of the wave fronts for the gelatin gel sample showed that at least two
pulse shape signals originating from the same location could be identified. It can be hypothesized that they were actually emitted by a
single bubble during its nucleation process. Spectrum analysis of the first signal emitted showed that this may have resulted from both
non-linear scattering and shock wave emission filtered by the bandwidth of the imaging transducer. Since no bubble could be detected in
the medium before the high-amplitude excitation, the shock wave could either have resulted from the explosive growth of a nucleus or
from the collapse of an activated nucleus. Several studies demonstrated experimentally that a bubble nucleated using a laser pulse (laser
optical breakdown) does emit a shock wave whilst it expands. However, the authors could not find strong evidence in the[35 ]–[36 ]literature that the same phenomenon occurs for acoustically generated bubbles. Nevertheless, the collapse of an acoustically generated
bubble was found to emit shock waves . Moreover, theoretical and experimental studies , showed that when a bubble is[30 ] [31 ] [37 ]–[39 ]submitted to a lithotripsy pulse, i.e. a shock wave starting with a peak positive pressure followed by a negative pressure, it first collapses
because of the high compression and then re-expands to collapse again. Therefore, a nucleus insonifed with the high-amplitude excitation
used in this paper could grow without radiating much recordable signals and then undergo a first collapse before expanding again.
Furthermore, this approach was confirmed by the fact that the first pulses recorded for a nucleating bubble and an already formed bubble
had very similar pulse shapes in the time domain ( ), implying that the nucleus had already grown before it emitted the pulse. AFigure 8
model developed by Church suggests that, when driven by a lithotripter pulse, a bubble first collapses, then undergoes a first bounce[31 ] “ ”(emitting a pressure pulse), after which the bubble undergoes a sustained expansion phase before collapsing again and, on the second
bounce, emits a second pressure pulse. In our case, this second collapse may explain the second pulse recorded in the passive data. After
the second collapse, the model predicts that the bubble (after rebounding) attains a stable radius larger than the initial radius, and then
slowly dissolves. This is also what was observed in our experiments and it explains why active imaging might exhibit a change in
echogenicity after a passive signature of the bubble ( and and ). Assuming that the observed phenonenaFigure 5 Figure 10-2c Figure 10-3c
followed Church s model, the period between the first two pulses would then be the time of collapse .’ [31 ]
The above analysis suggests that passive data can be interpreted as acoustic emissions from single nucleated bubbles. Additional
simultaneous optical investigations and further modeling using the high-amplitude waveform measured here are needed to test the
hypothesis and should be considered for future work.
Passive cavitation imaging techniques with ultrasonic arrays have been previously introduced , and they succeeded in[19 ]–[20 ]detecting cavitation by beamforming the array element signals and calculating their energy in time. These techniques do not require any
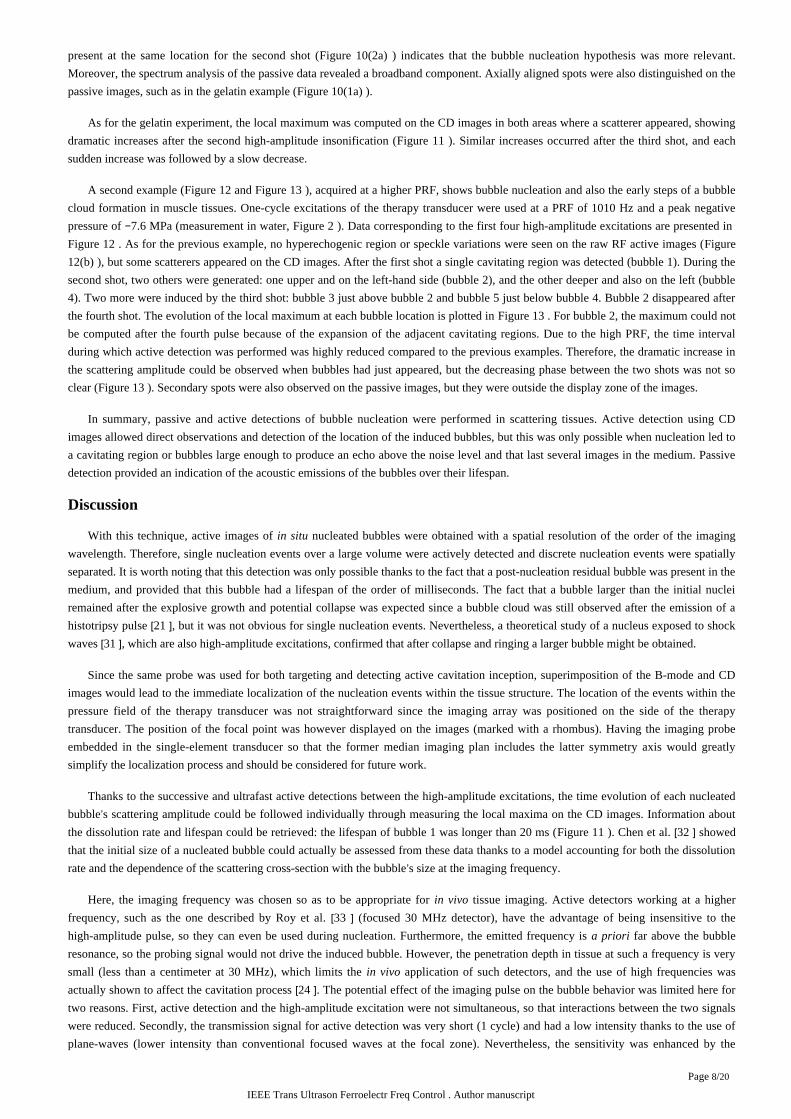
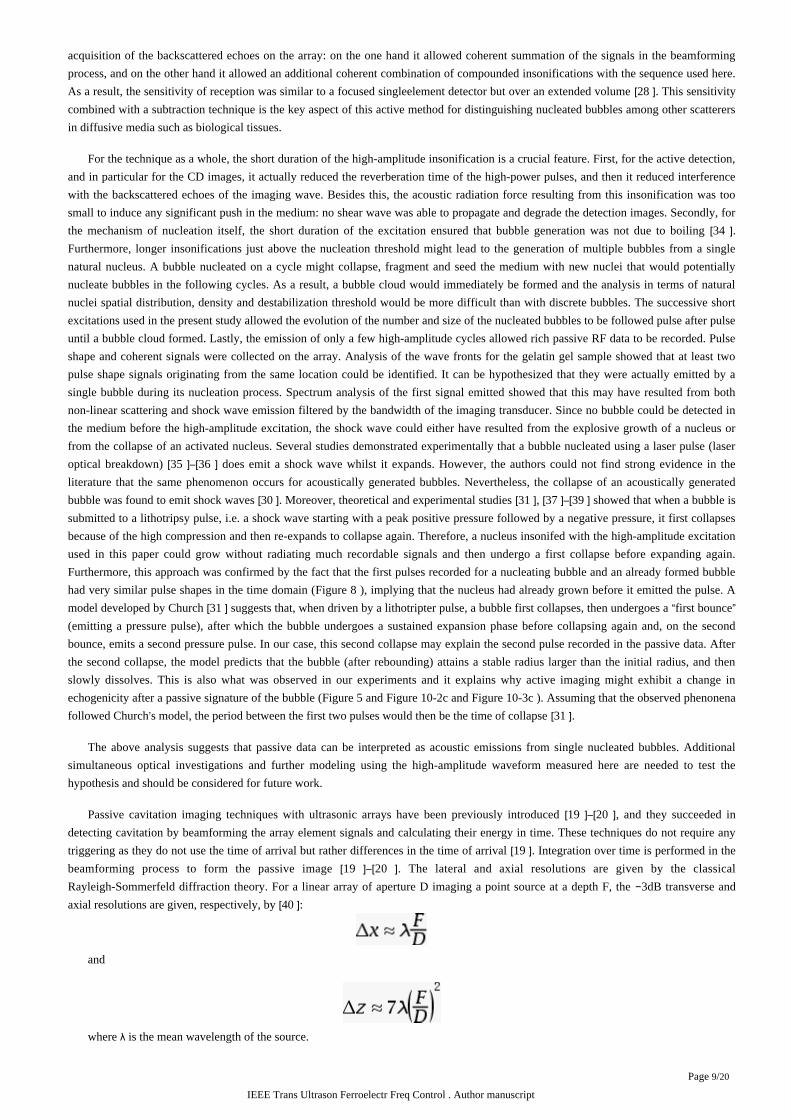
triggering as they do not use the time of arrival but rather differences in the time of arrival . Integration over time is performed in the[19 ]beamforming process to form the passive image . The lateral and axial resolutions are given by the classical[19 ]–[20 ]Rayleigh-Sommerfeld diffraction theory. For a linear array of aperture D imaging a point source at a depth F, the 3dB transverse and−axial resolutions are given, respectively, by :[40 ]
and
where is the mean wavelength of the source.λ
IEEE Trans Ultrason Ferroelectr Freq Control . Author manuscript
Page /10 20
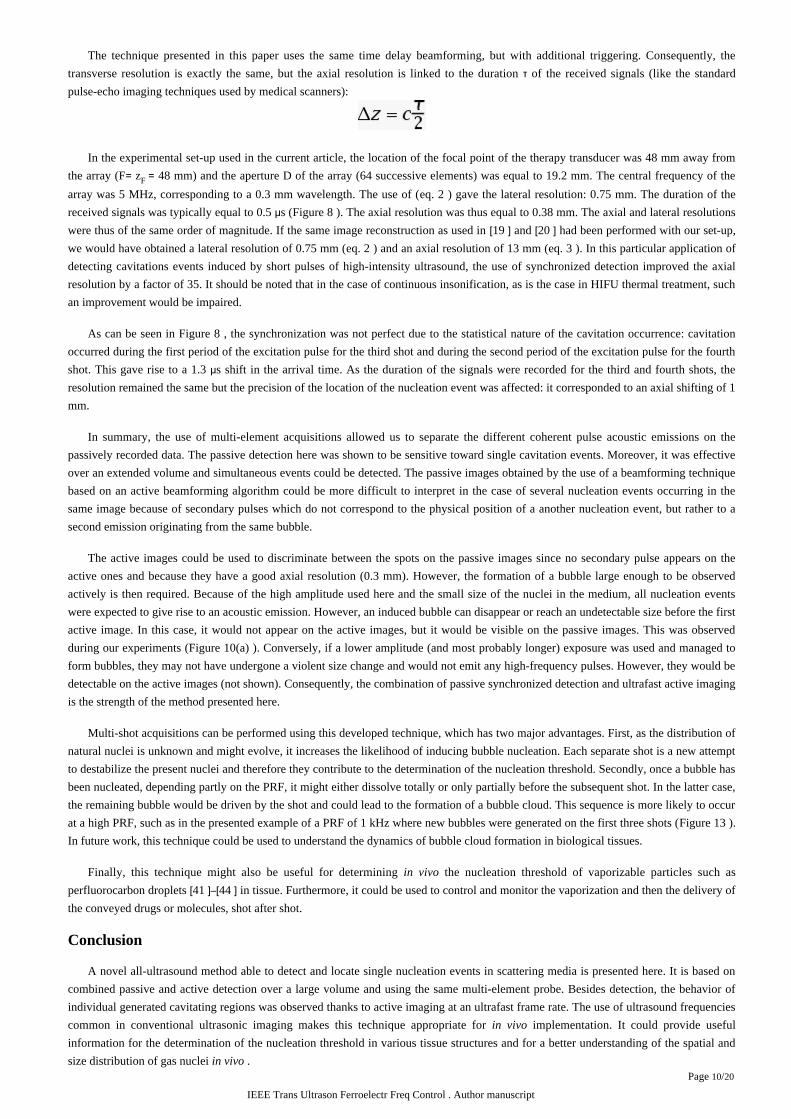
The technique presented in this paper uses the same time delay beamforming, but with additional triggering. Consequently, the
transverse resolution is exactly the same, but the axial resolution is linked to the duration of the received signals (like the standardτpulse-echo imaging techniques used by medical scanners):
In the experimental set-up used in the current article, the location of the focal point of the therapy transducer was 48 mm away from
the array (F z 48 mm) and the aperture D of the array (64 successive elements) was equal to 19.2 mm. The central frequency of the= F =
array was 5 MHz, corresponding to a 0.3 mm wavelength. The use of ( ) gave the lateral resolution: 0.75 mm. The duration of theeq. 2
received signals was typically equal to 0.5 s ( ). The axial resolution was thus equal to 0.38 mm. The axial and lateral resolutionsμ Figure 8
were thus of the same order of magnitude. If the same image reconstruction as used in and had been performed with our set-up,[19 ] [20 ]we would have obtained a lateral resolution of 0.75 mm ( ) and an axial resolution of 13 mm ( ). In this particular application ofeq. 2 eq. 3
detecting cavitations events induced by short pulses of high-intensity ultrasound, the use of synchronized detection improved the axial
resolution by a factor of 35. It should be noted that in the case of continuous insonification, as is the case in HIFU thermal treatment, such
an improvement would be impaired.
As can be seen in , the synchronization was not perfect due to the statistical nature of the cavitation occurrence: cavitationFigure 8
occurred during the first period of the excitation pulse for the third shot and during the second period of the excitation pulse for the fourth
shot. This gave rise to a 1.3 s shift in the arrival time. As the duration of the signals were recorded for the third and fourth shots, theμresolution remained the same but the precision of the location of the nucleation event was affected: it corresponded to an axial shifting of 1
mm.
In summary, the use of multi-element acquisitions allowed us to separate the different coherent pulse acoustic emissions on the
passively recorded data. The passive detection here was shown to be sensitive toward single cavitation events. Moreover, it was effective
over an extended volume and simultaneous events could be detected. The passive images obtained by the use of a beamforming technique
based on an active beamforming algorithm could be more difficult to interpret in the case of several nucleation events occurring in the
same image because of secondary pulses which do not correspond to the physical position of a another nucleation event, but rather to a
second emission originating from the same bubble.
The active images could be used to discriminate between the spots on the passive images since no secondary pulse appears on the
active ones and because they have a good axial resolution (0.3 mm). However, the formation of a bubble large enough to be observed
actively is then required. Because of the high amplitude used here and the small size of the nuclei in the medium, all nucleation events
were expected to give rise to an acoustic emission. However, an induced bubble can disappear or reach an undetectable size before the first
active image. In this case, it would not appear on the active images, but it would be visible on the passive images. This was observed
during our experiments ( ). Conversely, if a lower amplitude (and most probably longer) exposure was used and managed toFigure 10(a)
form bubbles, they may not have undergone a violent size change and would not emit any high-frequency pulses. However, they would be
detectable on the active images (not shown). Consequently, the combination of passive synchronized detection and ultrafast active imaging
is the strength of the method presented here.
Multi-shot acquisitions can be performed using this developed technique, which has two major advantages. First, as the distribution of
natural nuclei is unknown and might evolve, it increases the likelihood of inducing bubble nucleation. Each separate shot is a new attempt
to destabilize the present nuclei and therefore they contribute to the determination of the nucleation threshold. Secondly, once a bubble has
been nucleated, depending partly on the PRF, it might either dissolve totally or only partially before the subsequent shot. In the latter case,
the remaining bubble would be driven by the shot and could lead to the formation of a bubble cloud. This sequence is more likely to occur
at a high PRF, such as in the presented example of a PRF of 1 kHz where new bubbles were generated on the first three shots ( ).Figure 13
In future work, this technique could be used to understand the dynamics of bubble cloud formation in biological tissues.
Finally, this technique might also be useful for determining the nucleation threshold of vaporizable particles such asin vivo
perfluorocarbon droplets in tissue. Furthermore, it could be used to control and monitor the vaporization and then the delivery of[41 ]–[44 ]the conveyed drugs or molecules, shot after shot.
Conclusion
A novel all-ultrasound method able to detect and locate single nucleation events in scattering media is presented here. It is based on
combined passive and active detection over a large volume and using the same multi-element probe. Besides detection, the behavior of
individual generated cavitating regions was observed thanks to active imaging at an ultrafast frame rate. The use of ultrasound frequencies
common in conventional ultrasonic imaging makes this technique appropriate for implementation. It could provide usefulin vivo
information for the determination of the nucleation threshold in various tissue structures and for a better understanding of the spatial and
size distribution of gas nuclei .in vivo
IEEE Trans Ultrason Ferroelectr Freq Control . Author manuscript
Page /11 20
Furthermore, the high frame rate capacity of the active detection allows pulse rate frequencies to be reached in the kHz range for the
high-amplitude excitation. This makes a study of the steps of bubble cloud formation possible. Therefore, this method is expected to be of
great interest for a better understanding and monitoring of the initiation phase of cavitation therapies in living tissues.
Acknowledgements:
The authors would like to thank Abdelhak Souilah for the conception and fabrication of the transducers holder. The authors thank the IMM
research group (Paris, France, ) for their support and fruitful discussions.www.imm-recherche.com
Appendix
The algorithm used to beamform the passive data is based on the algorithm used for active images with an untilted plane-wave transmission.
However, because of the angle between the single-element axis and the median imaging plan of the array, the travel time to point A (x,z) and
then to the element of the array placed in x is given by:n
where c is the speed of sound assumed to be constant in the medium, F is the focal length of the therapy transducer, z is the depth of thec F
focal point in the imaging plan and is the angle between the array axis and the z axis of the imaging plan ( ).θ Figure 14
Each point (x,z) of the image is obtained by coherently adding the contribution of each acoustic emission, i.e. delaying the radio-frequency
signals ( , ) received on the array by ( , , ) and adding them in the array direction.RF xn t τ xn x z
The angle was set equal to 45 .θ °
References: 1 . Blatteau JE , Souraud JB , Gempp E . Gas nuclei, their origin, and their role in bubble formation . AVIATION SPACE AND ENVIRONMENTAL MEDICINE . 77 : (10 )
1068 - 1076 OCT 2006 ; 2 . Atchley AA , Prosperetti A . The crevice model of bubble nucleation . JOURNAL OF THE ACOUSTICAL SOCIETY OF AMERICA . 86 : 1065 - 1084 SEPT 1989 ; 3 . Fox FE , Herzfeld KF . Gas bubbles with organic skin as cavitation nuclei . JOURNAL OF THE ACOUSTICAL SOCIETY OF AMERICA . 26 : 984 - 989 NOV 1954 ; 4 . Leighton T . The acoustic bubble . ACADEMIC PRESS ; 1997 ; 5 . Roberts WW , Hall TL , Ives K . Pulsed cavitational ultrasound: A noninvasive technology for controlled tissue ablation (histotripsy) in the rabbit kidney . JOURNAL OF
UROLOGY . 175 : (2 ) 734 - 738 FEB 2006 ; 6 . Cole R . Boiling nucleation . ADVANCED HEAT TRANSFERT . 10 : ACADEMIC PRESS ; NEW YORK 1970 ; 7 . Khokhlova TD , Canney MS , Lee D . Magnetic resonance imaging of boiling induced by high intensity focused ultrasound . JOURNAL OF THE ACOUSTICAL
SOCIETY OF AMERICA . 125 : (4 ) 2420 - 2431 Part 1 APR 2009 ; 8 . Neppiras EA , Noltingk BE . Cavitation produced by ultrasonics theoretical conditions for the onset of cavitation – . PROCEEDINGS OF THE PHYSICAL SOCIETY OF
LONDON SECTION B . 64 : (384 ) 1032 - 1038 DEC 1951 ; 9 . Sokka SD , King R , Hynynen K . MRI-guided gas bubble enhanced ultrasound heating in in vivo rabbit thigh . PHYSICS IN MEDICINE AND BIOLOGY . 48 : (2 ) 223 -
241 JAN 2003 ; 10 . Coussios CC , Roy RA . Applications of acoustics and cavitation to noninvasive therapy and drug delivery . ANNUAL REVIEW OF FLUID MECHANICS . 40 : 395 -
420 JAN 2008 ; 11 . Xu Z , Fowlkes JB , Cain CA . A new strategy to enhance cavitational tissue erosion using a high-intensity, initiating sequence . IEEE TRANSACTIONS ON
ULTRASONICS FERROELECTRICS AND FREQUENCY CONTROL . 53 : (8 ) 1412 - 1424 AUG 2006 ; 12 . Church CC . Spontaneous homogeneous nucleation, inertial cavitation and the safety of diagnostic ultrasound . ULTRASOUND IN MEDICINE AND BIOLOGY . 28 : ( 10 ) 1349 - 1364 OCT 2002 ; 13 . Xu Z , Fowlkes JB , Ludomirsky A . Investigation of intensity thresholds for ultrasound tissue erosion . ULTRASOUND IN MEDICINE AND BIOLOGY . 31 : (12 )
1673 - 1682 DEC 2005 ; 14 . Tran BC , Seo J , Hall TL . Microbubble-enhanced cavitation for noninvasive ultrasound surgery . IEEE TRANSACTIONS ON ULTRASONICS FERROELECTRICS
AND FREQUENCY CONTROL . 50 : (10 ) 1296 - 1304 OCT 2003 ; 15 . Maxwell AD , Wang TY , Cain CA . The role of compressional pressure in formation of dense bubble clouds in histotripsy . IEEE INTERNATIONAL ULTRASONICS
SYMPOSIUM . 81 - 84 SEP 2009 ; 16 . Xu Z , Fowlkes JB , Rothman ED . Controlled ultrasound tissue erosion: The role of dynamic interaction between insonation and microbubble activity . JOURNAL OF
THE ACOUSTICAL SOCIETY OF AMERICA . 117 : (1 ) 424 - 435 JAN 2005 ; 17 . Rabkin BA , Zderic V , Vaezy S . Hyperecho in ultrasound images of HIFU therapy: Involvement of cavitation . ULTRASOUND IN MEDICINE AND BIOLOGY . 31 : (
7 ) 947 - 956 JUL 2005 ; 18 . Farny CH , Holt RG , Roy RA . Temporal and spatial detection of HIFU-induced inertial and hot-vapor cavitation with a diagnostic ultrasound system . ULTRASOUND
IN MEDICINE AND BIOLOGY . 35 : (4 ) 603 - 615 APR 2009 ; 19 . Salgaonkar VA , Datta S , Holland CK . Passive cavitation imaging with ultrasound arrays . JOURNAL OF THE ACOUSTICAL SOCIETY OF AMERICA . 126 : (6 )
3071 - 3083 DEC 2009 ; 20 . Gyongy M , Coussios CC . Passive Spatial Mapping of Inertial Cavitation During HIFU Exposure . IEEE TRANSACTIONS ON BIOMEDICAL ENGINEERING . 57 : (
1 ) 48 - 56 JAN 2010 ; 21 . Xu Z , Raghavan M , Hall TL . High Speed Imaging of Bubble Clouds in Pulsed Cavitational Ultrasound Therapy Histotripsy – . IEEE INTERNATIONAL
ULTRASONICS SYMPOSIUM . 293 - 296 OCT 2006 ;
IEEE Trans Ultrason Ferroelectr Freq Control . Author manuscript
Page /12 20
22 . Xu Z , Hall TL , Fowlkes JB . Optical and acoustic monitoring of bubble cloud dynamics at a tissue-fluid interface in ultrasound tissue erosion . JOURNAL OF THE ACOUSTICAL SOCIETY OF AMERICA . 121 : (4 ) 2421 - 2430 APR 2007 ;
23 . Gateau J , Marsac L , Pernot M . Transcranial ultrasonic therapy based on time reversal of acoustically induced cavitation bubble signature . IEEE TRANSACTIONS ON BIOMEDICAL ENGINEERING . 57 : (1 ) 134 - 44 JAN 2010 ;
24 . Madanshetty SI , Roy RA , Apfel RE . Acoustic microcavitation Its active and passive acoustic detection – . JOURNAL OF THE ACOUSTICAL SOCIETY OF
AMERICA . 90 : (3 ) 1515 - 1526 SEP 1991 ; 25 . Sandrin L , Catheline S , Tanter M . Time-resolved pulsed elastography with ultrafast ultrasonic imaging . ULTRASONIC IMAGING . 21 : (4 ) 259 - 272 OCT 1999 ; 26 . Sandrin L , Tanter M , Catheline S . Shear modulus imaging with 2-D transient elastography . IEEE TRANSACTIONS ON ULTRASONICS FERROELECTRICS AND
FREQUENCY CONTROL . 49 : (4 ) 426 - 435 APR 2002 ; 27 . Xu Z , Hall TL , Fowlkes JB . Effects of acoustic parameters on bubble cloud dynamics in ultrasound tissue erosion (histotripsy) . JOURNAL OF THE ACOUSTICAL
SOCIETY OF AMERICA . 122 : (1 ) 229 - 236 JUL 2007 ; 28 . Montaldo G , Tanter M , Bercoff J . Coherent Plane-Wave Compounding for Very High Frame Rate Ultrasonography and Transient Elastography . IEEE
TRANSACTIONS ON ULTRASONICS FERROELECTRICS AND FREQUENCY CONTROL . 56 : (3 ) 489 - 506 MAR 2009 ; 29 . Jacob X , Barriere C , Takatsu R . Optical measurement of transient ultrasonic shock waves . IEEE INTERNATIONAL ULTRASONICS SYMPOSIUM . 52 - 55 AUG
2004 ; 30 . Matula TJ , Hallaj IM , Cleveland RO . The acoustic emissions from single-bubble sonoluminescence . JOURNAL OF THE ACOUSTICAL SOCIETY OF AMERICA . 103 : (3 ) 1377 - 1382 MAR 1998 ;
31 . Church CC . A theoretical study of cavitation generated by an extracorporeal shock wave lithotripter . JOURNAL OF THE ACOUSTICAL SOCIETY OF AMERICA . 86 : 215 - 227 JULY 1989 ;
32 . Chen WS , Matula TJ , Crum LA . The disappearance of ultrasound contrast bubbles: Observations of bubble dissolution and cavitation nucleation . ULTRASOUND IN MEDICINE AND BIOLOGY . 28 : (6 ) 793 - 803 JUN 2002 ;
33 . Roy RA , Madanshetty SI , Apfel RE . An acoustic backscattering technique for the detection of transient cavitation produced by microsecond pulses of ultrasound . JOURNAL OF THE ACOUSTICAL SOCIETY OF AMERICA . 87 : (6 ) 2451 - 2458 JUN 1990 ;
34 . Canney MS , Khokhlova VA , Bessonova OV . Shock-Induced Heating and Millisecond Boiling in Gels and Tissue Due to High Intensity Focused Ultrasound . ULTRASOUND IN MEDICINE AND BIOLOGY . 36 : (2 ) 250 - 267 FEB 2010 ;
35 . Schaffer CB , Nishimura N , Glezer EN . Dynamics of femtosecond laser-induced breakdown in water from femtoseconds to microseconds . OPTICS EXPRESS . 10 : (3 ) 196 - 203 FEB 11 2002 ; 36 . Aglyamov SR , Karpiouk AB , Bourgeois F . Ultrasound measurements of cavitation bubble radius for femtosecond laser-induced breakdown in water . OPTICS
LETTERS . 33 : (12 ) 1357 - 1359 JUN 15 2007 ; 37 . Coleman AJ , Choi MJ , Saunders JE . Detection of acoustic emission from cavitation in tissue during clinical extracorporeal lithotripsy . ULTRASOUND IN MEDICINE
AND BIOLOGY . 22 : (8 ) 1079 - 1087 1996 ; 38 . Ohl CD . Cavitation inception following shock wave passage . PHYSICS OF FLUIDS . 14 : (10 ) 3512 - 3521 OCT 2002 ; 39 . Oleg A , Sapozhnikov VA , Khokhlova MR . Crum Effect of overpressure and pulse repetition frequency on cavitation in shock wave lithotripsy . JOURNAL OF THE
ACOUSTICAL SOCIETY OF AMERICA . 112 : 1183 - SEP 2002 ; 10.1121/1.1500754 40 . Kino GS . Acoustic Waves: Devices, Imaging, and Analog Signal Processing . Prentice-Hall ; Englewood Cliffs, NJ 1987 ; 41 . Kripfgans OD , Fowlkes JB , Miller DL . Acoustic droplet vaporization for therapeutic and diagnostic applications . ULTRASOUND IN MEDICINE AND BIOLOGY . 26 : (7 ) 1177 - 1189 SEP 2000 ; 42 . Kawabata K , Sugita N , Yoshikawa H . Nanoparticles with multiple perfluorocarbons for controllable ultrasonically induced phase shifting . JAPANESE JOURNAL OF
APPLIED PHYSICS PART 1-REGULAR PAPERS BRIEF COMMUNICATIONS & REVIEW PAPERS . 44 : (6B ) 4548 - 4552 Part 1 Sp. Iss. SI JUN 2005 ; 43 . Rapoport N , Christensen DA , Kennedy AM . Cavitation properties of block copolymer stabilized phase-shift nanoemulsions used as drug carriers . ULTRASOUND IN
MEDICINE AND BIOLOGY . 36 : (3 ) 419 - 29 MAR 2010 ; 44 . Couture O , Pannacci N , Babataheri A . Ultrasound-inducible fluorescent particles for internal tattooing . IEEE INTERNATIONAL ULTRASONICS SYMPOSIUM . 85
- 88 SEPT 2009 ;
Figure 1Experimental set-up. Drawing (a) represents a schematic side view of the integrated high-amplitude focused ultrasound and imaging system
and a schematic diagram of the driving electronics. The interrogation path ( . ) of the linear array is coaxial with the single element− −transducer focal spot. Picture (b) shows the integrated system.
IEEE Trans Ultrason Ferroelectr Freq Control . Author manuscript
Page /13 20
Figure 2Pressure waveforms of the therapy pulse at the focal point of the therapy transducer. The signals shown are the averages of 15 acquisitions
low-pass filtered below 50 MHz (FIR, Butterworth high-pass digital filter design, order 3, 50 MHz cutoff frequency). Each waveform
corresponds to a different excitation used in this paper: a two-cycle excitation for the gelatine gel, and two different one-cycle excitations for
the muscle samples. The measurements were recorded in degassed water. The peak negative pressure is indicated on the pressure axis.
Figure 3The nucleation detection sequence. The two time lines represent the timing sequence for (A) the ultrasound scanner driving the linear array
and, (B) the high power channel driving the single-element transducer. The synchronization of the time lines occurs at t 0 with the triggering=event (trig.). The blocks synchronized high-amplitude emission and passive detection are marked by the white rectangle including the“ ”triggering event, and the blocks ultrafast active detection are indicated by light gray rectangles. The time period between two successive“ ”plane wave transmits is T ; it is also the duration between the triggering event and the first transmission by the array. The reference1
acquisition before any nucleation is circled in gray. Each attempt to nucleate a bubble with a high-amplitude excitation was followed by the
union of a passive and an active detection block. This combined detection is circled by a black dashed line and lasted for a time period T . 1/T2
is the pulse rate frequency (PRF) of the high-amplitude excitation.2
IEEE Trans Ultrason Ferroelectr Freq Control . Author manuscript
Page /14 20
Figure 4(Gelatin gel) Images of the different detection acquisitions for the first four highamplitude exposures. Each line corresponds to a different
shot: (a) high-pass filtered passive radio-frequency data, (b) the corresponding passive beamformed image, (c) the second active change
detection image for each shot. The x axis origin is set to the first element of the array. For (b) and (c), the focus point of the single-element
transducer is marked with a black rhombus (z 47.9 mm, x 19.8 mm). The beamformed data are normalized to the brightest point of the= =series for (b) and (c).
Figure 5(Gelatin gel) Evolution of the scattering amplitude of the cavitating regions identified in . The vertical dash dotted lines indicate theFigure 4
high-amplitude shots.
IEEE Trans Ultrason Ferroelectr Freq Control . Author manuscript
Page /15 20
Figure 6(Gelatin gel) Magnitude of the Fourier transform of the unfiltered passive radio-frequency data for (a) all of the different shots and the whole
duration of the recorded signals, (b) the third shot analyzed in two separate parts: before and after 25 s from the beginning of passiveμrecording. The spectral traces shown are averages over the 64 channels. For (b), the spectral traces are normalized to their maximum. The
vertical dashed lines indicate the integer multiples of the central frequency of the high-amplitude excitation pulse (660 kHz).
Figure 7(Gelatin gel) Alignment of the filtered passive radio-frequency (RF) data for the first shot, (a) and (b) display the alignment of the RF data
corresponding to the first and second time delay laws plotted in (c), respectively. For (a) and (b), the superimposed gray curves are the 64
delayed passive signals received on the elements of the ultrasonic array, and the thick line shows their averages.
IEEE Trans Ultrason Ferroelectr Freq Control . Author manuscript
Page /16 20
Figure 8(Gelatin gel) Unfiltered passive radio-frequency signals recorded with the 65 element of the array for the third and fourth shots.th
Figure 9(First sheep thigh muscle sample) B-mode image corresponding to the acquisition presented in and . Nucleation detectionFigure 10 Figure 11
occurred in the area between the vertical white dashed lines. The focus point of the single-element transducer is marked with a white rhombus
(z 47.9 mm, x 19.8 mm).= =
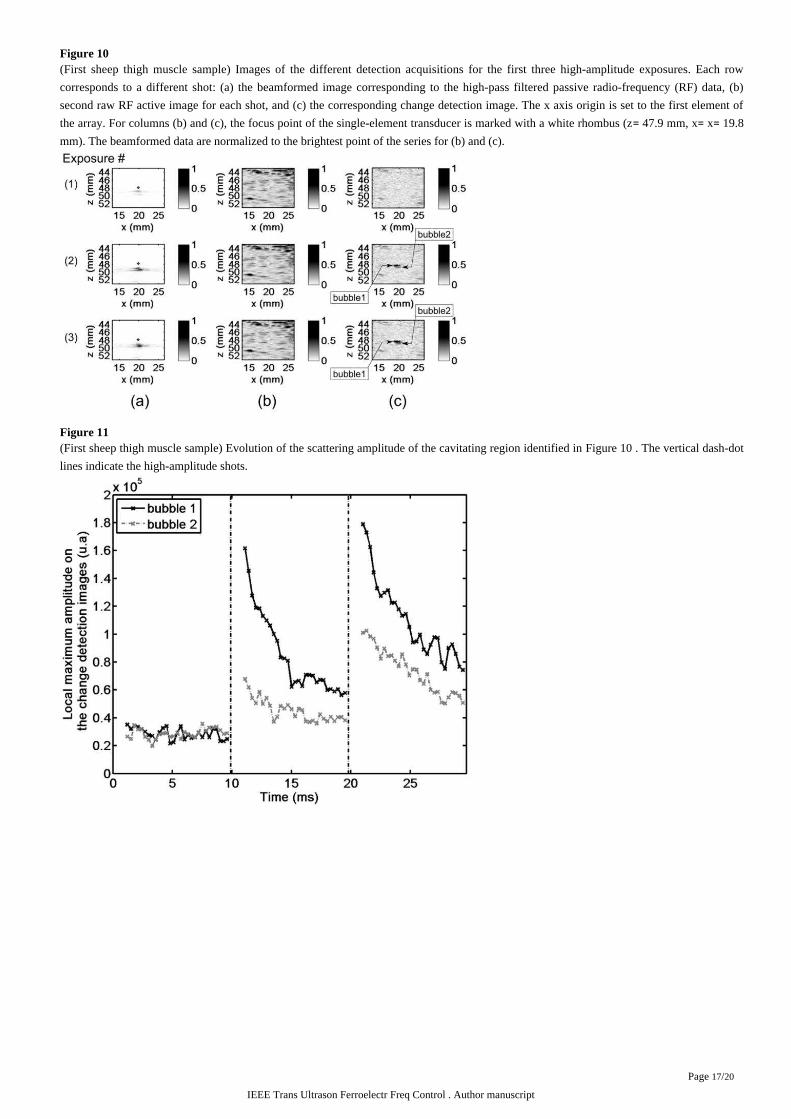
IEEE Trans Ultrason Ferroelectr Freq Control . Author manuscript
Page /17 20
Figure 10(First sheep thigh muscle sample) Images of the different detection acquisitions for the first three high-amplitude exposures. Each row
corresponds to a different shot: (a) the beamformed image corresponding to the high-pass filtered passive radio-frequency (RF) data, (b)
second raw RF active image for each shot, and (c) the corresponding change detection image. The x axis origin is set to the first element of
the array. For columns (b) and (c), the focus point of the single-element transducer is marked with a white rhombus (z 47.9 mm, x x 19.8= = =mm). The beamformed data are normalized to the brightest point of the series for (b) and (c).
Figure 11(First sheep thigh muscle sample) Evolution of the scattering amplitude of the cavitating region identified in . The vertical dash-dotFigure 10
lines indicate the high-amplitude shots.
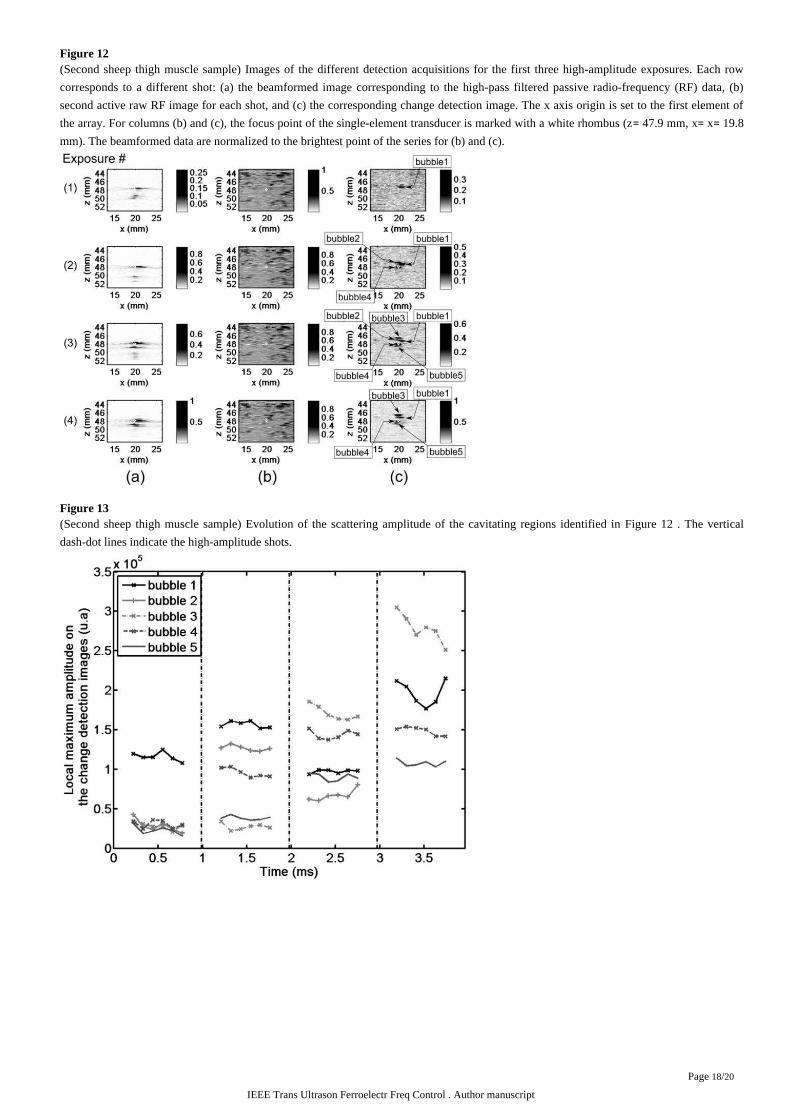
IEEE Trans Ultrason Ferroelectr Freq Control . Author manuscript
Page /18 20
Figure 12(Second sheep thigh muscle sample) Images of the different detection acquisitions for the first three high-amplitude exposures. Each row
corresponds to a different shot: (a) the beamformed image corresponding to the high-pass filtered passive radio-frequency (RF) data, (b)
second active raw RF image for each shot, and (c) the corresponding change detection image. The x axis origin is set to the first element of
the array. For columns (b) and (c), the focus point of the single-element transducer is marked with a white rhombus (z 47.9 mm, x x 19.8= = =mm). The beamformed data are normalized to the brightest point of the series for (b) and (c).
Figure 13(Second sheep thigh muscle sample) Evolution of the scattering amplitude of the cavitating regions identified in . The verticalFigure 12
dash-dot lines indicate the high-amplitude shots.
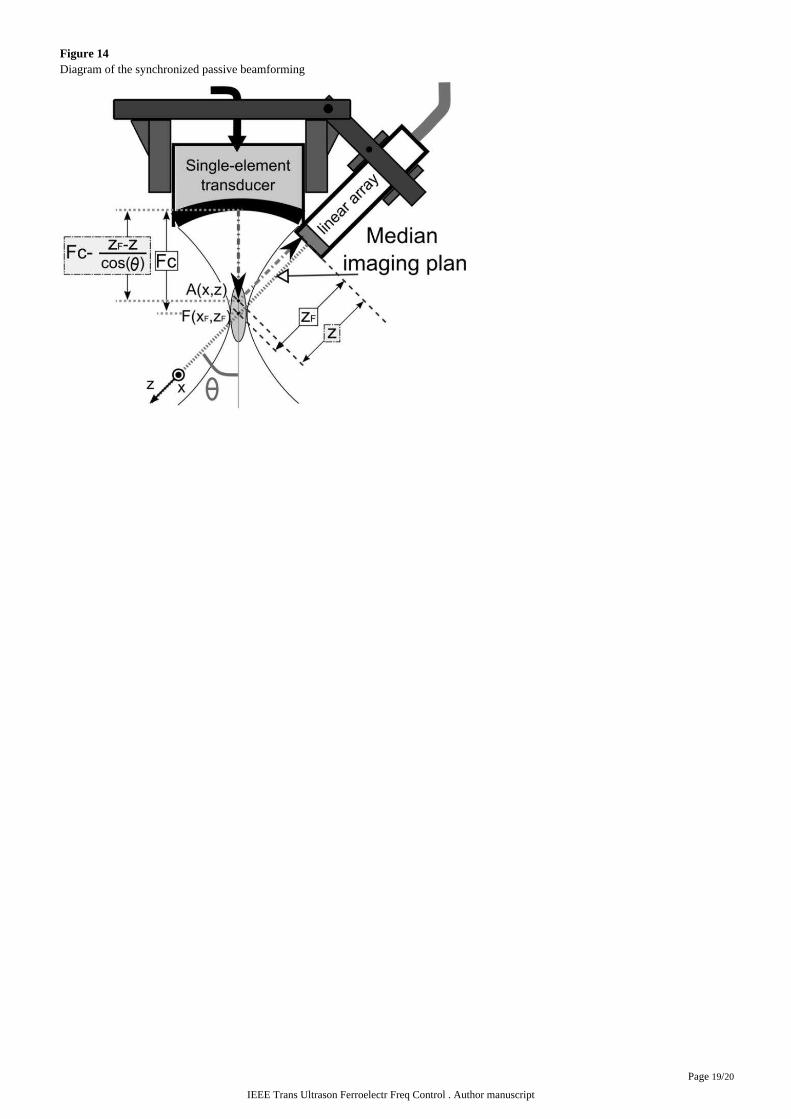
IEEE Trans Ultrason Ferroelectr Freq Control . Author manuscript
Page /19 20
Figure 14Diagram of the synchronized passive beamforming
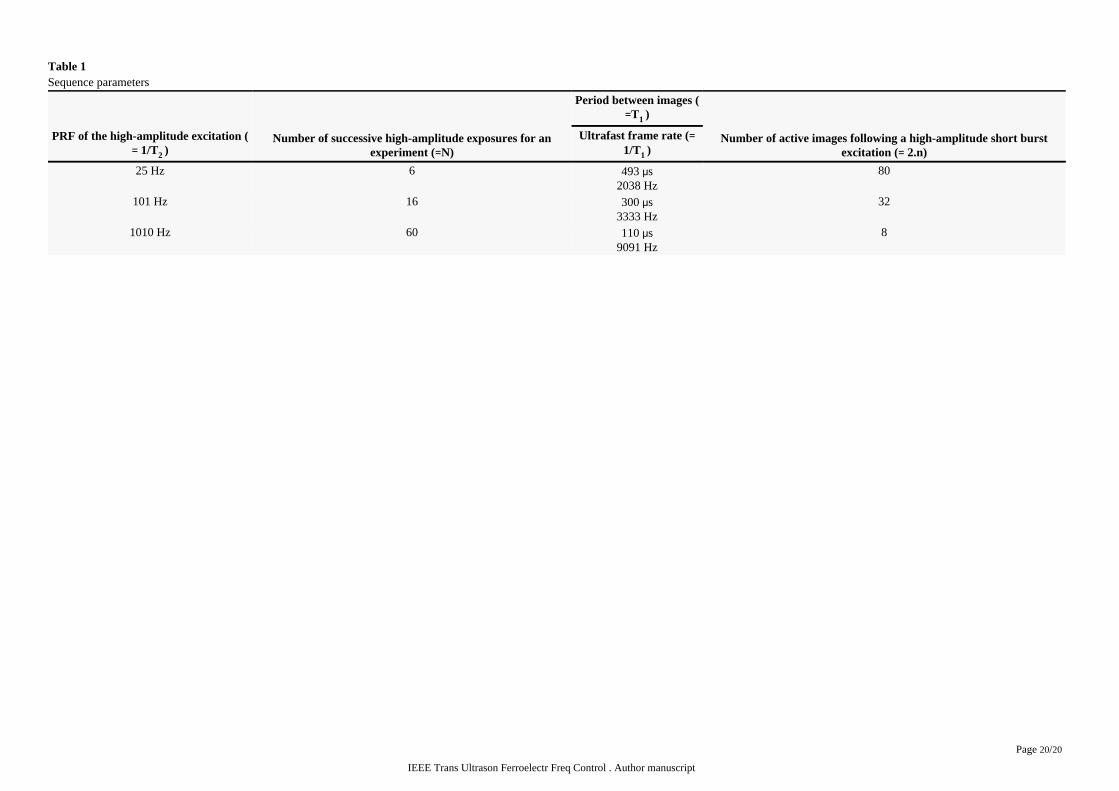
IEEE Trans Ultrason Ferroelectr Freq Control . Author manuscript
Page /20 20
Table 1Sequence parameters
PRF of the high-amplitude excitation ( 1/T )= 2
Number of successive high-amplitude exposures for anexperiment ( N)=
Period between images (T )= 1
Number of active images following a high-amplitude short burstexcitation ( 2.n)=
Ultrafast frame rate (=1/T )1
25 Hz 6 493 sμ2038 Hz
80
101 Hz 16 300 sμ3333 Hz
32
1010 Hz 60 110 sμ9091 Hz
8