Embed Size (px)
Citation preview

Postal address Visiting address Telephone
P.O. Box 124 Getingevägen 60 +46 46-222 82 85
SE-221 00 Lund, Sweden +46 46-222 00 00
Web address Telefax
www.chemeng.lth.se +46 46-222 45 26
Combined production of bioethanol and
biogas from wheat straw
by
Victor Gustafson
Department of Chemical Engineering
Lund University, Sweden
June 2015
Supervisor: Dr. Krisztina Kovacs
Examiner: Assoc. prof. Mats Galbe


i
Preface This master thesis has been performed at the Department of Chemical Engineering at the
Faculty of Engineering, Lund University.
First of all I would like to thank my supervisor Krisztina Kovacs for the opportunity to work
with this interesting project and for all the help and support she has given me throughout this
thesis. I would also like to take the opportunity to acknowledge my examiner Mats Galbe for
his time and effort in this project. I also want to thank Dr Ola Wallberg for introducing me to
this project, without him I would most likely never have discovered this project.
I would also like to thank the following people:
Filip Vrgoc, for all the interesting conversations, good spirit and help he has provided me with
concerning analysis and overall any issues with the laboratory experiments.
Balazs Franko and Pia-Maria Bondesson, for all the help they have provided me with issues
concerning fermentation.
Åsa Davidsson, for providing me with sludge for the biogas experiments.
Everyone at the department who made this time worthwile. Especially thanks to Åse Trulson,
my office colleague for all the fun company, and to Thais Leidiomara Silva Nilsson and Ida
Ahlberg, my lab colleagues which brighten up the everyday with a lot of jokes and funny
conversations.

ii
Abstract Currently the production cost of lignocellulosic ethanol is considered to be relatively high.
Large fractions of the production cost come from the raw material and the energy consumed in
the distillation. Therefore it is desirable to have a process that yields high concentration of
ethanol and maximizes the utilization of the biomass. Wheat straw is a promising raw material
for lignocellulosic ethanol production. It contains large fractions of glucose (C-6 sugar), xylose
(C-5 sugar) and lignin. Since the yeast (Ethanol red) is only able to convert C-6 sugars to
ethanol, the rest has to be efficiently separated and turned into other value-added products.
The approach in this study was to pretreat the wheat straw by steam explosion with addition of
a catalyst, which recovers most of the glucose and lignin in the solid fraction and most of the
xylose as well as degradation products in the liquid fraction. The solid fraction which contains
most of the C-6 sugars is utilized as substrate in the fermentation and the liquid fraction can be
utilized as substrate for biogas production.
In order to achieve higher concentrations of ethanol, the water insoluble solids (WIS) content
was increased in the fermenter vessel. WIS-contents investigated were 20%, 25% and 30%. But
by doing so, there will be an increased resistance to stirring, mass transfer limitations and
increased inhibitor concentration. This will most likely have a negative impact on the ethanol
yield.
The pretreatment was carried out by steam explosion at 190°C and 10 minutes residence time,
using lactic acid as a catalyst. About 91% of the glucose was recovered in the solid fraction and
about 54% of the xylose as well as most of the degradation products were recovered in the
liquid fraction. The fermentations were carried out by simultaneous saccharification and
fermentation (SSF) with or without a pre-hydrolysis step (PSSF). The experiments were
performed in fed batch mode, which was used in order to avoid increased viscosity. The highest
ethanol concentration (about 102 g/l, corresponding to 9.7% (w/w)) was achieved by the PSSF
concept at 30% WIS. The ethanol yield was about 88% of the theoretical yield, based on the
glucose available in the substrate. The liquid fraction was further separated from the solids and
distilled, intended to be used as substrate for biogas production. The solid residues can be used
for process heat.
The highest methane yield obtained from the pretreatment hydrolysate was about 168 ml/g
volatile solids (VS), corresponding to 2 g methane per 100 g wheat straw. The methane yield
of the stillages from the SSF experiments was estimated by stoichiometric calculations to be
about 1 – 3 g of methane per 100 g wheat straw.

iii
Populärvetenskaplig sammanfattning Kombinerad bioetanol- och biogas-produktion från vetehalm. Genom ökad torrhalt vid
fermentering, samt biogasproduktion från restprodukter, kan lönsamheten för biobränslen att
öka.
Ökande miljöproblem gällande växthusgaser är ständigt i fokus. År 2007 gav det europeiska
parlamentet nya direktiv gällande energipolitiken, där målen var att växthusgaserna i Europa
ska reduceras med 20% och att minst 10% av allt bränsle ska komma från biobränslen år 2020.
Med tanke på att det finns en stor brist på vissa produkter, så anser en del människor att det är
fördelaktigt ur ett etiskt perspektiv att använda råvaror som inte användas till matproduktion.
Vetehalm är därför en bra råvara för att göra biobränsle av, eftersom att vete är en av de mest
odlade grödorna Europa och halmen används inte till matproduktion. Ett av de största
problemen med att tillverka biobränslen är att det oftast är väldigt kostsamt, där stora kostnader
utgörs av energiförbrukning samt råvaror.
Målet var att hitta en tillverknings-process med minskad energiförbrukning. Detta kan göras
genom att öka koncentrationen av etanol i fermenteringen (eftersom att destilleringen
koncentrerar etanol). Detta görs enklast genom att öka andelen jäsbart socker, vilket medför
ökad torrhalt i fermenteringen. Problemet med en ökad torrhalt är att det blir svårt att få en bra
omrörning, vilket kommer att leda till att mycket av materialet inte kan användas effektivt.
Genom att förbehandla vetehalm via en metod som kallas för ”Ångexplosion”, där vetehalm
behandlas av ånga, så kommer det mesta sockret med 6 stycken kolatomer att hamna i en fast
fas. Resterande delar, mestadels socker med 5 kolatomer samt biprodukter kommer att hamna
i en vätskefas. Denna vätskefas samt det mesta som fås över från vilket processteg som helst
kan användas för att tillverka biogas, vilket är en blandning av metan och koldioxid.
När experimenten utfördes så erhölls ungefär 90-91% av glukosen från vetehalm i den fasta
fasen och 48 – 51% av socker med 5 kolatomer i vätskefasen genom förbehandlingen. Detta är
ett relativt bra resultat, eftersom det viktiga är att få så mycket glukos som möjligt i den fasta
fasen. I fermenteringen undersöktes tre olika torrhalter, 20%, 25% och 30%. Det visade sig att
en hög torrhalt på ungefär 30% i fermenteringen gav en så hög koncentration av etanol som 102
g/l vilket motsvarar ungefär 9.7 vikts%. Detta motsvarar ungefär en 12% alkoholdryck,
förslagsvis en vinflaska på systembolaget. Det som var överraskande var att det teoretiska
utbytet av glukos inte minskade med en ökad torrhalt, utan tvärtom det ökade! Ur experimenten
så erhölls ett utbyte på 85 – 88% av glukosen som fanns tillgängligt, vilket är väldigt högt för
en sån här hög torrhalt. Från fermenteringen så fanns det även massa biprodukter kvar i fast
form, vilket kan förbrännas och ge energi.
Tyvärr så uppstod den en rad problem med utrustningen för tillverkning av biogas därför blev
inte resultaten så bra. Det högsta utbytet av metan var ungefär 168 ml/g fast material. Men det
kan konstateras att det var möjligt att producera ungefär 2 gram metan av 100 gram vetehalm,
detta är ungefär 6% av den totala energi som man kan tänka sig utvinna från vetehalm.
Sammanfattningsvis utvanns det ungefär 15 gram av etanol, 2 gram metan och 35 gram rester
i fast fas, som alla anses vara värdefulla produkter eftersom att de generera energi. Om man
översätter dessa produkter till hur mycket energi de innehåller, så är det ungefär 74% av den
teoretiskt möjliga energi som maximalt går att utvinna.

iv
Table of Contents
1. Introduction ............................................................................................................................ 1
2. Literature Review ................................................................................................................... 3
2.1 Ethanol from biomass ....................................................................................................... 3
2.2 Lignocellulosic biomass as raw material.......................................................................... 3
2.3 Wheat straw ...................................................................................................................... 5
2.4 The conversion of lignocellulose biomass to ethanol ...................................................... 5
2.5 Lignocellulosic ethanol production today ........................................................................ 5
2.6 Enzymatic hydrolysis ....................................................................................................... 6
2.7 Pretreatment...................................................................................................................... 7
2.8 Inhibitors .......................................................................................................................... 8
2.9 Fermentation ..................................................................................................................... 9
2.10 Simultaneous saccharification and fermentation .......................................................... 10
2.11 Ethanol recovery........................................................................................................... 10
2.12 Biogas ........................................................................................................................... 10
2.12.1 Important process parameters for anaerobic digestion .......................................... 11
3. Materials and Methods ......................................................................................................... 13
3.1 Raw material................................................................................................................... 13
3.2 Steam pretreatment ......................................................................................................... 13
3.3 Process configuration for combined production of ethanol and biogas ......................... 14
3.4 SSF ................................................................................................................................. 15
3.5 Distillation ...................................................................................................................... 16
3.6 Biogas ............................................................................................................................. 16
3.7 Analysis of ethanol, sugars and byproducts ................................................................... 17
3.7.1 Composition analysis of liquid fraction ................................................................... 17
3.7.2 Composition analysis of solid fraction .................................................................... 17
3.7.3 Determination of water insoluble solids .................................................................. 18
3.7.4 Determination of volatile solid content ................................................................... 18
3.8 Calculations .................................................................................................................... 18
4. Results and Discussion......................................................................................................... 20
4.1 Composition analysis ..................................................................................................... 20
4.2 SSF ................................................................................................................................. 22
4.2.1 SSF at 20% WIS ...................................................................................................... 22
4.2.2 SSF at 25% WIS ...................................................................................................... 24
4.2.3 SSF at 30% WIS ...................................................................................................... 26

v
4.2.3 Comparison of SSF and PSSF at various WIS contents .......................................... 27
4.3 Biogas ............................................................................................................................. 29
4.4 Combined production of ethanol and biogas .................................................................. 31
5. Conclusions .......................................................................................................................... 33
6. Future work .......................................................................................................................... 35
7. Reference list ........................................................................................................................ 36
Appendices
Appendix I. Composition analysis of solid fractions
Appendix II. Composition analysis of liquid fractions
Appendix III Fed-batching of fermenters
Appendix IV. SSF batches 1 – 4
Appendix V. Concentration of sugars
Appendix VI. Byproducts
Appendix VII. Composition of thin stillage
Appendix VIII. Lower heating value


1
1. Introduction The world’s population is steadily increasing and more countries are expanding their industrial
production, especially India and China. These developments increases the global energy
demand as well as the pressure on the food supply. Today we are heavily reliant on fossil
resources, which are crucial for the global economy, they make up for the most of the global
energy supply as well as raw material for the chemical industry. Since fossil resources have a
considerable negative environmental impact, as well as they are about to be depleted, renewable
and more environmental alternatives have to be developed [1].
In 2007 the energy sector was accountable for 80% of all the greenhouse gas (GHG) emissions
within European Union. According to forecasts at that time, the energy policies were not
sustainable due to the fact that the GHG emissions would increase 5% in the European Union
and 55% globally for 2030. Therefore new policies were issued, the GHG emissions should be
reduced by 20% year 2020, compared to the levels of 1990 and at least 10% of all energy
consumption should come from biofuels and 20% from renewables [2]. In order to achieve this
goal more biofuel and bioenergy must be utilized, since they do not contribute to any net GHG
emissions. Suitable candidates are bioethanol and biogas derived from biomass. Ethanol is
suitable as a transportation fuel, whereas biogas can be used for transportation fuel as well as
production for heat and electricity.
Bioethanol has gained a lot of attention recently and today there are large scale production of
ethanol mostly from sugars and starch-based materials. There are major ethanol producers in
USA, where they use corn as raw material and Brazil, where they use sugar cane [3]. However,
considering there is a widespread starvation throughout the world, which does not seem to be
solved in a foreseeable future, this raises concern considering the ethics of making
transportation fuels out of the food supply, the cost of raw material is also considered to be
fairly high. Therefore it has been a considerable effort in producing ethanol, using biomass from
lignocellulosic materials, which is not part of the food supply. Examples of lignocellulosic
materials are forest products and agricultural waste. The cost of lignocellulosic materials is also
lower than sugar based raw materials. An issue with using forest products and agricultural waste
is that it is not as convenient to handle as sugar based materials are [4].
Biogas shows a large potential since it is relatively easy to produce and it can be produced from
almost any biodegradable material. In Sweden, it is common that wastewater treatment plants
are equipped with a biogas reactor [5].
Wheat straw which was the focus of this project, is a suitable candidate as raw material for
combined bioethanol and biogas production, due to its abundance and renewability. It
comprises of a mixture of hemicellulose, cellulose and lignin. In Sweden 2013 there was 1.87
million tons of wheat produced [6].The wheat is used for food production, where the residues,
the wheat straw is a potential source of raw material for biofuel production.
One of the greatest issues with lignocellulosic ethanol is that the production costs are relatively
high. Large fractions of the production cost come from the raw material and the energy
consumed in the process. Therefore it is desirable to have a process that yields high
concentrations of ethanol and maximizes the utilization of the raw materials. Wheat straw,
which was the focus in this project, contains large fractions of glucose (C-6 sugar), xylose (C-
5 sugar) and lignin. Since the intended yeast for this project was only able to convert C-6 sugars

2
to ethanol, C-5 sugars has to be efficiently separated and turned in to other value adding
products. A suitable approach is to pretreat the wheat straw by employing steam explosion with
addition of a catalyst, which recovers most of the glucose and lignin in the solid fraction and
most of the xylose as well as degradation products in the liquid fraction. The solid fraction
which contains most of the C-6 sugars can be utilized as substrate in the fermentation and the
liquid fraction can be utilized as substrate for biogas production. The slurry in the fermenter
vessels can be further separated into a solid and liquid fraction. Where the solids mostly consists
of lignin. The liquid can further be distilled in order to recover the ethanol, the stillage can also
be potential source of substrate for biogas production. The solid residues can be turned into
other value adding products, such as lignin pellets or burnt to provide the process with heat.
The goal of this project was to find a process concept which maximizes the energy yield from
wheat straw by a combined production of ethanol and biogas. It was desired to achieve a
recovery over 80% of the ingoing energy in wheat straw. The process concept was based on
separating the C6-sugars from the C5-sugars by employing steam explosion, using lactic acid
as a catalyst. Afterwards the solid fraction, rich in C6-sugars, was used to produce ethanol in
simultaneous saccharification and fermentation (SSF), while the liquid fraction, rich in C5-
sugars, organic acids and byproducts, was used to produce biogas by anaerobic digestion. The
lignin-rich solid residues were not used in this project, but were considered in the product and
energy balances. In the SSF, the aim was to obtain an ethanol concentration of 6% (w/w),
without decreasing the ethanol yield. High ethanol content makes the distillation more
economical. The ethanol concentration was increased by using high dry matter content in the
SSF.

3
2. Literature Review
2.1 Ethanol from biomass The bioethanol production today mostly relies on feed-stocks containing starch and sugars,
although it is quite controversial considering sustainability due to the fact that these feedstocks
are a food supply. Thus bioethanol produced from lignocellulosic biomass is considered to be
an interesting alternative, due to the fact that it does not compete with food crops and it is less
expensive than conventional agricultural feedstock [7].
2.2 Lignocellulosic biomass as raw material Lignocellulosic biomass comprises a range of materials, such as forestry and agricultural
residues, waste from the pulp and paper industry, municipal solid waste, energy crops amongst
others. These resources are vast and they can potentially be used as raw materials for ethanol
production. Since these materials possess a certain resistance to degradation, it is necessary to
pretreat them before use.
The main constituents of plant matter is lignocellulose, which comprises the natural polymers
hemicellulose, cellulose and lignin. These are strongly interconnected and chemically bound by
covalent cross linkages and non-covalent forces [8].
Cellulose has a linear structure of β-1,4-linked D-anhydro-glucopyranose units (Figure 2.1).
The beta bonds make the adjacent glucose molecule rotate 180°. Anhydro-cellbiose makes up
for the repeating unit in the polymer. The structure is highly symmetrical due to the rotation of
the molecules and the cellulose is ordered into long chains. The hydrogen bonds between
hydroxyl-groups and oxygen molecules, as well as Van der Waal’s forces arrange several
hundreds of cellulose chains into insoluble and rigid microfibrils [9]. The chains are highly
ordered crystalline domains, which are disrupted by amorphous regions [10].
Figure 2.1. The structure of cellulose. Glucose molecules are connected by β-(1-4) bonds,
which give cellulose its rigid structure. [11].
Hemicellulose is the linking agent between cellulose and lignin. It is a complex polymer,
comprised of various sugar units. For example D-mannose, D-galactose, D-glucose, D-xylose,
L-arabinose and glucoronic acids (Figure 2.2) [12]. The sugars are mainly linked together by
β-1,4- and to lesser extent by β-1,3-glycosidic bonds [8]. Furthermore, there are various
subclasses of hemicellulose, depending on the specific plant species, stage of development and
the tissue type. These are classified by the main sugar composition, such as xylans, mannans or
glucans. Since hemicellulose has a highly branched structure, it is able to be heavily hydrated
and thus forming gels [13]. Hemicellulose makes up for about one third of hardwoods and
herbaceous plants. The major components of the hemicellulose in softwood and hardwood are

4
usually made up of various mannan types or glucurono-xylans. For cereal residues, such as
wheat straw, arabino-glucurono-xylan and arabino-xylan are the most abundant hemicelluloses
[14].
Figure 2. 2. Structure of hemicellulose.
Lignin is one of the most common polymer in nature. Lignin provides structural support,
impermeability and mechanical resistance for the plants cell wall. The structure of lignin is
complex, highly cross-linked and three-dimensional amorphous heteropolymer (Figure 2.3). It
consists of phenyl-propane units, joined together through various ways of linkages. The
polymer consists of three different phenyl-propanoid units: syringyl propanol, p-hydroxyphenyl
and guaiacyl propanol. Depending on the origin, the proportions of these building blocks vary
[15].
Figure 2.3. Structure of lignin.

5
2.3 Wheat straw Wheat straw seems to be one promising feedstock for the production of biofuels due to the fact
that it is very abundant, has low lignin content and is renewable. According to the Food and
Agricultural organization of the United Nations (FAO), there was 716 million tons of wheat
and about 1000-1250 million tons of wheat straw produced globally in 2013 [16]. Today wheat
straw is generally used for the soil conservation of the crops, about 50% is required to be left
on the fields [17]. Farmers also use wheat straw to feed their life stock. Thus it is estimated that
about 15 – 40% of total residues produced can be used for fuel production [18].
2.4 The conversion of lignocellulose biomass to ethanol Fermentable sugars in lignocellulosic material are not as easily accessible as sugars from starch
based materials, therefore lignocellulosic materials requires a harsher pretreatment. The reason
behind this is the recalcitrant structure of lignocellulosic biomass [19]. The first step of
production of lignocellulosic ethanol is size reduction and hydrolysis of carbohydrates. There
are mainly three methods of hydrolysis, concentrated- or dilute-acid hydrolysis and enzymatic
hydrolysis.
The oldest method is acid hydrolysis. Sulfuric acid is the most investigated amongst the acids,
since it has proven to be the most effective on both hemicellulose and cellulose. Concentrated
acid hydrolysis is usually run at moderate pressures, with low temperatures and acid
concentrations between 60 – 90% [20]. Naturally since it is highly concentrated acids, the
equipment has to be made of corrosion resistant material. Recovery of the acids is necessary
due to economic reasons [21]. The advantage of this method is that sulfuric acid hydrolyses
sugars with a small amount of sugar degradation and with a high sugar yield [22].
Dilute acid hydrolysis requires lesser amount of acid, the concentration ranges between 0.5- 4%
(w/w) but in return it demands a higher operation temperature, between 160 - 230°C. This
results in a higher sugar degradation and corrosion problems. The greatest drawback is that the
sugar yields are only 50 – 60% of the theoretical yield, and it also generates higher amounts of
by-products which inhibit the microbes responsible for fermentation. Therefore this method is
considered to be too inefficient for a competitive use [22]. However, by implementing a two
step hydrolysis, the amount of sugar degraded can be decreased. In the first step, hemicellulose
sugars can be solubilized in milder condition within a temperature range between 150 - 190°C,
subsequently the remaining cellulose is hydrolyzed in harsher condition, with temperatures
ranging between 190 - 230°C. Even though sugar degradation is prevented by implementing
this method, there is no considerable increase of glucose yield [23].
2.5 Lignocellulosic ethanol production today Recently there has been huge development concerning production of lignocellulosic ethanol.
In 2012 the worlds first commercial plant opened in Italy and in 2014 another three
commercial plants commenced. A short description of the some of the largest plant in the
world is presented below.
Inbicon’s bioethanol plant located in Kalundborg, Denmark, has the capacity to produce 5.4
million liters of bioethanol annually, using about 33 000 tons of straw as raw material. Lignin
pellets and C5 molasses are generated as byproducts, the latter is used in order to produce biogas
via anaerobic digestion [24].

6
There are currently several companies planning to scale up their operations for commercial
lignocellulosic ethanol production. In Crescentino in Italy, 2012 the Beta Renewables plant
started operation, which is considered to be the first commercial scale cellulosic ethanol plant.
It is estimated that the plant will produce about 60 000 tons of ethanol annually. It uses Arundo
donax, perennial cane and wheat straw as raw material. The residuals from the process are burnt
in order to generate heat for the plant [25].
Poet-DSM’s plant named “Project LIBERTY”, located in Emmetsburg, IOWA, is the first
commercial cellulosic ethanol plant in the United States, which commenced in 2014. The plant
converts baled corn cobs, leaves, husk and stalk into renewable fuel. At full capacity it will
convert 770 tons of biomass each day. With that rate, Project LIBERTY will produce 75.7
million liters, which correspond to 60 000 tons, of ethanol annually. It will later be ramped up
to produce 75 000 tons of ethanol per year [26].
In Brazil there are currently two commercial lignocellulosic bioethanol plants. The GranBio
plant in Sãn Miguel dos Compos, Algoas, which is the first commercial plant in the southern
hemisphere. It has a capacity to produce about 65 000 tons of ethanol annually using straw and
bagasse. The second one is the Raizen/Iogen in Costa Pinto sugarcane mill plant, it also uses
bagasse and straw and has the capacity to producing 31 000 tons of ethanol annually. Both
plants commenced in 2014 [27]–[29].
2.6 Enzymatic hydrolysis Almost every living creature on this planet utilizes carbon as a source of energy. Since biomass
is the most abundant source of carbon in nature, several microbes have developed efficient
enzymes in order to degrade cellulose. Trichoderma and Aspergillus species are aerobic
filamentous (thread like) fungi with one of the most efficient enzyme system dedicated for this
purpose. That is why they are getting a lot of attention in research as well as being used for
industrial production of cellulose degrading enzymes [30].
There are four different classes of enzymes which are involved in biodegradation of cellulose.
(1)Endoglucanases, which release glucooligosacharides by cutting the cellulose chain,
preferably at the amorphous region. (2)Cellobiohydrolases, which release cellobiose from
crystalline cellulose by attacking the end of the cellulose chain. (3)Βeta-glucosidases, which
degrade oligosaccharides into glucose. Lastly there is (4) lytic polysaccharide monooxygenase
(LPMOs) which carry out oxidative cleavage of glycoside bonds. [31]–[33].
The ratio of enzymes secreted varies between microbes. For example Trichoderma reesei
secretes cellobiohydrolases and endoglucanases to a higher extent, while it is deficient in β-
glucosidases. This results in an accumulation of cellobiose that further cause end product
inhibition. Therefore β-glucosidases have to be provided from another source, preferably from
the microbe Aspergillus niger.
The hydrolysis rate that a certain enzyme system cocktail can provide, is depending on the
substrate used. For lignocellulosic materials, where cellulose is highly crystalline and
surrounded by hemicellulose and lignin, the rate of hydrolysis tends to be low. Therefore steam
pretreatment is preferably performed in order to increase the accessibility for the enzymes.
Enzymatic hydrolysis is initially fast, however as the number of amorphous regions and free
ends decrease, so does the rate of hydrolysis [9]. There are several other potential factors which
decrease the rate of hydrolysis, such as enzyme adsorptive loss. Activity is measured using a

7
Whatman nr 1 filter paper, thus the unit used for measuring enzymatic activity is given by filter
paper unit (FPU). However, the hydrolytic efficiency of one FPU of a certain enzyme on a
certain substrate does not correspond to the hydrolytic efficiency of one FPU of the same
enzyme on a different substrate, due to the difference in the structure of the lignocellulosic
materials [34].
The enzymes used in enzymatic hydrolysis are expensive. Biomass pretreatment based on
enzymatic hydrolysis is considered to be the second largest economic cost for the production
of bioethanol, after the cost of feedstock [35].
2.7 Pretreatment In order for the enzymes to efficiently convert cellulose to sugars, the lignocellulosic biomass
has to be pretreated. Hemicellulose has hydrogen bonds to cellulose microfibrils which form a
strong back bone to the plant cell wall. The presence of lignin as well as the crystallinity of
cellulose give further resistance to the accessibility. Therefore, the pretreatment step is crucial
in order to optimize the enzymatic hydrolysis [35]. The pretreatment should result in high
yields of sugars and high digestibility of cellulose, while keeping the degradation of sugars and
formation of inhibitory compounds to a minimum, as well as the costs [36].
It is necessary to carefully evaluate the most suitable pretreatment methods, since it will affect
all other steps the in the conversion process. Steam pretreatment is thought to be one of the
most promising methods, it is also the most widely used in pilot and demonstration-scale
facilities. The biomass has to be chipped before treatment. The principal of steam explosion is
that the material is first exposed to high pressure saturated steam, the pressure is then rapidly
decreased. Thus the material undergoes an explosive decompression. The initiating temperature
is usually between 160 – 260°C, which corresponds to a pressure of 0.69 – 4.83 MPa. The
operation time is usually about several seconds to a few minutes. This increases the potential
of cellulose hydrolysis, due to the degradation of hemicellulose and transformation of lignin
(Figure 2.1) [37]. Key factors to the steam pretreatment are residence time, temperature, chip
size and moisture content. Either a shorter residence time and a higher temperature, or a longer
residence time and lower temperature optimizes the hemicellulose solubility and hydrolysis
[38].

8
Figure 2.4. Visual presentation of degradation of hemicellulose and destruction of lignin by
pretreatment [39].
By adding a catalyst such as acid, SO2 or CO2 in the steam pretreatment, it is possible to
decrease the generation of inhibitory compounds, achieve a greater removal of hemicellulose
and improving the enzymatic hydrolysis [40].
Steam pretreatment is advantageous considering it has a low energy requirement compared to
mechanical comminution. It is considered to be one of the most effective pretreatment methods
for hardwoods and agricultural residues, though it is less effective for softwoods [41]. The
downside of steam pretreatment is that it degrades a portion of the xylan fraction, it may also
generate compounds that inhibit microbes used in down-stream processes, the disruption of the
lignin-carbohydrate matrix may also be insufficient [42].
2.8 Inhibitors During steam pretreatment the sugars in the polymeric chains are hydrolyzed to monomers in
an acidic environment, especially at high temperatures. However with a longer residence time,
higher temperature or acid concentration, the sugars will be further degraded into byproducts,
some of which work as inhibitors to the enzymatic process [43]. Two byproducts which
drastically reduce the ethanol productivity are furfural and 5-hydroxymethylfurfural (HMF).
These two are often used as model byproducts to evaluate toxicity of pretreated lignocellulosic
materials in literature. They are derived from hexose and pentose sugars under harsh conditions.
Further degradation of furfural forms formic acid, while further degradation of HMF forms both
formic acid and levulinic acid [44]. Another important inhibitor is acetic acid. When
hemicellulose is hydrolyzed, the acetyl groups form acetic acid and may inhibit the
hemicellulose hydrolysis. Of the three last mentioned acids, formic acid is considered to be the
strongest inhibitor, followed by levulinic acid. The yeast is not able to handle these organic
acids at high concentrations and might not survive [45]. They do not only inhibit the yeast, but
are also able to partially deactivate enzymes in the hydrolysis [46].

9
Lignin is degraded into phenolic compounds, for example vanillin, vanillic alcohol or acids.
They reduce fermentation rate and the yield from biomass more than they effect the ethanol
yield [47]. It is concluded that phenolic compounds are toxic to the yeast, even though the
mechanism behind this is not fully known yet [48].
2.9 Fermentation After pretreatment and the enzymatic hydrolysis, the environment in the liquid tends to be rather
harsh, which may cause some trouble for the yeast since it has to be able to survive and produce
ethanol. Therefore some adjustment to the environment might be necessary, for example pH
adjustment. For the production of second generation ethanol, ordinary baker’s yeast is common.
It has good fermentation properties and it is easy to come by, it can be purchased in almost any
supermarket. The baker’s yeast contains the yeast strain Saccharomyces cervisiae, which has a
high tolerance to lignocellulosic hydrolysate, has a high glucose utilization while keeping by-
product formation to a minimum.
There has been some development concerning yeast for industrial use recently. Ethanol Red,
produced by Fermentis, which is a modified Saccharomyces cervisiae strain, is said to exhibit
a higher ethanol tolerance, alcohol yield and maintains a higher cell viability compared to
regular baker’s yeast. It is also said to be able to withstand a wider range of fermentation
conditions [49].
Wheat straw mainly consists of glucose and xylose and some lesser amounts of galactose and
arabinose. Saccharomyces cerevisiae is only able to ferment sugars with 6 carbons, thus it is
not able to ferment either xylose or arabinose. The maximal yield of the fermentation can be
derived by observing the reaction, which is presented below.
𝐺𝑙𝑢𝑐𝑜𝑠𝑒(180.16𝑔/𝑚𝑜𝑙) → 2 𝐸𝑡ℎ𝑎𝑛𝑜𝑙(46.07𝑔/𝑚𝑜𝑙) + 2𝐶𝑂2 (44.01𝑔/𝑚𝑜𝑙)
Since one glucose molecule becomes two ethanol- and two carbon dioxide-molecules the
maximum theoretical yield can easily be calculated through the following equation:
𝑦𝑖𝑒𝑙𝑑 =2 · 46.07
180.16= 0.51
𝑔 𝑒𝑡ℎ𝑎𝑛𝑜𝑙
𝑔 𝑔𝑙𝑢𝑐𝑜𝑠𝑒
Thus for every gram of glucose that is put into the fermentation, roughly half of the weight of
ethanol as a maximum can be expected. The sugars that are consumed in the fermentation may
also give rise to formation of byproducts, for example glycerol, acetic acid amongst others.
Formation of byproducts will decrease the ethanol yield. Key factors for an ideal fermenting
microbe are high productivity and yield from all types of sugars, it shall be highly tolerant to
high ethanol and inhibitor concentrations. Certain temperature and pH tolerance are desired for
certain process configurations, for example simultaneous saccharification and fermentation
(SSF). It should also be rather tolerant to low pH, since a low pH reduces risks of contamination.
There are natural occurring strains that are capable of fermenting xylose into ethanol, for
example E. coli, P. stipites and C. shehatae. However these microbes have a low ethanol and
inhibitor tolerance and they perform best in narrower neutral pH range compared to S.
cerevisiae. Some of them also generate mixed products, in some cases ethanol is just a by-
product, thus they are not suitable for industrial use [14].

10
2.10 Simultaneous saccharification and fermentation Simultaneous saccharification and fermentation, SSF, is the concept of which fermentation
occurs simultaneously in the same vessel with enzymatic hydrolysis. The sugars which are
released by the enzymatic hydrolysis are directly fermented by the yeast to ethanol. This will
prevent the end-product inhibition of the hydrolysis, since there is no accumulation of
cellobiose and glucose. This makes it possible to reduce the enzymatic load [50]. It also
minimizes losses of sugars which would occur by separation in other processes between various
process steps [51]. However there are some drawbacks with using the SSF process. The optimal
temperature for enzymes is around 50°C and about 30°C for the yeast [52]. Thus it can be
difficult to find the optimal tradeoff between enzymatic hydrolysis and fermentation of sugars,
and yeast will be seriously damaged if not even dead at temperatures above 37°C. There might
also be a high content of solid lignin in the SSF-vessel, which will make it difficult to recover
and recycle the yeast. Thus the operating cost will be higher due to a higher demand for yeast.
2.11 Ethanol recovery When the SSF is completed, there will be a slurry containing ethanol and a large variety of
other compounds. Recovery of ethanol through solid-liquid separation and distillation might
have a considerable impact for the overall production cost [53]. Usually the distillation step
involves the use of both stripper- and rectification columns. The stripper separates ethanol from
the non-volatile solid compounds. It also removes a large amount of water thus concentrate the
ethanol. In the rectification columns, ethanol is further purified to near azeotropic point values.
Since distillation demands a lot of energy, it is of great importance to obtain as high
concentrations of ethanol as possible in the distillation feed, preferably at least 4 % (w/w) [36].
2.12 Biogas Not all the components of the biomass can be fermented to ethanol, however, a complete
utilization is desired in order to maximize the energy output. A promising alternative is to
process the “waste” from the fermentation, and/or the substrate which is separated in any
process step as feedstock for biogas production.
Biogas typically refers to a mixture of various gases, about 45-85% methane and 15-45%
carbon dioxide, with some traces of other gases [54]. These gases are the products of organic
matter that has been broken down by microbes in the absence of oxygen, in a process called
anaerobic digestion (AD). This is also a fermentation process [55]. AD is a complex process,
based on synergism between various kinds of microbes. AD comprises of four sequential steps,
hydrolysis, fermentation, anaerobic oxidation and methanogenesis [56].
Hydrolysis is the first step in the process, where sugar, fats and proteins are converted into
monomers and oligomers with the help of enzymes. The rate of which the microbes break down
the substrate varies, there are various kinds of microbes specializing in degradation of various
kinds of substrate. Some substrates are generally harder to break down, for example the
degradation of cellulose and hemicellulose is slower than the degradation of proteins [54].
In the second step, fermentation, a number of various kinds of microbes, Enterobacterium,
Bacteriodes, Acetobacterium, Eubacterium amongst others, ferment the products from the
hydrolysis step. In this step mainly sugars, alcohols and proteins are degraded. Fats and
aromatic compounds are degraded in the third step, anaerobic oxidation. The fermentation
generates various products, such as organic acids, alcohols, and ammonia amongst others,
11
depending on the kind of substrate, the chemical and physical environment as well as the kind
of microbes present [54].
Anaerobic oxidation is the third step, where the fermentation products are further degraded
through various biochemical reactions. This step is crucial and is only possible synergism by
the various microbes. The reason is complex, but mostly it depends on the concentration of
hydrogen gas. In the anaerobic oxidation, protons are used as final electron acceptors, which
drive the production of hydrogen gas. Due to thermo-dynamical considerations, the
concentration of hydrogen gas has to be kept to minimum. If the hydrogen gas is not
continuously removed, some of the microbes do no longer get the required energy for growth.
This is where the methane producing microbes come into the picture, as they continuously
consume hydrogen [57]. The substrate used in the anaerobic oxidation mostly comprises of
fatty acids, alcohols and certain amino acids and aromatic compounds [58]. Besides hydrogen
gas, anaerobic oxidation also generates byproducts such as acetate and carbon dioxide [59].
Methanogenesis is the fourth and last step in the biogas process. In this step, microbes produce
methane from mainly hydrogen, carbon dioxide and acetate which are products from the
anaerobic oxidation. Also methyl amines, alcohols and other products from the previous steps
are used as substrate. Acetate is the source to about 70% of the produced biogas [54]. Since the
methane producing microbes, which comprises of both bacteria and fungi, have the slowest
growth rate, methanogenesis is often considered to be the rate determining step in the biogas
process. They are also considered to be the most sensitive of all microbes to changes of pH and
contaminations of heavy metals or other organic compounds. Thus any disruption for the
methanogenes can result in severe consequences for the entire process [60].
2.12.1 Important process parameters for anaerobic digestion
Since there is a mixture of various microbes which work together, it is rather difficult to find
an environment which is optimal for all of them. What is common is that they all need substrate
as a source of energy and building blocks for the cells and electron acceptors. Important
parameters for the microbes are temperature, pH, absence of oxygen and salts.
Microbes are usually divided into various groups classified by the optimal temperature range.
Psychrophils, where growth maximum is around 10°C, mesophils around 37°C, thermophils
above 50°C, extremophils above 65°C and hyperthermophils above 85°C. Generally for all of
these groups, the optimal temperature for cell growth is closely followed by the maximum
temperature at which they start dying [61]. Typically for industrial production of biogas the
temperature ranges between 30 – 40 or 50 – 60°C [62].
The importance of the concentration of oxygen varies between the different groups of microbes.
For example the methanogenes are very sensitive to oxygen and might die if they are exposed
to it. Some are able to handle lower concentrations, while some even grow better with the
presence of oxygen. Some studies indicate that a brief exposure to air will decrease the
concentration of fatty acids.
Most microbes prefer a neutral range of pH, around 7.0 – 7.5. However there are numerous
microbes that are still active outside their preferred range, but this depends on the type. The
microbes that are responsible for fermentation are still active at a pH of about 5. Methanogenes
generally prefer a neutral pH in order to be active [63]. Even if they do not form methane,
certain groups like acidophile methanogenes, are still able to grow at a pH of 4.7, and alkaliphile

12
methanogenes still grow at a pH of 10.0 [64]. In Sweden, the current industrial biogas process
is generally performed at a pH around 8. The optimal ranges of pH follow the same pattern as
they do for the optimal temperature, where the maximum pH before cell death is close to the
optimum [54].
All microbres need salts and other forms of micronutrients in order to carry out functions
necessary for their survival. In salts there are important elements like sodium, potassium and
chlorine. Most of these can be found in various substrates, and additional external salts are
therefore not always required. However, some substrates possess dangerously high
concentrations of salts and could therefore be inhibitory, due to the fact that salts or sugar works
as conservatives and inhibit cell growth. Generally waste from food industries, fishing industry
or other protein rich sources have higher concentrations of salt [54].

13
3. Materials and Methods In this section, the methods for production of bioethanol and biogas is explained, as well as the
various methods for analysis. Here follows a brief description for the experiment. Wheat straw
was pretreated by steam explosion. The solid fraction was separated from the liquid fraction by
using a filter press. The solid fraction was used as substrate for the SSF experiments. After the
SSF, the solids were separated from the liquids by centrifugation. The latter was further distilled
in order to recover the ethanol. The remaining stillage was intended to be used as substrate for
biogas production along with the hydrolysate from the pretreatment. Composition analysis were
made through the standard methods from the National Renewable Energy Laboratory (NREL).
High performance liquid chromatography (HPLC) was used in order to analyze the composition
of the solids fraction and liquid fraction from pretreated wheat straw, liquid fraction from the
SSF experiments and the remaining stillage from the distillation.
3.1 Raw material The wheat straw was provided with a dry matter content of 96%. For size reduction, the wheat
straw was milled using a knife mill and sieved in order to obtain a length of 1 – 5 cm long
straws.
3.2 Steam pretreatment Wheat straw was impregnated using a water solution containing 1% (w/w) lactic acid, the
weight ratio between wheat straw and water was 1:20. The time of impregnation was 1 hour.
After the impregnation the slurry was filter pressed in order to obtain a dry matter content of
about 50%.
After the filter press, the material was loaded into a 10 liter steam explosion unit, each batch
about 800 gram of 50% dry matter wheat straw. The operation conditions for the steam
pretreatment were a temperature of 190°C, which corresponds to a pressure of saturated steam
at 12.5 bar, the residence time was 10 minutes. These conditions were chosen based on
unpublished results, which showed that these were the optimal conditions for wheat straw. Also
lactic acid was used as a catalyst, since it was desired to have milder pretreatment conditions,
and lactic acid can utilized in the anaerobic digestion. A picture of the steam explosion unit and
the appearance of wheat straw before and after pretreatment are presented in Figure 3.1.

14
Figure 3.1. Steam explosion unit used for pretreatment and the appearance of wheat straw
before and after pretreatment.
3.3 Process configuration for combined production of ethanol and biogas Wheat straw were pretreated by steam explosion, recovering glucose in solid fraction and
xylose in the liquid fraction. The latter was used as substrate for biogas production. The solid
fraction was used as substrate in the SSF experiments. There was two different process concepts
investigated in order to produce ethanol. SSF was used in both cases, however in one concept,
the substrate was pre-hydrolyzed (PSSF) for 9 hours for 20% WIS, 24 hours for 25% WIS and
35 hours for 30% WIS before yeast was added. The experiments were run in fed-batch mode in
order to prevent high viscosities within the fermenter vessels. After SSF the solids were
separated through centrifugation, the liquid was distilled in order to recover ethanol, and the
remaining stillage was planned to be used as substrate for biogas. The solids remaining after
SSF were also recovered and can be used for alternative value -added products. A schematic of
the process configuration is presented in Figure 3.2.
Figure 3.2 Schematic flowsheet of the process configuration.

15
3.4 SSF The fermentation experiments were carried out in 2 L laboratory fermenters (Infors AG,
Bottmingen, Switzerland), presented in Figure 3.3, with a total working weight of 1000 g.
Pretreated wheat straw was used as substrate, with a water insoluble solid (WIS) content of
20%, 25% and 30%. The enzymes used were Cellic CTec3, provided by Novozymes AB
(Bagsvaerk, Denmark), with a loading of 10 FPU/g WIS. Yeast concentration used in the
experiments was 5 g/L. The yeast strain used was S. cerevisiae (Ethanol Red) provided by
Fermentis AB, (France). Which was suspended in sterilized distilled water with a water to yeast
ratio of 5:1 and incubated for 20 – 30 minutes at a temperature of 30°C. (NH4)2HPO4 was used
as nutrients at concentration of 0.5 g/L. Vitahop, provided by BetaTec hop products, was added
as an antibacterial agent at a concentration of 0.125 ml/L. 10% NaOH was added in order to
adjust the pH to a level of 5. Before the experiments, the fermenters were sterilized, using an
autoclave at 121°C. The experiments were performed under fed-batch conditions, with 10% of
WIS as starting condition. When the substrate had been sufficiently liquefied, additional
substrate was added up to the final working weight.
There were two different operation concepts investigated, SSF at 35°C, where all of the
enzymes, yeast, nutrients and some substrate was added, to a WIS-level at 10%, all together at
the start of the experiment. The other concept worked basically the same except yeast and
nutrients were not added at the beginning. Instead, pre-hydrolysis SSF or PSSF, enzymes were
added in the beginning as well, but all the substrate were pre-hydrolyzed at 45°C, until it had
been sufficiently liquefied, then nutrients and yeast was added and the temperature was
decreased to 35°C. The operation time investigated was 144h, 168h and 192h. Samples were
first collected after 12 hours, then every 24 hours. All the samples were centrifuged in order to
extract the liquid fraction and filtered through a 0.2 μm filter in order to be analyzed by HPLC.
Figure 3.3. 2L laboratory fermenters from Infors AG
16
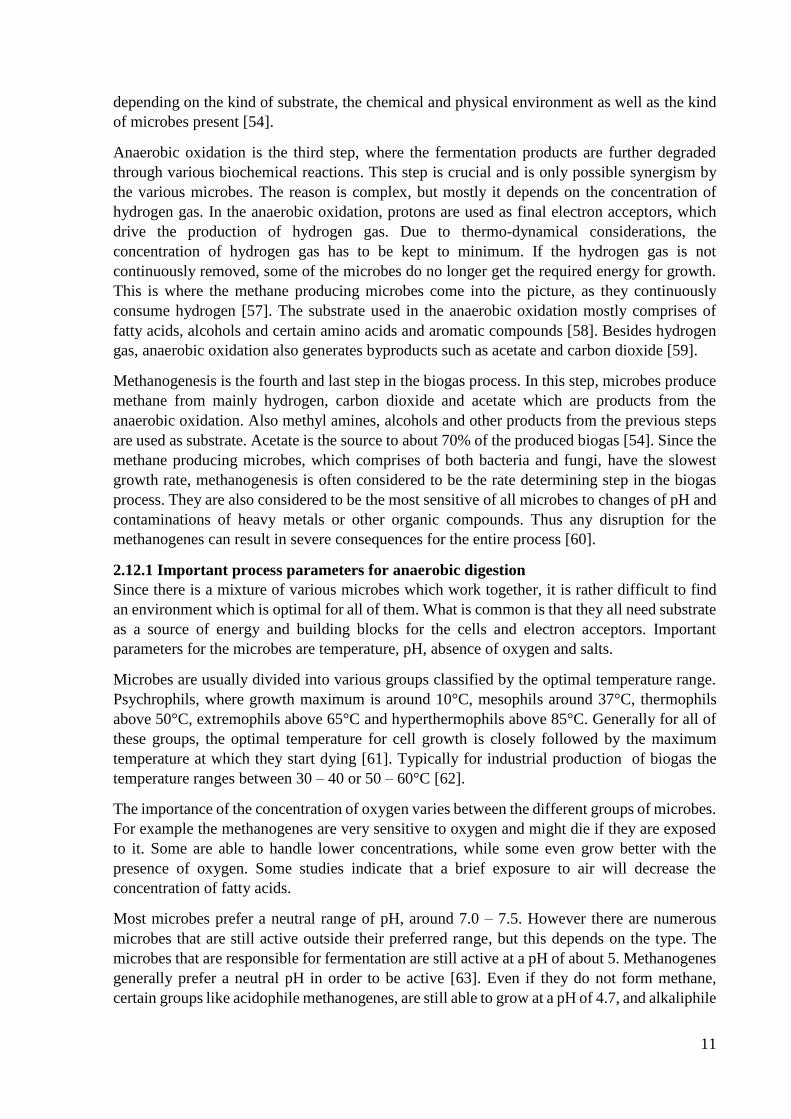
3.5 Distillation Distillation was used in order to recover as much ethanol as possible from the liquid fraction
from the SSF, the remaining fraction, called thin stillage, was further used as substrate for the
biogas production. The equipment set up is presented in Figure 3.4. In order for a maximum
separation of ethanol, the distillation was done twice for every sample. The temperature for the
first distillation was between 80 - 90ºC and 90 - 100ºC for the second one. The distillation was
carried out until all the liquid that had been evaporated had been condensed. The remaining
sample was further analyzed by HPLC to make sure minimal amounts of ethanol were
remaining in the stillage.
Figure 3.4. Experimental set up for the distillation.
3.6 Biogas The biogas was produced by anaerobic digestion, AD, using BlueSens reactors of 1070 and
1220 ml (Figure 3.5). The sludge containing the microbes was provided by Källby wastewater
treatment plant. Before the AD experiment, the sludge was incubated for about 5 days at 37°C
which is the same temperature the reactors were running at. The pH was adjusted to 7 – 8 using
a 25% NH3-solution.The reactors were filled to a weight of 500 gram, with a volatile solids
ratio between sludge and substrate of 2:1. One reactor was used as blank, with sludge to water
weight ratio of 2:1. The experiment was running for 1 - 2 weeks.

17
The produced volume of methane was measured by using milligas counters and the
concentration of methane within the bottles was measured by IR-sensors on a measuring cap.
Both the milligas counter and IR-sensor were provided from BlueSens. The equipment was
connected to a computer for data collection. Since the sludge was relatively hard to stir by
magnetic stirrer, it had to be done manually by shaking the bottles.
Figure 3.5. Biogas reactors with IR-sensors and milligas counters.
3.7 Analysis of ethanol, sugars and byproducts The liquid fraction from the fermentation and pretreatment was analyzed by HPLC, in a
chromatograph equipped with a refractive index detector (RID). Glucose, xylose, mannose,
galactose, arabinose and cellobiose were separated at 85°C in an ion-exchange column.
Distilled water was used as eluent at a flow rate of 0.5 mL/min. Ethanol, glycerol, lactic acid,
acetic acid, furfural, lactic acid and HMF were separated at 50°C in an Aminex HPX-87H
column from Shimadzu. The eluent used was 0.005M sulfuric acid at a flow rate of 0.5 mL/min.
3.7.1 Composition analysis of liquid fraction
The liquid fraction of untreated as well as the pretreated wheat straw was analyzed for
byproducts and total sugar content using a standard method of the NREL [65]. In this method,
the sample was treated with 4% sulfuric acid at 121°C for 1 hour in an autoclave, then it was
neutralized with calcium carbonate in order to be analyzed by HPLC.
3.7.2 Composition analysis of solid fraction The lignin and structural carbohydrate contents of the untreated as well as the solid fraction of
pretreated wheat straw were determined by using a NREL standard method [66]. Dry sample

18
was milled into fine powder in order to be treated with 72% sulfuric acid for 1 hour at 30°C
after that it was diluted to 4% sulfuric acid and autoclaved for 1 hour at 121°C. Solids were
filtered by a filter crucible and dried at 105°C over a night in order to measure the amount of
acid-insoluble lignin. The liquid was neutralized by calcium carbonate in order to be analyzed
by HPLC. Acid-soluble lignin was determined by spectrophotometry using a wavelength of
320 nm.
3.7.3 Determination of water insoluble solids
The total solids and total dissolved solids were determined by using a NREL standard method
[67]. The pretreated material in form of slurry and separated liquid was dried at 105°C in
aluminum pans. The weight fraction of water insoluble solids (WIS) was calculated by equation
3.1:
%WIS=100%∙
TS-DS
1-DS
(3.1)
Where
%DS is the percentage of the dissolved solids in the sample.
%TS is the percentage of the total solids in the sample.
3.7.4 Determination of volatile solid content
The volatile solid content, VS, was determined by first drying samples at 105°C then ashing the
samples in an ash oven for 550°C for two hours, it was calculated by equation 3.2:
%VS= 100%∙
Weight of dried sample(g)-Weight of ashes (g)
Weight of original sample (g)
(3.2)
3.8 Calculations The calculation of the amount of glucose, mglucan (glucan is the solid form of glucose) in the
SSF was done according to equation 3.3:
mglucan=
%𝑊𝐼𝑆
100% ·msubstrate·
𝑊%𝑔𝑙𝑢𝑐𝑎𝑛
100%·1/Canh
(3.3)
Where
msubstrate is the mass of substrate
W%glucan is the weight percent of glucan in in the pretreated wheat straw
Canh is the anhydro correction for monomer sugars which is 0.9 for glucose
The calculation of the amount of glucose in the SSF is made by equation 3.4:
mglucose=msubstrate·
1
ρ·Cglucose
(3.4)
Where
ρ is density of the liquid fraction, estimated to be 1030 (g/l) which was the average of a
number of density measurements.
Cglucose is the concentration of glucose in the liquid fraction (g/l).
The total weight of C-6 sugars is thus mglucan and mglucose, neglecting the contribution of
galactose. The maximal amount of ethanol, methanol,theo is calculated by equation 3.5:
19
methanol,theo=0.51·mc6-sugars (3.5)
Thus the maximum theoretical concentration of ethanol, Cmax was calculated by equation 3.6:
Cmax=
methanol,theo
mtotal∙(1-%𝑊𝐼𝑆𝑒𝑛𝑑
100% )
ρ
(3.6)
Where
mtotal is the total working weight of the fermentation
WISend is the WIS content after SSF.
The ethanol yield is calculated by equation 3.7:
𝑌𝑖𝑒𝑙𝑑𝑒𝑡ℎ𝑎𝑛𝑜𝑙=
Cethanol
Cmax
(3.7)
The mass of ethanol was calculated by equation 3.8:
methanol=Cethanol·mtotal·
1-%WISend
ρ
(3.8)
Conservative yield (C.Yield) is calculated in the same way as the so called Yieldethanol is
calculated, the difference is that WIS after SSF is approximated to be the same as WIS before
SSF.

20
4. Results and Discussion The goal was to recover as much energy from the wheat straw as possible. It was desired to
obtain an energy content in the products (ethanol, methane and solids) corresponding to more
than 80% of the lower heating value of wheat straw. Key factors investigated concerning
ethanol were concentration and yield. The C6-rich solid fraction was used as substrate for the
SSF. The C5-rich hydrolysate from the pretreatments was used as substrate for biogas
production. The residues after distillation (thin stillages) from the SSF experiments were also
considered as potential substrate for biogas production. Moreover, the lignin-rich solids after
SSF were considered for burning.
4.1 Composition analysis In this section the effect of the pretreatment is presented. As has been mentioned before, the
steam pretreatment turns the wheat straw into a wet slurry. The liquid fraction and solid fraction
were further separated in order to perform a composition analysis for each fraction. There were
several composition analysis done, which are presented in Appendix I and II. The mean values
of the sugars and lignin analysis of dry wheat straw as well as the solid fraction of pretreated
wheat straw are presented in Table 4.1. The composition of the liquid fraction is presented in
Table 4.2, and the total recovery of the sugars from the pretreatment is presented in Table 4.3.
The WIS contents of the pretreated wheat straw for pretreatment 1 and 2 were determined to be
7.97% and 8.01%, respectively.
Table 4.1. Composition of dry wheat straw and the solid fraction of pretreated wheat straw in
percentage.
Wheat
straw
Pretreatment 1 Pretreatment 2
Value SD Value SD Value SD
Glucan 35.4 0.1 55.3 0.5 53.6 1.2
Xylan 24.3 0.4 5.2 0.1 4.6 0.2
Galactan* 3.0 0.2 3.6 0.1 2.1 0.2
Arabinan* 4.6 0.2 - - - -
AIL 22.2 1.8 27.0 0.2 28.2 0.1
ASL 0.8 0.9 0.8 0.1 0.8 0.1
Ash 4.7 0.3 4.9 0.2 5.1 0.3
Total 93.9 2.3 96.7 0.4 94.5 1.7
*Under standard calibration curve in the HPLC analysis.
AIL = Acid insoluble lignin; ASL = Acid soluble lignin, SD = Standard deviation
Table 4.1 shows the fraction of sugars, lignin and ash for the solid fraction of wheat straw and
pretreated wheat straw. There are about 55% of glucan in the solid fraction, but only about 4 –
5% of xylan in the pretreated wheat straw compared to 35% glucan and 24% xylan in the
untreated wheat straw. These results indicates that most of the glucan, ash and lignin are
recovered in forms of solids, while xylan is recovered in the liquid fraction which can be seen
in Table 4.3. There are some differences between various pretreatment even though they are
performed in the same manner. These can be explained by error margins that comes with the
equipment and methods, especially HPLC analysis.

21
Table 4.2. Concentration (g/l) of sugars and byproducts in the liquid fraction of pretreated
wheat straw.
Pretreatment 1 Pretreatment 2
Value Value SD
Glucose 3.46 3.44 0.05
Xylose 20.18 17.85 0.12
Galactose* - 1.73 0.34
Arabinose* 2.54 4.06 0.37
Lactic acid* 1.95 1.55 0.02
Formic acid* 0.57 0.60 0.01
Acetic acid* 3.49 3.22 0.10
Levulinic acid* 0.35 0.28 0.01
HMF* 0.09 0.08 0.01
Furfural* 3.02 2.93 0.01
*Under the standard calibration curve for the HPLC analysis. All but one samples for the
composition analysis of the liquid fraction for the pretreatment 1 were ruined, thus no standard
deviation is reported. SD = Standard deviation
Table 4.2 shows the concentration of sugars and byproducts for the liquid fraction of pretreated
wheat straw. There are several byproducts with a concentration greater than 1 g/l. These results
might raise some concern, especially furfural and acetic acid with concentrations of about 3 g/l,
this is due to the fact that they are known to work as inhibitors for the SSF process. The lactic
acid present in the liquid fraction comes with no surprise, it is most likely a remnant of the
pretreatment.
It is important to understand the impact of the pretreatment in order to estimate the value of the
solid and liquid fraction respectively. The goal of the pretreatment was to recover as much
glucose in the solid fraction as possible while solubilizing as much xylose as possible and
keeping degradation products to a minimum. The results for the recovery of glucose and xylose
are presented in Table 4.3.
Table 4.3. Recovered glucose and xylose in the pretreatment.
Glucose recovered/100g wheat
straw
Xylose recovered/100g wheat
straw
Solid
fraction
(g)
Liquid
fraction (g)
Total
(g)
Solid
fraction (g)
Liquid
fraction (g)
Total
(g)
Pretreatment 1 32.26 2.27 35.27 3.01 13.21 15.48
Pretreatment 2 31.93 2.26 34.67 2.74 11.68 13.93
Glucose recovered in
pretreatment (%)
Xylose recovered in pretreatment
(%)
Solid
fraction
(%)
Liquid
fraction (%)
Total
(%)
Solid
fraction (%)
Liquid
fraction (%)
Total
(%)
Pretreatment 1 91.14 6.40 97.54 12.38 54.36 66.73
Pretreatment 2 90.19 7.75 96.56 11.29 48.06 59.35

22
Table 4.3 shows the total recovery of the glucose and xylose in the pretreatment. According to
these results, the glucose recovery which is above 96% for both pretreatments seems to be
reasonable, however the xylose recovery was roughly between 59 – 67%. This is not entirely
unexpected since steam pretreatment is known to degrade parts of the xylan fraction. The
pretreatment and composition analysis involve numerous steps which all are sources of errors.
For example, some errors comes with the HPLC analysis, depending on the condition of the
separation column. Pretreated wheat straw is also easier to solubilize during acid hydrolysis.
Therefore it was as expected some differences in terms of concentration between the various
pretreatments and composition analysis.
By comparing the results from the composition analysis and recovery calculations presented in
Table 4.1 – 3 as well as Appendix I and II with experiments done in literature [68], [69], it can
be concluded that there are large deviations between composition analyses. Which can be
expected due to numerous alternative methods and use of different equipment.
4.2 SSF In order to obtain high WIS-content without increasing the viscosity for the substrate in the
fermenter vessels, which would make it difficult to stir, the experiments were operated using
fed batch mode. The fed-batch SSF experiments were carried out by using two different process
concepts, SSF and PSSF. PSSF was investigated in order to evaluate possible advantages of
enzymatic hydrolysis at 45°C before adding yeast. There were three different WIS% contents
investigated, 20%, 25% and 30%. The SSF experiments were run for 192 hours in order to make
sure that maximal ethanol concentration was obtained. However this is a rather long residence
time, usually SSF experiments are run for 96 hours.
4.2.1 SSF at 20% WIS
Three different SSF- and PSSF-experiments were carried out at a WIS content of 20%. The
composition of the pretreated substrate used in Batch 1 - 4 is presented in Appendix I and II.
Batch 5 and 6 used substrate from pretreatment 1 (see Table 4.1). All the fermentations started
with 10%WIS content and were fed for 5 – 8 hours to obtain a WIS content of 20%. The fed-
batching strategies are presented in Appendix III. The results of ethanol yield, concentration
and weight percent of ethanol and WIS after SSF are presented in Table 4.4.
Table 4.4. Fermentation with WIS content of 20%, ethanol concentration, weight percent of
ethanol in the liquid fraction, conservative ethanol yield and ethanol yield.
Batch %WIS
after SSF
Concentration
(g/l)
%Ethanol
(w/w)
C.Yield
(%)
Yield
(%)
1. SSF 20% WIS* 11.5 55.2 5.4 65.6 72.6
2. PSSF 20% WIS* 12.2 55.0 5.3 65.3 71.6
3. SSF 20% WIS* 12.0 56.6 5.5 68.8 74.3
4. PSSF 20% WIS* 12.0 57.8 5.6 66.7 75.9
5. SSF 20% WIS 10.7 55.8 5.4 68.8 76.8
6. PSSF 20% WIS 9.1 54.1 5.3 66.7 75.8
*Fermentations were running for 144 hours. The WIS measurement of the second fermentation
was ruined, thus the WIS is assumed to be 12%. %Ethanol (w/w) is the weight fraction of
ethanol in the liquid fraction. C.Yield is referred to the Conservative Yield and Yield is referred
to the percentage of the theoretical maximum yield based on available glucose in the SSF.
C.Yield and Yield are calculated by equation 3.3 – 3.8.

23
Figure 4.1 shows the production of ethanol for batches 5-6. Since batches 1-4 were only run for
144 hours and the experiments at 25% and 30% WIS (presented later) were run 192 hours, they
are not comparable, thus not presented in Figure 4.1. The results for batch 1 – 4 are presented
in Appendix IV.
Figure 4.1. Ethanol concentration (g/l) in SSF and PSSF at 20% WIS. In the PSSF at 20% WIS
batch, the yeast and nutrients were added after 9 hours. No duplicates were done due to lack
of time.
Figure 4.1 shows the concentration of ethanol, where the concentration is constant after about
140 hours and there is some increase, about 2 – 3 g/L for the remaining time. At 192 hours the
concentrations for SSF and PSSF are 55.8 and 54.1 g/l respectively. According to these results,
there is no great advantage or disadvantage in terms of ethanol produced by using either PSSF
or SSF. It can though be noted that the concentration of ethanol for PSSF quickly catches up to
the one of the SSF, in about 24 hours, but after that the trends are quite similar. The general
difference between SSF and PSSF will be further discussed in 4.2.4. By comparing these results
from Figure 4.1 with the results with the figures in Appendix IV, it can be concluded that up to
144 hours, all batches show a similar behavior.
In order to investigate to what degree the substrate was utilized, as well as the value of the other
products within the slurry the concentration of glucose, xylose and xylitol was also analyzed,
which is presented in Figure 4.2, the concentration of arabinose and galactose are presented in
Appendix V.
0
10
20
30
40
50
60
0 24 48 72 96 120 144 168 192
Co
nce
ntr
atio
n (
g/l
)
Time (h)
PSSF at 20% WIS
SSF at 20% WIS

24
Figure 4.2. Concentration (g/l) of sugars in SSF at 20% WIS to the left, and PSSF at 20% WIS
to the right.
Figure 4.2 shows that the concentration of glucose in PSSF is rapidly decreasing from 58 g/l
after addition of the yeast and converges close to zero. For the SSF it is constantly close to zero.
From these results, it can be concluded that most of the glucose in liquid form is utilized for the
20% WIS fermentations and the glucose was utilized quickly by the yeast. Figure 4.2 also shows
decreasing concentration of xylose and increasing concentrations of xylitol. It may be possible
that the yeast may have done this conversion, or that the HPLC has detected some other
compound and interpreted it as xylitol.
Besides the byproducts originating from the pretreatment, there also occurs some formation of
byproducts during the fermentation. The trends of byproduct formation for 5.SSF 20% WIS
and 6. PSFF 20% WIS are presented in Appendix VI.
4.2.2 SSF at 25% WIS
For the experiment with a WIS content of 25%, the substrate from pretreatment 1 was used.
The batches started with 126 g of substrate and fed with additional 375.4 g for 32 hours, more
about how the fed-batching was done is presented in Appendix III. The WIS content of the
substrate was 41.6%. There were two batches of PSSF and two batches of SSF. The
concentration of ethanol, sugars as well as byproducts are calculated using an average value for
the samples. The ethanol concentration for SSF 25% WIS and PSSF 25% WIS are presented in
Figure 4.3.
0
1
2
3
4
5
6
7
8
9
10
0 24 48 72 96 120 144 168 192
Co
nce
ntr
atio
n (
g/l
)
Time (h)
Glucose
Xylose
Xylitol
0
10
20
30
40
50
60
70
0 24 48 72 96 120 144 168 192
Co
nce
ntr
atio
n (
g/l
)
Time (h)
Glucose
Xylose
Xylitol

25
Figure 4.3. Ethanol concentration (g/l) in SSF at 25% WIS and PSSF at 25%. Error bars
marking the standard deviation. In the PSSF at 25% WIS batch, the yeast and nutrients were
added after 32 hours.
Figure 4.3 shows the production of ethanol, where the concentration for SSF 25% WIS is about
79 g/l and 72 g/l for PSSF 25% WIS at 192h. However these results come with a large standard
deviation. Figure 4.3 shows that ethanol concentration for PSSF 25% WIS is fairly constant at
about 144h. Which is the same behavior as for the 20% WIS experiments.
The concentration of glucose, xylose and xylitol is presented in Figure 4.4. The concentration
of arabinose and galactose are presented in Appendix V.
Figure 4.4. Concentration for sugars (g/l) in SSF at 25% WIS to the left, and PSSF at 25% WIS
to the right. Error bars marking the standard deviation.
Figure 4.4 shows the concentration of glucose xylose and xylitol. It can be seen, that the glucose
concentration increases from 1.0 g/l to 6.5 g/l between 120h – 192h in the SSF 25% at WIS.
For PSSF 25% WIS, the concentration of glucose increases from 0.5 – 2 g/l between 168h –
0
10
20
30
40
50
60
70
80
90
100
0 24 48 72 96 120 144 168 192
Co
nce
ntr
atio
n (
g/l
)
Time (h)
PSSF 25%WIS
SSF 25%WIS
0
2
4
6
8
10
12
14
0 24 48 72 96 120 144 168 192
Co
nce
ntr
atio
n (
g/l
)
Time (h)
Glucose
Xylose
Xylitol
0
20
40
60
80
100
120
140
0 24 48 72 96 120 144 168 192
Co
nce
ntr
atio
n (
g/l
)
Time (h)
Glucose
Xylose
Xylitol

26
192h. An explanation for these results could be that the yeast is inhibited by either high
concentration of ethanol or byproducts (Appendix VI). Thus no full utilization occurs. This will
be further discussed in sections 4.2.3 and 4.2.4.
4.2.3 SSF at 30% WIS
The experiment with a WIS content of 30% used substrate from pretreatment 2. There were two
batches of PSSF and two batches of SSF. The batches started with 92 grams of substrate and
fed with additional 597.2 grams for 37 hours, more about how the fed-batching was done is
presented in appendix III. The WIS content of the substrate was about 43.5%. The average
concentration of ethanol for SSF at 30% WIS and PSSF at 30% WIS is presented in Figure 4.5.
Figure 4.5. Ethanol concentration (g/l) in SSF at 30% WIS and PSSF at 30% WIS. Error bars
marking the standard deviation. In the PSSF at 30% WIS batch, the yeast and nutrients were
added after 37 hours.
As can be seen in Figure 4.5, both SSF and PSSF 30% WIS reached a concentration around
100 g/l ethanol after 192 hours. This maximum concentration was already reached somewhere
between 120 – 144 hours of fermentation. Furthermore, already after 72 hours 90% of the
maximal ethanol concentration was obtained. The same results in terms of constant
concentration at about 120 - 144 hours is common for all of the SSF experiments. According to
these results, there is no need for the fermentation to be running for 192 hours, about 120 hours
would be sufficient. The concentration of glucose, xylose and xylitol for SSF 30% WIS and
PSSF 30% WIS is presented in Figure 4.6.
0
20
40
60
80
100
120
0 24 48 72 96 120 144 168 192
Co
nce
ntr
atio
n (
g/l
)
Time (h)
PSSF 30% WIS SSF 30%WIS

27
Figure 4.6. Concentration (g/l) of sugars in SSF at 30% WIS to the left, and PSSF at 30% WIS
to the right. Error bars marking the standard deviation.
Figure 4.6 shows the concentration of glucose, xylose and xylitol. The concentration of glucose
in both cases increases after about 96 – 120 hours to finally reach about 30 g/l for the SSF and
15 g/l for the PSSF. These results indicate that the yeast had stopped the production of ethanol
at this point. A possible explanation for this can be that the long residence time for the yeast in
unfavorable conditions made the yeast unable to perform. The initial environment of the SSF
itself is rather harsh, addition to that is the high concentration of ethanol and byproducts as well
as degradation products which may work as inhibitors for the yeast. Since the addition of yeast
occurs about 37 hours later for the PSSF-batches, this happens at a later point which might
explain the lower glucose concentration at the end of the experiments.
4.2.3 Comparison of SSF and PSSF at various WIS contents
The overall comparison between the results of yield, concentration and weight percent of
ethanol for the various experiments is presented in Table 4.5. One important thing to mention
concerning all the fermentation batches, is that the pretreated wheat straw was filter pressed in
order to achieve the desired WIS content of about 40%. This was not all that easy to achieve
due to the fact that the slurry of pretreated wheat straw was not homogenous, which resulted in
WIS content for the substrate in the various SSF experiment ranged from 36 – 44% WIS. A
higher WIS content for the substrate results in a lower amount of inhibitors present.
0
5
10
15
20
25
30
35
0 24 48 72 96 120 144 168 192
Co
nce
ntr
atio
n (
g/l
)
Time (h)
Glucose
Xylose
Xylitol
0
20
40
60
80
100
120
140
160
0 24 48 72 96 120 144 168 192
Co
nce
ntr
atio
n (
g/l
)
Time (h)
Glucose
Xylose
Xylitol

28
Table 4.5. Summary of results of ethanol production from SSF and PSSF at 20%, 25% and 30%
WIS.
Batch WIS after
SSF (%)
Concentration
(g/l)
%Ethanol
(w/w)
Conservative
Yield (%)
Yield
(%)
Value SD Value SD Value SD Value Value
SSF 20% 10.7 - 55.8 - 5.4 - 68.8 76.8
PSSF
20%
9.1 - 54.1 - 5.2 - 66.7 75.8
SSF 25% 13.0 1.3 79.0 11.56 8.0 0.32 73.1 84.8
PSSF
25%
14.4 0.1 72.3 3.95 7.0 0.52 66.7 76.3
SSF 30% 15.7 0.7 96.2 5.40 9.5 0.01 71.2 85.8
PSSF
30%
18.07 0.3 101.8 4.75 9.7 0.27 75.3 88.2
Where the Conservative Yield is the percentage of the maximum theoretical ethanol yield from
glucose in the SSF, calculated by equation 3.3 – 3.8, where the WIS after is approximated to be
equal to WIS before SSF. The Yield is the percentage of the maximum theoretical ethanol yield
from glucose in the SSF, calculated by equation 3.3 – 3.8, where the WIS after SSF was
measured by the method described in 3.7.3 and calculated by equation 3.2.
Table 4.5 shows that the experiments with higher WIS contents, tends to give higher
concentrations and yields of ethanol. Higher concentration of ethanol was expected, but that the
yield tended to increase was unexpected. An explanation to this could be that the total weight
of enzymes added to the fermenters, increased with an increased WIS content. Since the
concentration was fixed to 10 FPU/g WIS for all experiments, the higher the WIS after fed-
batch will be, the higher the enzyme to substrate ratio is at the start, when only 10% WIS is
present.
Table 4.5 shows that the ethanol yield and concentration for the various SSF experiments were
quite similar for batches with the same WIS content. By comparing the SSF and PSSF it is
difficult to draw any conclusions about which process concept yields more ethanol. For the 25%
WIS, the regular SSF seems to achieve a greater yield. For the case of 30% WIS the production
of ethanol is a bit higher for PSSF than SSF, but in both cases there are large standard
deviations.
As can be seen in Table 4.5, the WIS content after SSF is generally lower for regular SSF than
for the PSSF. A possible explanation for these results may be that the concentrations of glucose
were so high when the yeast was added to the PSSF batches that the yeast used a part of it for
cell growth. In that case, the PSSF batches had a higher amount of cell mass, which contributed
to a higher WIS content. Such cell growth might also explain the lower concentrations of
glucose in the end of fermentation for the PSSF at 25% and 30% WIS. Another possible
explanation for the lower glucose concentration at the end of the PSSF-batches compared to the
SSF batches, can be that addition of yeast in the PSSF at 25% and 30% occurs 32 – 37 hours
later than for the SSF. If the yeast is affected by being exposed to the harsh conditions in the
SSF during a relatively long period of time. Naturally the yeast in the PSSF would be able to
perform until a later point during operation in the SSF experiments.

29
There are uncertainties concerning these results. The slurry in the fermenter vessels is not
homogenous, thus sample taking includes error. This may affect the results of the WIS
measurement and sample taking. It may also give rise to temperature and pH gradients within
the fermenter vessels during operation. The results from HPLC could also include some errors,
depending on the condition of the column. In fact there were some difficulties encountered
while the samples were analyzed, some samples showed a large amount of background noise,
the baseline was not completely flat and some other HPLC analysis did not detect any
substances at all. Since basically all the analysis of the composition of the untreated as well as
pretreated wheat straw as well as the concentration of ethanol were done by HPLC, this could
be a great source of error. Some of the sugars as well as byproducts were beneath the standard
calibration curve for the HPLC, thus it is uncertain about the real concentration of any
compound which is beneath 0.2 g/l. This is mostly an issue for samples which also contained
traces of substances which had to be further diluted. It should also be noted that since the slurries
in the fermenters had such high WIS-content, it was difficult to estimate the correct liquid
volume. This fact also provided some uncertainties concerning the calculation of ethanol yield
and weight of ethanol in the liquid fraction.
As can be seen in Appendix VI, the concentration of most byproducts, except glycerol in the
PSSF batches, increases slightly during the fermentation. Glycerol for the PSSF batches
increases rapidly as soon as yeast is added to reach a value of about 5 – 6 g/l and remain fairly
constant.
4.3 Biogas The liquid fraction of steam-pretreated wheat straw contains high amounts of xylose and
organic acids. These are not able to be utilized in the SSF experiments. Since the goal of this
project was to maximize the energy recovery of the wheat straw, the use of hydrolysate from
the pretreatments as substrate for biogas production was investigated. The stillage from the SSF
was also considered to be a potential source of substrate for biogas production. However, due
to malfunctioning equipment, the results from those experiments are unreliable. Therefore
stoichiometric calculations were done instead.
Biogas is produced by anaerobic digestion, important factors are a high methane yield as well
as a high concentration within the reactors. The yield is based on methane (ml) produced per g
of volatile solids in the substrate. The SSF experiments that yielded the highest amount of
ethanol, as well as utilizing most of the glucose were distilled and intended to be used as
substrate for the AD. The five best candidates to fulfill these conditions were SSF at 25% WIS
1 and 2, PSSF at 25% WIS 1 and PSSF at 30% WIS 1 and 2. The results for the methane
production from the hydrolysate are presented in Figure 4.7.

30
Figure 4.7. Methane yield (ml/g VS) using hydrolysate from the pretreatments as substrate.
Hydrolysate 1.1 and 1.2 refer to the duplicates from biogas produced by using the hydrolysate
as substrate from pretreatment 1. Hydrolysate 2.1 and 2.2 refer to the duplicates from biogas
produced by using hydrolysate from pretreatment 2 as substrate for biogas production. These
results are corrected by a blank sample. The composition of the pretreatment hydrolysates is
presented in Table 4.2.
Figure 4.7 shows the amount of methane produced. All of the batches except hydrolysate 2.2,
yielded around 145-170 ml of methane per g VS. Due to an unknown reason, the equipment
stopped analyzing after 122 hours. The experiment should have run for at least 2 weeks, since
the methanogens have a growing time for about 10 – 12 days. However the sludge had been
incubated for 5 days before the start of the biogas experiment, which may have shortened the
minimum residence time required. Indeed it does seem like all the reactors reached a constant
value somewhere around 70 hours. The IR-sensors which measured the concentration of the
methane within the reactors did not function, which may be a reason why the measurement of
biogas stopped. Since no methane concentration could be estimated in the biogas from the AD,
a methane concentration of 50% was assumed in order to do the calculations concerning
methane yield. The biogas produced and methane yields of the hydrolysate are presented in
Table 4.6.
Table 4.6. Biogas production from the hydrolysate from pretreatment 1 and 2.
Hydrolysate from
pretreatment 1
Hydrolysate from
pretreatment 2
Biogas produced (ml) 2258 2030
Concentration of methane
(V%)*
50 50
Methane yield
(ml/g VS)
168 163
Methane g/100 g wheat straw 2.2 1.9
*Methane concentration in the biogas is assumed to be 50% based on literature [54]. The values
presented are average values from duplicates. The biogas produced from the pretreatment 1
0
20
40
60
80
100
120
140
160
180
200
0 20 40 60 80 100 120
Met
han
e yie
ld (
ml/
g V
S)
Time (h)
Hydrolysate 2.1
Hydrolysate 1.1
Hydrolysate 1.2
Hydrolysate 2.2

31
hydrolysate comes with a standard deviation of ±109 ml and ±447 for pretreatment 2
hydrolysate. The composition of the pretreatment hydrolysates is presented in Table 4.2.
Table 4.6 shows the methane produced from the hydrolysate from pretreatment 1 and 2. The
composition of the hydrolysate is presented in Table 4.2. The highest yield of 168 ml/g VS was
achieved by using the hydrolysate from pretreatment 1, which is about 5 ml/g VS more than the
batches using hydrolysate from pretreatment 2. These results indicate that the amount of
methane produced per g VS was almost the same no matter what substrate that was used.
In order to achieve a maximum methane yield from the wheat straw, the stillages from the
distilled liquid fractions from the SSF experiments were intended to be used as substrate as
well. Due to limited time, only the stillage from the process concepts, SSF and PSSF 25% WIS
and PSSF 30% WIS could be investigated. However, the temperature of the water bath went up
to 60°C for a couple of hours, thus the samples were destroyed. Instead of experimental data,
theoretical yields were estimated based on concentrations of sugars and organic acids in the
thin stillages.
Based on the composition analysis of the stillage (see Appendix VII) and the amount of
substrate used, a stoichiometric maximum methane yield can be estimated. The results from
these calculations are presented in Table 4.7.
Table 4.7. Theoretical amount of methane produced by using stoichiometric calculations based
on the composition of the stillage.
SSF 25% WIS PSSF 25% WIS PSSF 30% WIS
Methane produced (ml) 3180 1644 2197
Methane yield
(ml/g VS)
481 266 328
Stoichiometric yield (g/100
g wheat straw)
2.9 1.3 1.8
Where the methane produced is based on the amount of substrate and the composition analysis
of the stillage, which were used in the biogas experiment that failed.
Table 4.7 shows the maximum theoretical production of methane from the stillage. SSF at 25%
WIS achieved the highest methane yield. The reason to why SSF at 25% WIS yields the highest
amount of methane is most likely due to higher remnants of sugars and byproducts such as
acetic acid and glycerol in the stillage.
4.4 Combined production of ethanol and biogas The aim of this project was to investigate the energy recovery for different process concepts. In
order to evaluate the overall efficiency, the yield of products per 100 g of dry raw wheat straw
(see Figure 4.8) as well as total energy recovered were calculated (see Figure 4.9), which is
based on lower heating values (Appendix VIII).

32
Figure 4.8. Calculations based on yield of ethanol, methane and solids, from 100 grams of
ingoing dry raw wheat straw. Solids are assumed to be mostly comprised of lignin.
Figure 4.8 shows that the PSSF 30% WIS concept showed the highest yield of products, in
terms of overall mass, with 15.4 g of ethanol, 1.9 g of methane and 35.1 g of solids per 100 g
of wheat straw. According to these results, the PSSF 30% WIS would be the most efficient
concept in terms of recovered total mass, followed by PSSF 25%. This is due to the higher
amount of solids recovered. However the SSF 30% WIS concept yielded more mass of ethanol
and methane than PSSF 25% WIS. Comparison between energy recoveries for the various
process concepts are presented in Figure 4.9. It should also be noted that in SSF, for every mole
of ethanol produced one mole of carbon dioxide is also produced. Carbon dioxide is also formed
during anaerobic digestion. Thus a total recovery of 100 g of products (ethanol, methane and
solids) from 100 grams of wheat straw is not possible.
Figure 4.9. Energy recovered in products compared to the energy in dry raw wheat straw,
based on lower heating values, presented in Appendix VIII.
0
10
20
30
40
50
60
SSF 25%WIS PSSF 25%WIS SSF 30%WIS PSSF 30%WIS
Yie
ld g
/10
0g w
hea
t st
raw
Ethanol Methane Solids
0%
10%
20%
30%
40%
50%
60%
70%
80%
SSF 25%WIS PSSF 25%WIS SSF 30%WIS PSSF 30%WIS
Ener
gy r
eco
ver
ed
Ethanol Methane Solids

33
Figure 4.9 shows that highest energy recovery (about 74%) was achieved in the PSSF 30% WIS
concept, followed by the PSSF 25% WIS (about 70%) and SSF 25% WIS concept (about 69%).
These results are rough estimations, there are some error margins, especially for SSF 25% WIS.
Moreover, the biogas from stillage experiments are not included. The energy recovered in
methane is from the pretreatment hydrolysates alone.
It can be concluded from Table 4.7, that there is a lot of potential for methane production by
using the stillages as substrate, especially for SSF 25% WIS. In other words, these presented
results are underestimated.
As can be seen in Figure 4.9, in terms of energy recovered in ethanol, all of the process concepts
are quite even, about 24% for all concepts except for the PSSF 25%WIS. The greatest difference
is in the energy recovered in solids, which is 6% higher for PSSF 30%WIS compared to SSF
25 and 30%WIS. These results are most likely due to a higher amount of cell growth in the
PSSF batches, thus there was a greater amount of solids recovered.
It is interesting to compare these results to similar experiments on combined bioethanol and
biogas production reported in literature. An energy recovery of 86% was achieved by using
corn stover as substrate and sulfuric acid as a catalyst in the pretreatment [70]. Other
experiments, also using corn stover as substrate, energy recoveries of 88% and 76% were
obtained using acetic acid and phosphoric, respectively [71], [72]. By comparing the 69-74%
of recovered energy for the experiments in this project with the values from the articles, they
might seem to be inferior. However in the articles, about 20 – 30% of the energy was recovered
in the methane. Since the methane yield is underestimated for the experiments done in this
project, these process concepts might in fact prove to be quite potent.
5. Conclusions Wheat straw was steam pretreated at 190°C for 10 minutes using 1% (w/w) lactic acid as a
catalyst. The pretreatment recovered about 97% of glucose, about 90-91% was in the solid
fraction and 66% of xylose, about 48 -54% was in the liquid fraction. Since the goal was to
recover most of the glucose in the solid fraction and xylose in liquid fraction, it can be
concluded that steam pretreatment under these conditions, using lactic acid as catalyst can be a
suitable candidate for pretreatment of wheat straw.
There were no significant differences between the process concepts SSF and PSSF. Fed-
batching the substrate proved to be a good strategy in order to increase WIS content without
causing stirring problems. It was possible to obtain ethanol concentrations as high as 102 g/l,
with an ethanol yield of about 88%. The maximum ethanol concentrations were obtained
somewhere between 120 - 144 hours of SSF. Thus the experiments could have been stopped at
this point. However due to enzymatic hydrolysis still occurring, glucose was accumulated in
the fermenter vessels. These two facts indicated that somewhere between 120 – 144 hours, the
yeast was no longer able to produce any ethanol. A possible explanation for this can be the long
residence time for the yeast in unfavorable conditions, leading to a significant decrease in cell
viability. Furthermore, the fact that there was an increase in glucose concentration at the end of
the SSF indicated that the enzymatic hydrolysis at 35°C was rather slow.
An increase in WIS also resulted in larger remains of glucose after SSF. SSF at 30% WIS had
a concentration of 30 g/l of glucose after 192 hours, while the PSSF at 30% had about 15 g/l at

34
the end. The 25% WIS experiments showed this trend as well, but to a lower extent, while the
20% WIS experiments had concentrations of glucose close to zero. At some point in all the
SSF experiments, the concentration of xylitol increased at the cost of a decrease of xylose. It
may be possible that the yeast may have done this conversion, or that the HPLC has detected
some other compound and interpreted it as xylitol.
The hydrolysates from the pretreatments yielded about 163 - 168 ml/g VS of methane after 122
hours. This corresponds to approximately 2 g of methane/100 g of wheat straw. Biogas
production from the thin stillages failed, but according to stoichiometric calculations they
would yield about 1 – 3 g per 100 g of wheat straw. Overall, the biogas experiments were
insufficiently investigated, due to malfunctioning equipment and lack of time.
For the overall mass recovery, the highest amount of products; 15.4 g ethanol, 1.9 g methane
and 35.1 g of solids from 100 g of dry raw wheat straw was achieved in the PSSF at 30% WIS
configuration. The highest energy recovery was also obtained in PSSF at 30% WIS, where
about 74% of the ingoing chemical energy in wheat straw was recovered in the products.

35
6. Future work For future work concerning this project, there are various parameters interesting for further
investigation. There are numerous alternatives suitable for the pretreatment. It would be
interesting to find the optimal conditions which lead to highest ethanol and methane yield in
the SSF and the AD respectively.
Concerning the SSF, it could be investigated if additional yeast, added later in the SSF could
utilize the accumulated glucose. Another approach could be to add half of the yeast at the start
of the SFF and the other half when the ethanol concentration is constant, preferable at 120
hours. Different ways of fed-batching could also be investigated. For example the fermenters
could be fed with lower amounts of substrate at the time but more often.
Since the enzymatic hydrolysis proved to be slow, the effect of higher enzyme concentration
could be investigated. Alternatively, different ways of adding the enzymes, for example adding
a small amount of enzymes at the same time as adding new substrate could be studied. Methods
to reduce the concentration of inhibitors could be applied, such as washing the substrate before
SSF. Experiments with higher WIS content than 30% could be conducted as well, in order to
find the absolute limit where inhibitor concentrations are too high as well as when liquefaction
of the substrate is too poor.
Concerning the AD, first of all, the experiments using thin stillages as substrate should be
repeated. In addition residence time could be increased to about 2 – 3 weeks in order to make
sure no further biogas is produced. It could also be investigated whether mixing the hydrolysate
and the stillage would affect the yield compared to running the AD on the stillage and the
hydrolysate separately. It could also be interesting to investigate the influence of quality and
quantity of sludge in the biogas production.

36
7. Reference list
[1] R. K. Pachauri, L. Meyer, J.-P. Van Ypersele, S. Brinkman, L. Van Kesteren, N.
Leprince-Ringuet, and F. Van Boxmeer, Climate Change 2014 Synthesis Report The
Core Writing Team Core Writing Team Technical Support Unit for the Synthesis
Report. 2014.
[2] European Commission, “An energy policy for Europe,” Com, pp. 1–28, 2007.
[3] RFA, “Ethanol Facts. ,” Renewable Fuels Association, 2008. [Online]. Available:
http://ethanolrfa.org/pages/ethanol-facts-trade. visited 2015-05-04
[4] M. Balat, H. Balat, and C. Öz, “Progress in bioethanol processing,” Prog. Energy
Combust. Sci., vol. 34, no. 5, pp. 551–573, 2008.
[5] Swedish Energy Agency, “Produktion och användning av biogas år 2012,” 2013.
[6] UN, “Wheat Statistics,” Food and Agriculture organization of the United Nations,
2013. [Online]. Available: http://www.fao.org/home/en/. visited 2015-06-04
[7] Ó. J. Sánchez and C. a. Cardona, “Trends in biotechnological production of fuel
ethanol from different feedstocks,” Bioresour. Technol., vol. 99, no. 13, pp. 5270–
5295, 2008.
[8] J. Pérez, J. Muñoz-Dorado, T. De La Rubia, and J. Martínez, “Biodegradation and
biological treatments of cellulose, hemicellulose and lignin: An overview,” Int.
Microbiol., vol. 5, no. 2, pp. 53–63, 2002.
[9] Y. H. P. Zhang and L. R. Lynd, “Toward an aggregated understanding of enzymatic
hydrolysis of cellulose: Noncomplexed cellulase systems,” Biotechnol. Bioeng., vol.
88, no. 7, pp. 797–824, 2004.
[10] P. Béguin and J. P. Aubert, “The biological degradation of cellulose.,” FEMS
Microbiol. Rev., vol. 13, no. 1, pp. 25–58, Jan. 1994.
[11] E. Jaspard, “Structure of glucose,” 2012. [Online]. Available: http://biochimej.univ-
angers.fr/Page2/COURS/3CoursdeBiochSTRUCT/2GLUCIDES/2FIGURES/6Glycoge
ne/9Cellulose.png. visited 2015-04-04
[12] W. G. Fengel D, Wood: chemistry, ultrastructure, reactions. Berlin: Walter de Gruyter.
1989.
[13] C. E. Wyman, S. R. Decker, M. E. Himmel, J. W. Brady, and C. E. Skopec,
“Polysaccharides,” Polysaccharides Struct. Divers. Funct. Versatility, Second Ed. Ed.
by Sev. Dumitriu CRC Press 2004, 2004.
[14] F. M. Gírio, C. Fonseca, F. Carvalheiro, L. C. Duarte, S. Marques, and R. Bogel-
Łukasik, “Hemicelluloses for fuel ethanol: A review,” Bioresour. Technol., vol. 101,
no. 13, pp. 4775–4800, 2010.

37
[15] J. Ralph, K. Lundquist, P. G. Brunow, F. Lu, H. Kim, P. Schatz, J. Marita, R. Hatfield,
S. Ralph, J. Christensen, and W. Boerjan, “Lignins: Natural polymer from oxidative
coupling of 4-hydroxyphenylpropanoids,” Phytochem. Rev., vol. 3, pp. 29–60, 2004.
[16] A. Koopmans and J. Koppejan, “Agricultural and forest residues - Generation,
utilization and availability,” Reg. Consult. Mod. Appl. Biomass Energy, no. January
1997, pp. 6–10, 1997.
[17] W. E. Mabee and J. N. Saddler, “Bioethanol from lignocellulosics: Status and
perspectives in Canada,” Bioresour. Technol., vol. 101, no. 13, pp. 4806–4813, 2010.
[18] J. L. Bowyer and V. E. Stockmann, “Agricultural residues: An exciting bio-based raw
material for the global panels industry,” For. Prod. J., vol. 51, no. 1, pp. 10–21, 2001.
[19] M. Galbe and G. Zacchi, “Pretreatment: The key to efficient utilization of
lignocellulosic materials,” Biomass and Bioenergy, vol. 46, pp. 70–78, 2012.
[20] K. Wang and R. C. Sun, “Biorefinery straw for bioethanol,” in Cereal Straw as a
Resource for Sustainable Biomaterials and Biofuels, 2010, pp. 267–287.
[21] M. J. Taherzadeh and K. Karimi, “Enzyme-based hydrolysis processes for ethanol from
lignocellulosic materials: A review,” BioResources, vol. 2, no. 4. pp. 707–738, 2007.
[22] C. E. Wyman, “Ethanol from lignocellulosic biomass: Technology, economics, and
opportunities,” Bioresour. Technol., vol. 50, no. 1, pp. 3–15, 1994.
[23] Q. a. Nguyen, M. P. Tucker, F. a. Keller, D. a. Beaty, K. M. Connors, and F. P. Eddy,
“Dilute Acid Hydrolysis of Softwoods(Scientific Note),” Appl. Biochem. Biotechnol.,
vol. 77, no. 1–3, pp. 133–142, 1999.
[24] Chemicals Technology, “Kalundborg Bioethanol Demonstration Plant,” Chemicals,
2014. [Online]. Available: http://www.chemicals-
technology.com/projects/kalundborg_bioethano. visited 2015-06-04
[25] Kris Bevill and K. Bevill, “World’s largest cellulosic ethanol plant breaks ground in
Italy,” Ethanol Producer Magazine, 2011. [Online]. Available:
http://www.ethanolproducer.com/articles/7659/worldundefineds-largest-cellulosic-
ethanol-plant-breaks-ground-in-italy. visited 2015-06-04
[26] POET-DSM, “First commercial-scale cellulosic ethanol plant in the U.S. opens for
business,” POET-DSM Advanced Biofuels, 2014. [Online]. Available:
http://poetdsm.com/pr/first-commercial-scale-cellulosic-plant. visted 2015-06-04
[27] European Biofuels, “Cellulosic Ethanol,” European Biofuels, 2014. [Online].
Available: http://www.biofuelstp.eu/cell_ethanol.html#salamanca. visited 2015-06-05
[28] IOGEN CORPORATION, “Costa Pinto Project,” IOGEN CORPORATION, 2014.
[Online]. Available: http://www.iogen.ca/raizen-project/. visited 2015-06-05
38
[29] J. Lane, “GranBio Starts cellulosic ethanol production at 21 million gallon plant in
Alagoas, Brazil,” BiofuelsDigest, 2014. 2015-06-05
[30] L. R. Lynd, P. J. Weimer, W. H. Van Zyl, and S. Isak, “Microbial Cellulose
Utilization : Fundamentals and Biotechnology Microbial Cellulose Utilization :
Fundamentals and Biotechnology Downloaded from http://mmbr.asm.org/ on February
6 , 2013 by INDIAN INSTITUTE OF TECHNOLOGY MADRAS,” vol. 66, no. 3, pp.
506–577, 2002.
[31] R. P. De Vries and J. Visser, “Aspergillus Enzymes Involved in Degradation of Plant
Cell Wall Polysaccharides Aspergillus Enzymes Involved in Degradation of Plant Cell
Wall Polysaccharides,” Microbiol. Mol. Biol. Rev., vol. 65, no. 4, pp. 497–522, 2001.
[32] G. Davies and B. Henrissat, “Structures and mechanisms of glycosyl hydrolases.,”
Structure, vol. 3, no. 9, pp. 853–859, 1995.
[33] J. W. Agger, T. Isaksen, A. Várnai, S. Vidal-Melgosa, W. G. T. Willats, R. Ludwig, S.
J. Horn, V. G. H. Eijsink, and B. Westereng, “Discovery of LPMO activity on
hemicelluloses shows the importance of oxidative processes in plant cell wall
degradation.,” Proc. Natl. Acad. Sci. U. S. A., vol. 111, no. 17, pp. 6287–92, 2014.
[34] P. Sassner, M. Galbe, and G. Zacchi, “Techno-economic evaluation of bioethanol
production from three different lignocellulosic materials,” Biomass and Bioenergy, vol.
32, no. 5, pp. 422–430, 2008.
[35] N. Mosier, C. Wyman, B. Dale, R. Elander, Y. Y. Lee, M. Holtzapple, and M. Ladisch,
“Features of promising technologies for pretreatment of lignocellulosic biomass,”
Bioresour. Technol., vol. 96, no. 6, pp. 673–686, 2005.
[36] M. Galbe, P. Sassner, A. Wingren, and G. Zacchi, “Process engineering economics of
bioethanol production,” Adv. Biochem. Eng. Biotechnol., vol. 108, no. June, pp. 303–
327, 2007.
[37] W. R. Grous, A. O. Converse, and H. E. Grethlein, “Effect of steam explosion
pretreatment on pore size and enzymatic hydrolysis of poplar,” Enzyme Microb.
Technol., vol. 8, no. 5, pp. 274–280, 1986.
[38] S. J. B. Duff and W. D. Murray, “Bioconversion of forest products industry waste
cellulosics to fuel ethanol: A review,” Bioresour. Technol., vol. 55, no. 1, pp. 1–33,
1996.
[39] Z. Liu and B. Fei, “Characteristics of Moso Bamboo with Chemical Pretreatment,”
Intech, 2013. .
[40] P. J. Morjanoff and P. P. Gray, “Optimization of steam explosion as a method for
increasing susceptibility of sugarcane bagasse to enzymatic saccharification.,”
Biotechnol. Bioeng., vol. 29, no. 6, pp. 733–741, 1987.

39
[41] M. T. Holtzapple, a E. Humphrey, and J. D. Taylor, “Energy requirements for the size
reduction of poplar and aspen wood.,” Biotechnol. Bioeng., vol. 33, no. 2, pp. 207–210,
1989.
[42] K. L. Mackie, H. H. Brownell, K. L. West, and J. N. Saddler, “Effect of Sulphur
Dioxide and Sulphuric Acid on Steam Explosion of Aspenwood,” J. Wood Chem.
Technol., vol. 5, no. 3, pp. 405–425, 1985.
[43] P. J. Oefner, a. H. Lanziner, G. Bonn, and O. Bobleter, “Quantitative studies on
furfural and organic acid formation during hydrothermal, acidic and alkaline
degradation of D-xylose,” Monatshefte f??r Chemie Chem. Mon., vol. 123, no. 6–7, pp.
547–556, 1992.
[44] C. Tengborg, M. Galbe, and G. Zacchi, “Reduced inhibition of enzymatic hydrolysis of
steam-pretreated softwood,” Enzyme Microb. Technol., vol. 28, no. 9–10, pp. 835–844,
2001.
[45] S. Larsson, E. Palmqvist, B. Hahn-Hägerdal, C. Tengborg, K. Stenberg, G. Zacchi, and
N. O. Nilvebrant, “The generation of fermentation inhibitors during dilute acid
hydrolysis of softwood,” Enzyme Microb. Technol., vol. 24, no. 3–4, pp. 151–159,
1999.
[46] J. M. Oliva, F. Sáez, I. Ballesteros, A. González, M. J. Negro, P. Manzanares, and M.
Ballesteros, “Effect of lignocellulosic degradation compounds from steam explosion
pretreatment on ethanol fermentation by thermotolerant yeast Kluyveromyces
marxianus.,” Appl. Biochem. Biotechnol., vol. 105–108, pp. 141–153, 2003.
[47] H. B. Klinke, L. Olsson, a B. Thomsen, and B. K. Ahring, “Potential inhibitors from
wet oxidation of wheat straw and their effect on ethanol production of Saccharomyces
cerevisiae: wet oxidation and fermentation by yeast.,” Biotechnol. Bioeng., vol. 81, no.
6, pp. 738–747, 2003.
[48] E. Palmqvist and B. Hahn-Hägerdal, “Fermentation of lignocellulosic hydrolysates. II:
Inhibitors and mechanisms of inhibition,” Bioresour. Technol., vol. 74, no. 1, pp. 25–
33, 2000.
[49] “Ethanol Red TM Dry alcohol yeast,” vol. 33, no. 0, p. 10.
[50] S. Suzuki and M. Takagi, “United States Patent [ 191,” pp. 3–5, 1976.
[51] J. Söderström, M. Galbe, and G. Zacchi, “Separate versus Simultaneous
Saccharification and Fermentation of Two-Step Steam Pretreated Softwood for Ethanol
Production,” J. Wood Chem. Technol., vol. 25, no. 3, pp. 187–202, 2005.
[52] H. R. Sørensen, S. Pedersen, C. T. Jørgensen, and A. S. Meyer, “Enzymatic hydrolysis
of wheat arabinoxylan by a recombinant ‘minimal’ enzyme cocktail containing β-
xylosidase and novel endo-1,4-β-xylanase and α-L-arabinofuranosidase activities,”
Biotechnol. Prog., vol. 23, no. 1, pp. 100–107, 2007.

40
[53] M. Galbe, O. Wallberg, and G. Zacchi, 6 . 47 Techno-Economic Aspects of Ethanol
Production from Lignocellulosic Agricultural Crops and Residues, vol. 1. 2011.
[54] A. Schnürer and Å. Jarvis, “Mikrobilogisk handbok för biogasanläggningar,” no.
Rapport U2009 : 03, 2009.
[55] a D. Benefits and L. Hopwood, “NNFCC Renewable Fuels and,” Portal, vol. 44, no. 0,
1904.
[56] I. Cornell Univ. NY., “Microbiology of anaerobic conversion of organic wastes to
methane: recent developments,” Am. Soc. Microbiol. News, vol. 50:7, 1984.
[57] B. Schink, “Energetics of syntrophic cooperation in methanogenic degradation.,”
Microbiol. Mol. Biol. Rev., vol. 61, no. 2, pp. 262–280, 1997.
[58] N. H. Samarah, “Effects of drought stress on growth and yield of barley,” Agron.
Sustain. Dev., vol. 25, pp. 145–149, 2005.
[59] G. Fuchs, “Anaerobic metabolism of aromatic compounds,” in Annals of the New York
Academy of Sciences, 2008, vol. 1125, pp. 82–99.
[60] Y. Liu and W. B. Whitman, “Metabolic, phylogenetic, and ecological diversity of the
methanogenic archaea,” in Annals of the New York Academy of Sciences, 2008, vol.
1125, pp. 171–189.
[61] N. M. Mesbah and J. Wiegel, “Life at extreme limits: The anaerobic halophilic
alkalithermophiles,” Ann. N. Y. Acad. Sci., vol. 1125, pp. 44–57, 2008.
[62] U. Nordberg, “Biogas – Nuläge och framtida potential.”, Värmeforskning, 2006.
[63] W. Whitman, T. Bowen, and D. Boone, The methanogenic bacteria. 2006.
[64] I. M. Mathrani, D. R. Boone, R. a Mah, G. E. Fox, and P. P. Lau, “Methanohalophilus
zhilinae sp. nov., an alkaliphilic, halophilic, methylotrophic methanogen.,” Int. J. Syst.
Bacteriol., vol. 38, no. 2, pp. 139–142, 1988.
[65] a Sluiter, B. Hames, R. Ruiz, C. Scarlata, J. Sluiter, and D. Templeton, “Determination
of Sugars , Byproducts , and Degradation Products in Liquid Fraction Process Samples
Laboratory Analytical Procedure ( LAP ) Issue Date : 12 / 08 / 2006 Determination of
Sugars , Byproducts , and Degradation Products in Liquid Fraction Proce,” no. January,
2008.
[66] A. Sluiter, B. Hames, R. Ruiz, and C. Scarlata, “Determination of structural
carbohydrates and lignin in biomass,” Lab. Anal. …, vol. 2011, no. July, 2008.
[67] A. Sluiter, B. Hames, D. Hyman, C. Payne, R. Ruiz, C. Scarlata, J. Sluiter, D.
Templeton, and J. W. Nrel, “Determination of total solids in biomass and total
dissolved solids in liquid process samples,” Natl. Renew. Energy Lab., no. March, pp.
3–5, 2008.

41
[68] M. Linde, “Process Development of Bioethanol Production from Wheat and Barley
Residues,” Lund University, Sweden, 2007.
[69] B. Erdei, “Development of integrated cellulose- and starch-based ethanol production
and process design for improved xylose conversion,” Lund University, Sweden, 2013.
[70] P.-M. Bondesson, M. Galbe, and G. Zacchi, “Ethanol and biogas production after
steam pretreatment of corn stover with or without the addition of sulphuric acid.,”
Biotechnol. Biofuels, vol. 6, no. 1, p. 11, 2013.
[71] P. M. Bondesson, M. Galbe, and G. Zacchi, “Comparison of energy potentials from
combined ethanol and methane production using steam-pretreated corn stover
impregnated with acetic acid,” Biomass and Bioenergy, vol. 67, pp. 413–424, 2014.
[72] P.-M. Bondesson, A. Dupuy, M. Galbe, and G. Zacchi, “Optimizing Ethanol and
Methane Production from Steam-pretreated, Phosphoric Acid-impregnated Corn
Stover,” Appl. Biochem. Biotechnol., vol. 175, no. 3, pp. 1371–1388, 2014.


I
Appendices Appendix I. Composition analysis of solid fractions
Table A 1. Composition analyses for wheat straw.
Wheat straw
1.1
Wheat straw
1.2
Wheat Straw 1.3
Glucan 33.84 ±1.06 38.36 ±1.43 35.37 ±0.07
Xylan 23.74 ±0.74 23.91 ±0.83 24.32 ±0.44
Galactan* - - 3.01 ±0.21
Arabinan* 2.82 ±0.2 3.19 ±0.05 4.56 ±0.15
Mannan* 1.01 ±0.13 3.30
Acid insoluble
Lignin
19.32 ±0.34 20.13 ±0.05 22.19 ±1.82
Acid soluble Lignin 1.43 ±0.42 1.39 ±0.09 0.83 ±0.05
Ash 5.32 ±0.01 3.7 ±0.38 4.74 ±0.27
Total 86.47 ±2.22 90.69 ± 2.63 96.68 ±2.33
*Under standard calibration curve
Table A.2. Composition analysis of solid fraction from the remnant pretreated wheat straw.
Pretreated
wheat straw 1.1
Pretreated
wheat straw
1.2
Pretreated
wheat straw
1.3
Pretreate
d wheat
straw 1.4
Glucan 43.30 ±11.08 60.70 ±1.09 55.57 ±1,86 57.3 ±1.62
Xylan 5.50 ±1.04 6.61 ±0.29 6.68 ±2.07 5.3 ±0.71
Galactan* - 0.43 ± 0.02 - 2.0 ±0.18
Arabinan* 0.39 ±0.02 0.70 ± 0.02 0.99 ±0.21 -
Mannan* 0.53 ±0.3 0.45 ± 0.03 - -
Acid insoluble
Lignin
44.98 ±8.89 28.38±0.73 27.90 ±0.41 25.8 ±0.97
Acid soluble Lignin 0.54 ±0.02 0.87 ± 0.01 0.62 ±0.02 0.01
Ash 6.29 ± 0.5 6.18 ± 0.03 6.95 ±0.39 5.4 ±0.48
Total 101.53 ±21.84
103.89 ± 0.69
100.35 ±1.49
96.4 ±0.76
*Under standard calibration curve

II
Table A.3. Composition analysis of solid fraction from the first pretreatment.
Pretreatment 1.1 Pretreatment
1.2
Pretreatment
2.1
Glucan 60.47 ±0.76 55.3 ±0.55 53.6 ±1.23
Xylan 8.17 ±0.2 5.2 ±0.14 4.6 ±0.21
Galactan* - 3.6 ±0.05 2.1 ±0.18
Arabinan* 0.93 ±0.28 - -
Mannan* 3.51 ±0.16 - -
Acid insoluble
Lignin
27.63 ± 27.0 ±0.18 28.2 ±0.99
Acid soluble Lignin 0.58 ± 0.8 ±0.03 0.8 ±0.06
Ash 5.54 ± 4.9 ±0.02 5.1 ±0.32
Total 106.83 ±0.61 96.7 ±0.36 94.5 ±1.69
*Under standard calibration curve
Appendix II. Composition analysis of liquid fractions
Table A.4. Composition analysis of the liquid fraction of remnant pretreated wheat straw, given
by concentration (g/l).
Pretreated wheat straw 1.1 Pretreated wheat straw 1.2
Glucose 6.30 ±0.04 6.12 ±0.24
Xylose 28.21 ±0.55 27.68±0.68
Galactose - -
Arabinose 3.48 ±0.04 3.21 ±0.14
Mannose 1.29 ±0.02 1.38 ±0.12
Lactic acid 2.16 ±0.05 2.34 ± 0.01
Glycerol -
Formic acid 1.08 ±0.08 1.16 ±0.02
Acetic acid 0.12 ±0.03 4.86 ±0.04
Levulinic acid 0.12 ±0.01 0.41 ±0.01
HMF 0.17 ±0.02 0.10 ±0.01
Furfural 2.59 ±0.02 4.03 ±0.02

III
Appendix III Fed-batching of fermenters
Table A.5. Fed-batching of fermenters for batch 1 and 2 SSF at 20% WIS and PSSF at 20%WIS.
The WIS-content of the substrate was 35.4%
1.SSF at 20% WIS 2.PSSF at 20% WIS
Time(h) Substrate added (g)
2 100 100
3.5 100 100
4 100 100
6.5 94 94
9 - Enzymes added
Table A.6. Fed-batching of fermenters for batch 3 and 4 SSF at 20% WIS and PSSF at 20%WIS.
The WIS-content of the substrate was 44.9%
3.SSF at 20% WIS 4.PSSF at 20% WIS
Time(h) Substrate added (g)
1 100 100
2.5 100 100
4 100 100
7 94 94
9 - Enzymes added
Table A. 7. Fed-batching of fermenters for batch 5 and 6 SSF at 20% WIS and PSSF at 20%WIS.
The WIS-content of the substrate was 41.6%
5.SSF at 20% WIS 6.PSSF at 20% WIS
Time(h) Substrate added (g)
1.5 100 100
4 100 100
5.5 86 86
9 - Enzymes added

IV
Table A. 8. Fed-batching of fermenters for batch 1.2 SSF at 25% WIS and 1.2 PSSF at 25%WIS.
The WIS-content of the substrate was 41.6%
1.PSSF at
25% WIS
2.PSSF at
25% WIS
1.SSF at
25% WIS
2.SSF at
25% WIS
Time(h) Substrate added (g)
1 100 100 100 100
3 100 100 100 100
5 100 100 100 100
9 100 100 100 100
13 50 50 50 50
23 50 50 50 50
26 50 50 50 50
30 51.6 51.6 51.6 51.6
32 Enzymes
added
Enzymes
added
- -
Table A. 9. Fed-batching of fermenters for batch 1.2 SSF at 30% WIS and 1.2 PSSF at 30%WIS.
The WIS-content of the substrate was 43.5%
1.PSSF at
30% WIS
2.PSSF at
30% WIS
1.SSF at
30% WIS
2.SSF at
30% WIS
Time(h) Substrate added (g) Time(h) Substrate added (g)
0.5 50 50 0.25 50 50
1 50 50 0.75 50 50
2 50 50 1 75 75
3 75 75 2 50 50
4 50 50 3 50 50
5 50 50 5 50 50
7 50 50 6.5 50 50
8.5 50 50 8 75 75
10 75 75 12 50 50
14 50 50 16 50 50
18 50 50 22 50 50
24 50 50 26 50 50
35 40,3 40,3 33 40,3 40,3
37 Enzymes
added
Enzymes
added

V
Appendix IV. SSF batches 1 – 4
Figure A.1. Ethanol concentration (g/l) for batch 1 and 2.
Figure A.2. Ethanol concentration (g/l) for batch 3 and 4.
0
10
20
30
40
50
60
0 20 40 60 80 100 120 140 160
Co
nce
ntr
atio
n (
g/L)
Time (h)
SSF 20%WIS PSSF 20%WIS
0
10
20
30
40
50
60
70
0 20 40 60 80 100 120 140 160
Co
nce
ntr
atio
n (
g/L)
Time (h)
SSF 20%WIS PSSF 20%WIS
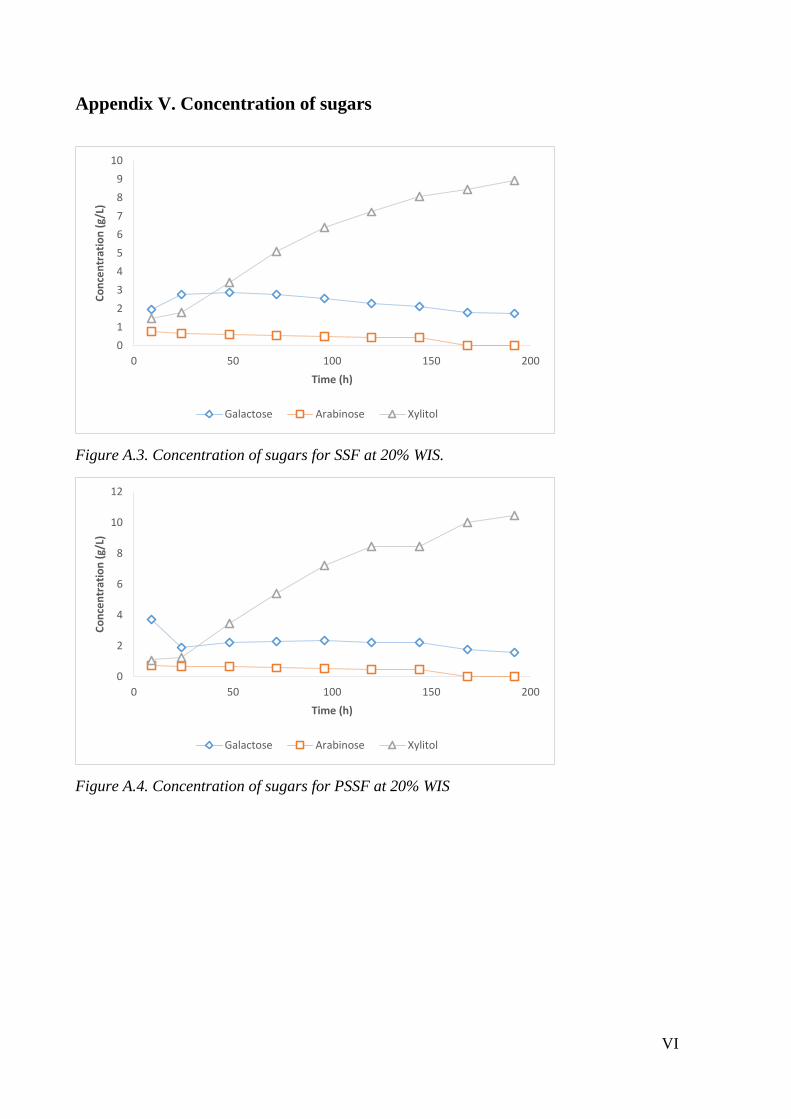
VI
Appendix V. Concentration of sugars
Figure A.3. Concentration of sugars for SSF at 20% WIS.
Figure A.4. Concentration of sugars for PSSF at 20% WIS
0
1
2
3
4
5
6
7
8
9
10
0 50 100 150 200
Co
nce
ntr
atio
n (
g/L)
Time (h)
Galactose Arabinose Xylitol
0
2
4
6
8
10
12
0 50 100 150 200
Co
nce
ntr
atio
n (
g/L)
Time (h)
Galactose Arabinose Xylitol

VII
Figure A.5. Concentration of sugars for SSF at 25% WIS
Figure A.6. Concentration of sugars for PSSF at 25% WIS.
0
1
2
3
4
5
6
7
8
0 50 100 150 200
Co
nce
ntr
atio
n (
g/L)
Time (h)
Galactose Arabinose Xylitol
0
0,5
1
1,5
2
2,5
3
3,5
4
4,5
0 50 100 150 200
Co
nce
ntr
atio
n (
g/L)
Time (h)
Galactose Arabinose Xylitol

VIII
Figure A.7. Concentration of sugars for SSF at 30% WIS
Figure A.8. Concentration of sugars for PSSF at 30% WIS
0
1
2
3
4
5
6
7
8
9
10
0 50 100 150 200
Co
nce
ntr
atio
n (
g/L)
Time (h)
Galactose Arabinose Xylitol
0
1
2
3
4
5
6
7
8
9
10
0 50 100 150 200
Co
nce
ntr
atio
n (
g/L)
Time (h)
Galactose Arabinose Xylitol

IX
Appendix VI. Byproducts
Figure A.9. Concentration of byproducts for SSF 20%WIS.
Figure A.10. Concentration of byproducts for PSSF 20%WIS.
0
0,5
1
1,5
2
2,5
3
3,5
4
4,5
5
0 50 100 150 200
Co
nce
ntr
atio
n (
g/l)
Time (h)
Lactic Acid Glycerol Formic Acid Acetic Acid
0
0,5
1
1,5
2
2,5
3
3,5
4
4,5
5
0 50 100 150 200
Co
nce
ntr
atio
n (
g/l)
Time (h)
Lactic Acid Glycerol Formic Acid Acetic Acid

X
Figure A.11. Concentration of byproducts for SSF 25% WIS
Figure A.12. Concentration of byproducts for PSSF 25%WIS
0
0,5
1
1,5
2
2,5
3
3,5
4
4,5
5
0 50 100 150 200
Co
nce
ntr
atio
n (
g/l)
Time (h)
Lactic Acid Glycerol Formic Acid Acetic Acid
-1
0
1
2
3
4
5
6
0 50 100 150 200
Co
nce
ntr
atio
n (
g/l)
Time (h)
Lactic Acid Glycerol Formic Acid Acetic Acid

XI
Figure A.13. Concentration of byproducts for SSF 30%WIS
Figure A. 14. Concentration of byproducts for PSSF 30%WIS
0
1
2
3
4
5
0 50 100 150 200
Co
nce
ntr
atio
n (
g/l)
Time (h)
Lactic Acid Glycerol Formic Acid Acetic Acid
0
1
2
3
4
5
6
7
0 50 100 150 200
Co
nce
ntr
atio
n (
g/l)
Time (h)
Lactic Acid Glycerol Formic Acid Acetic Acid
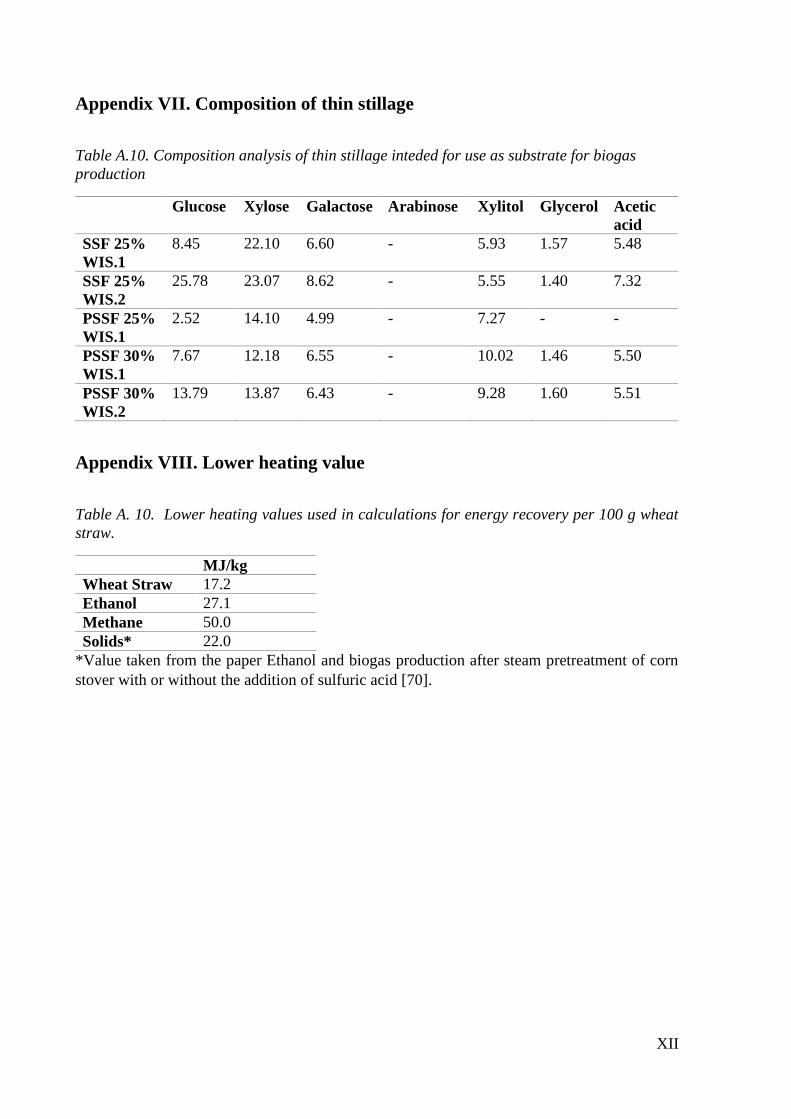
XII
Appendix VII. Composition of thin stillage
Table A.10. Composition analysis of thin stillage inteded for use as substrate for biogas
production
Glucose Xylose Galactose Arabinose Xylitol Glycerol Acetic
acid
SSF 25%
WIS.1
8.45 22.10 6.60 - 5.93 1.57 5.48
SSF 25%
WIS.2
25.78 23.07 8.62 - 5.55 1.40 7.32
PSSF 25%
WIS.1
2.52 14.10 4.99 - 7.27 - -
PSSF 30%
WIS.1
7.67 12.18 6.55 - 10.02 1.46 5.50
PSSF 30%
WIS.2
13.79 13.87 6.43 - 9.28 1.60 5.51
Appendix VIII. Lower heating value
Table A. 10. Lower heating values used in calculations for energy recovery per 100 g wheat
straw.
MJ/kg
Wheat Straw 17.2
Ethanol 27.1
Methane 50.0
Solids* 22.0
*Value taken from the paper Ethanol and biogas production after steam pretreatment of corn
stover with or without the addition of sulfuric acid [70].