Embed Size (px)
Citation preview
1
Combined Sewer System Permit and Long Term
Control Plan Update
CSS Stakeholder Group
Meeting #3
January 10, 2018
City of Alexandria - Department of Transportation and Environmental Services
Alexandria Renew Enterprises
2
PRESENTATION OUTLINE
Welcome
Purpose and Goals
Evaluation Criteria and Survey Results
CSO Program Options
Summary of CSO Performance
Green Infrastructure
Public Comment and Questions
Wrap-Up

3
Purpose and Goals
4
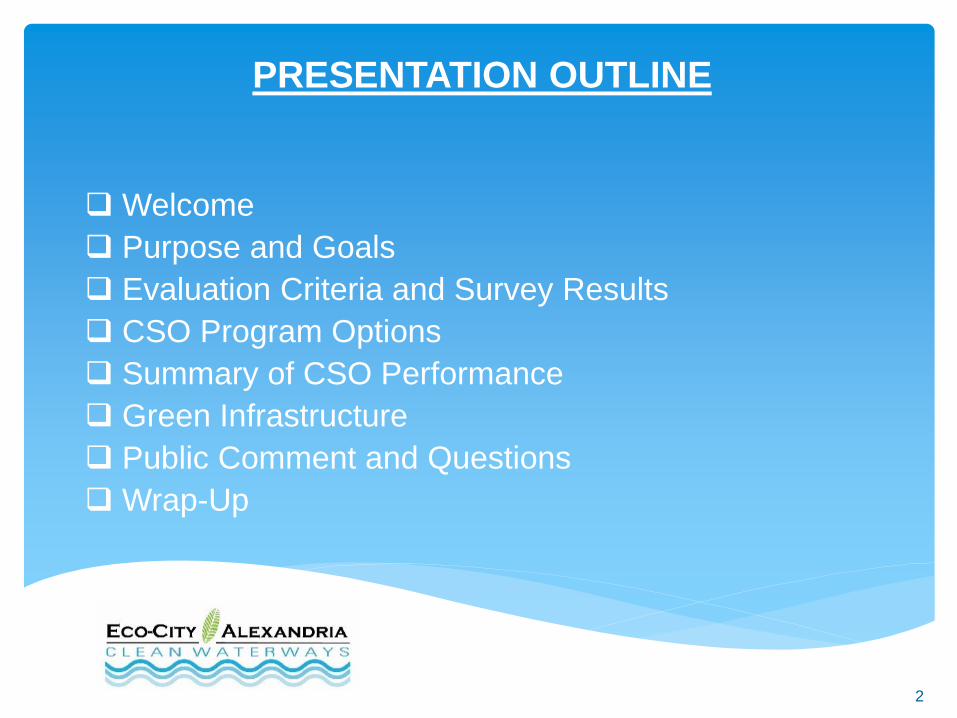
Public Participation Goals
Increase stakeholder
awareness of the City’s
combined sewer
system and the Long Term
Control Plan Update program.
Develop basic
understanding of the
Long Term Control
Plan Update
recommended
strategies.
Awareness,
consideration and
responsiveness on the
Long Term Control Plan.
Solicit feedback on
the combined sewer
control strategy
recommendations.
5
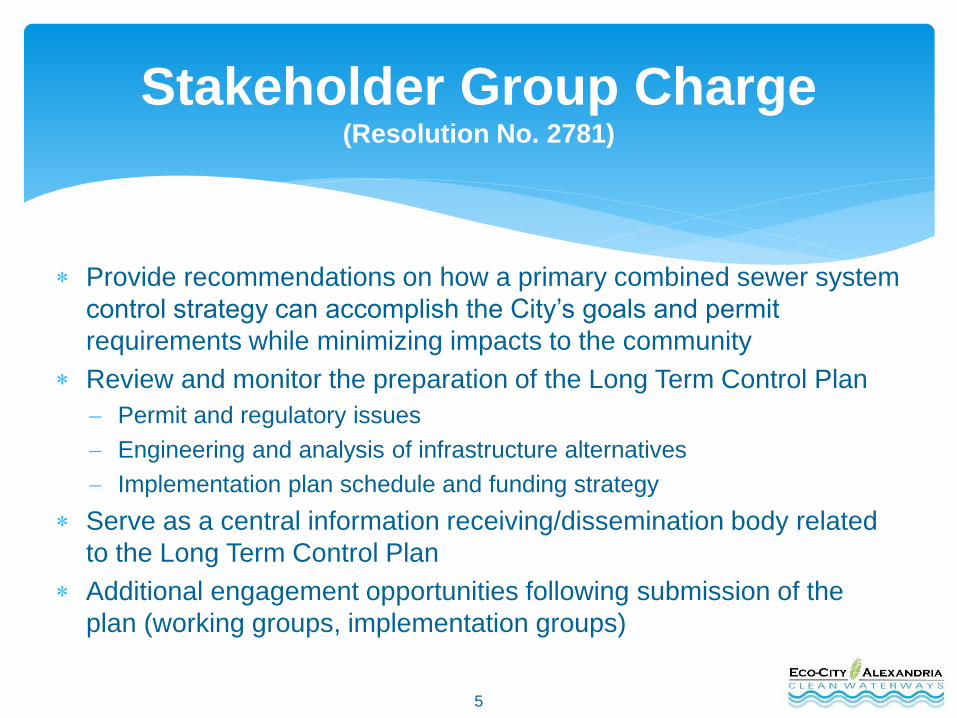
Provide recommendations on how a primary combined sewer system
control strategy can accomplish the City’s goals and permit
requirements while minimizing impacts to the community
Review and monitor the preparation of the Long Term Control Plan
Permit and regulatory issues
Engineering and analysis of infrastructure alternatives
Implementation plan schedule and funding strategy
Serve as a central information receiving/dissemination body related
to the Long Term Control Plan
Additional engagement opportunities following submission of the
plan (working groups, implementation groups)
Stakeholder Group Charge(Resolution No. 2781)
6
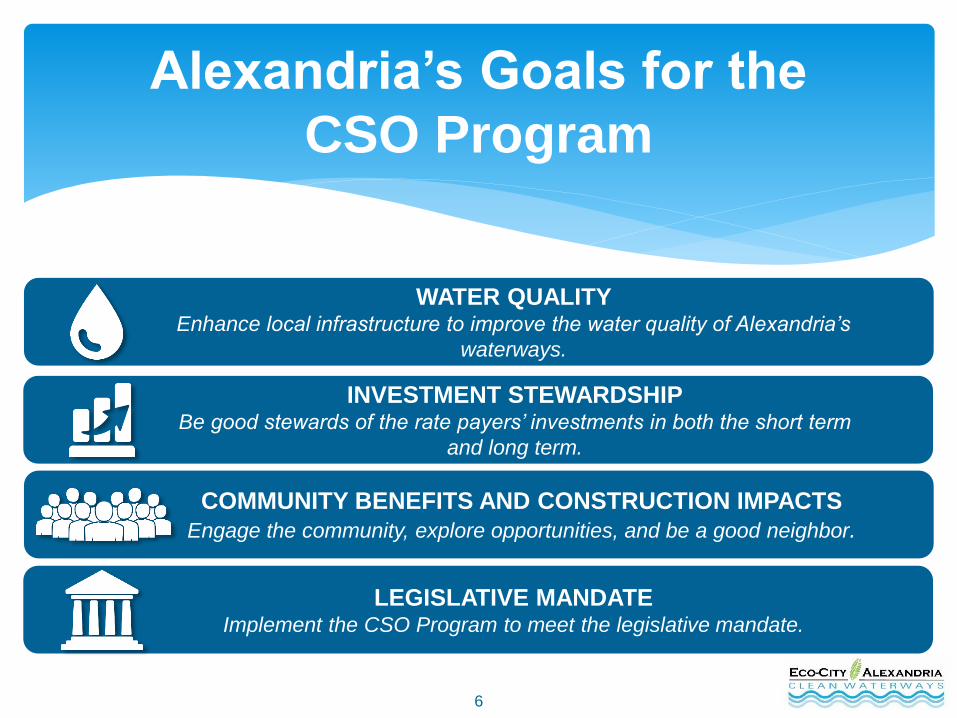
Alexandria’s Goals for the
CSO Program
WATER QUALITY Enhance local infrastructure to improve the water quality of Alexandria’s
waterways.
INVESTMENT STEWARDSHIPBe good stewards of the rate payers’ investments in both the short term
and long term.
COMMUNITY BENEFITS AND CONSTRUCTION IMPACTS
Engage the community, explore opportunities, and be a good neighbor.
LEGISLATIVE MANDATEImplement the CSO Program to meet the legislative mandate.
7
Evaluation Criteria
and Survey Results
8
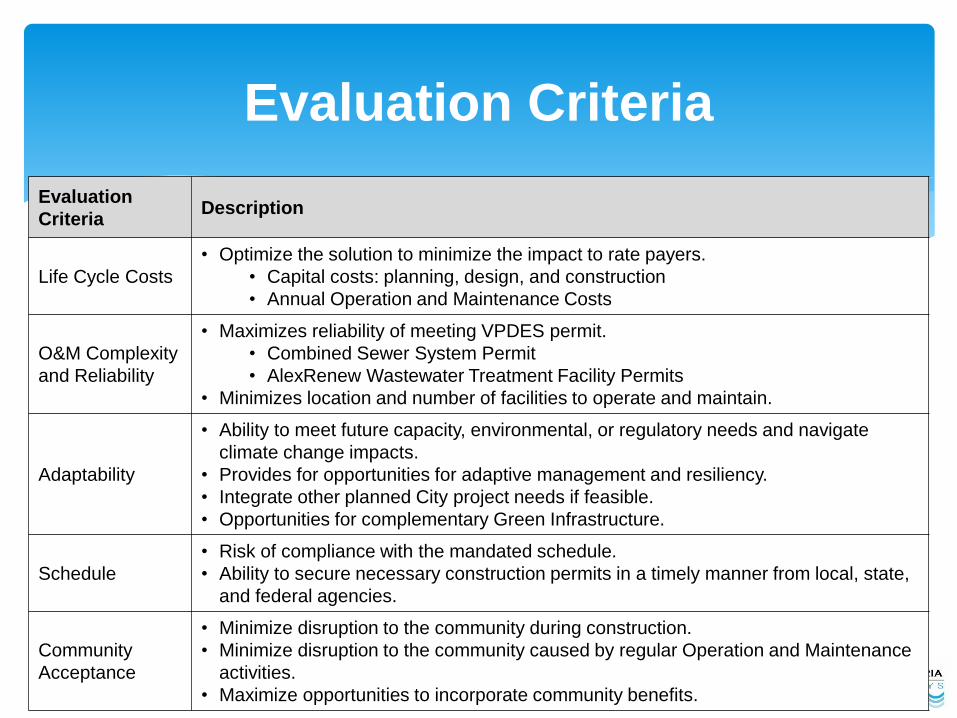
Evaluation
CriteriaDescription
Life Cycle Costs
• Optimize the solution to minimize the impact to rate payers.
• Capital costs: planning, design, and construction
• Annual Operation and Maintenance Costs
O&M Complexity
and Reliability
• Maximizes reliability of meeting VPDES permit.
• Combined Sewer System Permit
• AlexRenew Wastewater Treatment Facility Permits
• Minimizes location and number of facilities to operate and maintain.
Adaptability
• Ability to meet future capacity, environmental, or regulatory needs and navigate
climate change impacts.
• Provides for opportunities for adaptive management and resiliency.
• Integrate other planned City project needs if feasible.
• Opportunities for complementary Green Infrastructure.
Schedule
• Risk of compliance with the mandated schedule.
• Ability to secure necessary construction permits in a timely manner from local, state,
and federal agencies.
Community
Acceptance
• Minimize disruption to the community during construction.
• Minimize disruption to the community caused by regular Operation and Maintenance
activities.
• Maximize opportunities to incorporate community benefits.
Evaluation Criteria
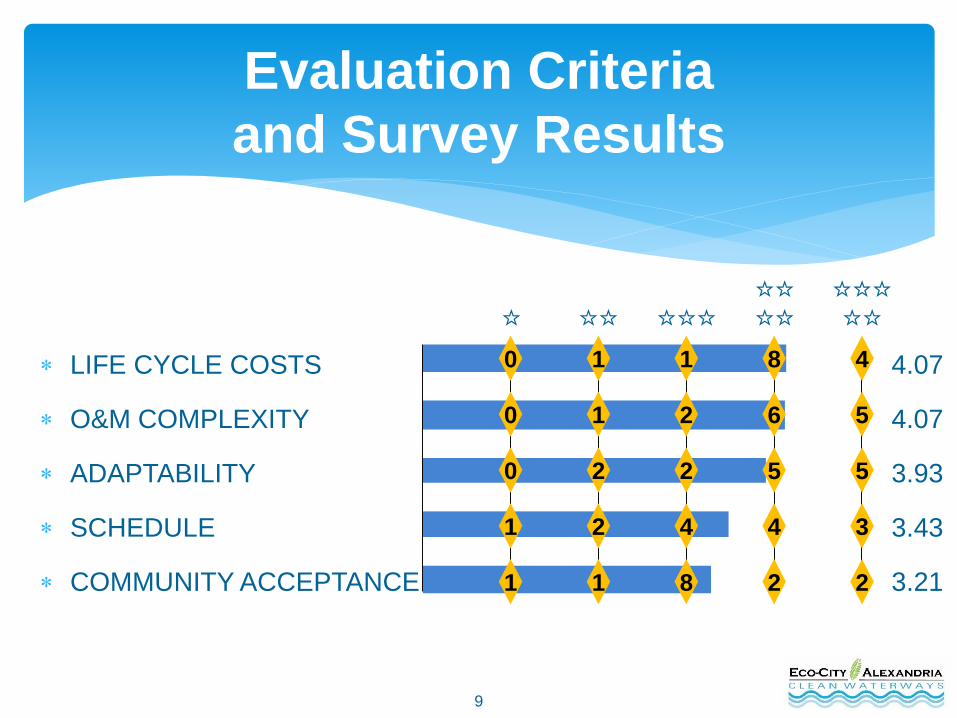
9
LIFE CYCLE COSTS
O&M COMPLEXITY
ADAPTABILITY
SCHEDULE
COMMUNITY ACCEPTANCE
0 1 1 8 4
0 1 2 6 5
0 2 2 5 5
1 2 4 4 3
1 1 8 2 2
4.07
4.07
3.93
3.43
3.21
Evaluation Criteria
and Survey Results
☆ ☆☆ ☆☆☆
☆☆
☆☆
☆☆☆
☆☆
10
Costs must be a consideration and this
project will cost a lot, particularly on an
accelerated basis.
Life Cycle Costs
11
Adaptability is the most critical feature as we
need to build a system that will be durable
and serve our City needs through 2050 and
beyond as climate change will force us to
deal with more extreme precipitation events
and a rising Potomac River.
Adaptability
12
The timetable is too ambitious.
But we should make a good faith effort
to attain it and hope the State will cut us
some slack later.
Schedule
13
CSO Program Options
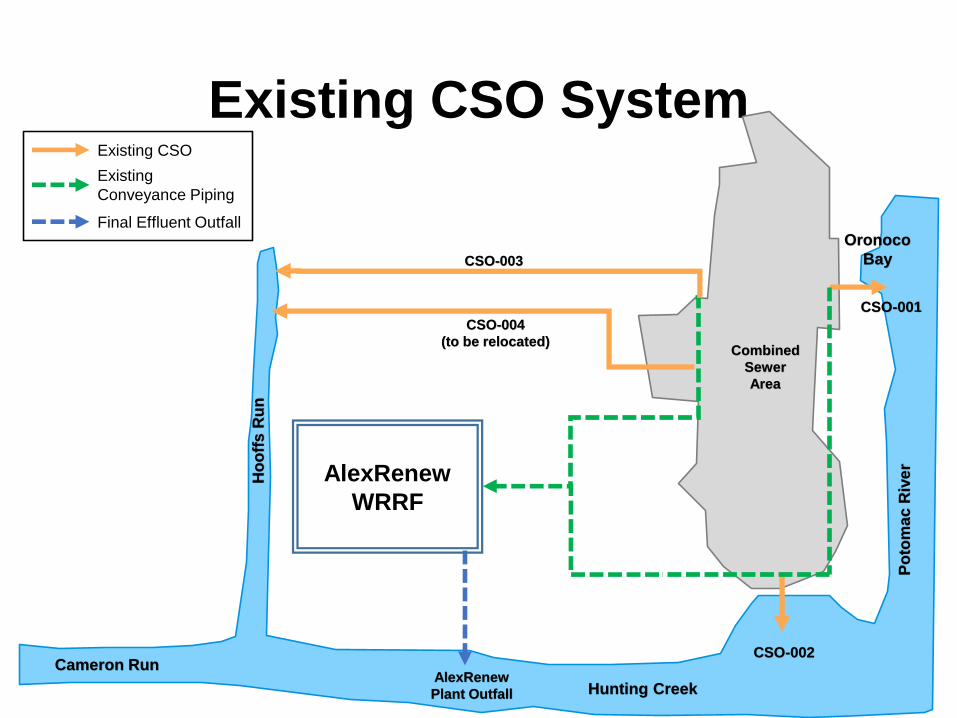
Existing CSO System
CSO-002
Combined
Sewer
Area
CSO-001
AlexRenew
WRRF
Ho
off
s R
un
Hunting Creek
Po
tom
ac
Riv
er
Cameron Run
Oronoco
Bay
AlexRenew
Plant Outfall
CSO-003
CSO-004
(to be relocated)
Final Effluent Outfall
Existing CSO
Existing
Conveyance Piping
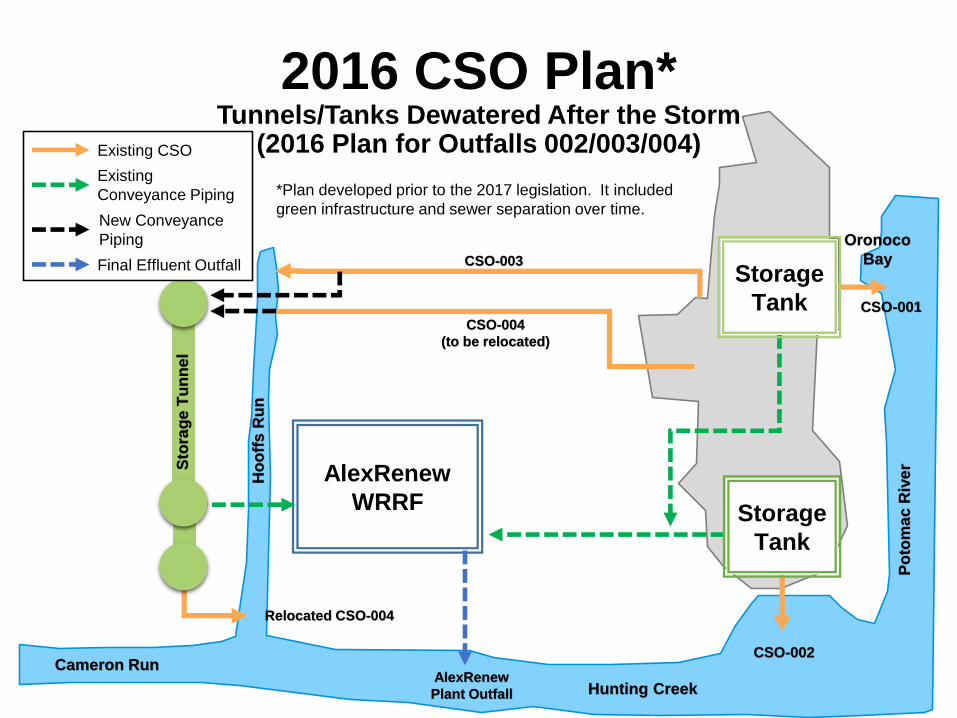
2016 CSO Plan*Tunnels/Tanks Dewatered After the Storm
(2016 Plan for Outfalls 002/003/004)
AlexRenew
WRRF
CSO-002
CSO-001
CSO-003
CSO-004
(to be relocated)
Sto
rag
e T
un
ne
l
Storage
Tank
Storage
Tank
Relocated CSO-004
Ho
off
s R
un
Hunting Creek
Po
tom
ac
Riv
er
Cameron Run
Oronoco
Bay
AlexRenew
Plant Outfall
New Conveyance
Piping
Final Effluent Outfall
Existing CSO
Existing
Conveyance Piping *Plan developed prior to the 2017 legislation. It included
green infrastructure and sewer separation over time.
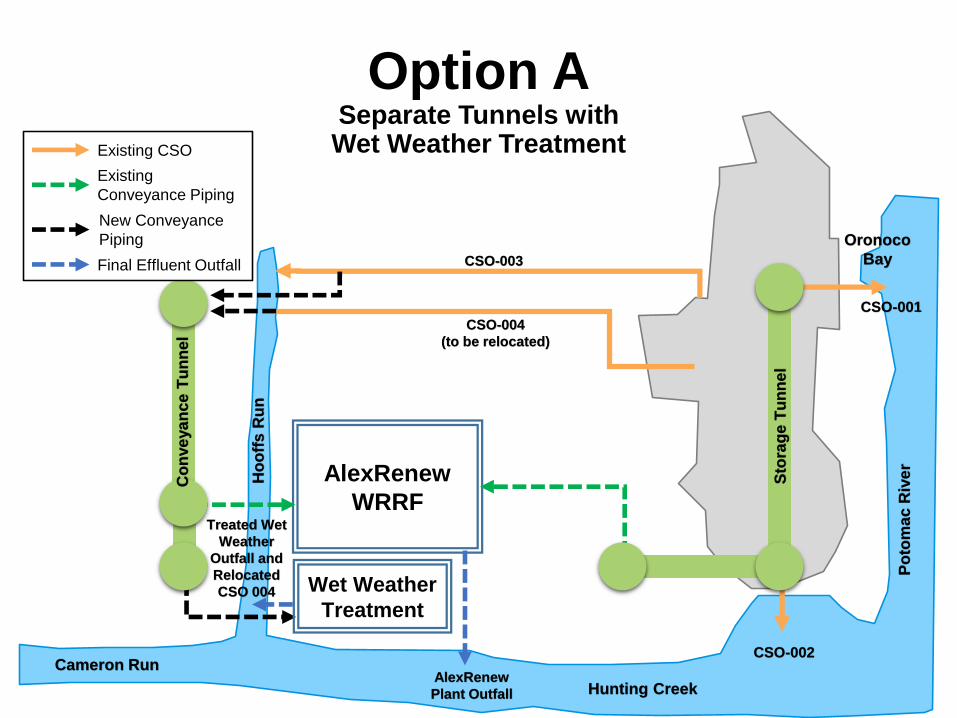
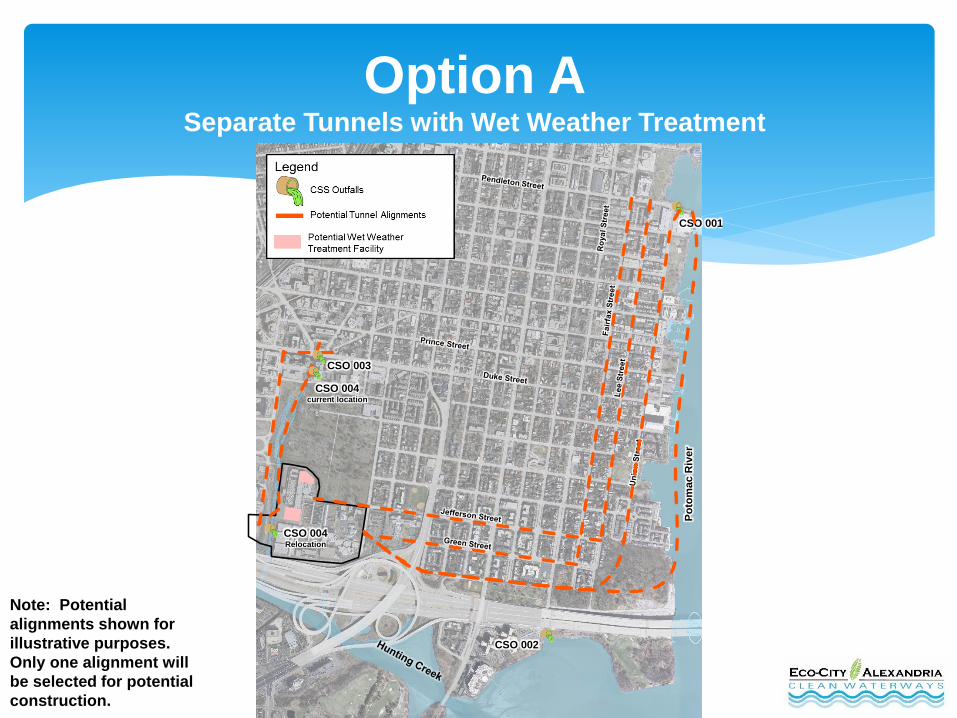
Option ASeparate Tunnels withWet Weather Treatment
AlexRenew
WRRF
CSO-002
Co
nve
ya
nc
e T
un
ne
l
Wet Weather
Treatment
Sto
rag
e T
un
ne
l
Treated Wet
Weather
Outfall and
Relocated
CSO 004
CSO-003
CSO-004
(to be relocated)
CSO-001
Ho
off
s R
un
Hunting Creek
Po
tom
ac
Riv
er
Cameron Run
Oronoco
Bay
AlexRenew
Plant Outfall
New Conveyance
Piping
Final Effluent Outfall
Existing CSO
Existing
Conveyance Piping
17
Option ASeparate Tunnels with Wet Weather Treatment
Note: Potential
alignments shown for
illustrative purposes.
Only one alignment will
be selected for potential
construction.
CSO 001
CSO 002
CSO 004current location
CSO 003
CSO 004Relocation
Po
tom
ac R
iver
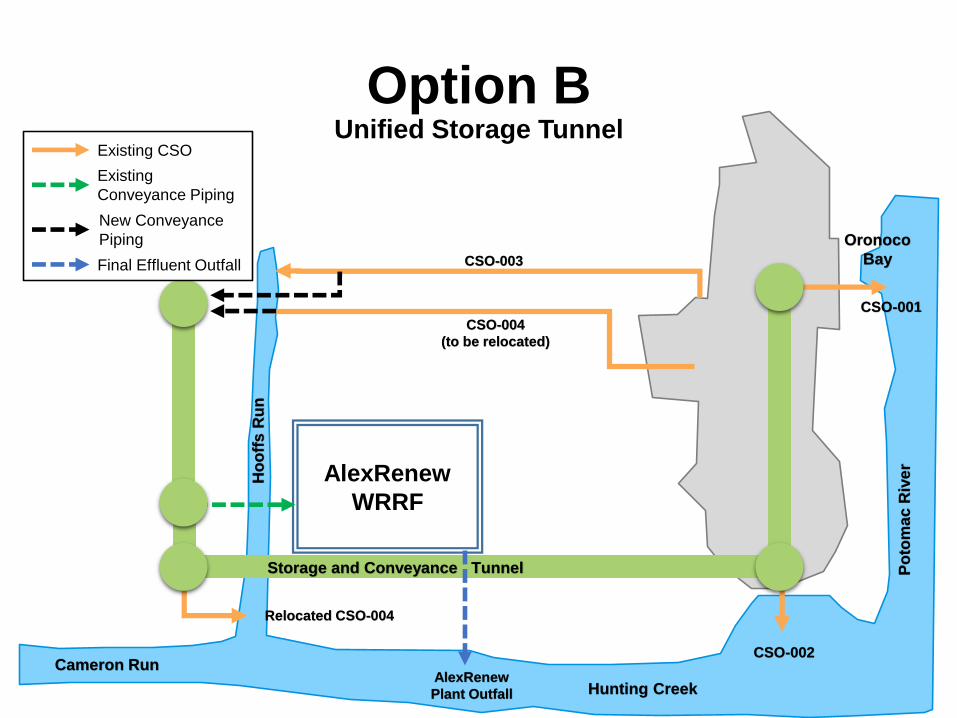
Option BUnified Storage Tunnel
Ho
off
s R
un
Po
tom
ac
Riv
er
Cameron Run
AlexRenew
WRRF
CSO-002
2.2
MG
Sto
rage
Tu
nn
el
Storage and Conveyance Tunnel
Relocated CSO-004
CSO-003
CSO-004
(to be relocated)
AlexRenew
Plant Outfall
CSO-001
Hunting Creek
Oronoco
Bay
New Conveyance
Piping
Final Effluent Outfall
Existing CSO
Existing
Conveyance Piping
19
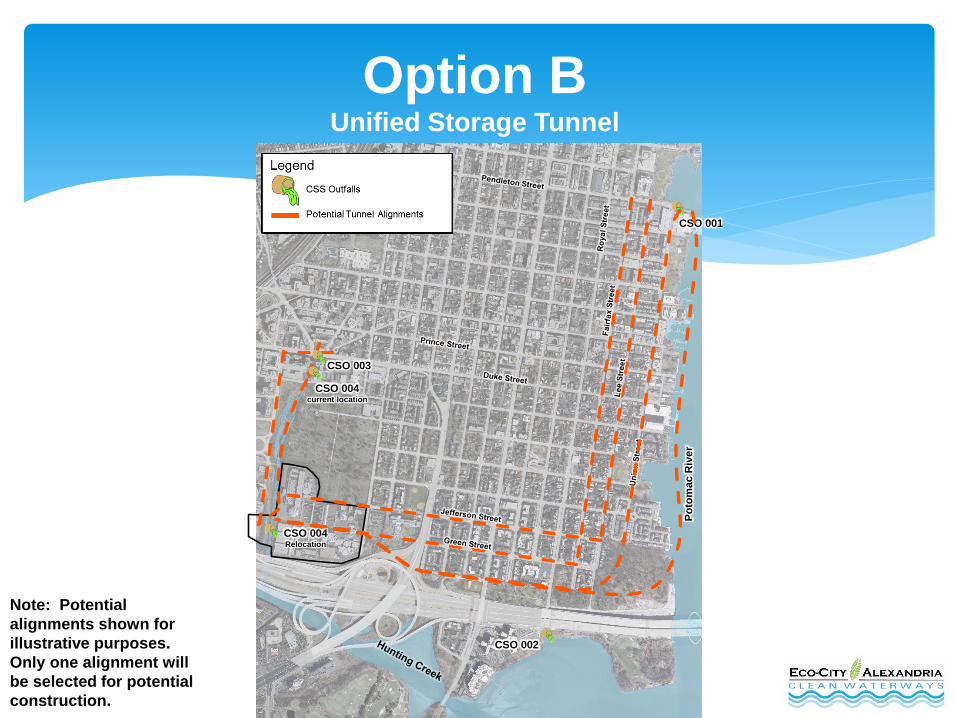
Option BUnified Storage Tunnel
Note: Potential
alignments shown for
illustrative purposes.
Only one alignment will
be selected for potential
construction.
CSO 001
CSO 002
CSO 004current location
CSO 003
CSO 004Relocation
Po
tom
ac R
iver
Ho
off
s R
un
Po
tom
ac
Riv
er
Cameron Run
AlexRenew
WRRF
CSO-002
CSO-001
CSO-003
CSO-004
(to be relocated)
Co
nve
ya
nc
e T
un
ne
l
Storage
Tank
Storage
Tank
AlexRenew
Plant Outfall
Wet Weather
Treatment
Hunting Creek
Oronoco
Bay
New Conveyance
Piping
Final Effluent Outfall
Existing CSO
Existing
Conveyance Piping
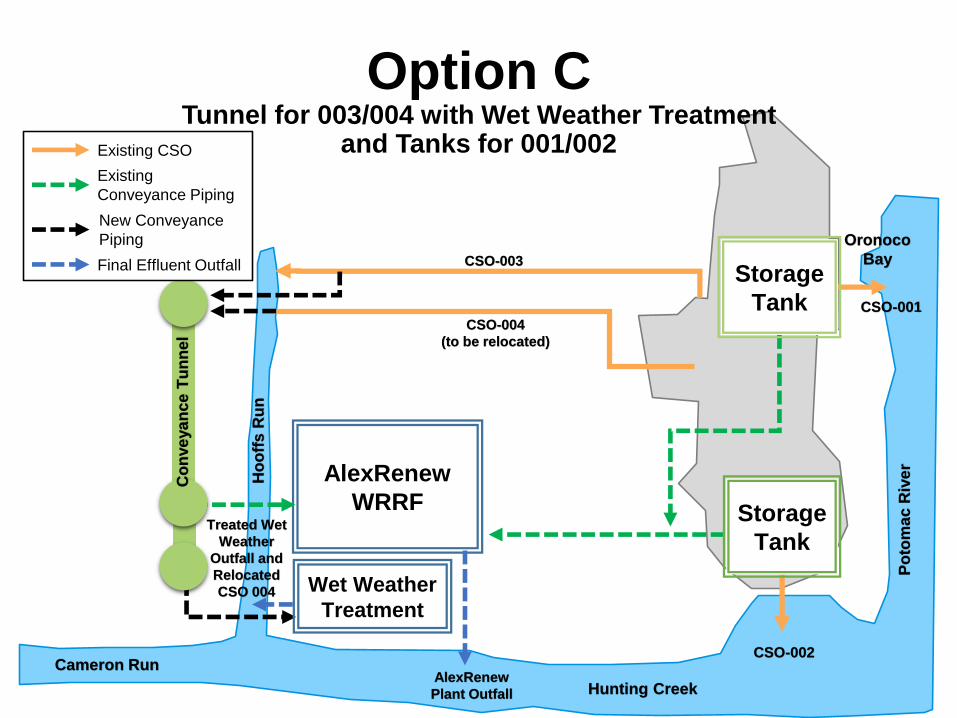
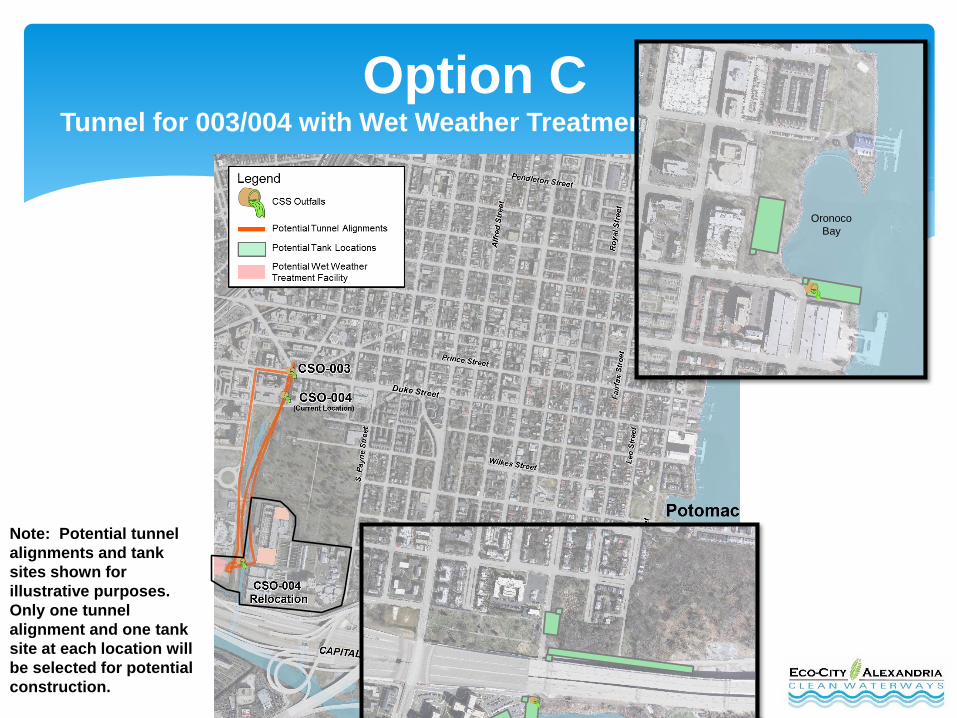
Option CTunnel for 003/004 with Wet Weather Treatment
and Tanks for 001/002
Treated Wet
Weather
Outfall and
Relocated
CSO 004
21
Option CTunnel for 003/004 with Wet Weather Treatment, Tanks for 001/002
Note: Potential tunnel
alignments and tank
sites shown for
illustrative purposes.
Only one tunnel
alignment and one tank
site at each location will
be selected for potential
construction.
Oronoco
Bay
22
Summary of CSO Performance
23
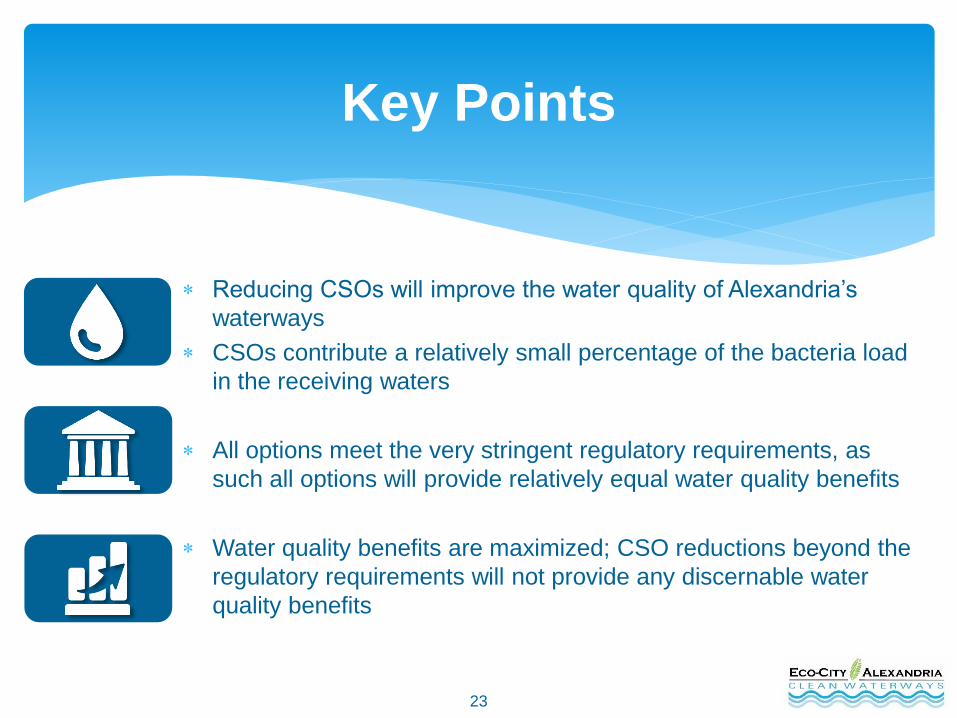
Reducing CSOs will improve the water quality of Alexandria’s
waterways
CSOs contribute a relatively small percentage of the bacteria load
in the receiving waters
All options meet the very stringent regulatory requirements, as
such all options will provide relatively equal water quality benefits
Water quality benefits are maximized; CSO reductions beyond the
regulatory requirements will not provide any discernable water
quality benefits
Key Points
24
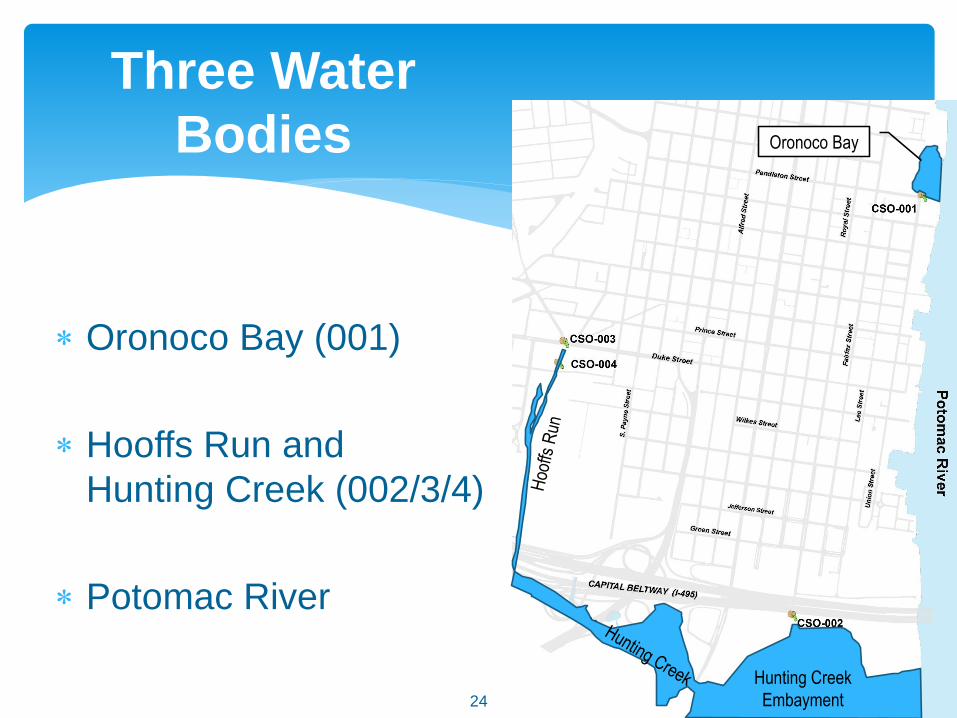
Oronoco Bay (001)
Hooffs Run and
Hunting Creek (002/3/4)
Potomac River
Three Water
Bodies
ADD MAP
Oronoco Bay
Hunting Creek
Embayment
25
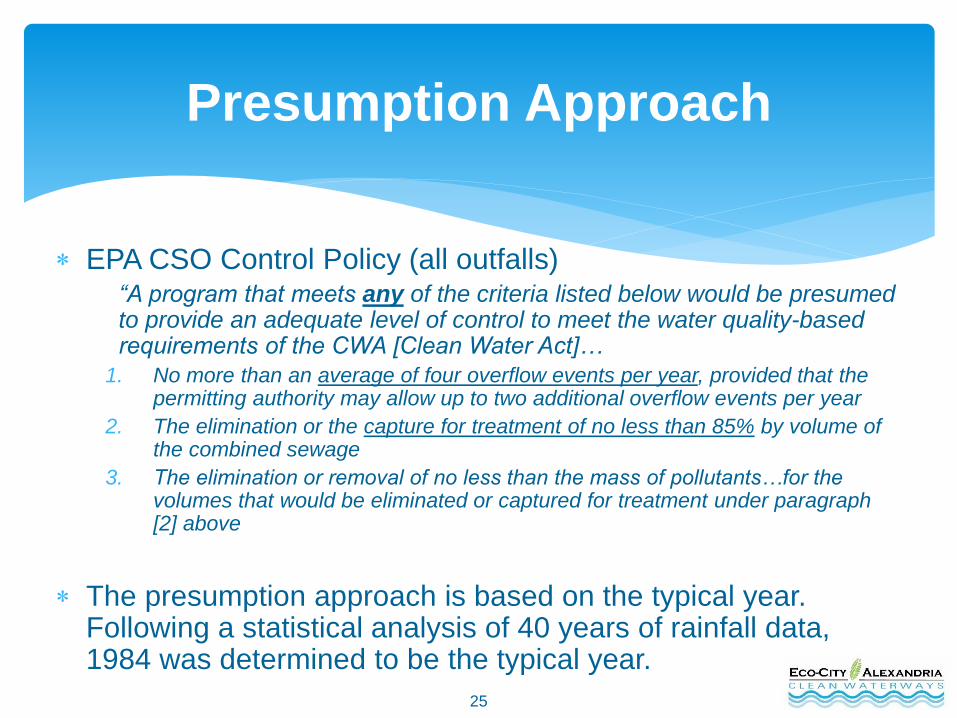
EPA CSO Control Policy (all outfalls)“A program that meets any of the criteria listed below would be presumed to provide an adequate level of control to meet the water quality-based requirements of the CWA [Clean Water Act]…
1. No more than an average of four overflow events per year, provided that the permitting authority may allow up to two additional overflow events per year
2. The elimination or the capture for treatment of no less than 85% by volume of the combined sewage
3. The elimination or removal of no less than the mass of pollutants…for the volumes that would be eliminated or captured for treatment under paragraph [2] above
The presumption approach is based on the typical year. Following a statistical analysis of 40 years of rainfall data, 1984 was determined to be the typical year.
Presumption Approach
26
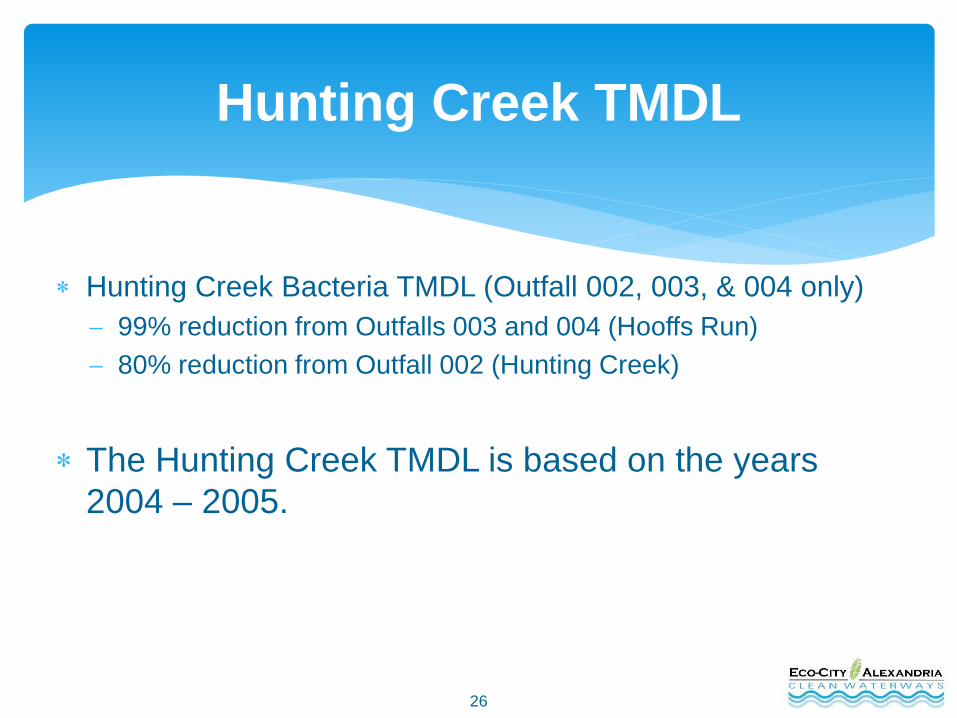
Hunting Creek Bacteria TMDL (Outfall 002, 003, & 004 only)
99% reduction from Outfalls 003 and 004 (Hooffs Run)
80% reduction from Outfall 002 (Hunting Creek)
The Hunting Creek TMDL is based on the years
2004 – 2005.
Hunting Creek TMDL
27
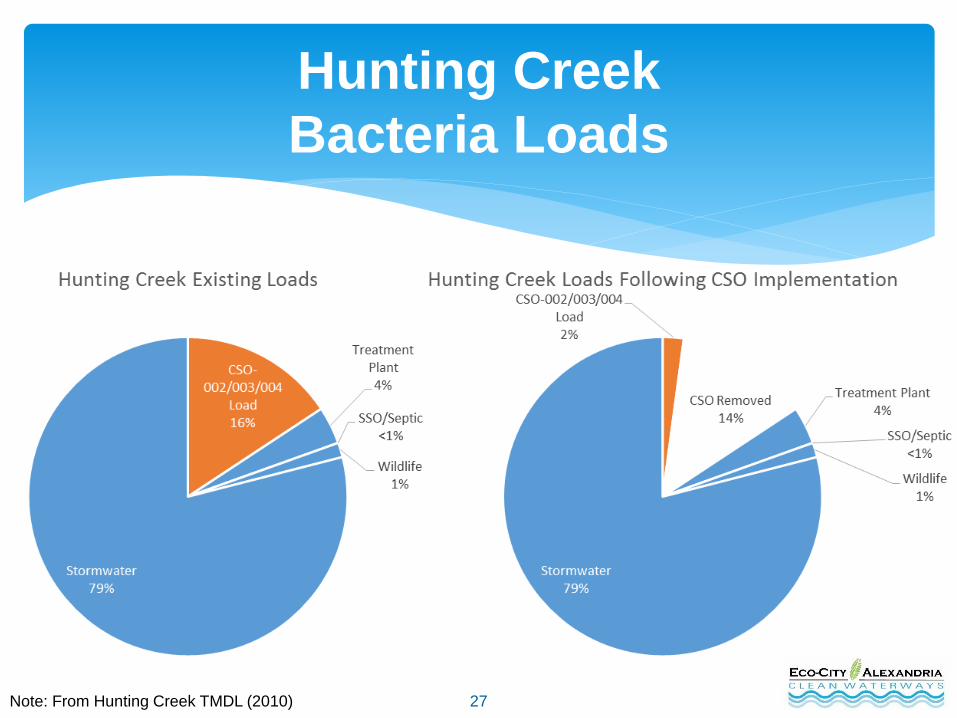
Hunting Creek
Bacteria Loads
Note: From Hunting Creek TMDL (2010)
28
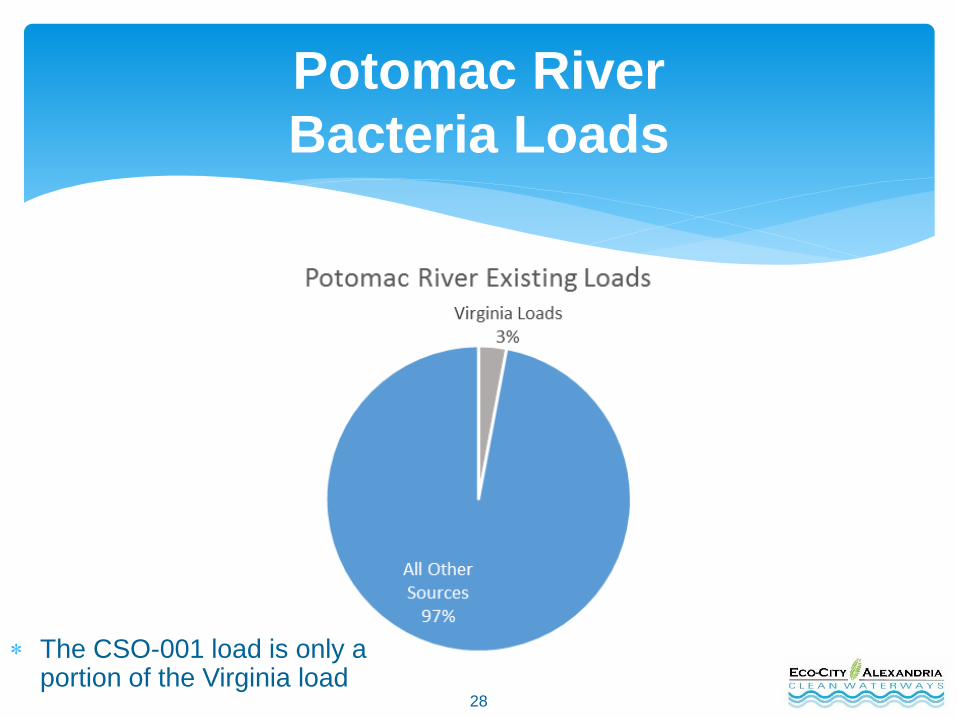
Potomac River
Bacteria Loads
The CSO-001 load is only a portion of the Virginia load
29
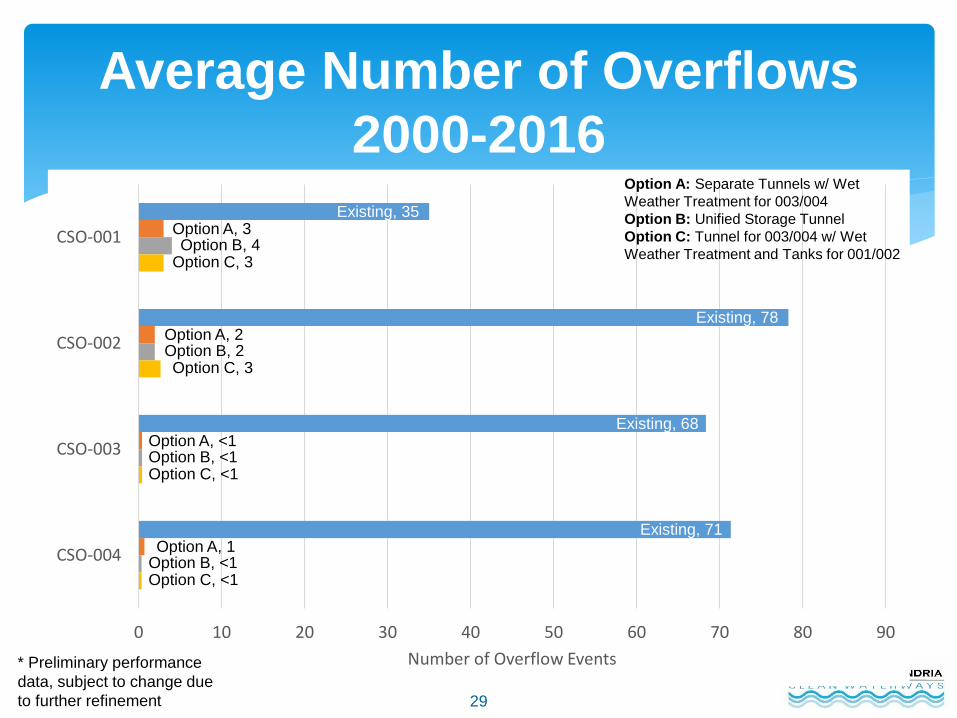
0 10 20 30 40 50 60 70 80 90
CSO-001
CSO-002
CSO-003
CSO-004
Number of Overflow Events
Average Number of Overflows
2000-2016
Option A, 2Option B, 2Option C, 3
Existing, 78
Option A, 3Option B, 4
Option C, 3
Existing, 35
Option A, <1Option B, <1Option C, <1
Existing, 68
Option A, 1Option B, <1Option C, <1
Existing, 71
* Preliminary performance
data, subject to change due
to further refinement
Option A: Separate Tunnels w/ Wet
Weather Treatment for 003/004
Option B: Unified Storage Tunnel
Option C: Tunnel for 003/004 w/ Wet
Weather Treatment and Tanks for 001/002
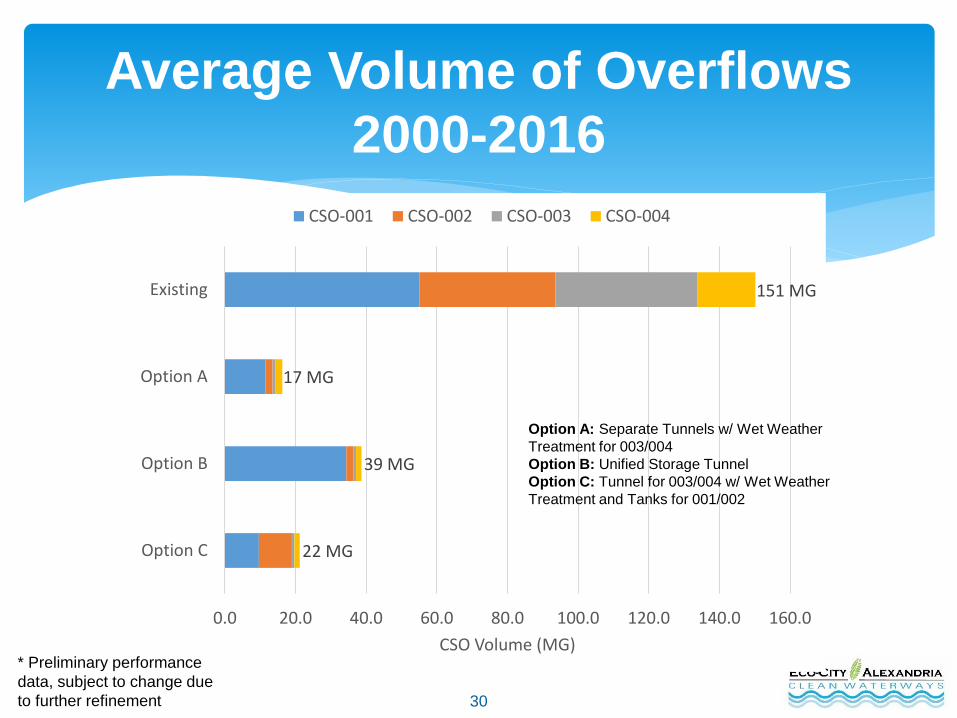
30
Average Volume of Overflows
2000-2016
151 MG
17 MG
39 MG
22 MG
0.0 20.0 40.0 60.0 80.0 100.0 120.0 140.0 160.0
Existing
Option A
Option B
Option C
CSO Volume (MG)
CSO-001 CSO-002 CSO-003 CSO-004
* Preliminary performance
data, subject to change due
to further refinement
Option A: Separate Tunnels w/ Wet Weather
Treatment for 003/004
Option B: Unified Storage Tunnel
Option C: Tunnel for 003/004 w/ Wet Weather
Treatment and Tanks for 001/002
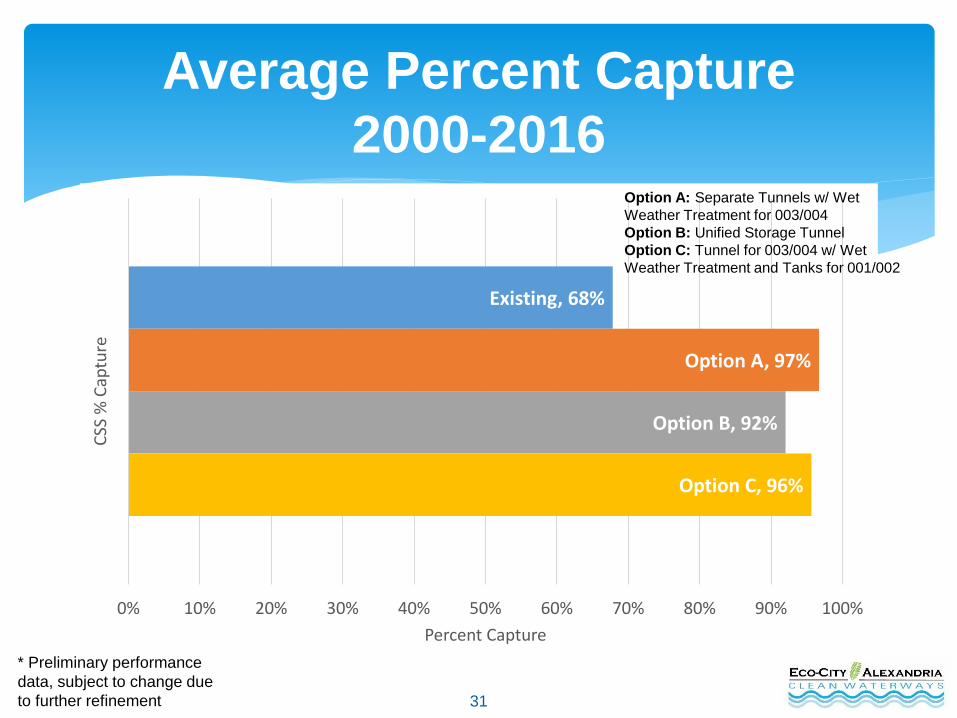
31
Average Percent Capture
2000-2016
Existing, 68%
Option A, 97%
Option B, 92%
Option C, 96%
0% 10% 20% 30% 40% 50% 60% 70% 80% 90% 100%
CSS
% C
aptu
re
Percent Capture
* Preliminary performance
data, subject to change due
to further refinement
Option A: Separate Tunnels w/ Wet
Weather Treatment for 003/004
Option B: Unified Storage Tunnel
Option C: Tunnel for 003/004 w/ Wet
Weather Treatment and Tanks for 001/002

32
Performance: All CSOs
* Preliminary performance
data, subject to change due
to further refinement
Existing
Option ASeparate Tunnels w/
Wet Weather
Treatment
Option BUnified Storage
Tunnel
Option CTunnel for 003/004
w/ Wet Weather
Treatment and
Tanks for 001/002
19
84
No. Overflows per Year 38 – 70 0-0 0-1 0-1
Overflow Volume per Year
(million gallons)97.1 0.0 3.5 0.4
% Capture 77% 100% 99% 100%
20
00
-20
16 No. Overflows per Year 35 – 79 0-3 1-4 1-3
Overflow Volume per Year
(million gallons)150.2 18.6 42.6 20.8
% Capture 68% 96% 91% 95%
Bacterial TMDL Met (2004-2005)? --

33
Performance: CSO 001
Existing
Option ASeparate Tunnels w/
Wet Weather
Treatment
Option BUnified Storage
Tunnel
Option CTunnel for 003/004
w/ Wet Weather
Treatment and
Tanks for 001/002
19
84
No. Overflows per Year 38 0 1 1
Overflow Volume per Year
(million gallons)28.6 0.0 3.5 0.4
% Capture 81% 100% 98% 100%
20
00
-20
16 No. Overflows per Year 35 3 4 3
Overflow Volume per Year
(million gallons)55.1 12.2 38.3 9.5
% Capture 74% 99% 78% 95%
Bacterial TMDL Met (2004-2005)? -- N/A N/A N/A
* Preliminary performance
data, subject to change due
to further refinement
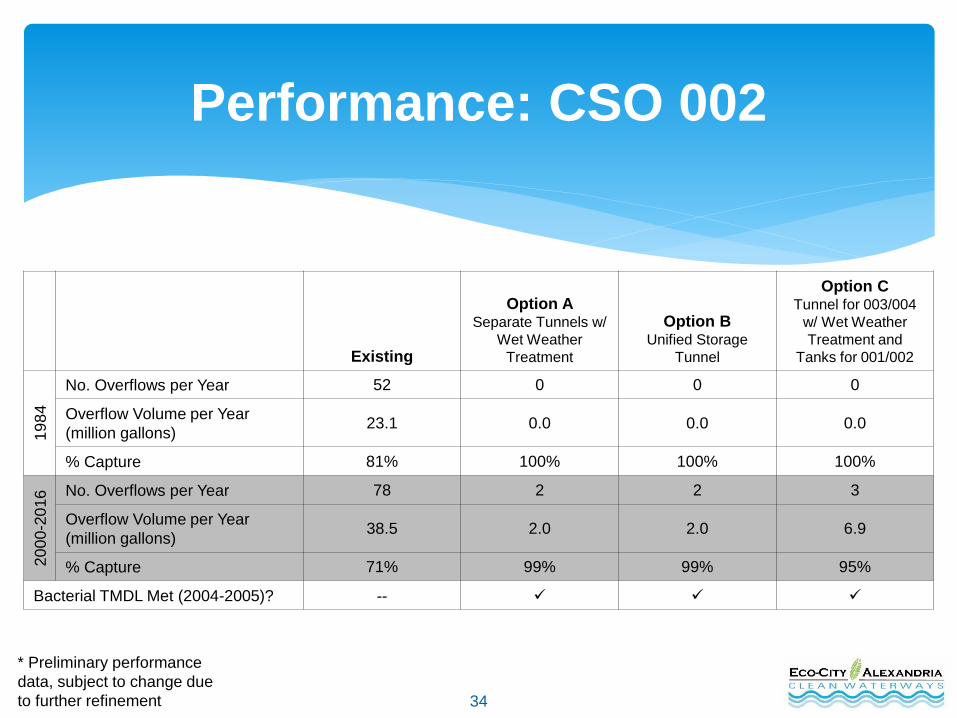
34
Performance: CSO 002
Existing
Option ASeparate Tunnels w/
Wet Weather
Treatment
Option BUnified Storage
Tunnel
Option CTunnel for 003/004
w/ Wet Weather
Treatment and
Tanks for 001/002
19
84
No. Overflows per Year 52 0 0 0
Overflow Volume per Year
(million gallons)23.1 0.0 0.0 0.0
% Capture 81% 100% 100% 100%
20
00
-20
16 No. Overflows per Year 78 2 2 3
Overflow Volume per Year
(million gallons)38.5 2.0 2.0 6.9
% Capture 71% 99% 99% 95%
Bacterial TMDL Met (2004-2005)? --
* Preliminary performance
data, subject to change due
to further refinement

35
Performance: CSO 003
Existing
Option ASeparate Tunnels w/
Wet Weather
Treatment
Option BUnified Storage
Tunnel
Option CTunnel for 003/004
w/ Wet Weather
Treatment and
Tanks for 001/002
19
84
No. Overflows per Year 65 0 0 0
Overflow Volume per Year
(million gallons)32.0 0.0 0.0 0.0
% Capture 42% 100% 100% 100%
20
00
-20
16 No. Overflows per Year 68 <1 <1 <1
Overflow Volume per Year
(million gallons)40.3 0.7 0.7 0.7
% Capture 40% 99% 99% 99%
Bacterial TMDL Met (2004-2005)? --
* Preliminary performance
data, subject to change due
to further refinement

36
Performance: CSO 004
Existing
Option ASeparate Tunnels w/
Wet Weather
Treatment
Option BUnified Storage
Tunnel
Option CTunnel for 003/004
w/ Wet Weather
Treatment and
Tanks for 001/002
19
84
No. Overflows per Year 70 0 0 0
Overflow Volume per Year
(million gallons)13.4 0.0 0.0 0.0
% Capture 85% 100% 100% 100%
20
00
-20
16 No. Overflows per Year 71 1 <1 1
Overflow Volume per Year
(million gallons)16.3 3.7 1.5 3.7
% Capture 82% 96% 98% 96%
Bacterial TMDL Met (2004-2005)? --
* Preliminary performance
data, subject to change due
to further refinement
37
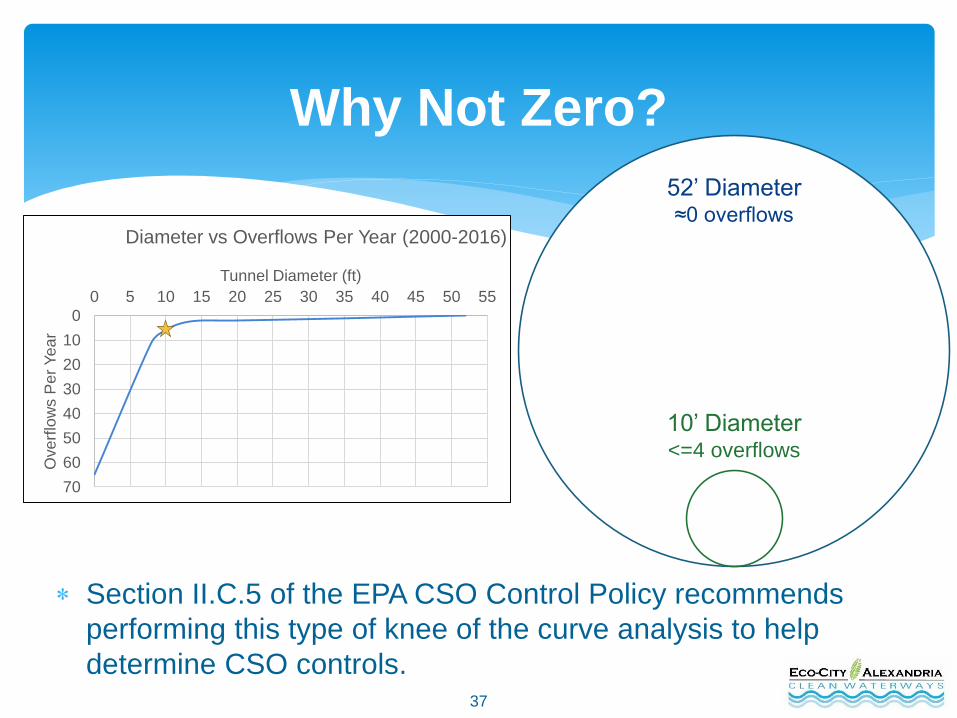
Why Not Zero?
Section II.C.5 of the EPA CSO Control Policy recommends
performing this type of knee of the curve analysis to help
determine CSO controls.
0
10
20
30
40
50
60
70
0 5 10 15 20 25 30 35 40 45 50 55
Ove
rflo
ws P
er
Ye
ar
Tunnel Diameter (ft)
Diameter vs Overflows Per Year (2000-2016)
10’ Diameter<=4 overflows
52’ Diameter≈0 overflows
38
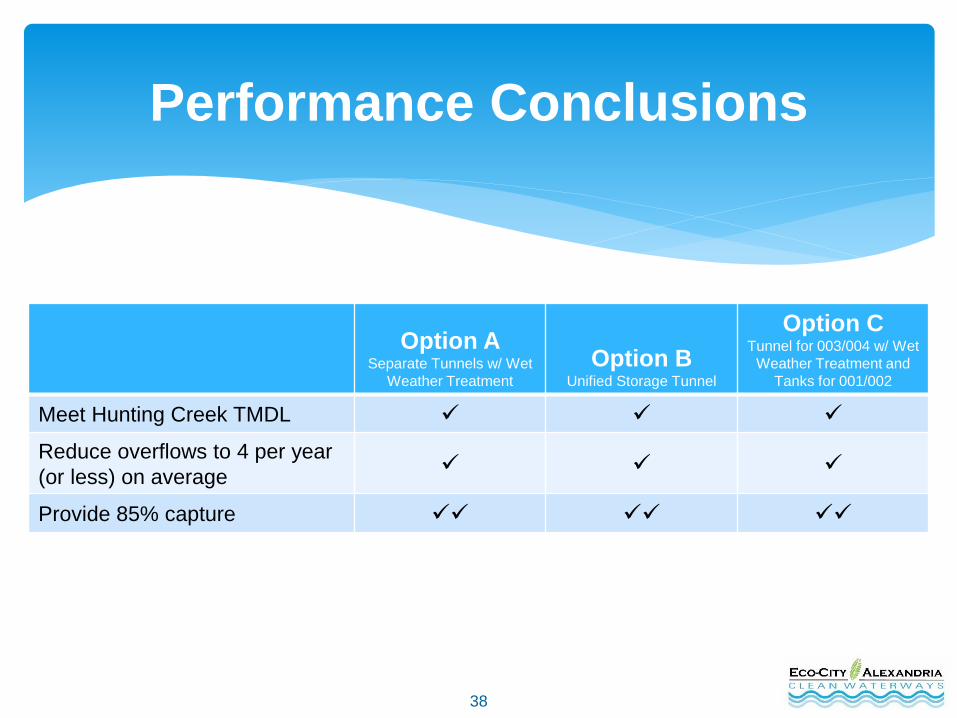
Performance Conclusions
Option ASeparate Tunnels w/ Wet
Weather Treatment
Option BUnified Storage Tunnel
Option CTunnel for 003/004 w/ Wet
Weather Treatment and
Tanks for 001/002
Meet Hunting Creek TMDL
Reduce overflows to 4 per year
(or less) on average
Provide 85% capture
39
Water Quality Benefit is assessed by how much improvement
can be obtained in meeting Water Quality Standards
All options sized to meet the regulatory requirements
All options provide substantial Water Quality Improvements
All options remove bacteria load beyond the level that Water
Quality Improvements can be discerned
After CSO controls are implemented other sources of bacteria
(stormwater, wildlife, SSO/septic, etc.) will dictate the quality of the
receiving waters.
Water Quality
Conclusions
40
Green Infrastructure Recap
and Discussion
41
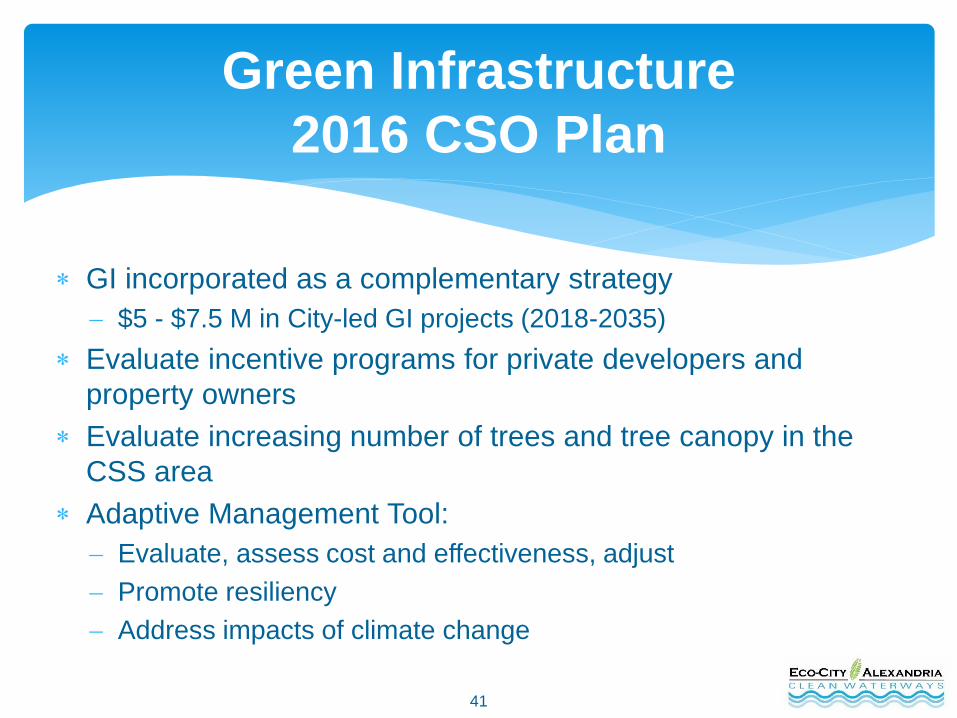
GI incorporated as a complementary strategy
$5 - $7.5 M in City-led GI projects (2018-2035)
Evaluate incentive programs for private developers and
property owners
Evaluate increasing number of trees and tree canopy in the
CSS area
Adaptive Management Tool:
Evaluate, assess cost and effectiveness, adjust
Promote resiliency
Address impacts of climate change
Green Infrastructure
2016 CSO Plan
42
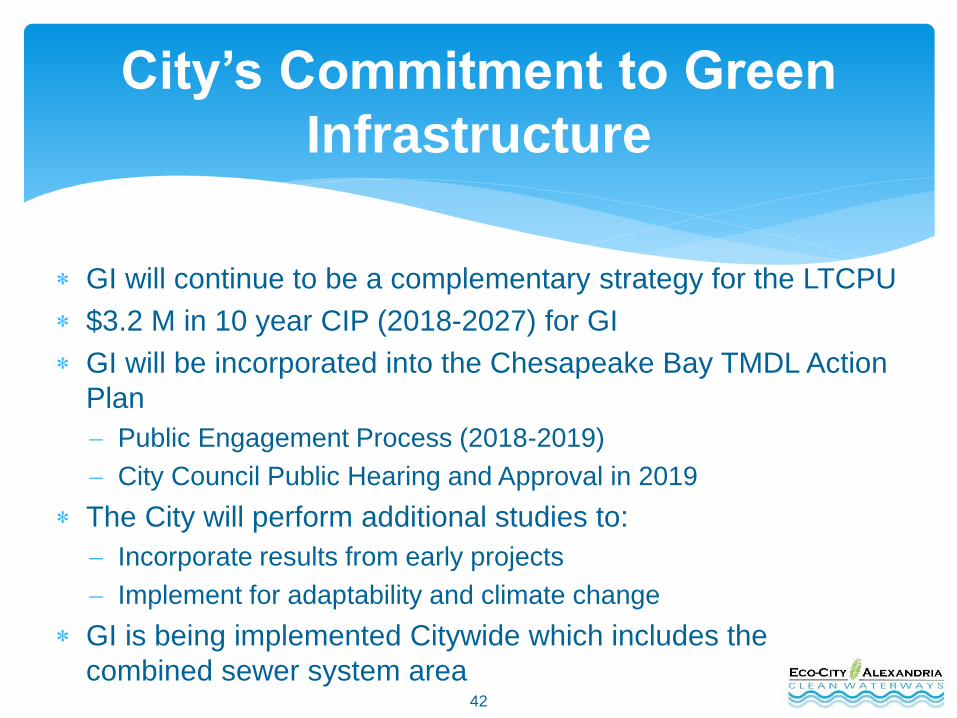
GI will continue to be a complementary strategy for the LTCPU
$3.2 M in 10 year CIP (2018-2027) for GI
GI will be incorporated into the Chesapeake Bay TMDL Action
Plan
Public Engagement Process (2018-2019)
City Council Public Hearing and Approval in 2019
The City will perform additional studies to:
Incorporate results from early projects
Implement for adaptability and climate change
GI is being implemented Citywide which includes the
combined sewer system area
City’s Commitment to Green
Infrastructure
43
Next Steps
44
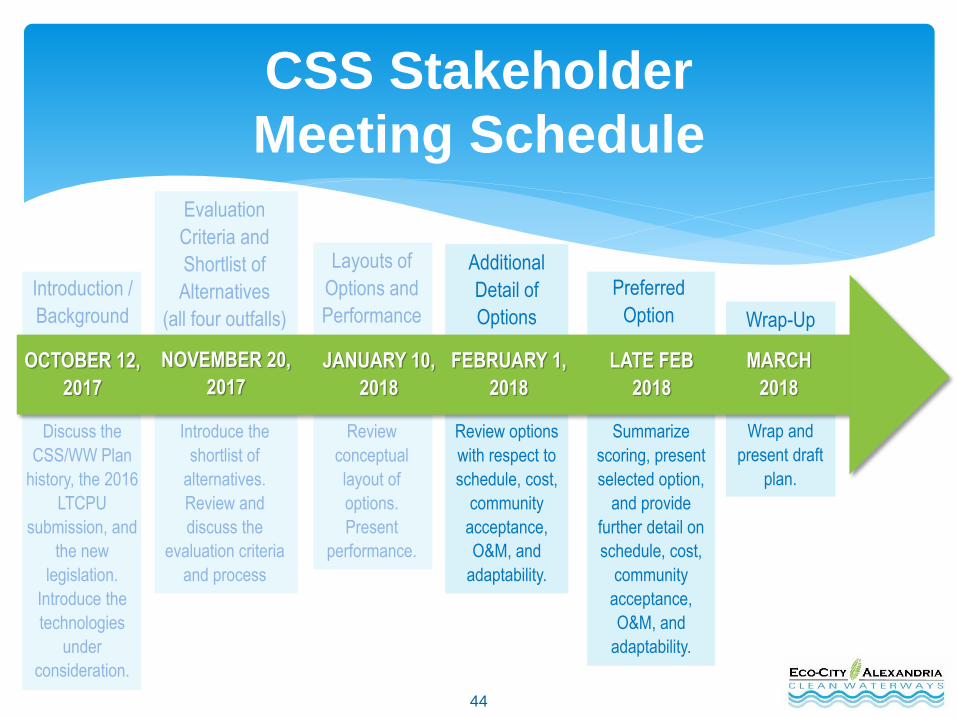
CSS Stakeholder
Meeting Schedule
Introduction /
Background
Evaluation
Criteria and
Shortlist of
Alternatives
(all four outfalls)
Layouts of
Options and
Performance
Additional
Detail of
Options
Preferred
Option Wrap-Up
Discuss the
CSS/WW Plan
history, the 2016
LTCPU
submission, and
the new
legislation.
Introduce the
technologies
under
consideration.
Introduce the
shortlist of
alternatives.
Review and
discuss the
evaluation criteria
and process
Review
conceptual
layout of
options.
Present
performance.
Review options
with respect to
schedule, cost,
community
acceptance,
O&M, and
adaptability.
Summarize
scoring, present
selected option,
and provide
further detail on
schedule, cost,
community
acceptance,
O&M, and
adaptability.
Wrap and
present draft
plan.
OCTOBER 12,
2017
NOVEMBER 20,
2017
JANUARY 10,
2018
LATE FEB
2018
MARCH
2018
FEBRUARY 1,
2018
45
For more information, contact:
703.746.4065
703.746.4154
www.alexandriava.gov/CleanWaterways
Questions/Suggestions/Comments

46
Thank You


![NR451_PPT_Presentation Infection Control in Long Term Care[1]](https://img.pdfslide.net/doc/110x75/54478cb1b1af9f0c068b4cae/nr451pptpresentation-infection-control-in-long-term-care1.jpg)