Embed Size (px)
Citation preview
Hindawi Publishing CorporationInternational Journal of ProteomicsVolume 2011, Article ID 739615, 11 pagesdoi:10.1155/2011/739615
Research Article
Combined Use of a Solid-Phase HexapeptideLigand Library with Liquid Chromatographyand Two-Dimensional Difference Gel Electrophoresisfor Intact Plasma Proteomics
Tatsuo Hagiwara,1, 2 Yumi Saito,1 Yukiko Nakamura,1, 3 Takeshi Tomonaga,3
Yasufumi Murakami,2 and Tadashi Kondo1
1 Division of Pharmacoproteomics, National Cancer Center Research Institute, Chuo-ku, Tokyo 104-0045, Japan2 Laboratory of Genome Biology, Department of Biological Science and Technology, Tokyo University of Science,Tokyo 278-8510, Japan
3 Laboratory of Proteome Research, National Institute of Biomedical Innovation, Osaka 567-0085, Japan
Correspondence should be addressed to Tadashi Kondo, [email protected]
Received 2 May 2011; Accepted 9 June 2011
Academic Editor: David E. Misek
Copyright © 2011 Tatsuo Hagiwara et al. This is an open access article distributed under the Creative Commons AttributionLicense, which permits unrestricted use, distribution, and reproduction in any medium, provided the original work is properlycited.
The intact plasma proteome is of great interest in biomarker studies because intact proteins reflect posttranslational proteinprocessing such as phosphorylation that may correspond to disease status. We examined the utility of a solid-phase hexapeptideligand library in combination with conventional plasma proteomics modalities for comprehensive profiling of intact plasmaproteins. Plasma proteins were sequentially fractionated using depletion columns for albumin and immunoglobulin, and separatedusing an anion-exchange column. Proteins in each fraction were treated with a solid-phase hexapeptide ligand library andcompared to those without treatment. Two-dimensional difference gel electrophoresis demonstrated an increased number ofprotein spots in the treated samples. Mass spectrometric studies of these protein spots with unique intensity in the treated samplesresulted in the identification of high- and medium-abundance proteins. Our results demonstrated the possible utility of a solid-phase hexapeptide ligand library to reveal greater number of intact plasma proteins. The characteristics of proteins with uniqueaffinity to the library remain to be clarified by more extensive mass spectrometric protein identification, and optimized protocolsshould be established for large-scale plasma biomarker studies.
1. Introduction
The plasma proteome has been extensively investigated withthe aim of biomarker development [1, 2]. Plasma is the mostaccessible clinical material, and plasma biomarkers for earlydiagnosis and monitoring the response to therapy and dis-ease recurrence would be beneficial for patients with cancer.Because proteins released by tumors, particularly early-stagetumors, are expected to exist in very low concentrations andplasma contains various proteins with considerable hetero-geneity between and within patients, the identification ofnovel plasma biomarkers represents a substantial challenge.
Global expression studies on intact plasma proteins areof special interest in biomarker studies as the intact proteins
reflect the functional features of protein structure. Thoseinclude posttranslational processing such as phosphorylationand glycosylation. Peptide subsets from complex digests havebeen analyzed for plasma proteomics, resulting in the iden-tification of low-abundance proteins such as tissue leakageproteins [3] and biomarker candidates [4]. However, analysisof peptide digests may not be sensitive to posttranslationalprotein processing, and may therefore not reveal manyrelevant protein isoforms associated with disease status. Todate, much effort has been devoted to detect trace intactproteins in complex plasma samples.
The utility of a combinatorial hexapeptide ligandlibrary immobilized on a solid-phase matrix has beenreported, introduced to intact plasma proteomics [5–9], and
2 International Journal of Proteomics
commercialized as ProteoMiner (Bio-Rad Laboratories, Her-cules, CA, USA). ProteoMiner contains millions of randomlysynthesized hexapeptide ligands that are equally representedwith a selected number of targets. When a complex plasmaprotein extract is exposed, the hexapeptide ligands for high-abundance proteins are saturated, but the majority remainsunbound. In contrast, the proteins which do not saturate thecorresponding hexapeptide ligands and usually not observedby the conventional methods will appear in the proteomedata. The approach of using a combinatorial hexapeptideligand library is different from that of using depletion andseparation; thus, it reveals a novel aspect of the plasmaproteome. A recent report demonstrated that prefraction-ation using a hexapeptide ligand library for shotgun massspectrometry studies identified plasma proteins not recordedin the Human Plasma Proteome Project [10]. The combineduse of a hexapeptide ligand library with depletion andseparation methods has also been a challenge in deeperplasma proteomics [11], and the resulting protein contentsare examined by gel electrophoresis and mass spectrometry[12, 13]. ProteoMiner has been used for disease biomarkerstudies in lung cancer [14] and liver cancer [15]. Consideringthat it will potentially visualize the unique plasma proteomeaspects, the application and optimization of a solid-phasehexapeptide ligand library for disease biomarker studiesshould be further investigated.
In this study, we examined the utility of a solid-phasehexapeptide ligand library in combination with a depletioncolumn, an anion-exchange column, and 2D-DIGE thatallows an instant visual comparison of the protein patterns.Protein spots exhibiting prominent differences between sam-ples treated with and without the library were subjected tomass spectrometry. Our study clearly demonstrated that thecombined use of the ProteoMiner and the other proteomicsmodalities can visualize unique plasma proteome.
2. Materials and Methods
2.1. Sample Preparation. Frozen human plasma was pur-chased from Cosmobio KOJ (Tokyo, Japan). After the plasmawas placed on ice, 40 mL plasma was centrifuged and 30 mLsupernatant was recovered for the following experiments.
2.2. Albumin Depletion. Albumin and other proteins wereseparated using a HiTrap Blue HP column (5 mL resin,GE, Uppsala, Sweden) with the AKTA Explorer system(GE) at a flow rate of 1.0 mL/min. The separation wasinitiated by washing the column with rinse buffer (50 mMKH2PO4/Na2HPO4, pH 7.0) for 5 min. Plasma (30 mL)was diluted with 60 mL 50 mM KH2PO4/Na2HPO4 (pH7.0), and 9 mL of the diluted plasma was injected. Thecolumn was then washed with binding buffer (50 mMKH2PO4/Na2HPO4, pH 7.0) for 35 min, and the flow-through fraction was collected. Bound proteins were elutedfrom the column with elution buffer (50 mM KHPO4, 1.5 MKCl, pH 7.0) for 45 min, and the bound fraction wascollected. The column was neutralized with rinse buffer for20 min. This process was repeated 10 times for a total of90 mL of diluted plasma.
One-third of the flow-through and bound fractions,approximately 150 mL of each, was concentrated to 1.2 mLusing a VIVA Spin 20 column (10 K MWCO, 20 mL capacity,Sartorius, Gotteingen, Germany). Then, 1.0 mL and 0.20 mLof the concentrated samples were subjected to treatmentwith the solid-phase hexapeptide ligand library and 2D-DIGE, respectively. Two-thirds of the flow-through fraction,approximately 300 mL, was subjected to an immunodeple-tion column.
2.3. Immunoglobulin Depletion. Immunoglobulin was deple-ted using the HiTrap Protein G HP column (1 mL resin,GE) with the AKTA Explorer system (GE) at a flow rateof 1.0 mL/min. The depletion was initiated by washing thecolumn with rinse buffer (50 mM KH2PO4/Na2HPO4, pH7.0) for 4 min. After 15 mL of the flow-through fraction fromthe HiTrap Blue HP column was injected, the column waswashed with binding buffer (50 mM KH2PO4/Na2HPO4, pH7.0) for 5 min, and the flow-through fraction was collected.Bound proteins were eluted from the column with elutionbuffer (0.1 M glycine-HCl, pH 2.2) for 8 min and collectedas the bound fraction. The collected bound fraction wasimmediately neutralized with neutralizing buffer (1.0 M Tris-HCl, pH 9.0). The column was equilibrated with rinse bufferfor 5 min for reuse. This process was repeated 20 times fora total of two-thirds of the flow-through fraction from theHiTrap Blue HP column (approximately 300 mL).
Half of the flow-through and bound fractions (approx-imately 200 mL and 80 mL, resp.) were concentrated to1.2 mL and 0.25 mL, respectively, using VIVA Spin 20columns (Sartorius). Then, 1.0 mL of the concentrated flow-through fraction and 0.20 mL of the concentrated boundfraction were subjected to treatment with the solid-phaseligand library, and the remaining samples were subjectedto 2D-DIGE. Another half of the flow-through fraction(approximately 200 mL) was concentrated to 2.0 mL usingthe VIVA Spin 20 column (Sartorius). After diluting with38 mL of 25 mM Tris-HCl (pH 9.0), the sample was subjectedto separation on an anion-exchange column.
2.4. Anion Exchange. The flow-through fraction from theHiTrap Protein G HP column was separated using theResource Q column (1 mL resin, 6.4 mm id × 30 mm, GE)with the AKTA Explorer system (GE) at a flow rate of3.0 mL/min. The separation was initiated by washing thecolumn with rinse buffer (25 mM Tris-HCl, pH 9.0) for4 min, and 5 mL of the flow-through fraction from theHiTrap Protein G HP column was injected. The separationswere performed using a stepwise NaCl gradient as follows:0, 100, 150, 200, 250, and 1000 mM for 5 min each. Allsamples contained 25 mM Tris-HCl, pH 9.0. The columnwas washed with rinse buffer (25 mM Tris-HCl, pH 9.0) for5 min. This process was repeated 8 times for a total of 40 mLof the diluted flow-through fraction from the HiTrap ProteinG HP column.
The collected samples were concentrated to 0.25 mL, andthe buffer was exchanged gradually with 25 mM Tris-HCl(pH 9.0) using the VIVA Spin 20 column (Sartorius). Then,
International Journal of Proteomics 3
0.2 mL and 0.05 mL were subjected to treatment with thesolid-phase ligand library and 2D-DIGE, respectively.
2.5. Treatment with the Solid-Phase Ligand Library. A solid-phase combinatorial library of hexapeptides was purchasedfrom Bio-Rad Laboratories (ProteoMiner kit). Unprocessedplasma (1 mL) and the flow-through fractions from theHiTrap Blue HP and HiTrap Protein G HP columns weretreated using the ProteoMiner large-capacity kit, and 0.2 mLof the bound fraction from the HiTrap Protein G HPcolumn, and all fractions from the Resource Q column weretreated using the ProteoMiner small-capacity kit. After 2 hof incubation at room temperature, the unbound fractionwas washed out by centrifugation. After rinsing, the boundsample was eluted with an elution reagent containing 8 Murea, 2% CHAPS, and 5% acetic acid, according to themanufacturer’s instructions.
2.6. Measurement of Protein Concentration. Protein concen-tration was measured using a protein assay kit (Bio-Rad),according to the manufacturer’s instructions (Table 1).
2.7. SDS-PAGE. Protein samples (1 μg) were examined byelectrophoresis using 18-well precast 12.5% polyacrylamidegel plates (e-PAGEL, ATTO, Tokyo, Japan). Electrophoresiswas performed at a constant current of 40 mA for 80 minand using the page Run AE6531 system [16]. Silver stainingwas performed using the Silver Stain KANTO III kit (KantoChemical, Tokyo, Japan), according to the manufacturer’sinstructions.
2.8. 2D-DIGE. 2D-DIGE was performed as described pre-viously [17]. Briefly, protein samples (20 μg) were labeledwith the Cy3 or Cy5 fluorescent dye (CyDye DIGE Fluorsaturation dye, GE), and differentially labeled protein sam-ples were mixed. After dividing into 3, the labeled proteinsamples were separated by 2D-PAGE. The first-dimensionseparation was performed using a 24 cm length immobilinegel (IPG, pI 4–7, GE) and Multiphor II (GE) whereas thesecond-dimension separation was performed using gradientgels prepared in house and EttanDalttwelve (GE). The gelswere scanned using a laser scanner (Typhoon Trio, GE) atan appropriate wavelength for Cy3 or Cy5. The Cy3 and Cy5intensities were compared in the same gel using the Proge-nesis SameSpots software (version 4.0; Nonlinear Dynamics,Newcastle, UK). ProteoMiner-treated and untreated sampleswere labeled with Cy3 and Cy5, respectively, or with Cy5and Cy3, respectively. Six gels were run for each sample. Theaverage value of the intensity ratio was calculated among thetriplicate gels for all protein spots and then averaged betweenthe 2 samples for further study. Spot intensity data wereexported from the Progenesis SameSpots software as Excelfiles amenable to numerical data analysis.
2.9. Mass Spectrometric Protein Identification. Proteins wereextracted from the protein spots by in-gel digestion, asreported previously [17]. Briefly, protein samples (100 μg)were labeled with Cy3 and separated by 2D-PAGE. The
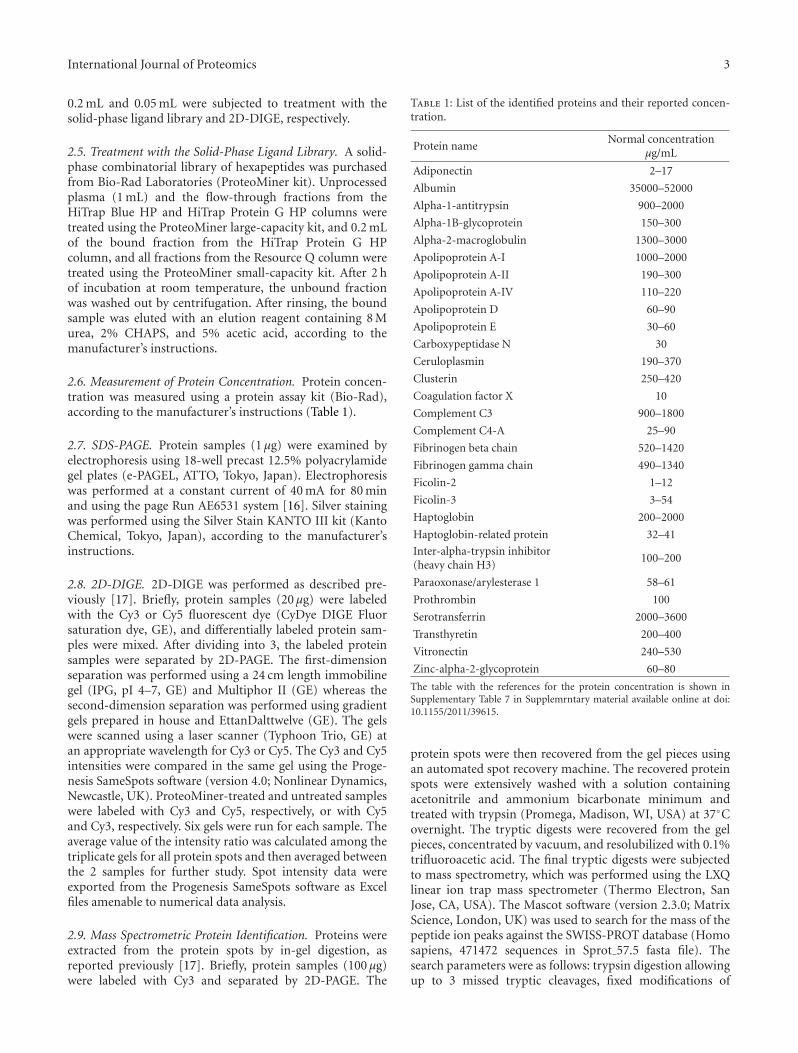
Table 1: List of the identified proteins and their reported concen-tration.
Protein nameNormal concentration
μg/mL
Adiponectin 2–17
Albumin 35000–52000
Alpha-1-antitrypsin 900–2000
Alpha-1B-glycoprotein 150–300
Alpha-2-macroglobulin 1300–3000
Apolipoprotein A-I 1000–2000
Apolipoprotein A-II 190–300
Apolipoprotein A-IV 110–220
Apolipoprotein D 60–90
Apolipoprotein E 30–60
Carboxypeptidase N 30
Ceruloplasmin 190–370
Clusterin 250–420
Coagulation factor X 10
Complement C3 900–1800
Complement C4-A 25–90
Fibrinogen beta chain 520–1420
Fibrinogen gamma chain 490–1340
Ficolin-2 1–12
Ficolin-3 3–54
Haptoglobin 200–2000
Haptoglobin-related protein 32–41
Inter-alpha-trypsin inhibitor(heavy chain H3)
100–200
Paraoxonase/arylesterase 1 58–61
Prothrombin 100
Serotransferrin 2000–3600
Transthyretin 200–400
Vitronectin 240–530
Zinc-alpha-2-glycoprotein 60–80
The table with the references for the protein concentration is shown inSupplementary Table 7 in Supplemrntary material available online at doi:10.1155/2011/39615.
protein spots were then recovered from the gel pieces usingan automated spot recovery machine. The recovered proteinspots were extensively washed with a solution containingacetonitrile and ammonium bicarbonate minimum andtreated with trypsin (Promega, Madison, WI, USA) at 37◦Covernight. The tryptic digests were recovered from the gelpieces, concentrated by vacuum, and resolubilized with 0.1%trifluoroacetic acid. The final tryptic digests were subjectedto mass spectrometry, which was performed using the LXQlinear ion trap mass spectrometer (Thermo Electron, SanJose, CA, USA). The Mascot software (version 2.3.0; MatrixScience, London, UK) was used to search for the mass of thepeptide ion peaks against the SWISS-PROT database (Homosapiens, 471472 sequences in Sprot 57.5 fasta file). Thesearch parameters were as follows: trypsin digestion allowingup to 3 missed tryptic cleavages, fixed modifications of
4 International Journal of Proteomics
0 mM NaCl
100 mM NaCl
150 mM NaCl
200 mM NaCl
250 mM NaCl
1 M NaCl
Plasma sample
Bound fraction
Bound fraction
Resource Q
ProteoMiner
ProteoMiner
ProteoMiner
ProteoMiner
ProteoMiner
ProteoMiner
ProteoMiner
ProteoMiner
ProteoMiner
ProteoMiner
ProteoMiner
HiTrap Blue HP
HiTrap Protein G HP
2D-DIGE
2D-DIGE
2D-DIGE
2D-DIGE
2D-DIGE
2D-DIGE
2D-DIGE
2D-DIGE
2D-DIGE
2D-DIGE
2D-DIGE
Massspectrometry
Massspectrometry
Massspectrometry
Massspectrometry
Massspectrometry
Massspectrometry
Massspectrometry
Massspectrometry
Massspectrometry
Massspectrometry
Massspectrometry
Flow-through fraction
Flow-through fraction
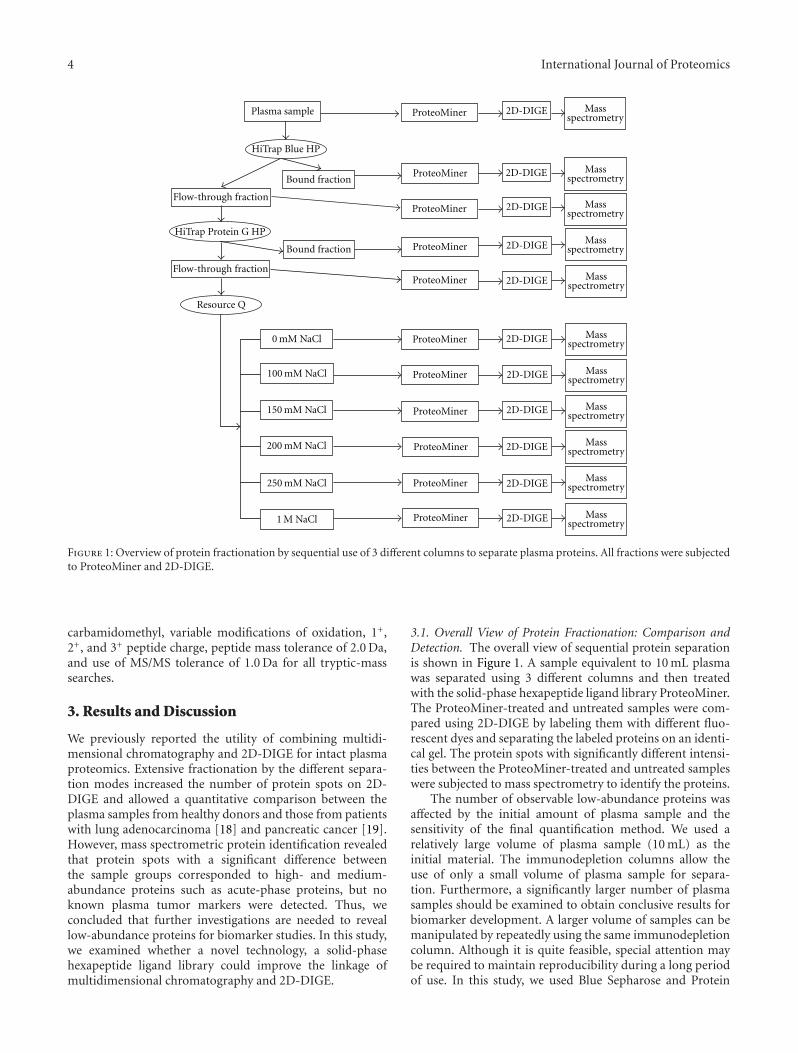
Figure 1: Overview of protein fractionation by sequential use of 3 different columns to separate plasma proteins. All fractions were subjectedto ProteoMiner and 2D-DIGE.
carbamidomethyl, variable modifications of oxidation, 1+,2+, and 3+ peptide charge, peptide mass tolerance of 2.0 Da,and use of MS/MS tolerance of 1.0 Da for all tryptic-masssearches.
3. Results and Discussion
We previously reported the utility of combining multidi-mensional chromatography and 2D-DIGE for intact plasmaproteomics. Extensive fractionation by the different separa-tion modes increased the number of protein spots on 2D-DIGE and allowed a quantitative comparison between theplasma samples from healthy donors and those from patientswith lung adenocarcinoma [18] and pancreatic cancer [19].However, mass spectrometric protein identification revealedthat protein spots with a significant difference betweenthe sample groups corresponded to high- and medium-abundance proteins such as acute-phase proteins, but noknown plasma tumor markers were detected. Thus, weconcluded that further investigations are needed to reveallow-abundance proteins for biomarker studies. In this study,we examined whether a novel technology, a solid-phasehexapeptide ligand library could improve the linkage ofmultidimensional chromatography and 2D-DIGE.
3.1. Overall View of Protein Fractionation: Comparison andDetection. The overall view of sequential protein separationis shown in Figure 1. A sample equivalent to 10 mL plasmawas separated using 3 different columns and then treatedwith the solid-phase hexapeptide ligand library ProteoMiner.The ProteoMiner-treated and untreated samples were com-pared using 2D-DIGE by labeling them with different fluo-rescent dyes and separating the labeled proteins on an identi-cal gel. The protein spots with significantly different intensi-ties between the ProteoMiner-treated and untreated sampleswere subjected to mass spectrometry to identify the proteins.
The number of observable low-abundance proteins wasaffected by the initial amount of plasma sample and thesensitivity of the final quantification method. We used arelatively large volume of plasma sample (10 mL) as theinitial material. The immunodepletion columns allow theuse of only a small volume of plasma sample for separa-tion. Furthermore, a significantly larger number of plasmasamples should be examined to obtain conclusive results forbiomarker development. A larger volume of samples can bemanipulated by repeatedly using the same immunodepletioncolumn. Although it is quite feasible, special attention maybe required to maintain reproducibility during a long periodof use. In this study, we used Blue Sepharose and Protein
International Journal of Proteomics 5
G-Sepharose columns in a sequential manner to depletealbumin and subsequently immunoglobulin and to min-imize repeated use of the same column. Although thesecolumns may have less sensitivity than an immunodepletioncolumn and deplete nontargeted proteins that may bind toalbumin and immunoglobulin, a larger volume of plasmasample can be treated in individual procedures. A previousstudy indicated that Cibacron Blue beads remove a majorportion of the albumin but with concomitant loss ofpotentially important peptides and proteins [20]. Thus,we examined both the column-bound and flow-throughfractions (Figure 1). Although the specificity of CibacronBlue beads was not validated in this study, as the purposeof Cibacron Blue was to reduce the complexity of plasmasample, it should not be problem.
To avoid possible redundant proteins in the neighboringfractions as much as possible when utilizing the anion-exchange column, we used stepwise elution and fractiona-tion; once all proteins were eluted, the next elution bufferwas applied to the column (Figure 1). Considering the com-plexity of the samples and resolution of an anion-exchangecolumn, extensive fractionation with a gradient buffer systemmay result in redundant contents among the fractions.We employed 6 stepwise fractionations by monitoring thefraction contents using SDS-PAGE (data not shown).
3.2. High Reproducibility of Protein Fractionation by Chro-matography. The ultraviolet detection (280 nm) trace foreach run demonstrated consistent separation of albumin andimmunoglobulin from the depletion and anion-exchangecolumns. This high reproducibility may suggest the possibleutilities of this approach for biomarker studies (Supple-mentary Figure 1). High quantitative and qualitative repro-ducibility of the solid-phase hexapeptide ligand library Pro-teoMiner has been confirmed in previous reports [21, 22].
3.3. Demonstration of the Effects of Fractionation and DynamicRange Reduction. We examined the effects of sequentialplasma protein fractionation using 3 columns and thereduction of dynamic range by ProteoMiner (Figure 2).The contents of the fractionated samples were apparentlydifferent from each other. Notably, the protein sample boundto the Blue Sepharose and Protein G-Sepharose columnsincluded many proteins that should be different from thetargeted proteins, according to their molecular weights.Treatment of the fractionated samples with ProteoMinerenhanced the proteins that were not observed, except forthose bound to the Protein G-Sepharose column. Treatmentof the bound fraction from the Protein G-Sepharose columnwith ProteoMiner did not result in a greater number ofobservable proteins. This may have been due to the lowcomplexity and narrow dynamic range of proteins in thebound fraction from the Protein G-Sepharose column. Therewas one order of magnitude in concentration differencefor the observed protein bands in the ProteoMiner-treatedsample. These observations may reflect that the affinity ofproteins for the peptide may not be equal and even thenumber of peptides bound on the beads is equal, the amountof proteins bound to the ProteoMiner may be different
− + − + − + − + − +
ProG BDProG FTBlue BDBlue FTPlasmaMW MW
250150100
75
50
37
25
20
15
(kDa) (kDa)
(a)
− + − + − + − + − + − +MW MW
250150100
75
50
37
25
20
15
0 mM 100 mM 150 mM 200 mM 250 mM
(kDa) (kDa)
1 M
(b)
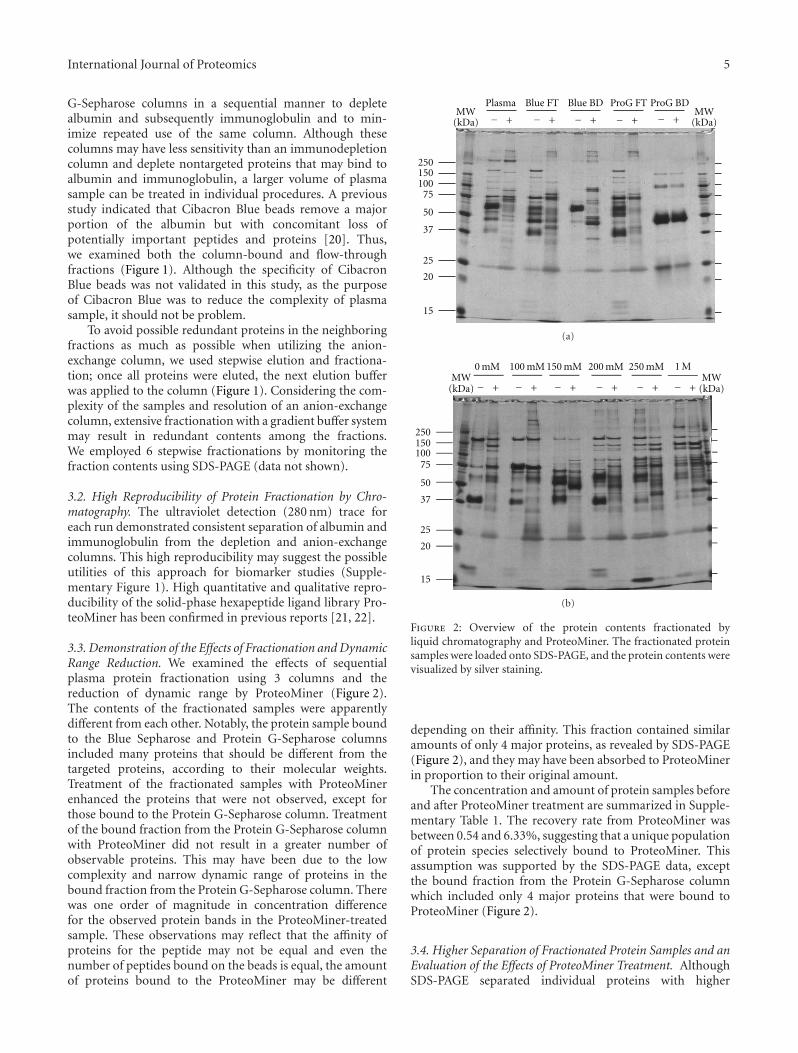
Figure 2: Overview of the protein contents fractionated byliquid chromatography and ProteoMiner. The fractionated proteinsamples were loaded onto SDS-PAGE, and the protein contents werevisualized by silver staining.
depending on their affinity. This fraction contained similaramounts of only 4 major proteins, as revealed by SDS-PAGE(Figure 2), and they may have been absorbed to ProteoMinerin proportion to their original amount.
The concentration and amount of protein samples beforeand after ProteoMiner treatment are summarized in Supple-mentary Table 1. The recovery rate from ProteoMiner wasbetween 0.54 and 6.33%, suggesting that a unique populationof protein species selectively bound to ProteoMiner. Thisassumption was supported by the SDS-PAGE data, exceptthe bound fraction from the Protein G-Sepharose columnwhich included only 4 major proteins that were bound toProteoMiner (Figure 2).
3.4. Higher Separation of Fractionated Protein Samples and anEvaluation of the Effects of ProteoMiner Treatment. AlthoughSDS-PAGE separated individual proteins with higher
6 International Journal of Proteomics
resolution than chromatography in this study, using it for aquantitative comparison in a biomarker study may be trou-blesome because many protein bands obviously overlapped(Figure 2). Thus, we subjected the fractionated samplesto 2D-DIGE in order to separate the proteins with higherresolution. Bandow compared ProteoMiner-treated anduntreated plasma samples using conventional 2D-PAGE anddemonstrated substantial differences between unprocessedand immunodepleted plasma samples [11]. In 2D-DIGE, 2protein samples were labeled with different fluorescent dyes,mixed, and separated by 2D-PAGE. Because the 2 sampleswere separated on an identical 2D-PAGE, gel-to-gel variationwas compensated. In addition, the wide dynamic range ofthe fluorescent dyes enabled a quantitative comparison.2D-DIGE has been applied to compare the performance ofProteoMiner with an immunodepletion column [12]. Wefurther extended the evaluation of the utility of ProteoMinerby loading a high amount of protein and examining theproteins separated by an anion-exchange column.
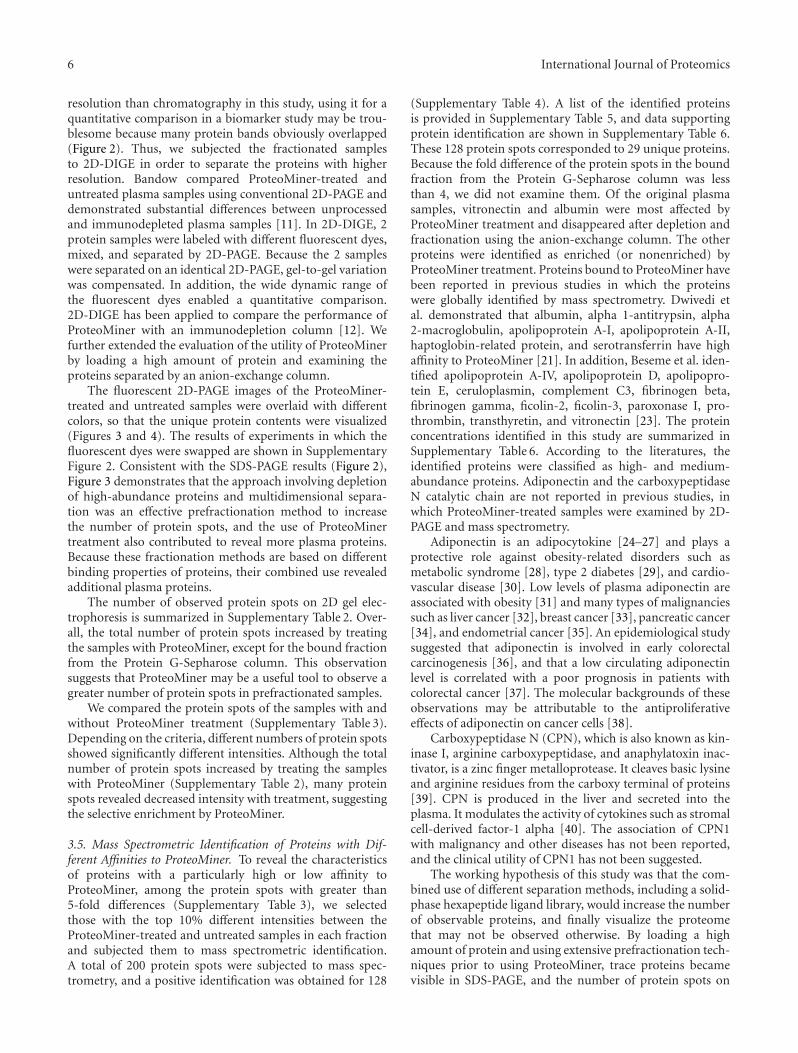
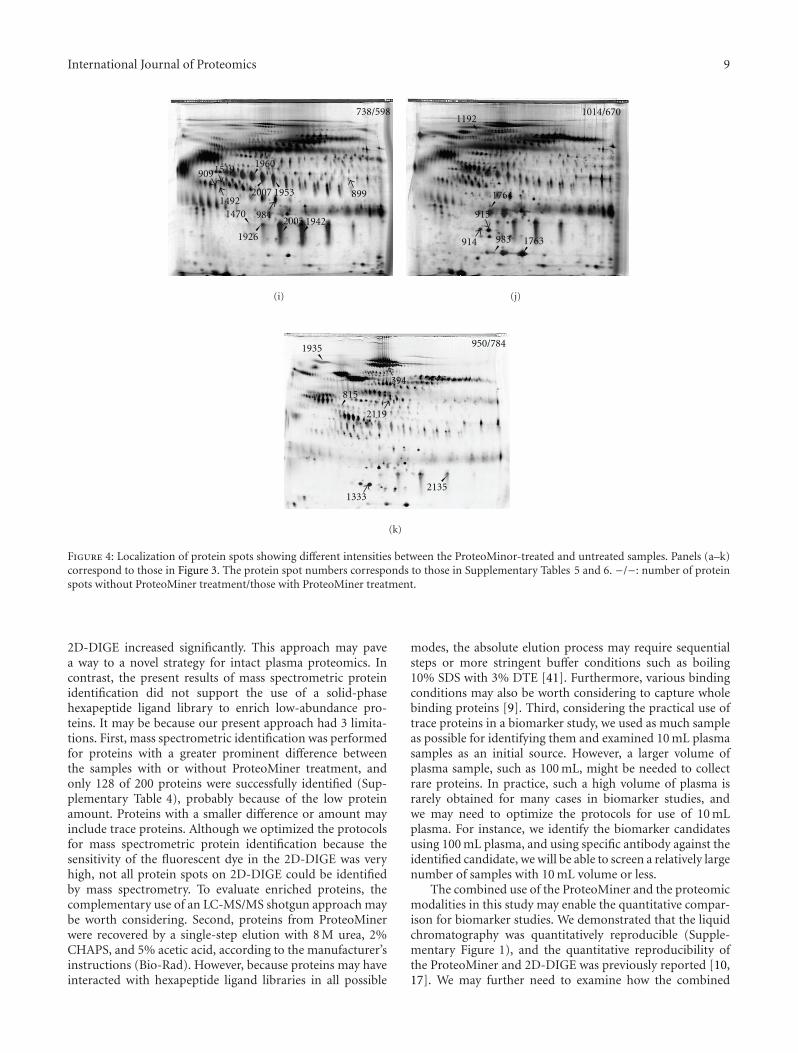
The fluorescent 2D-PAGE images of the ProteoMiner-treated and untreated samples were overlaid with differentcolors, so that the unique protein contents were visualized(Figures 3 and 4). The results of experiments in which thefluorescent dyes were swapped are shown in SupplementaryFigure 2. Consistent with the SDS-PAGE results (Figure 2),Figure 3 demonstrates that the approach involving depletionof high-abundance proteins and multidimensional separa-tion was an effective prefractionation method to increasethe number of protein spots, and the use of ProteoMinertreatment also contributed to reveal more plasma proteins.Because these fractionation methods are based on differentbinding properties of proteins, their combined use revealedadditional plasma proteins.
The number of observed protein spots on 2D gel elec-trophoresis is summarized in Supplementary Table 2. Over-all, the total number of protein spots increased by treatingthe samples with ProteoMiner, except for the bound fractionfrom the Protein G-Sepharose column. This observationsuggests that ProteoMiner may be a useful tool to observe agreater number of protein spots in prefractionated samples.
We compared the protein spots of the samples with andwithout ProteoMiner treatment (Supplementary Table 3).Depending on the criteria, different numbers of protein spotsshowed significantly different intensities. Although the totalnumber of protein spots increased by treating the sampleswith ProteoMiner (Supplementary Table 2), many proteinspots revealed decreased intensity with treatment, suggestingthe selective enrichment by ProteoMiner.
3.5. Mass Spectrometric Identification of Proteins with Dif-ferent Affinities to ProteoMiner. To reveal the characteristicsof proteins with a particularly high or low affinity toProteoMiner, among the protein spots with greater than5-fold differences (Supplementary Table 3), we selectedthose with the top 10% different intensities between theProteoMiner-treated and untreated samples in each fractionand subjected them to mass spectrometric identification.A total of 200 protein spots were subjected to mass spec-trometry, and a positive identification was obtained for 128
(Supplementary Table 4). A list of the identified proteinsis provided in Supplementary Table 5, and data supportingprotein identification are shown in Supplementary Table 6.These 128 protein spots corresponded to 29 unique proteins.Because the fold difference of the protein spots in the boundfraction from the Protein G-Sepharose column was lessthan 4, we did not examine them. Of the original plasmasamples, vitronectin and albumin were most affected byProteoMiner treatment and disappeared after depletion andfractionation using the anion-exchange column. The otherproteins were identified as enriched (or nonenriched) byProteoMiner treatment. Proteins bound to ProteoMiner havebeen reported in previous studies in which the proteinswere globally identified by mass spectrometry. Dwivedi etal. demonstrated that albumin, alpha 1-antitrypsin, alpha2-macroglobulin, apolipoprotein A-I, apolipoprotein A-II,haptoglobin-related protein, and serotransferrin have highaffinity to ProteoMiner [21]. In addition, Beseme et al. iden-tified apolipoprotein A-IV, apolipoprotein D, apolipopro-tein E, ceruloplasmin, complement C3, fibrinogen beta,fibrinogen gamma, ficolin-2, ficolin-3, paroxonase I, pro-thrombin, transthyretin, and vitronectin [23]. The proteinconcentrations identified in this study are summarized inSupplementary Table 6. According to the literatures, theidentified proteins were classified as high- and medium-abundance proteins. Adiponectin and the carboxypeptidaseN catalytic chain are not reported in previous studies, inwhich ProteoMiner-treated samples were examined by 2D-PAGE and mass spectrometry.
Adiponectin is an adipocytokine [24–27] and plays aprotective role against obesity-related disorders such asmetabolic syndrome [28], type 2 diabetes [29], and cardio-vascular disease [30]. Low levels of plasma adiponectin areassociated with obesity [31] and many types of malignanciessuch as liver cancer [32], breast cancer [33], pancreatic cancer[34], and endometrial cancer [35]. An epidemiological studysuggested that adiponectin is involved in early colorectalcarcinogenesis [36], and that a low circulating adiponectinlevel is correlated with a poor prognosis in patients withcolorectal cancer [37]. The molecular backgrounds of theseobservations may be attributable to the antiproliferativeeffects of adiponectin on cancer cells [38].
Carboxypeptidase N (CPN), which is also known as kin-inase I, arginine carboxypeptidase, and anaphylatoxin inac-tivator, is a zinc finger metalloprotease. It cleaves basic lysineand arginine residues from the carboxy terminal of proteins[39]. CPN is produced in the liver and secreted into theplasma. It modulates the activity of cytokines such as stromalcell-derived factor-1 alpha [40]. The association of CPN1with malignancy and other diseases has not been reported,and the clinical utility of CPN1 has not been suggested.
The working hypothesis of this study was that the com-bined use of different separation methods, including a solid-phase hexapeptide ligand library, would increase the numberof observable proteins, and finally visualize the proteomethat may not be observed otherwise. By loading a highamount of protein and using extensive prefractionation tech-niques prior to using ProteoMiner, trace proteins becamevisible in SDS-PAGE, and the number of protein spots on
International Journal of Proteomics 7
(a) (b) (c)
(d) (e) (f)
(g) (h) (i)
(j) (k)
Figure 3: Effects of ProteoMiner treatment were examined by 2D-DIGE. The ProteoMiner-treated and untreated samples were labeled withCy3 and Cy5, respectively, mixed, and separated by 2D gel electrophoresis. Note that a significant number of protein spots showed differentintensities between the 2 samples. The dye-swapped images are shown in Supplementary Figure 2. (a) Original plasma; (b) flow-throughfraction of HiTrap Blue HP column; (c) binding fraction of HiTrap Blue HP column. (d) Flow-through fraction of HiTrap Protein G HPcolumn. (e) Binding fraction of HiTrap Protein G HP column; 0 mM fraction. (f) 100 mM fraction. (g) 150 mM. (h) 200 mM. (i) 250 mM.(j) 1 M fraction. (k) Resource Q column.

8 International Journal of Proteomics
697/538
1322
2003
2938
27032670
271526642936
2937
2923
297029621250
2963 12911266
(a)
878/698
775
200619607921748
813
18592078
1895
1894
1714 1893 1416
1920
17321627
(b)
786/725
1832
440
1840
15201514
15111498
1503275
151914991852
1784 1841
586
(c)
877/667
25291914
25342165 2536 2571
240 2307303
569564
2498
1319
2559251325732515
12721284 1285
25091255
1084
(d)
288/284
(e)
668/445
720
7451570
154115431545
1549 1452
15621509 1205
1551
(f)
556/431
1034
16841689 10501526
1707
1393
16751657 1648
1651
(g)
578/550
1085
2092
15621506
1312
581 586
879
846
860
1359
(h)
Figure 4: Continued.
International Journal of Proteomics 9
738/598
9841492
1519909
1953 899
147019422005
1926
2007
1960
(i)
1014/670
915
983 1763
1764
1192
914
(j)
950/784
13332135
2119
394815
1935
(k)
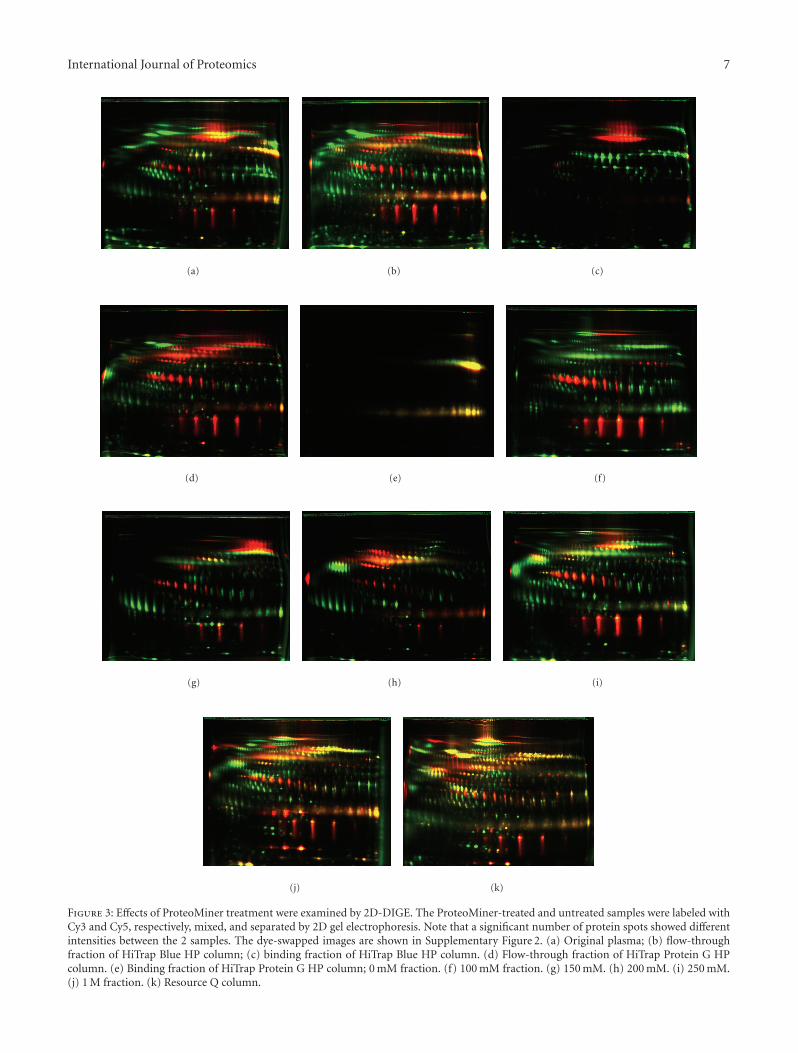
Figure 4: Localization of protein spots showing different intensities between the ProteoMinor-treated and untreated samples. Panels (a–k)correspond to those in Figure 3. The protein spot numbers corresponds to those in Supplementary Tables 5 and 6. −/−: number of proteinspots without ProteoMiner treatment/those with ProteoMiner treatment.
2D-DIGE increased significantly. This approach may pavea way to a novel strategy for intact plasma proteomics. Incontrast, the present results of mass spectrometric proteinidentification did not support the use of a solid-phasehexapeptide ligand library to enrich low-abundance pro-teins. It may be because our present approach had 3 limita-tions. First, mass spectrometric identification was performedfor proteins with a greater prominent difference betweenthe samples with or without ProteoMiner treatment, andonly 128 of 200 proteins were successfully identified (Sup-plementary Table 4), probably because of the low proteinamount. Proteins with a smaller difference or amount mayinclude trace proteins. Although we optimized the protocolsfor mass spectrometric protein identification because thesensitivity of the fluorescent dye in the 2D-DIGE was veryhigh, not all protein spots on 2D-DIGE could be identifiedby mass spectrometry. To evaluate enriched proteins, thecomplementary use of an LC-MS/MS shotgun approach maybe worth considering. Second, proteins from ProteoMinerwere recovered by a single-step elution with 8 M urea, 2%CHAPS, and 5% acetic acid, according to the manufacturer’sinstructions (Bio-Rad). However, because proteins may haveinteracted with hexapeptide ligand libraries in all possible
modes, the absolute elution process may require sequentialsteps or more stringent buffer conditions such as boiling10% SDS with 3% DTE [41]. Furthermore, various bindingconditions may also be worth considering to capture wholebinding proteins [9]. Third, considering the practical use oftrace proteins in a biomarker study, we used as much sampleas possible for identifying them and examined 10 mL plasmasamples as an initial source. However, a larger volume ofplasma sample, such as 100 mL, might be needed to collectrare proteins. In practice, such a high volume of plasma israrely obtained for many cases in biomarker studies, andwe may need to optimize the protocols for use of 10 mLplasma. For instance, we identify the biomarker candidatesusing 100 mL plasma, and using specific antibody against theidentified candidate, we will be able to screen a relatively largenumber of samples with 10 mL volume or less.
The combined use of the ProteoMiner and the proteomicmodalities in this study may enable the quantitative compar-ison for biomarker studies. We demonstrated that the liquidchromatography was quantitatively reproducible (Supple-mentary Figure 1), and the quantitative reproducibility ofthe ProteoMiner and 2D-DIGE was previously reported [10,17]. We may further need to examine how the combined
10 International Journal of Proteomics
use of such reproducible methods generate the results in areproducible way, considering the degree of differences thatwe expect between the samples to be compared.
4. Conclusions
The use of ProteoMiner in combination with conventionalproteomic modalities such as depletion and anion-exchangecolumns significantly enhanced trace proteins on SDS-PAGEand increased the number of protein spots on 2D-DIGE,suggesting that the use of a solid-phase hexapeptide ligandlibrary has great potential for intact plasma proteomics. Massspectrometric protein identification revealed that high- andmiddle-abundance proteins were enriched by ProteoMiner,and the characteristics of proteins with unique affinity to asolid-phase hexapeptide ligand library remain to be clarifiedby more extensive mass spectrometric protein identification.Although use of ProteoMiner for biomarker studies is quitefeasible and attractive, more extensive characterization ofbinding proteins and optimized protocols are required forlarge-scale biomarker studies.
Acknowledgments
This paper was supported by the Ministry of Health,Labor, and Welfare and by the Program for Promotion ofFundamental Studies in Health Sciences of the Organizationfor Pharmaceutical Safety and Research of Japan, T. Kondowas a principal funding recipient. The authors report noconflicts of interests.
References
[1] S. M. Hanash, S. J. Pitteri, and V. M. Faca, “Mining the plasmaproteome for cancer biomarkers,” Nature, vol. 452, no. 7187,pp. 571–579, 2008.
[2] Z. Zhang and D. W. Chan, “The road from discovery to clinicaldiagnostics: lessons learned from the first FDA-cleared in vitrodiagnostic multivariate index assay of proteomic biomarkers,”Cancer Epidemiology Biomarkers and Prevention, vol. 19, no.12, pp. 2995–2999, 2010.
[3] H. Zhang, A. Y. Liu, P. Loriaux et al., “Mass spectrometricdetection of tissue proteins in plasma,” Molecular and CellularProteomics, vol. 6, no. 1, pp. 64–71, 2007.
[4] Q. Zhang, V. Faca, and S. Hanash, “Mining the plasmaproteome for disease applications across seven logs of proteinabundance,” Journal of Proteome Research, vol. 10, no. 1, pp.46–50, 2011.
[5] P. G. Righetti, E. Boschetti, L. Lomas, and A. Citterio, “Proteinequalizer technology : the quest for a “democratic proteome”,”Proteomics, vol. 6, no. 14, pp. 3980–3992, 2006.
[6] V. Thulasiraman, S. Lin, L. Gheorghiu et al., “Reduction of theconcentration difference of proteins in biological liquids usinga library of combinatorial ligands,” Electrophoresis, vol. 26, no.18, pp. 3561–3571, 2005.
[7] P. G. Righetti, A. Castagna, P. Antonioli, and E. Boschetti,“Prefractionation techniques in proteome analysis: the miningtools of the third millennium,” Electrophoresis, vol. 26, no. 2,pp. 297–319, 2005.
[8] P. G. Righetti, A. Castagna, F. Antonucci et al., “Proteomeanalysis in the clinical chemistry laboratory: myth or reality?”Clinica Chimica Acta, vol. 357, no. 2, pp. 123–139, 2005.
[9] P. G. Righetti, E. Boschetti, A. Zanella, E. Fasoli, and A.Citterio, “Plucking, pillaging and plundering proteomes withcombinatorial peptide ligand libraries,” Journal of Chromatog-raphy A, vol. 1217, no. 6, pp. 893–900, 2010.
[10] L. Sennels, M. Salek, L. Lomas, E. Boschetti, P. G. Righetti,and J. Rappsilber, “Proteomic analysis of human blood serumusing peptide library beads,” Journal of Proteome Research, vol.6, no. 10, pp. 4055–4062, 2007.
[11] J. E. Bandow, “Comparison of protein enrichment strategiesfor proteome analysis of plasma,” Proteomics, vol. 10, no. 7,pp. 1416–1425, 2010.
[12] C. Sihlbom, I. Kanmert, H. Von Bahr, and P. Davidsson,“Evaluation of the combination of bead technology withSELDI-TOF-MS and 2-D DIGE for detection of plasmaproteins,” Journal of Proteome Research, vol. 7, no. 9, pp. 4191–4198, 2008.
[13] E. Ernoult, A. Bourreau, E. Gamelin, and C. Guette, “A pro-teomic approach for plasma biomarker discovery with iTRAQlabelling and OFFGEL fractionation,” Journal of Biomedicine& Biotechnology, vol. 2010, Article ID 927917, 8 pages, 2010.
[14] J. S. K. Au, W. C. S. Cho, T. T. Yip et al., “Deep proteomeprofiling of sera from never-smoked lung cancer patients,”Biomedicine and Pharmacotherapy, vol. 61, no. 9, pp. 570–577,2007.
[15] C. Marrocco, S. Rinalducci, A. Mohamadkhani, G. M.D’Amici, and L. Zolla, “Plasma gelsolin protein: a candidatebiomarker for hepatitis B-associated liver cirrhosis identifiedby proteomic approach,” Blood Transfusion, vol. 8, supplement3, pp. s105–s112, 2010.
[16] M. Gatto, M. C. Bragazzi, R. Semeraro et al., “Cholangiocar-cinoma: update and future perspectives,” Digestive and LiverDisease, vol. 42, no. 4, pp. 253–260, 2010.
[17] T. Kondo and S. Hirohashi, “Application of highly sensitivefluorescent dyes (CyDye DIGE Fluor saturation dyes) tolaser microdissection and two-dimensional difference gelelectrophoresis (2D-DIGE) for cancer proteomics,” NatureProtocols, vol. 1, no. 6, pp. 2940–2956, 2007.
[18] T. Okano, T. Kondo, T. Kakisaka et al., “Plasma proteomicsof lung cancer by a linkage of multi-dimensional liquidchromatography and two-dimensional difference gel elec-trophoresis,” Proteomics, vol. 6, no. 13, pp. 3938–3948, 2006.
[19] T. Kakisaka, T. Kondo, T. Okano et al., “Plasma proteomicsof pancreatic cancer patients by multi-dimensional liquidchromatography and two-dimensional difference gel elec-trophoresis (2D-DIGE): Up-regulation of leucine-rich alpha-2-glycoprotein in pancreatic cancer,” Journal of Chromatogra-phy B, vol. 852, no. 1-2, pp. 257–267, 2007.
[20] N. Zolotarjova, J. Martosella, G. Nicol, J. Bailey, B. E. Boyes,and W. C. Barrett, “Differences among techniques for high-abundant protein depletion,” Proteomics, vol. 5, no. 13, pp.3304–3313, 2005.
[21] R. C. Dwivedi, O. V. Krokhin, J. P. Cortens, and J. A. Wilkins,“Assessment of the reproducibility of random hexapeptidepeptide library-based protein normalization,” Journal of Pro-teome Research, vol. 9, no. 2, pp. 1144–1149, 2010.
[22] E. Mouton-Barbosa, F. Roux-Dalvai, D. Bouyssie et al., “In-depth exploration of cerebrospinal fluid by combining peptideligand library treatment and label-free protein quantification,”Molecular and Cellular Proteomics, vol. 9, no. 5, pp. 1006–1021,2010.
[23] O. Beseme, M. Fertin, H. Drobecq, P. Amouyel, and F.Pinet, “Combinatorial peptide ligand library plasma treat-ment: advantages for accessing low-abundance proteins,”Electrophoresis, vol. 31, no. 16, pp. 2697–2704, 2010.

International Journal of Proteomics 11
[24] P. E. Scherer, S. Williams, M. Fogliano, G. Baldini, and H.F. Lodish, “A novel serum protein similar to C1q, producedexclusively in adipocytes,” Journal of Biological Chemistry, vol.270, no. 45, pp. 26746–26749, 1995.
[25] E. Hu, P. Liang, and B. M. Spiegelman, “AdipoQ is a noveladipose-specific gene dysregulated in obesity,” Journal ofBiological Chemistry, vol. 271, no. 18, pp. 10697–10703, 1996.
[26] K. Maeda, K. Okubo, I. Shimomura, T. Funahashi, Y. Mat-suzawa, and K. Matsubara, “cDNA cloning and expression ofa novel adipose specific collagen-like factor, apM1 (adiposemost abundant gene transcript 1),” Biochemical and Biophys-ical Research Communications, vol. 221, no. 2, pp. 286–289,1996.
[27] Y. Nakano, T. Tobe, N. H. Choi-Miura, T. Mazda, and M.Tomita, “Isolation and characterization of GBP28, a novelgelatin-binding protein purified from human plasma,” Journalof Biochemistry, vol. 120, no. 4, pp. 803–812, 1996.
[28] Y. Matsuzawa, T. Funahashi, S. Kihara, and I. Shimo-mura, “Adiponectin and metabolic syndrome,” Arteriosclerosis,Thrombosis, and Vascular Biology, vol. 24, no. 1, pp. 29–33,2004.
[29] J. Spranger, A. Kroke, M. Mohlig et al., “Adiponectin andprotection against type 2 diabetes mellitus,” The Lancet, vol.361, no. 9353, pp. 226–228, 2003.
[30] D. M. Maahs, L. G. Ogden, G. L. Kinney et al., “Low plasmaadiponectin levels predict progression of coronary arterycalcification,” Circulation, vol. 111, no. 6, pp. 747–753, 2005.
[31] E. E. Calle, C. Rodriguez, K. Walker-Thurmond, and M. J.Thun, “Overweight, obesity, and mortality from cancer ina prospectively studied cohort of U.S. Adults,” New EnglandJournal of Medicine, vol. 348, no. 17, pp. 1625–1638, 2003.
[32] T. Arano, H. Nakagawa, R. Tateishi et al., “Serum level ofadiponectin and the risk of liver cancer development inchronic hepatitis C patients,” International Journal of Cancer,vol. 129, no. 9, pp. 2226–2235, 2011.
[33] C. Duggan, M. L. Irwin, L. Xiao et al., “Associations of insulinresistance and adiponectin with mortality in women withbreast cancer,” Journal of Clinical Oncology, vol. 29, no. 1, pp.32–39, 2011.
[34] T. Krechler, M. Zeman, M. Vecka et al., “Leptin andadiponectin in pancreatic cancer: connection with diabetesmellitus,” Neoplasma, vol. 58, pp. 58–64, 2011.
[35] P. T. Soliman, X. Cui, Q. Zhang, S. E. Hankinson, and K. H.Lu, “Circulating adiponectin levels and risk of endometrialcancer: the prospective nurses’ health study,” American Journalof Obstetrics and Gynecology, vol. 204, no. 2, pp. 167.e1–167.e5,2011.
[36] T. Yamaji, M. Iwasaki, S. Sasazuki, and S. Tsugane, “Interactionbetween adiponectin and leptin influences the risk of colorec-tal adenoma,” Cancer Research, vol. 70, no. 13, pp. 5430–5437,2010.
[37] P. Ferroni, R. Palmirotta, A. Spila et al., “Prognostic sig-nificance of adiponectin levels in non-metastatic colorectalcancer,” Anticancer Research, vol. 27, no. 1 B, pp. 483–489,2007.
[38] G. Li, L. Cong, J. Gasser, J. Zhao, K. Chen, and F. Li, “Mecha-nisms underlying the anti-proliferative actions of adiponectinin human breast cancer cells, MCF7-dependency on thecAMP/protein Kinase-A pathway,” Nutrition and Cancer, vol.63, no. 1, pp. 80–88, 2011.
[39] R. A. Skidgel, G. B. McGwire, and X. Y. Lix, “Membraneanchoring and release of carboxypeptidase M: implications forextracellular hydrolysis of peptide hormones,” Immunophar-macology, vol. 32, no. 1-3, pp. 48–52, 1996.
[40] D. A. Davis, K. E. Singer, M. De La Luz Sierra et al., “Identi-fication of carboxypeptidase N as an enzyme responsible forC-terminal cleavage of stromal cell-derived factor-1α in thecirculation,” Blood, vol. 105, no. 12, pp. 4561–4568, 2005.
[41] G. Candiano, V. Dimuccio, M. Bruschi et al., “Combinatorialpeptide ligand libraries for urine proteome analysis: investiga-tion of different elution systems,” Electrophoresis, vol. 30, no.14, pp. 2405–2411, 2009.

Submit your manuscripts athttp://www.hindawi.com
Hindawi Publishing Corporationhttp://www.hindawi.com Volume 2014
Anatomy Research International
PeptidesInternational Journal of
Hindawi Publishing Corporationhttp://www.hindawi.com Volume 2014
Hindawi Publishing Corporation http://www.hindawi.com
International Journal of
Volume 2014
Zoology
Hindawi Publishing Corporationhttp://www.hindawi.com Volume 2014
Molecular Biology International
GenomicsInternational Journal of
Hindawi Publishing Corporationhttp://www.hindawi.com Volume 2014
The Scientific World JournalHindawi Publishing Corporation http://www.hindawi.com Volume 2014
Hindawi Publishing Corporationhttp://www.hindawi.com Volume 2014
BioinformaticsAdvances in
Marine BiologyJournal of
Hindawi Publishing Corporationhttp://www.hindawi.com Volume 2014
Hindawi Publishing Corporationhttp://www.hindawi.com Volume 2014
Signal TransductionJournal of
Hindawi Publishing Corporationhttp://www.hindawi.com Volume 2014
BioMed Research International
Evolutionary BiologyInternational Journal of
Hindawi Publishing Corporationhttp://www.hindawi.com Volume 2014
Hindawi Publishing Corporationhttp://www.hindawi.com Volume 2014
Biochemistry Research International
ArchaeaHindawi Publishing Corporationhttp://www.hindawi.com Volume 2014
Hindawi Publishing Corporationhttp://www.hindawi.com Volume 2014
Genetics Research International
Hindawi Publishing Corporationhttp://www.hindawi.com Volume 2014
Advances in
Virolog y
Hindawi Publishing Corporationhttp://www.hindawi.com
Nucleic AcidsJournal of
Volume 2014
Stem CellsInternational
Hindawi Publishing Corporationhttp://www.hindawi.com Volume 2014
Hindawi Publishing Corporationhttp://www.hindawi.com Volume 2014
Enzyme Research
Hindawi Publishing Corporationhttp://www.hindawi.com Volume 2014
International Journal of
Microbiology