Embed Size (px)
Citation preview
This is a repository copy of Combining density functional theory (DFT) and collision cross-section (CCS) calculations to analyze the gas-phase behaviour of small molecules and their protonation site isomers.
White Rose Research Online URL for this paper:http://eprints.whiterose.ac.uk/105281/
Version: Accepted Version
Article:
Boschmans, J, Jacobs, S, Williams, JP et al. (7 more authors) (2016) Combining density functional theory (DFT) and collision cross-section (CCS) calculations to analyze the gas-phase behaviour of small molecules and their protonation site isomers. Analyst, 141 (13). pp. 4044-4054. ISSN 0003-2654
https://doi.org/10.1039/c5an02456k
[email protected]://eprints.whiterose.ac.uk/
Reuse
Unless indicated otherwise, fulltext items are protected by copyright with all rights reserved. The copyright exception in section 29 of the Copyright, Designs and Patents Act 1988 allows the making of a single copy solely for the purpose of non-commercial research or private study within the limits of fair dealing. The publisher or other rights-holder may allow further reproduction and re-use of this version - refer to the White Rose Research Online record for this item. Where records identify the publisher as the copyright holder, users can verify any specific terms of use on the publisher’s website.
Takedown
If you consider content in White Rose Research Online to be in breach of UK law, please notify us by emailing [email protected] including the URL of the record and the reason for the withdrawal request.
Combining density functional theory (DFT) and collision cross-section 1
(CCS) calculations to analyze the gas-phase behaviour of small 2
molecules and their protonation site isomers 3
4
Jasper Boschmans1, Sam Jacobs2, Jonathan P. Williams3, Martin Palmer3, Keith 5
Richardson3, Kevin Giles3, Cris Lapthorn4, Wouter A. Herrebout2, Filip Lemière1, Frank 6
Sobott1,5,6
7
8
1Biomolecular & Analytical Mass Spectrometry group, Department of Chemistry, 9
University of Antwerp, Antwerp, Belgium, 2Molecular Spectroscopy group, Department of 10
Chemistry, University of Antwerp, Antwerp, Belgium, 3Waters Corporation, Stamford 11
Avenue, Wilmslow, SK9 4AX, UK, 4Faculty of Engineering & Science, University of 12
Greenwich, Medway Campus, Chatham, ME4 4TB, UK, 5Astbury Centre for Structural 13
Molecular Biology, University of Leeds, Leeds LS2 9JT, UK, 6School of Molecular and 14
Cellular Biology, University of Leeds, LS2 9JT, UK 15
16
17
18
1. Abstract 19
20
Electrospray ion mobility-mass spectrometry (IM-MS) data show that for some small 21
molecules, two (or even more) ions with identical sum formula and mass, but distinct drift 22
times are observed. In spite of showing their own unique and characteristic fragmentation 23
spectra in MS/MS, no configurational or constitutional isomers are found to be present in 24
solution. Instead the observation and separation of such ions appears to be inherent to 25
their gas-phase behaviour during ion mobility experiments. The origin of multiple drift 26
times is thought to be the result of protonation site isomers (‘protomers’). Although some 27
important properties of protomers have been highlighted by other studies, correlating the 28
experimental collision cross-sections (CCS) with calculated values has proven to be a 29
major difficulty. As a model, this study uses the pharmaceutical compound melphalan and 30
a number of related molecules with alternative (gas-phase) protonation sites. Our study 31
combines density functional theory (DFT) calculations with modified MobCal methods 32
(e.g. nitrogen-based Trajectory Method algorithm) for the calculation of theoretical CCS 33
values. Calculated structures can be linked to experimentally observed signals, and a 34
strong correlation is found between the difference of the calculated dipole moments of the 35
protomer pairs and their experimental CCS separation. 36
37
38
39
2. Introduction 40
41
Ion mobility-mass spectrometry (IM-MS) is a separation and characterization technique 42
that has proven to be applicable in many research fields since it started to gain popularity 43
more than a decade ago with the introduction of the commercial Synapt system1. The drift 44
time in ion mobility is determined by the collision cross-section (CCS) of an ion, which is a 45
parameter related to its size, shape and charge. Originally used in structural studies 46
investigating protein folding2-9 and protein complexes10-15, more and more researchers 47
are starting to use commercial IM-MS instrumentation to investigate the separation, 48
identification and gas-phase behaviour of small molecules. A possible application is the 49
rapid separation of all types of isomers, based on their mobilities (drift times)16-24. 50
Recently, a number of ion mobility studies have reported on the observation of protomers 51
for aniline and the antibacterial agent norfloxacin25-27. These isobaric ions are gas-phase 52
protonation site isomers, where the protons are located on different atoms. Although the 53
position of a single H atom and the positive charge appear to have a very subtle effect on 54
these small molecules, they can cause clear differences in drift times. Such differences 55
can be relatively large for small molecules, and one would therefore typically expect that 56
they are due to the presence of isomers or conformers (i.e. size and shape differences). 57
In a recent study, Warnke et al. used IM-MS in combination with infrared multiple photon 58
dissociation (IRMPD) spectroscopy to study the origin of benzocaine protomers28. 59
Differences in N-H and O-H stretch vibrations showed that two alternative sites are 60
protonated: the amine and, unexpectedly, also the carbonyl group. These data confirm 61
that the large difference between the observed CCS values for this compound is caused 62
by the different charge sites, rather than e.g. the consequence of a subsequent 63
gas-phase rearrangement reaction. The appearance of alternative gas-phase protonation 64
sites highlights the possibility of intra-molecular charge transfer during the electrospray 65
process28. Anionic species show similar phenomena, as was recently reported by 66
Galaverna et al. for benzoic acid de-protomers29. It also questions the localization of 67
charges in multiply protonated peptide and protein ions, important for computational 68
structure and fragmentation prediction, which are frequently assumed to remain on basic, 69
surface-exposed residues such as lysine and arginine during the ESI process. 70
71
Computational methods, such as molecular dynamics and quantum mechanical 72
calculations, can support IM-MS observations (see Figure 1). These methods have 73
become important tools for understanding and interpreting the experimental data, and 74
they can potentially also be used to predict the separation of hypothetical charge isomers 75
in ion mobility30,31. Interpretation of ion mobility data typically requires a conformational 76
analysis of each protomer, after which all structures are optimized using DFT. This yields 77
a set of geometries and associated partial atomic charges that can be used to compute 78
the corresponding CCS values. 79
In this study we utilised the MobCal software32, which provides three different algorithms; 80
the Projection Approximation (PA), Exact Hard Sphere Scattering (EHSS) and the 81
Trajectory Method (TM). Of these, the most widely used are the PA and TM. In both the 82
PA and EHSS methods the molecule is represented as a collection of overlapping hard 83
spheres. The CCS calculated by the PA is simply the rotational average of the projected 84
area of this collection. While fast, the PA fails to model momentum transfer between the 85
gas and analyte molecules as well as concave analyte structure and long range ion 86
molecule interactions. In the EHSS method, a full hard sphere trajectory is calculated for 87
each analyte-gas collision. This is a significantly more sophisticated model, and it has 88
found utility as a fast method for calculating CCS of large molecular structures33. 89
Long-range interactions, which are often significant for drug-like molecules, are 90
necessarily ignored. The TM is the most sophisticated and computationally intensive of 91
the commonly used methods. It involves a simulation of the trajectory of gas atoms 92
through a superposition of Lennard-Jones potentials corresponding to the atoms in the 93
analyte molecule. Polarisation of the gas molecules by the charge on the analyte 94
molecule is also taken into account, but modifications to the original algorithm are 95
required to adequately model interactions with polyatomic gases. More recently, the 96
Projected Superposition Approximation (PSA) algorithm was introduced by Bleiholder et. 97
al.34-38 In this approach, which is used mainly for larger molecules, the PA cross section is 98
modified to take into account the detailed three-dimensional structure of the analyte. 99
Although previous studies of protomers made use of methods originally available in 100
MobCal, they were not always able to accurately reproduce the experimental CCS 101
values25,27. It is believed that IM-MS separations using polyatomic drift gases (such as N2 102
or CO2) require a better representation of long-range interactions. The passage of a 103
charged particle induces higher-order multipoles in the gas molecules, leading to 104
additional (retarding) forces on the ion, and more collision geometries must be 105
considered. Kim et al. proposed a modification to the existing trajectory method CCS 106
calculation algorithms for N2, which takes ion-quadrupole interactions and the orientation 107
of non-spherical gas molecules into account40,41. This modification leads to significantly 108
higher calculated CCS values, which better conform to the experimentally determined 109
data. Only a few studies have used this new approach so far to correctly reproduce 110
experimental CCS values28,30,31,40-42. Apart from protomer-related studies, Lavanant et al. 111
used the modified algorithm to calculate CCS values for phosphoric acid clusters, which 112
can be used for negative ion mode IM calibrations43. 113
114
The present study investigates 1. the experimental separation of hypothetical protomers 115
for 7 related compounds which share an amino and carbonyl function (in aniline, a 116
benzene ring) as alternative protonation sites; 2. the effect of using different levels of 117
theory for optimization of molecular geometry and charge distribution, 3. the ability to 118
obtain theoretical CCS that closely match experimental values; 4. the importance of the 119
analyte charge distribution itself (and the resulting dipole moment) in contrast to possible 120
charge-driven changes in molecular structure, and 5. the ability to predict protomer 121
separation in ion mobility experiments based on the difference in the calculated molecular 122
dipole moments for hypothetical protomer pairs. This study tests the hypothesis that 123
experimentally found protomers can be predicted reasonably well by differences in the 124
calculated dipole moments. The results reported here inform choices of computational 125
approaches for the prediction of protomer separation in ion mobility so that spectral 126
interpretation software (e.g. in metabolomics) could be trained to detect such 127
phenomena. 128
129
130
131
3. Results and discussion 132
133
3.1 IM-MS separation of protonation site isomers 134
Two distinct peaks are observed in the arrival time distribution (ATD) of melphalan (m/z 135
305) using nitrogen as drift gas: I’ and I” (see Figure 2), which are centred around 169.9 136
Å2 and 179.1 Å2. However, for two other, closely related compounds, 137
dimethoxymelphalan (DOCH3; II) and dihydroxymelphalan (DOH; III), we observe only 138
single and unique peaks (Figure 2), at 172.2 Å2 for DOCH3 and 165.3 Å2 for DOH. We 139
also used CO2 to perform ion mobility separations of DOCH3 and DOH, but again only 140
single peaks were observed (data not shown). 141
Similar observations to those with melphalan were made for the local anaesthetic 142
para-benzocaine, an ethyl ester derivative of para-aminobenzoic acid (Figure 3). Two 143
peaks were found (IV’ and IV”) at 131.7 Å2 and 147.5 Å2. For comparison, positional 144
isomers of benzocaine were also studied (Figure 3): ethyl 2-aminobenzoate 145
(“ortho-benzocaine”) and ethyl 3-aminobenzoate (“meta-benzocaine”). The selected-ion 146
ATD of ortho-benzocaine shows only one peak at 135.2 Å2 (V). For meta-benzocaine, two 147
peaks are observed (VI’ and VI”) which correspond to CCS values of 133.6 Å2 and 146.4 148
Å2. For aniline, which we included here as a reference compound, we find two peaks as 149
reported previously25 (VII’ and VII”; see Figure 3), with CCS values of 112.9 Å2 and 118.9 150
Å2. Table 1 summarizes all experimental CCS values. 151
152
3.2 Calculating CCS values of melphalan protomers 153
Three possible protomers of melphalan were taken into account here: protonation at the 154
nitrogen atom of the NH2 group (NAA), the carboxyl group (OCO) on the amino acid side, 155
and the nitrogen atom adjacent to the phenyl ring on the chloroethyl side (NCl). Based on 156
the solution basicity (i.e. pKa) of the various functional groups in melphalan44, OCO and NCl 157
protonation seem less plausible (see Figure 2). Nonetheless, other protomer studies 158
have reported on oxygen-rich functional groups or even aromatic rings25-28 as preferred 159
protonation sites. After performing a conformational analysis of melphalan and 160
subsequent DFT optimisation at the B3LYP/6-31G(d,p) level (hereafter referred to as 161
“standard” level), the CCS values for the optimised structures were calculated using a 162
modified version of MobCal where the TM code optimized for use with nitrogen (see 163
Figure 1). Table 2 gives an overview of the top 5 lowest-energy conformers of each 164
melphalan protomer, together with energies, overall Boltzmann weights, dipole moments 165
and calculated CCS values. Figure 4 visualizes the conformation and molecular 166
electrostatic potential (MEP) of each lowest-energy melphalan protomer. 167
From the three protomers considered here, the NAA and NCl forms best match the 168
experimentally determined CCSN2. This would indicate that the OCO protomer is not 169
observed during the ion mobility experiments. The ∆CCSN2 between the calculated NAA 170
and NCl protomers is 9.0 Å2, which is a good match with the experimentally determined 171
value of 9.2 Å2. 172
173
3.3 Melphalan-related compounds: dihydroxymelphalan and dimethoxymelphalan 174
The study of melphalan derivatives, which unlike melphalan itself show only one 175
observed drift time, allows us to investigate the factors that govern formation and 176
separation of melphalan protomers more closely. A conformational analysis was 177
performed for possible protomers of these compounds, and the resulting structures were 178
optimised at “standard” level. Although DOH and DOCH3 are chemically less complex 179
structures than melphalan itself (i.e. no halogen atoms), the additional rotational flexibility 180
yields more conformers and thus entails an added computational cost. For each 181
lowest-energy protomer, the values are reported in Table 3 and structures are given in 182
Figure 2. Calculated CCS values were also compared to the experimentally derived ones 183
(172.2 Å2 for DOCH3 and 165.3 Å2 for DOH). This allows us to evaluate the 184
nitrogen-modified MobCal code, but could also show whether significantly different CCS 185
values are calculated for protomers in cases where they are not experimentally resolved. 186
The NAA protomer for DOH has a considerably smaller calculated CCS (156.1 Å2) than the 187
experimentally observed value. The CCS of the NOH protomer on the other hand (164.6 188
Å2) is a close match with the experiment. For DOCH3, the calculated CCS values of both 189
hypothetical protomers (181.3 Å2 and 182.3 Å2) over-estimate the experimental CCS of 190
172.2 Å2. 191
192
3.4 Other related small molecules: benzocaine isomers and aniline 193
Our calculation strategy was further evaluated against experimentally determined CCS 194
values of benzocaine isomers and aniline (Table 4). For para-benzocaine, protonation of 195
the carbonyl group gives a CCSN2 of 132.0 Å2 for the lowest-energy structure after 196
standard-level optimization, while the equivalent procedure for the amine-protonated 197
species results in a CCSN2 value of 140.9 Å2, which is significantly smaller than the 198
experimental value (147.5 Å2). While the theory correctly predicts the separation of the 199
two protomers, it remains unclear why the calculated value for the amine-protonated 200
para-benzocaine deviates so much from the experiment. 201
After standard-level optimization, OCO and NNH2 protomers of ortho-benzocaine have 202
computed CCS values of 131.0 and 131.5 Å2, respectively. Based on these values, 203
assignment of the single experimentally observed peak to either protomer is difficult, as 204
they are expected to be almost indistinguishable. It is therefore impossible to say whether 205
they both occur in the gas phase, with their peaks overlapping, or if only one of them is 206
present. In this context it is worth noting that a recent report proposed the two alternative 207
forms of deprotonated ortho-hydroxybenzoic acid to be connected by a relatively low 208
isomerization barrier29. It might therefore be considered likely that the protomers of 209
ortho-benzocaine could also easily convert due to intramolecular H-bonding, leading to 210
only one mobility signal. 211
Two distinct CCS values are calculated after standard-level optimization for 212
meta-benzocaine: 133.9 Å2 for the OCO isomer and 140.8 Å2 for the NNH2 protomer. While 213
such calculations predict reasonably well if the postulated protomers will be separated by 214
ion mobility (one or two peaks expected), the absolute CCS values do not always match 215
well with the measured ones, e.g. for the NNH2 form of meta-benzocaine. 216
The calculated CCS value of the N protomer of aniline (at “standard” level) is also not well 217
matched with either of the experimental values (112.9 Å2 and 118.0 Å2). The 218
ring-protonated species should be assigned to the first peak in the ATD, based on data 219
reported in the literature25. 220
221
3.5 Evaluating different levels of DFT calculations 222
Although the majority of ion mobility studies employ the commonly used B3LYP functional 223
with 6-31G or 6-311G basis sets, a wide variety of other functionals and basis sets are 224
available. Because the CCS values computed so far, using the “standard” level combined 225
with the N2-modified MobCal code, still show some discrepancies with the experiment, we 226
also used B3PW91/def2-TVZP (hereafter called “high” level) in order to assess how 227
sensitive the computed values are to the DFT parameters. Tables 1, 3 and 4 and Figures 228
S.2 to S.9 contrast “standard” with high-level calculated CCS values. 229
For the benzocaine isomers and aniline, we found that the high-level calculations yield 230
generally better matches against the experimental values (Table 1). 231
Both postulated protomers of DOH are found to have similar CCS at “high” level, which 232
also closely match the single observed peak centred at 165.3 Å2. The “standard” level 233
result, where the CCS value for the NAA protomer was underestimated (156.1 Å2), falsely 234
suggested that two distinct DOH protomers should exist, with a ∆CCSN2 of 8.5 Å2 (Table 235
3). 236
For the DOCH3 form of melphalan on the other hand, the CCS values calculated at both 237
levels of structural optimization (around 180 Å2) are significantly higher than the 238
measured one (172.2 Å2). It is not apparent though why CCS calculations for this 239
compound deviate so much from the experiment. 240
For melphalan itself, the expected improvement in the theoretical values is also less 241
pronounced when using the B3PW91 functional and larger basis set. Notably the CCS of 242
the NCl protomer is now overestimated: 170.6 Å2 (“standard” level) vs. 174.1 A2 (“high” 243
level). Since the experimentally derived value for this protomer is 169.9 Å2, the “standard” 244
level result is in better agreement in this particular case. While the reason for this anomaly 245
is not entirely clear, melphalan stands out as a compound with the highest conformational 246
“flexibility” (see below) in the group studied here. 247
We show here that for a number of structurally related compounds, the calculation of 248
“best” molecular geometries and charge distributions using two different levels of DFT 249
calculations leads to mixed results, with respect to how well the derived CCS match with 250
experimentally observed CCS (see Figure 5). Contrary to what we might have expected, 251
the high-level calculations do not always agree better with experiment. A more thorough 252
investigation of different basis sets and functionals is needed, as well as a 253
re-parametrization of CCS calculation methods, which currently rely on modifications to 254
the existing MobCal code. Such efforts are now underway in different research groups. 255
256
3.6 Effect of charge distribution on CCS calculations 257
Although this study assumes that different protonation site isomers can be formed in the 258
electrospray process and observed via their characteristic mobility peaks, the question 259
still remains to what extent different factors contribute to protomer separation in ion 260
mobility: is it the charge site itself, or rather the conformational change driven by 261
alternative charge sites? As an example of the latter, the rotation of the chloroethyl 262
groups in the mustard moiety of melphalan could lead to the observation of multiple 263
conformers. Interaction of these chloroethyl groups with the phenylalanine moiety of the 264
molecule could possibly also result in more compact ions. 265
Protonation at different sites, which results in different charge distributions (after 266
optimization) across the molecule, can potentially affect its geometry (i.e. the atomic 267
positions) in a way that contributes to a change in CCS. In order to assess the magnitude 268
of this effect separately from that of the charge distribution itself, we simply recalculated 269
the CCS, while removing the atomic partial charges. These re-calculated CCS values are 270
reported in Table 5 (“no charge distribution”). Removing the charges drastically lowers the 271
computed CCS values, as expected in N2 drift gas particularly for the smaller analytes 272
(benzocaine isomers and aniline), and we do not expect them to match the experimental 273
values anymore. More importantly, what this exercise can show is if the calculated CCS 274
difference between two postulated protomers is maintained even in the absence of any 275
charge, i.e. whether it is largely caused by a conformational change of the molecule. This 276
is the case only for the melphalan protomers. All other molecules studied here show 277
virtually identical CCS (within the error margin of the experiment) for the “uncharged” 278
protomer pairs. This signifies that the potentially different molecular geometries of the 279
protomers, optimised in the presence of charge, would not account for any possible CCS 280
difference. Rather the position of the proton and the resulting relatively large differences 281
in charge distributions and dipole moments are held responsible for the observed 282
protomer separation in ion mobility. We can speculate that of the molecules studied here, 283
only melphalan is “flexible” enough to undergo a charge-site driven conformational 284
change which is sufficiently large to contribute to the separation of its protomer peaks. 285
These calculations show that different protonation sites can yield significantly different ion 286
mobilities in nitrogen, indicating that the long-range electrostatic contribution of the 287
charge to the overall CCS is substantial. 288
289
3.7 Protomers and dipole moments 290
The analysis of the effect of molecular geometry on CCS independent of charge (see 291
section 3.6) showed that for some of the small molecules studied here, charge 292
distributions are the determining factor for their separation in ion mobility when using 293
polarizable gases. A close look at the structures of the protomer pairs shows that, 294
although their mobilities can differ considerably, their geometries may indeed be relatively 295
similar. Since the atomic coordinates of these structures only vary slightly (apart from 296
melphalan), the CCS difference is thought to be predominantly the result of the charge 297
distribution. The differences between the molecular dipole moment of various protomers 298
could therefore be used as a possible predictor for the separation of these protomers in 299
ion mobility30. 300
As an example, the charge distributions of the three melphalan protomers considered 301
here are visualized as molecular electrostatic potentials (MEPs) in Figure 4. Comparison 302
of the 5 lowest-energy structures per protonation site (see Table 2) shows that they share 303
similar dipole moments. Furthermore, the structures with the smallest dipole moment (ca. 304
6 Debye) also correspond to the ion with the smallest CCS value, i.e. the NCl protomer. 305
The structures that have a dipole moment of around 11 Debye correspond to the ion with 306
the largest observed CCS value (NAA protomer). We plotted all 4 experimentally observed 307
protomer pairs with their 〉CCS values against the corresponding Delta dipole values, 308
calculated at the best-fitting DFT level (apart from melphalan, all “high” level; see Figure 309
6). Although the correlation is not very strong, the trend is clear: the larger the calculated 310
Delta dipole values, the higher the measured Delta CCS. 311
To test this hypothesis further, we also plotted predicted 〉CCS values for all possible 312
protomer pairs, calculated at both “standard” and “high” levels using MobCal, against 313
their corresponding Delta dipole values. These data highlight that the correlation between 314
CCS and dipole moment is quite poor with standard-level calculations (red squares in 315
Figure 6). The high-level structure calculations on the other hand (blue diamonds) yield a 316
reasonably good correlation (linear fit: R2=0.8784) between differences in dipole moment 317
of protomer pairs and their separation in ion mobility experiments where polarisable drift 318
gases such as nitrogen are used30,31. Aniline shows a 〉CCS larger than expected based 319
on the calculated 〉 dipole value, which may be due to the fact that the smaller protomer is 320
a ring-protonated (charge-delocalized) form. 321
Taken together, these data suggest that rather than geometry or net charge alone, the 322
charge distribution – characterized by the dipole moment and, as recently proposed29, the 323
polarizability of the analyte – plays a major role for the observed CCS values as well, 324
particularly for relatively rigid molecules and their specific interaction with a polarizable 325
drift gas (i.e. N2). Experimentally observed protomer separation is found to be explained 326
reasonably well by differences between the calculated dipole moments of alternatively 327
protonated forms of the analyte. 328
329
330
331
4. Experimental 332
333
Caution: melphalan and degradation products are carcinogenic and should be handled 334
with care. 335
336
4.1. Chemicals and sample preparation 337
Chemicals purchased from Sigma-Aldrich (Bornem, Belgium): acetaminophen (> 99.0 338
%), alprenolol (Eur. Pharmacop. Ref.), aniline (99.8 %), colchicine (> 95 %), 339
dexamethasone (> 97 %), ethyl 4-aminobenzoate (98 %), ethyl 3-aminobenzoate (97 %), 340
ethyl 2-aminonenzoate (> 99 %), N-ethylaniline (98 %), melphalan (min. 95 %), 341
ondansetron (> 98 %), poly-DL-alanine, sodium formate (HPLC, > 99.0 %) and verapamil 342
(> 99 %). Acetonitrile (ACN; HPLC grade), methanol (MeOH; HPLC grade) and formic 343
acid (FA; 99+ %) were obtained from Acros (Geel, Belgium). Reversed osmosis (RO) 344
water was prepared using a Silex water filtering system from Eurowater (Nazareth-Eke, 345
Belgium). Ammonium hydroxide (solution of 25 % v/v) was purchased from Merck 346
(Overijse, Belgium). Dimethoxymelphalan was synthesized in-house, and 347
dihydroxymelphalan formed during synthesis as an additional reaction product. Stock 348
solutions (10-2 M) of all analytes and calibrants were prepared in MeOH. 349
350
4.2 Optimisation of molecular structures and charge distributions 351
A conformational analysis was performed to find the best structure of melphalan ions in 352
the gas phase. The conformational space of the different protonated species 353
(‘protomers’) was explored using TINKER (version 6)45 with the Merck molecular force 354
field (MMFF94). The resulting structures were further optimised with Gaussian 0946 at the 355
B3LYP/6-31G(d,p) (“standard”) and B3PW91/def2-TZVP (“high”) levels. For each 356
calculation, the optimised structure was verified to be a local minimum by performing a 357
vibrational analysis. Atomic charges were computed using the Merz-Singh-Kollman 358
scheme with the constraint to reproduce the molecular dipole (‘pop=mk,dipole’). The 359
uncharged structures were generated by simply removing the atomic partial charges. As 360
the dipole moment for charged species depends on the origin chosen, the center of 361
charge was used as a reference point instead of the center of mass for all calculations. 362
Three-dimensional structures were visualized using Avogadro (version 1.1.1)47 and 363
molecular electrostatic potentials (MEPs) using VMD (version 1.9.2)48,49. 364
365
4.3 Calculation of CCS values 366
MobCal was used to calculate CCS values32,33. MobCal is available as freeware50. 367
MobCalPARSER, also available as freeware51, allowed the direct use of Gaussian output 368
(.log) files. 369
The modified version of MobCal41 used in this study calculates CCS values for 370
experiments in nitrogen drift gas and takes into account ion-quadrupole interactions and 371
the orientation of non-spherical gases during collisions (TM algorithm only). 372
Lennard-Jones potentials were re-tuned by scaling universal force field (UFF) parameters 373
such as the atomic energy and van-der-Waals distance, in order to represent the ion 374
motion through N2 drift gas better. The code was also expanded with other types of 375
atoms. 376
377
4.4 Instrumentation 378
Travelling-Wave Ion Mobility Spectrometry (TWIMS) experiments were performed on a 379
Synapt G2 HDMS instrument, and data acquisition and processing were carried out using 380
MassLynx (V 4.1). 381
The instrument (Waters Corporation, Wilmslow, UK) was equipped with a 382
nano-electrospray source and used gold-coated glass capillary needles, which were 383
fabricated in-house. In order to obtain clean spectra, the ions under investigation were 384
m/z selected in all IM-MS experiments. Prior to the experiments, the instrument was 385
calibrated in the m/z 50-600 mass range using sodium formate solution (positive ion 386
mode). All prepared solutions were checked for the presence of impurities, which might 387
overlap with the signal of the analyte. 388
Typical instrument parameters in time-of-flight mode are: sample and extraction cone 389
voltage: 10 V and 3 V, trap bias: 2 V, trap cell gas flow: 2 mL/min, trap and transfer CE: 4 390
V and 0 V. Experimental CCS are determined after a single calibration of the TWIMS cell 391
using both poly-DL-alanine (0.5 mg/mL in 1:1 H2O:ACN) and a set of drug-like 392
compounds (5 M each in 1:1 H2O:ACN) as reported before12,39. In ion mobility mode, 393
drift times were determined for different IM wave velocities in order to eliminate 394
energy-dependent phenomena, which could affect the ion mobility separation. Some 395
parameters differ in ion mobility mode: trap bias: 40 V, IMS wave velocity: 600 m/s or, for 396
melphalan and related compounds: 1000 m/s, IMS wave height: 40 V, He and IMS 397
(nitrogen) gas flow: 180 mL/min and 90 mL/min. 398
399
400
401
5. Conclusions 402
403
Most small compounds show only one, unique drift time in ion mobility experiments, which 404
allows the use of such data as additional identifiers for mass-spectrometry based 405
molecular characterization, e.g. in metabolomics. There is now considerable interest in 406
assembling databases which contain ion mobilities of compounds under standardized 407
conditions, not dissimilar to retention times in chromatography. 408
Occasionally, small molecules exhibit multiple ion mobility drift times, due to the ability to 409
form different protomers. Protomers are constitutional isomers, or more precisely, 410
isomeric catiomers. They are molecular species which originate from the same chemical 411
entity in solution, but where partial, intramolecular proton transfer during electrospray 412
ionization causes the formation of charge isomers in the gas phase. This is often 413
encountered for, but not limited to, small molecules containing an amino and a carbonyl 414
or carboxyl moiety. Protonation at different sites may not only distort the molecular 415
geometry, affecting the hard sphere cross-sections, but also lead to significantly different 416
charge distributions. The latter can be represented by the dipole moment, which has a 417
large effect on the ion's mobility when polarisable drift gases such as nitrogen are used. 418
419
In the most systematic analysis to date, we utilized a panel of 7 closely related small 420
molecules, 4 of which are found to show two drift time signals, to better understand what 421
determines protomer separation in ion mobility and evaluate computational approaches 422
for their characterization. IM-MS of the chemotherapeutic agent melphalan revealed the 423
presence of two mobility peaks, whereas molecules closely related to this compound (i.e. 424
dihydroxy- and dimethoxymelphalan) only showed one protonated form. For comparison, 425
aniline and three isomers of benzocaine were also included in this study. 426
By comparing experimental with calculated CCS values from molecular modelling, we 427
could assign the protonation site and structure of the observed ions. More flexible 428
structures with bulky side chains (e.g. DOCH3) however appear to have their CCS 429
overestimated with both types of calculations used. While results of what we call 430
“high-level” calculations match experimental data much better for most molecules studied 431
here, a more systematic investigation of functionals and basis sets is required to 432
determine the most appropriate computational strategy for the optimization of structure 433
and charge of protomers. With different protonation sites in these compounds available 434
under electrospray conditions, a number of alternative charge distributions and molecular 435
geometries have to be evaluated for how well they match the corresponding collision 436
cross sections in the experiment. More straightforward and efficient calculation methods 437
would make this step much faster and more accurate, and enable “high-throughput” 438
approaches for ion mobility data processing such as would benefit, e,g., compound 439
identification in complex samples. 440
The use of polarisable drift gases (e.g. N2), which has become common due to the 441
widespread use of travelling wave IM-MS, leads to a more frequent observation of 442
protomer phenomena, and puts the issue of their structual assignment into the spotlight. 443
We found a good agreement between experimental and theoretical CCS data in this 444
study when using a modified version of the trajectory method, optimised for use with 445
nitrogen as drift gas. Our data show that the molecular dipole moment, rather than the 446
hard sphere collision cross section, is a useful determinant for the ion mobility separation 447
of protomers. Furthermore, a good correlation appears to exist between the different 448
calculated dipole moments, and both experimental and theoretical CCS differences, in 449
protomer pairs investigated here. As calculated dipole moments are readily available, 450
they may be useful “predictors” of protomer separation in experiments which target rapid 451
small molecule isomer separation and identification using ion mobility. 452
453
454
455
Acknowledgements 456
457
Financial support by the Hercules Foundation Flanders allowing the purchase of the 458
Synapt instrument and the CalcUA/VSC supercomputing cluster is acknowledged. We 459
thank Iain Campuzano (Amgen, Thousand Oaks, CA, USA) for providing us with the 460
modified MobCal algorithm and helpful discussions, and wish to thank the reviewers for 461
their constructive feedback. 462
463
464
465
References 466
467
1. K. Giles, S. D. Pringle, K. R. Worthington, D. Little, J. L. Wildgoose and R. H. Bateman, 468
Rapid Comm. Mass Spectrom., 2004, 18, 2401-2414. 469
2. K. Thalassinos, S. E. Slade, K. R. Jennings, J. H. Scrivens, K. Giles, J. Wildgoose, J. 470
Hoyes, R. H. Bateman and M. T. Bowers, Int. J. Mass Spectrom., 2004, 236, 55-63. 471
3. H. A. Sawyer, J. T. Marini, E. G. Stone, B. T. Ruotolo, K. J. Gillig and D. H. Russell, J. Am. 472
Soc. Mass Spectrom., 2005, 16, 893-905. 473
4. S. D. Pringle, K. Giles, J. L. Wildgoose, J. P. Williams, S. E. Slade, K. Thalassinos, R. H. 474
Bateman, M. T. Bowers and J. H. Scrivens, Int. J. Mass Spectrom., 2007, 261, 1-12. 475
5. C. A. Scarff, K. Thalassinos, G. R. Hilton and J. H. Scrivens, Rapid Commun. Mass 476
Spectrom., 2008, 22, 3297-3304 . 477
6. D. P. Smith, T. W. Knapman, I. Campuzano, R. W. Malham, J. T. Berryman, S. E. Radford 478
and A. E. Ashcroft, Eur. J. Mass Spectrom., 2009, 15, 113-130. 479
7. C. W. N. Damen, Chen, A. B. Chakraborty, M. van Oosterhout, J. R. Mazzeo, J. C. Gebler, 480
J. H. M. Schellens, H. Rosing and J. H. Beijnen, J. Am. Soc. Mass Spectrom., 2009, 20, 481
2021-2033. 482
8. C. Atmanene, S. Petiot-Bécard, D. Zeyer, A. Van Dorsselaer, V. Vivat Hannah and S. 483
Sanglier-Cianférani, Anal. Chem., 2012, 84, 4703-4710. 484
9. A. Konijnenberg, A. Butterer and F. Sobott, BBA - Proteins and Proteomics, 2013, 1834, 485
1239-1256. 486
10. B. T. Ruotolo, J. L. P. Benesch, A. M. Sandercock, S.-J. Hyung and C. V. Robinson, Nat. 487
Protoc., 2008, 3, 1139-1152. 488
11. C. Uetrecht, R. J. Rose, E. Van Duijn, K. Lorenzen, and Albert J. R. Heck, Chem. Soc. 489
Rev., 2010, 39, 1633-1655. 490
12. M. F. Bush, I. D. G. Campuzano, and C. V. Robinson, Anal. Chem., 2012, 84, 7124-7130. 491
13. J. L. Benesch and B. T. Ruotolo, Curr. Opin. Struct. Biol., 2011, 21, 641-649. 492
14. J. Snijder, R. J. Rose, D. Veesler, J. E. Johnson and A. J. R. Heck, Angew. Chem. Int. Ed., 493
2013, 52, 4020-4023. 494
15. L. Han and B. T. Ruotolo, Int. J. Ion Mobil. Spectrom., 2013, 16, 41-50. 495
16. M. Benassi, Y. E. Corilo, D. Uria, R. Augusti and M. N. Eberlin, J. Am. Soc. Mass 496
Spectrom., 2009, 20, 269-277. 497
17. J. P. Williams, T. Bugarcic, A. Habtemariam, K. Giles, I. Campuzano, P. M. Rodger and P. 498
J. Sadler, J. Am. Soc. Mass Spectrom., 2009, 20, 1119-1122. 499
18. M. Zhu, B. Bendiak, B. Clowers and H. H. Hill, Anal. Bioanal. Chem., 2009, 394, 500
1853-1867. 501
19. G. J. Dear, J. Munoz-Muriedas, C. Beaumont, A. Roberts, J. Kirk, J. P. Williams and I. 502
Campuzano, Rapid Commun. Mass Spectrom., 2010, 24, 3157-3162. 503
20. M. Fasciotti, A. F. Gomes, F. C. Gozzo, B. A. Iglesias, G. F. de Sá, R. J. Daroda, M. 504
Toganoh, H. Furuta, K. Araki and M. N. Eberlin, Org. Biomol. Chem., 2012, 10, 8396-8402. 505
21. L. Ahonen, M. Fasciotti, G. B. A. Gennäs, T. Kotiaho, R. J. Daroda, R. M. Eberlin and R. 506
Kostiainen, J. Chromatogr. A, 2013, 1310, 133–137. 507
22. V. E. Wright, F. Castro-Gómez, E. Jurneczko, J. C. Reynolds, A. Poulton, S. D. R. Christie, 508
P. Barran, C. Bo and C. S. Creaser, Int. J. Ion Mobil. Spec., 2013, 16, 61–67. 509
23. J. P. Williams, J. M. Brown, I. Campuzano and P. J. Sadler, Chem. Commun., 2010, 46, 510
5458-5460. 511
24. J. Hofmann, H. S. Hahm, P. H. Seeberger and K. Pagel, Nature, 2015, 526, 241-244. 512
25. P. M. Lalli, B. A. Iglesias, H. E. Toma, G. F. Sa, R. J. Daroda, J. C. Silva Filho, J. E. 513
Szulejko, K. Araki and M. N. Eberlin, J. Mass Spectrom., 2012, 47, 712-719. 514
26. A. Kaufmann, P. Butcher, K. Maden, M. Widmer, K. Giles and D. Uria, Rapid Commun. 515
Mass Spectrom., 2009, 23, 985-998. 516
27. C. Lapthorn, T. J. Dines, B. Z. Chowdhry, G. L. Perkins and F. S. Pullen, Rapid Commun. 517
Mass Spectrom., 2013, 27, 2399-2410. 518
28. S. Warnke, J. Seo, J. Boschmans, F. Sobott, J. H. Scrivens, C. Bleiholder, M. T. Bowers, S. 519
Gewinner, W. Schöllkopf, K. Pagel and G. von Helden, J. Am. Chem. Soc., 2015, 137, 520
4236-4242. 521
29. R. S. Galaverna, G. A. Bataglion, G. Heerdt, G. F. de Sa, R. Daroda, V. S. Cunha, N. H. 522
Morgon, M. N. Eberlin, Eur. J. Org. Chem., 2015, 2015, 2189-2196. 523
30. P. M. Lalli, Y. E. Corilo, M. Fasciotti, M. F. Riccio, G. F. de Sá, R. J. Daroda, G. H. M. F. 524
Souza, M. McCullagh, M. D. Bartberger, M. N. Eberlin and I. D. G. Campuzano, J. Mass 525
Spectrom., 2013, 48, 989-997. 526
31. T. G. Flick, I. D. G. Campuzano and M. D. Bartberger, Anal. Chem., 2015, 87, 3300-3307. 527
32. M. F. Mesleh, J. M. Hunter, A. A. Shvartsburg, G. C. Schatz, and M. F. Jarrold, J. Phys. 528
Chem., 1996, 100, 16082-16086. 529
33. A. A. Shvartsburg and M. F. Jarrold, Chem. Phys. Lett., 1996, 261, 86-91. 530
34. T. W. Knapman, J. T. Berryman, I. Campuzano, S. A. Harris and A. E. Ashcroft, Int. J. Mass 531
Spectrom., 2010, 298, 17-23. 532
35. C. Bleiholder, T. Wyttenbach and M. T. Bowers, Int. J. Mass Spectrom., 2011, 308, 1-10. 533
36. S. E. Anderson, C. Bleiholder, E. R. Brocker, P. J. Stang and M. T. Bowers, Int. J. Mass 534
Spectrom., 2012, 330-332, 78-84. 535
37. C. Bleiholder, S. Contreras, T. D. Do and M. T. Bowers, Int. J. Mass Spectrom., 2013, 536
345-347, 89-96. 537
38. C. Bleiholder, S. Contreras and M. T. Bowers, Int. J. Mass Spectrom., 2013, 354-355, 538
275-280. 539
39. E. G. Marklund, M. T. Degiacomi, C. V. Robinson, A. J. Baldwin and Justin L.P. Benesch, 540
Collision Cross Sections for Structural Proteomics, Structure, http://impact.chem.ox.ac.uk, 541
(accessed May 2015). 542
40. D. Guillarme, H. Kim, J. Ruta, H. I. Kim, S. Rudaz, P. V. Johnson, J.-L. Veuthey, L. W. 543
Beegle, J. L. Beauchamp, W. A. Goddard and I. Kanik, Anal. Chem., 2008, 80, 1928-1936. 544
41. I. Campuzano, M. F. Bush, C. V. Robinson, C. Beaumont, K. Richardson, H. Kim, and H. I. 545
Kim, Anal. Chem., 2012, 84, 1026–1033. 546
42. C. Lapthorn, F. S. Pullen, B. Z. Chowdhry, P. Wright, G. L. Perkins, and Y. Heredia, 547
Analyst, 2015, 140, 6814-6823. 548
43. H. Lavanant, V. Tognetti and C. Afonso, J. Am. Soc. Mass Spectrom., 2014, 25, 572-580. 549
44. S. A. Stout and C. M. Riley, Int. J. Pharm., 1985, 24, 193-208. 550
45. TINKER – Software Tools for Molecular Design, http://dasher.wustl.edu/tinker, (accessed 551
January 2015). 552
46. M. J. Frisch, G. W. Trucks, H. B. Schlegel, G. E. Scuseria, M. A. Robb, J. R. Cheeseman, 553
G. Scalmani, V. Barone, B. Mennucci, G. A. Petersson, H. Nakatsuji, M. Caricato, X. Li, H. 554
P. Hratchian, A. F. Izmaylov, J. Bloino, G. Zheng, J. L. Sonnenberg, M. Hada, M. Ehara, K. 555
Toyota, R. Fukuda, J. Hasegawa, M. Ishida, T. Nakajima, Y. Honda, O. Kitao, H. Nakai, T. 556
Vreven, J. A. Montgomery, Jr., J. E. Peralta, F. Ogliaro, M. Bearpark, J. J. Heyd, E. 557
Brothers, K. N. Kudin, V. N. Staroverov, R. Kobayashi, J. Normand, K. Raghavachari, A. 558
Rendell, J. C. Burant, S. S. Iyengar, J. Tomasi, M. Cossi, N. Rega, J. M. Millam, M. Klene, 559
J. E. Knox, J. B. Cross, V. Bakken, C. Adamo, J. Jaramillo, R. Gomperts, R. E. Stratmann, 560
O. Yazyev, A. J. Austin, R. Cammi, C. Pomelli, J. W. Ochterski, R. L. Martin, K. Morokuma, 561
V. G. Zakrzewski, G. A. Voth, P. Salvador, J. J. Dannenberg, S. Dapprich, A. D. Daniels, Ö. 562
Farkas, J. B. Foresman, J. V. Ortiz, J. Cioslowski, D. J. Fox, Gaussian 09, Revision D.01, 563
Gaussian, Inc., Wallingford CT, 2009. 564
47. Avogadro – An Open-source Molecular Builder and Visualization Tool, 565
http://avogadro.cc/wiki/Main_Page, (accessed May 2015). 566
48. VMD – Visual Molecular Dynamics, http://www.ks.uiuc.edu/Research/vmd, (accessed 567
January 2015). 568
49. W. Humphrey, A. Dalke and K. Schulten, VMD - Visual Molecular Dynamics, J. Molec. 569
Graphics, 1996, 14, 33-38. 570
50. MobCal – A Program to Calculate Mobilities, http://www.indiana.edu/~nano/software.html, 571
(accessed May 2015). 572
51. MobCalPARSER, http://sourceforge.net/projects/mobcalparser, (accessed May 2015). 573
52. Collision Cross Section Database, http://depts.washington.edu/bushlab/ccsdatabase, 574
(accessed February 2015). 575
576
577
Figures 578
579
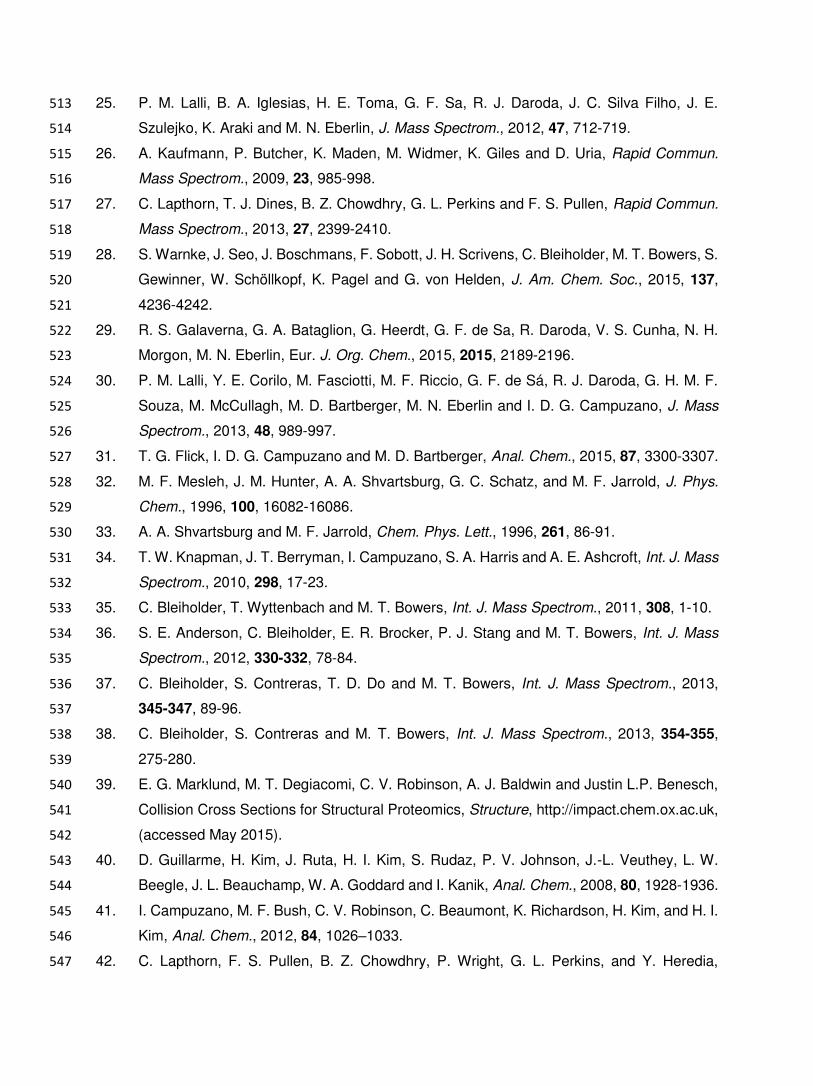
Graphical abstract 580
581
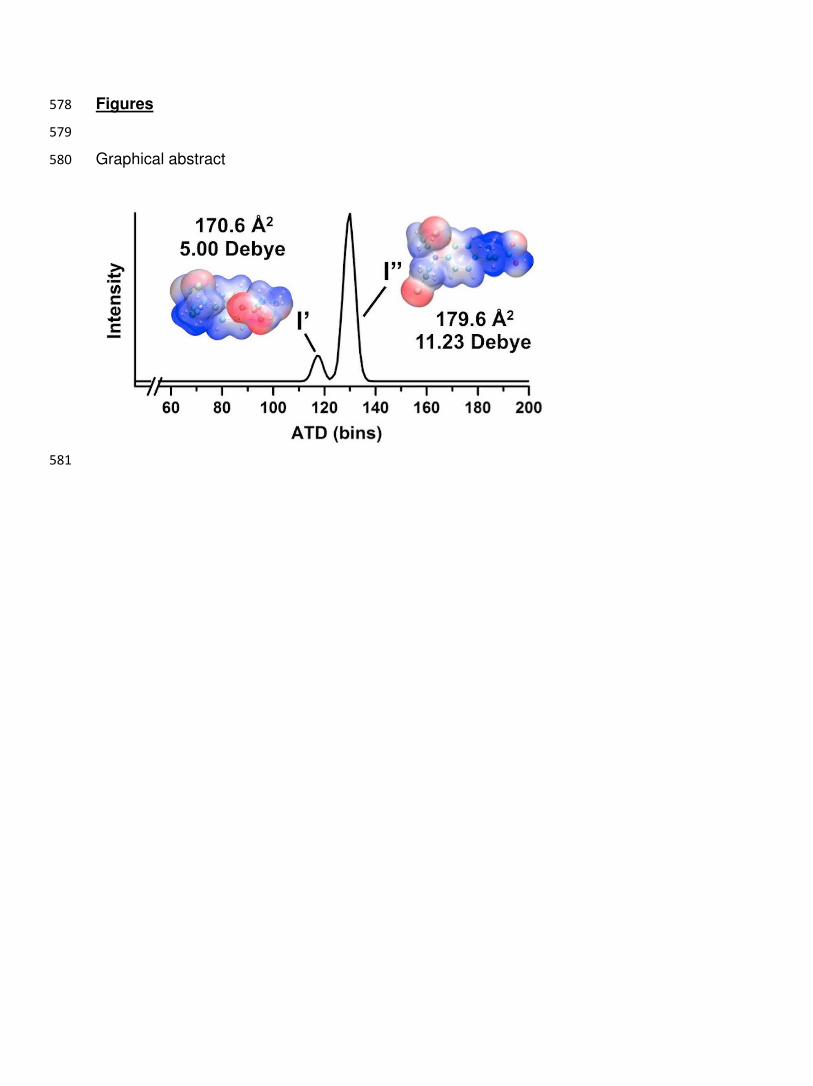
Figure 1 582
Overview of the sequence and output of the various experiments and calculations. 583
584
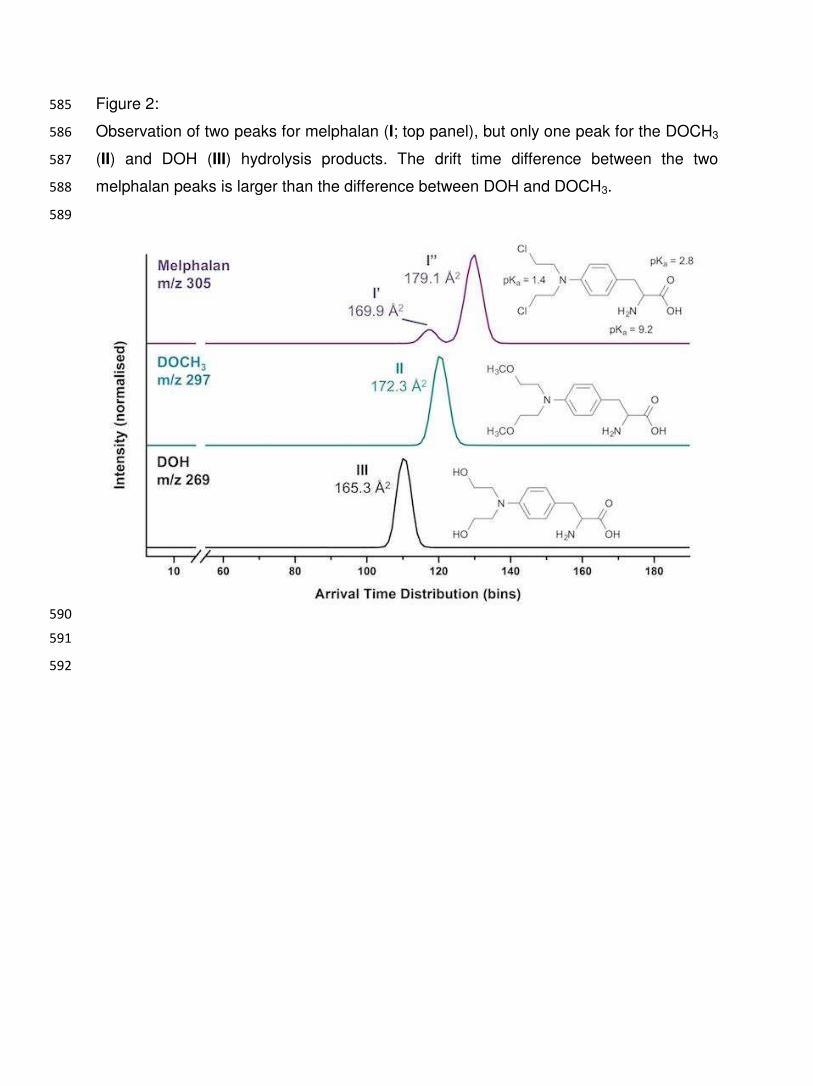
Figure 2: 585
Observation of two peaks for melphalan (I; top panel), but only one peak for the DOCH3 586
(II) and DOH (III) hydrolysis products. The drift time difference between the two 587
melphalan peaks is larger than the difference between DOH and DOCH3. 588
589
590
591
592
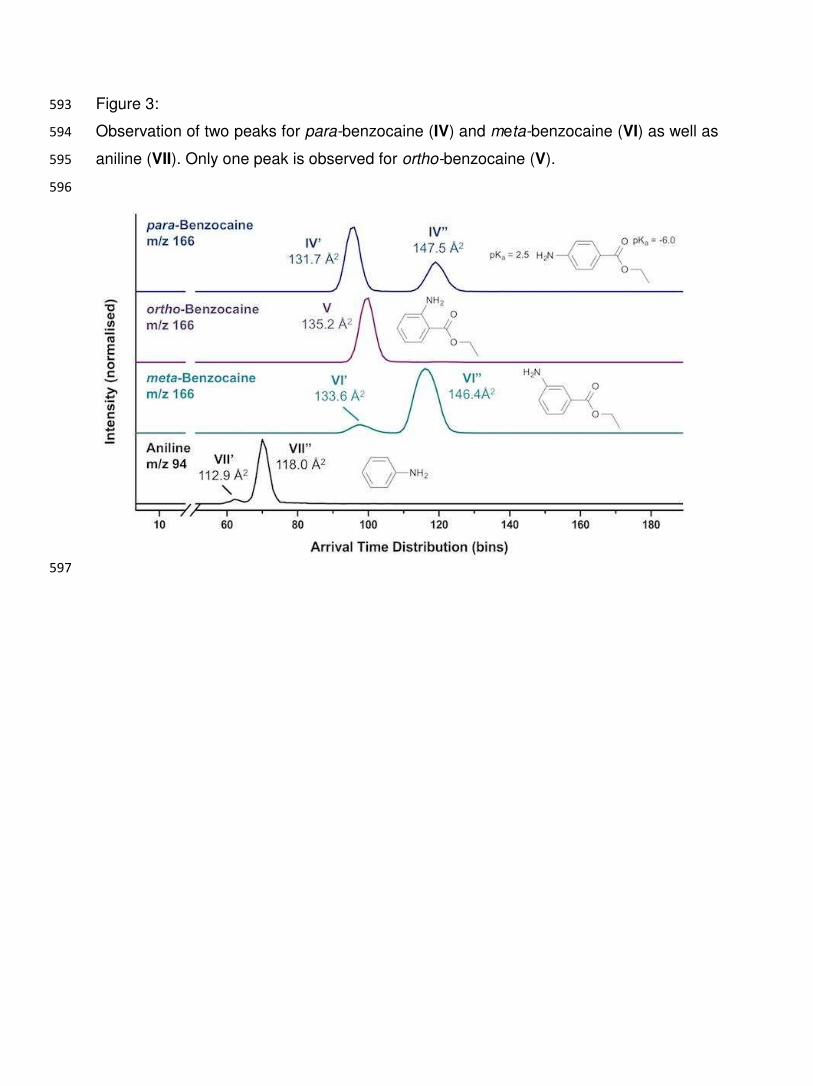
Figure 3: 593
Observation of two peaks for para-benzocaine (IV) and meta-benzocaine (VI) as well as 594
aniline (VII). Only one peak is observed for ortho-benzocaine (V). 595
596
597
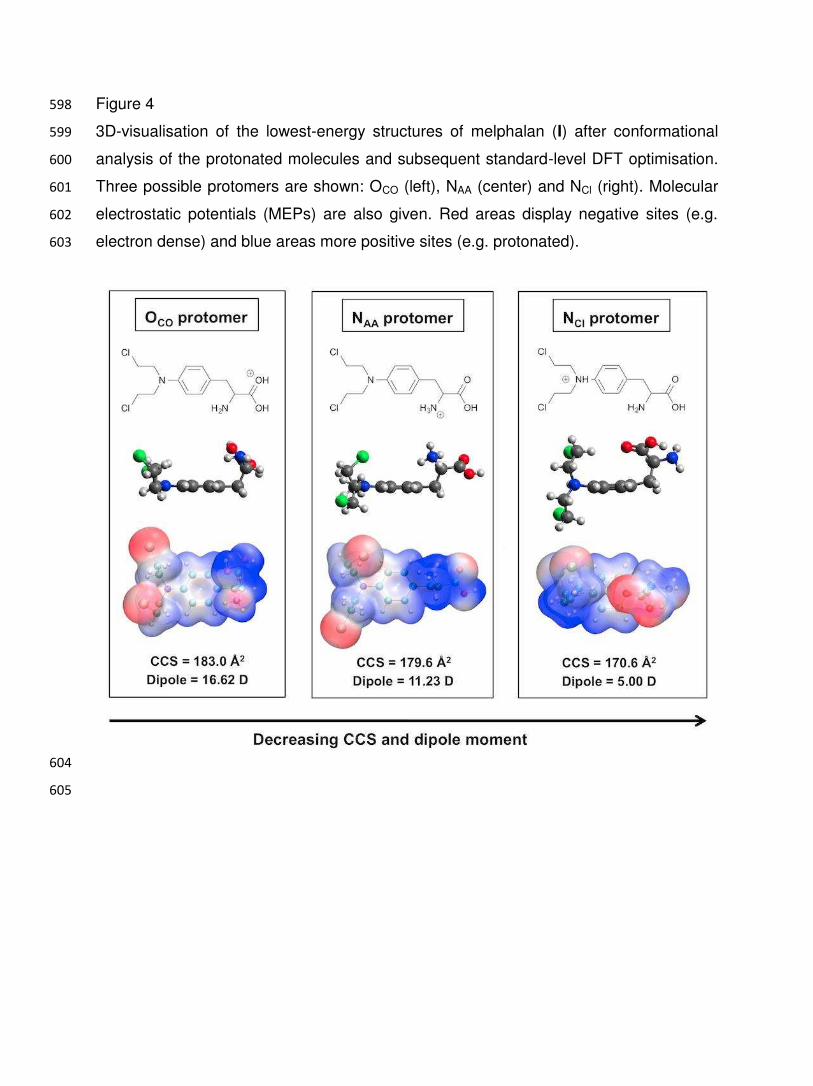
Figure 4 598
3D-visualisation of the lowest-energy structures of melphalan (I) after conformational 599
analysis of the protonated molecules and subsequent standard-level DFT optimisation. 600
Three possible protomers are shown: OCO (left), NAA (center) and NCl (right). Molecular 601
electrostatic potentials (MEPs) are also given. Red areas display negative sites (e.g. 602
electron dense) and blue areas more positive sites (e.g. protonated). 603
604
605
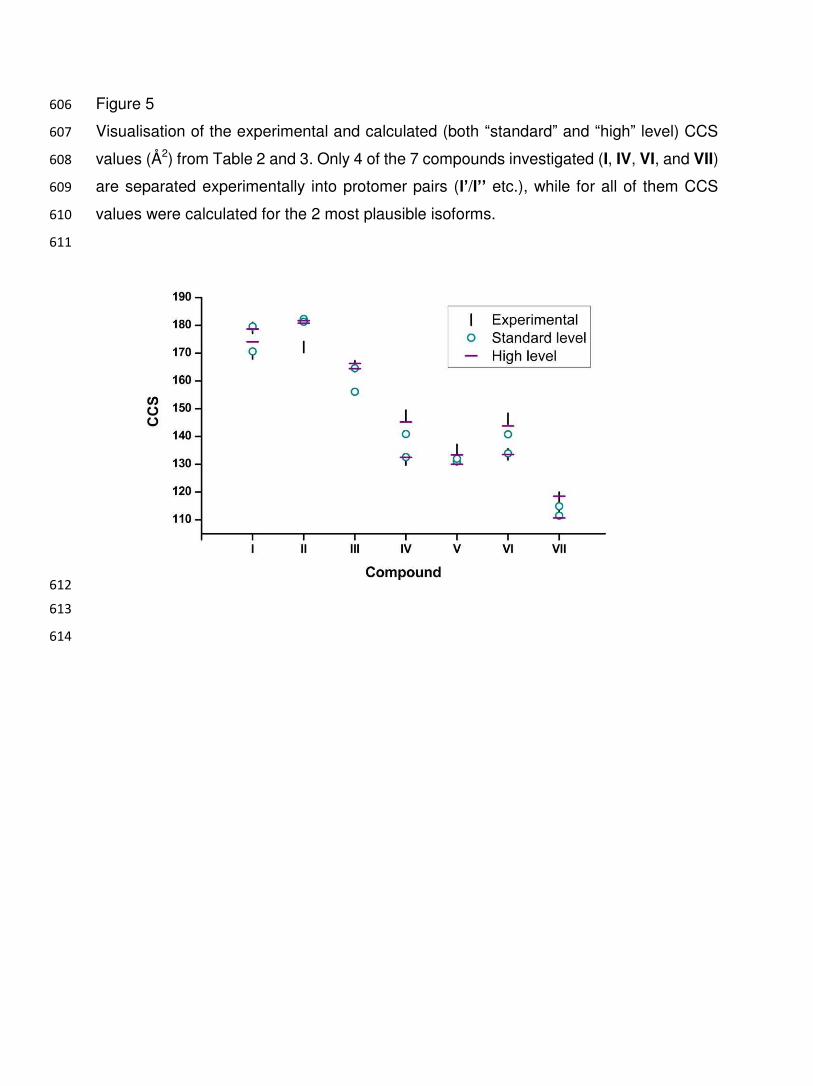
Figure 5 606
Visualisation of the experimental and calculated (both “standard” and “high” level) CCS 607
values (Å2) from Table 2 and 3. Only 4 of the 7 compounds investigated (I, IV, VI, and VII) 608
are separated experimentally into protomer pairs (I’/I’’ etc.), while for all of them CCS 609
values were calculated for the 2 most plausible isoforms. 610
611
612
613
614
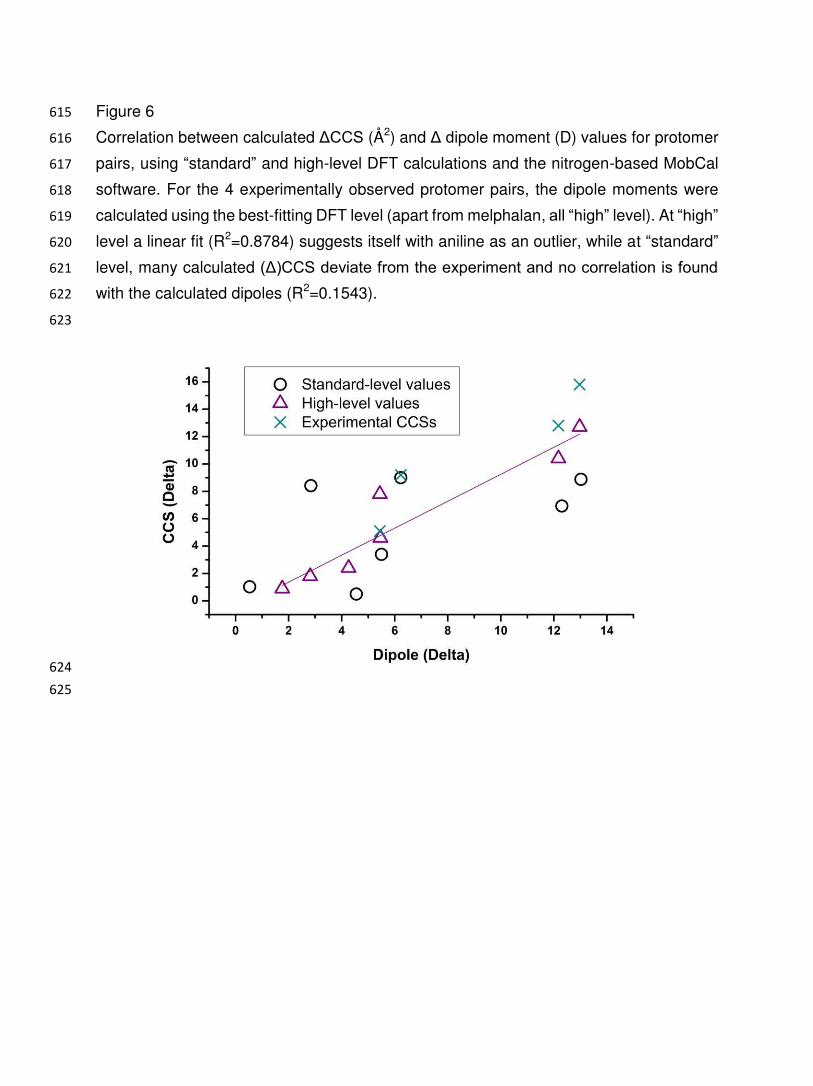
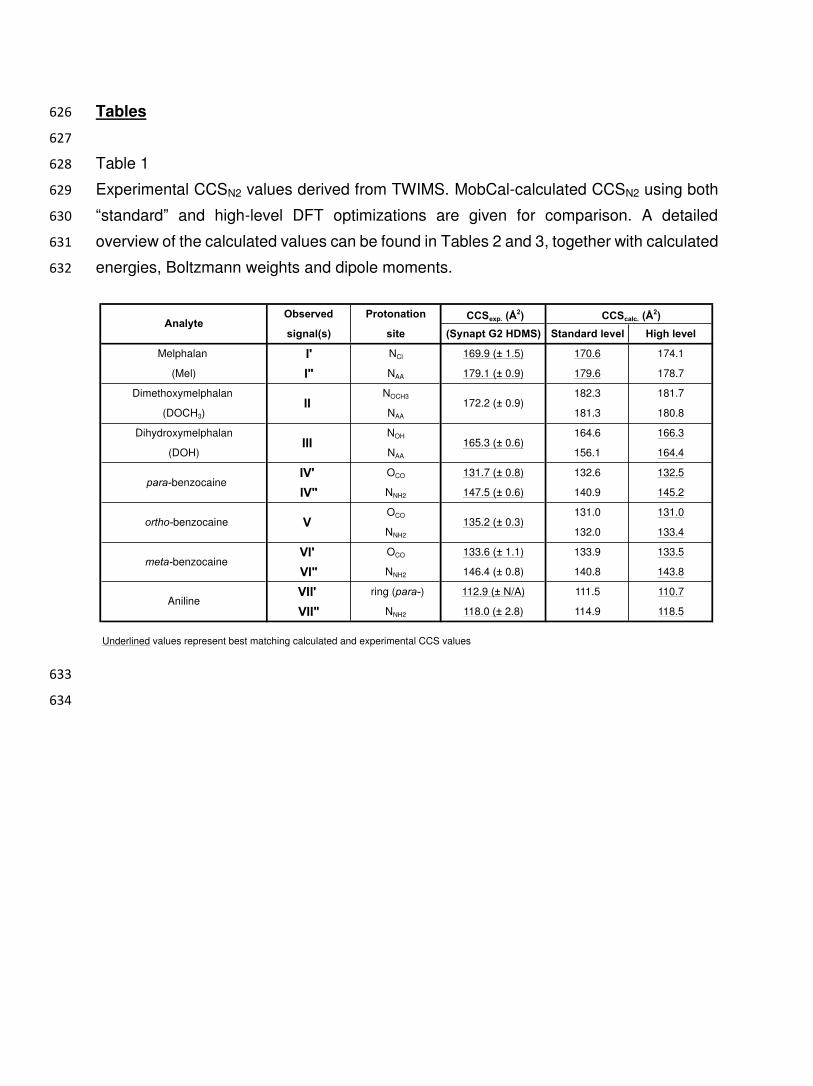
Figure 6 615
Correlation between calculated 〉CCS (Å2) and 〉 dipole moment (D) values for protomer 616
pairs, using “standard” and high-level DFT calculations and the nitrogen-based MobCal 617
software. For the 4 experimentally observed protomer pairs, the dipole moments were 618
calculated using the best-fitting DFT level (apart from melphalan, all “high” level). At “high” 619
level a linear fit (R2=0.8784) suggests itself with aniline as an outlier, while at “standard” 620
level, many calculated (〉)CCS deviate from the experiment and no correlation is found 621
with the calculated dipoles (R2=0.1543). 622
623
624
625
Tables 626
627
Table 1 628
Experimental CCSN2 values derived from TWIMS. MobCal-calculated CCSN2 using both 629
“standard” and high-level DFT optimizations are given for comparison. A detailed 630
overview of the calculated values can be found in Tables 2 and 3, together with calculated 631
energies, Boltzmann weights and dipole moments. 632
633
634
Observed Protonation CCSexp. (Å2)
signal(s) site (Synapt G2 HDMS) Standard level High level
Melphalan I' NCl 169.9 (± 1.5) 170.6 174.1
(Mel) I" NAA 179.1 (± 0.9) 179.6 178.7
Dimethoxymelphalan NOCH3 182.3 181.7
(DOCH3) NAA 181.3 180.8
Dihydroxymelphalan NOH 164.6 166.3
(DOH) NAA 156.1 164.4
IV' OCO 131.7 (± 0.8) 132.6 132.5
IV" NNH2 147.5 (± 0.6) 140.9 145.2
OCO 131.0 131.0
NNH2 132.0 133.4
VI' OCO 133.6 (± 1.1) 133.9 133.5
VI" NNH2 146.4 (± 0.8) 140.8 143.8
VII' ring (para-) 112.9 (± N/A) 111.5 110.7
VII" NNH2 118.0 (± 2.8) 114.9 118.5
Underlined values represent best matching calculated and experimental CCS values
AnalyteCCScalc. (Å2)
II 172.2 (± 0.9)
Aniline
III 165.3 (± 0.6)
ortho-benzocaine
meta-benzocaine
para-benzocaine
135.2 (± 0.3)V
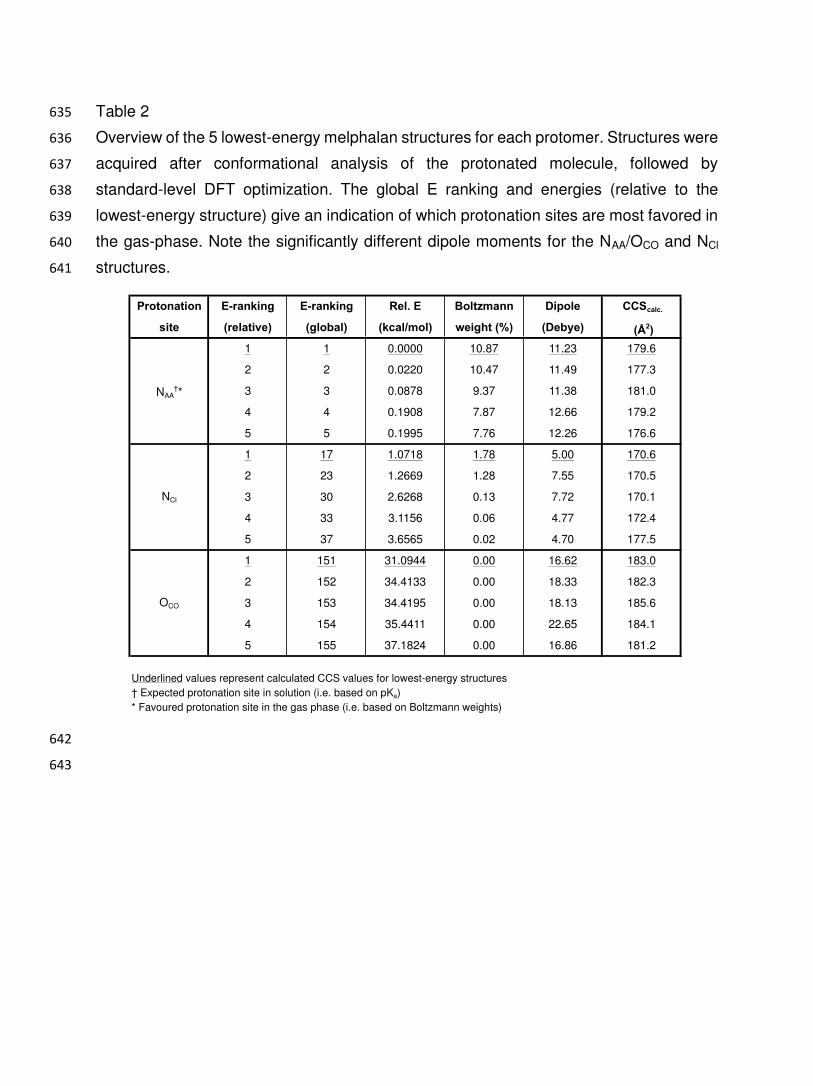
Table 2 635
Overview of the 5 lowest-energy melphalan structures for each protomer. Structures were 636
acquired after conformational analysis of the protonated molecule, followed by 637
standard-level DFT optimization. The global E ranking and energies (relative to the 638
lowest-energy structure) give an indication of which protonation sites are most favored in 639
the gas-phase. Note the significantly different dipole moments for the NAA/OCO and NCl 640
structures. 641
642
643
Protonation E-ranking E-ranking Rel. E Boltzmann Dipole CCScalc.
site (relative) (global) (kcal/mol) weight (%) (Debye) (Å2)
1 1 0.0000 10.87 11.23 179.6
2 2 0.0220 10.47 11.49 177.3
3 3 0.0878 9.37 11.38 181.0
4 4 0.1908 7.87 12.66 179.2
5 5 0.1995 7.76 12.26 176.6
1 17 1.0718 1.78 5.00 170.6
2 23 1.2669 1.28 7.55 170.5
3 30 2.6268 0.13 7.72 170.1
4 33 3.1156 0.06 4.77 172.4
5 37 3.6565 0.02 4.70 177.5
1 151 31.0944 0.00 16.62 183.0
2 152 34.4133 0.00 18.33 182.3
3 153 34.4195 0.00 18.13 185.6
4 154 35.4411 0.00 22.65 184.1
5 155 37.1824 0.00 16.86 181.2
Underlined values represent calculated CCS values for lowest-energy structures† Expected protonation site in solution (i.e. based on pKa)* Favoured protonation site in the gas phase (i.e. based on Boltzmann weights)
NAA†*
NCl
OCO
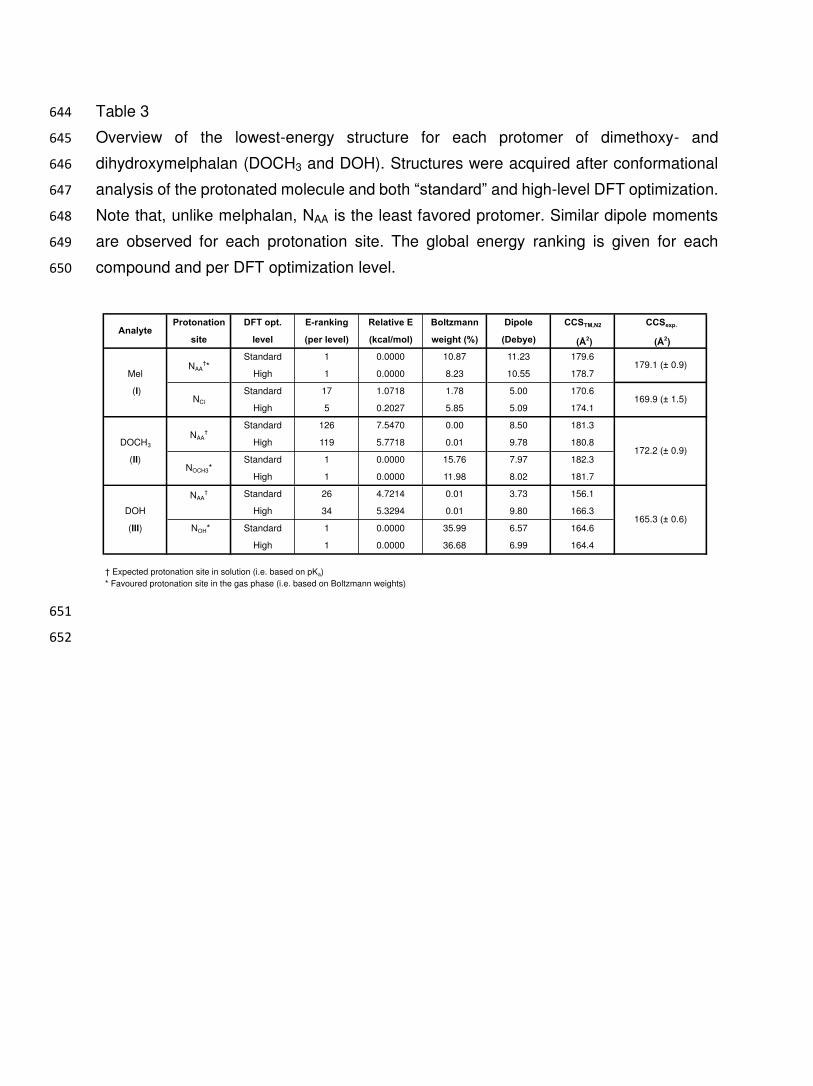
Table 3 644
Overview of the lowest-energy structure for each protomer of dimethoxy- and 645
dihydroxymelphalan (DOCH3 and DOH). Structures were acquired after conformational 646
analysis of the protonated molecule and both “standard” and high-level DFT optimization. 647
Note that, unlike melphalan, NAA is the least favored protomer. Similar dipole moments 648
are observed for each protonation site. The global energy ranking is given for each 649
compound and per DFT optimization level. 650
651
652
Protonation DFT opt. E-ranking Relative E Boltzmann Dipole CCSTM,N2 CCSexp.
site level (per level) (kcal/mol) weight (%) (Debye) (Å2) (Å2)
Standard 1 0.0000 10.87 11.23 179.6
Mel High 1 0.0000 8.23 10.55 178.7
(I) Standard 17 1.0718 1.78 5.00 170.6
High 5 0.2027 5.85 5.09 174.1
Standard 126 7.5470 0.00 8.50 181.3
DOCH3 High 119 5.7718 0.01 9.78 180.8
(II) Standard 1 0.0000 15.76 7.97 182.3
High 1 0.0000 11.98 8.02 181.7
NAA† Standard 26 4.7214 0.01 3.73 156.1
DOH High 34 5.3294 0.01 9.80 166.3
(III) NOH* Standard 1 0.0000 35.99 6.57 164.6
High 1 0.0000 36.68 6.99 164.4
† Expected protonation site in solution (i.e. based on pKa)* Favoured protonation site in the gas phase (i.e. based on Boltzmann weights)
165.3 (± 0.6)
NOCH3*
Analyte
NAA†*
NCl
NAA†
179.1 (± 0.9)
169.9 (± 1.5)
172.2 (± 0.9)
Table 4 653
Overview of the lowest-energy structure for each of the benzocaine and aniline 654
protomers, after conformational analysis of the protonated molecule and both “standard” 655
and high-level DFT optimization. For all molecules (apart from ortho-benzocaine) 656
significantly different CCS values are observed for both protomers. Standard-level DFT 657
optimization tends to underestimate CCS values, but similar dipole moments are 658
observed at both levels anyway. 659
660
661
662
Protonation DFT opt. E-ranking Relative E Boltzmann Dipole CCSTM,N2 CCSexp.
site level (per level) (kcal/mol) weight (%) (Debye) (Å2) (Å2)
Standard 1 0.0000 67.22 2.73 132.0
para-benzocaine High 1 0.0000 74.22 2.62 132.5
(IV) Standard 5 11.6453 0.00 15.75 140.9
High 5 11.9007 0.00 15.59 145.2
Standard 5 9.9485 0.00 0.99 131.0
ortho-benzocaine High 3 9.9485 0.00 1.04 131.0
(V) Standard 1 0.0000 68.58 5.54 131.5
High 1 0.0000 74.59 5.30 133.4
Standard 1 0.0000 45.62 0.96 133.9
meta-benzocaine High 1 0.0000 57.02 0.87 133.5
(VI) Standard 5 1.3987 4.30 13.25 140.8
High 5 2.4900 0.85 13.05 143.8
Standard 1 0.0000 99.22 1.67 111.5
Aniline High 1 0.0000 90.60 1.62 110.7
(VII) Standard 2 2.9687 0.68 7.18 114.9
High 2 1.3535 9.36 7.07 118.5
† Expected protonation site in solution (i.e. based on pKa)* Favoured protonation site in the gas phase (i.e. based on Boltzmann weights)
146.4 (± 0.8)
112.9 (± N/A)
118.0 (± 2.8)
131.7 (± 0.8)
147.5 (± 0.6)
135.2 (± 0.3)
133.6 (± 1.1)
Analyte
ring (para-)*
NNH2†
OCO
NNH2†*
OCO*
NNH2†
OCO*
NNH2†
Table 5 663
Comparison of CCS values calculated for structures with or without their charge 664
distribution. Apart from melphalan (I), the effect of the charge distribution is essential in 665
order to calculate a distinct CCS for each of the compound's protomers. 666
667
Protonation
site Charge distr. No charge distr.
Mel NCl 170.6 149.0
(I) NAA 179.6 155.9
DOCH3 NOCH3 181.7 161.8
(II) NAA 180.8 161.5
DOH NOH 166.3 144.4
(III) NAA 164.4 142.0
para-benzocaine OCO 132.5 109.2
(IV) NNH2 145.2 109.4
ortho-benzocaine OCO 131.0 105.2
(V) NNH2 133.4 106.1
meta-benzocaine OCO 133.5 109.4
(VI) NNH2 143.8 108.8
Aniline ring (para-) 110.7 76.6
(VII) NNH2 118.5 76.6
AnalyteCCScalc. (Å2)


![The Body Manifold: Mathematics (〰ねis)〰ばerformed by the ...eprints.whiterose.ac.uk/102199/2/Body%20Manifold1-2[1].pdf3 confers the ideal embodiment a sense of beauty and truth](https://img.pdfslide.net/doc/110x75/5e8cae6f548af534356dac53/the-body-manifold-mathematics-iserformed-by-the-20manifold1-21pdf.jpg)


![H s ÌÒ ïq B] è · 招 集 ご 通 知 株 主 総 会 参 考 書 類 事 業 報 告 連 結 計 算 書 類 計 算 書 類 監 査 報 告 書 ―2― 〰〰〰〰〰〰〰〰〰〰〰〰〰〰〰〰〰〰〰〰〰〰〰〰〰〰〰〰〰〰〰〰〰〰〰〰〰〰〰〰〰〰](https://img.pdfslide.net/doc/110x75/605521e01c4f7a39f730ff2e/h-s-oe-q-b-e-e-c-c-ef-e-.jpg)