Embed Size (px)
Citation preview
CONCURRENCY AND COMPUTATION: PRACTICE AND EXPERIENCEConcurrency Computat.: Pract. Exper. 2015; 27:3295–3315Published online 4 February 2014 in Wiley Online Library (wileyonlinelibrary.com). DOI: 10.1002/cpe.3221
SPECIAL ISSUE PAPER
Combining geo-referencing and network coding for distributedlarge-scale information management†
Marco Picone1, Michele Amoretti2,*,† , Marco Martalò1,3,Francesco Zanichelli1 and Gianluigi Ferrari1
1Dipartimento di Ingegneria dell’Informazione, Università degli Studi di Parma, Parma, Italy2Centro Interdipartimentale SITEIA.PARMA, Università degli Studi di Parma, Parma, Italy
3E-Campus University, Novedrate, Italy
SUMMARY
The widespread and ubiquitous availability of Internet access enables the collective sharing of huge amountof data generated by heterogeneous sources. For example, the information, which will be exchanged amongentities (sensors, people, and services) of future smart cities to enhance the security and lifestyle of their cit-izens, poses the challenging question of how this information can be efficiently and effectively maintainedacross the city. In this article, we propose a decentralized approach, based on the distributed geographictable (DGT) overlay scheme, which exploits geo-referenced information about nodes to achieve efficientdata management. After recalling DGT main concepts, we illustrate the possible node types and how infor-mation can be published and retrieved within the network. To cope with the unavoidable node failures anddisconnections, our approach leverages upon randomized network coding to increase the robustness of pub-lish/retrieval operations. Evaluation is carried out through an extensive simulation analysis for a realisticurban scenario using the metrics of efficiency in data publication/search, resource availability, and storageoccupancy requirements. Results show the approach effectiveness for large-scale sharing of geo-referencedinformation and tradeoffs between redundancy overhead and resource availability. A few results obtainedwith a preliminary DGT implementation are also presented in the paper. Copyright © 2014 John Wiley &Sons, Ltd.
Received 26 March 2013; Revised 14 October 2013; Accepted 23 December 2013
KEY WORDS: peer-to-peer (P2P); network coding (NC); smart cities
1. INTRODUCTION
The concept of smart city has recently emerged from the interaction of research areas like intel-ligent cities [1] and smart communities [2]. Cities can be considered as systems of systems andoffer tremendous opportunities for the introduction of digital nervous systems, intelligent respon-siveness, and optimization at every level of system integration. For instance, connected vehiclescan participate in the smart mobility subsystem by sharing traffic and travel data as well as receiv-ing information about the nearest available parking slot and other relevant events. In this context,one major aspect being discussed in the research community is the choice between centralized anddecentralized organizations for infrastructures, which need to ensure robust and secure data storage
�This paper has been partially presented at the International Conference on High Performance Computing & Simulation(HPCS), Madrid, Spain, July 2012.*Correspondence to: Michele Amoretti, Centro Interdipartimentale SITEIA.PARMA, Università degli Studi di Parma,
Parma, Italy.†E-mail: [email protected]
Copyright © 2014 John Wiley & Sons, Ltd.
3296 M. PICONE ET AL.
and retrieval [3–5]. The availability of massive amounts of sensed information provides fascinatingopportunities to understand the city activity by means of modeling and analysis. A large amountof information (either raw or aggregated) generated by city actors (both humans and machines)needs to be stored, maintained, and returned, either in proactive or reactive manners, to city actorsthemselves.
In this article, we propose an efficient scheme for maintaining and distributing large amount ofinformation. Our approach consists in defining a peer-to-peer (P2P) network, based on the dis-tributed geographic table (DGT) overlay scheme [6, 20], which allows to store and distribute citystatus information with minimum overhead and high reliability. The use of network coding (NC),and in particular randomized network coding (RNC), allows the achievement of these goals [7].Data regeneration is also necessary to improve the robustness of the system against possible losses.While the DGT approach obtains load balancing and avoids the presence of bottlenecks and sin-gle points of failure, the use of RNC techniques allows data redundancy, which makes informationretrieval extremely reliable and real-time streaming highly efficient. Indeed, RNC improves the per-formance of the DGT, mitigating the block transfer scheduling or piece selection problem, especiallywhen nodes dynamically join/depart from the Internet. Moreover, RNC is important also for anotherfunctionality of the system, that is, distributed storage: should a storage node fail, the stored infor-mation could be retrieved by properly combining the information contained in other storage nodes.Therefore, the system architecture is based on two distinct yet complementary pillars: RNC pro-vides tunable data redundancy for high availability, whereas geo-referencing enables searching fordata fragments in the most probable direction.
Although the idea of combining NC techniques and P2P architectures has already been investi-gated in the literature (see, e.g., [8, 9] and references therein), our work is novel in the sense that itexploits these ideas in a properly designed architecture, which includes different types of peers—data sources, storage nodes, data aggregators, and user nodes—that may be stationary or mobile.The DGT overlay scheme, which takes into account the geographic positions of the peers [20]. TheDGT efficiently supports the publication and search of geo-localized data and, interacting with RNCfunctionalities, allows to maintain the published data either periodically or sporadically. A Sip2Peer-based implementation of the proposed system is under development, with application to a realisticsmart city scenario imagined for the city of Parma, Italy.
The paper is organized as follows. In Section 2, we briefly discuss the reference works in the fieldsof P2P and NC. In Section 3, our joint DGT/RNC-based architecture for information maintenanceand distribution is illustrated. In Section 4, we derive a simple, but insightful, analytical frameworkto characterize the performance, in terms of publication and search hops, of the proposed archi-tecture. In Section 5, the performance of the proposed solution is evaluated, through simulations,considering realistic dynamic scenarios and validating the analytical results. A preliminary DGTimplementation, based on the open source Sip2Peer middleware, and corresponding experimentalresults are presented in Section 6. Finally, Section 7 concludes the paper.
2. RELATED WORK
The adoption of fully decentralized approaches for highly pervasive monitoring, data aggregation,and information sharing within cities is a new research topic that is gaining momentum because ofthe availability of a new generation of smart devices. In particular, the P2P paradigm enables twoor more entities to collaborate spontaneously in a network of ‘equals’ (peers) by using appropri-ate information and communication systems without the need for central coordination. In the lastdecade, P2P has been studied and applied to different application scenarios, from file sharing tolive multimedia streaming [10]. Recent research is focusing on P2P-based large-scale storage sys-tems [11], distributed hash tables [12], social networks [13], and measurements of real systems[14]. Particularly promising are the P2P approaches based on geographic localization, for example,Globase.KOM [15] and those based on traffic information [4].
NC is a recently proposed network-oriented channel coding paradigm, arisen in the field of infor-mation theory, which generalizes the classical concept of routing in wired networks [16]. With NC,in fact, intermediate nodes are not only allowed to forward incoming packets but also to encode
Copyright © 2014 John Wiley & Sons, Ltd. Concurrency Computat.: Pract. Exper. 2015; 27:3295–3315DOI: 10.1002/cpe
GEO-REFERENCING AND NETWORK CODING 3297
them. This allows to achieve the multicast capacity [16] and, therefore, leads to potential advantagesin terms of bandwidth and computational efficiency, robustness, and other performance metrics.Although NC has been extensively studied from a theoretical point of view, several practical scenar-ios, where benefits can be observed, have been proposed in the last years. An example of applicationdomain is distributed storage [7]. In a previous work, we illustrated how NC and P2P can be enablingtechnologies for robust distributed storage [17]. NC has also been considered in [18], where theauthors have implemented a prototype NC/P2P filecasting system and tested it in the distribution oflarge files (e.g., several GBytes) over the Internet. Their experimental results are very encouraging,although the considered scenario is quite simpler than the one we address in this paper.
3. SYSTEM ARCHITECTURE
In this section, we illustrate our distributed architecture for the management of information flowsin smart cities. We first recall the main features of the DGT overlay scheme, which allows everynode to maintain knowledge about surrounding peers, as well as to publish and retrieve data items.We also illustrate how NC techniques are exploited to ensure data survival. Note that these twoparts currently focus on different system aspects: RNC allows to have tunable data redundancy forhigh availability, whereas geo-referencing enables searching for data fragments in the most proba-ble direction. Future work will investigate the possibility of tighter interoperation between the twopillars of system architecture.
3.1. Distributed geographic table
A structured decentralized P2P overlay is characterized by a controlled overlay, shaped in a waythat resources (or resource advertisements) are placed at appropriate locations [10]. Moreover, aglobally consistent protocol ensures that any node can efficiently route a search to some peer that hasthe desired resource, even if the resource is extremely rare. Beyond basic routing correctness, twoimportant constraints on the topology are (i) a sufficiently small maximum number of hops in anyroute, so that requests complete quickly and (ii) a sufficiently small maximum number of neighborsof any node, so that maintenance overhead is limited.
The DGT is a structured overlay scheme where each participant can efficiently retrieve node orresource information (data or services) located near any chosen geographic position [19, 20]. Insuch a system, the responsibility for maintaining information about the position of active peers isdistributed among nodes, for which a change in the set of participants causes a minimal amountof disruption. The interested reader on the main DGT concepts is referred to the previous work byPicone et al. [20]. In the following, we focus on the routing strategy, whose proper extension to thesmart city scenario of interest is one of the novel contributions of this work. DGT routing parametersare summarized in Table I and explained in the following.
The DGT routing strategy is a function R that, given a geographic position !, returns the set ofnodes N.!; a/ that are in the interest region a and satisfy the request. Therefore, a routing queryissued by node p has the following structure: route.p; !; a/. The routing strategy is used not onlyto maintain the neighborhood of a peer but also to discover active peers in a remote region of interest.
Table I. DGT routing parameters.
! Geographic position
a Interest regionN.!; a/ Nodes in region a centered in !R Routing functionp Generic noderoute.p; !; a/ Routing query�t Time range of a query’s reply
DGT, distributed geographic table.
Copyright © 2014 John Wiley & Sons, Ltd. Concurrency Computat.: Pract. Exper. 2015; 27:3295–3315DOI: 10.1002/cpe
3298 M. PICONE ET AL.
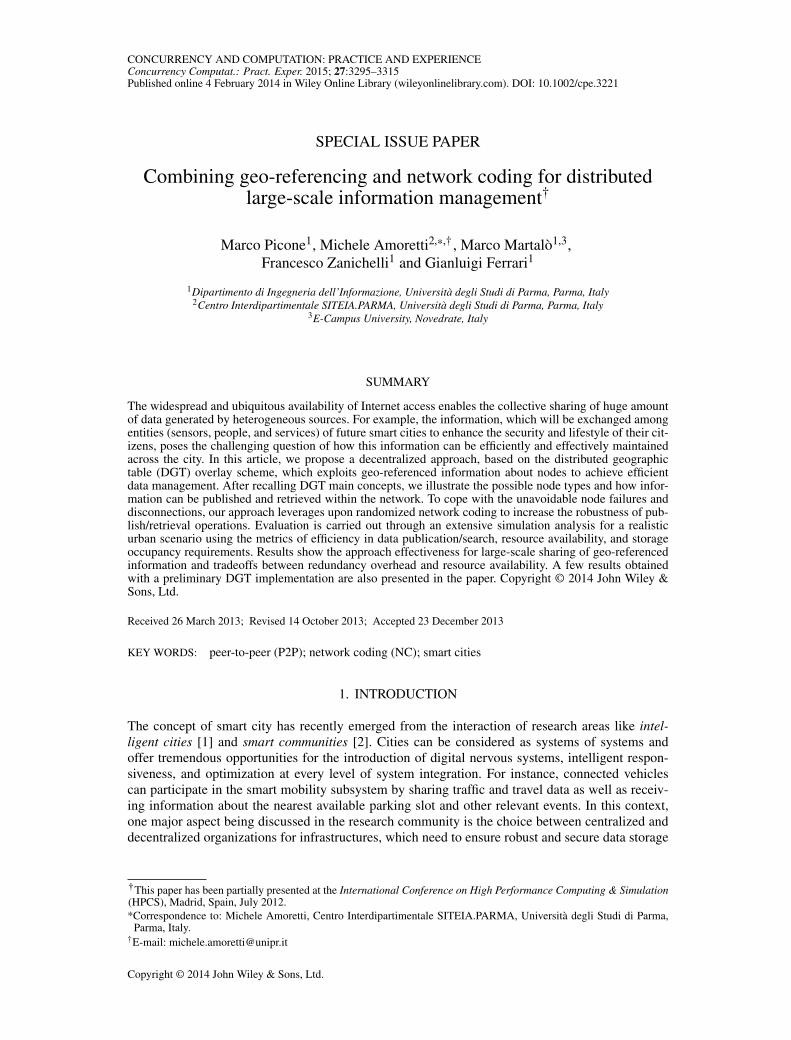
Figure 1. Propagation of a query between nodes to retrieve the neighborhood of a remote region of interest.
Figure 1 shows the propagation of a query between nodes, to retrieve the neighborhood of a remoteregion of interest.
The query propagation process is affected by (i) the distance between the source and the des-tination of the query itself and (ii) the size of the neighborhood region. Two kind of queries areenvisioned. The first query returns the list of nodes that are interested on a type of data within aregion centered in a specific position, defined by its latitude and longitude—such a list can be usedfor publication purposes. The second query returns the list of nodes that own a type of data, in anarea that is centered in a specific position defined by its world’s coordinate, being such data notolder than the specified time range �t . Such a list can be used for retrieval purposes.
3.2. Node description
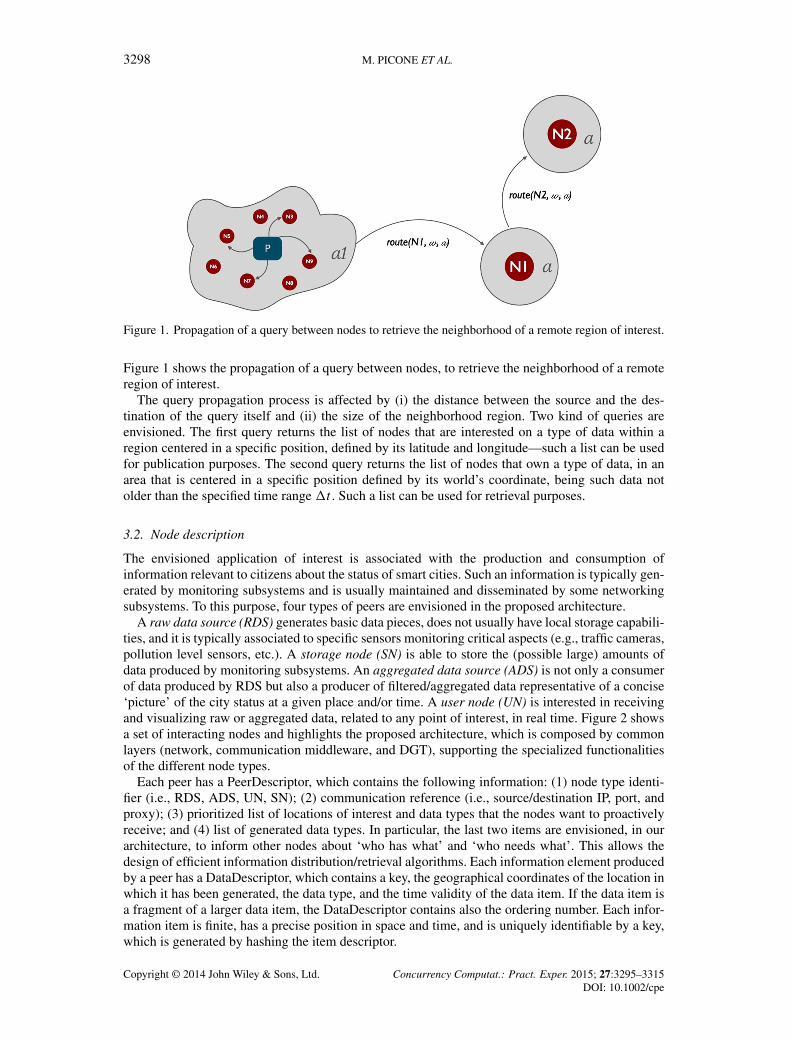
The envisioned application of interest is associated with the production and consumption ofinformation relevant to citizens about the status of smart cities. Such an information is typically gen-erated by monitoring subsystems and is usually maintained and disseminated by some networkingsubsystems. To this purpose, four types of peers are envisioned in the proposed architecture.
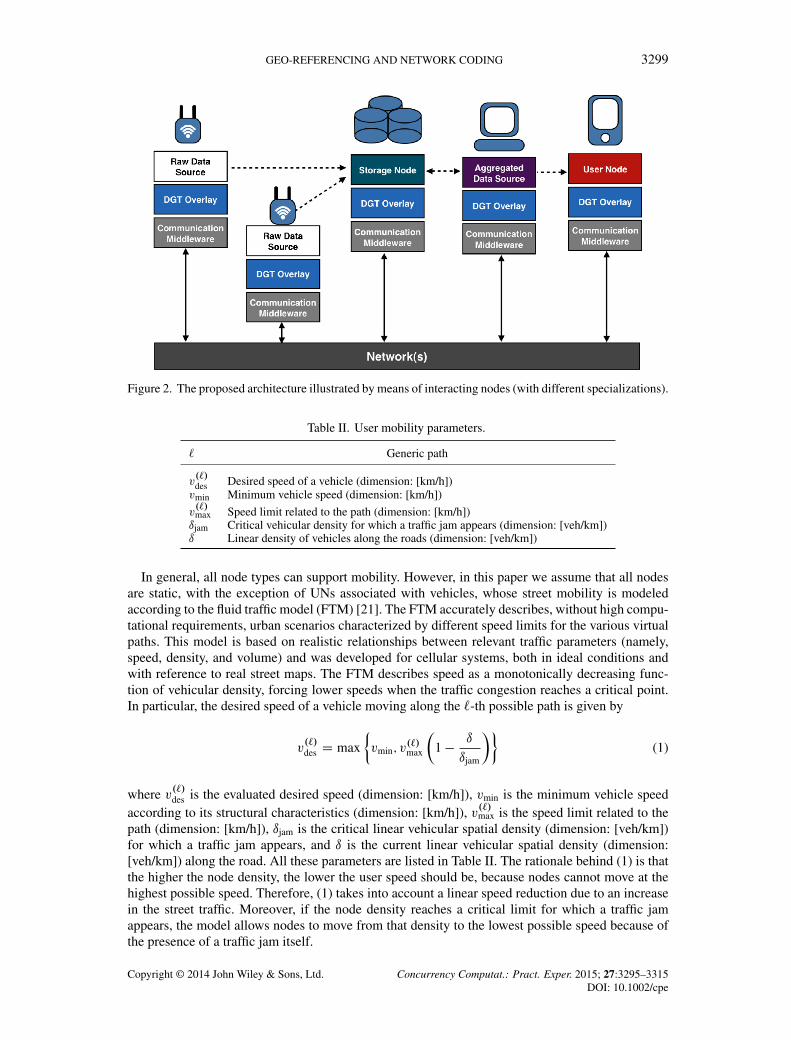
A raw data source (RDS) generates basic data pieces, does not usually have local storage capabili-ties, and it is typically associated to specific sensors monitoring critical aspects (e.g., traffic cameras,pollution level sensors, etc.). A storage node (SN) is able to store the (possible large) amounts ofdata produced by monitoring subsystems. An aggregated data source (ADS) is not only a consumerof data produced by RDS but also a producer of filtered/aggregated data representative of a concise‘picture’ of the city status at a given place and/or time. A user node (UN) is interested in receivingand visualizing raw or aggregated data, related to any point of interest, in real time. Figure 2 showsa set of interacting nodes and highlights the proposed architecture, which is composed by commonlayers (network, communication middleware, and DGT), supporting the specialized functionalitiesof the different node types.
Each peer has a PeerDescriptor, which contains the following information: (1) node type identi-fier (i.e., RDS, ADS, UN, SN); (2) communication reference (i.e., source/destination IP, port, andproxy); (3) prioritized list of locations of interest and data types that the nodes want to proactivelyreceive; and (4) list of generated data types. In particular, the last two items are envisioned, in ourarchitecture, to inform other nodes about ‘who has what’ and ‘who needs what’. This allows thedesign of efficient information distribution/retrieval algorithms. Each information element producedby a peer has a DataDescriptor, which contains a key, the geographical coordinates of the location inwhich it has been generated, the data type, and the time validity of the data item. If the data item isa fragment of a larger data item, the DataDescriptor contains also the ordering number. Each infor-mation item is finite, has a precise position in space and time, and is uniquely identifiable by a key,which is generated by hashing the item descriptor.
Copyright © 2014 John Wiley & Sons, Ltd. Concurrency Computat.: Pract. Exper. 2015; 27:3295–3315DOI: 10.1002/cpe
GEO-REFERENCING AND NETWORK CODING 3299
Figure 2. The proposed architecture illustrated by means of interacting nodes (with different specializations).
Table II. User mobility parameters.
` Generic path
v.`/des Desired speed of a vehicle (dimension: [km/h])vmin Minimum vehicle speed (dimension: [km/h])
v.`/max Speed limit related to the path (dimension: [km/h])ıjam Critical vehicular density for which a traffic jam appears (dimension: [veh/km])ı Linear density of vehicles along the roads (dimension: [veh/km])
In general, all node types can support mobility. However, in this paper we assume that all nodesare static, with the exception of UNs associated with vehicles, whose street mobility is modeledaccording to the fluid traffic model (FTM) [21]. The FTM accurately describes, without high compu-tational requirements, urban scenarios characterized by different speed limits for the various virtualpaths. This model is based on realistic relationships between relevant traffic parameters (namely,speed, density, and volume) and was developed for cellular systems, both in ideal conditions andwith reference to real street maps. The FTM describes speed as a monotonically decreasing func-tion of vehicular density, forcing lower speeds when the traffic congestion reaches a critical point.In particular, the desired speed of a vehicle moving along the `-th possible path is given by
v.`/des D max
²vmin; v
.`/max
�1 �
ı
ıjam
�³(1)
where v.`/des is the evaluated desired speed (dimension: [km/h]), vmin is the minimum vehicle speedaccording to its structural characteristics (dimension: [km/h]), v.`/max is the speed limit related to thepath (dimension: [km/h]), ıjam is the critical linear vehicular spatial density (dimension: [veh/km])for which a traffic jam appears, and ı is the current linear vehicular spatial density (dimension:[veh/km]) along the road. All these parameters are listed in Table II. The rationale behind (1) is thatthe higher the node density, the lower the user speed should be, because nodes cannot move at thehighest possible speed. Therefore, (1) takes into account a linear speed reduction due to an increasein the street traffic. Moreover, if the node density reaches a critical limit for which a traffic jamappears, the model allows nodes to move from that density to the lowest possible speed because ofthe presence of a traffic jam itself.
Copyright © 2014 John Wiley & Sons, Ltd. Concurrency Computat.: Pract. Exper. 2015; 27:3295–3315DOI: 10.1002/cpe
3300 M. PICONE ET AL.
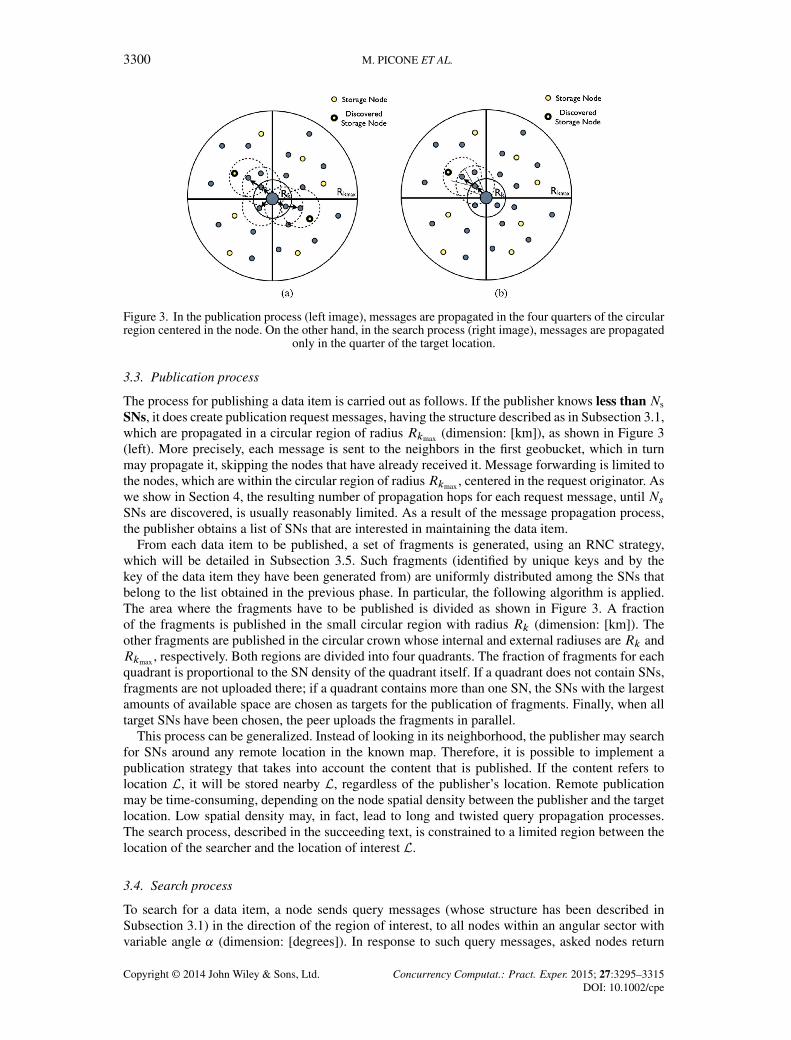
Figure 3. In the publication process (left image), messages are propagated in the four quarters of the circularregion centered in the node. On the other hand, in the search process (right image), messages are propagated
only in the quarter of the target location.
3.3. Publication process
The process for publishing a data item is carried out as follows. If the publisher knows less than Ns
SNs, it does create publication request messages, having the structure described as in Subsection 3.1,which are propagated in a circular region of radius Rkmax (dimension: [km]), as shown in Figure 3(left). More precisely, each message is sent to the neighbors in the first geobucket, which in turnmay propagate it, skipping the nodes that have already received it. Message forwarding is limited tothe nodes, which are within the circular region of radiusRkmax , centered in the request originator. Aswe show in Section 4, the resulting number of propagation hops for each request message, until NsSNs are discovered, is usually reasonably limited. As a result of the message propagation process,the publisher obtains a list of SNs that are interested in maintaining the data item.
From each data item to be published, a set of fragments is generated, using an RNC strategy,which will be detailed in Subsection 3.5. Such fragments (identified by unique keys and by thekey of the data item they have been generated from) are uniformly distributed among the SNs thatbelong to the list obtained in the previous phase. In particular, the following algorithm is applied.The area where the fragments have to be published is divided as shown in Figure 3. A fractionof the fragments is published in the small circular region with radius Rk (dimension: [km]). Theother fragments are published in the circular crown whose internal and external radiuses are Rk andRkmax , respectively. Both regions are divided into four quadrants. The fraction of fragments for eachquadrant is proportional to the SN density of the quadrant itself. If a quadrant does not contain SNs,fragments are not uploaded there; if a quadrant contains more than one SN, the SNs with the largestamounts of available space are chosen as targets for the publication of fragments. Finally, when alltarget SNs have been chosen, the peer uploads the fragments in parallel.
This process can be generalized. Instead of looking in its neighborhood, the publisher may searchfor SNs around any remote location in the known map. Therefore, it is possible to implement apublication strategy that takes into account the content that is published. If the content refers tolocation L, it will be stored nearby L, regardless of the publisher’s location. Remote publicationmay be time-consuming, depending on the node spatial density between the publisher and the targetlocation. Low spatial density may, in fact, lead to long and twisted query propagation processes.The search process, described in the succeeding text, is constrained to a limited region between thelocation of the searcher and the location of interest L.
3.4. Search process
To search for a data item, a node sends query messages (whose structure has been described inSubsection 3.1) in the direction of the region of interest, to all nodes within an angular sector withvariable angle ˛ (dimension: [degrees]). In response to such query messages, asked nodes return
Copyright © 2014 John Wiley & Sons, Ltd. Concurrency Computat.: Pract. Exper. 2015; 27:3295–3315DOI: 10.1002/cpe

GEO-REFERENCING AND NETWORK CODING 3301
Table III. Publication and search parameters.
Rk Radius of the first geobucket (dimension: [km])
RkmaxRadius of the most external geobucket (dimension: [km])
L Location of interest (geographic coordinates)˛ Angle of the angular sector where a search takes place (dimension: [degrees])
Table IV. RNC parameters.
M Size of a generic file (dimension: [Bytes])
Ng Number of generations (dimension: [gen])Nf Number of fragments in one generation (dimension: [frag/gen])si i -th fragmentdf Fragment size (dimension: [Bytes/frag])GF(q) Galois field of size q (adimensional)K Overhead factor (adimensional)Rc Coding rate (adimensional)� Guard threshold (dimension: [frag])� Fraction of the number of coded fragments (adimensional)n Number of coded fragments (dimension: [frag])TM Maintenance period (dimension: [s])
RNC, randomized network coding.
lists of SNs that are aware of the searched data item (because they own some fragments). The angle˛ of the search angular sector can be increased if the dimension of the retrieved list of nodes is notsatisfactory. In this paper, we assume that ˛ can vary between ˛min D 30
ı and ˛max D 60ı. Although
these values may be optimized through proper analysis or simulations, they have been heuristicallychosen so as to produce at least sufficient results in a smart city scenario. In fact, our simulationssuggest that a node looking in such a region is able, through the proposed approach, to recover theinformation of interest in its application.
After a short time, the node that started the request propagation has a list of Nk SNs that areaware of the data item of interest. It is then sufficient to contact a subset of such SNs to rebuild theoriginal data item, as discussed in detail in Subsection 3.5. If, otherwise, the publisher is not online,the searcher can collect a number of fragments from the SNs that have declared to be aware of thedata item. Our system is robust against churns, because new fragments of the same data item areperiodically generated (until the time validity of the data item expires) according to the strategiesdescribed in Subsection 3.5.
The process is illustrated in Figure 3 (right). Like the publication process, also the search pro-cess can be generalized, that is, instead of looking in its neighborhood, the searcher may look forpeers around any remote location in the known map. The publication and search parameters aresummarized in Table III.
3.5. Randomized network coding strategy
In the following, we detail the RNC operations performed during the publication, retrieval, andmaintenance of a given resource in the network. For the sake of clarity, the parameters of the RNCstrategy are listed in Table IV.
A file of size M (dimension: [Bytes]), which needs to be stored, is divided into Ng (dimen-sion: [gen]) generations composed of Nf fragments (dimension: [frag/gen]) ¹siº
NfiD1 each, so that
M D NgNfdf, df being the size of each fragment (dimension: [Bytes/frag]).‡ We now focus ona single generation, because all the operations are the same for each generation. The fragments ofa generation can be interpreted as symbols in the Galois field GF(q) and are linearly combined in
‡Because all fragments are supposed to have the same size, if a generation is composed by less than Nf fragments, zeropadding is applied.
Copyright © 2014 John Wiley & Sons, Ltd. Concurrency Computat.: Pract. Exper. 2015; 27:3295–3315DOI: 10.1002/cpe
3302 M. PICONE ET AL.
order to obtain the coded fragments. The number of linearly encoded fragments is equal to n D KNf
(dimension: [frag]), K being the overhead factor (adimensional). This corresponds, from a codingtheory perspective, to a coding rate Rc D 1=K (adimensional). In the presence of RNC, each coef-ficient of the linear combinations is uniformly chosen among all possible values in GF(q). Thisimplies that there exists a nonzero probability that two coded packets are linearly dependent. How-ever, it is well known that this probability is basically zero if q is sufficiently large [22]. Each packetflowing in the network contains a coded payload and a header, which carries information about thegeneration (which the fragment belongs to) and the global coding vector of dimension Nf (i.e., thecoefficients representing the linear combination of the original symbols). This has been shown tointroduce small overhead for practical packet sizes [23].
To retrieve a published file, it is necessary to obtain, for each generation, using the previouslyillustrated lookup functionality,Nf linearly independent fragments. After these fragments have beencollected, a system of linear equations can be solved using the classical Gauss elimination algorithm.
The use of RNC can be taken into account in order to perform the following novel proactiveresource maintenance strategy. Whenever a UN retrieves a resource, it generates a given numberof new fragments for each generation, also checking for network dynamic condition evolution. Inparticular, the more dynamic the network conditions (e.g., large churns), the larger the number ofgenerated fragments, in order to make the scheme more robust against nodes’ failures. In additionto this strategy, resource maintenance can also be carried out reactively, by periodically (i.e., everyTM seconds) checking the availability, in the SNs, of the resources. If, for each generation, the per-centage of surviving fragments falls below a properly defined retrieval ‘guard threshold’ (whichrepresents the fraction of fragments below which the resource is likely to become soon unavailable),the node responsible for that resource generates new fragments independent of the surviving ones,and distributes them in SNs. The threshold is denoted as � (dimension: [frag]) and is equal to afraction of the total number of fragments, that is, � , �n, � 2 Œ1=K; 1� (adimensional). The num-ber of new generated fragments is chosen so that the overall number of available fragments for ageneration is equal to n, that is, the published number of fragments.
Note that, in the proposed system, proactive maintenance is performed only when a client hasfinished a successful download, and, therefore, a resource may not be regularly maintained if it isnot sufficiently ‘popular’. However, the complexity of the maintenance operations can be reducedsignificantly with respect to the reactive approach. Moreover, as the number of exchanged controlmessages is significantly smaller, the bandwidth waste is lower. Therefore, an enhanced solutionmay combine these two techniques in order to obtain an efficient maintenance also for non popularresources. In this case, in fact, resource is reactively maintained by generating new fragments whenthe resource is downloaded. However, centralized maintenance is also performed with period T 0M(dimension: [s]) so that a sufficient amount of redundancy is guaranteed for all resources. Note that,in general, T 0M ¤ TM.
In the following, we will refer to the reactive strategy as ‘periodic maintenance’ (PM), whereas thenew proactive strategy will be denoted as ‘sporadic maintenance’ (SM). The intermediate strategywill be finally denoted as ‘hybrid maintenance’ (HM). Note that, in all cases, according to thetaxonomy in [7], the maintenance strategy aims at performing functional repair and not exact repair.For all considered strategies, in fact, the new generated fragments are not exactly the same as thoselost by disconnected nodes, but they exhibit the same statistical characteristics.
4. ANALYTICAL SYSTEM PERFORMANCE EVALUATION FRAMEWORK
In this section, we describe an analytical framework to characterize system performance, anticipat-ing some of the results of simulations and experiments later shown in Sections 5 and 6, respectively.Such a model relies on control parameters, which are independent from the network size. Thus, itwill be useful to predict the system behavior where lengthy simulations or large-scale experimentswould be needed or even impossible to perform. In particular, we characterize the performance ofthe overlay architecture in terms of hops needed to publish and/or recovery information. The analyt-ical performance evaluation of the coding strategy, taking into account resource availability, is notconsidered, as this was already investigated in our previous works [17, 24].
Copyright © 2014 John Wiley & Sons, Ltd. Concurrency Computat.: Pract. Exper. 2015; 27:3295–3315DOI: 10.1002/cpe
GEO-REFERENCING AND NETWORK CODING 3303
Therefore, let us now compute the probability mass function (PMF) of the number of hops Hneeded to find a given number, denoted as Ns , of storage nodes — H > 0, and we refer to thecase with H D 0 as the initial number of known storage nodes (to account for a possible initialknowledge). To this end, we first evaluate the CDF of H , that is,§FH .h/ D P ¹H <D hº. Notethat FH .h/ can be equivalently reinterpreted as the probability of finding Ns storage nodes with nomore than h hops. The following assumptions are expedient for our analysis:
� The request issuer initially knows 0 6 ks.0/ < Ns storage nodes.� The request is sent to the m neighbors in the first geobucket.� Each request copy is then possibly propagated to one other node, among those that have not
yet received the request.� Each node other than the request issuer returns, on average, ns different storage nodes not
known to the request issuer.
The number of storage nodes known after propagating the request on h hops is denoted as ks.h/
(ks.h/ 6 Ns), where we have explicitly indicated the dependence on h, and can be computedaccording the following recursive equation:
ks.h/ D ks.h � 1/C�h
where
�h D
�1 �
ks.h � 1/
Ns
�m � ns (2)
is the increment of knowledge after propagating requests over the h-th hop. The rationale behindthis choice is due to the fact that the function should be decreasing with the number of hops and,when ks.h/ D Ns, no further increment of knowledge is possible.
Equation (4) can be equivalently rewritten as
ks.h/ D ks.h � 1/
�1 �
m � ns
Ns
�Cm � ns
D Bks.h � 1/C C
where
C D m � ns
B D 1 �C
Ns:
Expanding the recursive equation leads to
ks.h/ D Bhks.0/C .B
h�1 C :::C B C 1/C
D Bhks.0/C C
h�1XiD0
B i :
Finally, observing that B < 1, the CDF of H can be written as
FH .h/ ,ks.h/
Ns � ks.0/: (3)
§We remark that the CDF FH .h/ is, correctly, a conditional CDF, as it is conditioned on the number Ns of storagenodes. For the sake of notational simplicity, we simply use the notation FH .h/, rather than FH .hjNs/. The samecomment applies also to the corresponding PMF.
Copyright © 2014 John Wiley & Sons, Ltd. Concurrency Computat.: Pract. Exper. 2015; 27:3295–3315DOI: 10.1002/cpe
3304 M. PICONE ET AL.
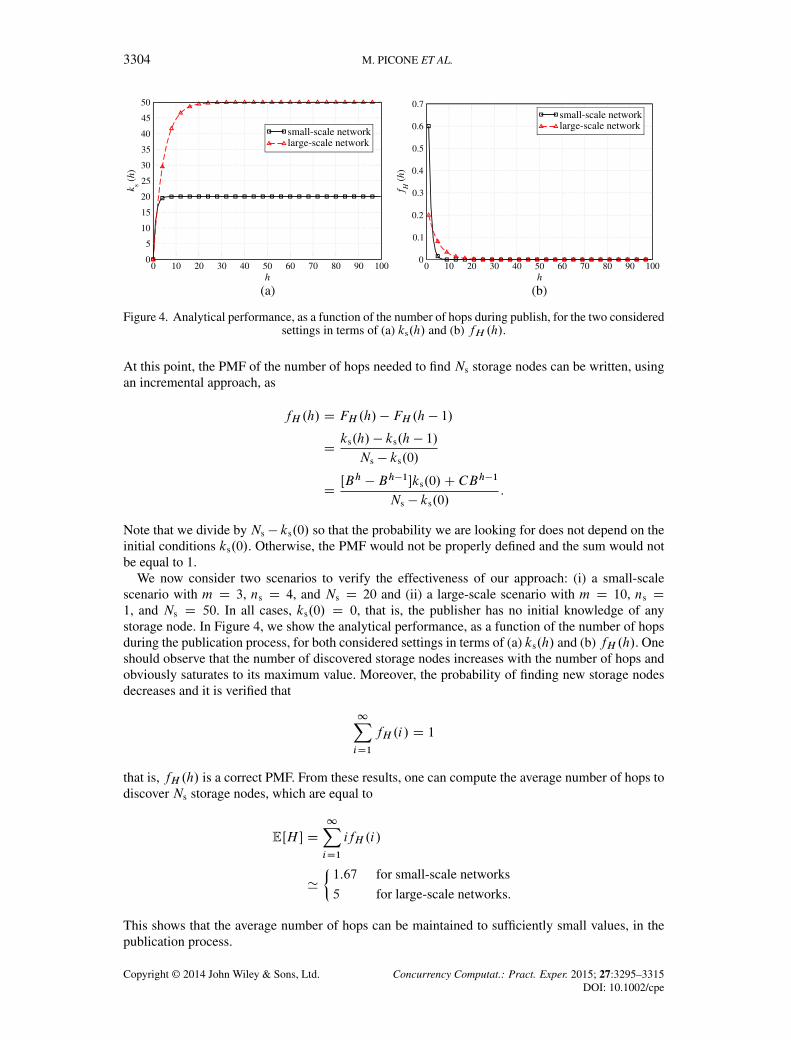
(a) (b)
Figure 4. Analytical performance, as a function of the number of hops during publish, for the two consideredsettings in terms of (a) ks.h/ and (b) fH .h/.
At this point, the PMF of the number of hops needed to find Ns storage nodes can be written, usingan incremental approach, as
fH .h/ D FH .h/ � FH .h � 1/
Dks.h/ � ks.h � 1/
Ns � ks.0/
DŒBh � Bh�1�ks.0/C CB
h�1
Ns � ks.0/:
Note that we divide by Ns � ks.0/ so that the probability we are looking for does not depend on theinitial conditions ks.0/. Otherwise, the PMF would not be properly defined and the sum would notbe equal to 1.
We now consider two scenarios to verify the effectiveness of our approach: (i) a small-scalescenario with m D 3, ns D 4, and Ns D 20 and (ii) a large-scale scenario with m D 10, ns D1, and Ns D 50. In all cases, ks.0/ D 0, that is, the publisher has no initial knowledge of anystorage node. In Figure 4, we show the analytical performance, as a function of the number of hopsduring the publication process, for both considered settings in terms of (a) ks.h/ and (b) fH .h/. Oneshould observe that the number of discovered storage nodes increases with the number of hops andobviously saturates to its maximum value. Moreover, the probability of finding new storage nodesdecreases and it is verified that
1XiD1
fH .i/ D 1
that is, fH .h/ is a correct PMF. From these results, one can compute the average number of hops todiscover Ns storage nodes, which are equal to
EŒH � D1XiD1
ifH .i/
'
²1:67 for small-scale networks
5 for large-scale networks.
This shows that the average number of hops can be maintained to sufficiently small values, in thepublication process.
Copyright © 2014 John Wiley & Sons, Ltd. Concurrency Computat.: Pract. Exper. 2015; 27:3295–3315DOI: 10.1002/cpe
GEO-REFERENCING AND NETWORK CODING 3305
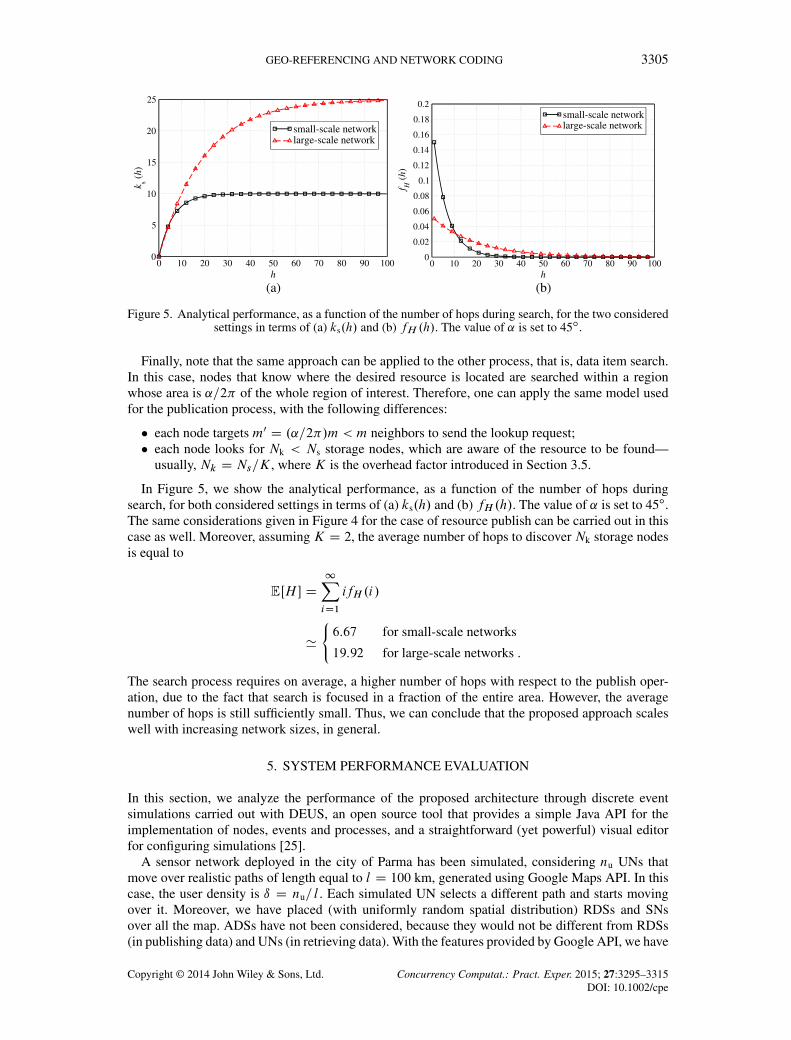
(a) (b)
Figure 5. Analytical performance, as a function of the number of hops during search, for the two consideredsettings in terms of (a) ks.h/ and (b) fH .h/. The value of ˛ is set to 45ı.
Finally, note that the same approach can be applied to the other process, that is, data item search.In this case, nodes that know where the desired resource is located are searched within a regionwhose area is ˛=2� of the whole region of interest. Therefore, one can apply the same model usedfor the publication process, with the following differences:
� each node targets m0 D .˛=2�/m < m neighbors to send the lookup request;� each node looks for Nk < Ns storage nodes, which are aware of the resource to be found—
usually, Nk D Ns=K, where K is the overhead factor introduced in Section 3.5.
In Figure 5, we show the analytical performance, as a function of the number of hops duringsearch, for both considered settings in terms of (a) ks.h/ and (b) fH .h/. The value of ˛ is set to 45ı.The same considerations given in Figure 4 for the case of resource publish can be carried out in thiscase as well. Moreover, assuming K D 2, the average number of hops to discover Nk storage nodesis equal to
EŒH � D1XiD1
ifH .i/
'
´6:67 for small-scale networks
19:92 for large-scale networks .
The search process requires on average, a higher number of hops with respect to the publish oper-ation, due to the fact that search is focused in a fraction of the entire area. However, the averagenumber of hops is still sufficiently small. Thus, we can conclude that the proposed approach scaleswell with increasing network sizes, in general.
5. SYSTEM PERFORMANCE EVALUATION
In this section, we analyze the performance of the proposed architecture through discrete eventsimulations carried out with DEUS, an open source tool that provides a simple Java API for theimplementation of nodes, events and processes, and a straightforward (yet powerful) visual editorfor configuring simulations [25].
A sensor network deployed in the city of Parma has been simulated, considering nu UNs thatmove over realistic paths of length equal to l D 100 km, generated using Google Maps API. In thiscase, the user density is ı D nu=l . Each simulated UN selects a different path and starts movingover it. Moreover, we have placed (with uniformly random spatial distribution) RDSs and SNsover all the map. ADSs have not been considered, because they would not be different from RDSs(in publishing data) and UNs (in retrieving data). With the features provided by Google API, we have
Copyright © 2014 John Wiley & Sons, Ltd. Concurrency Computat.: Pract. Exper. 2015; 27:3295–3315DOI: 10.1002/cpe
3306 M. PICONE ET AL.
Table V. Main simulation parameters.
Number of SNs 50
Number of RDSs 500Rkmax
2.5 kmSearch angle ˛ 30ı (first attempt) and 60ı (other attempts)Disk space for each SN Uniformly between 10 and 100 GBResource size M Uniform in Œ1; 35� MBSimulated time interval 10 hResource search period Ts 3 minPath length l 100 kmNumber of independent trials 20
RDS, raw data source; SN, storage node.
created a simple HTML&Javascript control page, which allows to monitor the temporal progressionof the simulated system, with the possibility to select any node and visualize its neighborhood(videos are available at [27]).
The considered setup is summarized in Table V. The network is composed of 50 SNs and 500RDSs. The number of randomly placed UNs is such that a given linear density of ı (nodes/km) overthe roads is obtained. In particular, a path length of 100 km is considered, and ı varies from 5 to 40so that
# of UNs D ı � l D 100ı 2 Œ500; 4000�:
The storage space at each SN is a uniformly distributed random variable between 10 and 100 GB.As in [20], each node covers a region of interest of size A D 20 km2 so that the maximum radius is
Rkmax D
rA
�' 2:5 km
and a dynamic discovery period ranging from 1:5 to 6 min, depending on the number of discov-ered nodes. The more the geobuckets are filled, the more the discovery period is high. The systemparameters for the coding and maintenance strategies are set as in [17]. The lifetime of the systemis set to 10 h. Within the first 4 h, the overlay is initialized and stabilized, whereas from the fifthhour RDSs begin publishing data resources. From the sixth hour, UNs start searching contents atrandom locations implemented using a Poisson process with a mean arrival of approximately 40 s.Moreover, in this last phase storage, nodes are randomly disconnected, according to the followingdifferent scenarios:
1. Burst of SN disconnections during the sixth hour of the observed period: at the end of the sixthhour, the number of SNs has been reduced to 10.
2. SN disconnections over the second half of the observed period: the final number of SNs is 10as in the first scenario.
3. Continuous disconnections and reconnections of SN modeled with a Poisson process with amean arrival equal to 1.5 min.
Simulation results have been averaged over 20 independent simulation runs in order to reducestatistical fluctuations.
Regarding data publication and search, the following performance metrics are of interest:
� average number of hops per publication;� average number of exchanged messages per publication required to find an SN;� average number of hops per search;� average number of exchanged messages per search.
Copyright © 2014 John Wiley & Sons, Ltd. Concurrency Computat.: Pract. Exper. 2015; 27:3295–3315DOI: 10.1002/cpe
GEO-REFERENCING AND NETWORK CODING 3307
5 10 15 20 25 30 35 40δ
0
1
2
3
4
5
Ave
rage
Num
ber
of H
ops
PublicationSearch
Figure 6. Average number of message propagations (hops) to discover storage nodes (SNs) for publishingor searching data as functions of the user node (UN) density.
The impact of coding, instead, has been evaluated through the following performance metrics:
� resource availability, defined as the probability that a given resource in the network can bereconstructed;� average used storage space on each SN (dimension: [GB]).
Unfortunately, each distributed geo-referencing information management system has its ownparameters and performance indicators, and, therefore, it is difficult to make a fair comparison withour system. As an example, the Globase.KOM architecture proposed by Kovacevic et al. [15] appar-ently needs more hops and shows higher delay than our approach. However, their simulated scenariois different (and impossible to be reproduced) with respect to ours and, therefore, the comparisonmay not be meaningful.
5.1. Publication and search
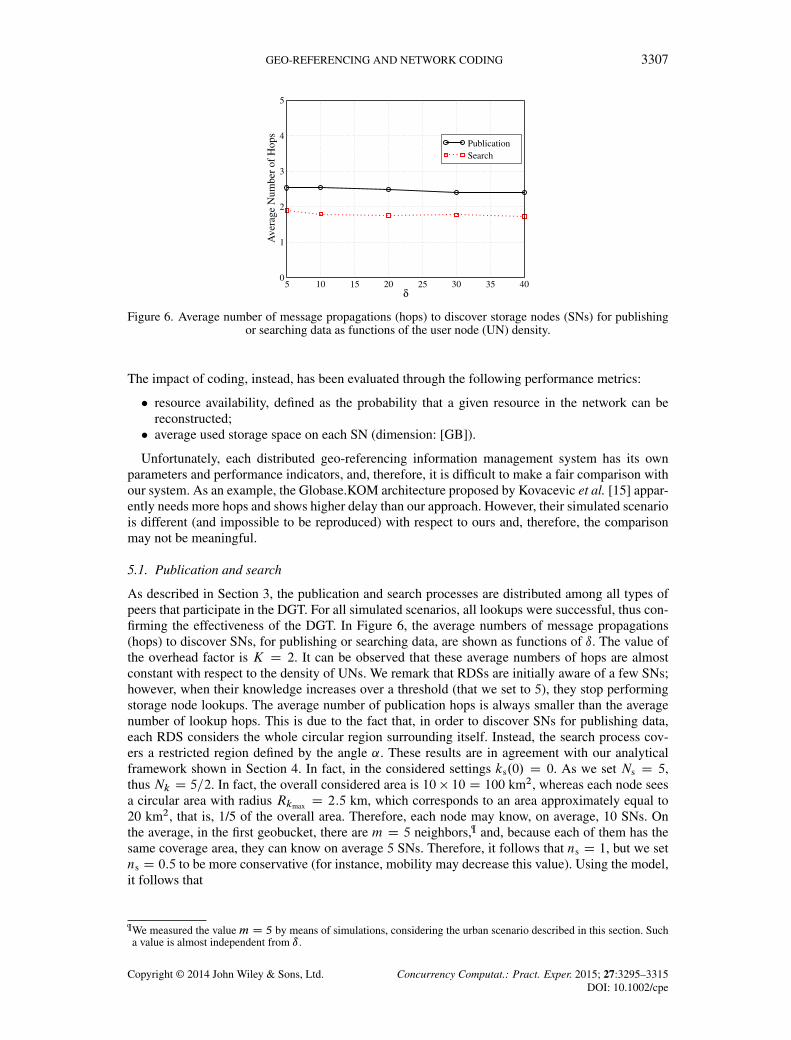
As described in Section 3, the publication and search processes are distributed among all types ofpeers that participate in the DGT. For all simulated scenarios, all lookups were successful, thus con-firming the effectiveness of the DGT. In Figure 6, the average numbers of message propagations(hops) to discover SNs, for publishing or searching data, are shown as functions of ı. The value ofthe overhead factor is K D 2. It can be observed that these average numbers of hops are almostconstant with respect to the density of UNs. We remark that RDSs are initially aware of a few SNs;however, when their knowledge increases over a threshold (that we set to 5), they stop performingstorage node lookups. The average number of publication hops is always smaller than the averagenumber of lookup hops. This is due to the fact that, in order to discover SNs for publishing data,each RDS considers the whole circular region surrounding itself. Instead, the search process cov-ers a restricted region defined by the angle ˛. These results are in agreement with our analyticalframework shown in Section 4. In fact, in the considered settings ks.0/ D 0. As we set Ns D 5,thus Nk D 5=2. In fact, the overall considered area is 10 � 10 D 100 km2, whereas each node seesa circular area with radius Rkmax D 2:5 km, which corresponds to an area approximately equal to20 km2, that is, 1/5 of the overall area. Therefore, each node may know, on average, 10 SNs. Onthe average, in the first geobucket, there are m D 5 neighbors,¶ and, because each of them has thesame coverage area, they can know on average 5 SNs. Therefore, it follows that ns D 1, but we setns D 0:5 to be more conservative (for instance, mobility may decrease this value). Using the model,it follows that
¶We measured the valuem D 5 by means of simulations, considering the urban scenario described in this section. Sucha value is almost independent from ı .
Copyright © 2014 John Wiley & Sons, Ltd. Concurrency Computat.: Pract. Exper. 2015; 27:3295–3315DOI: 10.1002/cpe
3308 M. PICONE ET AL.
5 10 15 20 25 30 35 40δ
10
20
30
40
50
60
70
80
Ave
rage
Exc
hang
ed M
essa
ges
PublicationSearch
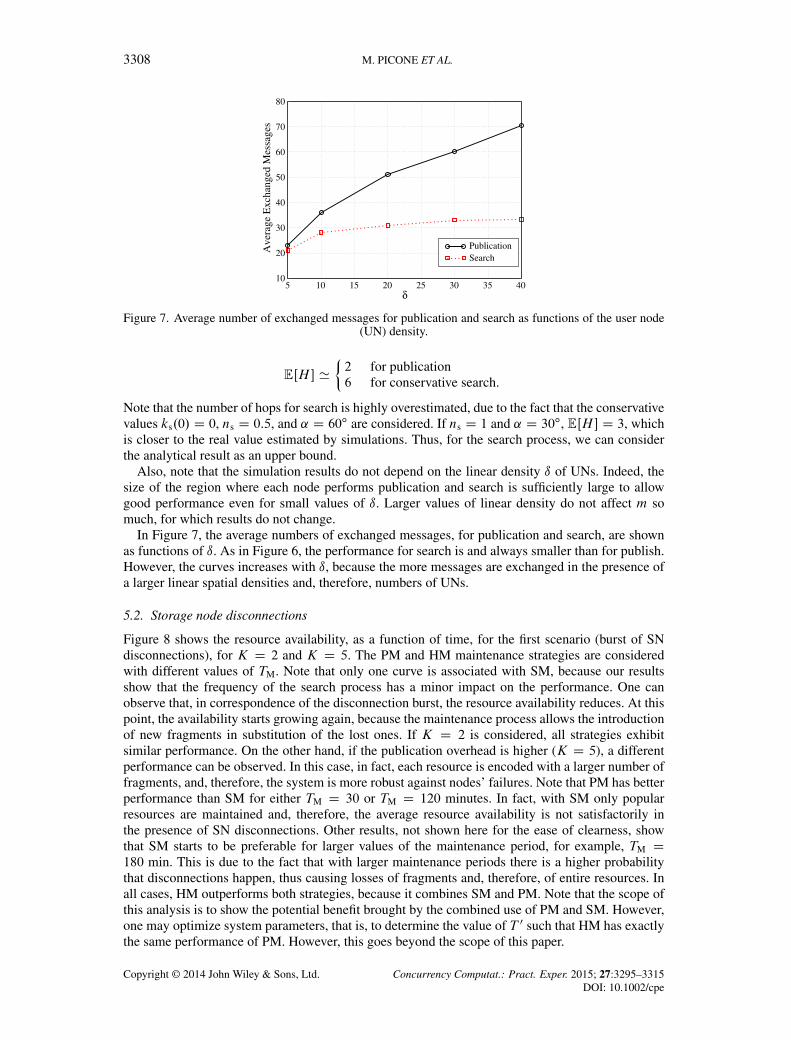
Figure 7. Average number of exchanged messages for publication and search as functions of the user node(UN) density.
EŒH � '
²2 for publication6 for conservative search.
Note that the number of hops for search is highly overestimated, due to the fact that the conservativevalues ks.0/ D 0, ns D 0:5, and ˛ D 60ı are considered. If ns D 1 and ˛ D 30ı, EŒH � D 3, whichis closer to the real value estimated by simulations. Thus, for the search process, we can considerthe analytical result as an upper bound.
Also, note that the simulation results do not depend on the linear density ı of UNs. Indeed, thesize of the region where each node performs publication and search is sufficiently large to allowgood performance even for small values of ı. Larger values of linear density do not affect m somuch, for which results do not change.
In Figure 7, the average numbers of exchanged messages, for publication and search, are shownas functions of ı. As in Figure 6, the performance for search is and always smaller than for publish.However, the curves increases with ı, because the more messages are exchanged in the presence ofa larger linear spatial densities and, therefore, numbers of UNs.
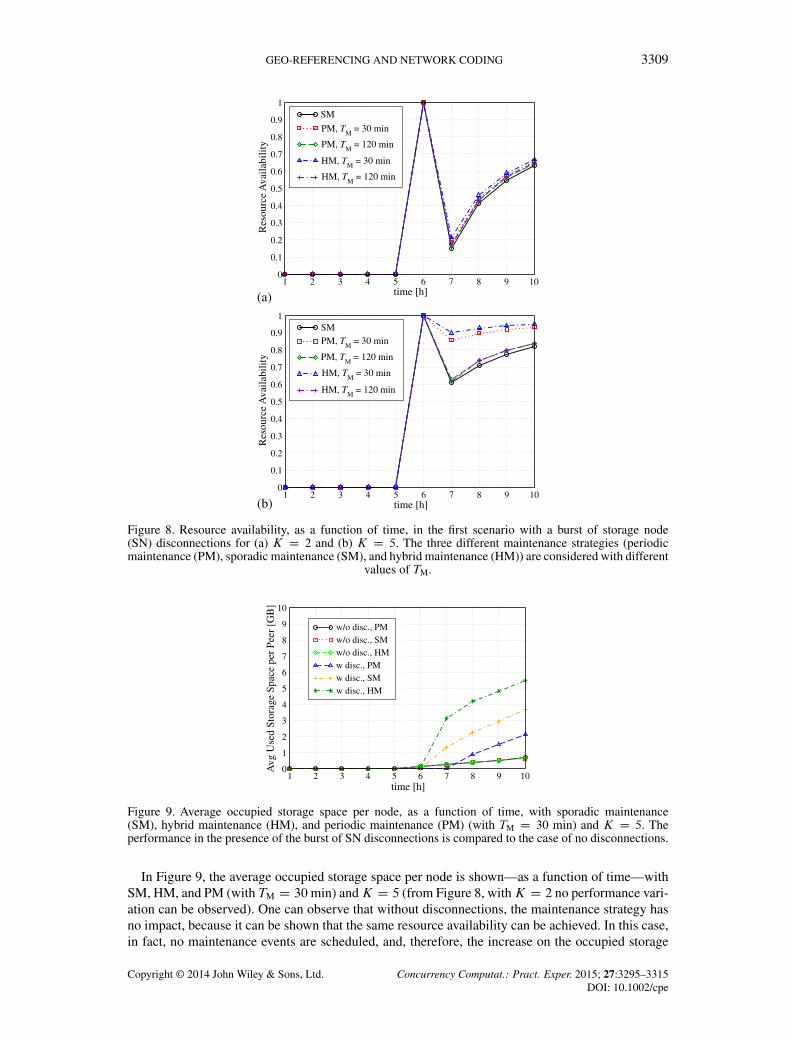
5.2. Storage node disconnections
Figure 8 shows the resource availability, as a function of time, for the first scenario (burst of SNdisconnections), for K D 2 and K D 5. The PM and HM maintenance strategies are consideredwith different values of TM. Note that only one curve is associated with SM, because our resultsshow that the frequency of the search process has a minor impact on the performance. One canobserve that, in correspondence of the disconnection burst, the resource availability reduces. At thispoint, the availability starts growing again, because the maintenance process allows the introductionof new fragments in substitution of the lost ones. If K D 2 is considered, all strategies exhibitsimilar performance. On the other hand, if the publication overhead is higher (K D 5), a differentperformance can be observed. In this case, in fact, each resource is encoded with a larger number offragments, and, therefore, the system is more robust against nodes’ failures. Note that PM has betterperformance than SM for either TM D 30 or TM D 120 minutes. In fact, with SM only popularresources are maintained and, therefore, the average resource availability is not satisfactorily inthe presence of SN disconnections. Other results, not shown here for the ease of clearness, showthat SM starts to be preferable for larger values of the maintenance period, for example, TM D180 min. This is due to the fact that with larger maintenance periods there is a higher probabilitythat disconnections happen, thus causing losses of fragments and, therefore, of entire resources. Inall cases, HM outperforms both strategies, because it combines SM and PM. Note that the scope ofthis analysis is to show the potential benefit brought by the combined use of PM and SM. However,one may optimize system parameters, that is, to determine the value of T 0 such that HM has exactlythe same performance of PM. However, this goes beyond the scope of this paper.
Copyright © 2014 John Wiley & Sons, Ltd. Concurrency Computat.: Pract. Exper. 2015; 27:3295–3315DOI: 10.1002/cpe
GEO-REFERENCING AND NETWORK CODING 3309
(a)1 2 3 4 5 6 7 8 9 10
time [h]
0
0.1
0.2
0.3
0.4
0.5
0.6
0.7
0.8
0.9
1
Res
ourc
e A
vaila
bilit
y
SM
PM, TM
= 30 min
PM, TM
= 120 min
HM, TM
= 30 min
HM, TM
= 120 min
(b)1 2 3 4 5 6 7 8 9 10
time [h]
0
0.1
0.2
0.3
0.4
0.5
0.6
0.7
0.8
0.9
1
Res
ourc
e A
vaila
bilit
y
SMPM, T
M = 30 min
PM, TM
= 120 min
HM, TM
= 30 min
HM, TM
= 120 min
Figure 8. Resource availability, as a function of time, in the first scenario with a burst of storage node(SN) disconnections for (a) K D 2 and (b) K D 5. The three different maintenance strategies (periodicmaintenance (PM), sporadic maintenance (SM), and hybrid maintenance (HM)) are considered with different
values of TM.
5 6 71 2 3 4 8 9 10time [h]
0
1
2
3
4
5
6
7
8
9
10
Avg
Use
d St
orag
e Sp
ace
per
Peer
[G
B]
w/o disc., PMw/o disc., SMw/o disc., HMw disc., PMw disc., SMw disc., HM
Figure 9. Average occupied storage space per node, as a function of time, with sporadic maintenance(SM), hybrid maintenance (HM), and periodic maintenance (PM) (with TM D 30 min) and K D 5. Theperformance in the presence of the burst of SN disconnections is compared to the case of no disconnections.
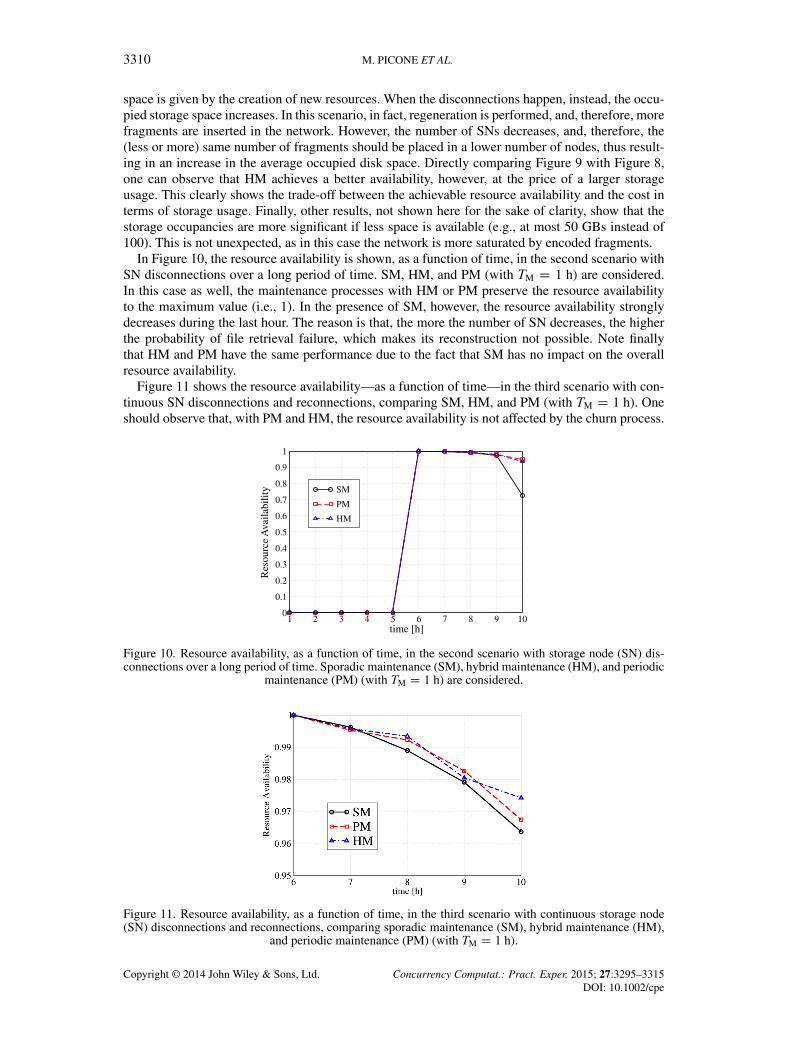
In Figure 9, the average occupied storage space per node is shown—as a function of time—withSM, HM, and PM (with TM D 30min) andK D 5 (from Figure 8, withK D 2 no performance vari-ation can be observed). One can observe that without disconnections, the maintenance strategy hasno impact, because it can be shown that the same resource availability can be achieved. In this case,in fact, no maintenance events are scheduled, and, therefore, the increase on the occupied storage
Copyright © 2014 John Wiley & Sons, Ltd. Concurrency Computat.: Pract. Exper. 2015; 27:3295–3315DOI: 10.1002/cpe
3310 M. PICONE ET AL.
space is given by the creation of new resources. When the disconnections happen, instead, the occu-pied storage space increases. In this scenario, in fact, regeneration is performed, and, therefore, morefragments are inserted in the network. However, the number of SNs decreases, and, therefore, the(less or more) same number of fragments should be placed in a lower number of nodes, thus result-ing in an increase in the average occupied disk space. Directly comparing Figure 9 with Figure 8,one can observe that HM achieves a better availability, however, at the price of a larger storageusage. This clearly shows the trade-off between the achievable resource availability and the cost interms of storage usage. Finally, other results, not shown here for the sake of clarity, show that thestorage occupancies are more significant if less space is available (e.g., at most 50 GBs instead of100). This is not unexpected, as in this case the network is more saturated by encoded fragments.
In Figure 10, the resource availability is shown, as a function of time, in the second scenario withSN disconnections over a long period of time. SM, HM, and PM (with TM D 1 h) are considered.In this case as well, the maintenance processes with HM or PM preserve the resource availabilityto the maximum value (i.e., 1). In the presence of SM, however, the resource availability stronglydecreases during the last hour. The reason is that, the more the number of SN decreases, the higherthe probability of file retrieval failure, which makes its reconstruction not possible. Note finallythat HM and PM have the same performance due to the fact that SM has no impact on the overallresource availability.
Figure 11 shows the resource availability—as a function of time—in the third scenario with con-tinuous SN disconnections and reconnections, comparing SM, HM, and PM (with TM D 1 h). Oneshould observe that, with PM and HM, the resource availability is not affected by the churn process.
5 6 71 2 3 4 8 9 10time [h]
0
0.1
0.2
0.3
0.4
0.5
0.6
0.7
0.8
0.9
1
Res
ourc
e A
vaila
bilit
y SM
PM
HM
Figure 10. Resource availability, as a function of time, in the second scenario with storage node (SN) dis-connections over a long period of time. Sporadic maintenance (SM), hybrid maintenance (HM), and periodic
maintenance (PM) (with TM D 1 h) are considered.
Figure 11. Resource availability, as a function of time, in the third scenario with continuous storage node(SN) disconnections and reconnections, comparing sporadic maintenance (SM), hybrid maintenance (HM),
and periodic maintenance (PM) (with TM D 1 h).
Copyright © 2014 John Wiley & Sons, Ltd. Concurrency Computat.: Pract. Exper. 2015; 27:3295–3315DOI: 10.1002/cpe
GEO-REFERENCING AND NETWORK CODING 3311
SM, instead, is not sufficient to preserve resource availability to its maximum value. The reason isthat if resources cannot be retrieved, because of SN disconnections, new fragments are not insertedin the system. Moreover, SM is improved by the use of extra periodically scheduled maintenanceevents. Therefore, the hybrid strategy has to be preferred in scenarios with continuous connectionsand disconnections of SNs.
6. SIP2PEER-BASED IMPLEMENTATION
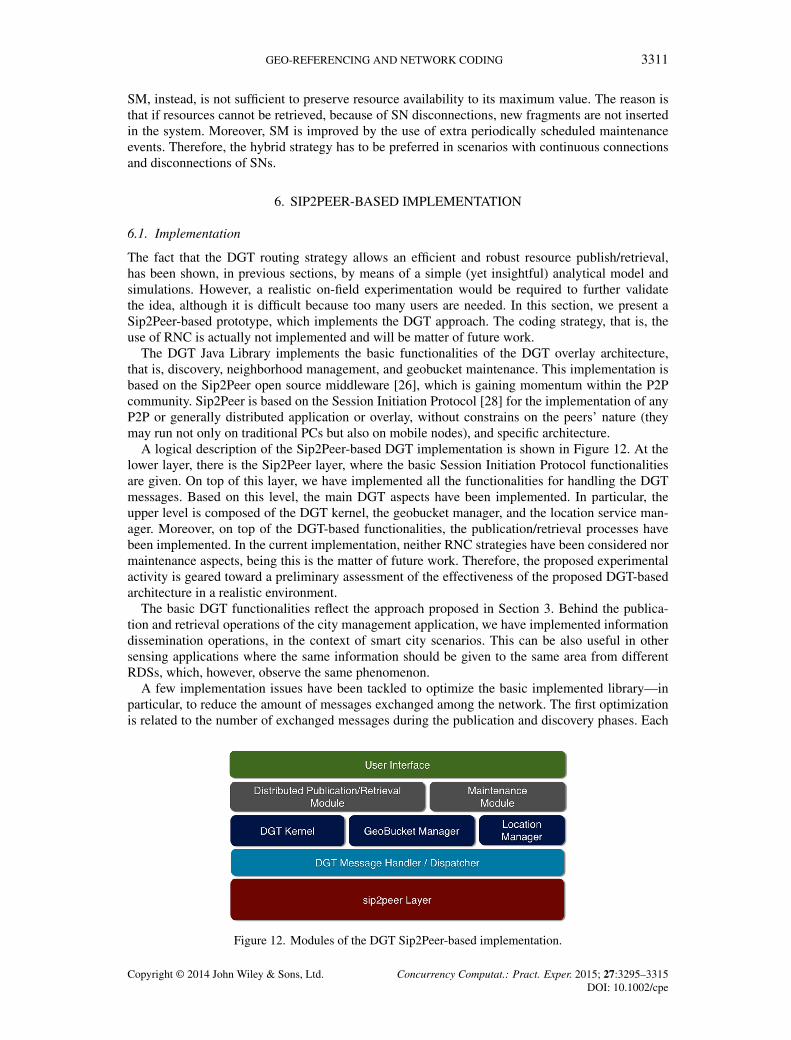
6.1. Implementation
The fact that the DGT routing strategy allows an efficient and robust resource publish/retrieval,has been shown, in previous sections, by means of a simple (yet insightful) analytical model andsimulations. However, a realistic on-field experimentation would be required to further validatethe idea, although it is difficult because too many users are needed. In this section, we present aSip2Peer-based prototype, which implements the DGT approach. The coding strategy, that is, theuse of RNC is actually not implemented and will be matter of future work.
The DGT Java Library implements the basic functionalities of the DGT overlay architecture,that is, discovery, neighborhood management, and geobucket maintenance. This implementation isbased on the Sip2Peer open source middleware [26], which is gaining momentum within the P2Pcommunity. Sip2Peer is based on the Session Initiation Protocol [28] for the implementation of anyP2P or generally distributed application or overlay, without constrains on the peers’ nature (theymay run not only on traditional PCs but also on mobile nodes), and specific architecture.
A logical description of the Sip2Peer-based DGT implementation is shown in Figure 12. At thelower layer, there is the Sip2Peer layer, where the basic Session Initiation Protocol functionalitiesare given. On top of this layer, we have implemented all the functionalities for handling the DGTmessages. Based on this level, the main DGT aspects have been implemented. In particular, theupper level is composed of the DGT kernel, the geobucket manager, and the location service man-ager. Moreover, on top of the DGT-based functionalities, the publication/retrieval processes havebeen implemented. In the current implementation, neither RNC strategies have been considered normaintenance aspects, being this is the matter of future work. Therefore, the proposed experimentalactivity is geared toward a preliminary assessment of the effectiveness of the proposed DGT-basedarchitecture in a realistic environment.
The basic DGT functionalities reflect the approach proposed in Section 3. Behind the publica-tion and retrieval operations of the city management application, we have implemented informationdissemination operations, in the context of smart city scenarios. This can be also useful in othersensing applications where the same information should be given to the same area from differentRDSs, which, however, observe the same phenomenon.
A few implementation issues have been tackled to optimize the basic implemented library—inparticular, to reduce the amount of messages exchanged among the network. The first optimizationis related to the number of exchanged messages during the publication and discovery phases. Each
Figure 12. Modules of the DGT Sip2Peer-based implementation.
Copyright © 2014 John Wiley & Sons, Ltd. Concurrency Computat.: Pract. Exper. 2015; 27:3295–3315DOI: 10.1002/cpe
3312 M. PICONE ET AL.
DGTEvent message is attached with a list of size L containing the descriptors of peers which havealready received that message. In this way, the message is forwarded only to nodes interested to itand not already receiving it. Moreover, the messages are forwarded by a peer to its neighborhoodwith a given probability p. It is straightforward to observe that the forwarding probability has tobe properly set. In fact, if this parameter is too low, a given message may be stopped somewherein the network, and no more propagated. Another implemented modification is a method to informwhen a node is disconnected from the network. In the original solution, a node is recognized asdisconnected if it does not reply to a presence message. In the modified solution, instead, if a nodewants to disconnect from the network, it informs its neighborhood. Finally, the DGT messageshave been provided with a time to live, as well as the possibility to reduce the list size from thebootstrap node. Also, these optimizations have been made to reduce the bandwidth usage. A finalimportant feature, inherited from Sip2Peer, is the Session Border Controller (SBC)-based networkaddress translation (NAT) traversal mechanism, which allows the peers to communicate in presenceof NATs—a very relevant problem especially in mobile scenarios. The SBC is a node provided witha public IP address. It allows a generic peer to check if it is in a private network with a NAT, alsorequesting (if needed) an IP address/port pair to communicate with other peers.
6.2. Experimental evaluation
The developed library has been initially tested both on traditional PCs and on real Android devicesto validate the designed behaviors with different mobility patterns and network coverages. Consec-utively, a preliminary evaluation of the DGT Java Library has been carried out by deploying 200peers on a cluster at our Department. As in the simulation-based performance evaluation reportedin Section 5, each peer is randomly placed in the area of the city of Parma. All peers are connectedto the DGT overlay network and can move according to the FTM mobility model described by (1).Performance evaluation is performed by letting each peer logging every 30 s its speed, geographicalposition, and amount and type of exchanged data. During network operations, another peer is gen-erated and selected as the bootstrap node, which generates random events, for example, accidentsor road works. Three scenarios have been analyzed, changing L and p. In the first case, L D 0 andp D 1; in the second scenario, L D 15 and p D 1; in the third scenario, L D 0 and p D 0:5. Thefollowing performance metrics have been evaluated:
� Bandwidth, denoted as B , expressed in terms of average kB/s of data sent by a peer.� Delay, denoted as D, expressed as the average time required to deliver an event message and
to receive the acknowledgement reception.� Number of neighbors, denoted as NN, expressed as the average current number of neighbor of
a peer.
Finally, five independent runs have been performed to average over statistical fluctuations.
0 600 1200 1800 2400 3000 3600time [s]
0
0.4
0.8
1.2
1.6
2
2.4
2.8
3.2
3.6
4
B [
kB/s
]
L = 0, p = 1
L = 15, p = 1
L = 0, p = 0.5
Average
Instantaneous
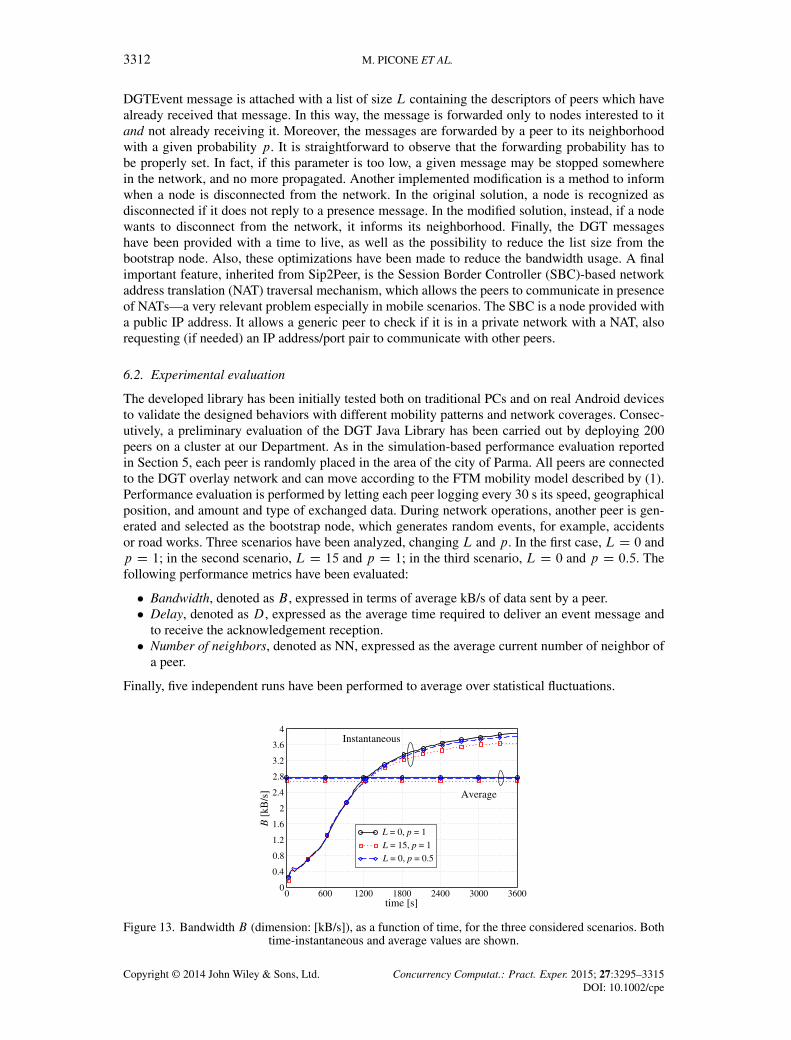
Figure 13. Bandwidth B (dimension: [kB/s]), as a function of time, for the three considered scenarios. Bothtime-instantaneous and average values are shown.
Copyright © 2014 John Wiley & Sons, Ltd. Concurrency Computat.: Pract. Exper. 2015; 27:3295–3315DOI: 10.1002/cpe
GEO-REFERENCING AND NETWORK CODING 3313
(a)0 1800 3600 5400 7200 9000 10800
time [s]
0
0.02
0.04
0.06
0.08
0.1
0.12
0.14
0.16
0.18
0.2
D [
s]
InstantaneousAverage
(b)0 1800 3600 5400 7200 9000 10800
time [s]
5
6
7
8
9
10
11
12
13
NN
InstantaneousAverage
Figure 14. (a) Delay (D) and (b) average number of neighbors (NN), as functions of time, for L D 0 andp D 0:5. Both time-instantaneous and average values are shown.
In Figure 13, B (dimension: [kB/s]) is shown, as a function of time, for the three consideredscenarios. Both time-instantaneous and average values are shown. One can observe that the band-width increases with time, because more and more packets and messages are generated during theexperiments. For a fixed value of p, increasing the value of L leads to better performance. In fact,each forwarding node is aware of more nodes which have already received a given message. More-over, for a fixed value of L, decreasing the forwarding probability p reduces the bandwidth usage,due to the fact that less packets are transmitted across the network.
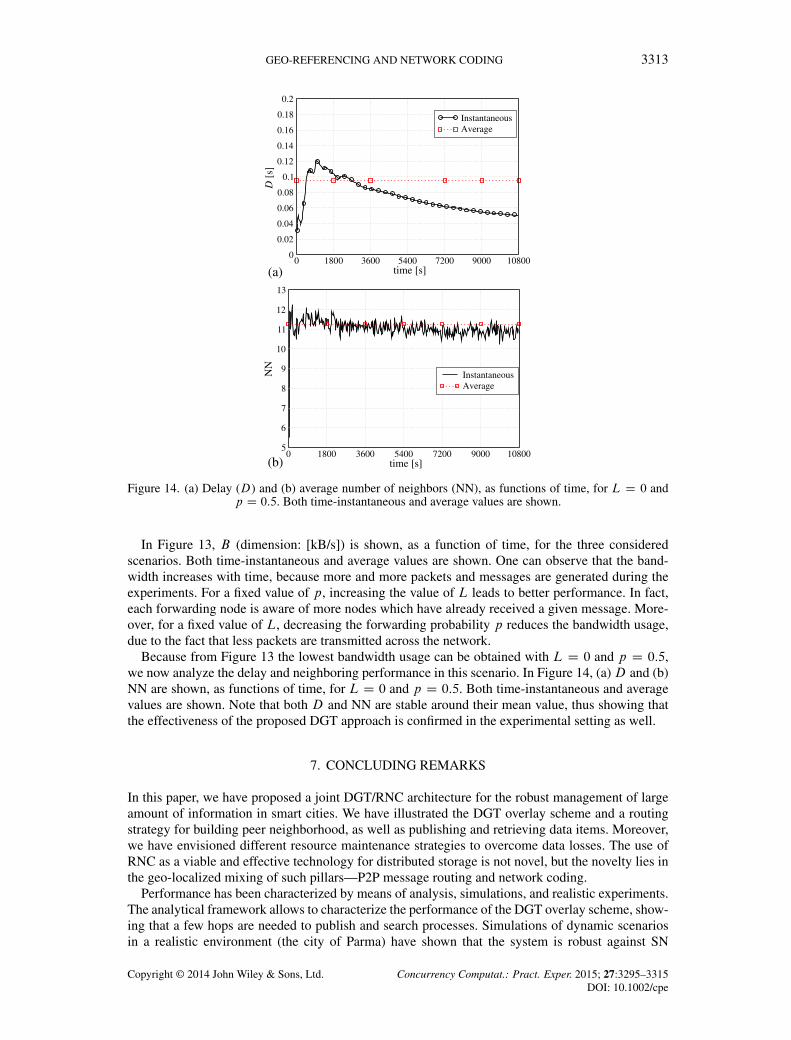
Because from Figure 13 the lowest bandwidth usage can be obtained with L D 0 and p D 0:5,we now analyze the delay and neighboring performance in this scenario. In Figure 14, (a)D and (b)NN are shown, as functions of time, for L D 0 and p D 0:5. Both time-instantaneous and averagevalues are shown. Note that both D and NN are stable around their mean value, thus showing thatthe effectiveness of the proposed DGT approach is confirmed in the experimental setting as well.
7. CONCLUDING REMARKS
In this paper, we have proposed a joint DGT/RNC architecture for the robust management of largeamount of information in smart cities. We have illustrated the DGT overlay scheme and a routingstrategy for building peer neighborhood, as well as publishing and retrieving data items. Moreover,we have envisioned different resource maintenance strategies to overcome data losses. The use ofRNC as a viable and effective technology for distributed storage is not novel, but the novelty lies inthe geo-localized mixing of such pillars—P2P message routing and network coding.
Performance has been characterized by means of analysis, simulations, and realistic experiments.The analytical framework allows to characterize the performance of the DGT overlay scheme, show-ing that a few hops are needed to publish and search processes. Simulations of dynamic scenariosin a realistic environment (the city of Parma) have shown that the system is robust against SN
Copyright © 2014 John Wiley & Sons, Ltd. Concurrency Computat.: Pract. Exper. 2015; 27:3295–3315DOI: 10.1002/cpe
3314 M. PICONE ET AL.
disconnections. Even in extreme conditions (e.g., 80% of SNs disconnected), maintenance strate-gies guarantee high resource availability. In particular, we have shown that PM performs better thanSM if maintenance is sufficiently frequent. On the other hand, SM is effective only with popularresources, because regeneration is performed only after a successful download. To overcome thisproblem, we have proposed to combine these two strategies. Results show a resource availabilityimprovement, at the expense of higher storage occupancy.
We have also proposed a partial implementation based on the Sip2Peer middleware to the pur-pose of achieving an experimental validation of the proposed system. This preliminary version onlyimplements the overlay architecture, without any form of redundancy generation. Preliminary testsappear promising for the our goal of proving the effectiveness of the approach on the field.
Future work will be devoted to the design of a maintenance strategy based on network stateanalysis and to the implementation of the proposed architecture. Moreover, the experimentalSip2Peer-based testbed will be extended to take into account the network coding strategy, as well asresource maintenance. This will allow to perform on-field testing, in order to find an optimal tuningof the (several) control parameters, which characterize the proposed solution. In a real deploy-ment, we think that one major issue will be network handover (both vertical and horizontal). Whiledeveloping the software, we are taking this aspect into account.
ACKNOWLEDGEMENTS
We would like to thank Giacomo Brambilla, from Università degli Studi di Parma, Italy, for his help in theimplementation of the proposed solution using the Sip2Peer middleware.
REFERENCES
1. Steventon A, Wright S (eds.) Intelligent Spaces: The Application of Pervasive ICT. Springer-Verlag: London, UK,2006.
2. California Institute for Smart Communities. Ten Steps to Becoming a Smart Community, 2011.3. Santa J, Moragon A, Gomez-Skarmeta AF. Experimental evaluation of a novel vehicular communication paradigm
based on cellular networks. IEEE Intelligent Vehicles Symposium, Eindhoven, Netherlands, 2008; 198–203.4. Jedrzej A, Scheuermann B, Koegel M, Mauve M. PeerTIS: a peer-to-peer traffic information system. Proceedings
of the ACM International Conference on Mobile Computer and Networking (MOBICOM), Beijing, China, 2009;23–32.
5. IBM. SmarterCity Initiative. (Available from: www.ibm.com/thesmartercity).6. Picone M, Amoretti M, Zanichelli F. GeoKad: A P2P Distributed Localization Protocol. Proceedings of the 8th IEEE
International Conference on Pervasive Computing and Communications (PerCom 2010), 2010; 800–803.7. Dimakis AG, Godfrey PB, Wu Y, Wainwright MO, Ramachandran K. Network coding for distributed storage
systems. IEEE Transactions on Information Theory 2010 September; 56(9):4539–4551.8. Dimakis A, Godfrey PB, Wainwright MJ, Ramchandran K. The benefits of network coding for peer-to-peer storage
Systems. Proceedings of thw International Symposium on Network Coding (NetCod), San Diego, CA, USA, 2007;1–6.
9. Li B, Niu D. Random network coding in peer-to-peer networks: from theory to practice. Proceedings of the IEEE2011; 99(3):513–523.
10. Amoretti M. A survey of peer-to-peer overlay schemes: effectiveness, efficiency and security. BSP Recent Patents onComputer Science 2009; 2(3):195–213.
11. Oggier F, Datta A. Byzantine fault tolerance of regenerating codes. Proceedings of the IEEE International ConferencePeer-to-Peer Computing (P2P), Kyoto, Japan, 2011; 112–121.
12. Rao W, Vitenberg R, Tarkoma S. Towards optimal keyword-based content dissemination in DHT-based P2P net-works. Proceedings of the IEEE International Conference Peer-to-Peer Computing (P2P), Kyoto, Japan, 2011;102–111.
13. Mega G, Montresor A, Picco GP. Efficient dissemination in decentralized social networks. Proceedings of the IEEEInternational Conference Peer-to-Peer Computing (P2P), Kyoto, Japan, 2011; 338–347.
14. Montassier G, Cholez T, Doyen G, Khatoun R, Chrisment I, Festor O. Content pollution quantification in large P2Pnetworks: a measurement study on KAD. Proceedings of the IEEE International Conference Peer-to-Peer Computing(p2p), Kyoto, Japan, 2011; 30–33.
15. Kovacevic A, Liebau N, Steinmetz R. Globase.KOM - a P2P overlay for fully retrievable location-based search.Proceedings of the IEEE International Conference Peer-to-Peer Computing (p2p), Galway, Ireland, 2007; 87–96.
16. Ahlswede R, Cai N, Li SYR, Yeung RW. Network information flow. IEEE Transactions on Information Theory 2000;46(4):1204–1216.
Copyright © 2014 John Wiley & Sons, Ltd. Concurrency Computat.: Pract. Exper. 2015; 27:3295–3315DOI: 10.1002/cpe

GEO-REFERENCING AND NETWORK CODING 3315
17. Martalò M, Picone M, Bussandri R, Amoretti M. A practical network coding approach for peer-to-peer distributedstorage. Proceedings of the IEEE International Symposium on Network Coding (netcod), Toronto, Canada, 2010;103–108.
18. Gkantsidis C, Miller J, Rodriguez P. Comprehensive view of a live network coding P2P system. Proceedings of theACM SIGCOMM Internet Measurement Conference (IMC), Rio de Janeiro, Brazil, 2006 October; 177–188.
19. Picone M, Amoretti M, Zanichelli F. Evaluating the robustness of the DGT approach for smartphone-based vehicularnetworks. IEEE Workshop On User Mobility and Vehicular Networks, Bonn, Germany, 2011; 820–826.
20. Picone M, Amoretti M, Zanichelli F. Proactive neighbor localization based on distributed geographic table.Proceedings of the International Conference Advances in Mobile Computing and Multimedia, 2010; 305–312.
21. Seskar I, Marie S, Holtzman J, Wasserman J. Rate of location area updates in cellular systems. Proceedings of theIEEE Vehicular Technology Conference (vtc), Vol. 2, Denver, CO, USA, 1992; 694–697.
22. Fragouli C, Soljanin E. Network Coding Fundamentals. Now Publisher Foundations and Trends in Networking:Hanover, MA, USA, 2007.
23. Fragouli C, Soljanin E. Network Coding Applications. Now Publisher Foundations and Trends in Networking:Hanover, MA, USA, 2007.
24. Martalò M, Picone M, Amoretti M, Ferrari G, Raheli R. Randomized network coding in distributed storage systemswith layered overlay. Information Theory and Applications Workshop (ITA), 2011, 2011; 1–7.
25. Amoretti M, Picone M, Zanichelli F, Ferrari G. Simulating mobile and distributed systems with DEUS and ns-3.Proceedings of the International Conference on High Performance Computing and Simulation (HPCS), Helsinki,Finland, 2013; 107–114.
26. Distributed Systems Group. Sip2peer project home page. (Available from: http://code.google.com/p/sip2peer/)[Accessed on 25 January 2014].
27. Distributed Systems Group. Smart City videos. (Available from: http://dsg.ce.unipr.it/d4v) [Accessed on 25 January2014].
28. Rosenberg J, Schulzrinne H, Camarillo G, Johnston A, Peterson J, Sparks R, Handley M, Schooler E.RFC 3261 - SIP: Session Initiation Protocol. Technical Report, IETF Network Working Group, 2002.
Copyright © 2014 John Wiley & Sons, Ltd. Concurrency Computat.: Pract. Exper. 2015; 27:3295–3315DOI: 10.1002/cpe