Embed Size (px)
Citation preview
Combining Geographic and
Network Analysis:The GoMore Rideshare Network
Kate Lyndegaard
10.15.2014

Outline
1
1. Motivation
2. What is network analysis?
3. The project objective
4. The GoMore network
5. The results
6. The next steps
Motivation
2
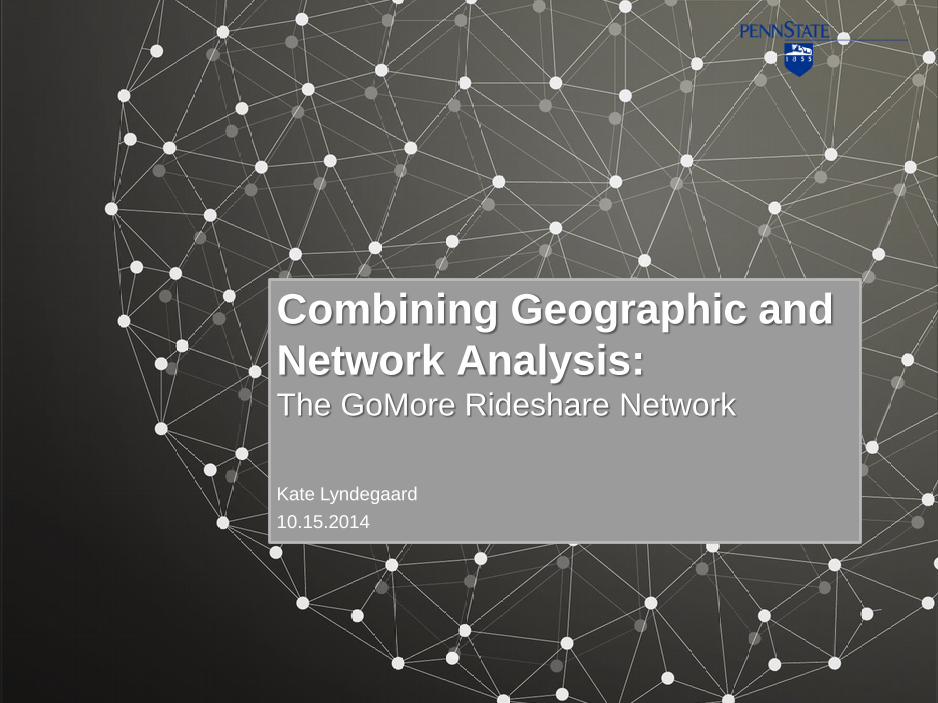
Are there elements of geospatial theory which
complement social network theoretic approaches to
examining context and relationships in networks, and
vice versa?
What is complex network analysis?
3
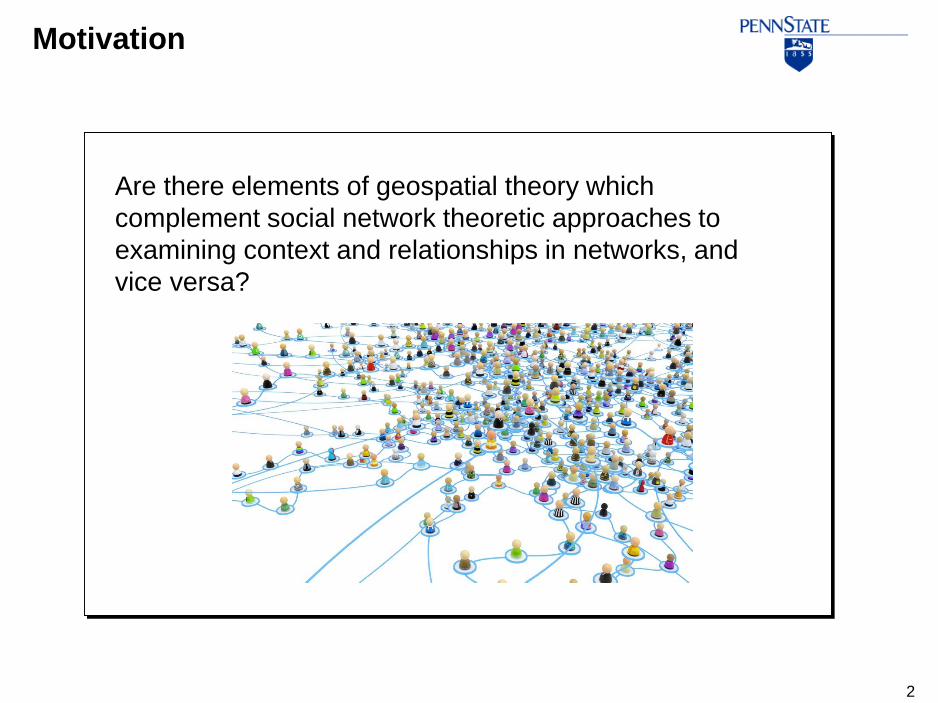
A network represents data as a series of ‘nodes’ and ‘edges’.
Node
Edge
Weighted Networks
4
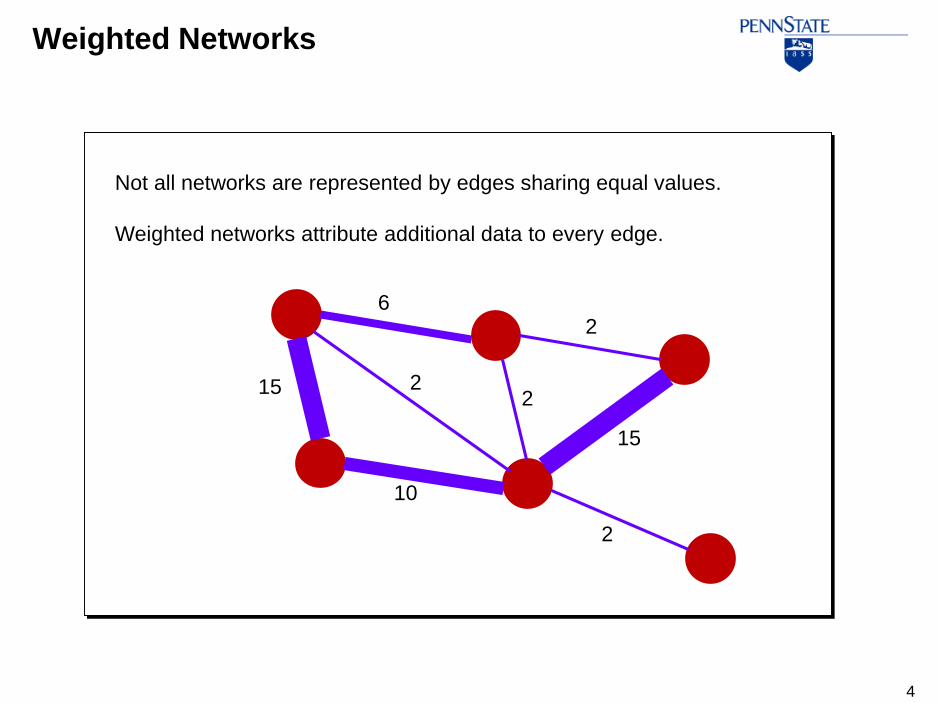
Not all networks are represented by edges sharing equal values.
Weighted networks attribute additional data to every edge.
15
15
10
2
2
2
2
6
Topological Properties: Degree
5
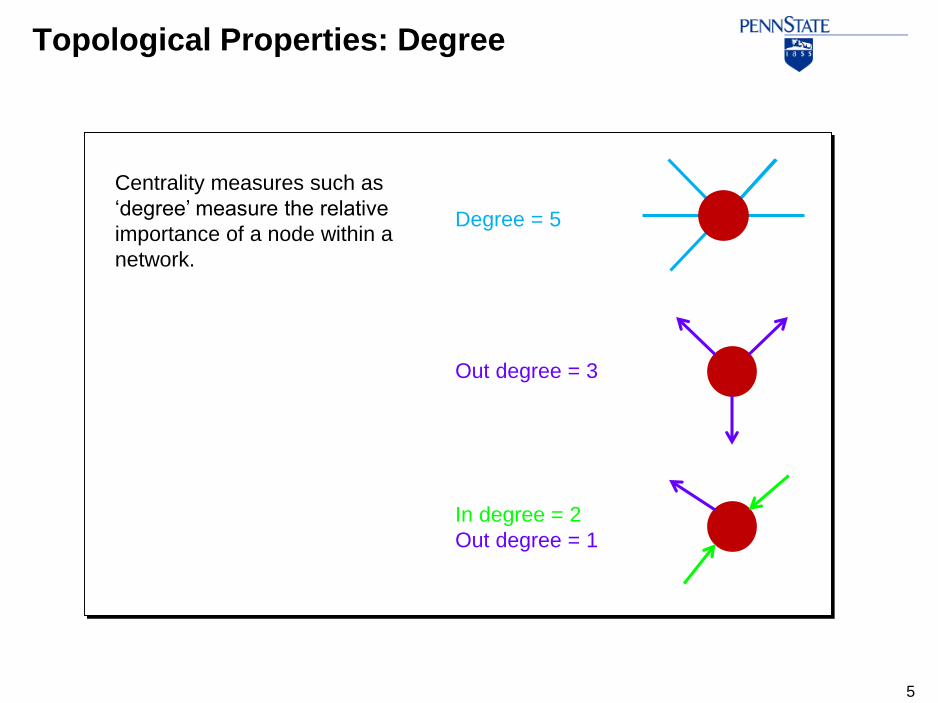
Centrality measures such as
‘degree’ measure the relative
importance of a node within a
network.
Degree = 5
Out degree = 3
In degree = 2
Out degree = 1
The Project Objective
6
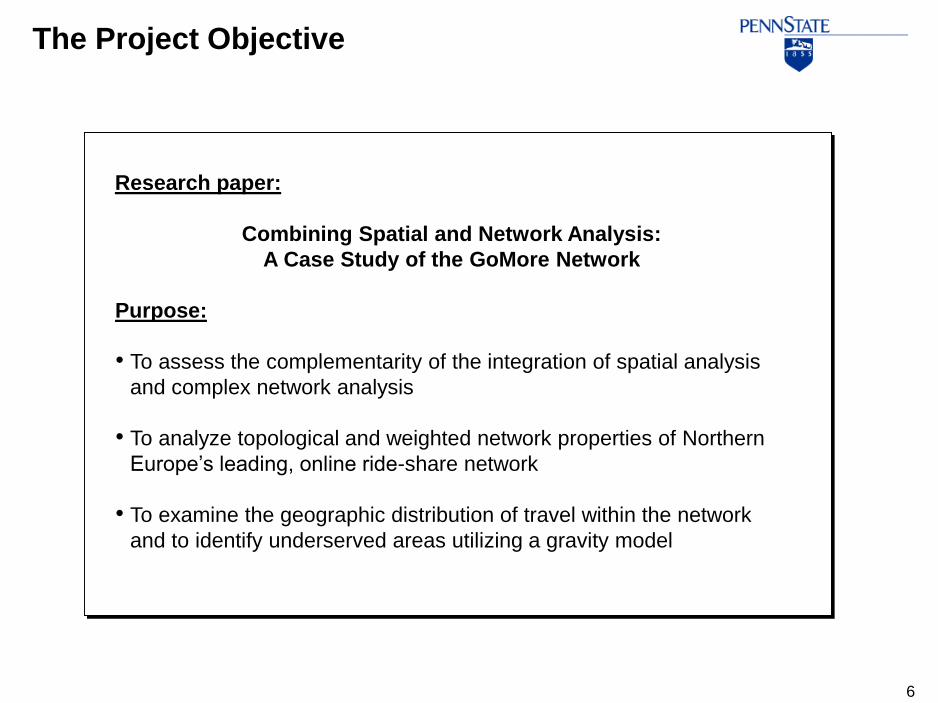
Research paper:
Combining Spatial and Network Analysis:
A Case Study of the GoMore Network
Purpose:
• To assess the complementarity of the integration of spatial analysis
and complex network analysis
• To analyze topological and weighted network properties of Northern
Europe’s leading, online ride-share network
• To examine the geographic distribution of travel within the network
and to identify underserved areas utilizing a gravity model

GoMore, DenmarkCase Study
7Source: gomore.dk
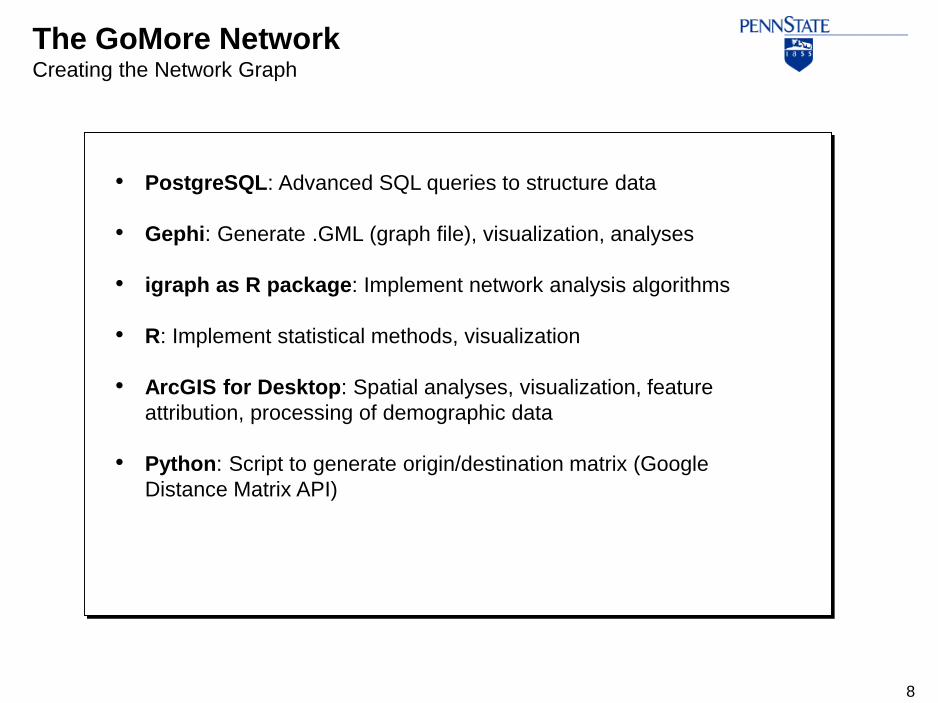
The GoMore NetworkCreating the Network Graph
8
• PostgreSQL: Advanced SQL queries to structure data
• Gephi: Generate .GML (graph file), visualization, analyses
• igraph as R package: Implement network analysis algorithms
• R: Implement statistical methods, visualization
• ArcGIS for Desktop: Spatial analyses, visualization, feature
attribution, processing of demographic data
• Python: Script to generate origin/destination matrix (Google
Distance Matrix API)
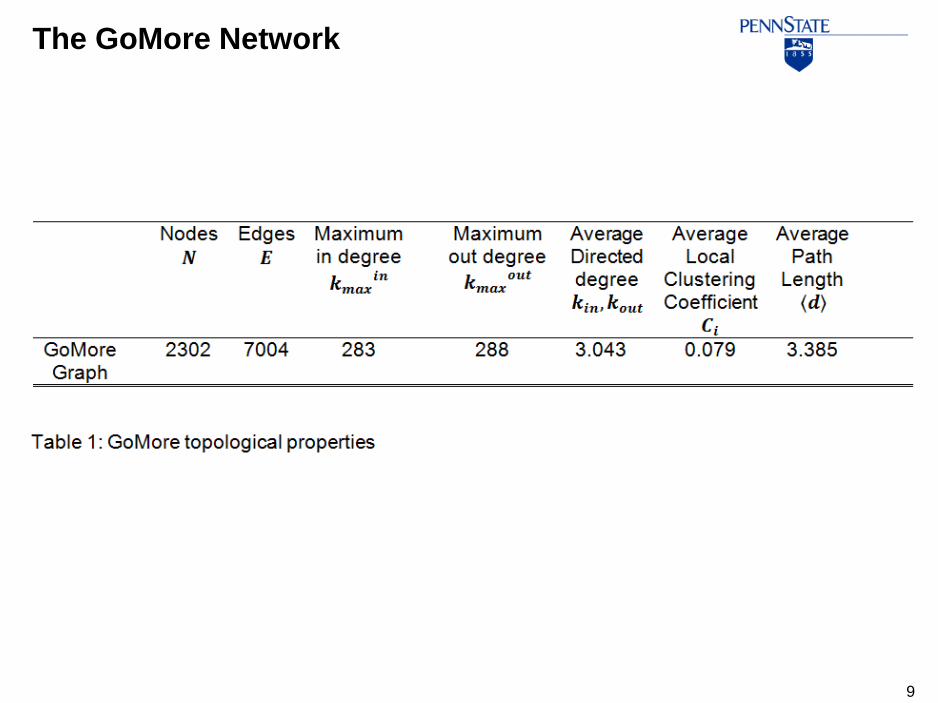
The GoMore Network
9
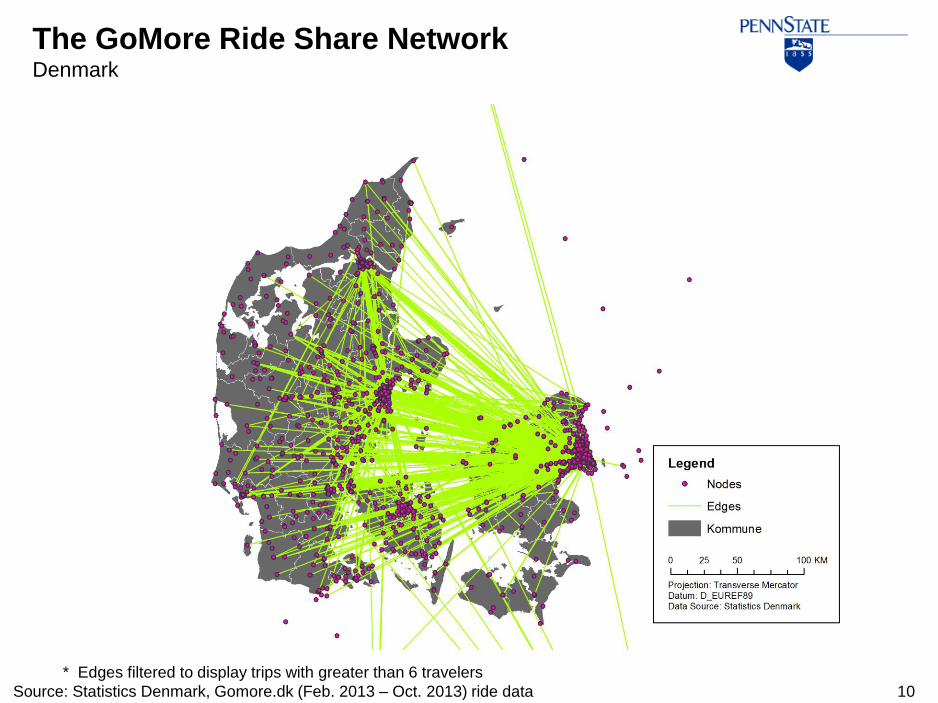
The GoMore Ride Share NetworkDenmark
10
* Edges filtered to display trips with greater than 6 travelers
Source: Statistics Denmark, Gomore.dk (Feb. 2013 – Oct. 2013) ride data
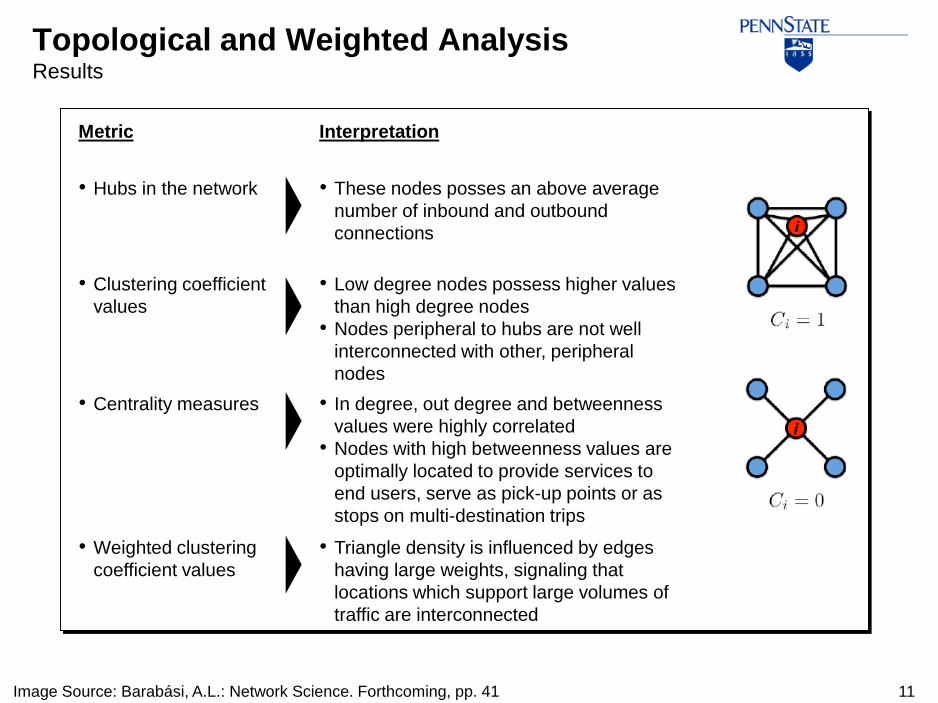
Topological and Weighted AnalysisResults
11Image Source: Barabási, A.L.: Network Science. Forthcoming, pp. 41
Metric Interpretation
• Hubs in the network • These nodes posses an above average
number of inbound and outbound
connections
• Clustering coefficient
values
• Low degree nodes possess higher values
than high degree nodes
• Nodes peripheral to hubs are not well
interconnected with other, peripheral
nodes
• Centrality measures • In degree, out degree and betweenness
values were highly correlated
• Nodes with high betweenness values are
optimally located to provide services to
end users, serve as pick-up points or as
stops on multi-destination trips
• Weighted clustering
coefficient values
• Triangle density is influenced by edges
having large weights, signaling that
locations which support large volumes of
traffic are interconnected
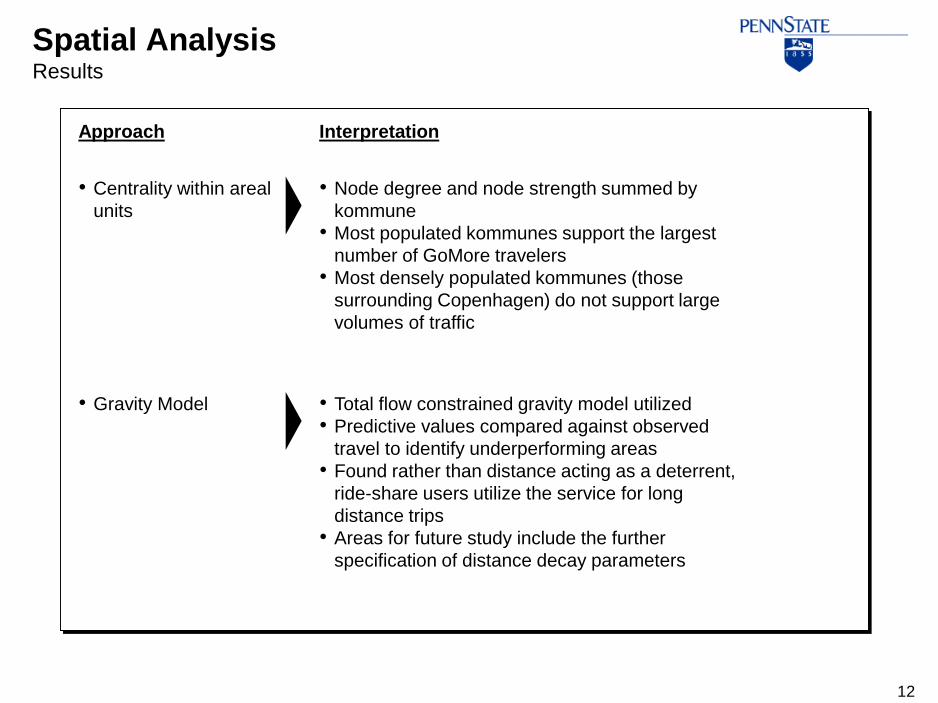
Spatial AnalysisResults
12
Approach Interpretation
• Centrality within areal
units
• Node degree and node strength summed by
kommune
• Most populated kommunes support the largest
number of GoMore travelers
• Most densely populated kommunes (those
surrounding Copenhagen) do not support large
volumes of traffic
• Gravity Model • Total flow constrained gravity model utilized
• Predictive values compared against observed
travel to identify underperforming areas
• Found rather than distance acting as a deterrent,
ride-share users utilize the service for long
distance trips
• Areas for future study include the further
specification of distance decay parameters
Conclusion
13
• Unique opportunity to examine the structural properties of an
online/offline network from a geographic perspective, contextualized
by demographic variables.
• Nodes with high betweenness values are optimally located to provide
services to end users, serve as pick-up points or as stops on multi-
destination trips.
• The examination of degree centrality within areal units, in this case
the administrative boundaries of Danish kommunes, showed that the
most populated kommunes supported the largest number of GoMore
travelers. The most densely populated kommunes did not support
large volumes of traffic, however this may be explained by user-
generated location descriptions within the greater Copenhagen
region.
References
14
Albert, R., Barabási, A. L.: Topology of evolving networks: local events and universality. Physical review letters 85.24, 5234
(2000).
Barabási, A.L.: Network Science. Forthcoming.
Barabási, A.L., Albert, R.: Emergence of Scaling in Random Networks. Science 286.5439, 509-512 (1999)
Barthélemy, M., Barrat, A., Pastor-Satorras, R., Vespignani, A.: Characterization and modeling of weighted networks. Physica a:
Statistical mechanics and its applications 346.1, 34-43 (2005)
Barrat, A., Barthelemy, M., Pastor-Satorras, R., Vespignani, A.: The architecture of complex weighted networks. PNAS 101.11,
3747-3752 (2004)
Clauset, A., Shalizi, C. R., Newman, M. E.: Power-law distributions in empirical data. SIAM Review 51.4, 661-703 (2009)
De Montis, A., Barthélemy, M., Chessa, A., Vespignani, A.: The structure of inter-urban traffic: A weighted network analysis. arXiv
preprint physics/0507106 (2005)
De Montis, A., Caschili, S., Chessa, A.: Spatial Complex Network Analysis and Accessibility Indicators: the Case of Municipal
Commuting in Sardinia, Italy. EJTIR 4.11, (2011)
De Montis, A., Chessa, A., Campagna, M., Caschili, S., Deplano, G.: Modeling commuting systems through a complex network
analysis: A study of the Italian islands of Sardinia and Sicily. Journal of Transport and Land Use 2.3, (2010)
Easley, D., Kleinberg, J.: Networks, crowds, and markets. Cambridge, Cambridge University Press (2010)
Erdős, P., Rényi, A.: On the evolution of random graphs. Magyar Tud. Akad. Mat. Kutató Int. Közl 5, 17-61 (1960).
Gallego, F. J.: A population density grid of the European Union. Population and Environment 31.6, 460-473 (2010).
Gastner, M. T., Newman, M. E.: The spatial structure of networks. Eur. Phys. J. B 49.2, 247-252 (2006)
Gorman, S. P., Kulkarni, R.: Spatial small worlds: new geographic patterns for an information economy. arXiv preprint cond-
mat/0310426, (2003)
Liben-Nowell, D., Novak, J., Kumar, R., Raghavan, P., Tomkins, A.: Geographic routing in social networks. PNAS 102.33, 11623-
11628 (2005)
Newman, M. E.: Analysis of weighted networks. Physical Review E 70.5, 056131(2004).
Onnela, J. P., Saramäki, J., Kertész, J., Kaski, K.: Intensity and coherence of motifs in weighted complex networks. Physical
Review E 71.6, 065103 (2005)
Patuelli, R., Reggiani, A., Gorman, S. P., Nijkamp, P., Bade, F. J.: Network analysis of commuting flows: A comparative static
approach to German data. Networks and Spatial Economics 7.4, 315-331 (2007)
Travers, J., Milgram, S.: An experimental study of the small world problem. Sociometry 4, 425-443 (1969)
Watts, D. J., Strogatz, S. H.: Collective dynamics of ‘small-world’networks. Nature 393.6684, 440-442 (1998)
Yook, S. H., Jeong, H., Barabási, A. L.: Modeling the Internet's large-scale topology. PNAS 99.21, 13382-13386 (2002).