Embed Size (px)
Citation preview
Computers & Industrial Engineering 94 (2016) 93–104
Contents lists available at ScienceDirect
Computers & Industrial Engineering
journal homepage: www.elsevier .com/ locate/caie
Combining statistical learning with metaheuristics for the Multi-DepotVehicle Routing Problem with market segmentation
http://dx.doi.org/10.1016/j.cie.2016.01.0160360-8352/� 2016 Elsevier Ltd. All rights reserved.
⇑ Corresponding author.E-mail addresses: [email protected] (L. Calvet), [email protected] (A. Ferrer),
[email protected] (M.I. Gomes), [email protected] (A.A. Juan), [email protected](D. Masip).
Laura Calvet a,⇑, Albert Ferrer b, M. Isabel Gomes c, Angel A. Juan a, David Masip a
aComputer Science Department, Open University of Catalonia - IN3, Castelldefels, SpainbDepartment of Mathematics, Technical University of Catalonia, Barcelona, SpaincCentro de Matemática e Aplicações, FCT, Universidade Nova de Lisboa, Lisbon, Portugal
a r t i c l e i n f o
Article history:Received 25 July 2015Received in revised form 20 January 2016Accepted 21 January 2016Available online 28 January 2016
Keywords:Multi-Depot Vehicle Routing ProblemMarket segmentation applicationsHybrid algorithmsStatistical learning
a b s t r a c t
In real-life logistics and distribution activities it is usual to face situations in which the distribution ofgoods has to be made from multiple warehouses or depots to the final customers. This problem is knownas the Multi-Depot Vehicle Routing Problem (MDVRP), and it typically includes two sequential and cor-related stages: (a) the assignment map of customers to depots, and (b) the corresponding design of thedistribution routes. Most of the existing work in the literature has focused on minimizing distance-based distribution costs while satisfying a number of capacity constraints. However, no attention hasbeen given so far to potential variations in demands due to the fitness of the customer-depot mappingin the case of heterogeneous depots. In this paper, we consider this realistic version of the problem inwhich the depots are heterogeneous in terms of their commercial offer and customers show differentwillingness to consume depending on how well the assigned depot fits their preferences. Thus, weassume that different customer-depot assignment maps will lead to different customer-expenditurelevels. As a consequence, market-segmentation strategies need to be considered in order to increase salesand total income while accounting for the distribution costs. To solve this extension of the MDVRP, wepropose a hybrid approach that combines statistical learning techniques with a metaheuristic framework.First, a set of predictive models is generated from historical data. These statistical models allow estimat-ing the demand of any customer depending on the assigned depot. Then, the estimated expenditure ofeach customer is included as part of an enriched objective function as a way to better guide the stochasticlocal search inside the metaheuristic framework. A set of computational experiments contribute to illus-trate our approach and how the extended MDVRP considered here differs in terms of the proposed solu-tions from the traditional one.
� 2016 Elsevier Ltd. All rights reserved.
1. Introduction
In the distribution business, whenever a supplier operates frommultiple warehouses or depots it needs to decide two things: (a)which set of customers will be served from each depot, i.e., thecustomer-depot assignment map; and (b) the vehicle routing planfor the given assignment map. This two-stage decision-makingprocess is called the Multi-Depot Vehicle Routing Problem(MDVRP). During the last decades, researchers have extensivelyaddressed different variants of this problem, among others thoseincluding heterogeneous fleets of vehicles, multiple products,simultaneous pick-up and delivery, etc. (Caceres, Arias,
Guimarans, Riera, & Juan, 2015; Montoya-Torres, Lopez, Nieto,Felizzola, & Herazo-Padilla, 2015). The large majority of modelsaim at minimizing total distribution costs, which are often mod-eled by means of a distance-based cost function. Minimization ofdistribution costs has a major impact on the efficiency of any com-petitive shipping company. However, following the trend to con-sider richer and more realistic Vehicle Routing Problems(Barbucha, 2014; Ehmke, Campbell, & Urban, 2015; Tas�, Jabali, &Woensel, 2014), it should be noticed that these costs representonly half of the equation, i.e.: if a distribution company wants tomaximize its benefits, it has also to account for the expectedincomes associated with different customer-to-depot assignmentplans. Thus, retail centers (depots) belonging to the same organiza-tion may offer different products, trade credit policies, or comple-mentary services, which often have a non-negligible impact on thecustomer’s willingness to buy. Accordingly, under the existence ofa diversity of depots and commercial offers, the customer-to-depot
94 L. Calvet et al. / Computers & Industrial Engineering 94 (2016) 93–104
assignment process should not only consider distribution costs butalso expected sales or total income.
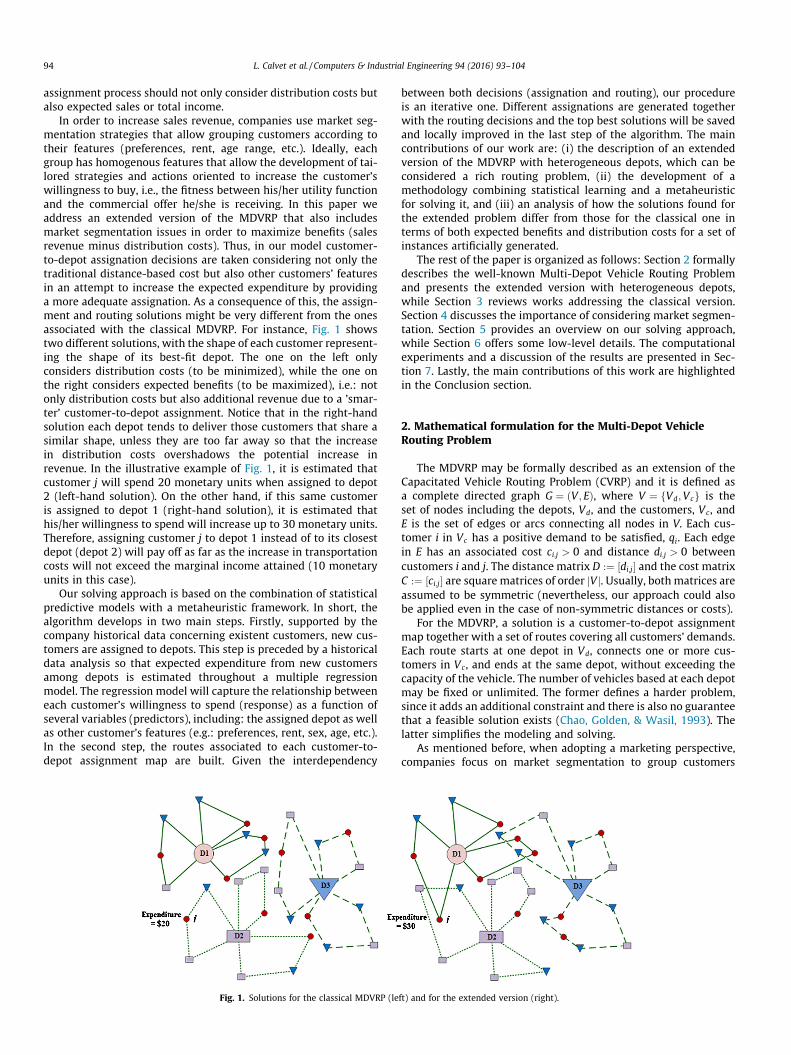
In order to increase sales revenue, companies use market seg-mentation strategies that allow grouping customers according totheir features (preferences, rent, age range, etc.). Ideally, eachgroup has homogenous features that allow the development of tai-lored strategies and actions oriented to increase the customer’swillingness to buy, i.e., the fitness between his/her utility functionand the commercial offer he/she is receiving. In this paper weaddress an extended version of the MDVRP that also includesmarket segmentation issues in order to maximize benefits (salesrevenue minus distribution costs). Thus, in our model customer-to-depot assignation decisions are taken considering not only thetraditional distance-based cost but also other customers’ featuresin an attempt to increase the expected expenditure by providinga more adequate assignation. As a consequence of this, the assign-ment and routing solutions might be very different from the onesassociated with the classical MDVRP. For instance, Fig. 1 showstwo different solutions, with the shape of each customer represent-ing the shape of its best-fit depot. The one on the left onlyconsiders distribution costs (to be minimized), while the one onthe right considers expected benefits (to be maximized), i.e.: notonly distribution costs but also additional revenue due to a ’smar-ter’ customer-to-depot assignment. Notice that in the right-handsolution each depot tends to deliver those customers that share asimilar shape, unless they are too far away so that the increasein distribution costs overshadows the potential increase inrevenue. In the illustrative example of Fig. 1, it is estimated thatcustomer j will spend 20 monetary units when assigned to depot2 (left-hand solution). On the other hand, if this same customeris assigned to depot 1 (right-hand solution), it is estimated thathis/her willingness to spend will increase up to 30 monetary units.Therefore, assigning customer j to depot 1 instead of to its closestdepot (depot 2) will pay off as far as the increase in transportationcosts will not exceed the marginal income attained (10 monetaryunits in this case).
Our solving approach is based on the combination of statisticalpredictive models with a metaheuristic framework. In short, thealgorithm develops in two main steps. Firstly, supported by thecompany historical data concerning existent customers, new cus-tomers are assigned to depots. This step is preceded by a historicaldata analysis so that expected expenditure from new customersamong depots is estimated throughout a multiple regressionmodel. The regression model will capture the relationship betweeneach customer’s willingness to spend (response) as a function ofseveral variables (predictors), including: the assigned depot as wellas other customer’s features (e.g.: preferences, rent, sex, age, etc.).In the second step, the routes associated to each customer-to-depot assignment map are built. Given the interdependency
Fig. 1. Solutions for the classical MDVRP (le
between both decisions (assignation and routing), our procedureis an iterative one. Different assignations are generated togetherwith the routing decisions and the top best solutions will be savedand locally improved in the last step of the algorithm. The maincontributions of our work are: (i) the description of an extendedversion of the MDVRP with heterogeneous depots, which can beconsidered a rich routing problem, (ii) the development of amethodology combining statistical learning and a metaheuristicfor solving it, and (iii) an analysis of how the solutions found forthe extended problem differ from those for the classical one interms of both expected benefits and distribution costs for a set ofinstances artificially generated.
The rest of the paper is organized as follows: Section 2 formallydescribes the well-known Multi-Depot Vehicle Routing Problemand presents the extended version with heterogeneous depots,while Section 3 reviews works addressing the classical version.Section 4 discusses the importance of considering market segmen-tation. Section 5 provides an overview on our solving approach,while Section 6 offers some low-level details. The computationalexperiments and a discussion of the results are presented in Sec-tion 7. Lastly, the main contributions of this work are highlightedin the Conclusion section.
2. Mathematical formulation for the Multi-Depot VehicleRouting Problem
The MDVRP may be formally described as an extension of theCapacitated Vehicle Routing Problem (CVRP) and it is defined asa complete directed graph G ¼ ðV ; EÞ, where V ¼ fVd;Vcg is theset of nodes including the depots, Vd, and the customers, Vc , andE is the set of edges or arcs connecting all nodes in V. Each cus-tomer i in Vc has a positive demand to be satisfied, qi. Each edgein E has an associated cost ci;j > 0 and distance di;j > 0 betweencustomers i and j. The distance matrix D :¼ ½di;j� and the cost matrixC :¼ ½ci;j� are square matrices of order jV j. Usually, both matrices areassumed to be symmetric (nevertheless, our approach could alsobe applied even in the case of non-symmetric distances or costs).
For the MDVRP, a solution is a customer-to-depot assignmentmap together with a set of routes covering all customers’ demands.Each route starts at one depot in Vd, connects one or more cus-tomers in Vc , and ends at the same depot, without exceeding thecapacity of the vehicle. The number of vehicles based at each depotmay be fixed or unlimited. The former defines a harder problem,since it adds an additional constraint and there is also no guaranteethat a feasible solution exists (Chao, Golden, & Wasil, 1993). Thelatter simplifies the modeling and solving.
As mentioned before, when adopting a marketing perspective,companies focus on market segmentation to group customers
ft) and for the extended version (right).

L. Calvet et al. / Computers & Industrial Engineering 94 (2016) 93–104 95
according to their features and preferences. Considering theheterogeneity of markets, segmentation attempts to divide cus-tomers into subsets that behave in a similar way. Our extensionof the MDVRP aims at assigning customers to depots based notonly on distribution costs but also on customers’ features and pref-erences. The goal is then to optimize expected benefits by consid-ering both distribution costs and expected incomes.
To formally describe the mathematical model for the MDVRPwith heterogeneous depots, we will first introduce a model forthe CVRP problem, which is a particular case of the MDVRP whenjVdj ¼ 1, i.e., Vd ¼ f0g, and a model for the classical MDVRP.
2.1. Mathematical model for the MDVRP with one depot (CVRP)
In graph theory, a finite path, /, of length r is a sequence of r þ 1vertices, fa0;a1; . . . ;arg, together with a sequence of r arcs,f/1;/2; . . . ;/rg, such that
/k ¼ ðak�1;akÞ; k ¼ 1;2; . . . ; r:
Sometimes we will denote a finite path, /, in the form:
/ : a0 ! a1 ! a2 ! � � � ! ar�1 ! ar :
The vertex a0 is called the start vertex and the vertex ar is called theend vertex of the path. Both of them are called terminal vertices ofthe path. The other vertices in the path are internal vertices. A finitecycle is a path such that the start vertex and the end vertex are thesame. Note that the choice of the start vertex in a cycle is arbitrary.A path with no repeated vertices is called a simple path, and a cyclewith no repeated vertices or arcs aside from the necessary repeti-tion of the start and the end vertex is a simple cycle.
Definition 2.1. In our context, a route, q, of order r is a simplefinite cycle of length r þ 2 in which the start vertex and the endvertex is the depot node 0,
q : 0 ! a1 ! a2 ! � � � ! ar�1 ! ar ! 0:
We denote,R, the set of all routes of the complete directed graph G.Notice that the cardinality of R is jRj ¼ Pn
k¼1Pðn; kÞ, wherePðn; kÞ represents the number of k-permutations of a set of nelements (or customers in our case). Notice thatjRj ¼ Pn
k¼1Pðn; kÞ � n!e, where e represents the Euler’s number,e ¼ P1
k¼01k!.
Definition 2.2. Two routes are independent when they have nointernal vertices in common, i.e., the only vertex in common is thedepot node. A non-empty set of independents routes, S � R, isnamed a complete system of routeswhen every customer belongsto a route of S. The set of all the complete system of routes of R isdenoted by CSR.
Notice that from now, in order to simplify the notation, whenwe write a 2 q, with q 2 S, and S 2 CSR, we want to indicate thata is a node of the route q.
Traditionally, the cost of a route, cq, and its distance, dq, havebeen modeled as
cq :¼ car ;a0 þXr
k¼1
cak�1 ;ak ; dq :¼ dar ;a0 þXr
k¼1
dak�1 ;ak :
Then, the optimization problem to be solved consists in finding acomplete system of routes, S, minimizing the total cost,cT :¼ P
q2Scq subject to the following constraints: the total demandserved in each route q 2 S does not exceed a maximum constantdemand (or vehicles capacity) Qmax;
Pa2qqa 6 Qmax, and the total
distance of each route q 2 S does not exceed a maximum constantdistance Dmax; dq 6 Dmax. Therefore, the optimization problem is
minimize cT ¼Xq2S
cq
subject to :Xa2q
qa 6 Qmax; q 2 S
dq 6 Dmax; q 2 SS 2 CSR:
ð1Þ
2.2. Mathematical model for the classical MDVRP
The extension to a MDVRP goes as follows: consider a completedirected graph G ¼ ðV ; EÞ, where V is the disjoint union (also nameda partition) of the set of nodes including the depots, Vd, and the setof nodes including customers Vc;V :¼ Vd [ Vc , and E is the set ofedges connecting all nodes in V. Hereafter, m :¼ jVdj will representthe number of depots. A feasible solution for the MDVRP is a par-tition of direct graphs Gi ¼ ðVi; EiÞ; i ¼ 1; . . . ;m, obtained from Gsuch that Vi :¼ f0i;v i
1; . . . ;v imig, for all i ¼ 1; . . . ;m, with 0i 2 Vd
and v ij 2 Vc for all j ¼ 1; . . . ;mi. Then, the optimization problem
to solve consists in finding a family of complete system of routes,fS1; . . . ;Smg, minimizing the total cost, cT :¼ Pm
i¼1
Pq2Si
cq subjectto the following constraints: the total demand served in each routeq 2 Si; i ¼ 1; . . . ;m, does not exceed a maximum constant demand,Qmax, i.e., bq :¼ P
a2qqa 6 Qmax, for all q 2 Si; i ¼ 1; . . . ;m, and thetotal distance of each route q 2 S does not exceed a maximum con-stant distance Dmax, i.e., for all q 2 Si; dq 6 Dmax; i ¼ 1; . . . ;m. There-fore, the optimization problem is
minimize cT ¼Xmi¼1
Xq2Si
cq
subject to : bq 6 Qmax; q 2 Si; i ¼ 1; . . . ;m;
dq 6 Dmax; q 2 Si; i ¼ 1; . . . ;m;
Si 2 CSR; i ¼ 1; . . . ;m:
ð2Þ
2.3. Mathematical model for the MDVRP with heterogeneous depots
The heterogeneous version of the MDVRP analyzed in this paperdoes not assume depots are equal (homogeneous), which leads toconsider customers’ preferences. Then, demands will not be fixedparameters, but depend on the assignment map of customers todepots. Following a realistic approach, we assume demands arenot known, but can be predicted relying on an historical databaseand information about new customers. In the heterogeneous casethe assignation of the customers is not made in advance usingthe classical considerations of distance. Our procedure takes intoaccount the combination of statistical predictive models with ametaheuristic, so three main steps must be considered.
(i) Analysis of the historical data so that expected expenditurefrom new customers among depots is estimated using amultiple regression model. The model captures the relation-ship between each customer’s willingness to spend(response) as a function of several variables (predictors),which include the assigned depot as well as other customer’scharacteristics as preferences, rent, sex, age, and so on.
(ii) Assignation of the new customers to the depots supportedby the company historical data with respect to the existentcustomers.
(iii) Routes are built, which are associated to each customer-to-depot assignment map.
Notice that revenue incomes are not considered in the modelfor the classical MDVRP because they do not depend on theassignation of customers to depots and, consequently, they are a

96 L. Calvet et al. / Computers & Industrial Engineering 94 (2016) 93–104
constant value. On the other hand, given the interdependencybetween both assignation and routing, the procedure is an iterativeone. Different assignations are generated (see Fig. 1) then, togetherwith the routing decisions. The top best solutions will be saved andlocally improved in the last step of the algorithm in order to max-imize the total benefit, bT , obtained from the difference between
the total income, iT :¼ Pmi¼1
Pq2Si
bq� �
and the total cost
cT :¼ Pmi¼1
Pq2Si
cq� �
.
bT :¼ iT � cT ¼Xmi¼1
Xq2Si
bq � cq� �
:
Thus, the optimization problem for the heterogeneous case can bedescribed as
maximize bT :¼Xmi¼1
Xq2Si
bq � cq� �
subject to : bq 6 Qmax; q 2 Si; i ¼ 1; . . . ;m;
dq 6 Dmax; q 2 Si; i ¼ 1; . . . ;m;
Si 2 CSR; i ¼ 1; . . . ;m:
ð3Þ
3. Literature review on the classical MDVRP
The MDVRP has received a considerable amount of attention inthe recent literature (Montoya-Torres et al., 2015). Tillman (1969)is usually referred as the first paper to address this problem. Itconsiders a version where customer demands follow specificprobability distributions, which is solved with an extension ofthe well-known CWS heuristic (Clarke & Wright, 1964). Mostworks may be classified according to the proposed approach: exactmethods and heuristics/metaheuristics methods. The main differ-ence is that the former guarantee the optimality of the solutionfound, while the latter usually provide a high-quality solution fas-ter. Currently, hybrid approaches have received more attention.Ceselli, Righini, and Salani (2009) is an example of work employingan exact methodology. The authors describe a version of theMulti-Depot Heterogeneous Vehicle Routing Problem with TimeWindows (MDHVRPTW) including diverse constraints. A columngeneration algorithm, in which the pricing problem is a resource-constrained elementary shortest-path problem, is implementedto solve real instances. Another methodology to solve theMDHVRPTW is proposed in Bettinelli, Ceselli, and Righini (2011).It describes a branch-and-cut-and-price algorithm, and differentpricing and cutting techniques. More recently, Contardo andMartinelli (2014) have formulated the MDVRP employing avehicle-flow and a set-partitioning formulation.
A higher number of published works rely on heuristics-basedmethodologies. For instance, Cordeau, Gendreau, and Laporte(1997) present a Tabu Search (TS) metaheuristic. In Salhi and Sari(1997), the authors propose a multi-level composite heuristic foraddressing a MDVRP in which the vehicle fleet composition hasto be determined. Nagy and Salhi (2005) consider the MDVRP withPickups and Delivers. Several heuristics from the Vehicle RoutingProblem (VRP) literature are adapted and some problem-specificare constructed. Metaheuristics are frequently implemented tosolve real-size instances. The Simulated Annealing (SA) meta-heuristic is chosen in Wu, Low, and Bai (2002) for solving theMulti-Depot Location-Routing Problem. Polacek, Hartl, andDoerner (2004) employ the Variable Neighborhood Search (VNS)metaheuristic for addressing the MDVRP with Time Windows(MDVRPTW). The MDVRP with a heterogeneous fleet of vehiclesis faced in Salhi, Imran, and Wassan (2014), where an algorithmalso based on the VNS metaheuristic is designed. Pisinger andRopke (2007) tackle different variants of the VRP, including the
MDVRP, by transforming them into rich pickup and delivery mod-els and developing an Adaptive Large Neighborhood Searchmethodology. A Genetic Algorithm (GA) is constructed inOmbuki-Berman and Hanshar (2009). Another population-basedmetaheuristic, the Path Relinking, is presented in Rahimi-Vahed,Crainic, Gendreau, and Rei (2013).
Regarding hybrid algorithms, Ho, Ho, Ji, and Lau (2008) intro-duce an algorithm relying on a GA. The initialization procedureconsists in a distance-based grouping, the CWS heuristic isemployed for routing, and the Nearest Neighbor Heuristic (NNH)for scheduling (i.e., sequencing each route in every depot). Anotherhybrid GA is developed in Vidal, Crainic, Gendreau, and Prins(2013) for addressing several rich VRPs, including the MDVRPTW.It has diversity management mechanisms, and employs geometricand structural problem decompositions for large instances. Mirabi,Fatemi-Ghomi, and Jolai (2010) describe a methodology combininga constructive heuristic search and improvement techniques. First,the nearest depot method, the CWS heuristic and the NNH areimplemented for grouping, routing, and scheduling, respectively.The resulting solutions are improved by means of a deterministic,stochastic, or the SA metaheuristic. Yu, Yang, and Xie (2011) con-struct an algorithm based on the Ant Colony metaheuristic, apply-ing a coarse-grain parallel strategy, an ant-weight strategy andmutation operation. Cordeau and Maischberger (2012) design aparallel Iterated Tabu Search heuristic which introduces the TSheuristic into the Iterated Local Search (ILS) framework, in orderto ensure a broad exploration of the search space. The ParticleSwarm Optimization (PSO) metaheuristic is proposed in Geetha,Vanathi, and Poonthalir (2012). It generates initial particles withthe k-means algorithm and the NNH. Lahrichi et al. (2012) presenta multi-thread cooperative search method called the IntegrativeCooperative Search for multi-attribute combinatorial optimizationproblems. In Juan, Pascual, Guimarans, and Barrios (2014), theauthors combine an ILS metaheuristic with biased-randomizationtechniques to solve the MDVRP. The same metaheuristic frame-work is proposed in Li, Pardalos, Sun, Pei, and Zhang (2015). In thiscase, an adaptive neighborhood selection mechanism is integratedfor the MDVRP with simultaneous deliveries and pickups. Luo andChen (2014a) develop an improved Shuffled Frog Leaping Algo-rithm (SFLA) and its multi-phase model for the MDVRP and theMDVRPTW. In order to improve the efficiency of the metaheuristic,a Power Law Extremal Optimization Neighborhood Search is used.The same problems are addressed in Luo and Chen (2014b), wherea multi-phase modified SFLA is applied. It implements the k-meansalgorithm and presents cluster and global optimization procedures.
4. Importance of considering market segmentation
In a global and dynamic world, companies have to compete inorder to build profitable and long-lived relationships with cus-tomers. Analyzing customer needs and desires, capabilities, socialvalues, and objectives of a specific company as well as how theseinterrelate is a crucial area in business intelligence. During manydecades mass market-based strategies had prevailed, which makeprofit from economies of scale, providing homogeneous goods andservices for a vast number of customers. Technological develop-ments and flexible manufacturing systems have boosted the cus-tomization of goods and services according to customerpreferences (Datta, 1996; Liu, Kiang, & Brusco, 2012). Market seg-mentation is a key concept in this new approach.
Considering the heterogeneity of markets, segmentationattempts to divide customers into subsets that behave in the sameway or have similar needs (Bennett, 1995). As a result, a betterunderstanding of customer requirements is obtained, which mayassist in the developing of marketing strategies as well as in the

L. Calvet et al. / Computers & Industrial Engineering 94 (2016) 93–104 97
efficient allocation of resources among markets and products(Wind, 1978). According to Foedermayr and Diamantopoulos(2008), the segmentation process includes the following stages(Fig. 2):
1. Market definition: The scope of the concept of market for acompany is chosen. It should be broad enough to cover as manypotential customers as possible, but also manageable.
2. Selection of segmentation variables or bases: These basesshould be capable of diminishing the market heterogeneityand explaining why customers have different requirementsand/or do not respond similarly to marketing campaigns. Fromthe point of view of the company, they should be easy to obtainor infer in terms of cost and time, among others. The most pop-ular are classified into the following groups (Kotler &Armstrong, 2011): (i) geographic bases (e.g., location); (ii)demographic bases (e.g., age, occupation, and education level);(iii) behavioral bases (e.g., purchase occasion, degree of usage,and degree of loyalty); and (iv) psychographic bases (customeractivities and opinions).
3. Decision on segmentation method: A-priori versus post hocmethods, and descriptive versus predictive methods, are thecriteria most commonly employed to classify segmentationmethods (Foedermayr & Diamantopoulos, 2008). A-priori meth-ods are based on intuitions and prior experience, and/or sec-ondary data. While in post hoc methods the data analysis iswhat leads to the segments. In descriptive methods, no distinc-tion is made between dependent and independent variables.The focus is on exploring the relation between the units of anal-ysis and the variables. In contrast, predictive methods link adependent variable (e.g., degree of loyalty) to a set of indepen-dent variables, and use this set to segment. There are plenty oftechniques for segmentation, which includes: cross tabulationanalysis, RFM analysis, k-means clustering, hierarchical cluster-ing, self-organizing map (SOM), automatic interaction detec-tion, classification and regression trees, logistic regression,support vector machine, linear regression, clusterwise regres-sion, neural networks, finite mixture model, and metaheuristics,among others. For instance, McCarty and Hastak (2007) investi-gate RFM, decision trees, and logistic regression. Vellido, Lisboa,and Meehan (1999) present a strategy combining SOM and fac-tor analysis before clustering. Another two-stage approachinvolving SOM is detailed in Kuo, Ho, and Hu (2014). Theseauthors apply SOM to determine the number of clusters andthe starting point, and the k-means algorithm to find the finalsolution. Huang, Tzeng, and Ong (2007) employ a support vec-tor clustering algorithm. Fish, Barnes, and Aiken (1995) analyzethe performance of artificial neural networks, in comparisonwith those of discriminant analysis and logistic regression. Acase-based reasoning system is described in Chen, Wang, andFeng (2010). It implements GAs for selecting variables andinstances.
4. Formation of market segments: The method selected in the pre-vious step is applied to obtain a set of segments.
5. Profiling, evaluation, and final selection of target segments: Adetailed analysis of the resulting segments and a selection ofthem are performed. There are several criteria to evaluate
Fig. 2. Scheme of the seg
market segments. Smith (1956), considered the first work totackle this issue, highlights the characteristics of identifiability,which means that customers in a segment should have a similarprofile, allowing for their identification, and responsiveness, i.e.,customers in a segment should similarly respond to a market-ing strategy. DeSarbo and DeSarbo (2007) gather the main cri-teria that have been proposed in the literature. Someexamples are: reachability, feasibility, profitability, and stability.
6. Implementation: The next step is to translate the results of theprevious work into specific strategies. This step involves deci-sions that depend on a large number of factors as relevant ascompany resources and ethics.
7. Segmentation strategy evaluation: Sales, profit, companyexpansion, reputation, and customer satisfaction may be usedto evaluate a strategy. Although these steps could be sequen-tially followed, all are interconnected. Therefore, it is recom-mendable to allow the possibility to repeat previous steps inorder to reconsider some selections.
As it has been shown, marketing segmentation has been exten-sively studied. It is an important topic of research due to its poten-tial applications. New lines of research emerge from thedevelopment of data techniques, the gathering of empirical evi-dences, and the publication of new marketing theories, amongothers. Many challenges still remain to be faced such as reducingthe gap between academic research and practitioner needs, study-ing implementation issues.
5. Overview of our approach
The MDVRP includes two sequential and correlated stages: (a)the assignment map of customers to depots; and (b) the corre-sponding design of distribution routes to satisfy all customers’demands. In order to assign customers, we take into account theheterogeneity of the depots. It can be considered a realisticapproach, since depots belonging to the same organization usuallyhave different characteristics related to products, trade credit poli-cies, and complementary services, among others. The diversity ofdepots leads to consider customer preferences. Specifically, thewillingness to consume (or expenditure) of each customer dependson how well the assigned depot fits his/her preferences. Marketsegmentation techniques are applied to identify subsets of cus-tomers with similar profiles and assign them to the particulardepot that better fits their preferences, considering the restrictionsof the problem. Accordingly, we propose to study the relationshipbetween expenditure and customers’ features from data of existentcustomers by employing statistical learning methodologies (e.g.,prediction techniques). It will enable the assignation of new cus-tomers in such a way that the expected benefits (expected incomesminus distribution costs) is maximized. The phases of ourapproach are represented in Fig. 3 and described next:
1. Data collection. Our approach requires several inputs: databaseof historical sales, description of new customers, location ofdepots, vehicle maximum capacity, number of available vehi-cles at each depot, and maximum distribution costs per route.The sales database includes the following information for each
mentation process.

Fig. 3. The proposed approach.
98 L. Calvet et al. / Computers & Industrial Engineering 94 (2016) 93–104
existent customer: personal features, geographical location,expenditure level, and depot to which he/she has been assigned(randomly or according to a metric not related to personal fea-tures such as distribution costs). The description of new cus-tomers gathers personal features and geographical locations.This information may be easily obtained, for instance, in e-commerce environments, where customers have to registerand provide personal data before buying. After processing andanalyzing this data, a company may assign a new client by redi-recting him/her to a specific directory/website and offeringgoods from a given depot. Regarding the information of bothexistent and new customers, an initial selection of variableshas to be performed by assessing which ones may be valuable.Besides explaining the differences of expenditures amongdepots, they should be easy to obtain, estimate or compute,and store.
2. Statistical learning. Given the database of existent customers, astatistical model exploring the relationship between customers’features and expenditure is performed for each group of cus-tomers assigned to a specific depot. Considering several groups,we allow the existence of a different trend in each one. A highnumber of methodologies are available to carry out regressionanalysis (Hastie, Tibshirani, & Friedman, 2001; Lantz, 2013).Probably, the most applied is Linear Regression (Montgomery,Peck, & Vining, 2012), which is easy to understand and inter-pret, highly relevant in the marketing literature, and has associ-ated a relatively low risk of overfitting (i.e., the modeldescribing noise). Neural Networks represent a popular alterna-tive capable of capturing non-linear relationships. However,they are computationally more intensive, may overfit/underfitdata more easily and are difficult to interpret. Support VectorMachines constitute another powerful black box approach,which is more robust and less prone to overfitting than NeuralNetworks. Its main disadvantage is that requires testing severalcombinations of kernels and model parameters. Model Treescombine Decision Trees with modeling of numeric data. Itresults in an approach that may fit some types of data betterthan linear regression and perform automatic feature selection.On the other hand, it may be difficult to determine the overallnet effect of individual variables on the response.
3. Prediction of expenditure for new customers. Once a methodol-ogy has been selected and the different functions have been fit-ted, the expenditure is predicted for each new customer givenhis/her features if assigned to each depot. Here, it is assumedthat the sample (set of existent customers) is representativeof the population (market).
4. Assignment of customers to depots. In order to perform an effi-cient and feasible assignation, it is necessary not only to con-sider the predicted expenditure but also the distribution costs,the maximum number of vehicles per depot, and their capacity.Taking a decision for each customer individually may providenon-feasible and poor-quality solutions. Consequently, we pre-sent a global and iterative strategy where customers areselected one at a time to be assigned to a specific depot. Itprioritizes the assignments of those customers that have
associated a relatively high expected benefits only for a partic-ular depot, and is based on the procedure developed in Juanet al. (2014). In particular, the following steps are proposed:� For each depot k and customer i,
– Compute the expected benefits lki as the difference
between the predicted expenditure pki and the distribu-
tion costs cki (computed as the cost of moving from k to i).– Compute the difference between the expected benefits of
assigning i to k and the maximum expected benefits ofassigning i to a depot l other than k, i.e.:
ski ¼ lki �maxl2Vdnfkg l
li 8i 2 Vc; 8k 2 Vd:
We refer to this measure as ‘‘marginal savings”. Accordingly, skiwill be high in the case customer i reports relevant expectedbenefits only if assigned to k, low (in absolute terms) if theexpected benefits are similar for k and at least one other depot,presenting both depots the highest expected benefits, and verylow (negative) when there is at least one depot where theexpected benefits are larger than those estimated for k.
� For each depot k, create a priority list of customers and sortit in descending order according to the marginal savings ski .
� Create a list of unassigned customers. Then, select a depotand choose the next customer to assign from its priority list.Update the list of unassigned customers and repeat thesesteps while there are unassigned customers. Different poli-cies may be applied to determine which depot selects thenext customer, as: (i) allowing the depot with the highestremaining capacity to choose, (ii) using a round robin-based criterion, or (iii) selecting it randomly.
5. Routing. Having an assignment map, the MDVRP can be solvedas a set of independent CVRPs. However, the most importantchallenge when addressing a MDVRP instance is the interrela-tion between assignation and routing. Therefore, algorithmsare required to take the decisions associated to both phases ’si-multaneously’. Thus, instead of finding an optimal or near-optimal solution for the customer-to-depot assignment phaseand then use this unique solution as a starting point to solvethe routing phase, an iteration process combines ’good’ and fastcomputed solutions for the first stage with ’good’ and fast com-puted solutions for the second one in order to find a near-optimal solution for the overall problem.
Note that our approach will be appropriate as long as the exis-tent customers had been assigned randomly or based on a variablenot related to personal features. If regression functions were esti-mated again after implementing this procedure (replacing existentcustomers by the new ones), the predictive model could be notvalid anymore, since the groups of customers assigned to eachdepot may not be representative of all potential customers. At thispoint, a description of each resulting group may be performed.Accordingly, a new customer would be assigned to the closestgroup (considering standardized data, the Euclidean distance, andan average profile per group, for instance). In the described

L. Calvet et al. / Computers & Industrial Engineering 94 (2016) 93–104 99
approach, the statistical learning techniques and the metaheuristicare sequentially employed. There are other realistic versions of theproblem that may be addressed by adapting our approach to inte-grate the statistical learning techniques inside the metaheuristic.For instance, consider a dynamic scenario in which the willingnessof customers to spend varies as new customers are assigned toeach depot (e.g., due to the decrease in the service’s quality or inthe number of available offers). In this case, the learning mecha-nism would iteratively run throughout the searching process inorder to update each customer’s willingness to spend after eachassignment.
6. Detailed algorithm
This section describes some low-level details of the proposedapproach. Fig. 4 summarizes it highlighting the main differencesbetween the classical version of the problem and the proposed one.
Fig. 4. Flow chart of our approach for solving
Since the phase of data collection is company-specific, we willassume it has already been done. The second and the third phasesare related to the development and use of predictive statisticallearning models. First, the database of existent customers is splitinto two subsets: a training set, which will be used to build themodels, and a test set, to assess their performance. These subsetsare generated by means of random sampling: 75% of customersare assigned to the training set and 25% to the test set. Having dif-ferent alternatives to explore the relationship between expendi-ture and customers’ features, in our experiments (described laterin this paper) we make use of three well-known methodologies:Multiple Linear Regression (MLR), Multi-layer Feedforward Net-work (MFN), and Model Tree.
� Regarding Multiple Linear Regression, given a database of cus-tomers with m features and jVdj depots, the models proposedmay be described as follows:
the MDVRP with heterogeneous depots.

100 L. Calvet et al. / Computers & Industrial Engineering 94 (2016) 93–104
Expi ¼b j0þb j
1 � f 1iþb j2 � f 2iþ . . .þb j
m � f miþ�i 8i2V jc; 8j2Vd;
where f 1i; . . . ; f mi represent the features of customer i; b j0; . . . ;b
jm
are the parameters of the model, Expi and �i denote the expendi-
ture and an error term for customer i, and V jc is the set of cus-
tomers assigned to depot j. The ordinary least squares methodis applied to estimate the parameters, and the stepwise regres-sion approach with a bidirectional elimination procedure is cho-sen to perform the variable selection.
� Regarding the Multi-layer Feedforward Network with one hid-den layer, the generated models are:
Zli ¼ rðbjl0 þ bjl
1 � f 1i þ bjl2 � f 2i þ � � � þ bjl
m � f miÞ8i 2 V j
c; 8j 2 Vd; l ¼ 1; . . . ;p;
Expi ¼ a j0 þ a j
1 � Z1i þ � � � þ a jp � Zpi 8i 2 V j
c; 8j 2 Vd;
where r is the sigmoid function and p the number of hiddenunits. The value of p (4;5;6;7, or 8) and the decay value for reg-ularization (0:2;0:3;0:4; 0:5 or 0:6) are set using 10-fold crossvalidation based on the metric R2 (Kuhn, 2008). The back prop-agation method is employed to estimate the parameters.
� The algorithm selected to implement a model tree is the stan-dard M5P (Wang & Witten, 1996). Basically, it builds adecision-tree induction algorithm relying on a splitting criterionthat minimizes the intra-subset variation in the class valuesdown each branch. The pruning of the tree is performed backfrom each leaf. Instead of a constant value, the final solutionfor each leaf is a linear regression model considering the vari-ables participating in decisions.
Different criteria can be employed to select one of the formerstatistical learning methodologies. The most common criteria arerelated to performance, easiness to apply and understand, requiredtime, or any combination of the aforementioned properties. Con-sidering the first one, we compute the Mean Squared Error (MSE)for each model (the number of models is the number of depotsmultiplied by the number of methodologies tested) using the sameproblem instance. The Total MSE (TMSE) is computed by aggregat-ing the values of the models corresponding to the same methodol-ogy. In mathematical terms:
MSEaj ¼ 1
jV jcjX8i2V j
c
dExpai � Expi
� �2 8a ¼ 1; . . . ; o 8j 2 Vd;
TMSEa ¼XjVd j
j¼1
MSEaj 8a ¼ 1; . . . ; o;
where a represents the methodology assessed, and dExpai refers to
the predicted expenditure for customer i employing the methodol-ogy a. In our experiments, for each instance we always select themethodology associated with the lowest TMSE. Thus, during thethird phase, the expenditure that each new customer would makeif he/she was assigned to each one of the depots is predicted usingthe selected methodology and the customer’s features.
For the assignation and the routing phases, an existing method-ology described in Juan et al. (2014) has been adapted. The authorspropose an efficient algorithm based on an ILS metaheuristicframework (Lourenço, Martin, & Stützle, 2010), which is a popularchoice for solving routing problems (see Cattaruzza, Absi, Feillet, &Vigo, 2014). This metaheuristic guides the search by interspersingexploration and intensification movements. Firstly, an initial solu-tion is generated assigning customers to depots according to themarginal savings (only the distribution costs are considered) and
designing the routes by implementing the classical CWS heuristic(Clarke & Wright, 1964). Afterwards, an iterative procedure isstarted in which the base solution (the initial solution in the firstiteration) is perturbed. If the new solution is better than the basesolution, then the latter is replaced. In case no improvement isachieved, a Demon-based acceptance criterion (Talbi, 2009) is con-sidered to avoid entrapment at local optimum. It allows move-ments that deteriorate the base solution with a higher frequencyat the beginning, when a global search is required, and restrictsthem as the execution proceeds. These steps are repeated until atermination condition is met. Finally, the top best solutions areimproved by means of a post optimization process, and the bestone is returned. The described algorithm includes Biased Random-ization techniques to further diversify the search (Juan et al., 2009).These techniques are introduced in traditionally deterministicsteps in order to add biased randomization, which favors the gen-eration of high-quality alternatives. In particular, they are imple-mented both in the assignation phase, to randomize the sortedpriority list of customers of each depot in such a way that the rea-soning behind the sorting is not erased but many orderings areprovided, and in the routing phase, where the CWS heuristic israndomized.
7. Numerical experiments
An algorithm based on the described approach has been imple-mented and employed to solve a number of generated instances.The computational experiments compare the results of ourapproach for the analyzed version of the MDVRP and for the clas-sical version (i.e., the one assuming homogeneous depots). Thissection provides the description of the instances and the tests car-ried out, as well as the numerical results and their analysis.
7.1. Set of instances
A total of 15 instances have been generated. Each of them con-sists in three datasets: the first two gather data concerning existentand new customers, respectively, and the third includes depots’locations and information related to restrictions. Regarding dataof existent customers, four variables have been created: age (a dis-crete variable following a Uniform distribution with parameters 16and 80), sex (a categorical variable with two equally probable val-ues), estimated income (it follows a Normal distribution with amean of 1500 and standard deviation of 300), and preferred article(a categorical variable including four equally probable values). Ini-tially, each customer has been assigned to his/her closest depot,while the expenditure level has been determined by a given func-tion that depends on the depot, the aforementioned variables and awhite noise term. For a total of 100 new customers, the variablesage, sex, estimated income and preferred article have been gener-ated using the same distributions. Customers’ and depots’ locationshave been randomly generated in a square of 100 � 100. In order tosimplify the instances’ generation, Euclidean distances areemployed as distribution costs. Different values have been chosenfor the number of depots, existent customers and vehicles, themaximum cost per route and vehicles’ capacity. This informationis shown in Table 1.
7.2. Test
Each instance has been adapted by modifying the expenditureof existent customers to analyze the following scenarios: (1) lowratio (LR), the ratio between average expenditure of existent cus-tomers and average distribution costs is similar; (2) medium ratio(MR), average expenditure is relatively higher than average

Table 1Description of the generated instances.
Instance Numb.depots
Numb.existent cust.
Numb.vehicles
Vehiclecapacity
Max.cost
1 3 300 3 250 2002 3 300 3 225 2003 3 300 3 225 1504 3 300 3 225 2005 3 300 3 200 1506 3 400 3 350 2257 3 400 3 300 2008 3 400 3 200 1759 5 400 4 325 175
10 5 400 4 200 15011 5 400 4 275 17512 5 400 4 275 15013 5 400 4 225 20014 5 400 4 175 12515 5 400 4 250 175
Fig. 5. Boxplot of the expected benefits for each scenario and version of theproblem.
Fig. 6. Boxplot of the distribution costs and the expected incomes for the richversion of the problem.
L. Calvet et al. / Computers & Industrial Engineering 94 (2016) 93–104 101
distribution costs; and (3) high ratio (HR), average expenditure ismuch higher than average distribution costs. The target ratio hasbeen reached multiplying expenditures by a coefficient. The result-ing instances are available from the authors upon request. Theanalysis of these scenarios will allow us to compare the expectedbenefits (expected incomes, defined as the sum of predicted expen-ditures, minus distribution costs) associated to solutions consider-ing only distribution costs and those taking into account alsocustomers’ preferences (predicted expenditure), thus exploringthe consequences of having different weights of expenditure inthe objective solution. For the first scenario, it is expected thatthe gap between distribution costs will be low (i.e., solutions areexpected to be relatively similar). Likewise, it is expected that thisgap will be higher as the ratio increases. Similarly, it is alsoexpected that the higher the ratio, the higher the gap betweenthe expected benefits of the solutions. The code has been imple-mented with Java and R – version 2.15.0 (Team, 2008) (packages:caret, MASS, nnet, and RWeka). A standard personal computer,Intel QuadCore i5 CPU at 3.2 GHz and 4 GB RAM with WindowsXP, has been used to perform all tests. The ILS process runs for4,000 iterations, and all executions are solved for 10 differentseeds. Only the best values obtained after the 10 runs are reported.
7.3. Results and analysis
The results of the experiments carried out are summarized inFigs. 5 and 6. The boxplots in the first figure show the expectedbenefits per scenario and version of the problem: consideringheterogeneous depots (rich) and assuming homogeneous ones(traditional). Even if the medians associated to each ratio level donot differ significantly, the third and second quartile values do pre-sent a higher value for the extended version of the problem. Thisbehavior is caused by the long right tails of the corresponding dis-tributions, which indicate that for some instances the rich versionresults in better solutions in terms of expected benefits. The secondfigure displays the variables in which expected benefits are decom-posed per scenario considering the rich version. We observe thatdifferences of expected benefits between scenarios are mainlydue to differences between expected incomes.
Tables 2–4 provide a detailed description of the results. Theinformation gathered in the tables is the following: instance name;methodology selected for prediction; distribution costs, expectedincomes, expected benefits and time associated to the best solutionfound considering only distribution costs (classical MDVRP) and tothe best solution found when maximizing expected benefit(MDVRP with heterogeneous depots); and gaps between distribu-tion costs, expected incomes and expected benefits of both solu-tions. The average of each gap is also shown.
Given the flexibility of Feedforward Neural Networks to modelrelationships between variables, and despite the basic topologyand parameter fine-tuning, and the medium size of the trainingset, they have been selected to solve more than half of theinstances (57.8%). Multiple Linear Regression has provided the bestTMSE in a high number of cases (31.1%). Although less frequently,the algorithm M5P has also been used in some instances (11.1%).Being an experiment for illustrative purposes, we show that differ-ent methodologies with particular strengths may be easily applied,but we do not aim to perform a comprehensive comparison amongthem.
The gaps related to the distribution costs and the expectedincomes are strictly positive except in one case. It confirms thetrade-off decision-makers face between both measures; that is tosay, higher distribution costs are required to obtain an increasein expected incomes. Regarding the gap of expected benefits, it isstrictly positive for all instances except for two where both solu-tions are equal. Therefore, attempting to achieve the highest bene-fits studying only distribution costs in instances withheterogeneous depots results in sub-optimal solutions. Asexpected, all average gaps increase with the ratio, i.e., the differ-ence between solutions (in terms of distribution costs, expectedincomes or expected benefits) is positively correlated to the

Table 2Results obtained for 15 instances: scenario characterized by a low ratio.
Inst. Meth. Traditional (1) Rich(2) Gaps(2-1)
Dist. cost Exp. Inc. Exp. ben. Time Dist. cost Exp. Inc. Exp. ben. Time Dist. cost Exp. Inc. Exp. ben.
p01.1 MLR 898.6 961 62.4 82 930.6 1006 75.4 123 31.9 45.0 13.1p02.1 M5P 834.3 943 108.7 112 834.5 947 112.6 335 0.1 4.0 3.9p03.1 MFN 944.0 911 �33.0 143 964.4 939 �25.4 159 20.4 28.0 7.6p04.1 MFN 891.8 852 �39.8 79 923.4 884 �39.4 165 31.6 32.0 0.4p05.1 MFN 909.7 824 �85.7 189 914.4 829 �85.4 66 4.8 5.0 0.2p06.1 MFN 868.5 1425 556.5 655 870.2 1429 558.8 613 1.7 4.0 2.3p07.1 MFN 923.4 1073 149.6 103 925.7 1093 167.3 383 2.3 20.0 17.7p08.1 M5P 898.2 867 �31.2 105 900.9 872 �28.9 122 2.7 5.0 2.3p09.1 MLR 1039.2 2008 968.8 91 1127.5 2218 1090.5 33 88.3 210.0 121.7p10.1 MFN 1029.6 1404 374.4 63 1062.5 1462 399.5 40 32.9 58.0 25.1p11.1 MLR 880.7 1469 588.3 47 939.1 1609 669.9 464 58.4 140.0 81.6p12.1 MFN 1858.4 1699 �159.4 108 1864.2 1709 �155.2 328 5.8 10.0 4.2p13.1 MLR 1428.3 1495 66.7 437 1568.0 1691 123.0 144 139.6 196.0 56.4p14.1 MFN 930.0 1163 233.0 43 930.0 1163 233.0 40 0.0 0.0 0.0p15.1 M5P 1268.1 1401 132.9 374 1375.0 1512 137.0 59 107.0 111.0 4.0
Average 35.2 57.9 22.7
Table 3Results obtained for 15 instances: scenario characterized by a medium ratio.
Inst. Meth. Traditional (1) Rich(2) Gaps(2-1)
Dist. cost Exp. Inc. Exp. ben. Time Dist. cost Exp. Inc. Exp. ben. Time Dist. cost Exp. Inc. Exp. ben.
p01.2 MLR 925.3 1383 457.7 277 978.0 1483 505.0 173 52.7 100.0 47.3p02.2 MLR 901.2 1334 432.8 301 921.9 1385 463.1 254 20.7 51.0 30.3p03.2 MLR 959.3 1405 445.7 134 979.1 1438 458.9 89 19.8 33.0 13.2p04.2 MFN 942.5 1280 337.5 124 947.8 1292 344.3 101 5.3 12.0 6.7p05.2 MFN 919.0 1264 345.0 51 921.3 1269 347.8 221 2.3 5.0 2.7p06.2 MFN 945.6 2103 1157.4 106 948.6 2122 1173.4 327 3.1 19.0 15.9p07.2 MFN 962.8 1581 618.2 394 992.3 1617 624.7 139 29.5 36.0 6.5p08.2 MFN 969.9 1302 332.1 300 969.9 1302 332.1 296 0.0 0.0 0.0p09.2 MFN 1169.6 2897 1727.4 36 1336.1 3335 1998.9 173 166.5 438.0 271.5p10.2 MFN 1165.1 2109 943.9 161 1222.9 2222 999.1 97 57.8 113.0 55.2p11.2 MLR 1001.8 2212 1210.2 80 1054.4 2288 1233.7 253 52.5 76.0 23.5p12.2 MFN 1050.0 2571 1521.0 75 1070.5 2620 1549.5 41 20.6 49.0 28.4p13.2 MLR 1633.4 2178 544.6 106 1778.2 2446 667.8 270 144.8 268.0 123.2p14.2 MFN 1020.2 1703 682.8 63 1026.8 1717 690.2 67 6.6 14.0 7.4p15.2 M5P 1419.6 2090 670.4 69 1560.2 2257 696.8 106 140.5 167.0 26.5
Average 48.2 92.1 43.9
Table 4Results obtained for 15 instances: scenario characterized by a high ratio.
Inst. Meth. Traditional (1) Rich(2) Gaps(2-1)
Dist. cost Exp. Inc. Exp. ben. Time Dist. cost Exp. Inc. Exp. ben. Time Dist. cost Exp. Inc. Exp. ben.
p01.3 MLR 1060.3 1930 869.7 199 1153.7 2132 978.3 42 93.4 202.0 108.6p02.3 M5P 1070.7 1803 732.3 253 1097.0 1864 767.0 174 26.3 61.0 34.7p03.3 MFN 1042.7 1864 821.3 23 1067.1 1923 855.9 162 24.4 59.0 34.6p04.3 MFN 1043.2 1701 657.8 54 1080.5 1755 674.5 393 37.2 54.0 16.8p05.3 MFN 994.0 1621 627.0 174 1011.0 1657 646.0 68 17.0 36.0 19.0p06.3 MFN 1068.1 2856 1787.9 109 1102.7 2906 1803.3 208 34.6 50.0 15.4p07.3 MFN 1064.1 2115 1050.9 152 1081.2 2139 1057.8 71 17.1 24.0 6.9p08.3 M5P 1069.6 1741 671.5 32 1069.6 1741 671.5 261 0.0 0.0 0.0p09.3 MLR 1420.5 4269 2848.5 37 1690.6 4825 3134.4 138 270.1 556.0 285.9p10.3 MFN 1434.8 2913 1478.2 113 1734.8 3396 1661.2 33 299.9 483.0 183.1p11.3 MLR 1238.0 3020 1782.0 25 1486.3 3407 1920.7 265 248.3 387.0 138.7p12.3 MFN 1195.7 3385 2189.3 37 1216.1 3452 2235.9 125 20.3 67.0 46.7p13.3 MLR 1843.3 2801 957.7 79 2321.4 3387 1065.6 101 478.1 586.0 107.9p14.3 MFN 1198.9 2297 1098.1 17 1251.0 2351 1100.0 23 52.1 54.0 1.9p15.3 M5P 1416.0 2086 670.0 164 1595.5 2311 715.6 210 179.5 225.0 45.5
Average 119.9 189.6 69.7
102 L. Calvet et al. / Computers & Industrial Engineering 94 (2016) 93–104
average expenditure for fixed average distribution costs. However,this rule does not apply for all cases. In some of them, despite thefact that the gap of expected incomes increases, so does the gap ofdistribution costs. As a consequence, the gap of expected benefitmay be reduced.
8. Conclusions
This paper addresses an extension of the Multi-Depot VehicleRouting Problem (MDVRP) in which heterogeneous depots are con-sidered. The resolution of the classical MDVRP has two sequential

L. Calvet et al. / Computers & Industrial Engineering 94 (2016) 93–104 103
and interrelated stages: (a) the assignment of customers to depots,and (b) the corresponding design of distribution routes. Typically,the assignment map is generated by minimizing the total distance,which is intended to lead to the minimization of distribution costs.Implementing this approach, researchers assume that depots arehomogeneous. However, this is an unrealistic assumption sinceseveral factors may result in differences between depots from aparticular organization. We propose to take into account the exis-tence of heterogeneous depots, which allows the consideration ofcustomers’ preferences. The customers’ willingness to consume isaffected by how well the assigned depot fits their preferences.Thus, the main contribution of this work is the development of asimple yet comprehensive metaheuristic-based approach includ-ing market segmentation issues in order to maximize expectedbenefits (expected sales incomes minus distribution costs).
The proposed methodology consists of five steps: (i) data collec-tion, in which information basically related to existent customersthat have been already served and new customers is gathered;(ii) statistical learning, where the relationship between customers’features and expenditure for different depots is studied employingexistent customer data; (iii) expenditure prediction for new cus-tomers; (iv) assignment of new customers; and (v) routing. A setof computational experiments has been carried out in order toillustrate our methodology. A total of 15 instances have been arti-ficially generated and analyzed considering three scenarios, whichvary in the weight of the expenditure of existent customers. It hasbeen shown how our approach differs from an approach based onlyon minimizing distribution costs when solving instances withheterogeneous depots. Our experiment also allows quantifyinghow the performance gap between both approaches increases asthe weight of the expenditures is incremented.
Acknowledgements
This work has been partially supported by the Spanish Ministryof Economy and Competitiveness (TRA2013-48180-C3-P,TRA2015-71883-REDT, MTM2014-59179-C2-01-P), FEDER of EU,the Dept. of Universities, Research, and Information Society ofthe Catalan Government (2014-CTP-00001), and the PortugueseFoundation for Science and Technology (UID/MAT/00297/2013).
References
Barbucha, D. (2014). A cooperative population learning algorithm for vehiclerouting problem with time windows. Neurocomputing, 146, 210–229.
Bennett, P. (1995). Dictionary of marketing terms (2nd ed.). McGraw-HillContemporary.
Bettinelli, A., Ceselli, A., & Righini, G. (2011). A branch-and-cut-and-price algorithmfor the multi-depot heterogeneous vehicle routing problem with time windows.Transport Research Part C: Emerging Technologies, 19, 723–740.
Caceres, J., Arias, P., Guimarans, D., Riera, D., & Juan, A. (2015). Rich vehicle routingproblem: A survey. ACM Computing Surveys, 47, 115–129.
Cattaruzza, D., Absi, N., Feillet, D., & Vigo, D. (2014). An iterated local search for themulti-commodity multi-trip vehicle routing problem with time windows.Computers & Operations Research, 51, 257–267.
Ceselli, A., Righini, G., & Salani, M. (2009). A column generation algorithm for a richvehicle routing problem. Transport Science, 43, 56–69.
Chao, I., Golden, B., & Wasil, E. (1993). A new heuristic for the multi-depot vehiclerouting problem that improves upon best known solutions. American Journal ofMathematical and Management Sciences, 13, 371–406.
Chen, Y.-K., Wang, C.-Y., & Feng, Y.-Y. (2010). Application of a 3NN+1 based CBRsystem to segmentation of the note book computers market. Expert Systems withApplications, 37, 276–281.
Clarke, G., & Wright, J. (1964). Scheduling of vehicles from a central depot to anumber of delivering points. Operations Research, 12, 568–581.
Contardo, C., & Martinelli, R. (2014). A new exact algorithm for the MDVRP undercapacity and route length constraints. Discrete Optimization, 12, 129–146.
Cordeau, J., Gendreau, M., & Laporte, G. (1997). A tabu search heuristic for periodicand multidepot vehicle routing problems. Networks, 30, 105–119.
Cordeau, J., & Maischberger, M. (2012). A parallel iterated tabu search heuristic forvehicle routing problems. Computers & Operations Research, 39, 2033–2050.
Datta, Y. (1996). Market segmentation: An integrated framework. Long RangePlanning, 29, 797–811.
DeSarbo, W., & DeSarbo, C. (2007). A generalized normative segmentationmethodology employing conjoint analysis. In A. Gustafsson, A. Herrmann, & F.Huber (Eds.), Conjoint measurement: Methods and application (pp. 321–345).Springer Science & Business Media.
Ehmke, J., Campbell, A., & Urban, T. (2015). Ensuring service levels in routingproblems with time windows and stochastic travel times. European Journal ofOperational Research, 240, 539–550.
Fish, K., Barnes, J., & Aiken, M. (1995). Artificial neural networks: a newmethodology for industrial market segmentation. Industrial MarketingManagement, 24, 431–438.
Foedermayr, E., & Diamantopoulos, A. (2008). Market segmentation in practice:Review of empirical studies, methodological assessment, and agenda for futureresearch. Journal of Strategic Marketing, 16, 223–265.
Geetha, S., Vanathi, P., & Poonthalir, G. (2012). Metaheuristic approach for themulti-depot vehicle routing problem. Applied Artificial Intelligence, 26, 878–901.
Hastie, T., Tibshirani, R., & Friedman, J. (2001). The elements of statistical learning.Springer series in statistics. Springer New York Inc.
Ho, W., Ho, G., Ji, P., & Lau, H. (2008). A hybrid genetic algorithm for the multi-depotvehicle routing problem. Engineering Applications of Artificial Intelligence, 21,548–557.
Huang, J.-J., Tzeng, G.-H., & Ong, C.-S. (2007). Marketing segmentation using supportvector clustering. Expert Systems with Applications, 32, 313–317.
Juan, A., Faulin, J., Ruiz, R., Barrios, B., Gilibert, M., & Vilajosana, X. (2009). Usingoriented random search to provide a set of alternative solutions to thecapacitated vehicle routing problem. In Operations research and cyber-infrastructure (pp. 331–346). New York, USA: Springer.
Juan, A., Pascual, I., Guimarans, D., & Barrios, B. (2014). Combining biasedrandomization with iterated local search for solving the multi-depot vehiclerouting problem. International Transactions in Operational Research, 22, 647–667.
Kotler, P., & Armstrong, G. (2011). Principles of marketing (14th ed.). PearsonPrentice Hall.
Kuhn, M. (2008). Building predictive models in R using the caret package. Journal ofStatistical Software, 28.
Kuo, R., Ho, L., & Hu, C. (2014). Integration of self-organizing feature map and K-means algorithm for market segmentation. Computers & Operations Research, 29,1475–1493.
Lahrichi, N., Crainic, T., Gendreau, M., Rei, W., Cris�an, G., & Vidal, T. (2012). Anintegrative cooperative search framework for multi-decision-attributecombinatorial optimization. Technical Report No. 42 CIRRELT.
Lantz, B. (2013). Machine learning with R. Packt Publishing.Li, J., Pardalos, P., Sun, H., Pei, J., & Zhang, Y. (2015). Iterated local search embedded
adaptive neighborhood selection approach for the multi-depot vehicle routingproblem with simultaneous deliveries and pickups. Expert Systems withApplications, 42, 3551–3561.
Liu, Y., Kiang, M., & Brusco, M. (2012). A unified framework for market segmentationand its applications. Expert Systems with Applications, 39, 10292–10302.
Lourenço, H., Martin, O., & Stützle, T. (2010). Iterated local search: Framework andapplications. In M. Gendreau & J.-Y. Potvin (Eds.), Handbook of metaheuristics.International series in operations research & management science (Vol. 146,pp. 363–397). US: Springer.
Luo, J., & Chen, M.-R. (2014a). Improved shuffled frog leaping algorithm and itsmulti-phase model for multi-depot vehicle routing problem. Expert Systemswith Applications, 41, 2535–2545.
Luo, J., & Chen, M.-R. (2014b). Multi-phase modified shuffled frog leaping algorithmwith extremal optimization for the MDVRP and the MDVRPTW. Computers &Industrial Engineering, 72, 84–97.
McCarty, J., & Hastak, M. (2007). Segmentation approaches in data-mining: Acomparison of RFM, CHAID, and logistic regression. Journal of Business Research,60, 656–662.
Mirabi, M., Fatemi-Ghomi, S., & Jolai, F. (2010). Efficient stochastic hybrid heuristicsfor the multi-depot vehicle routing problem. Robotics and Computer-IntegratedManufacturing, 26, 564–569.
Montgomery, D., Peck, E., & Vining, G. (2012). Introduction to linear regressionanalysis (5th ed.). Wiley Publishing.
Montoya-Torres, J., Lopez, J., Nieto, S., Felizzola, H., & Herazo-Padilla, N. (2015). Aliterature review on the vehicle routing problem with multiple depots.Computers & Industrial Engineering, 79, 115–129.
Nagy, G., & Salhi, S. (2005). Heuristic algorithms for single and multiple depotvehicle routing problems with pickups and deliveries. European Journal ofOperational Research, 162, 126–141.
Ombuki-Berman, B., & Hanshar, F. (2009). Using genetic algorithms for multi-depotvehicle routing. In F. Pereira & J. Tavares (Eds.), Bio-inspired algorithms for thevehicle routing problem (pp. 77–99). Berlin, Heidelberg: Springer.
Pisinger, D., & Ropke, S. (2007). A general heuristic for vehicle routing problems.Computers & Operations Research, 34, 2403–2435.
Polacek, M., Hartl, R., & Doerner, K. (2004). A variable neighborhood search for theMDVRP with time windows. Journal of Heuristics, 10, 613–627.
Rahimi-Vahed, A., Crainic, T., Gendreau, M., & Rei, W. (2013). A path relinkingalgorithm for a multi-depot periodic vehicle routing problem. Journal ofHeuristics, 19, 497–524.
Salhi, S., Imran, A., & Wassan, N. (2014). The multi-depot vehicle routing problemwith heterogeneous vehicle fleet: Formulation and a variable neighborhoodsearch implementation. Computers & Operations Research, 52, 315–325.
Salhi, S., & Sari, M. (1997). A multi-level composite heuristic for the multi-depotvehicle fleet mix problem. European Journal of Operational Research, 103,95–112.

104 L. Calvet et al. / Computers & Industrial Engineering 94 (2016) 93–104
Smith, W. (1956). Product differentiation and market segmentation as alternativemarketing strategies. Journal of Marketing, 21, 3–8.
Tas�, D., Jabali, O., & Woensel, T. (2014). A vehicle routing problem with flexible timewindows. Computers & Operations Research, 52, 39–54.
Talbi, E. (2009). Metaheuristics: From design to implementation. New Jersey: JohnWiley & Sons.
RDC Team (2008). R: A language and environment for statistical computing. RFoundation for Statistical Computing.
Tillman, F. (1969). The multiple terminal delivery problem with probabilisticdemands. Distribution Science, 3, 192–204.
Vellido, A., Lisboa, P., & Meehan, K. (1999). Segmentation of the on-lineshopping market using neural networks. Expert Systems with Applications, 17,303–314.
Vidal, T., Crainic, T., Gendreau, M., & Prins, C. (2013). A hybrid genetic algorithmwith adaptive diversity management for a large class of vehicle routingproblems with time windows. Computers & Operations Research, 40, 475–489.
Wang, Y., & Witten, I. (1996). Induction of model trees for predicting continuousclasses. Technical Report Working paper 96/23 Hamilton, University ofWaikato, New Zealand.
Wind, Y. (1978). Issues and advances in segmentation research. Journal of MarketingResearch, 15, 317–337.
Wu, T.-H., Low, C., & Bai, J.-W. (2002). Heuristic solutions to multi-depot location-routing problems. Computers & Operations Research, 29, 1393–1415.
Yu, B., Yang, Z.-Z., & Xie, J.-X. (2011). A parallel improved ant colony optimizationfor multi-depot vehicle routing problem. Journal of the Operational ResearchSociety, 62, 183–188.